Process Intensification of Alkynol Semihydrogenation in a Tube Reactor Coated with a Pd/ZnO Catalyst


1
School of Engineering, University of Warwick, Coventry CV4 7AL, UK
2
Stoli Catalysts Ltd., Coventry CV3 4DS, UK
3
Department of Biotechnology and Chemistry, Tver State Technical University, Nab. A. Nikitina 22, 170026 Tver, Russia
*
Author to whom correspondence should be addressed.
Catalysts 2017, 7(12), 358; https://doi.org/10.3390/catal7120358
Submission received: 26 October 2017
/
Revised: 16 November 2017
/
Accepted: 20 November 2017
/
Published: 25 November 2017
Abstract
:Semihydrogenation of 2-methyl-3-butyn-2-ol (MBY) was studied in a 5 m tube reactor wall-coated with a 5 wt% Pd/ZnO catalyst. The system allowed for the excellent selectivity towards the intermediate alkene of 97.8 ± 0.2% at an ambient H2 pressure and a MBY conversion below 90%. The maximum alkene yield reached 94.6% under solvent-free conditions and 96.0% in a 30 vol % MBY aqueous solution. The reactor stability was studied for 80 h on stream with a deactivation rate of only 0.07% per hour. Such a low deactivation rate provides a continuous operation of one month with only a two-fold decrease in catalyst activity and a metal leaching below 1 parts per billion (ppb). The excellent turn-over numbers (TON) of above 105 illustrates a very efficient utilisation of the noble metal inside catalyst-coated tube reactors. When compared to batch operation at 70 °C, the reaction rate in flow reactor can be increased by eight times at a higher reaction temperature, keeping the same product decomposition of about 1% in both cases.
Keywords:
palladium; hydrogenation; selectivity; acetylene; ethylene; Lindlar; flow chemistry; process intensification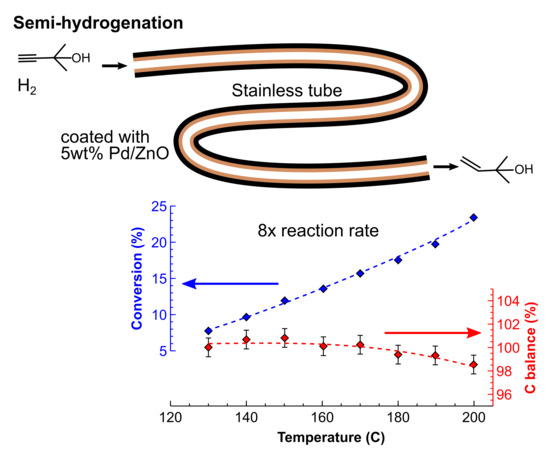
1. Introduction
Finding a balance between opposing trends of production costs, environmental impacts, and operational safety is a challenge in the chemical industry. Minimisation of either parameter is obviously possible, but simultaneously doing it for all of them is a problem. Nowadays, most of the fine chemicals (substances produced below 10,000 ton a year worldwide) industry relies on batch reactors. Batch reactors are very versatile, the operational procedures are well developed, and the decades of process developments result in an excellent operational safety. Unfortunately, the batch technology brings also a burden of low labour efficiency, which is caused by the low space-time yield caused mainly by discontinuous nature of the batch operation and mass transfer limitations originating from the low mass transfer rates [1,2,3].
Not surprisingly, the larger-scale chemical industry, such as oil refinery, uses an entirely different approach to continuous production, such as fixed or fluidised bed reactors. These provide a much higher cost efficiency which is vastly amplified by the sheer production scale [4]. For the last decade, the adaptation of continuous flow technology in smaller scale fine chemical industry is becoming a more prominent trend [3,5,6]. It is exemplified by the change in the Food and Drug Administration (FDA), a United States chemistry oversight authority, which from 2012 cautiously noted that continuous flow manufacturing fully agrees with the current regulations and implements the “quality by design” [7]. From 2016, the FDA actively encourages the adaptation of continuous flow processing in the industry [8].
In fact, the benefits of the continuous flow processing extend far beyond the growing regulatory approval. The costs can be significantly decreased due to a continuous mode of operation, and reduced labour costs by process automation [2,3]. A much smaller volume of a flow reactor brings substantial safety advantages because even a catastrophic rupture of a reactor results in a minor release of hazardous substances which is easier to deal with [9,10,11]. Enhanced mass and heat transfer that is caused by a higher surface to volume ratio often results in a higher product selectivity and the decreased need for excessive solvent dilution—two factors that contribute to the environment, as well as the production costs [5,6,12,13,14].
There are many significant advantages of flow processing that are already vividly demonstrated and adopted by the industry [6]. These examples involve Grignard reactions where mixing time is crucial for high-selective reactions and the flow processing allows for a notable improvement of operational conditions when compared to batch. The reaction can be performed at an ambient temperature as compared to a cryogenic batch synthesis with a higher product yield [15,16]. An intrinsic process safety of continuous processing allows for carrying out reactions that can prohibitively dangerous in a batch, such as diazo chemistry, allowing for novel reaction shortcuts as well as improved product yields [9,17,18].
Until now, most of these advantages were employed in “conventional” organic liquid-liquid reactions, while gas-liquid reactions received a much lower attention even despite the fact that at least 10% of all the reactions used in fine chemical industry are hydrogenation reactions [19,20]. The likely reason is that the reaction requires a heterogeneous catalyst, which results in a gas-liquid-solid system with rather complex hydrodynamics.
An additional challenge appears when the gas-liquid heterogeneous catalytic reaction is required to synthesis some particular reaction intermediate. The examples include the chemoselective reduction of unsaturated aldehydes, esters, furfural derivatives, or halogenated compounds that are found in many fine chemicals areas [20]. However, one of the most challenging reactions is alkyne semihydrogenation to alkene, which is widely used in the synthesis of vitamins from kilograms to kilotons a year scale [20,21]. For example, the semihydrogenation of 2-methyl-3-butyn-2-ol (MBY) is one of the key reactions that is used in the synthesis of vitamin E intermediates and represent a range of alkynol molecules that are widely used in vitamin, fragrance, and pharma areas [21,22]. Moreover, the bulky polar group at the vicinity of the triple bond provides a notably different behaviour as compared to linear alkyne molecules. Such a difference in behaviour is demonstrated by the negligible hydrogenation rates of linear alkenes over the Pb- and Bi-poisoned catalysts when compared to the high rates of bulky alkene hydrogenation over the same catalysts [23,24].
The particular challenge in alkyne semihydrogenation is almost identical boiling points of the reactants and the products that result in the inability of scalable separation. Even despite advances in the development of the bimetallic catalysts that decrease the rate of the overhydrogenation step, the industry relies on the use of Lindlar catalyst, which contains toxic Pb [23,24,25,26,27]. From the reactor design perspective, the operation of the Lindlar-type Pb-poisoned Pd catalyst creates a problem of controlling the residence time distribution because once all of the alkyne is consumed, the subsequent reaction of alkene hydrogenation proceeds at a rate that is comparable to that of alkyne hydrogenation [24]. High overhydrogenation rates mean that the reaction timing must be precisely controlled to maximise the semihydrogenation product yield. The addition of catalyst poisons, such as pyridine or quinoline, decreases the relative alkene to alkyne hydrogenation rates and allows for a broader residence time distribution. However, such poisons also dramatically decrease the overall reaction rates and the reactor throughput, requiring only limited catalyst poisoning combined with the precise residence time control [28,29].
The conventional approaches of fixed-bed reactors have limited applications in such chemoselective reactions. One of the reasons is that liquid channelling easily occurs and results in a very broad residence time distribution and the possibility of over or under-reaction at such conditions [30,31]. An alternative approach is the application of structured reactors; however, they demonstrate low heat removal rates and are often operated in a recycle mode requiring high energy input into the reactant pumping [32,33,34]. The high operational costs can be overcome using a single tubular reactor that provides a simple hydrodynamics and excellent control of residence time due to the Taylor flow regime [28,35,36,37].
In our previous works, we have demonstrated that the catalyst-coated tube reactors are very efficient in providing high selectivity towards intermediate hydrogenation products over the Bi-poisoned Pd catalysts [28,36]. The selectivity in such reactors was demonstrated to be as high as in an ideal batch reactor with the same catalyst. Hence, the maximum product selectivity obtained is determined only by the catalyst chemistry with no handicap being brought by the reactor [24,28]. However, the catalyst-coated tubes were demonstrated so far only at the milligram [38] to 10 g a day throughput levels [28,36], which are not suitable for industrial applications [35,39,40]. We have extrapolated the experimental performance of the tube reactors wall-coated with the Pd/ZnO catalyst and showed that a throughput of above 4 kg a day is feasible in a single 5 m long 1.5 mm ID reactor in the solvent-free MBY semihydrogenation [41]. However, there is very little experimental evidence on the applicability of the catalyst-coated tube reactors at the kilogram throughput level, which covers the area of innovator-drug manufacturing scale. Also, the crucial operational parameters, catalyst deactivation over a long period on stream and its intensified operation were not studied. In this work, we address this gap and experimentally study the applicability of the catalyst-coated tube reactors as a platform for chemoselective hydrogenation with high selectivity towards intermediate products. We study scalability, deactivation rates, and show the possibility for process intensification by going to high reaction temperatures at very short residence times.
2. Results and Discussion
2.1. Characterisation
The catalyst-coated tubes were cut in several pieces along the length and studied. The cross-sections were filled with conductive resin and polished to ensure that the coating layer is not damaged during polishing. The coating thickness studied was 23 ± 3 μm (Figure 1a). The frontal sections showed that the coating consists of needle-shaped ZnO crystals 2–50 μm long and 100–500 nm in diameter (Figure 1b). The macroporous structure formed by such needle-shaped crystals of the coating is greatly beneficial for the internal mass transfer as it provides high diffusion coefficients when compared to microporous materials.
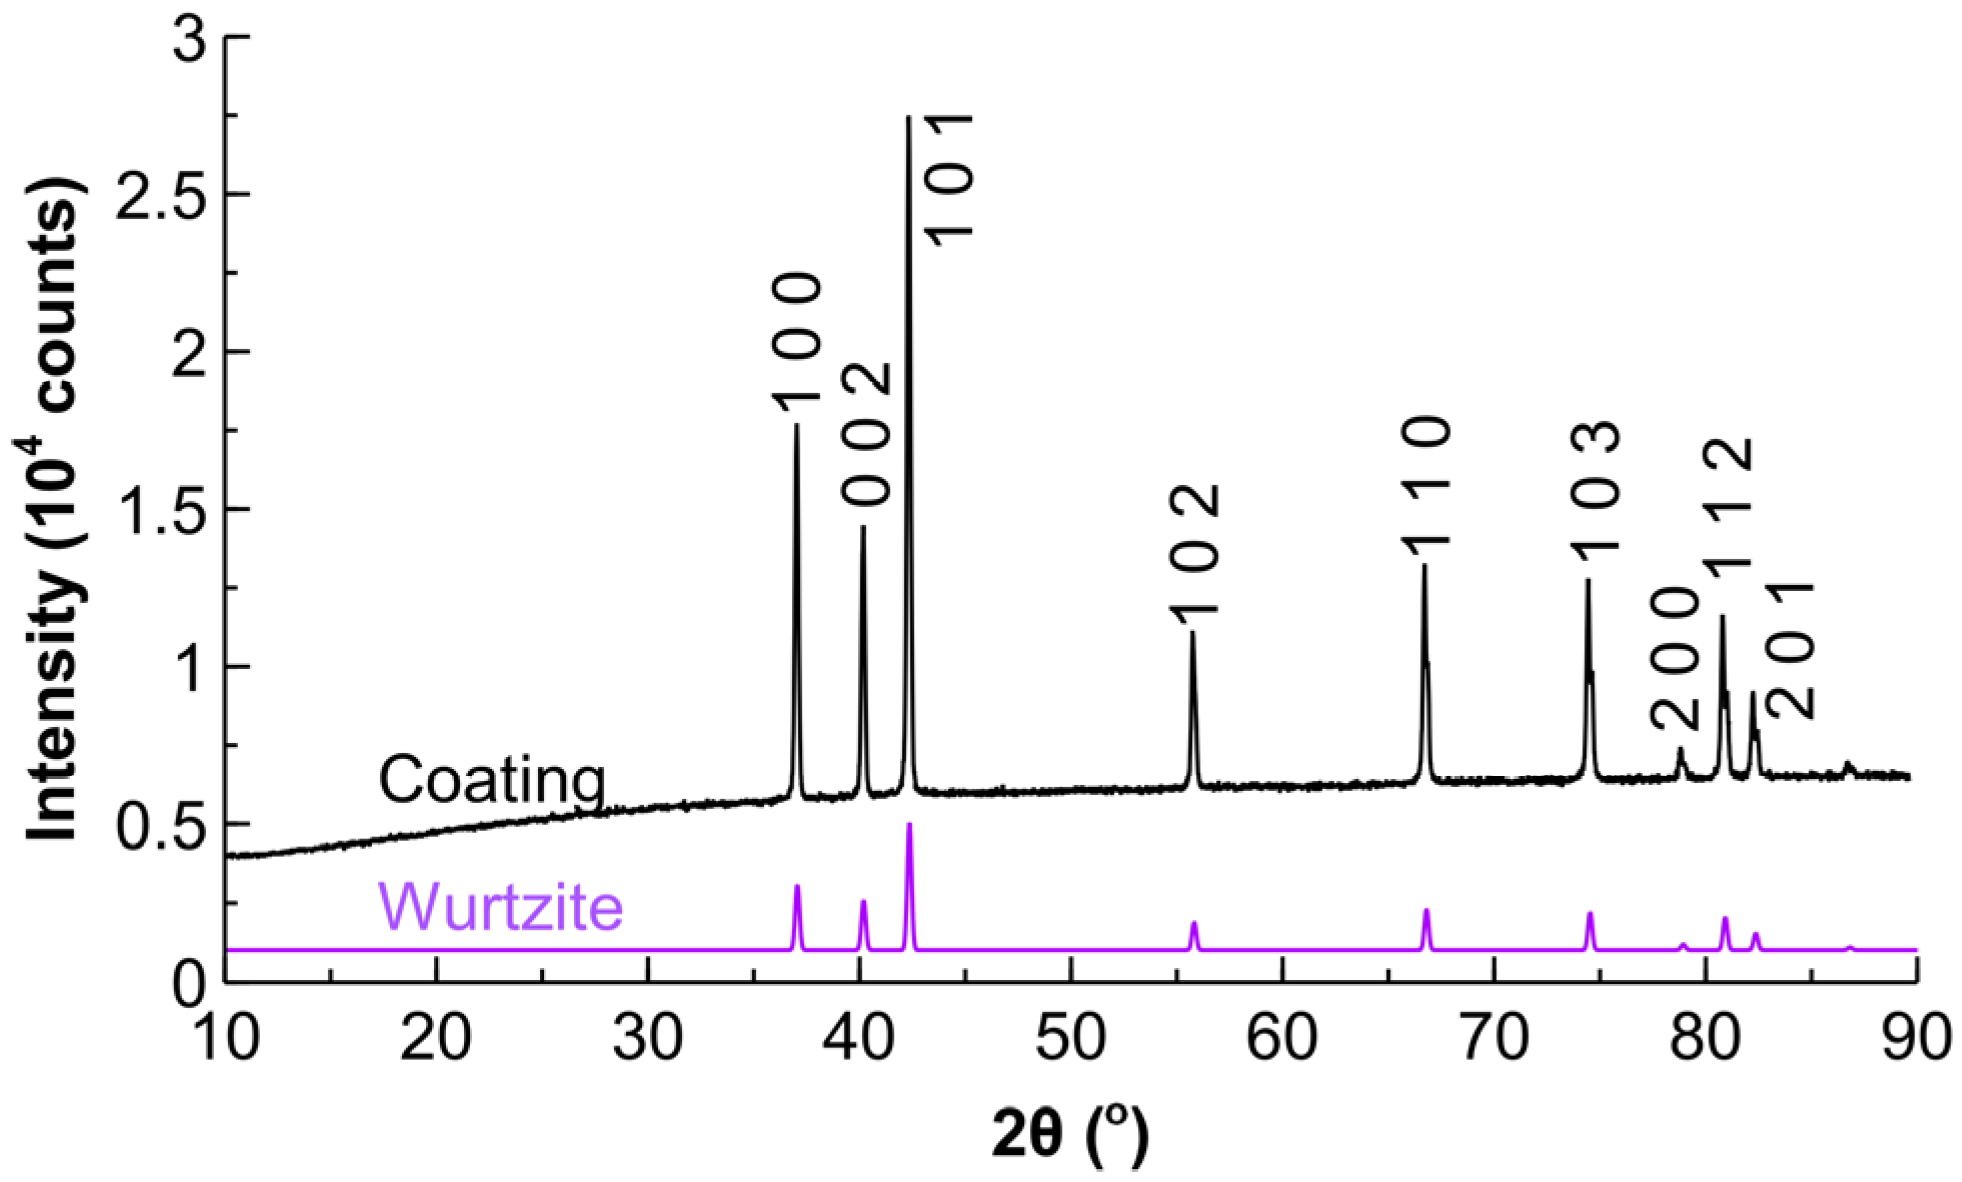
The nitrogen physisorption study demonstrated low surface area of the support of 0.5 m2 g−1, which is typical for crystalline ZnO materials [42,43]. The powder X-ray diffraction study showed mainly the presence of hexagonal wurtzite crystals with the average diameter of 60 nm based on the Scherrer equation estimation for the most intensive peak at 2θ = 37.4° (Figure 2). The presence of diffraction peaks for Pd was not detected (major peaks expected at 2θ = 45.6°, 53.2°, 78.7°), likely due to a low signal to noise ratio and small particle size. The smaller Pd nanoparticles are expected to result in broad peaks and the correspondingly low signal from the particles [24]. The Pd nanoparticles of comparable dimensions (4–6 nm) were also not observed over the ZnO support in powder X-ray diffraction studies in the literature [41,44,45]. However, the particles with the average diameter of 7 nm were observed in the diffraction patterns by Semagina et al. [46], likely due to larger Pd nanoparticles and a higher ZnO crystallinity.
The coating was studied by transmission electron microscopy (TEM) to investigate the Pd nanoparticle size distribution with the representative picture shown in Figure 3. The average diameter of the nanoparticles observed was 4.2 nm, which corresponded to a Pd dispersion of 28% using the calculation provided in reference [47].
2.2. Effect of Liquid Flow Rates
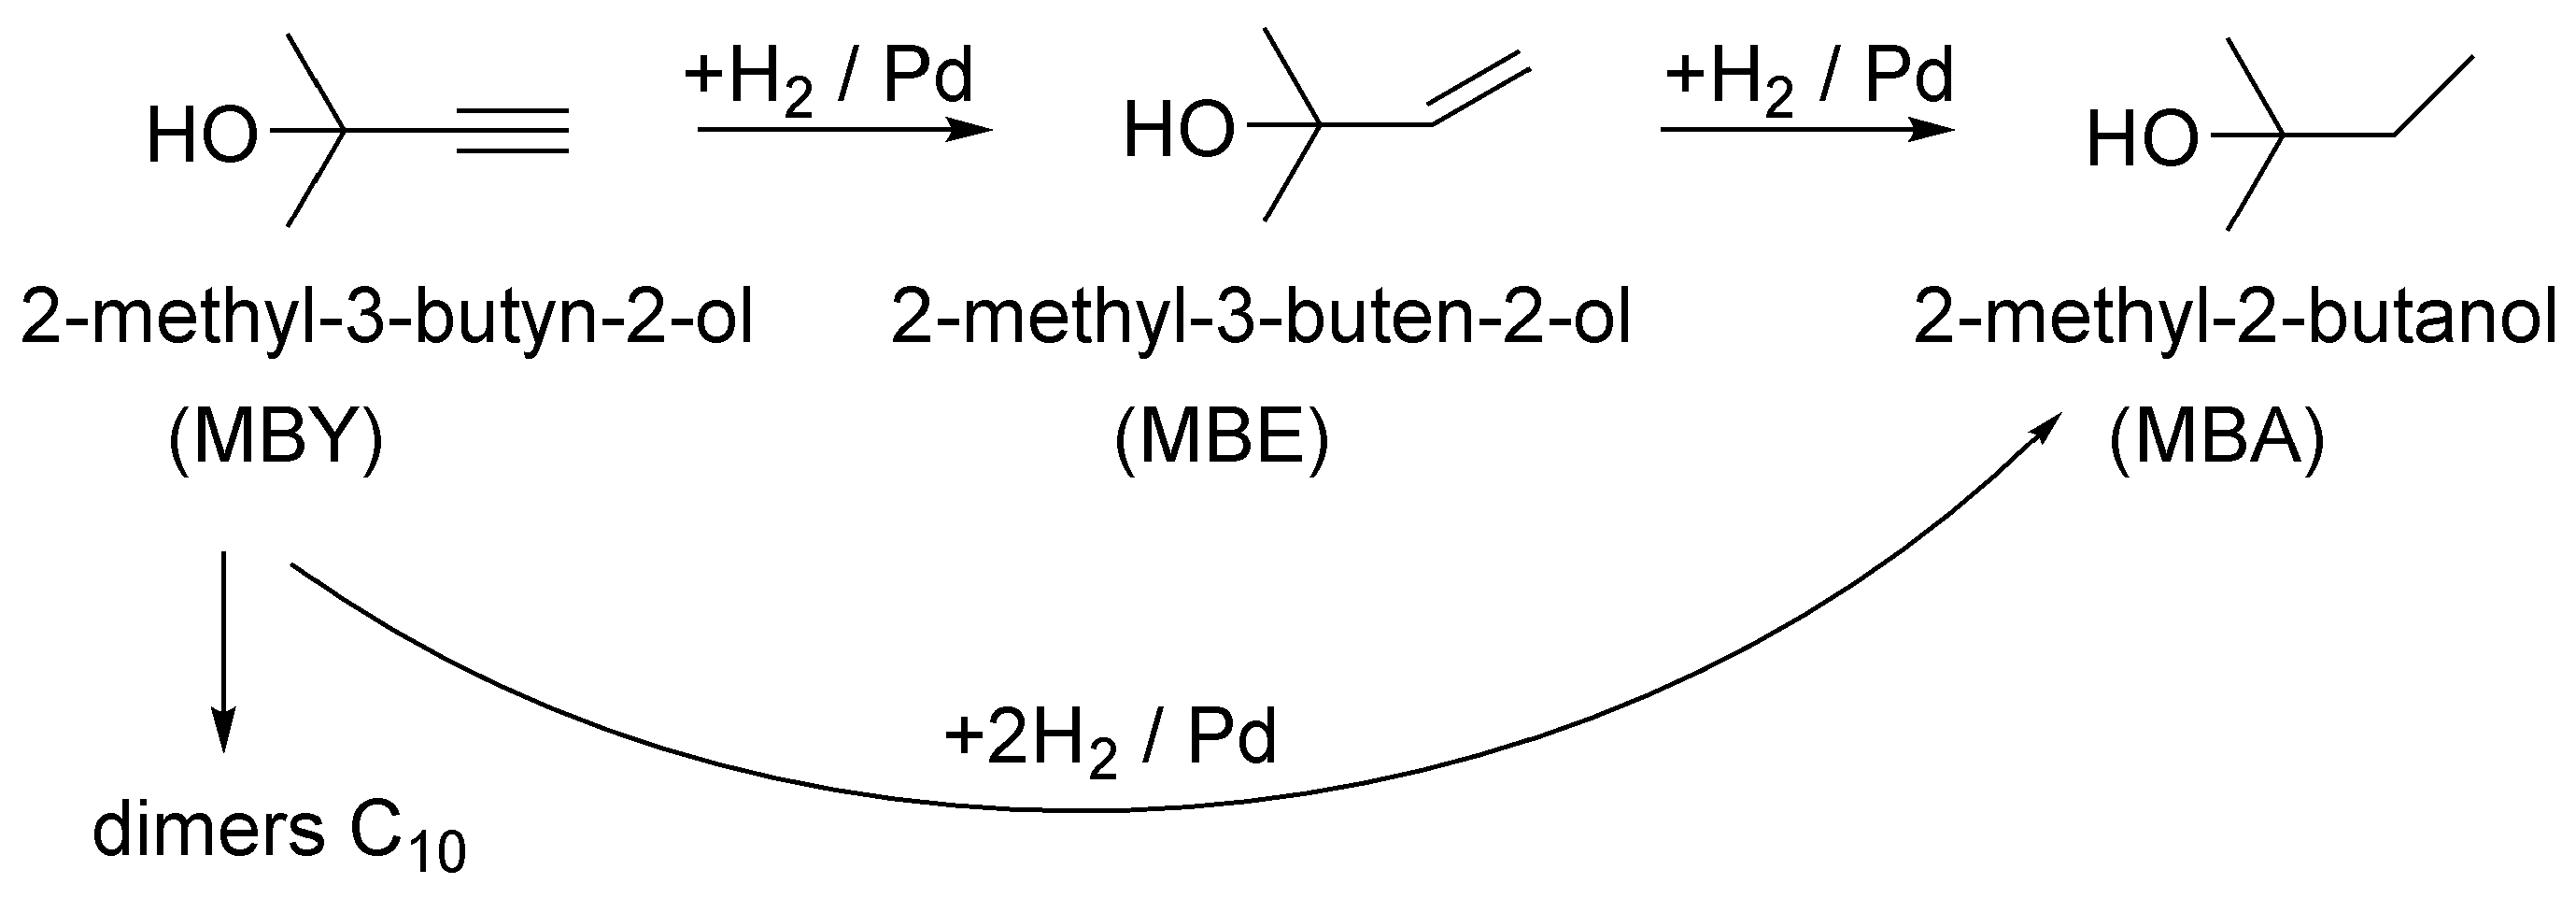
The scheme of MBY hydrogenation is presented in Figure 4 and consists of two main stages: (i) semihydrogenation to the target product, 2-methyl-3-buten-2-ol (MBE), and (ii) its subsequent full hydrogenation to 2-methyl-2-butanol (MBA). Also, a direct step of MBY to MBA hydrogenation is considered feasible, although the product distribution can often be accurately described when considering only the former two stages [25,28,44]. The formation of the C10 dimers is also a possible step, but selectivity towards dimers is generally below 0.1% [48]. Because of the low dimer quantities and the difficulty in identification, we did not perform the corresponding analyses. The target product of the reaction is MBE with the required selectivity being generally above 95% at full conversion. The requirement of high selectivity only at high conversion comes from the fact that the reaction mixture cannot be separated on a scale, rendering the full selectivity at low conversion is impractical.
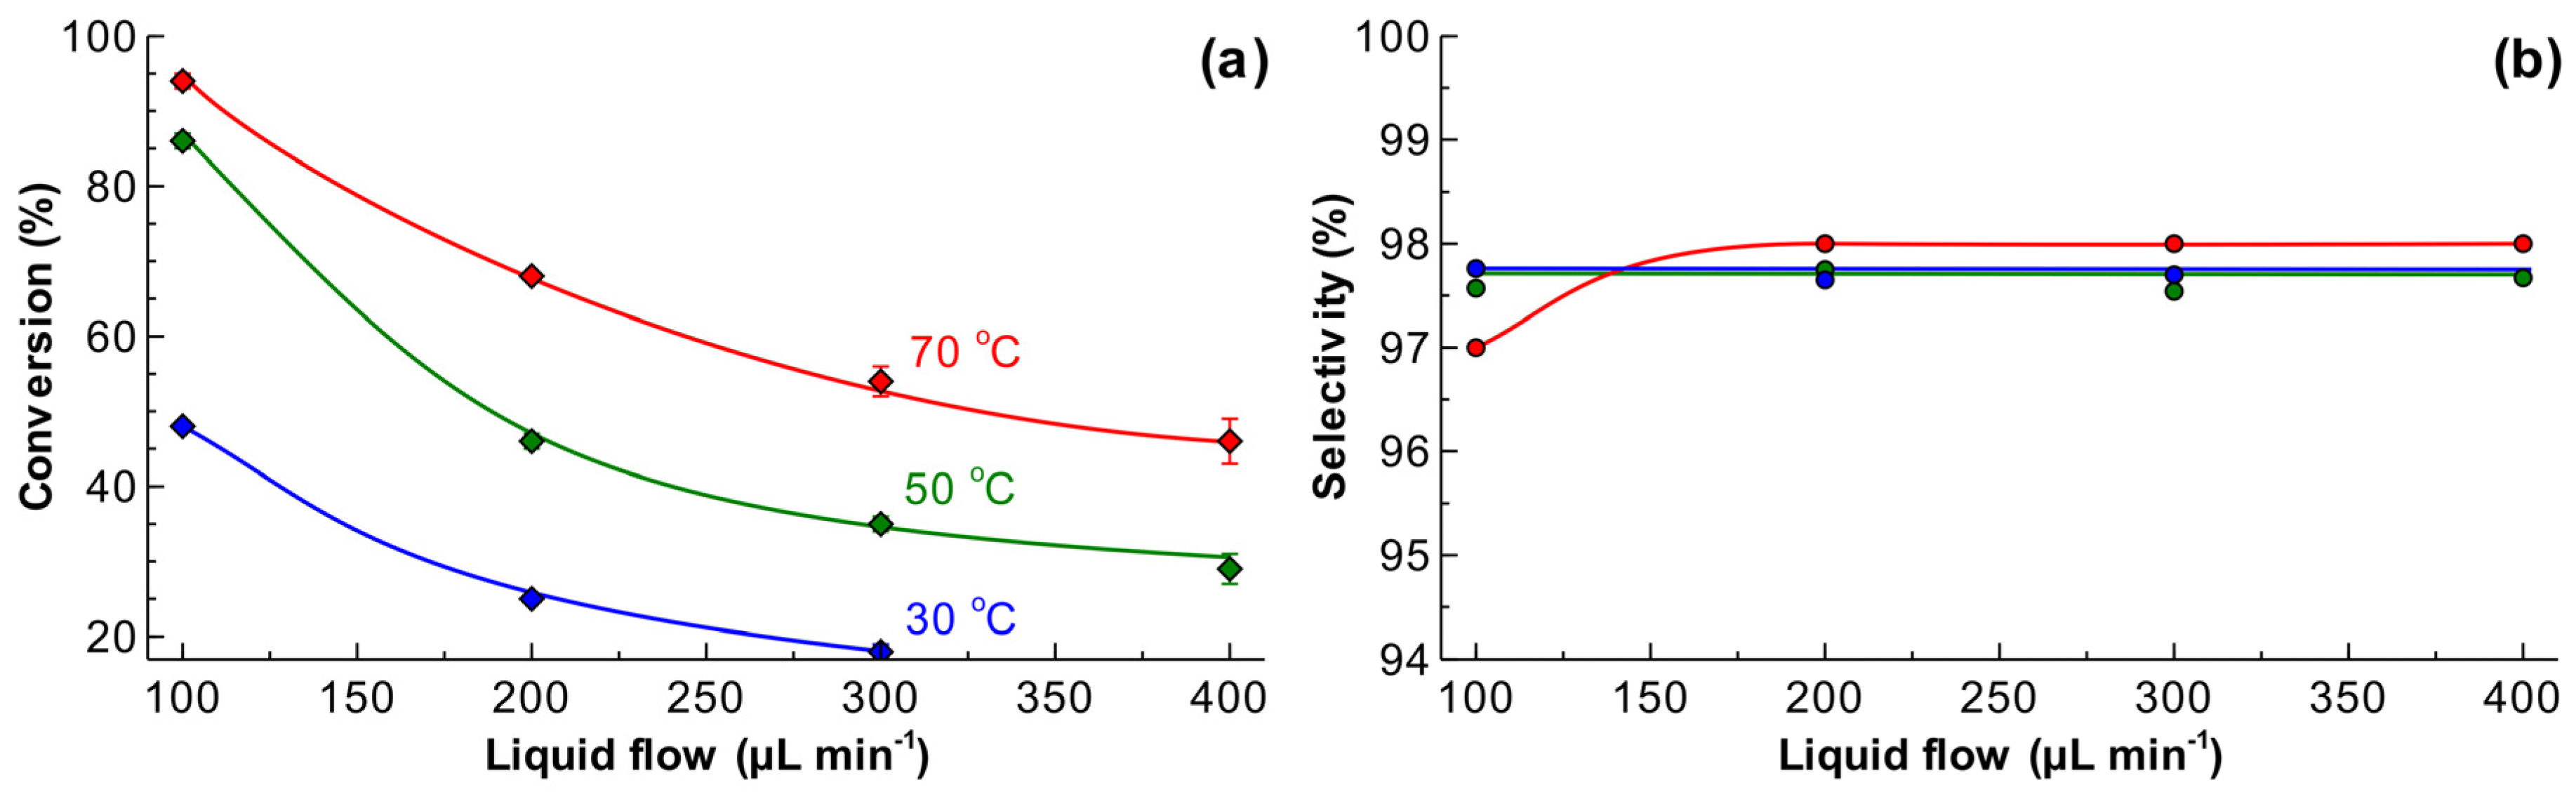
The reaction was performed feeding solvent-free MBY and H2. The results presented in Figure 5a show that the conversion increases at a lower liquid flow rate and a higher temperature. The higher liquid flow rate results in a shorter residence time, as well as a higher substrate/catalyst ratio, with both factors decreasing the conversion. The conversion increases with temperature due to increased hydrogenation rate. Interestingly, the MBY conversions observed at the temperatures of 50 and 70 °C and a liquid flow rate of 100 μL min−1 were close to each other. This suggests that the reaction rate at 70 °C was limited by full hydrogen consumption.
The selectivity to MBE (Figure 5b) was above 97.5% in the entire range of conversion studied, with the only exception at the MBY conversion of 95%, where the selectivity of 97% was observed. The observed selectivity is notably higher than the one observed over the Pd catalysts supported on conventional supports, such as TiO2 or SiO2, where the selectivity reaches around 92% at a low conversion [24,49]. These data are in excellent agreement with the previous studies over Pd/ZnO catalysts [41,48] and are comparable to the best examples of MBY semihydrogenation reported in literature over more complex metal-poisoned bimetallic catalysts which show selectivity of in the range of 97–98% [28,32,36,50,51,52].
The reaction mechanism for alkyne semihydrogenation over the Pd-based catalysts is well established to take place between the adsorbed alkyne species and dissociatively adsorbed hydrogen over the Pd nanoparticles [53,54,55]. The ZnO support, in contrast to traditional supports, such as carbon or refractory oxides (SiO2, Al2O3, or TiO2), forms Pd-Zn intermetallic compounds, which affect the relative adsorption energies of alkynes and alkenes and result in an increased alkene selectivity [51,56].
The effect of H2 pressure was studied at a fixed reaction temperature of 50 °C and a liquid MBY flow rate of 400 μL min−1, as presented in Figure 6. Increasing the pressure from 1 to 5 bar resulted in a linear increase in the MBY conversion (Figure 6a), followed by a plateau that is caused by the full hydrogen consumption. The dilution of H2 with N2 decreased the conversion to some extent. The MBE selectivity decreased at a higher reaction pressure from 98% to below 92%.
The observed phenomena can be explained considering the first order hydrogenation rates to hydrogen, as presented in Equation (1) [48,52,57,58],
where k is the rate constant, pH2 is the hydrogen pressure, and Q1 and Q2 are relative adsorption constants of MBE to MBY and MBA to MBY, respectively [24,57].
Equation (1) shows that the increase in H2 pressure (or its dilution with N2) affects directly the hydrogenation rates. Moreover, at a higher pressure, the gas slugs shrink, which results in a higher liquid residence time in the reactor, and in turn further increases the MBY conversion. The dilution with nitrogen, similarly, decreases conversion due to a lower hydrogenation reaction rate and shorter residence time.
The MBE selectivity (Figure 6b) was also affected by N2 dilution. With pure H2, the selectivity was 98% at the low MBY conversions, and decreased to 87.0% at a higher reaction pressure. The addition of 15 mL min−1 N2 to the flow of 100 mL min−1 H2 increased the selectivity to 94.6% at the full MBY conversion. The decrease in the selectivity at a higher pressure might be ascribed either to (i) the mass transfer limitations or (ii) an increased MBY to MBA reaction rate, which is proportional to squared hydrogen pressure.
The mass transfer limitations may lead to a slow removal of MBE molecules from the catalyst vicinity, and result in overhydrogenation [29]. There are three possible mechanisms for the mass-transfer limited operation: external mass transfer, gas-liquid mass transfer, or internal diffusion in the catalyst. External mass transfer limitations are highly unlikely in the tube reactors of millimiter dimensions because it was shown that full mixing of the Talylor flow slug proceeds quickly, within a length of a few diameters of the tube [59,60]. The possibility for internal mass transfer can be estimated using the Weisz-Prater number, Equation (2), where is the reaction rate, h is the coating thickness, Cs is the substrate concentration, and Deff is the effective diffusion coefficient. The Weisz-Prater number for MBY and H2 is 10−3 and 0.03, respectively; both are well below the threshold of 0.3 and 1. It shows the absence of internal diffusion limitations, which is expected when considering the very low catalyst coating thickness. Hence, the likely decreased MBE selectivity in the studied reactor at an elevated pressure was caused by the increased rate of direct MBY to MBA overhydrogenation reaction. Similarly, the observed increasing MBE selectivity with the increasing gas N2 dilution was likely caused by the decreasing overhydrogenation rates at a lower H2 partial pressure.
The reaction products were also analysed for Pd leaching. The samples that were obtained both in H2-rich (i.e., when H2 was always in excess) and H2-lean (when H2 was fully consumed) conditions were concentrated and analysed. The degree of Pd leaching was only 0.94 and 0.82 parts per billion (ppb) in the H2-lean and rich conditions, respectively. A slightly higher leaching under H2-lean conditions is well in line with the literature observations of a decreased leaching in the presence of hydrogen [61]. However, it should be noted that in both of the cases, leaching was orders of magnitude below the acceptable level that is an order of 1000 ppb [62]. A possible reason for such a low difference in leaching levels is likely that even under H2-lean condition, the major part of the tube length is still operating in hydrogen excess. As a result, the Pd nanoparticles are exposed to the reaction medium with no hydrogen and are prone to leaching only in the downstream section of the reactor.
To increase the selectivity further, we studied the hydrogenation of a 30 vol % MBY aqueous solution (close to the solubility limit). At two liquid flow rates (Figure 7), the MBY conversion monotonously increased, reaching a plateau in the same way as it was observed for the solvent-free operation (Figure 7). The conversion at the higher total flow rate and the same pressure was considerably lower obviously because of a shorter residence time, as well as a higher substrate/catalyst ratio. The increase in the MBY conversion with H2 pressure inside catalyst-coated tube reactors shows that a significant improvement in throughput can be achieved at a higher pressure.
Importantly, the MBE selectivity in all of these conditions was 99.0%. The increased selectivity by 1–2% in the diluted solutions when compared solvent-free operation agrees with the previous literature data [41,48]. The likely reason is that the increasing absolute concentrations of MBE that was formed under solvent-free conditions result in higher MBE adsorption on the catalyst surface and a higher rate of subsequent hydrogenation into MBA. Solvent effects may also play a role in the change in the selectivity, however, the literature data indicate that the solvent mainly affects the reaction rates [63]. The literature data on the solvent effects in MBY semihydrogenation over the Pd nanoparticles suggest that the solvent effects should result in a minor increase in MBE selectivity (0.5–1.0%) in alcohol as compared to water solvent [64]. Therefore, the increasing selectivity in the diluted solution is likely associated with the decrease in the substrate concentration rather than the solvent effect. The corresponding MBE yield under such conditions was 96.0% at the conversion of 97.0% and corresponded to the throughput of 0.56 kg MBY a day in a single tube reactor.
Although, the production scale achieved is significantly lower than one required for the fine chemicals production of 10–10,000 ton a year, the current scale covers a significant fraction of the innovator drug pharma industry with the required throughput of around 1 kg a day. Moreover, a larger scale production can be achieved using either the numbering-up approach connecting the catalyst-coated reactors in parallel [65,66], or even in series made possible by the low pressure drop.
2.3. Catalyst Deactivation
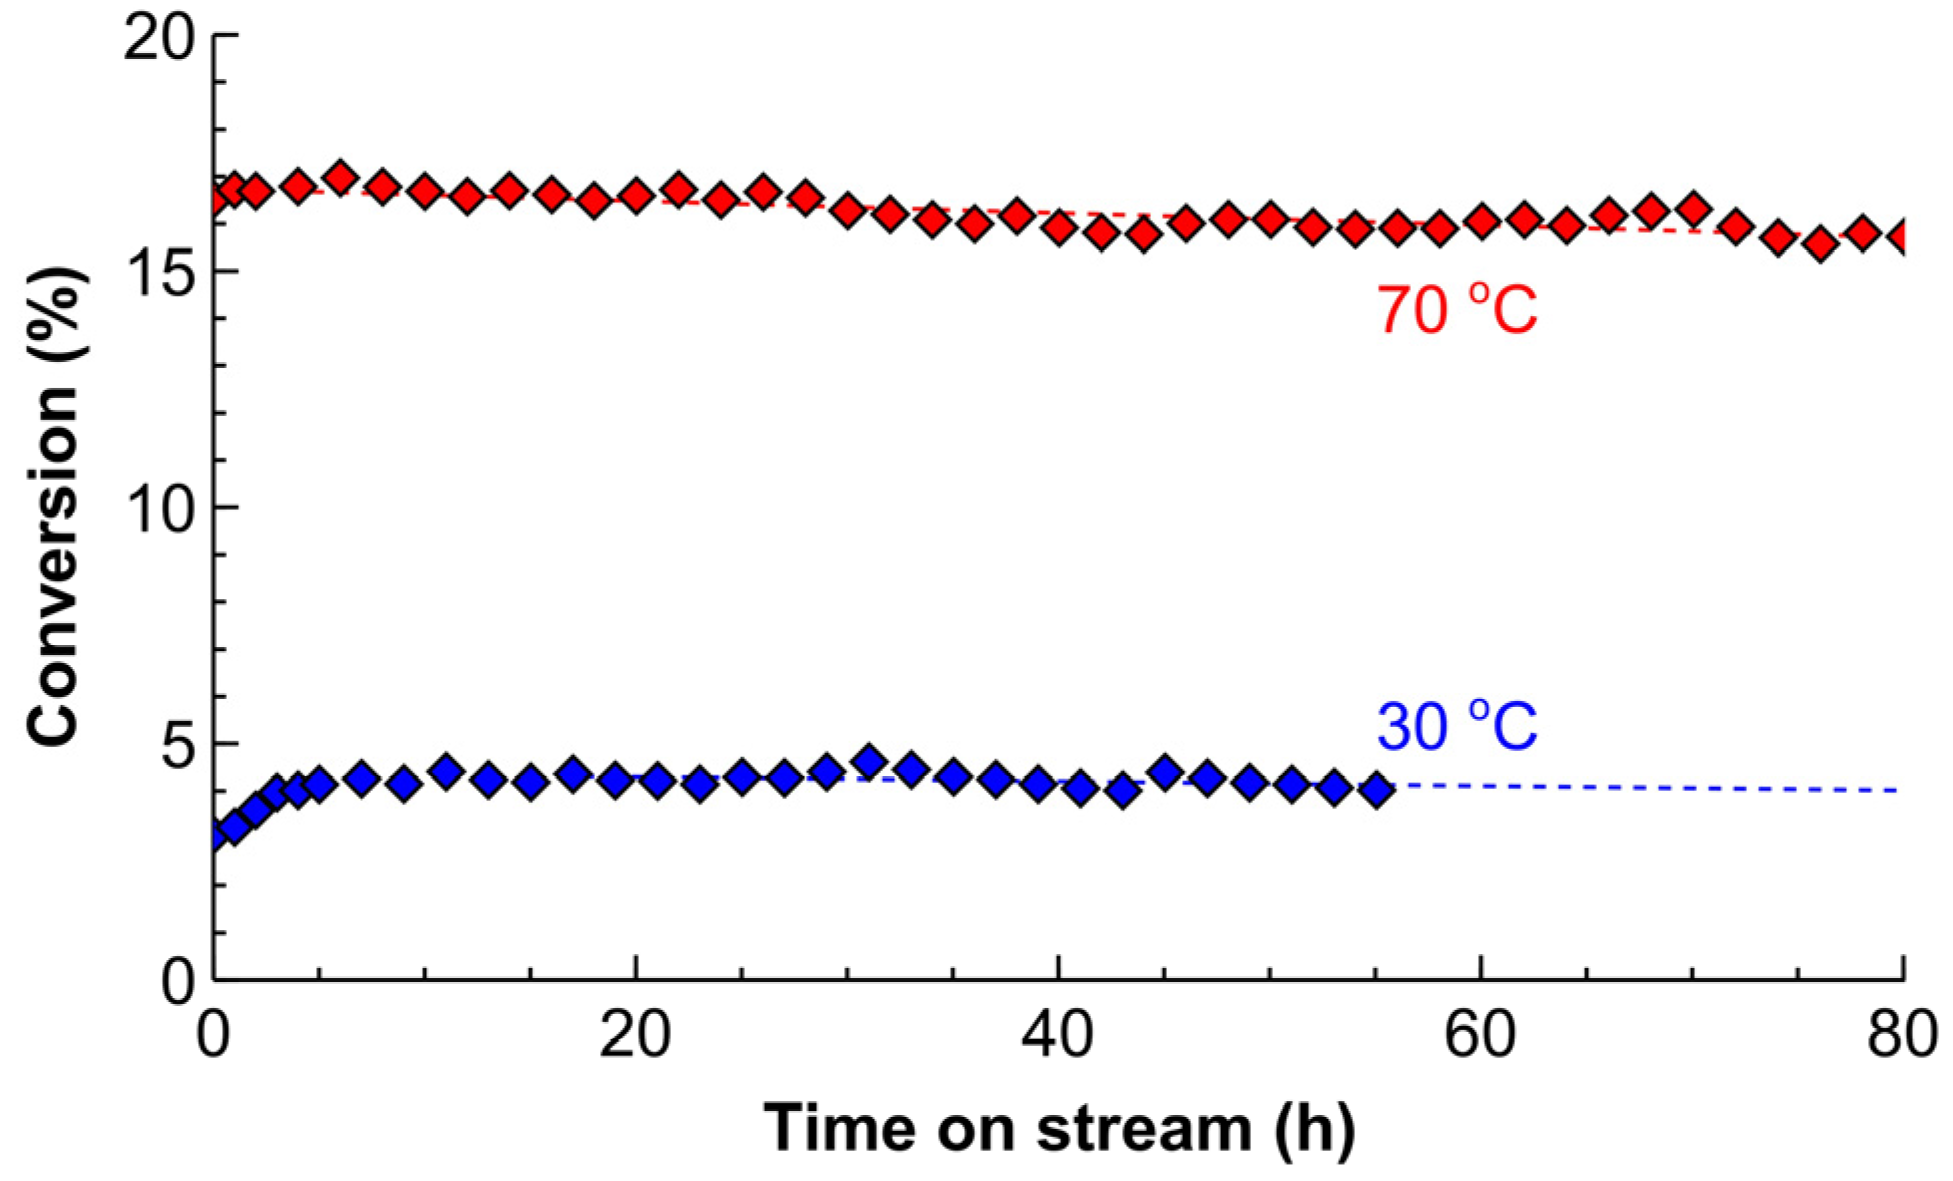
Catalyst deactivation study was performed in the low and medium conversion ranges to underline the deactivation phenomena, as presented in Figure 8. A shorter section of the reactor tube was taken to decrease the substrate consumption during the long-term experiment. Under both of the conditions studied, during the first 4 h on stream the conversion was increasing. This induction period was considerably more pronounced in the low conversion operation with the conversion increasing by 12% (in relative terms compared to the maximum conversion observed after 4 h). However, this increase in conversion was limited to 2% in the medium conversion range. Such a difference indicates that the increasing reaction rates might be associated with the built-up of carbonaceous species on the catalyst surface, which proceeds considerably slower in the low-conversion range [67,68,69,70].
After 4 h on stream, the maximum conversion was reached and then started decreasing gradually. Some fluctuations were also observed that were likely caused by minor variations in temperature or the feed rates. The deactivation rate that was expressed as the decrease in the conversion relative to the maximum conversion observed after 4 h amounted to 0.11 and 0.07% h−1 for the low and medium-conversion conditions, respectively. At such a rate, the decrease in the conversion of 50% relative to the fresh catalysts happens in one month of the continuous operation. Importantly, the corresponding converted product to the catalyst molar ratio (also referred to as a turn-over number, TON) is 5.7 × 10⁵ molsubstrate molPd−1. Due to time and scale constraints, the experimental verification was not completed. However, the TON of 9 × 10⁴ was obtained in Figure 8, and the values above 105 were observed in the capillary reactor wall-coated with Pd-Bi catalysts [28]. The high TON demonstrated in the current study show an excellent catalyst reusability without the need for intermediate catalyst separation in contrast to alternative catalyst regeneration methods, such as centrifuging or magnetic separation [71,72].
The catalysts after the long-term study were removed and characterised. The particle dimensions of Pd studied by the TEM had the average diameter of 4.1 nm, the same as the initial catalyst (4.2 nm). The same Pd particle diameters indicate that there were no sintering of Pd nanoparticles over more than 80 h on stream. No Pd sintering was expected considering low reaction temperature as compared to the Hüttig temperature of 275 °C, at which crystal defects diffuse and sintering becomes likely [73]. The negligible leaching and the absence of sintering indicate that the likely deactivation mechanism is poisoning of the active sites with the reaction by-products or coke formed during the operation.
2.4. Process Intensification
Conventional batch semihydrogenation processes are performed in the temperature range of 70–90 °C because of the danger of the decreased yields via the product decomposition at a higher temperature. This problem, of course, is far more substance-specific than reactor-specific. However, the batch reactors used at a different catalyst to substrate ratio and require a lengthy heating up and cooling down periods. These constraints naturally result in a considerably longer reaction time measuring at least in hours, which amplifies even a minor problem of product decomposition. The reaction in a flow reactor, on the contrary, usually requires the residence time of seconds to minutes and allows for the operation at a considerably higher temperature with minimal substrate (or product) decomposition.
The solvent-free MBY semihydrogenation was performed in a 80 cm tube reactor coated with a 5 wt% Pd/ZnO catalyst at an MBY flow rate of 4 mL min−1 and a H2 flow rate of 1 L min−1 (standard temperature and pressure, STP) to experimentally study the boundaries of the substrate decomposition. The high flow rates and a short section of the catalyst-coated reactor were selected to ensure low conversions, because the results become less representative in the range close to the full MBY conversion. A pressure of 15 bar was chosen to keep MBY in the liquid phase, even at the highest reaction temperature studied. The pressure drop in the reactor was only about 3 bar.
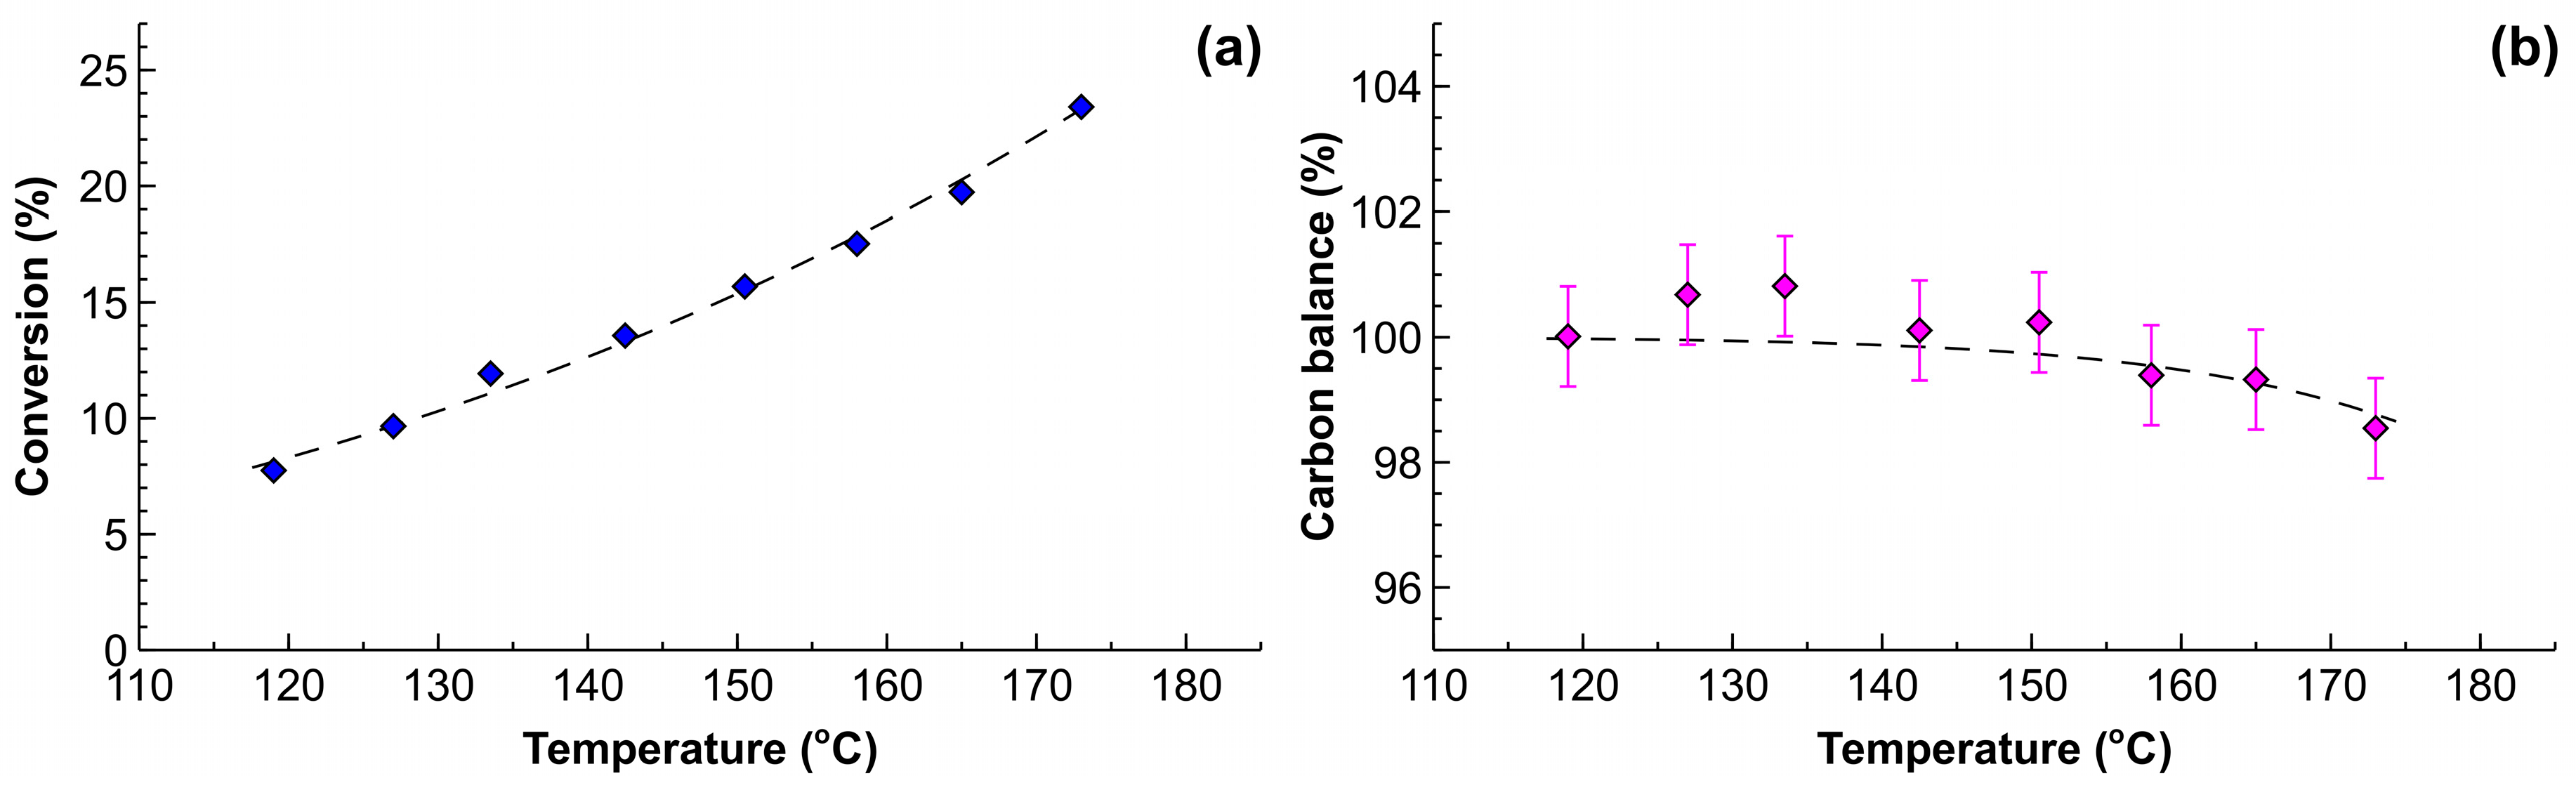
The results presented in Figure 9a show that the MBY conversion increased from 7% to 22% when comparing the reaction temperature of 120 and 175 °C. The conversion at the reaction temperature of 70 °C was only 2.2% (not shown). The MBE selectivity for all of the conditions studied was above 96.5%, which is in line with the data obtained for the lower-temperature semihydrogenation (Figure 6). The activation energy for the MBY hydrogenation was determined to be 28.4 ± 1.7 kJ mol−1, which is in good agreement with that of 25.2 ± 1.6 kJ mol−1 [48] obtained in a batch reactor in the low temperature range. This agreement indicates that no mass transfer limitations were observed under such conditions due to the excellent mass transfer performance of the tube reactor.
Importantly, the carbon balance obtained with the internal standard (tetradecane) was 100 ± 0.5% up to the reaction temperature of 150 °C and decreased only to 98.3 ± 0.4% at the highest reaction temperature studied of 175 °C. The decomposition of 1 mol % of MBY in the flow hydrogenation was observed at the reaction temperature as high as 160 °C.
The MBY decomposition reaction rate can be described with zero-order kinetics, as in Equation (3):
where rdecomp is the decomposition rate, A0 is the pre-exponential factor, and Ea is the activation energy. Similarly, the carbon balance (Cbal) in the reaction can be described as in Equation (4):
where tres is the residence time, Cinitial is the initial MBY concentration and k0 is a constant equal to A0/Cinitial. The parameters were determined by regression of the Figure 9b to be k0 = 1.6 × 10⁷ s−1 and Ea = 84 kJ mol−1.
The simple substrate decomposition model presented provides an opportunity to compare the performance of the catalyst-coated tube reactor with a batch reactor. When considering a batch operation for a typical duration of 1 h, the expected carbon balance would become 99% at the reaction temperature of only 72 °C. Such a low reaction temperature is in excellent agreement with the convention to perform batch semihydrogenation reaction around 70 °C [48,51,74,75]. The tube reactor with the residence time of only 6 s provides the same substrate decomposition at the temperature of 160 °C and allows for a 8-fold higher specific hydrogenation reaction rates when compared to the batch.
3. Materials and Methods
3.1. Characterisation
The samples of catalyst-coated tubes were obtained from Stoli Catalysts Ltd (Coventry, UK) using a proprietary technology and used as received for the catalytic testing. Due to patent restrictions, we cannot disclose the particular fabrication method, but the catalysts were obtained using a modified sol-gel approach, as reported in reference [36]. A tube with a coating was cut along the length and several cross-sections were studied with a Carl Zeiss Sigma scanning electron microscope (SEM) (Carl Zeiss, Oberkochen, Germany). Prior to the measurements, the sample was inserted in a conductive resin and polished. For the metal particle size distribution study, the coating was removed mechanically, redispersed in ethanol, and applied on a carbon-coated copper grid. The transmission electron microscopy (TEM) study was performed with a Jeol 2000FX microscope (Jeol, Akishima, Tokyo, Japan). Several images with more than 100 particles were analysed, and the particle size distribution was obtained using an ImageJ software (Version 1.50i, National Institute of Mental Health, Bethesda, MD, USA, 2017) [76].
Powder X-ray diffraction (XRD) patterns were collected from the extracted catalyst samples using a PANalytical Empyrean diffractometer (Malvern Panalytical B.V., Almelo, The Netherlands) that was equipped with a Co X-ray tube (Kα = 1.798 A) in the 2θ range of 5–50° using step scanning (0.01°) at a scanning rate of 60 s per step. Specific surface area and pore distribution were investigated using a Micromeritics ASAP 2020 instrument (Micromeritics, Norcross, GA, USA) with nitrogen physisorption at −196 °C. Prior to the measurements, the sample was degassed under evacuation (10 μPa) at 200 °C for 3 h.
3.2. Catalyst Testing
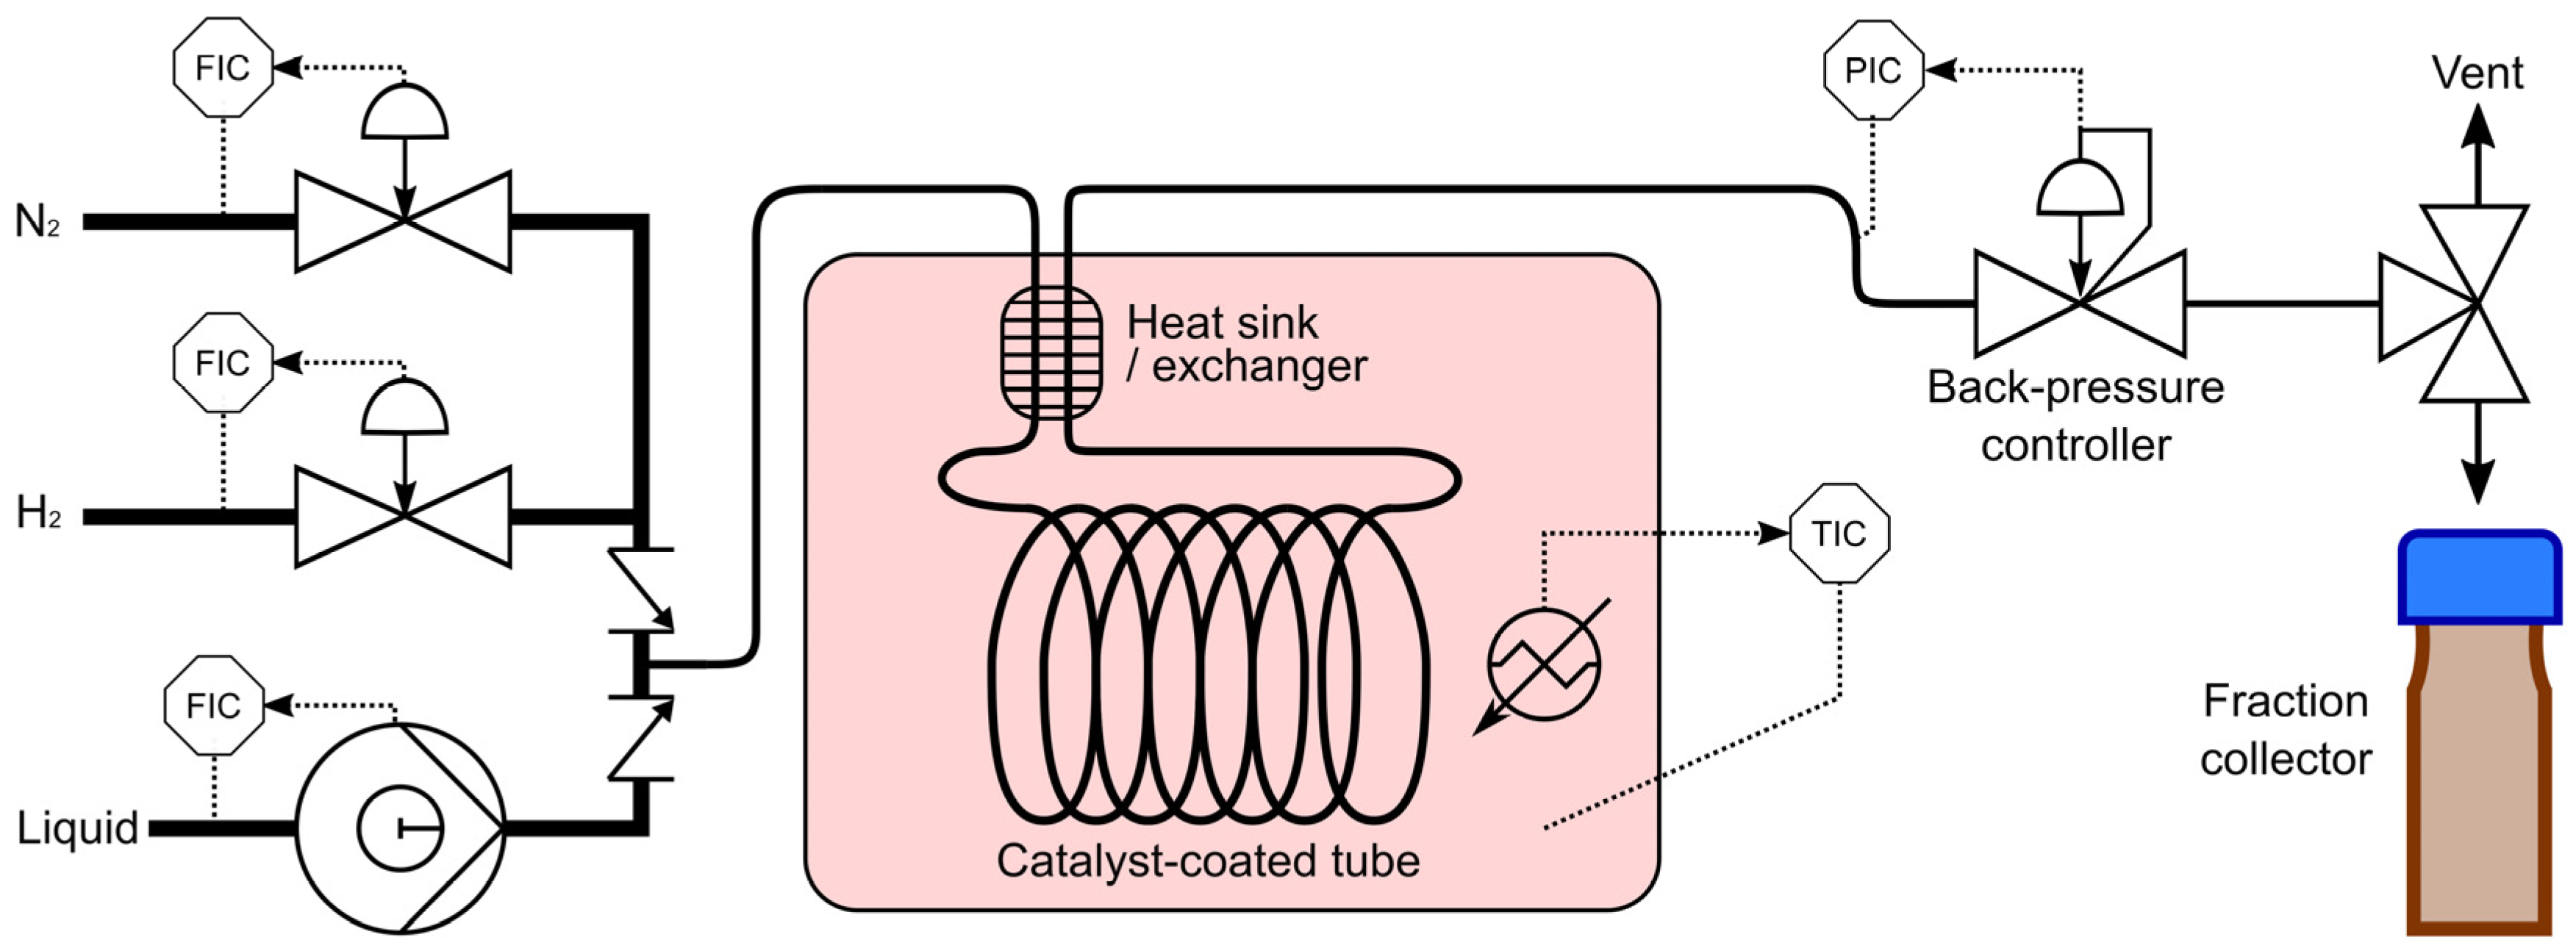
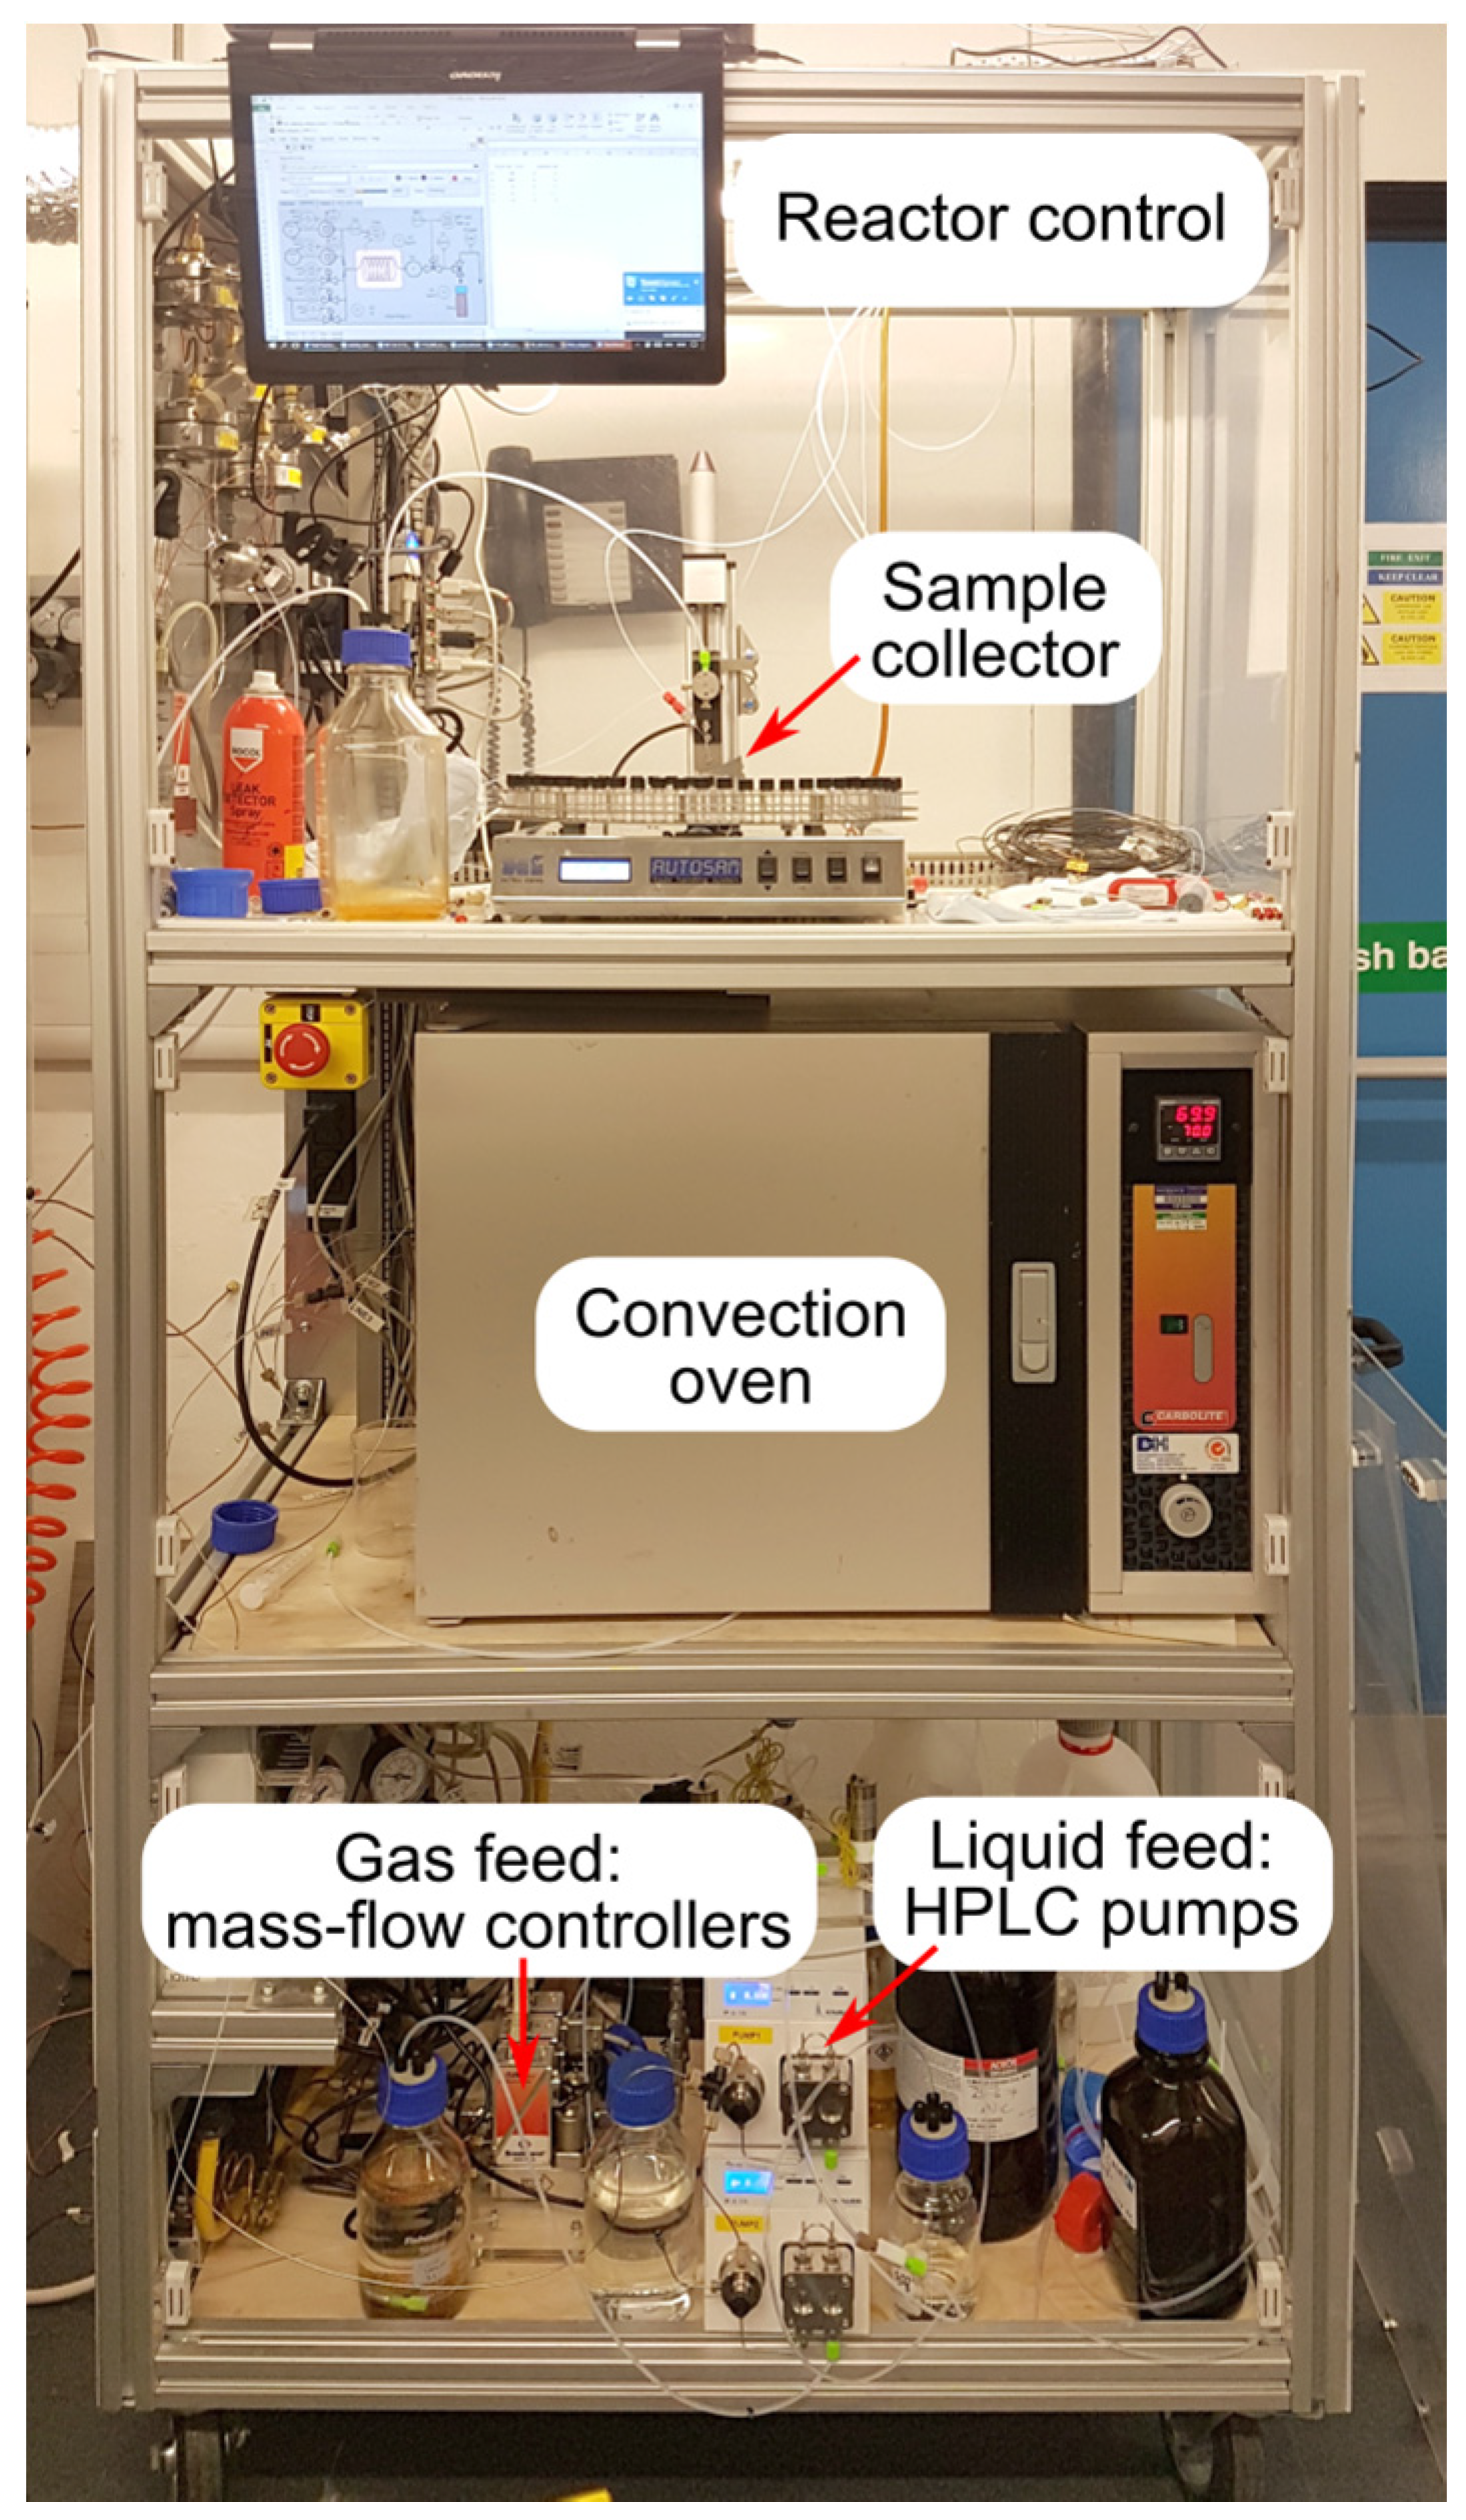
Catalyst testing was performed in the custom-built system, as schematically presented in Figure 10. The photograph of the system is shown in Figure 11. The system consists of Bronkhorst mass flow controllers (Bronkhorst High-Tech B.V., Ruurlo, The Netherlands) for H2 (99.999 vol %, The BOC Group plc, Guildford, UK) and N2 (99.999 vol %, BOC), a Knauer HPLC pump (Wissenschaftliche Geräte GmbH, Berlin, Germany), a convection furnace where the catalyst-coated tube was placed followed by an Equilibar gas-liquid back-pressure regulator (Equilibar LLC, Fletcher, NC, USA) and a fraction collector. Before testing, the catalyst-coated tubes were reduced in a flow of 10 mL min−1 (STP) H2 for 30 min at 50 °C. The reactor was operated in a fully automated mode using a pre-defined program, injecting liquid samples into vials equipped with septa to minimise sample evaporation. The reactor was flushed with liquid at least with three times of its internal volume to ensure a representative sample and sampling was repeated at least twice for every measurement.
The liquid samples extracted were analysed using a Shimadzu GC-2010 Gas Chromatograph (Shimadzu Corporation, Kyoto, Japan) equipped with a Stabilwax 0.32 mm ID column and a flame ionization detector (FID). The concentrations of MBY, MBE, and MBA were determined using external standard (area) calibration. In all of the cases, the carbon balance was above 100 ± 1%, except for the high-temperature experiments (Figure 9b). The results were discussed in terms of the MBY conversion (X) and selectivity towards MBE (SMBE), which are shown in Equations (5) and (6), where Cz is the concentration of a specie z.
Leaching of Pd was performed first by concentrating the collected feed from 300 mL into 3 mL. The liquid was then extracted with aqua regia and topped to 10.0 mL with deionized water and filtered. The analysis was performed with a PerkinElmer 5300DV ICP-OES instrument (Waltham, MA, USA) along with a series of standard samples in the concentration range of 1–1000 ppb.
4. Conclusions
A solvent-free semihydrogation reaction of alkynol has been studied in continuous flow using a tube reactor, wall-coated with a 5 wt% Pd/ZnO catalyst. The system allowed for the excellent selectivity towards the intermediate alkene with the maximum 2-methyl-3-butyn-2-ol (MBE) yield of 94.6%. Utilisation of a water solution increased the yield to 96.0%. The catalyst stability was studied for over 80 hours on stream and the deactivation rate of 0.07% per hour was observed. This means a 50% decrease in activity will be reached after one month of continuous operation. Moreover, a highly efficient utilisation of the noble metal was achieved with a turn-over number of above 105.
The continuous flow hydrogenation allows for a significant process intensification by increasing the process temperature by 90 °C above that used in a conventional batch reactor with a minimum substrate decomposition that does not exceed 1 mol% at the highest temperature studied. Under such conditions, the reaction rates increases by eight times without compromising the product selectivity, allowing us to reduce the residence time from hours required in batch to seconds in flow.
Acknowledgments
The authors are grateful to Jonathan Strong for the ICP analysis, Guannan Hu for the XRD study of the Pd/ZnO catalyst. We also acknowledge the support of the European Research Council Proof of concept grant (project MiCARF 693739) and InnovateUK grant (900041) for funding this research.
Author Contributions
N.C. and E.R. conceived and designed the experiments; Y.B. prepared the catalyst-coated tubes and performed the experiments; N.C. and Y.B. analysed the data; All the authors contributed to writing the paper.
Conflicts of Interest
The authors declare no conflict of interest.
References
- Jähnisch, K.; Hessel, V.; Löwe, H.; Baerns, M. Chemistry in microstructured reactors. Angew. Chem. Int. Ed. 2004, 43, 406–446. [Google Scholar] [CrossRef] [PubMed]
- Calabrese, G.S.; Pissavini, S. From Batch to Continuous Flow Processing in Chemicals Manufacturing. AIChE J. 2011, 57, 828–834. [Google Scholar] [CrossRef]
- Roberge, D.M.; Ducry, L.; Bieler, N.; Cretton, P.; Zimmermann, B. Microreactor Technology: A Revolution for the Fine Chemical and Pharmaceutical Industries? Chem. Eng. Technol. 2005, 28, 318–323. [Google Scholar] [CrossRef]
- Ford, M.E. (Ed.) Catalysis of Organic Reactions; Marcel Dekker: New York, NY, USA, 2001; ISBN 082470486X. [Google Scholar]
- Irfan, M.; Glasnov, T.N.; Kappe, C.O. Heterogeneous catalytic hydrogenation reactions in continuous-flow reactors. ChemSusChem 2011, 4, 300–316. [Google Scholar] [CrossRef] [PubMed]
- Jensen, K.F. Flow chemistry-Microreaction technology comes of age. AIChE J. 2017, 63, 858–869. [Google Scholar] [CrossRef]
- Chatterjee, S. FDA Perspective on Continuous Manufacturing. In Proceedings of the IFPAC Annual Meeting, Baltimore, MD, USA, 22–25 January 2012. [Google Scholar]
- Lawrence Yu Continuous Manufacturing Has a Strong Impact on Drug Quality. Available online: https://blogs.fda.gov/fdavoice/index.php/2016/04/continuous-manufacturing-has-a-strong-impact-on-drug-quality/ (accessed on 6 July 2017).
- Deadman, B.J.; Collins, S.G.; Maguire, A.R. Taming Hazardous Chemistry in Flow: The Continuous Processing of Diazo and Diazonium Compounds. Chem. A Eur. J. 2015, 21, 2298–2308. [Google Scholar] [CrossRef] [PubMed]
- Hessel, V.; Kralisch, D.; Kockmann, N.; Noël, T.; Wang, Q. Novel process windows for enabling, accelerating, and uplifting flow chemistry. ChemSusChem 2013, 6, 746–789. [Google Scholar] [CrossRef] [PubMed]
- Ehrfeld, W.; Hessel, V.; Löwe, H. Microreactors; Wiley-VCH Verlag GmbH & Co. KGaA: Weinheim, Germany, 2000; ISBN 3527295909. [Google Scholar]
- Pastre, J.C.; Browne, D.L.; Ley, S.V. Flow chemistry syntheses of natural products. Chem. Soc. Rev. 2013, 42, 8849–8869. [Google Scholar] [CrossRef] [PubMed]
- Frost, C.G.; Mutton, L. Heterogeneous catalytic synthesis using microreactor technology. Green Chem. 2010, 12, 1687–1703. [Google Scholar] [CrossRef]
- Mason, B.P.; Price, K.E.; Steinbacher, J.L.; Bogdan, A.R.; McQuade, T.D.; McQuade, D.T. Greener approaches to organic synthesis using microreactor technology. Chem. Rev. 2007, 107, 2300–2318. [Google Scholar] [CrossRef] [PubMed]
- Wakami, H.; Yoshida, J. Grignard Exchange Reaction Using a Microflow System: From Bench to Pilot Plant. Org. Process Res. Dev. 2005, 9, 787–791. [Google Scholar] [CrossRef]
- Zhang, X.; Stefanick, S.; Villani, F.J. Application of Microreactor Technology in Process Development. Org. Process Res. Dev. 2004, 8, 455–460. [Google Scholar] [CrossRef]
- Müller, S.T.R.; Wirth, T. Diazo Compounds in Continuous-Flow Technology. ChemSusChem 2015, 8, 245–250. [Google Scholar] [CrossRef] [PubMed]
- Pieber, B.; Kappe, C.O. Generation and Synthetic Application of Trifluoromethyl Diazomethane Utilizing Continuous Flow Technologies. Org. Lett. 2016, 18, 1076–1079. [Google Scholar] [CrossRef] [PubMed]
- Carey, J.S.; Laffan, D.; Thomson, C.; Williams, M.T. Analysis of the reactions used for the preparation of drug candidate molecules. Org. Biomol. Chem. 2006, 4, 2337–2347. [Google Scholar] [CrossRef] [PubMed]
- Bonrath, W.; Medlock, J.; Schutz, J.; Wüstenberg, B.; Netscher, T. Hydrogenation in the Vitamins and Fine Chemicals Industry—An Overview. In Hydrogenation; InTech: Rijeka, Yugoslavia, 2012; pp. 69–90. ISBN 978-953-51-0785-9. [Google Scholar]
- Bonrath, W.; Eggersdorfer, M.; Netscher, T. Catalysis in the industrial preparation of vitamins and nutraceuticals. Catal. Today 2007, 121, 45–57. [Google Scholar] [CrossRef]
- Eggersdorfer, M.; Laudert, D.; Létinois, U.; McClymont, T.; Medlock, J.; Netscher, T.; Bonrath, W. One hundred years of vitamins-a success story of the natural sciences. Angew. Chem. Int. Ed. 2012, 51, 12960–12990. [Google Scholar] [CrossRef] [PubMed]
- Anderson, J.A.; Mellor, J.; Wells, R.K.P.K. Pd catalysed hexyne hydrogenation modified by Bi and by Pb. J. Catal. 2009, 261, 208–216. [Google Scholar] [CrossRef]
- Cherkasov, N.; Ibhadon, A.O.; McCue, A.; Anderson, J.A.; Johnston, S.K. Palladium–bismuth intermetallic and surface-poisoned catalysts for the semi-hydrogenation of 2-methyl-3-butyn-2-ol. Appl. Catal. A Gen. 2015, 497, 22–30. [Google Scholar] [CrossRef]
- Coq, B.; Figueras, F. Bimetallic palladium catalysts: influence of the co-metal on the catalyst performance. J. Mol. Catal. A Chem. 2001, 173, 117–134. [Google Scholar] [CrossRef]
- López, N.; Vargas-Fuentes, C. Promoters in the hydrogenation of alkynes in mixtures: insights from density functional theory. Chem. Commun. 2012, 48, 1379–1391. [Google Scholar] [CrossRef] [PubMed]
- Wu, Z.; Cherkasov, N.; Cravotto, G.; Borretto, E.; Ibhadon, A.O.; Medlock, J.; Bonrath, W. Ultrasound- and Microwave-Assisted Preparation of Lead-Free Palladium Catalysts: Effects on the Kinetics of Diphenylacetylene Semi-Hydrogenation. ChemCatChem 2015, 7, 952–959. [Google Scholar] [CrossRef]
- Cherkasov, N.; Ibhadon, A.O.; Rebrov, E.V. Solvent-free Semihydrogenation of Acetylene Alcohols in a Capillary Reactor coated with a Pd-Bi/TiO2 Catalyst. Appl. Catal. A Gen. 2016, 515, 108–115. [Google Scholar] [CrossRef]
- Nijhuis, T.A.; van Koten, G.; Moulijn, J.A. Optimized palladium catalyst systems for the selective liquid-phase hydrogenation of functionalyzed alkynes. Appl. Catal. A Gen. 2003, 238, 259–271. [Google Scholar] [CrossRef]
- Kundu, A.; Saroha, A.K.; Nigam, K.D.P. Liquid distribution studies in trickle-bed reactors. Chem. Eng. Sci. 2001, 56, 5963–5967. [Google Scholar] [CrossRef]
- Van Herk, D.; Castaño, P.; Makkee, M.; Moulijn, J.A.; Kreutzer, M.T. Catalyst testing in a multiple-parallel, gas–liquid, powder-packed bed microreactor. Appl. Catal. A Gen. 2009, 365, 199–206. [Google Scholar] [CrossRef]
- Elias, Y.; Rudolf von Rohr, P.; Bonrath, W.; Medlock, J.; Buss, A. A porous structured reactor for hydrogenation reactions. Chem. Eng. Process. Process Intensif. 2015, 95, 175–185. [Google Scholar] [CrossRef]
- Kapteijn, F.; Nijhuis, T.A.; Heiszwolf, J.J.; Moulijn, J.A. New non-traditional multiphase catalytic reactors based on monolithic structures. Catal. Today 2001, 66, 133–144. [Google Scholar] [CrossRef]
- Tsoligkas, A.N.; Simmons, M.J.H.; Wood, J. Influence of orientation upon the hydrodynamics of gas-liquid flow for square channels in monolith supports. Chem. Eng. Sci. 2007, 62, 4365–4378. [Google Scholar] [CrossRef]
- Tsoligkas, A.N.; Simmons, M.J.H.; Wood, J.; Frost, C.G. Kinetic and selectivity studies of gas-liquid reaction under Taylor flow in a circular capillary. Catal. Today 2007, 128, 36–46. [Google Scholar] [CrossRef]
- Cherkasov, N.; Ibhadon, A.O.; Rebrov, E.V. Novel synthesis of thick wall coatings of titania supported Bi poisoned Pd catalysts and application in selective hydrogenation of acetylene alcohols in capillary microreactors. Lab Chip 2015, 15, 1952–1960. [Google Scholar] [CrossRef] [PubMed]
- Rebrov, E.V.; Berenguer-Murcia, A.; Wheatley, A.E.H.; Johnson, B.F.G.; Schouten, J.C. Thin catalytic coatings on microreactor walls A way to make industrial processes more efficient. Chim. Oggi 2009, 27, 4–7. [Google Scholar]
- Rebrov, E.V.; Klinger, E.A.; Berenguer-murcia, A.; Sulman, E.M.; Schouten, J.C. Selective Hydrogenation of 2-Methyl-3-butyne-2-ol in a Wall-Coated Capillary Microreactor with a Pd2.5Zn7.5/TiO2 Catalyst. Org. Process Res. Dev. 2009, 13, 991–998. [Google Scholar] [CrossRef]
- Protasova, L.N.; Rebrov, E.V.; Skelton, H.E.; Wheatley, A.E.H.; Schouten, J.C. A kinetic study of the liquid-phase hydrogenation of citral on Au/TiO2 and Pt–Sn/TiO2 thin films in capillary microreactors. Appl. Catal. A Gen. 2011, 399, 12–21. [Google Scholar] [CrossRef]
- Bakker, J.J.W.; Zieverink, M.M.P.; Reintjens, R.W.E.G.; Kapteijn, F.; Moulijn, J.A.; Kreutzer, M.T. Heterogeneously Catalyzed Continuous-Flow Hydrogenation Using Segmented Flow in Capillary Columns. ChemCatChem 2011, 3, 1155–1157. [Google Scholar] [CrossRef] [PubMed]
- Cherkasov, N.; Al-Rawashdeh, M.; Ibhadon, A.O.; Rebrov, E.V. Scale up study of capillary microreactors in solvent-free semihydrogenation of 2-methyl-3-butyn-2-ol. Catal. Today 2016, 273, 205–212. [Google Scholar] [CrossRef]
- Li, D.; Haneda, H. Morphologies of zinc oxide particles and their effects on photocatalysis. Chemosphere 2003, 51, 129–137. [Google Scholar] [CrossRef]
- Sun, Y.; Chen, L.; Bao, Y.; Zhang, Y.; Wang, J.; Fu, M.; Wu, J.; Ye, D. The Applications of Morphology Controlled ZnO in Catalysis. Catalysts 2016, 6, 188. [Google Scholar] [CrossRef]
- Johnston, S.K.; Cherkasov, N.; Pérez-Barrado, E.; Aho, A.; Murzin, D.Y.; Ibhadon, A.O.; Francesconi, M.G. Pd3Sn nanoparticles on TiO2 and ZnO supports as catalysts for semi-hydrogenation: Synthesis and catalytic performance. Appl. Catal. A Gen. 2017, 544, 40–45. [Google Scholar] [CrossRef]
- Okhlopkova, L.B.; Cherepanova, S.V.; Prosvirin, I.P.; Kerzhentsev, M.A.; Ismagilov, Z.R. Semi-hydrogenation of 2-methyl-3-butyn-2-ol on Pd-Zn nanoalloys prepared by polyol method: Effect of composition and heterogenizationNo Title. Appl. Catal. A 2018, 549, 245–253. [Google Scholar] [CrossRef]
- Semagina, N.; Grasemann, M.; Xanthopoulos, N.; Renken, A.; Kiwi-Minsker, L. Structured catalyst of Pd/ZnO on sintered metal fibers for 2-methyl-3-butyn-2-ol selective hydrogenation. J. Catal. 2007, 251, 213–222. [Google Scholar] [CrossRef]
- Borodziński, A.; Bonarowska, M. Relation between Crystallite Size and Dispersion on Supported Metal Catalysts. Langmuir 1997, 13, 5613–5620. [Google Scholar] [CrossRef]
- Crespo-Quesada, M.; Grasemann, M.; Semagina, N.; Renken, A.; Kiwi-Minsker, L. Kinetics of the solvent-free hydrogenation of 2-methyl-3-butyn-2-ol over a structured Pd-based catalyst. Catal. Today 2009, 147, 247–254. [Google Scholar] [CrossRef]
- Rebrov, E.V.; Berenguer-Murcia, A.; Skelton, H.E.; Johnson, B.F.G.; Wheatley, A.E.H.; Schouten, J.C. Capillary microreactors wall-coated with mesoporous titania thin film catalyst supports. Lab Chip 2009, 9, 503–506. [Google Scholar] [CrossRef] [PubMed] [Green Version]
- Okhlopkova, L.B.; Matus, E.V.; Prosvirin, I.P.; Kerzhentsev, M.A.; Ismagilov, Z.R. Selective hydrogenation of 2-methyl-3-butyn-2-ol catalyzed by embedded polymer-protected PdZn nanoparticles. J. Nanoparticle Res. 2015, 17, 1–15. [Google Scholar] [CrossRef]
- Shen, L.; Mao, S.; Li, J.; Li, M.; Chen, P.; Li, H.; Chen, Z.; Wang, Y. PdZn intermetallic on a CN@ZnO hybrid as an efficient catalyst for the semihydrogenation of alkynols. J. Catal. 2017, 350, 13–20. [Google Scholar] [CrossRef]
- Vernuccio, S.; Goy, R.; Meier, A.; Rudolf von Rohr, P.; Medlock, J. Kinetics and mass transfer of the hydrogenation of 2-methyl-3-butyn-2-ol in a structured Pd/ZnO/Al2O3 reactor. Chem. Eng. J. 2017, 316, 121–130. [Google Scholar] [CrossRef]
- Silvestre-Albero, J.; Rupprechter, G.; Freund, H. Atmospheric pressure studies of selective 1,3-butadiene hydrogenation on Pd single crystals: effect of CO addition. J. Catal. 2005, 235, 52–59. [Google Scholar] [CrossRef]
- Bos, A.N.R.; Westerterp, K.R. Mechanism and kinetics of the selective hydrogenation of ethyne and ethene. Chem. Eng. Process. Process Intensif. 1993, 32, 1–7. [Google Scholar] [CrossRef]
- Kennedy, D.R.; Webb, G.; Jackson, S.D.; Lennon, D. Propyne hydrogenation over alumina-supported palladium and platinum catalysts. Appl. Catal. A Gen. 2004, 259, 109–120. [Google Scholar] [CrossRef]
- Tew, M.W.; Emerich, H.; van Bokhoven, J.A. Formation and Characterization of PdZn Alloy: A Very Selective Catalyst for Alkyne Semihydrogenation. J. Phys. Chem. C 2011, 115, 8457–8465. [Google Scholar] [CrossRef]
- Duca, D.; Liotta, L.F.; Deganello, G. Selective hydrogenation of phenylacetylene on pumice-supported palladium catalysts. J. Catal. 1995, 154, 69–79. [Google Scholar] [CrossRef]
- Singh, U.K.; Vannice, M.A. Kinetics of liquid-phase hydrogenation reactions over supported metal catalysts—A review. Appl. Catal. A Gen. 2001, 213, 1–24. [Google Scholar] [CrossRef]
- Günther, A.; Khan, S.A.; Thalmann, M.; Trachel, F.; Jensen, K.F. Transport and reaction in microscale segmented gas—Liquid flow. Lab Chip 2004, 4, 278–286. [Google Scholar] [CrossRef] [PubMed]
- Warnier, M.J.F. Taylor Flow Hydrodynamics in Gas-Liquid-Solid Micro Reactors. Ph.D. Thesis, Eindhoven University of Technology, Eindhoven, The Netherlands, 2009. [Google Scholar]
- Albers, P.; Pietsch, J.; Parker, S.F. Poisoning and deactivation of palladium catalysts. J. Mol. Catal. A Chem. 2001, 173, 275–286. [Google Scholar] [CrossRef]
- Flahive, E.J.; Ewanicki, B.L.; Sach, N.W.; O’Neill-Slawecki, S.A.; Stankovic, N.S.; Yu, S.; Guinness, S.M.; Dunn, J. Development of an effective palladium removal process for VEGF oncology candidate AG13736 and a simple, efficient screening technique for scavenger reagent identification. Org. Process Res. Dev. 2008, 12, 637–645. [Google Scholar] [CrossRef]
- Panpranot, J.; Phandinthong, K.; Praserthdam, P.; Hasegawa, M.; Fujita, S.; Arai, M. A comparative study of liquid-phase hydrogenation on Pd/SiO2 in organic solvents and under pressurized carbon dioxide: Activity change and metal leaching/sintering. J. Mol. Catal. A Chem. 2006, 253, 20–24. [Google Scholar] [CrossRef]
- Nikoshvili, L.; Shimanskaya, E.; Bykov, A.; Yuranov, I.; Kiwi-Minsker, L.; Sulman, E. Selective hydrogenation of 2-methyl-3-butyn-2-ol over Pd-nanoparticles stabilized in hypercrosslinked polystyrene: Solvent effect. Catal. Today 2015, 241, 179–188. [Google Scholar] [CrossRef]
- Al-Rawashdeh, M.; Fluitsma, L.J.M.; Nijhuis, T.A.; Rebrov, E.V.; Hessel, V.; Schouten, J.C. Design criteria for a barrier-based gas-liquid flow distributor for parallel microchannels. Chem. Eng. J. 2012, 181–182, 549–556. [Google Scholar] [CrossRef]
- Al-Rawashdeh, M.; Yu, F.; Nijhuis, T.A.; Rebrov, E.V.; Hessel, V.; Schouten, J.C. Numbered-up gas–liquid micro/milli channels reactor with modular flow distributor. Chem. Eng. J. 2012, 207–208, 645–655. [Google Scholar] [CrossRef] [Green Version]
- Teschner, D.; Vass, E.; Havecker, M.; Zafeiratos, S.; Schnorch, P.; Sauer, H.; Knopgericke, A.; Schlogl, R.; Chamam, M.; Wootsch, A. Alkyne hydrogenation over Pd catalysts: A new paradigm. J. Catal. 2006, 242, 26–37. [Google Scholar] [CrossRef]
- Teschner, D.; Borsodi, J.; Kis, Z.; Szentmiklósi, L.; Révay, Z.; Knop-Gericke, A.; Schlögl, R.; Torres, D.; Sautet, P. Role of Hydrogen Species in Palladium-Catalyzed Alkyne Hydrogenation. J. Phys. Chem. C 2010, 114, 2293–2299. [Google Scholar] [CrossRef]
- Teschner, D.; Révay, Z.; Borsodi, J.; Hävecker, M.; Knop-Gericke, A.; Schlögl, R.; Milroy, D.; Jackson, S.D.; Torres, D.; Sautet, P. Understanding palladium hydrogenation catalysts: When the nature of the reactive molecule controls the nature of the catalyst active phase. Angew. Chem. 2008, 47, 9274–9278. [Google Scholar] [CrossRef] [PubMed]
- Teschner, D.; Borsodi, J.; Wootsch, A.; Révay, Z.; Hävecker, M.; Knop-Gericke, A.; Jackson, S.D.; Schlögl, R. The roles of subsurface carbon and hydrogen in palladium-catalyzed alkyne hydrogenation. Science 2008, 320, 86–89. [Google Scholar] [CrossRef] [PubMed]
- Shokouhimehr, M. Magnetically Separable and Sustainable Nanostructured Catalysts for Heterogeneous Reduction of Nitroaromatics. Catalysts 2015, 5, 534–560. [Google Scholar] [CrossRef]
- Cherkasov, N.; Jadvani, V.; Mann, J.; Losovyj, Y.B.; Shifrina, Z.B.; Bronstein, L.M.; Rebrov, E.V. Hydrogenation of bio-oil into higher alcohols over Ru/Fe3O4-SiO2 catalysts. Fuel Process. Technol. 2017, 167, 738–746. [Google Scholar] [CrossRef]
- Argyle, M.; Bartholomew, C. Heterogeneous Catalyst Deactivation and Regeneration: A Review. Catalysts 2015, 5, 145–269. [Google Scholar] [CrossRef]
- Mitsudome, T.; Takahashi, Y.; Ichikawa, S.; Mizugaki, T.; Jitsukawa, K.; Kaneda, K. Metal-ligand core-shell nanocomposite catalysts for the selective semihydrogenation of alkynes. Angew. Chem. Int. Ed. 2013, 52, 1481–1485. [Google Scholar] [CrossRef] [PubMed]
- Molnár, Á.; Sárkány, A.; Varga, M. Hydrogenation of carbon–carbon multiple bonds: Chemo-, regio-and stereo-selectivity. J. Mol. Catal. A Chem. 2001, 173, 185–221. [Google Scholar] [CrossRef]
- Schneider, C.A.; Rasband, W.S.; Eliceiri, K.W. NIH Image to ImageJ: 25 years of image analysis. Nat. Methods 2012, 9, 671–675. [Google Scholar] [CrossRef] [PubMed]
Figure 1.
Scanning electron microscope (SEM) microphotographs of the coating (a) cross-section and (b) isometric views.
Figure 1.
Scanning electron microscope (SEM) microphotographs of the coating (a) cross-section and (b) isometric views.
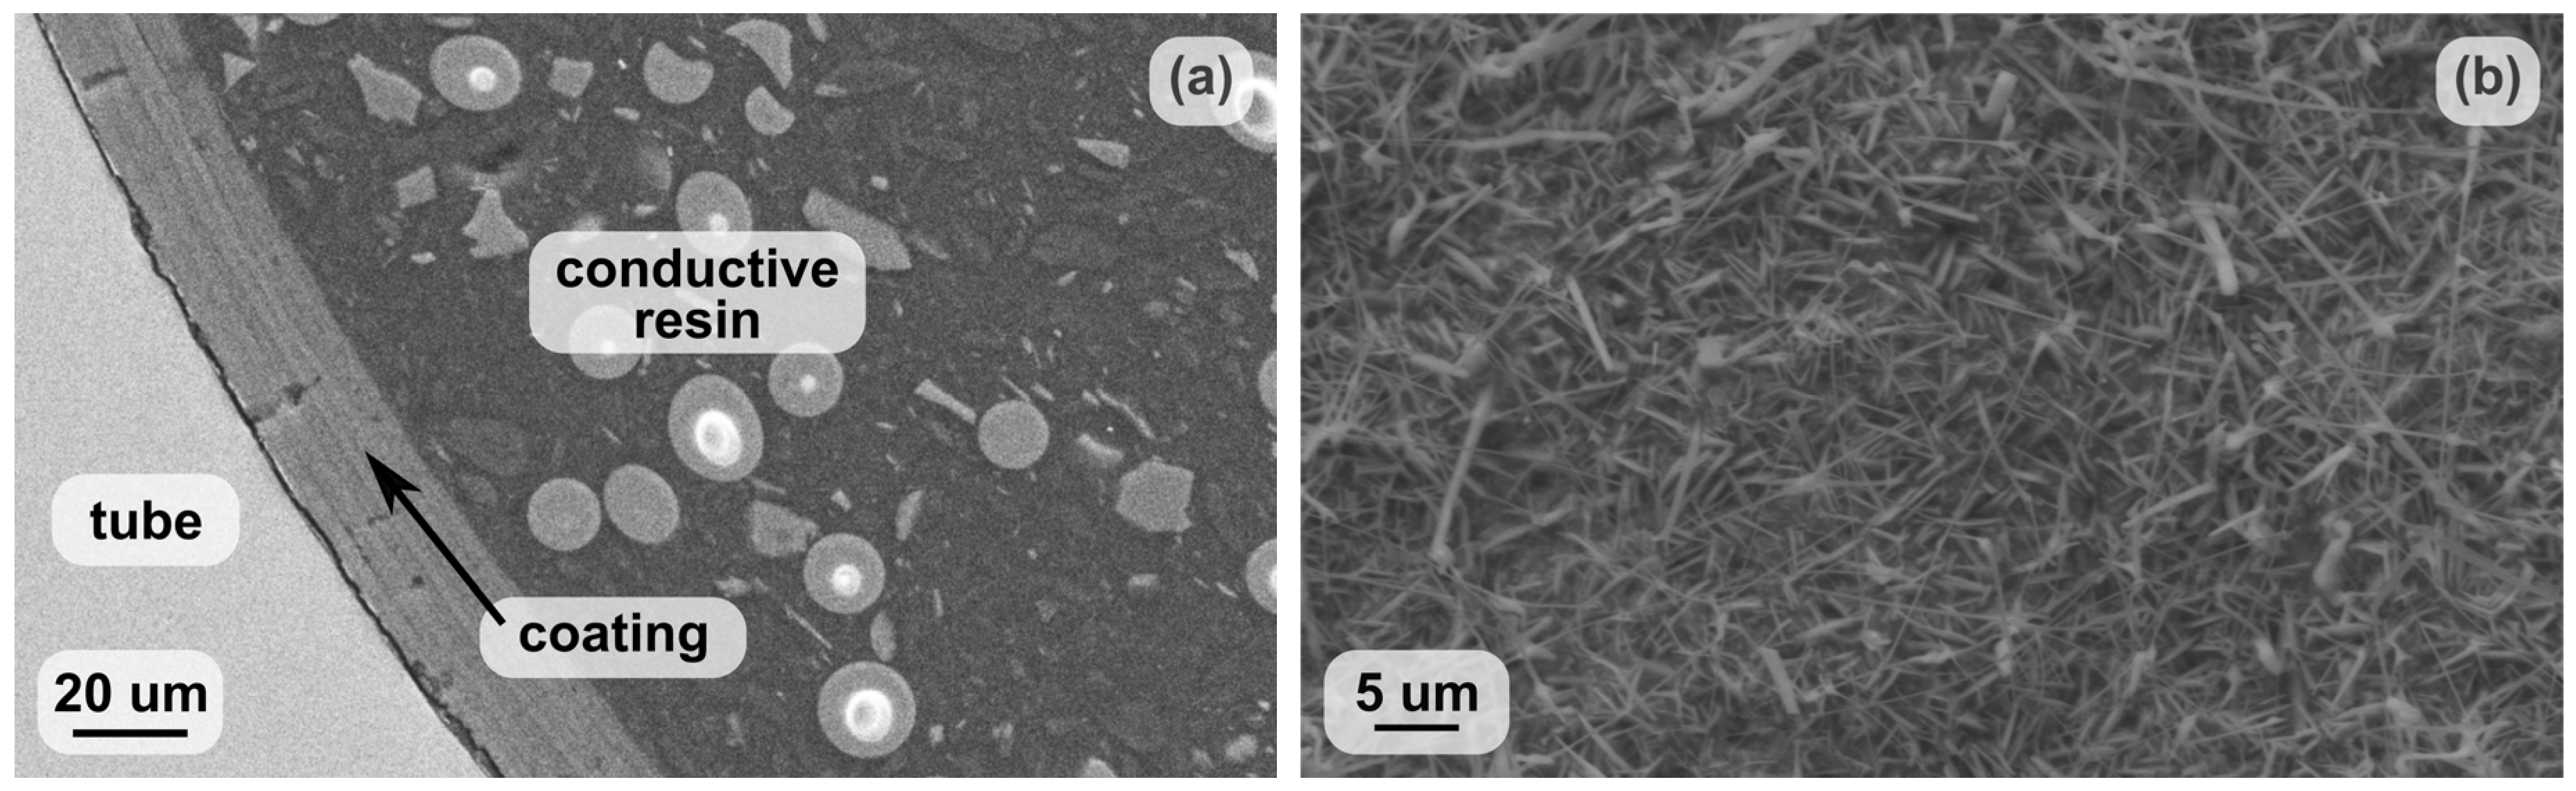
Figure 2.
Powder X-ray diffraction pattern (obtained via Co X-ray tube) for the coating as compared to the wurtzite structure.
Figure 2.
Powder X-ray diffraction pattern (obtained via Co X-ray tube) for the coating as compared to the wurtzite structure.

Figure 3.
Transmission electron microscopy (TEM) image of the Pd nanoparticles supported on ZnO with their diameter distribution.
Figure 3.
Transmission electron microscopy (TEM) image of the Pd nanoparticles supported on ZnO with their diameter distribution.
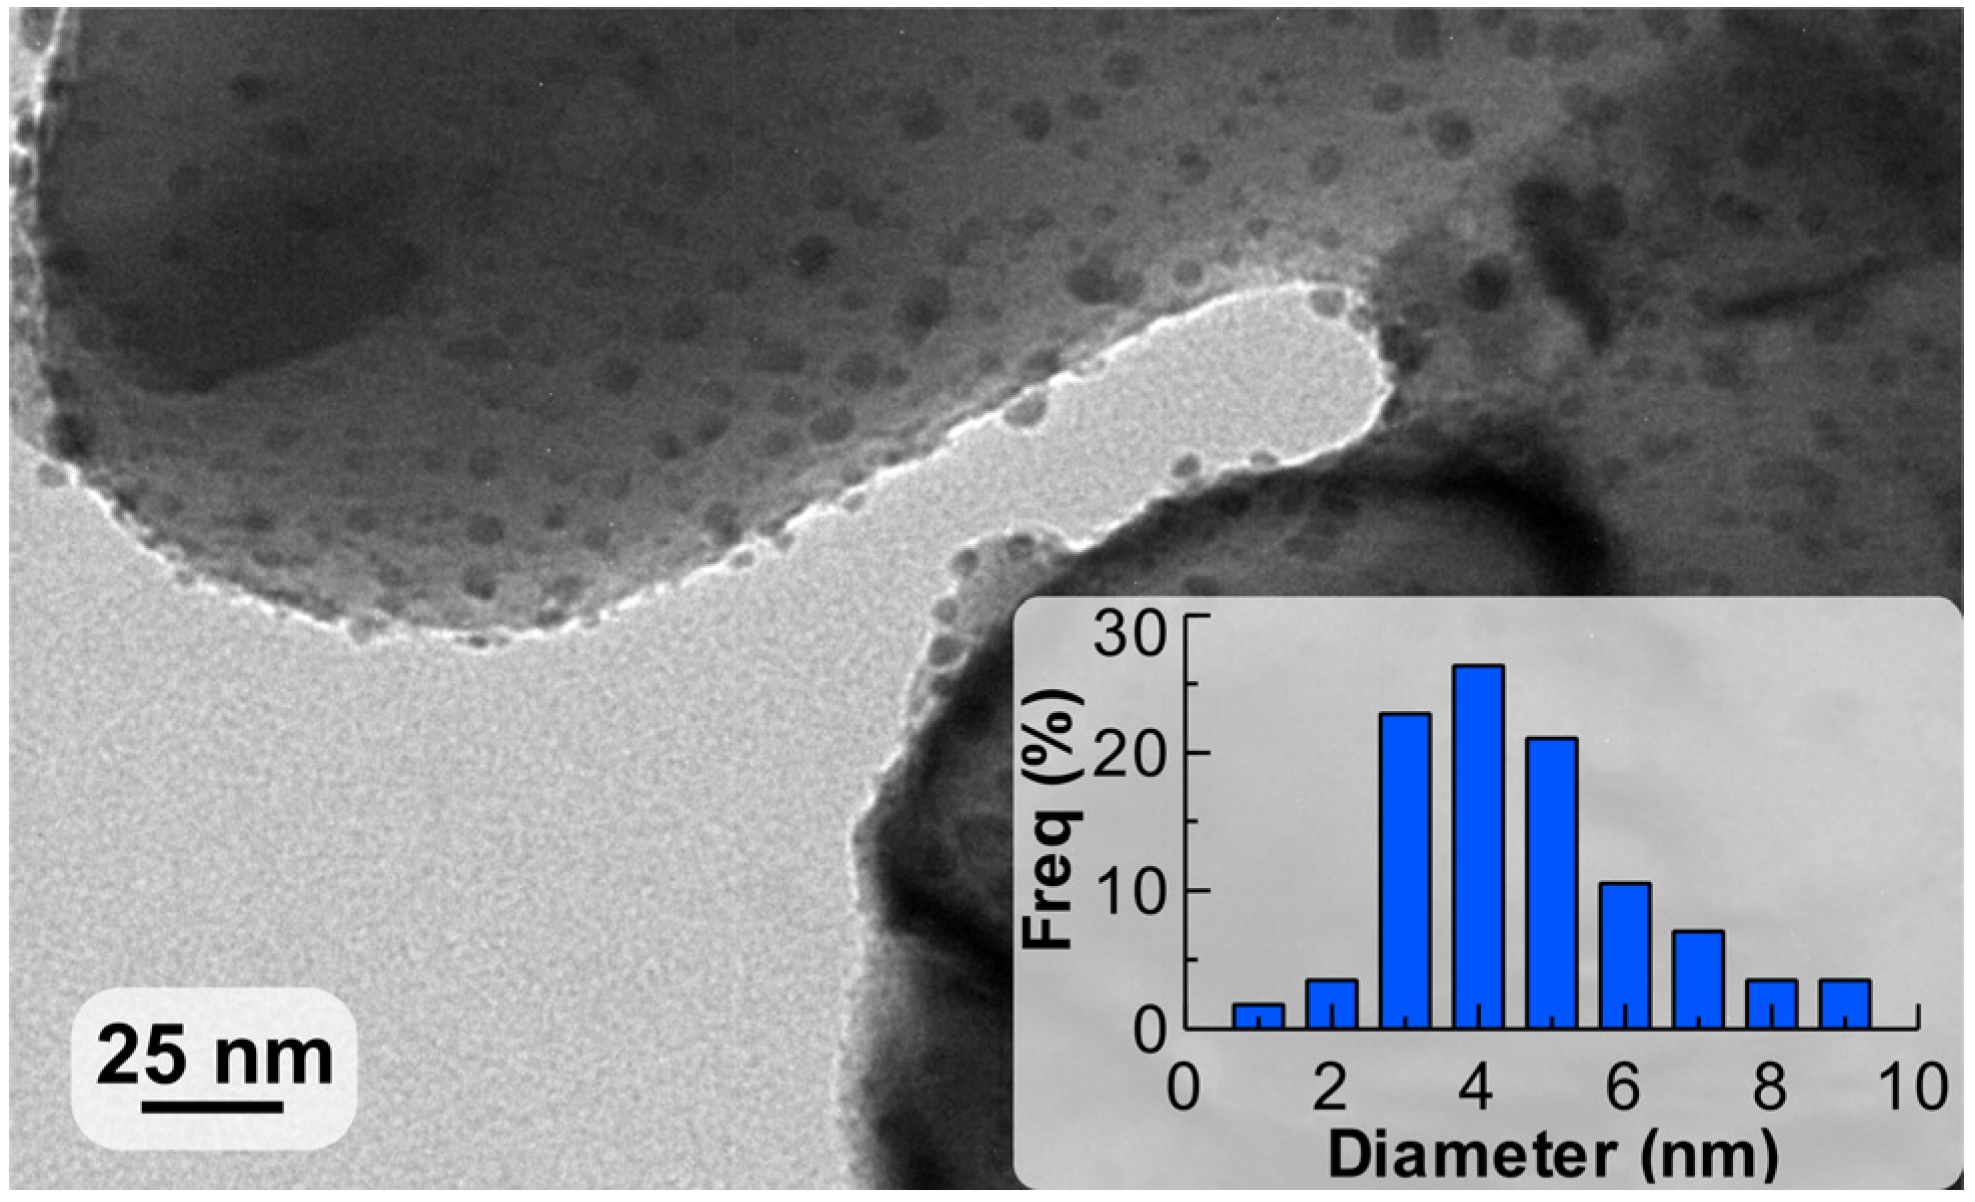
Figure 4.
Scheme of the 2-methyl-3-butyn-2-ol (MBY) hydrogenation reaction.

Figure 5.
The effect of liquid flow rate and reaction temperature on (a) 2-methyl-3-butyn-2-ol (MBY) conversion and (b) 2-methyl-3-buten-2-ol (MBE) selectivity in semihydrogenation of solvent-free MBY. Reaction conditions: MBY/H2 molar ratio of 1.05, ambient H2 pressure inside a 5 m reactor coated with a 5 wt% Pd/ZnO catalyst.

Figure 6.
The effects of hydrogen pressure on (a) 2-methyl-3-butyn-2-ol (MBY) conversion and (b) 2-methyl-3-buten-2-ol (MBE) selectivity. Reaction conditions: solvent-free MBY flow 400 μL min−1, 100 mL min−1 (standard temperature and pressure, STP) H2 with the addition of either 0, 5 or 15 mL min−1 (STP) N2. The reaction temperature of 50 °C inside a 5 m reactor coated with a 5 wt% Pd/ZnO catalyst.
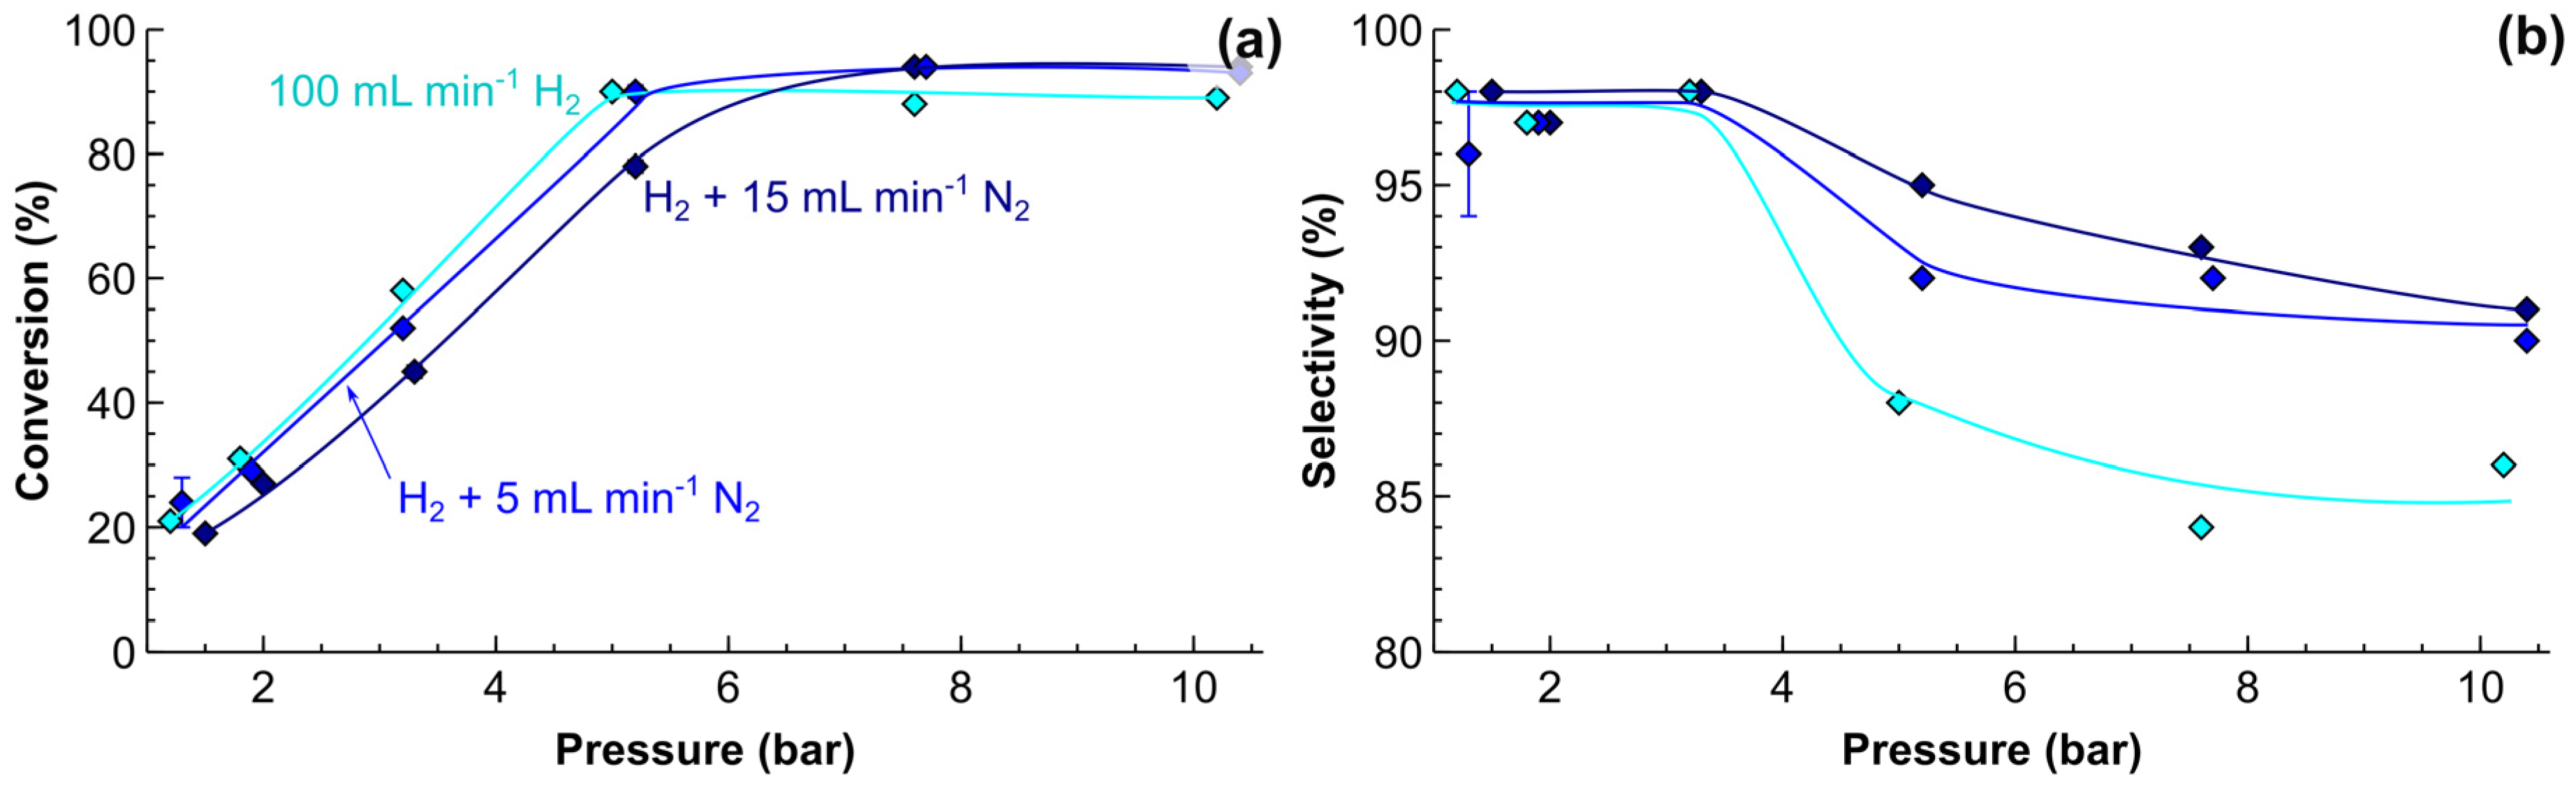
Figure 7.
MBY conversion as a function of reaction pressure in the hydrogenation of a 30 vol % MBY aqueous solution in a 5 m reactor coated with a 5 wt % Pd/ZnO catalyst. Reaction conditions: liquid flow rate 0.65 or 1.3 mL min−1, H2 flow 55 or 110 mL min−1 (standard temperature and pressure, STP), respectively. The reaction temperature: 50 °C. The MBE selectivity was 99.0% in the entire range of conditions studied.
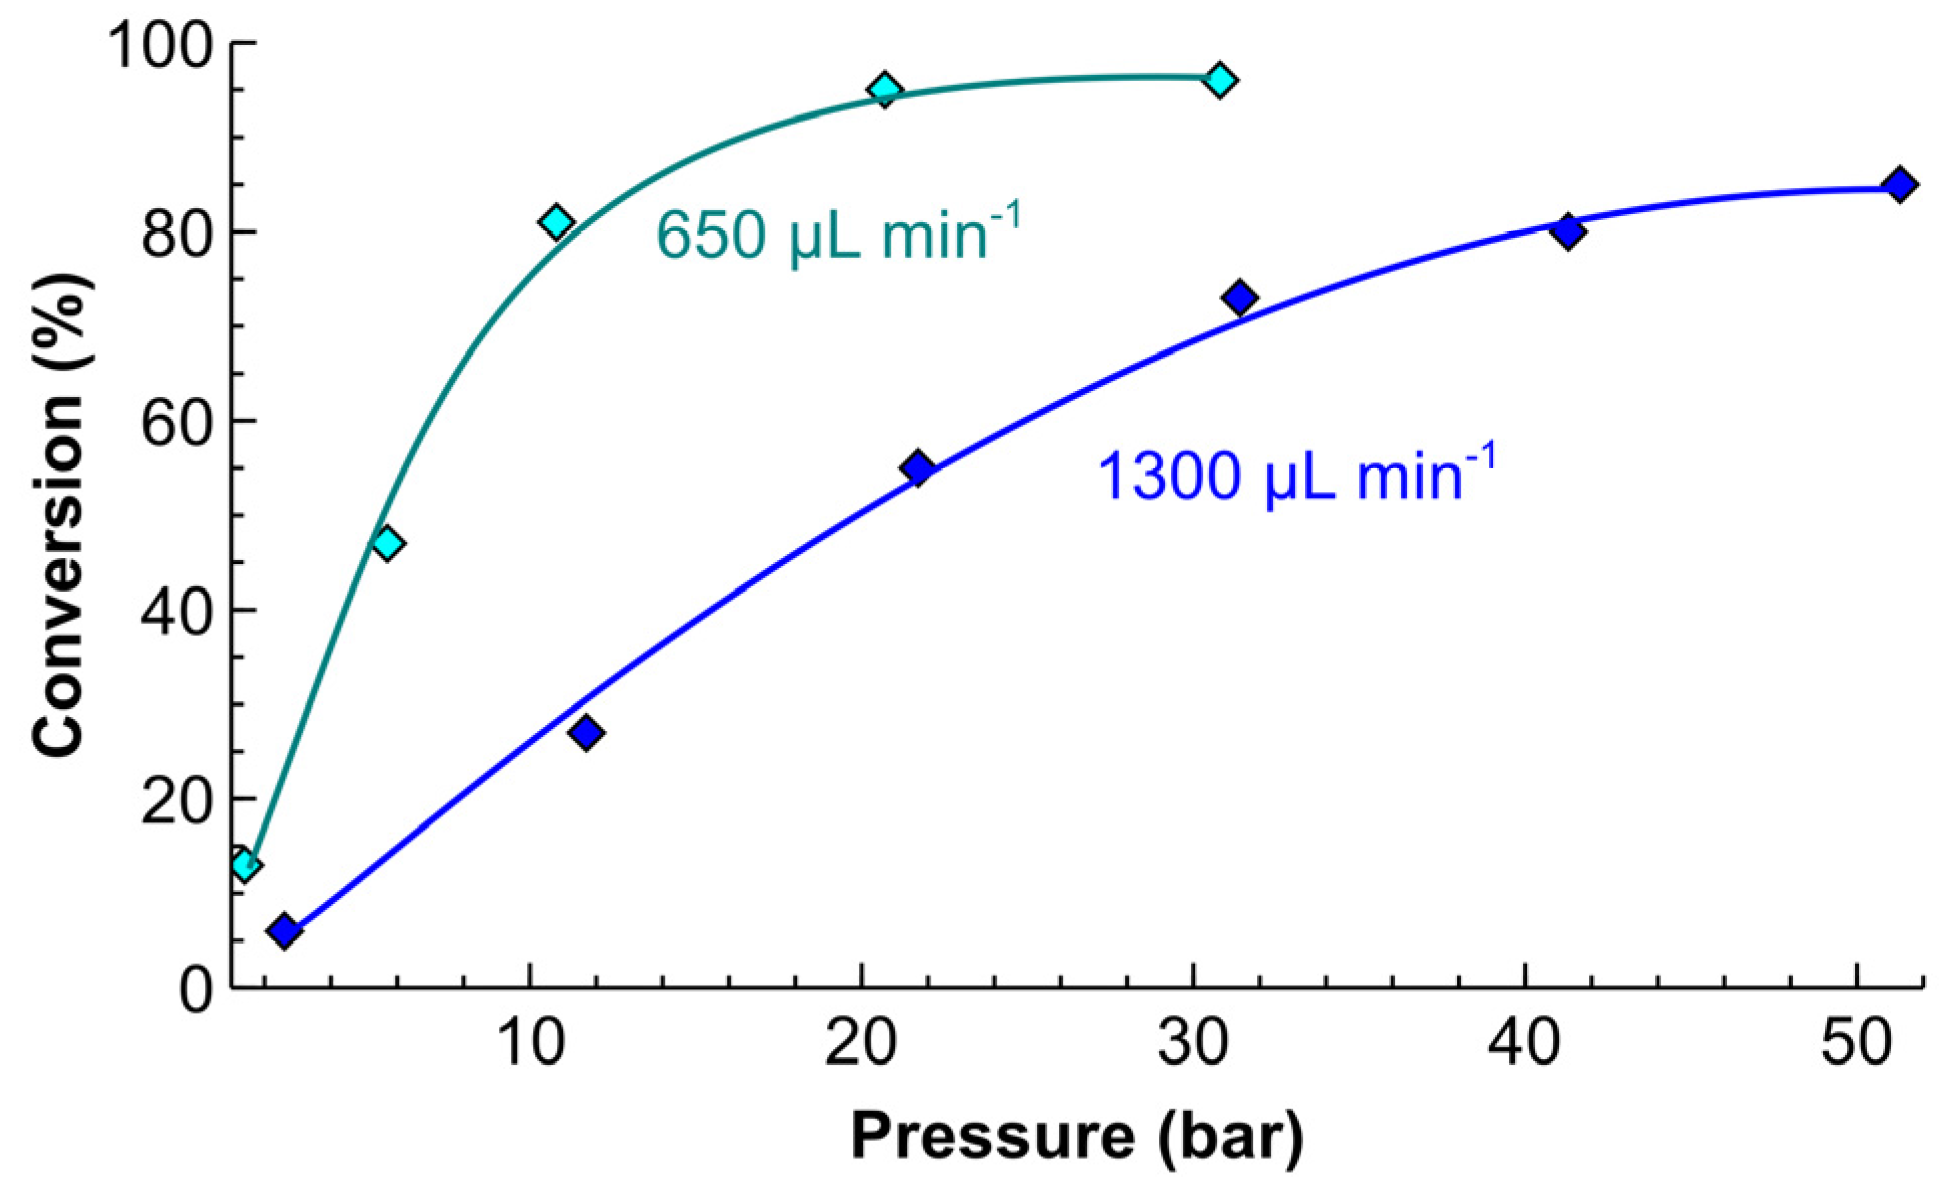
Figure 8.
Deactivation of the 5 wt% Pd/ZnO catalyst coated inside a 0.86 m tube reactor at 30 °C and 70 °C. Reaction conditions: 100 μL min−1 solvent-free MBY and 10 mL min−1 (standard temperature and pressure, STP) H2 at ambient pressure.
Figure 8.
Deactivation of the 5 wt% Pd/ZnO catalyst coated inside a 0.86 m tube reactor at 30 °C and 70 °C. Reaction conditions: 100 μL min−1 solvent-free MBY and 10 mL min−1 (standard temperature and pressure, STP) H2 at ambient pressure.

Figure 9.
(a) The MBY conversion and (b) carbon balance as a function of reaction temperature obtained in a 80 cm reactor coated with a 5 wt% Pd/ZnO catalyst. Reaction conditions: solvent-free MBY flow rate of 4 mL min−1, H2 flow rate of 1 L min−1 and the outlet pressure of 15 bar.
Figure 9.
(a) The MBY conversion and (b) carbon balance as a function of reaction temperature obtained in a 80 cm reactor coated with a 5 wt% Pd/ZnO catalyst. Reaction conditions: solvent-free MBY flow rate of 4 mL min−1, H2 flow rate of 1 L min−1 and the outlet pressure of 15 bar.

Figure 10.
Scheme of the experimental set-up used for testing catalyst-coated tubes.

Figure 11.
Photograph of the hydrogenation reactor system used in the current study.

© 2017 by the authors. Licensee MDPI, Basel, Switzerland. This article is an open access article distributed under the terms and conditions of the Creative Commons Attribution (CC BY) license (http://creativecommons.org/licenses/by/4.0/).
Share and Cite
MDPI and ACS Style
Cherkasov, N.; Bai, Y.; Rebrov, E. Process Intensification of Alkynol Semihydrogenation in a Tube Reactor Coated with a Pd/ZnO Catalyst. Catalysts 2017, 7, 358. https://doi.org/10.3390/catal7120358
AMA Style
Cherkasov N, Bai Y, Rebrov E. Process Intensification of Alkynol Semihydrogenation in a Tube Reactor Coated with a Pd/ZnO Catalyst. Catalysts. 2017; 7(12):358. https://doi.org/10.3390/catal7120358
Chicago/Turabian StyleCherkasov, Nikolay, Yang Bai, and Evgeny Rebrov. 2017. "Process Intensification of Alkynol Semihydrogenation in a Tube Reactor Coated with a Pd/ZnO Catalyst" Catalysts 7, no. 12: 358. https://doi.org/10.3390/catal7120358
Note that from the first issue of 2016, this journal uses article numbers instead of page numbers. See further details here.