Removal of NOX Using Hydrogen Peroxide Vapor over Fe/TiO2 Catalysts and an Absorption Technique


1
Key Laboratory of Thermo-Fluid Science and Engineering of MOE, School of Energy and Power Engineering, Xi’an Jiaotong University, Xi’an 710049, China
2
National Engineering Laboratory for Biomass Power Generation Equipment, North China Electric Power University, Beijing 102206, China
*
Author to whom correspondence should be addressed.
Catalysts 2017, 7(12), 386; https://doi.org/10.3390/catal7120386
Submission received: 17 October 2017
/
Revised: 25 November 2017
/
Accepted: 5 December 2017
/
Published: 13 December 2017
(This article belongs to the Special Issue Catalytic Oxidation in Environmental Protection)
Abstract
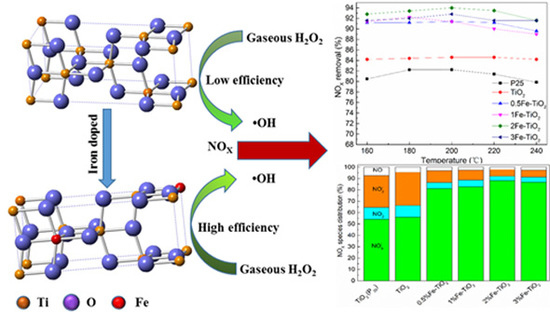
:In this study, we proposed an innovative oxidation–absorption method for low-temperature denitrification (160–240 °C), in which NO is initially catalytically oxidized by hydrogen peroxide (H2O2) vapor over titania-based catalysts, and the oxidation products are then absorbed by NaOH solution. The effects of flue gas temperature, molar H2O2/NO ratio, gas hourly space velocity (GHSV), and Fe substitution amounts of Fe/TiO2 catalysts on the denitrification efficiency were investigated by a well-designed experiment. The results indicated that the Fe/TiO2 catalyst exhibited a combination of remarkable activity and deep oxidation ability (NO converted into harmless NO3−). In order to comprehend the functional mechanism of the Fe dopant’s local environment in TiO2 support, the promotional effect of the calcination temperature of Fe/TiO2 on the denitration performance was also studied. A tentative synergetic mechanism could be interpreted from two aspects: (1) Fe3+ as a substitute of Ti4+, leading to the formation of enriched oxygen vacancies at the surface, could significantly improve the adsorption efficiency of •OH; (2) the isolated surface Fe ion holds a strong adsorption affinity for NO, such that the adsorbed NO could be easily oxidized by the pre-formed •OH. This process offers a promising alternative for current denitrification technology.
1. Introduction
Increasingly serious environmental pollution has brought with it a significant threat to human survival and the ecological system, wherein the discharge of atmospheric pollutants, which mainly include nitric oxide (NOX), has become the main phenomenon responsible for acid deposition, photochemical smog, and respiratory disease in mankind.
Conventional strategies for NOX control are mainly categorized into three groups: pre-combustion, combustion modification, and post-combustion technologies [1]. Since pre-combustion and combustion modification could not meet the strict new emissions regulations, they are often adopted as an adjunctive way to control NOX. The post-combustion technologies, which mainly include the selective catalytic reduction method (SCR), the selective non-catalytic reduction method (SNCR), electron-beam, and absorption, are the primary methods for NOX elimination. As the most common way to control NOX, SCR is capable of achieving a high level of NOX removal efficiency: up to 85% [2]. Nevertheless, this process suffers from problems, such as a high and narrow operating temperature window (300–400 °C), NH3 slip, and the poisoning of the catalyst [3]. Other deNOx methods suffer from the defects of requiring a high amount of investment capital or having a low efficiency. Therefore, a cost-effective and environmentally friendly strategy for reducing NOX was overpoweringly needed. Fortunately, advanced oxidation technology seems to be a promising approach and has drawn much attention recently. The ultraviolet (UV)/H2O2 advanced oxidation process is a typical method for purifying flue gas and can achieve a relatively high NO oxidation efficiency [4,5]. However, this breakthrough technique was found to be hard to realize for a real scale application due to a high operating cost and unfeasibility for implementation. The catalytic decomposition of gas-phase H2O2 into •OH seemed to be an appealing alternative due to its mild reaction conditions and environment-friendly advantage. Ding and his colleague had attempted to produce a series of iron-based catalysts for the catalytic decomposition of H2O2 and achieved an ~80% NOX removal efficiency [6,7,8]. Nonetheless, the method is stoichiometrically limited by hydrogen peroxide (H2O2/NO molar ratio = 450~800:1), and consequently it is difficult to use for widespread application. Recently, Zhao et al. adopted nanoscale zerovalent iron to activate vaporized H2O2 for removing NO, and the NO removal efficiency was 80.4% at the price of a low H2O2 dosage (H2O2/NO molar ratio = 10~30:1) [9]. Moreover, Wu further decreased the H2O2/NO molar ratio to 4~16:1 by employing the solid-phase Fe2(SO4)3 and La1−xCaxFeO3 oxides as the catalysts [10,11]. However, they focused more attention on the removal efficiency of NO, irrespective of the potential intermediates and their individual hazards. In this regard, the undesired intermediate products (NO2 and NO2−), which are recognized to be more detrimental than NO, were usually ignored as DeNOX indexes to evaluate the performance of NOx abatement.
TiO2 is considered to be an ideal catalyst for the removal of air pollutants—including NOX—due to its excellent chemical stability, low cost, and nontoxicity toward both humans and the environment [12]. Recent studies have proven that H2O2 can act both as an oxidant and as a reductant via a redox path of Ti3+/Ti4+ when the decomposition reaction of a H2O2 molecule over a TiO2 surface occurs [13]. It should be noted that defective surface sites, especially for the oxygen vacancies, play a significant role in the decomposition of H2O2 [14]. However, the limited quantity of oxygen vacancies on a pure TiO2 surface retards its capacity for the generation of •OH by activating H2O2. The doping of hetero-valence ions in the host lattice seems to be a good choice to resolve this problem.
In this paper, a series of Fe/TiO2 catalysts has been synthesized by a conventional co-precipitation method and applied in the catalytic decomposition of H2O2 for treating NOX. The possible intermediate products and their individual hazards in the nitric oxide oxidation process were comprehensively considered to evaluate the catalytic performance of the catalysts. Remarkably, the prepared material achieved a combination of high NOx removal efficiency and deep oxidation ability.
2. Results and Discussion
2.1. Effects of Molar H2O2/NO and Temperature
The effect of molar H2O2/NO with temperature on denitration was studied experimentally as shown in Figure 1a–c. Blank tests were also performed using various H2O2 solutions without catalyst (Figure S1). The tests showed that at 160–240 °C the highest NOX removal efficiency under different H2O2/NO ratios was less than 25%. The significant increase of NO oxidation efficiency in the presence of catalyst could be attributed to the activated species produced from catalytic decomposition of H2O2 vapor. The catalytic mechanism of a H2O2 molecule over TiO2 is analogous to the Fenton-type mechanism, and the reaction pathways can be described by the following equations [13,15]:
As observed in Figure 1a, for the molar H2O2/NO range from 8 to 24, the NO oxidation efficiency displayed an increasing and then a decreasing tendency with an increase in reaction temperature. The optimum NO oxidation efficiency reached at 200 °C. In contrast, the NO oxidation values for the molar H2O2/NO of 48 varied slightly with temperature and maintained a higher level than the others. NO2 selectivity (Figure 1b) was positively associated with the temperature, and the growth of NO2 at a high-temperature segment could be due to the decomposition of formed nitrates [16]. As a consequence, the total amount of NOX removal (Figure 1c) for the molar H2O2/NO range from 8 to 24 achieved a highest value at 200 °C, and showed a moderating trend along with the temperature for the molar H2O2/NO of 48. It is worth noting that the efficiency values of NO oxidation increased with an increase in the molar H2O2/NO, while the NO2 selectivity firstly increased as the molar H2O2/NO rose from 8 to 24 and then declined with a further increase of molar H2O2/NO. This phenomenon could be interpreted in two respects: (1) the increase of molar H2O2/NO implied that more H2O2 molecules participated in the reaction with NO; however, the weak oxidative capacity of H2O2 molecules could not implement a completed oxidation process of NO [17,18]; and (2) the weakening of the concentration effect for the molar H2O2/NO of 48 was mainly ascribed to the quenching of •OH; i.e., •OH radicals were depleted in the side-reaction and H2O2 was also a radical scavenger in addition to the source of •OH (Equations (3)–(6)) [19,20]. Meanwhile, the molar percentage of NO3− increased from 36.8% to 62.1% as the molar H2O2/NO rose from 8 to 24, and then dropped to 58.7% with a further increase of molar H2O2/NO (Figure 1d). This trend strengthened the abovementioned analysis.
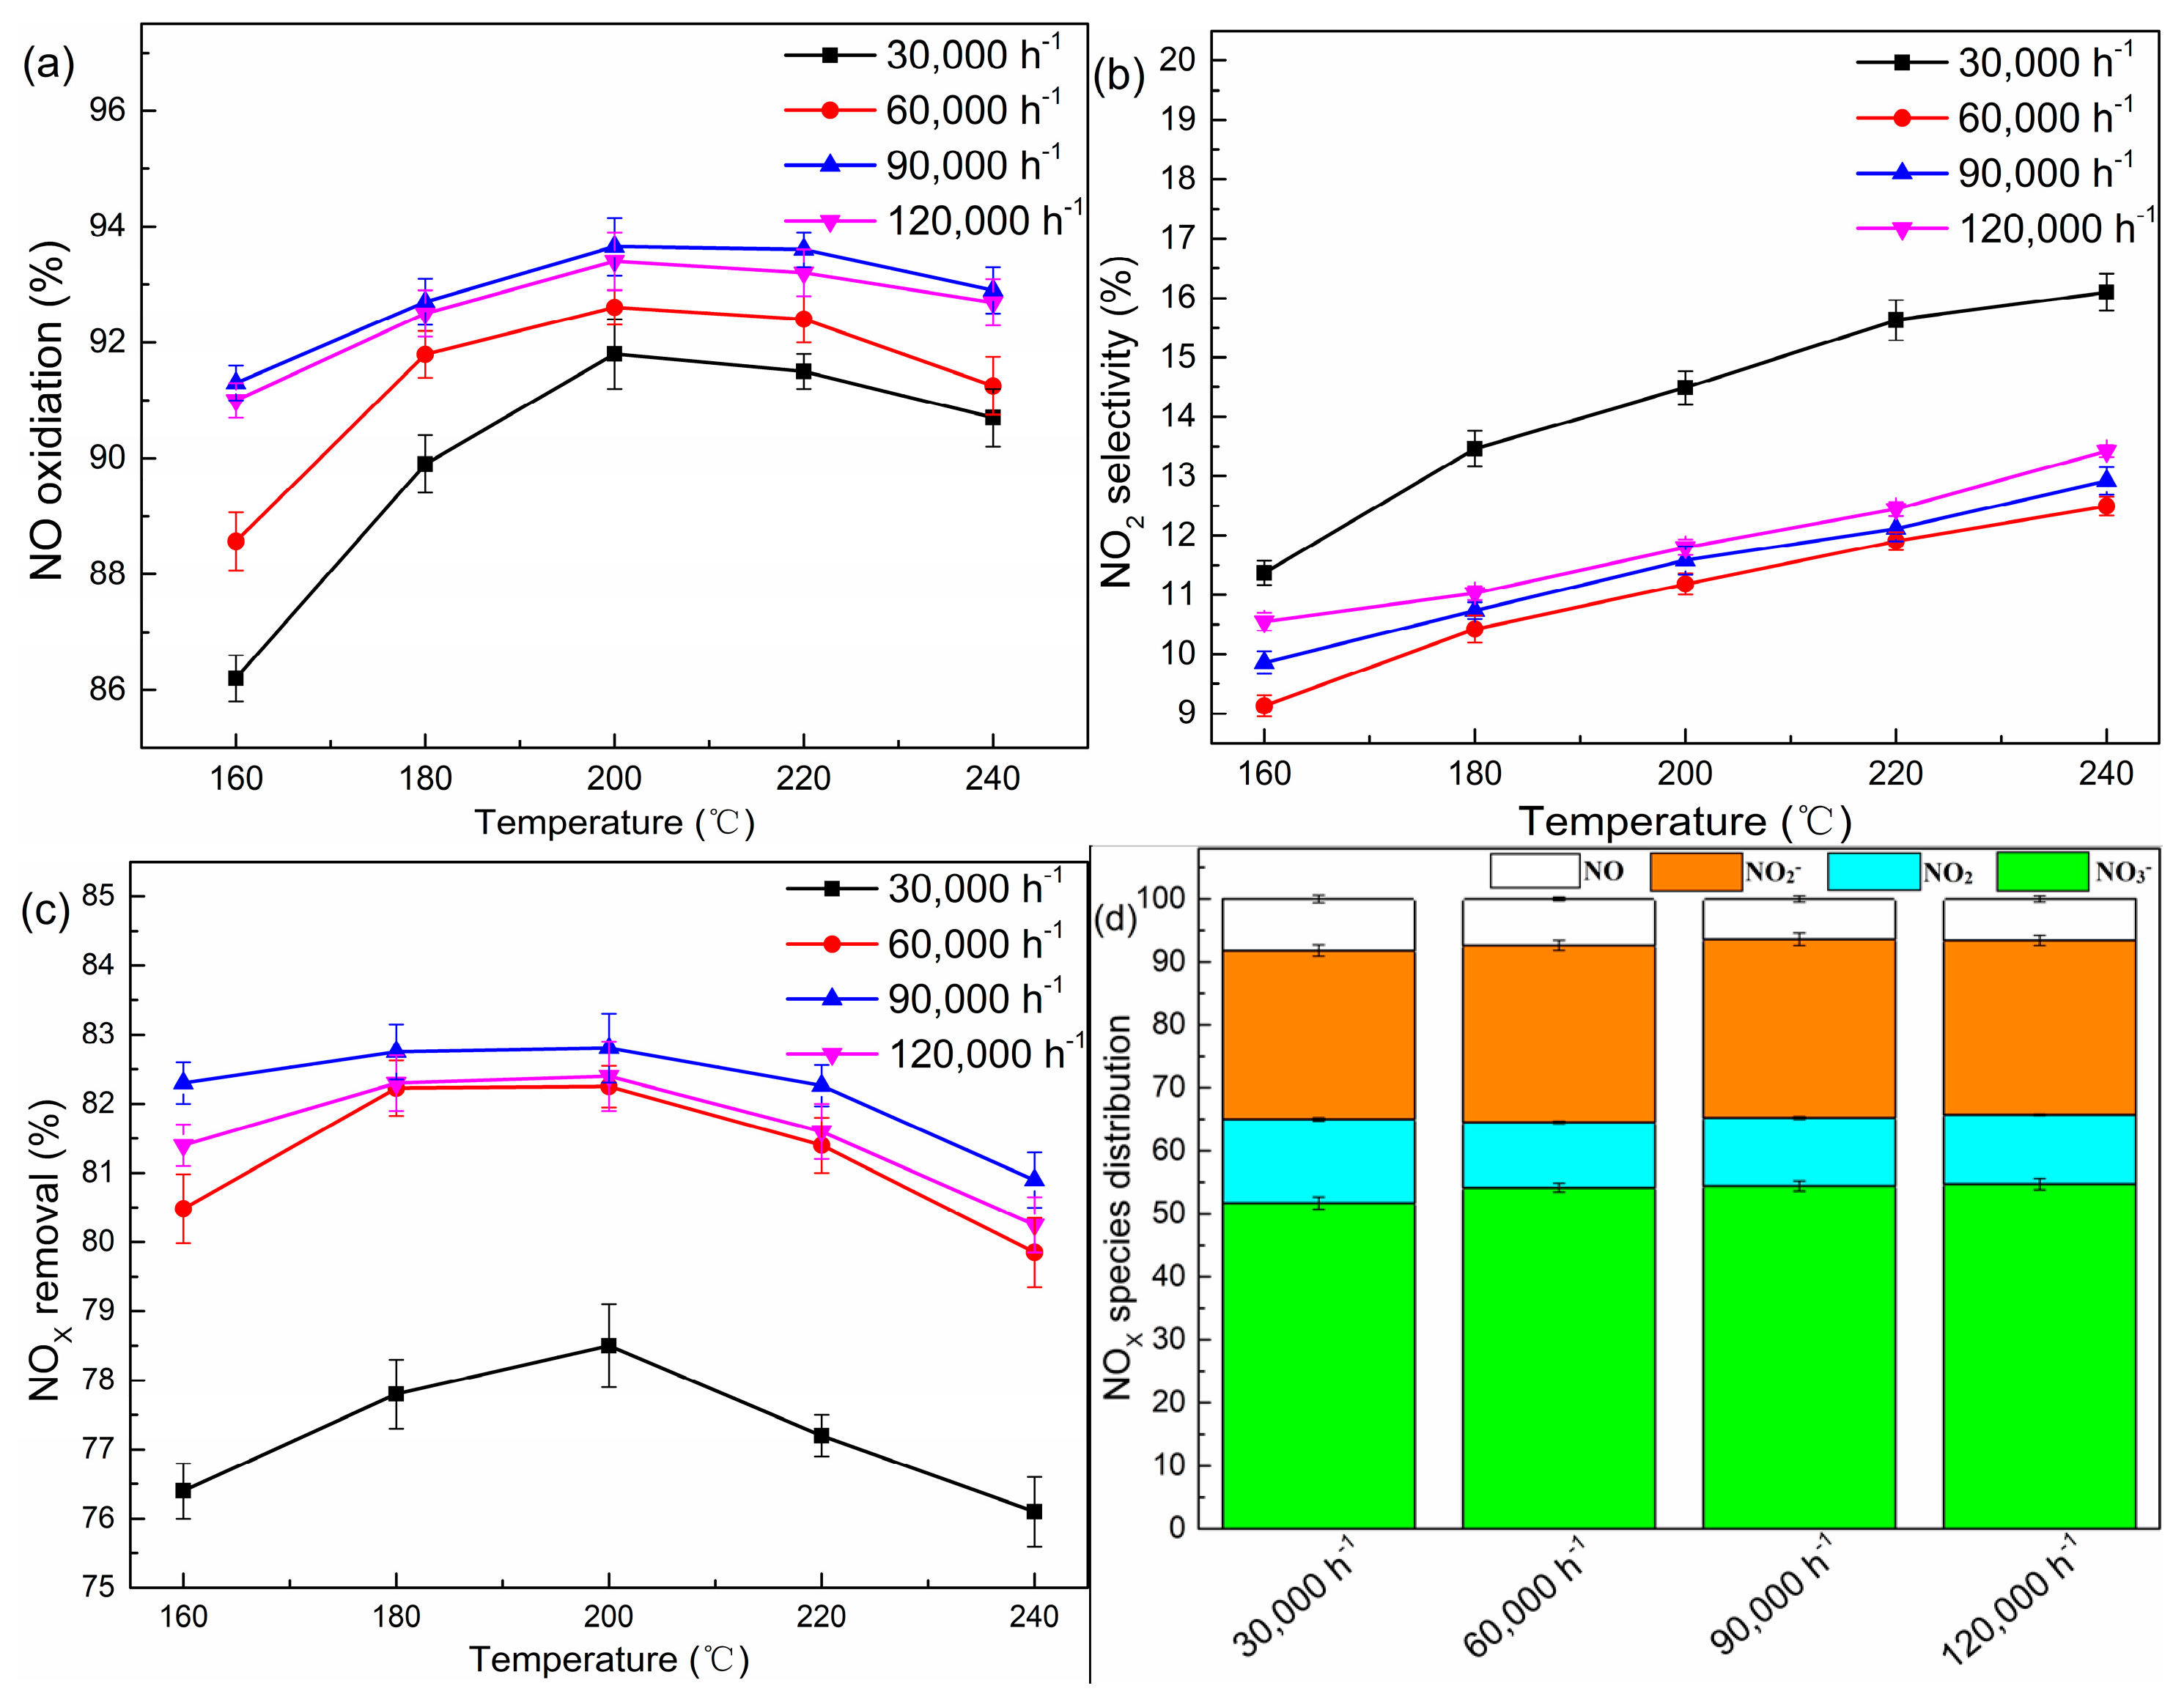
2.2. Effects of the Gas Hourly Space Velocity (GHSV)
A series of experiments with different GHSV were conducted. As shown in Figure 2a–c, the performance of denitration strongly depended on the space velocity. A higher GHSV (>60,000 h−1) displayed a NOX removal efficiency of more than 80% in the temperature range from 160 °C to 240 °C. As demonstrated by Li et al. [21], H2O2 could easily be adsorbed by the TiO2 surface and give rise to surface complexes, and further be converted into •OH, which is highly reactive and interacts with NO rapidly. Theoretically, the NOX removal efficiency should increase with a decline of GHSV from 60,000 h−1 to 30,000 h−1. However, the observed results showed a contrary tendency. This phenomenon could be interpreted such that the surface nitrate would decompose into NO2 on the TiO2 surface when the catalyst dosage was excessive [22]. In the meanwhile, the Ti3+ species generated in the redox process might have reacted with NO2 (Equation (7)), thus facilitating the generation of NO [10,23].
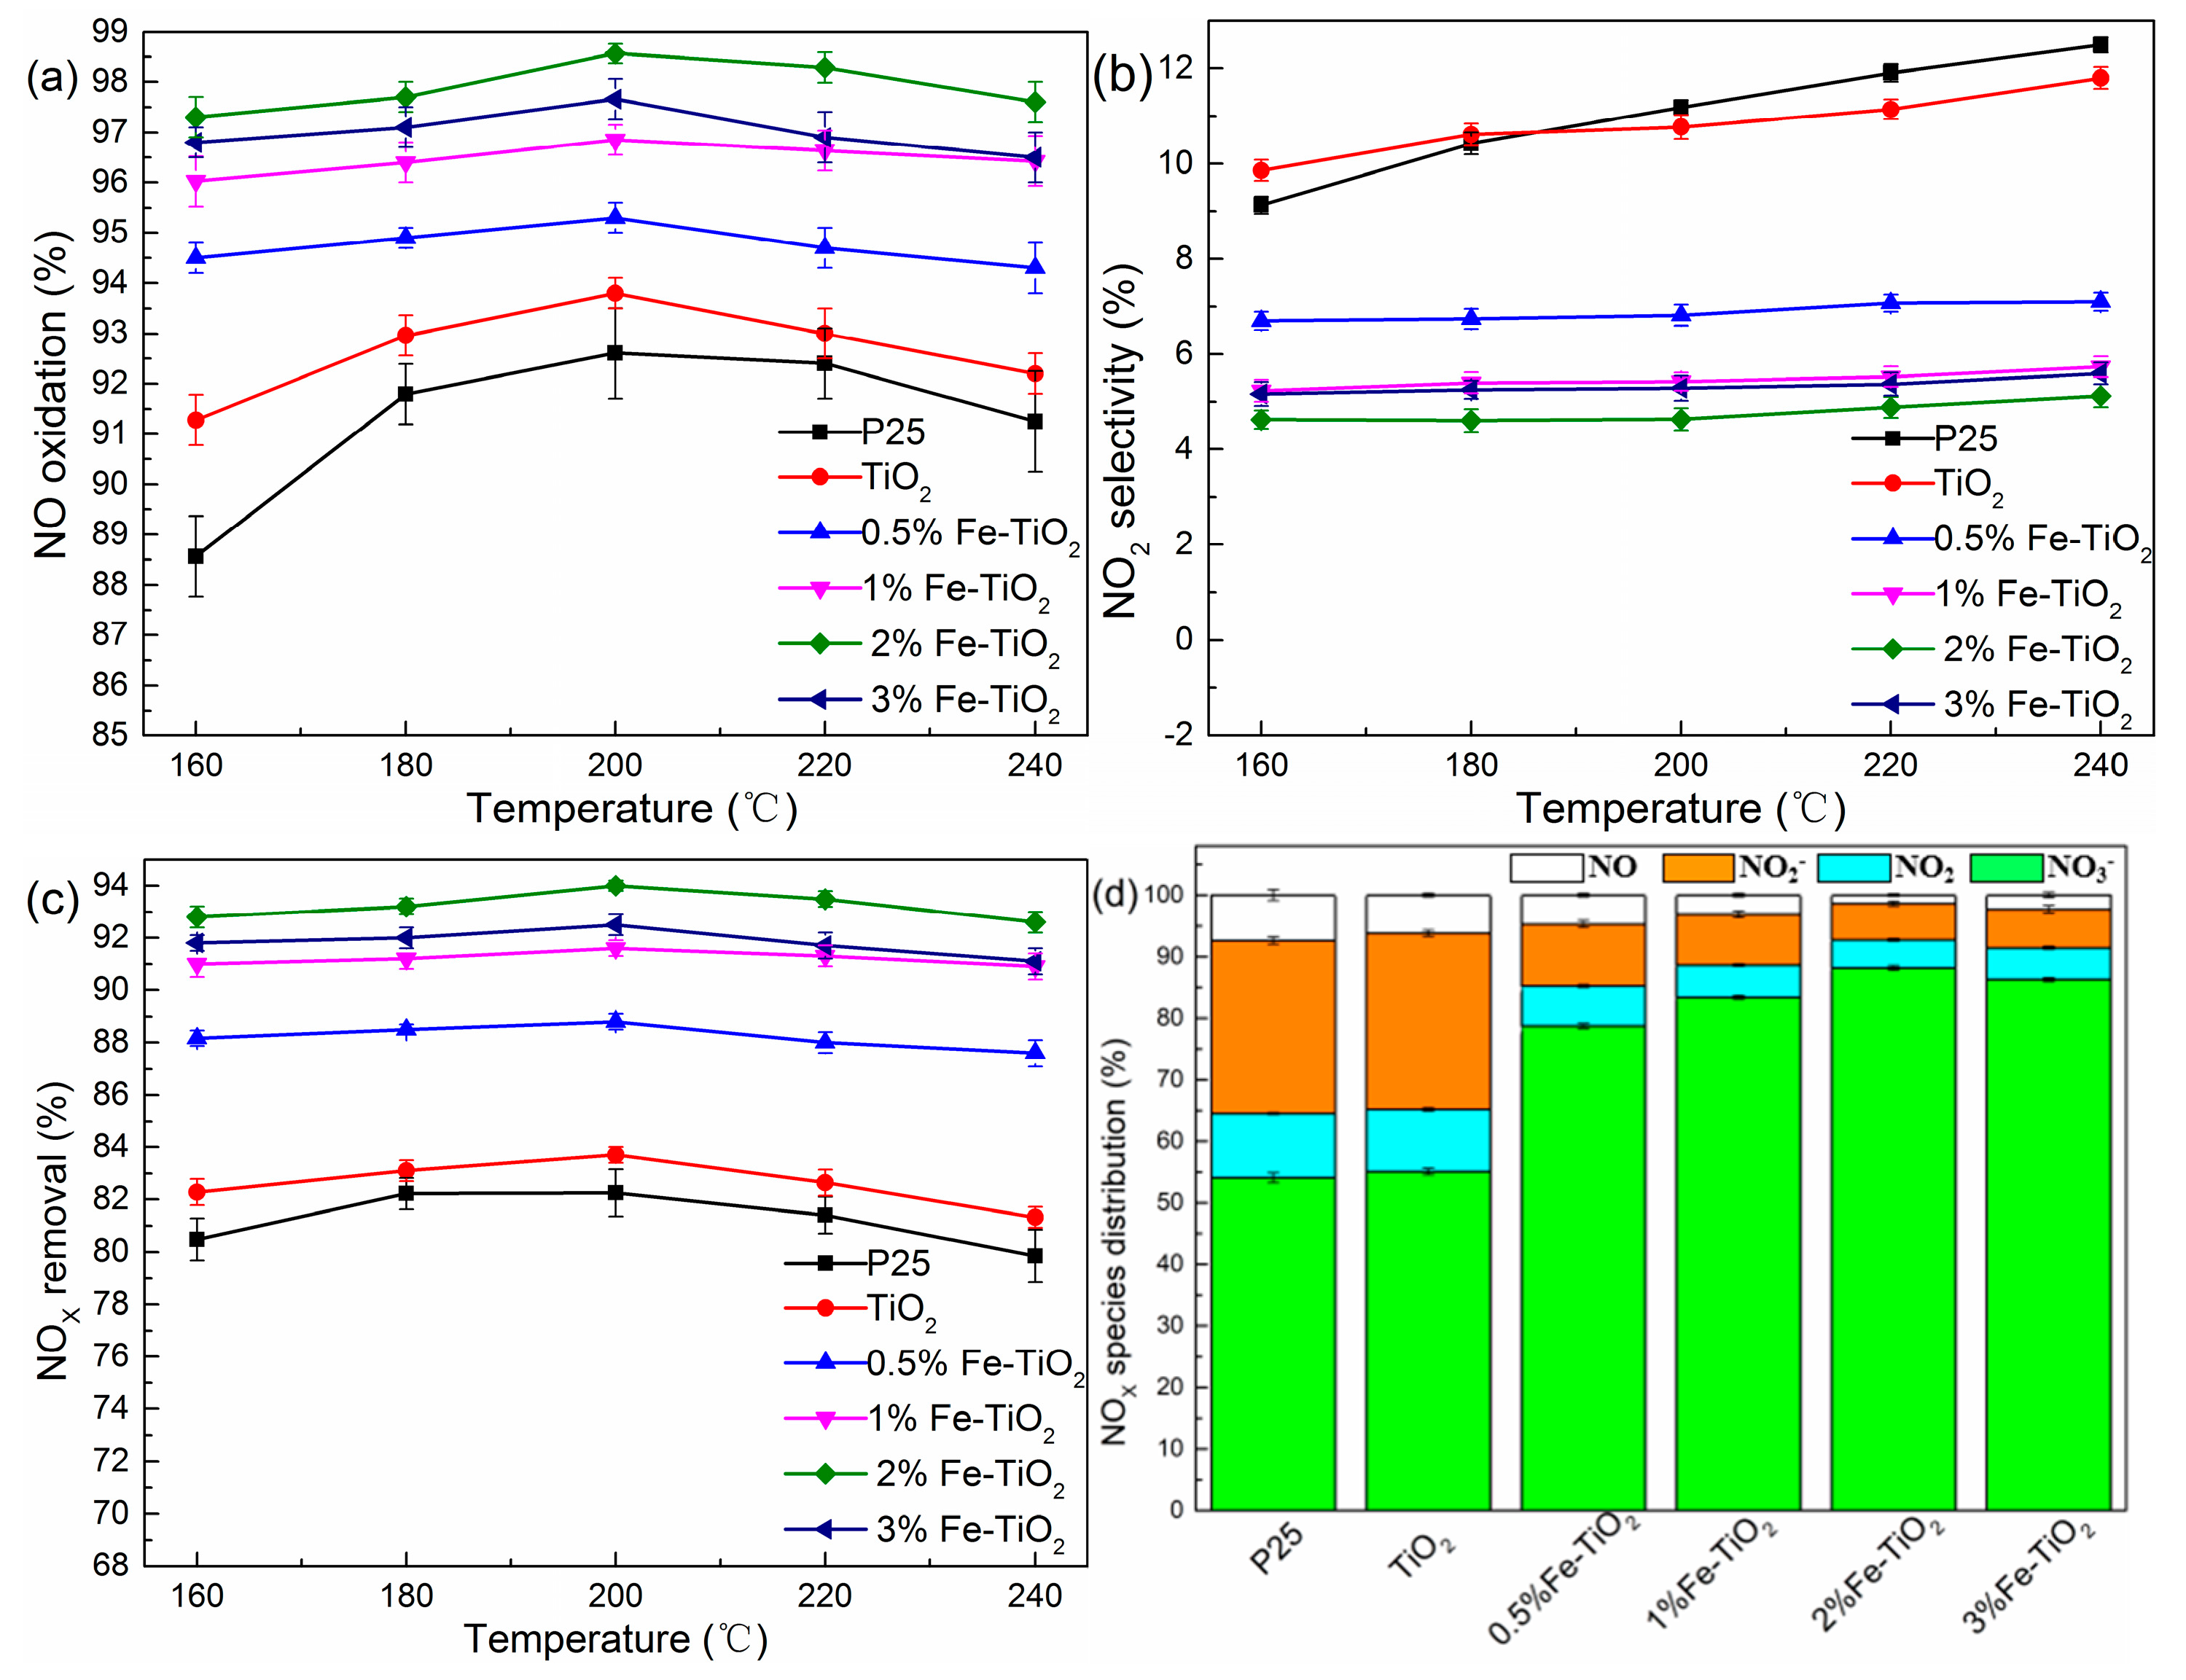
2.3. Effects of Catalyst Type
To investigate the effect of TiO2 from different sources and Fe substitution amounts on the removal efficiency of NOX, a series of experiments with different catalyst types were performed. As depicted in Figure 3a–c, TiO2 exhibited a higher NO oxidation efficiency compared with P25, while both gave a ~10% NO2 selectivity. With the introduction of an iron ion, the NO oxidation efficiency increased slightly while NO2 selectivity declined at the same time. This trend led to a significant increase in the total NOX removal efficiency, especially for the 2% Fe-TiO2, which was up to 94%. We also selected the nitrogen species distribution at 200 °C to further confirm the positive effect of the iron ion. As illustrated in Figure 3d, the molar percentage of NO3− increased from 78.7% to 88.1% when the iron molar concentration increased from 0.5% to 2% and then dropped by 1.8% with a 3% Fe-TiO2. Moreover, the percentage of NO2− was significantly less than TiO2 without an iron ion. This strengthened the fact that the iron ion facilitated the deep oxidation ability which turned NO into NO3−.
2.4. Structural Properties of Catalyst
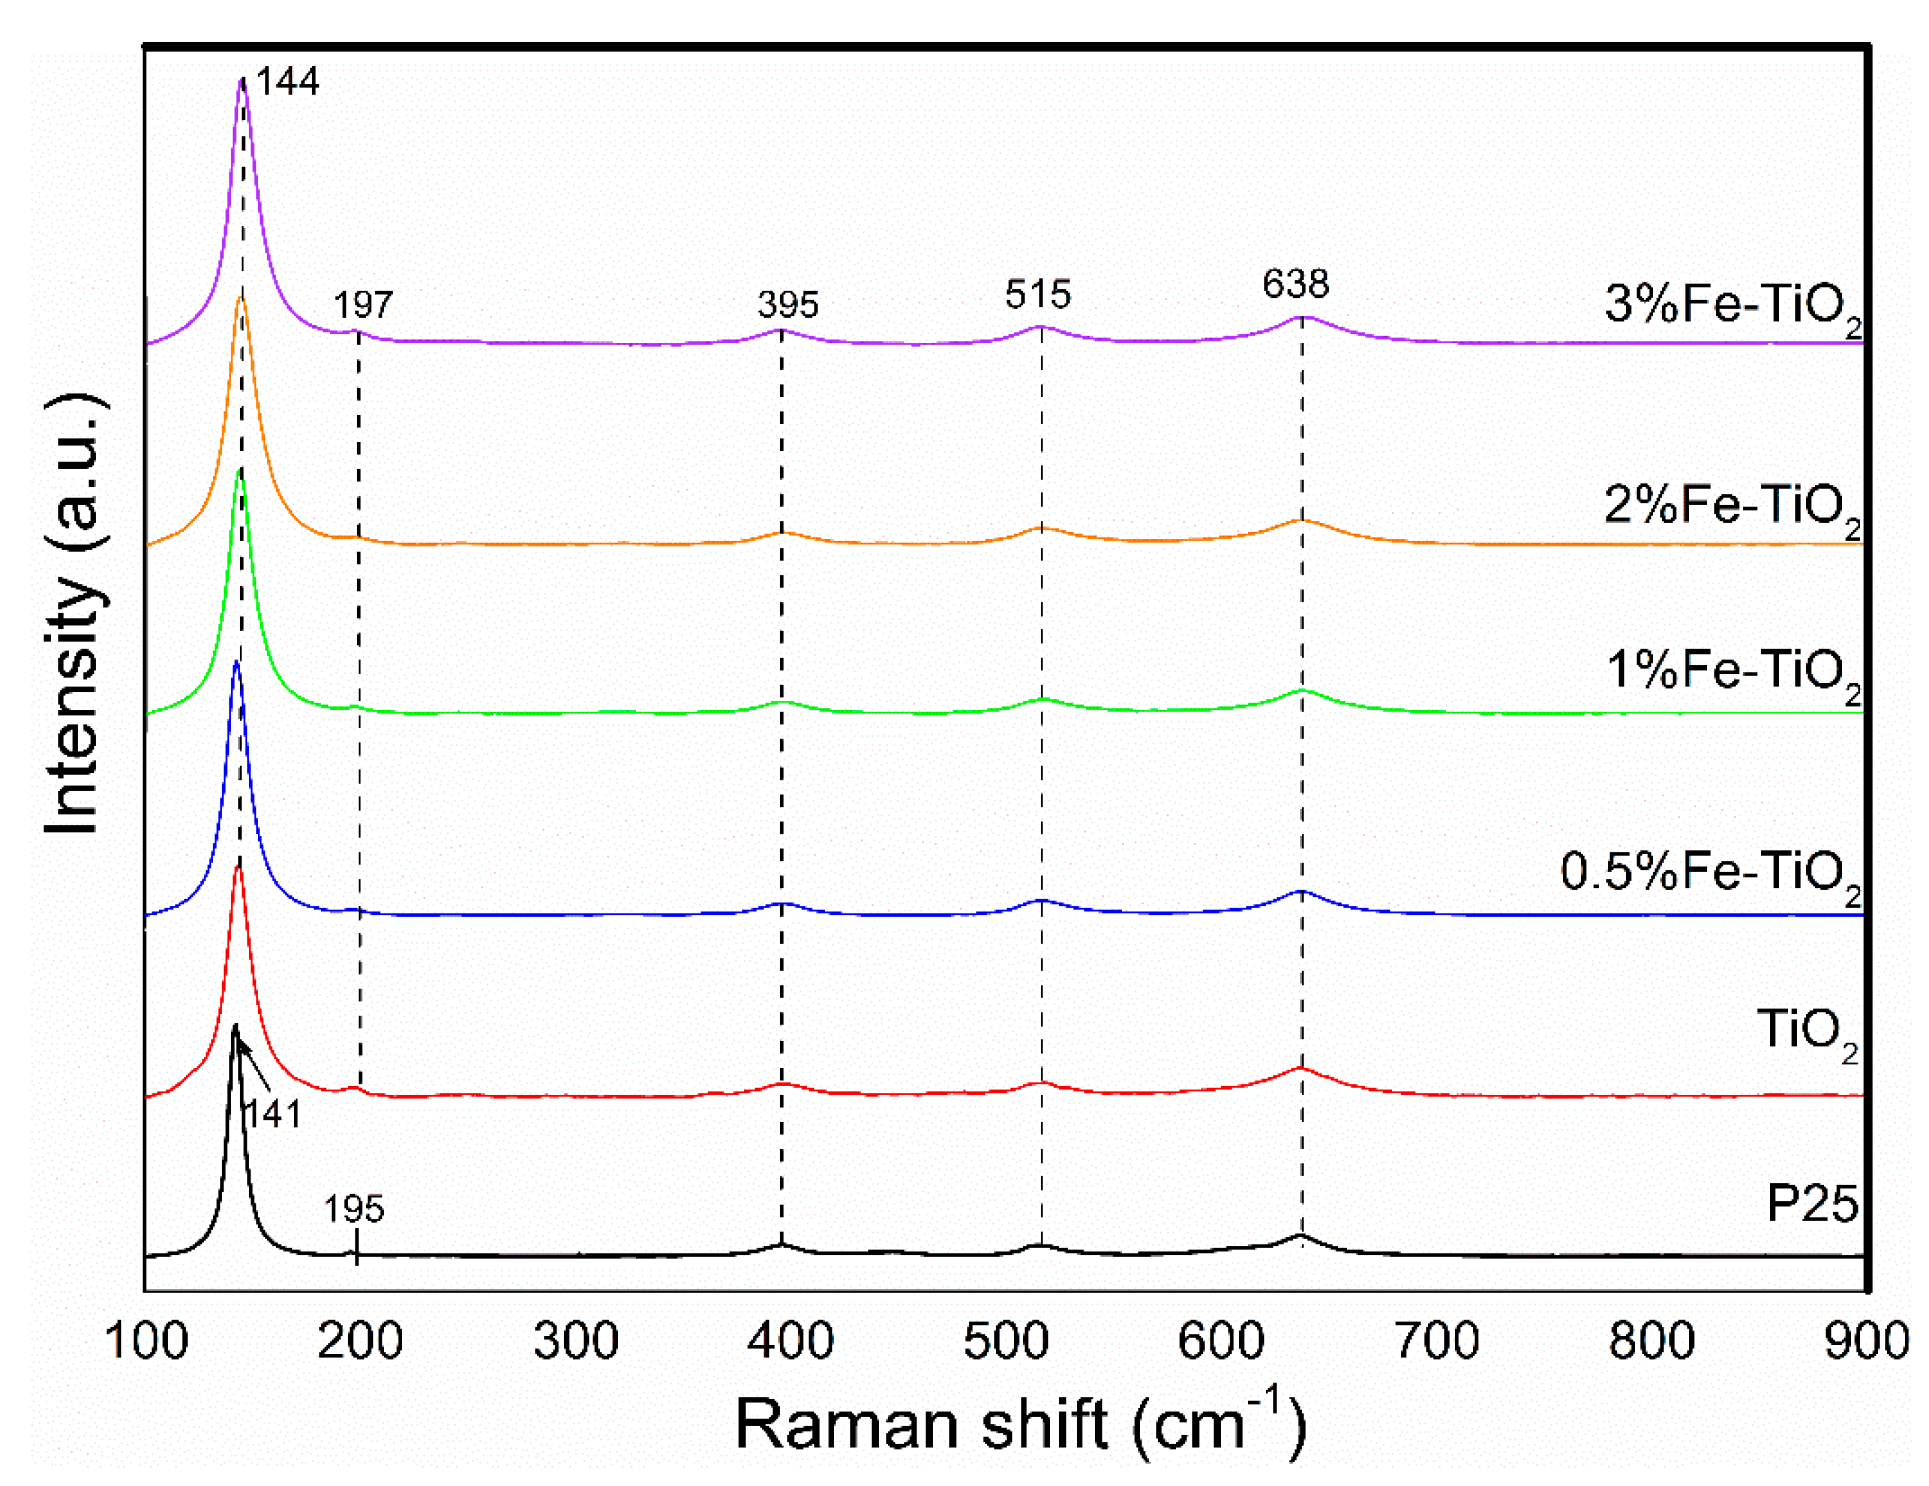
Figure 4 displays the Raman scattering spectra of the tested catalysts. The P25 and iron-doped titanium dioxides with different molar ratios (0%, 0.5%, 1%, 2%, and 3%) showed similar spectral characteristics. The observed peaks at 144 cm−1, 195 cm−1, 395 cm−1, 515 cm−1, and 638 cm−1 belong to the Raman active of TiO2 with symmetries of Eg(1), Eg(2), B1g(1), B1g(2), and Eg(3), respectively [24,25]. It should be mentioned that no Fe-relevant structures could be observed in the sample obtained above 400 °C, confirming that the Fe atom may substitute for the Ti atom and be highly dispersed in the lattice of TiO2.
The N2 adsorption–desorption isotherms of the samples and the Brunauer–Emmett–Teller (BET) value are presented in Figure S2 and Table 1. From Figure S2, all of the samples showed a typical IV-type pattern according to the Brunauer–Deming–Deming–Teller (BDDT) classification. The 3% Fe-TiO2 displayed hysteresis loops in the relative pressure of 0.4~0.8, which represented mesoporous materials (2–50 nm). Nevertheless, the other samples exhibited two capillary condensation steps, suggesting bimodal pore size distributions in the mesoporous and microporous regions [26]. The BET specific surface area of the P25 and pure TiO2 was 36.7 and 98.6 m2·g−1, respectively. It should be mentioned that a sharp decrease in surface area was observed when the doping content exceeded 1 mol %, which was possibly due to a solubility limit for Fe3+ ions in the crystal structure of anatase and the excess Fe3+ ion blocking the pore channel of TiO2 [27].
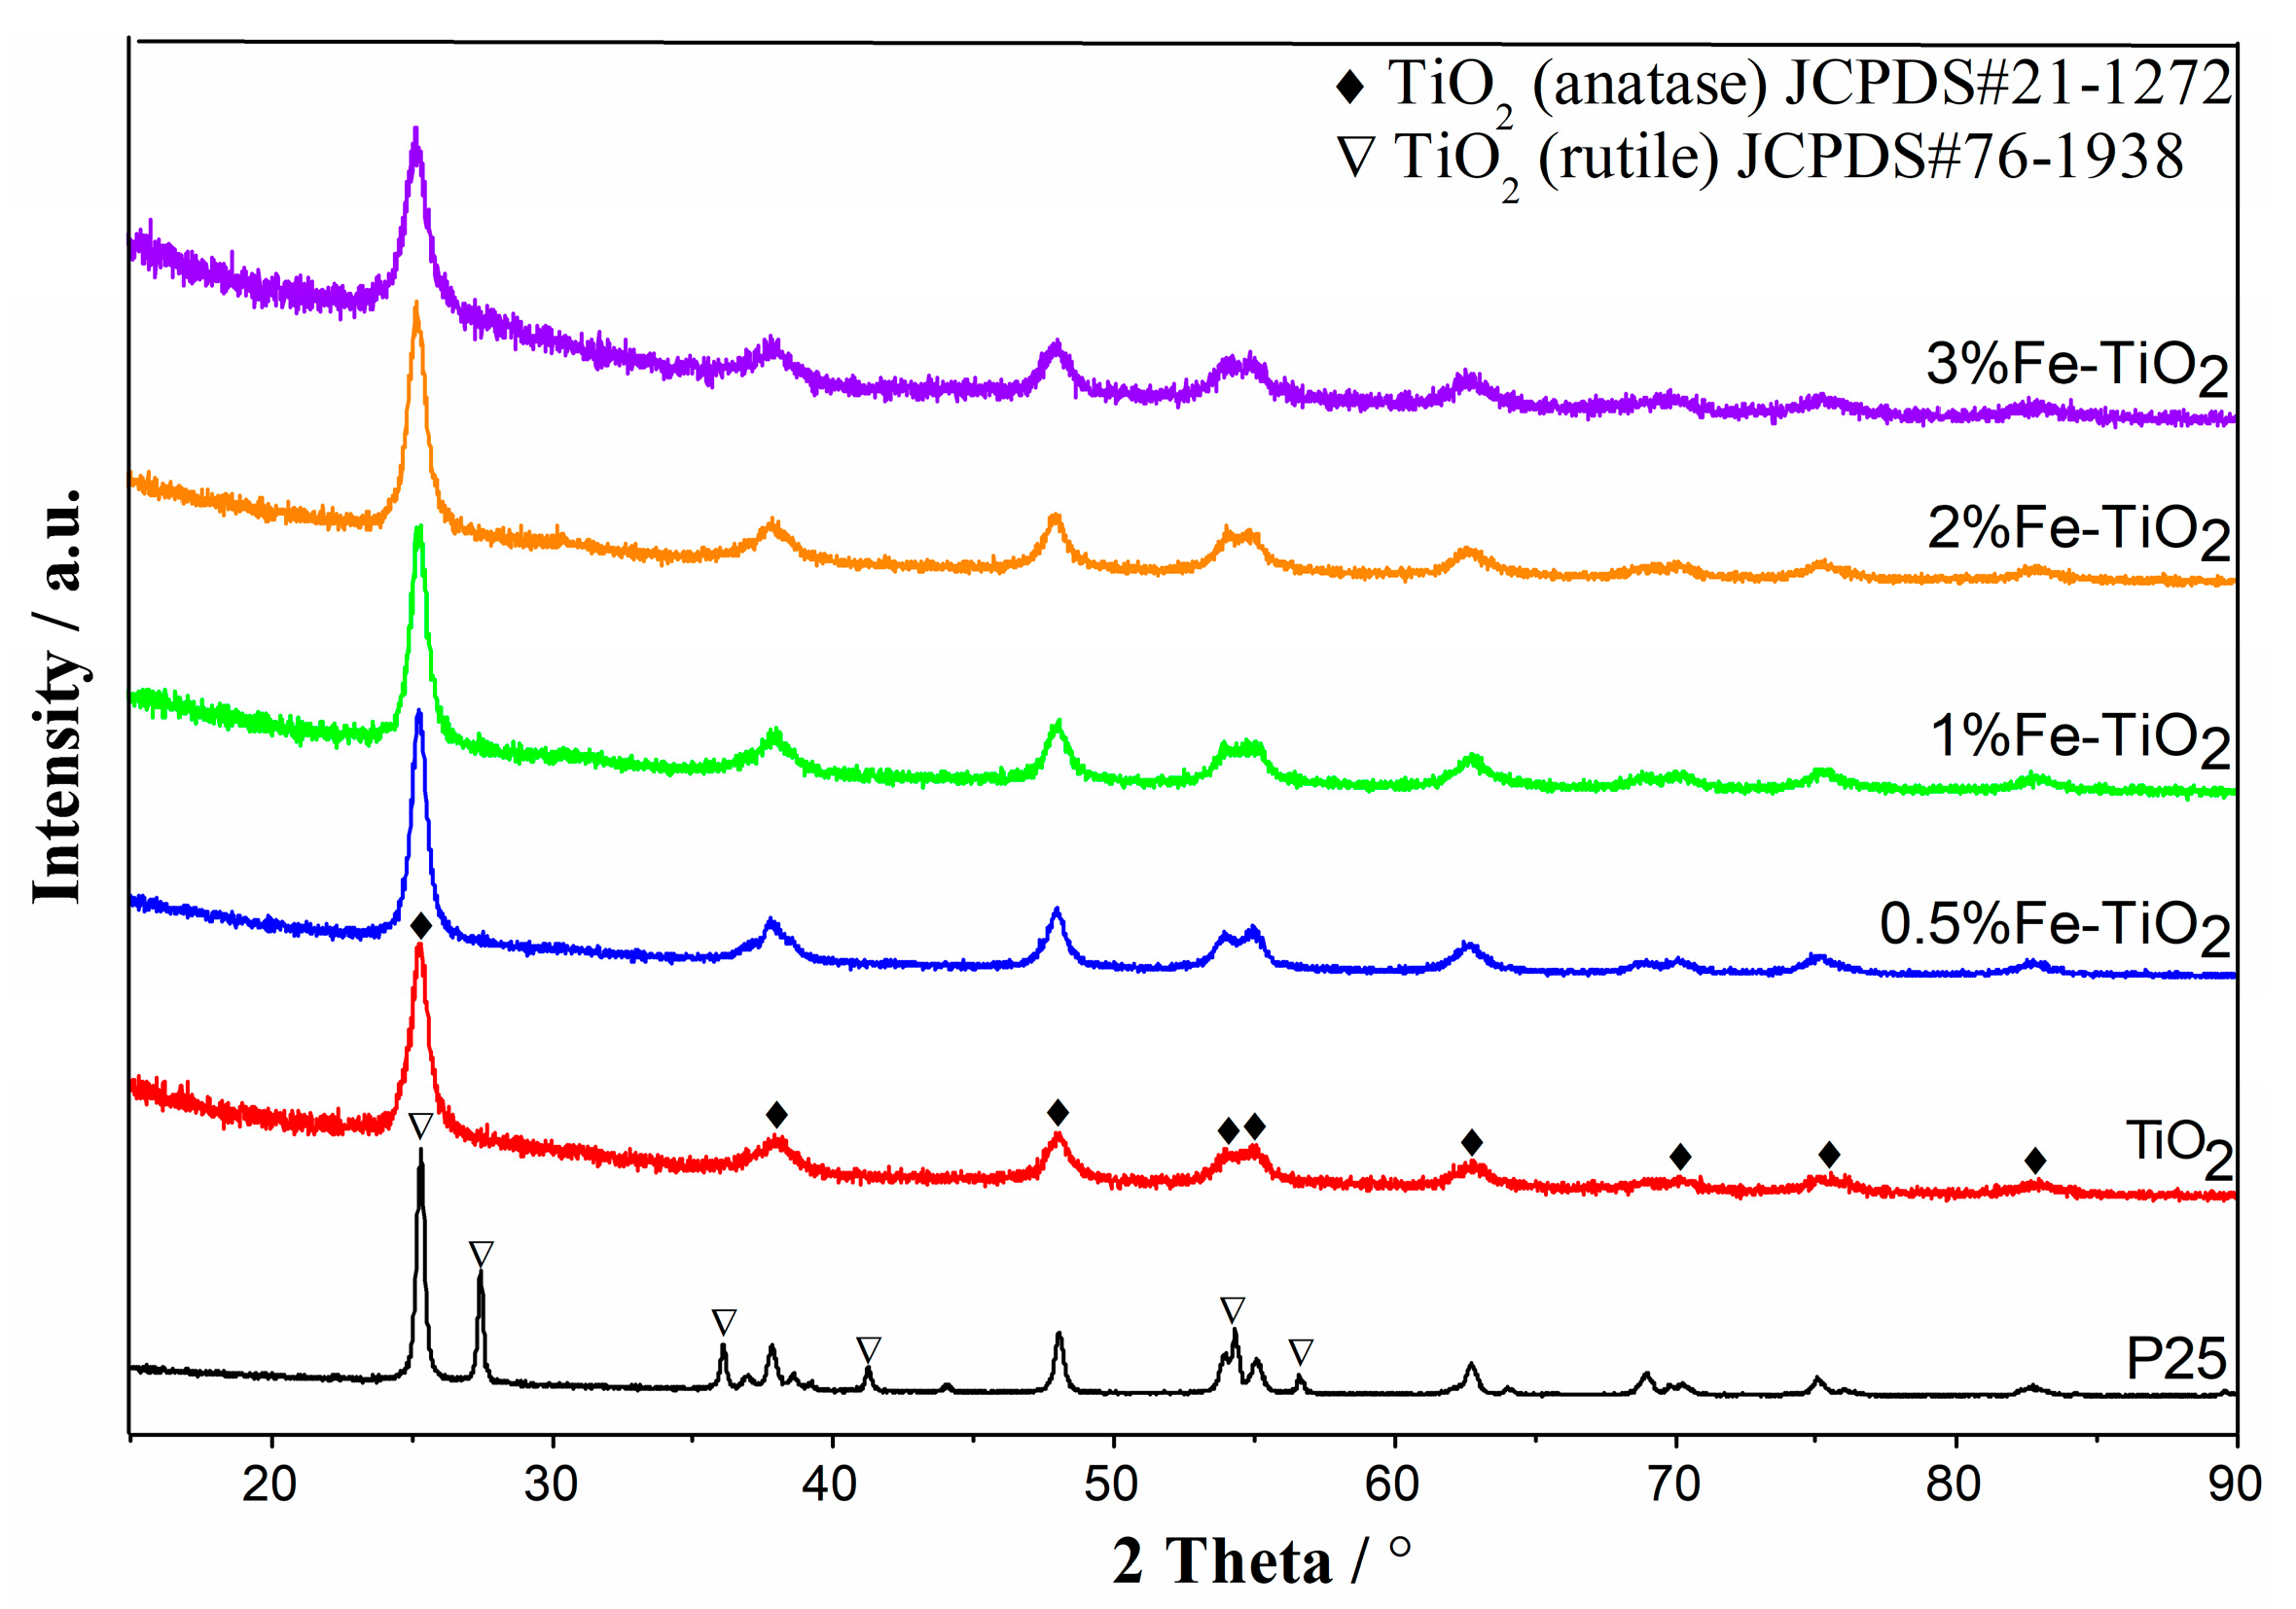
The XRD patterns of the tested catalysts are depicted in Figure 5. The P25 revealed a pattern characteristic of both a rutile and anatase phase, while the crystal structures of the doped and undoped samples prepared by the co-precipitation method were all anatase (JCPD S#21-1272). For the diffraction patterns of the Fe-doped TiO2 samples, all diffraction peaks were congruent with TiO2 and no peaks attributable to iron species could be observed in the investigated range. The possible reason was that the Fe atoms had successfully replaced Ti atoms and were incorporated into the crystal framework of the TiO2 lattice due to a similar ionic radius of Fe3+ (0.69 A) and Ti4+ (0.745 A) [28,29]. As presented in Table 1, iron species loading also impacted on the crystallite size of the samples significantly. The maximum crystallite size was found in the material with dopant concentrations of around 0.5 mol %. This phenomenon was in good agreement with the attainment, which suggested a solubility limit for Fe3+ ions in the anatase structure owing to lattice expansion that arises from compensating effects between the Fe3+ substitution of Ti4+ and oxygen vacancy formation for the maintenance of charge neutrality [30,31].
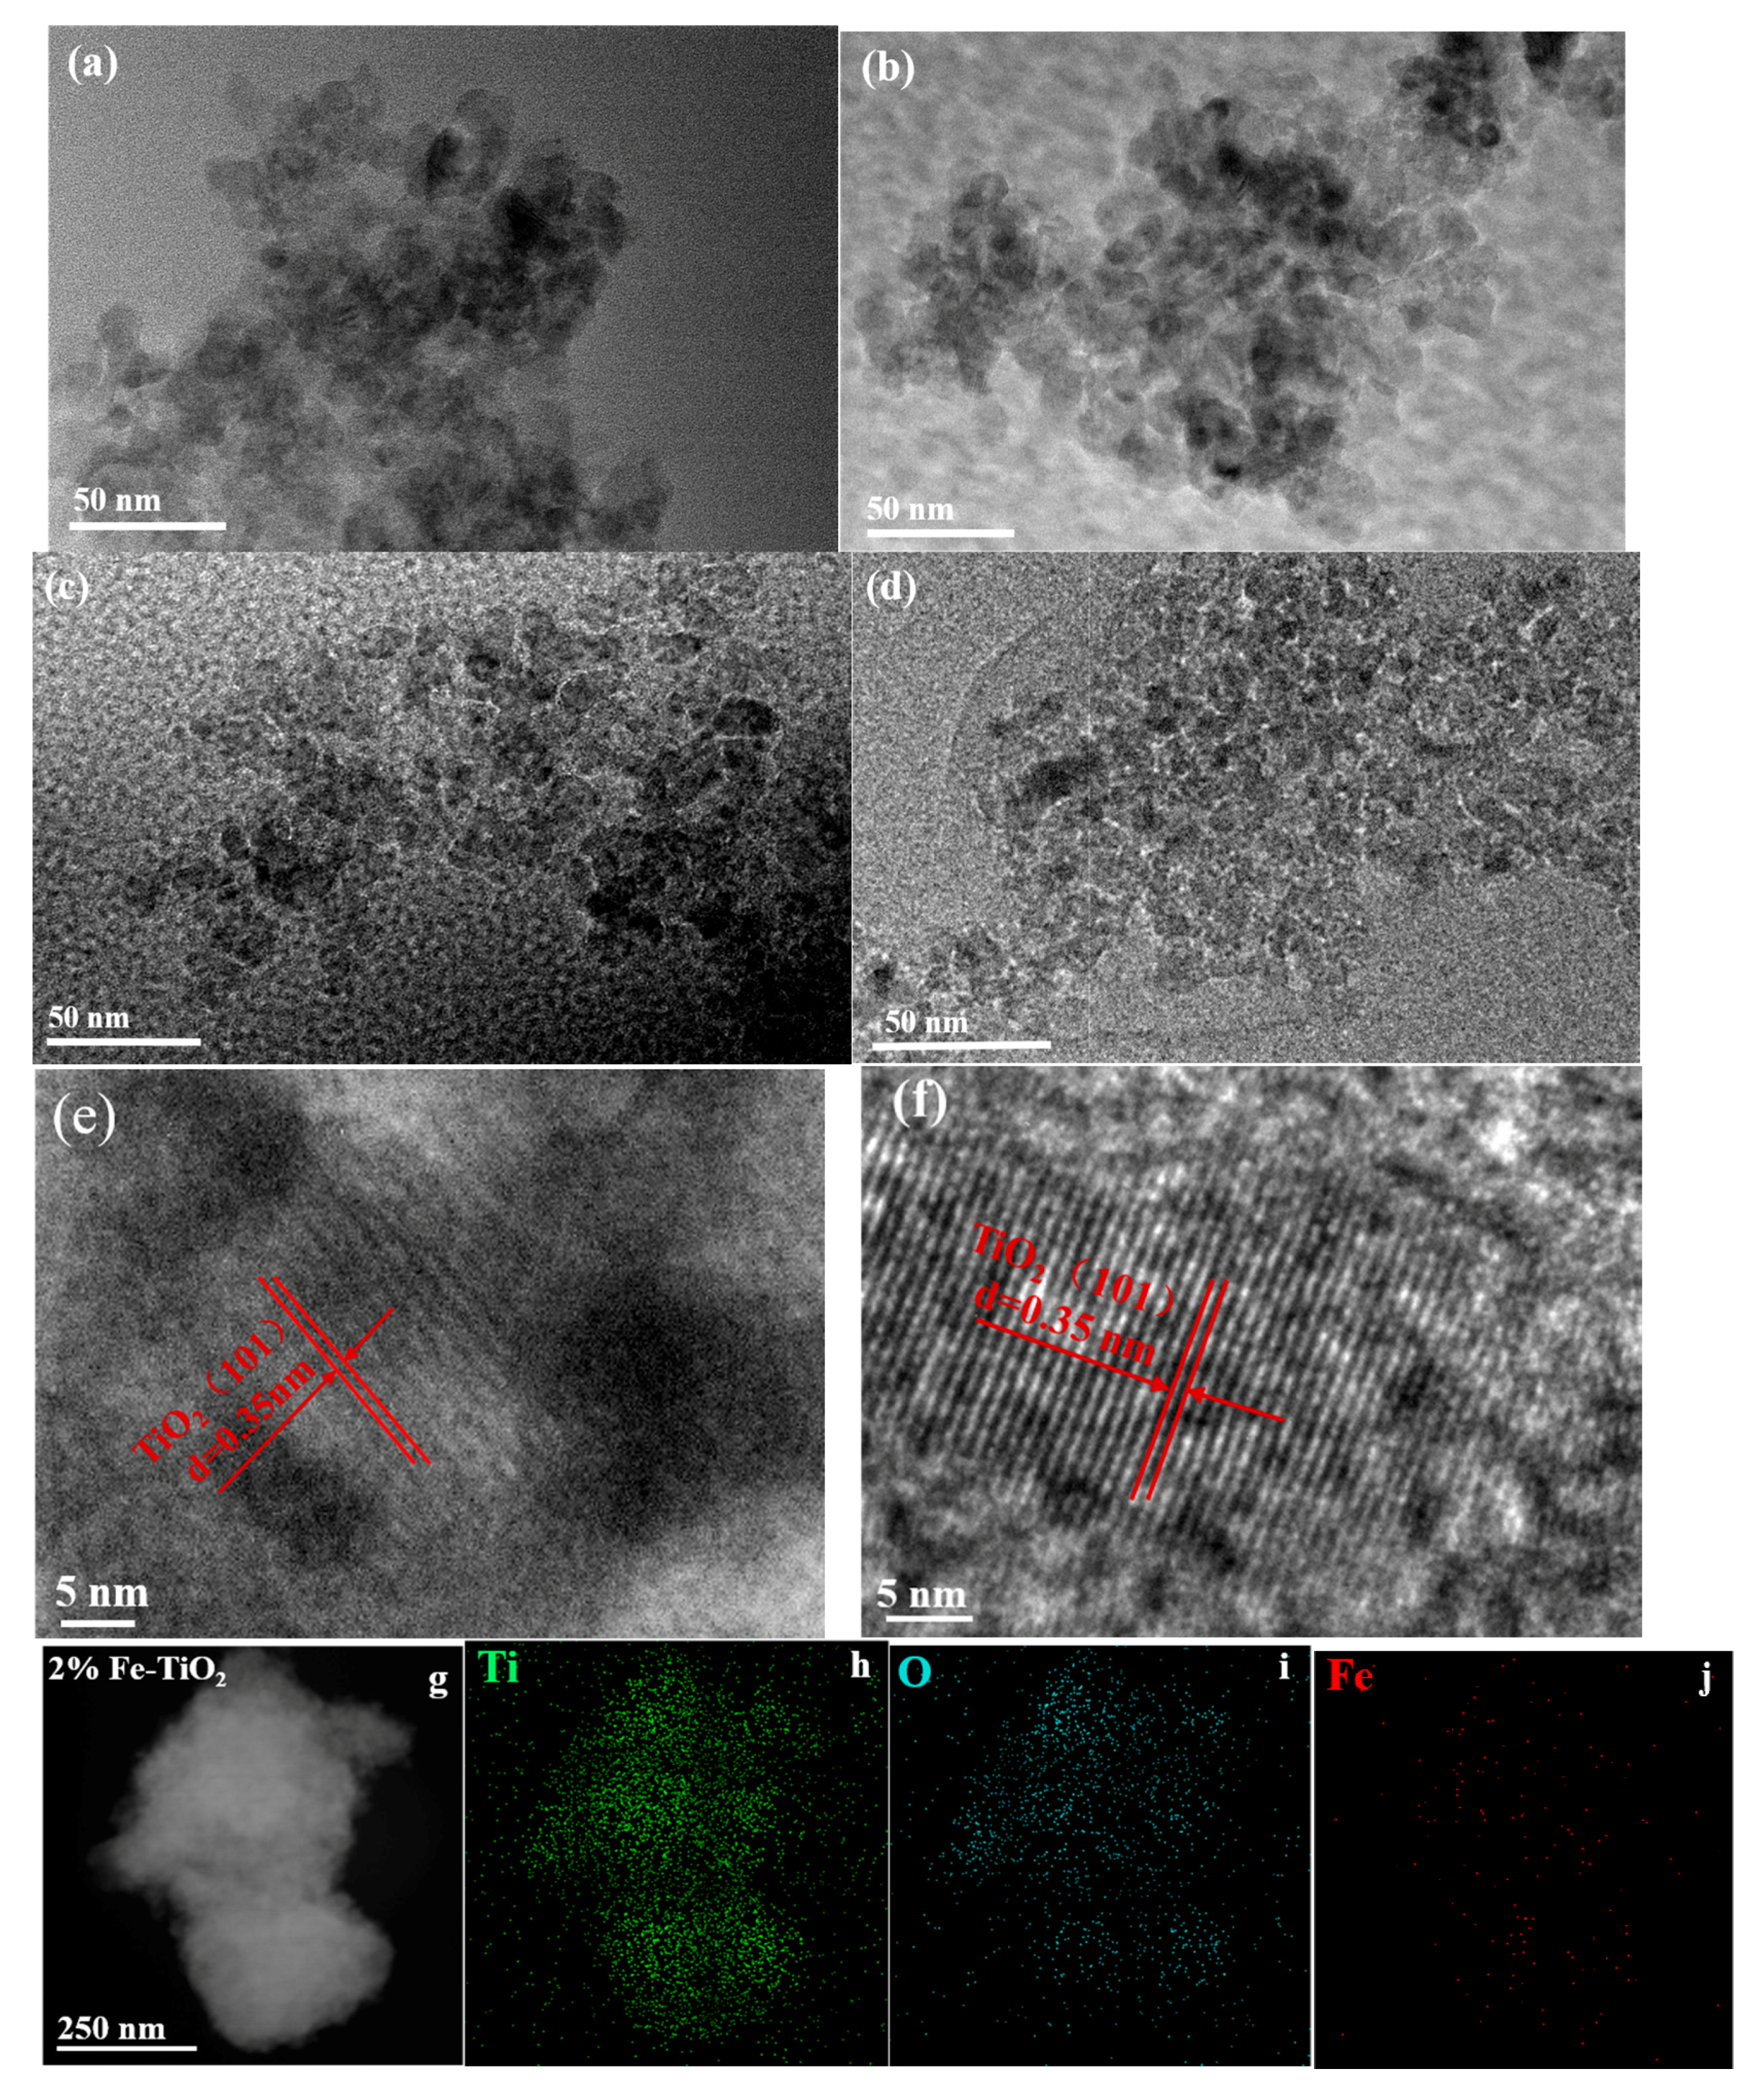
FE-SEM micrographs of undoped and doped TiO2 nanoparticles are shown in Figure S3. The average particle size of the P25 sample was significantly larger than the catalysts prepared by the co-precipitation method, and all samples revealed a fine and uniform spherical particulate structure. The morphology structures of the samples were characterized by TEM (transmission electron microscopy) and HRTEM (high resolution transmission electron microscopy). As shown in Figure 6a–d, a uniform isolated individual particle can be observed in the Fe-doped TiO2 samples. The HRTEM image of all of the Fe-TiO2 samples indicates that the obtained TiO2 particles were mainly in the anatase phase (Figure 6e,f), wherein a well-ordered lattice fringe spacing of 0.35 nm corresponded to the (1 0 1) crystallographic plane of anatase, and the results were consistent with the XRD analysis [32]. It can be easily observed in the EDX (energy-dispersive X-ray spectrometry) mapping of the 2% Fe-TiO2 that the iron element was homogeneously dispersed onto the TiO2 support (Figure 6g–j), and this finding clearly raised the conclusion that the present preparation method provided a well-dispersed metal loading over the supported sample.
In addition, XPS measurements were conducted to further ascertain the chemical status of the surface of the Fe-doped TiO2 nanoparticles. The corresponding results are presented in Figure 7. As shown in Figure 7a, the fully scanned spectra demonstrated the existence of Ti, O, and Fe elements, as well as C as the reference (C 1s calibrated with a fixed value of 284.8 eV). According to the core level spectra of Fe 2p (given in Figure 7a as inset), the presence of Fe 2p3/2 and Fe 2p1/2 components in the 0.5% Fe-TiO2 and 1% Fe-TiO2 samples at the binding energy (B.E.) positions of 710.9 eV and 724.3 eV were consistent with Fe3+ in an interactive Ti-O-Fe species [33]. A higher shift of the binding energies of Fe 2p3/2 and Fe 2p1/2 could be observed with a further increase in Fe concentration, and this phenomenon was caused by the existence of the adsorbed Fe3+ dopant on the surface of the TiO2 [34]. The existence of Fe3+ on the TiO2 surface was likely to increase the number of available adsorption sites and lower the surface desorption energy [34,35]. A slight shift was also observed in the presence of Ti 2p3/2 and Ti 2p1/2 when the Fe-doped concentration exceeded 2 mol %, and all peaks regarding Ti 2p indicated that the Ti elements in the samples were in agreement with the values of Ti4+.
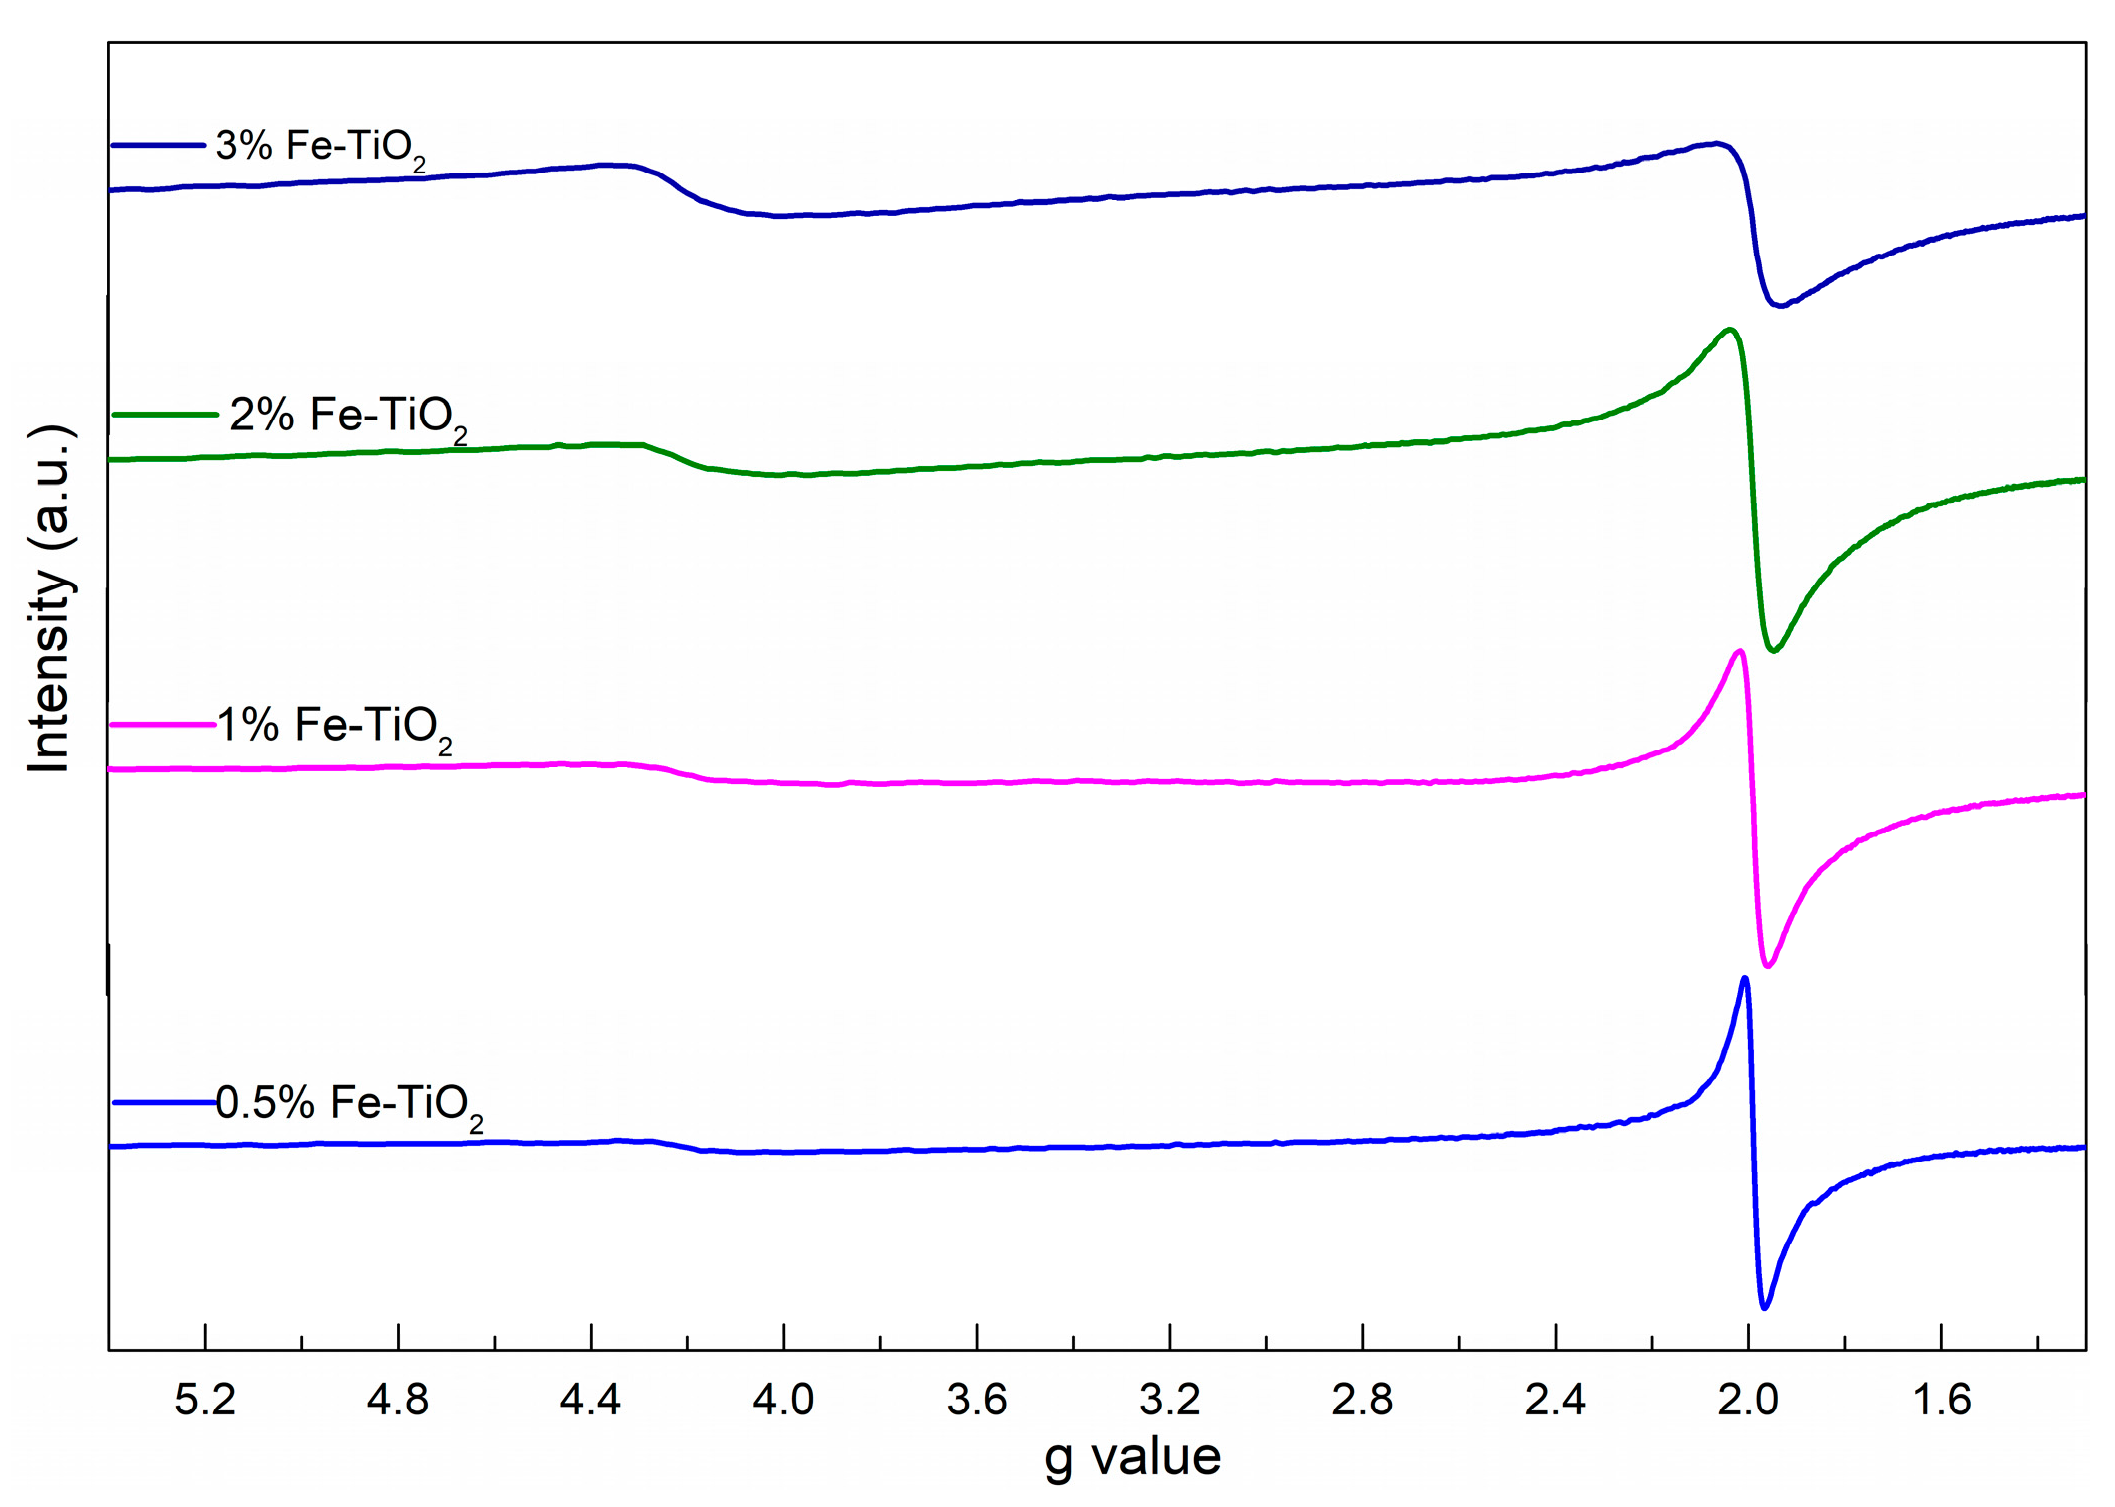
To further investigate the lattice site occupancy around the iron ion in the TiO2 host, electron paramagnetic resonance (EPR) experiments of the iron-loaded TiO2 samples were conducted and the results are presented in Figure 8. The EPR signals observed at g = 1.99 and g = 4.22 were attributed to Fe3+ substituted for Ti4+ in the matrix of TiO2 and to the substitutional incorporation of isolated iron cations dispersed on the TiO2 surface, respectively [27,36,37]. According to the standard Kroger–Vink equation, the acceptor-type Fe3+ dopant in the TiO2 lattice could act as defective sites (Ti) and generate oxygen vacancies () [38,39].
Meanwhile, a comparison of the spectral characteristics among the tested samples showed that the g = 4.22 resonance band increases with the iron content compared with the signal at g = 1.99, indicating that more doped iron cations were located on the TiO2 surface.
To investigate the reducibility behaviour of the bare and Fe-supported TiO2, a series of H2-TPR experiments were conducted and the results are shown in Figure 9. It can be seen that, in the pure TiO2 sample, a broad signal was presented ranging from 500 °C to 650 °C, and the two reduction peaks located at 585 °C and 613 °C can be ascribed to the surface oxygen and lattice oxygen due to Ti4+ to Ti3+ [40]. When Fe was incorporated into the TiO2 support, a distinct overlapped peak shifted to the lower temperature range (400–565 °C). Meanwhile, the peak intensity showed a significant increase as the Fe-doped concentration increased from 0.5% to 2%, and weak growth could be observed with a further increase in Fe-doped concentration. These results indicate that the integration of Fe with the TiO2 nanoparticle could enhance the oxidative ability of the TiO2. To better understand the detailed reduction properties of Fe species, a peak-fitting process was performed according to the method proposed by Liu et al. [41]. As shown in Figure 9, all of the Fe-doped TiO2 reduction peaks can be divided into four sub-bands and denominated as T1, T2, T3, and T4. The sub-band T1 and sub-bands T2–T4 are assigned to the surface oxygen and lattice oxygen, respectively [42]. Specially, the T2, T3, and T4 bands correspond to the progressive reduction process of the Fe ion, i.e., Fe3+-O-Ti→Fe2+/3+-O-Ti→Fe2+-O-Ti→Fe0 [43]. The area ratio values of T1/(T2 + T3) were all below 1:2, indicating that the Fe3+-O-Ti has been really converted into Fe0 in the T3–T4 process. It is worth mentioning that the area ratio values of T1/(T2 + T3) decreased with an increase in Fe-doped concentration, and this phenomenon should be attributed to the fact that an increase in Fe-doped concentration facilitates the enrichment of isolated Fe3+ on the surface of TiO2 (hereafter denoted as Fe3+surface). The results are consistent with the above EPR analysis.
As proposed above, •OH served as putative contributors to the removal of NO, where P25 and the as-prepared materials were used as catalysts to decompose H2O2. As shown in Figure 10, the observed hyperfine splitting constants for the 1:2:2:1 signal (aN = aH = 14.9 G) were the typical spectrum shape of the DMPO-OH spin adduct and were in good accordance with the values in the literature [44]. What is more, the concentration of •OH was in the order of: 2% Fe-TiO2 + H2O2 > TiO2 + H2O2 > P25 + H2O2 > H2O2. This order was identical to the NOX removal efficiency and evidenced that the as-prepared catalysts facilitated the production of •OH.
2.5. Mechanistic Discussion
To elucidate in depth the functional mechanism and promotional effect of Fe species on the oxidative activity of NOX, a fixed Fe/Ti molar ratio of 2% treated at different calcination temperatures were selected to test the catalytic activities. As shown in Figure 11a–d, the sample treated at 450 °C yielded the highest NOX removal efficiency of 95.67% and the conversion efficiency of NO to HNO3 was 88.1%. The XRD patterns of the Fe/TiO2 samples (Figure S4) revealed that samples treated at Tanneal ≤ 400 °C exhibited a hybrid crystalline feature of the amorphous gel and a small grain size anatase structure, while the samples annealing at temperatures ranging from 400 °C to 600 °C all exhibited a pure anatase phase [45]. Moreover, a trace amount of the characteristic peaks of α-Fe2O3 (2θ = 32.4° and 34.6°) was detected in the samples annealed below 400 °C and disappeared as the calcination temperature increased. The XPS results (Figure S5a) suggested that the iron species in the samples treated below 400 °C were assigned to Fe2O3, further confirming the existence of phase segregation and verifying that a low annealing temperature is unfavorable for Fe3+ substituting for Ti4+ in the TiO2 matrix [46]. In comparison, the peaks of Fe 2p3/2 and Fe 2p1/2 of the samples treated at temperatures ranging from 400 °C to 500 °C shift higher, and this phenomenon could account for the cooperative formation of positively charged surface Fe3+ and Fe3+ in the Ti-O-Fe species [47,48]. Interestingly, the Fe 2p level binding energy exhibited a negative shift when the calcination temperature was over 500 °C, and the peak positions corresponded with the characteristics of a pure Ti-O-Fe species. The appearance of two distinct peaks of Ti 2p1/2 (464.4–464.7 eV) and Ti 2p3/2 (458.7–458.8 eV) confirmed that all Ti ions were in the +4 valence state (Figure S5b). The EPR spectra of the samples gave direct evidence that an elevated temperature treatment facilitated the iron ions diffusing from the surface into the bulk of TiO2 (Figure S6).
Based on the above analysis, the promotion effect of iron species on the catalytic activity could be represented in the following two respects. On one hand, a certain proportion of Fe3+ in the matrix of TiO2 (g = 1.99, hereafter denoted as Fe3+matrix) generated the positively charged oxygen vacancies by compensating for the negative charge acceptor dopant [38]. The oxygen vacancies site acted as a catalytic center and facilitated the formation of •OH by the catalytic decomposition of H2O2 vapor. The highly oxidative radical groups contributed to the charge separation process as well as the oxidation of NO. On the other hand, a minor fraction of Fe3+ on the TiO2 surface showed a remarkable inhibition of NO2; similar results were reported by Wu et al. [38]. Specifically, some Fe3+ sites would be reduced into Fe2+ during the redox process of an H2O2 molecule, while Fe2+, which holds a strong affinity for NO, could easily adsorb the NO molecules and form a Fe2+(NO)X polynitrosyls species [49,50]. Then, this species could be oxidized via the adjacent •OH. As a result, the introduction of appropriate Fe3+surface and Fe3+matrix were responsible for the superior performance of the Fe-TiO2 catalyst.
3. Materials and Methods
3.1. Experimental Apparatus and Procedure
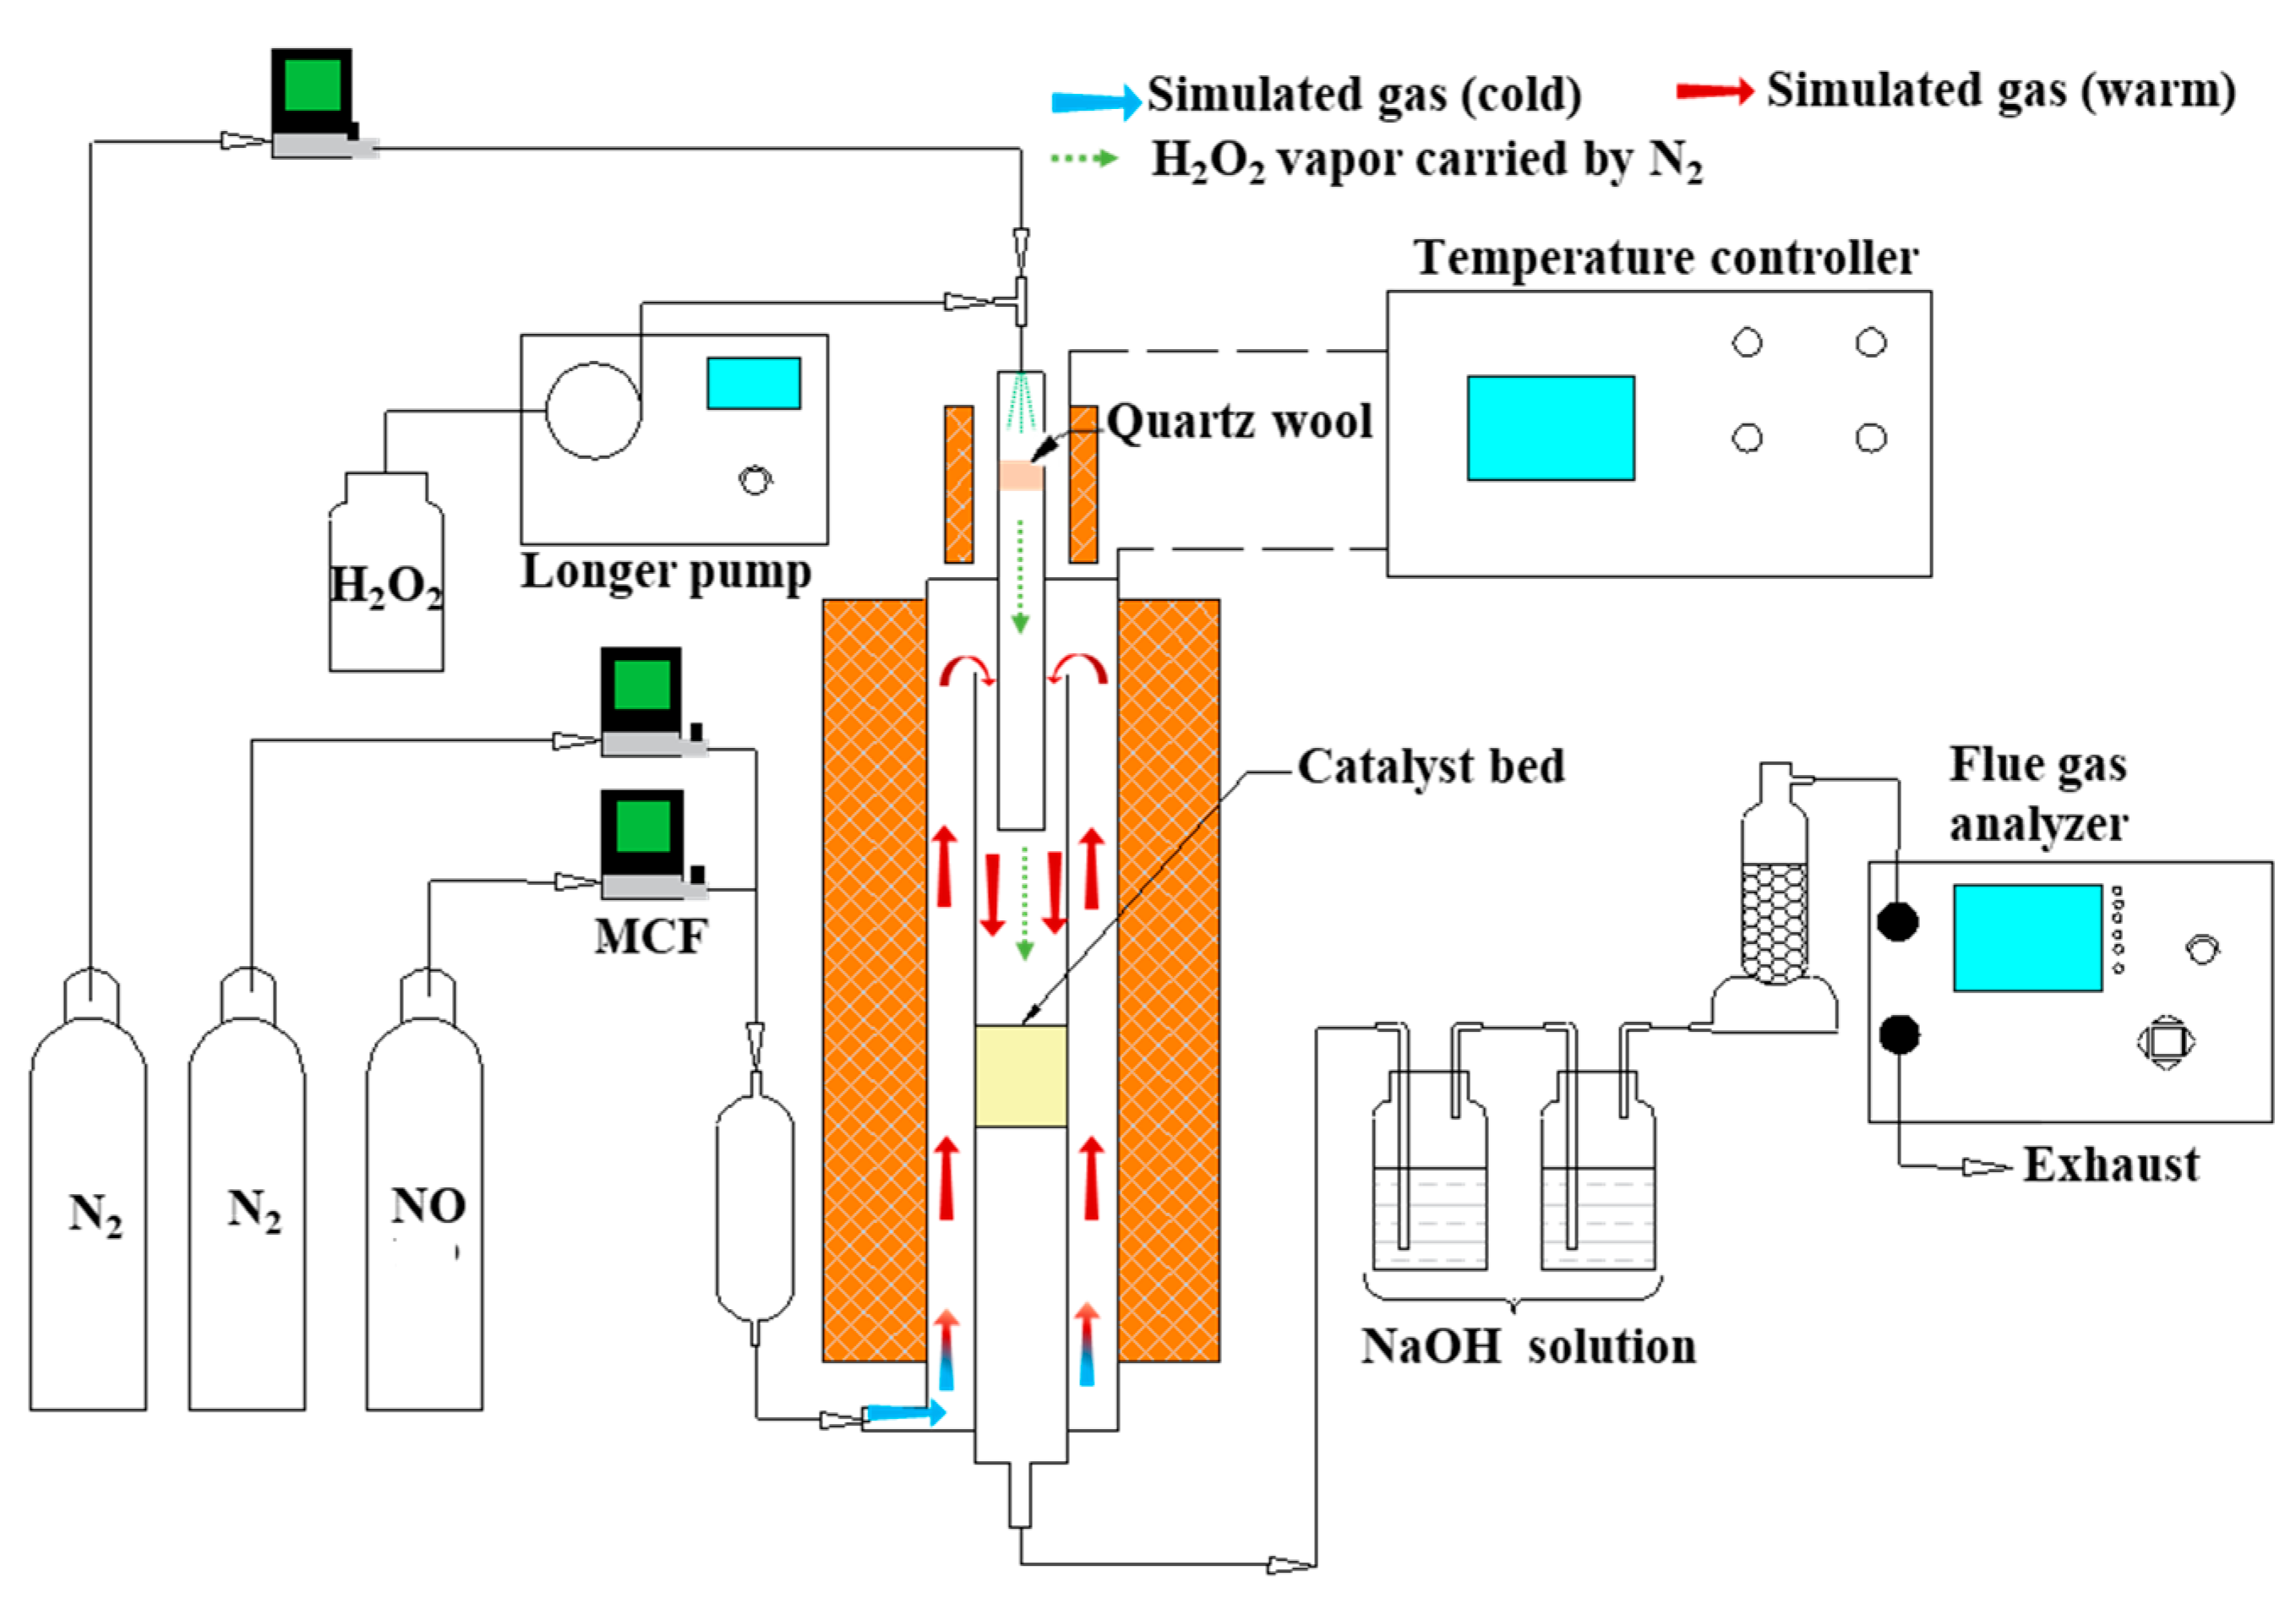
The experiments were carried out in a fixed-bed system as presented in Figure 12. The system consisted of four sections: a simulated flue gas generating section, a quartz-made integrated reactor for hydrogen peroxide vaporization and NO oxidation, an absorption section, and a flue gas analyser. N2 and NO (1% (v/v), balanced with N2) compressed gas cylinders (Dalian Special Gases Co., Ltd., Dalian, China) were used to generate simulated flue gas. The total gas flow which passed through the catalyst was fixed at 1 L/min controlled by mass flow meter (MCF), wherein the NOX content was 500 ppm. Some 0.3 mL/min 3 wt %, 6 wt %, 9 wt %, and 12 wt % H2O2 solution (30.0%, Sinopharm Chemical Reagent, Shanghai, China), which corresponded to a molar H2O2/NO of 8, 12, 24, and 48, respectively, was pumped by a peristaltic pump (Longer Precision Pump Co., Ltd., Baoding, China), carried by 200 mL/min N2, and vaporized through a heating apparatus (140 °C). The gas mixture was injected into the catalyst zone with the simulated flue gas. The H2O2 vapor decomposed to produce the oxidative free radicals via a typical surface catalysis reaction. As the catalytic decomposition process of the H2O2 vapor occurred in the stream of simulated flue gas, the oxidative free radicals rapidly converted NO into HNO2, NO2, and HNO3. Two scrubbers, made of a gas-washing bottle filled with NaOH solution (0.2 mol/L, 0.3 L), were utilized to remove the HNO2 and HNO3 in the mist. As demonstrated by Wang et al., up to 83% NO2 would not be absorbed by NaOH solution, which then remained in the exhaust gas [51,52,53]. Therefore, the NO and NO2 remaining in the gas measured by a flue gas analyser (Madur Photon PGD-100, Madurai Eljack Electronics Co., Vienna, Austria) can represent the real NOX removal efficiency. The NO2− and NO3− ions in the sample solutions were determined by ion chromatography (Dionex 4000, Dionex Corp., Sunnyvale, CA, USA). The chromatographic conditions were: AS14 anion column, eluent solution (3.5 mM Na2CO3/1.0 mM NaHCO3), flowrate (1.2 mL/min), column temperature (25 °C). The qualitative results of the ion products in the scrubber solution were analyzed via the retention time and the peak area, respectively.
3.2. Catalyst Preparation
Nanosize TiO2 (P25) was purchased from Evonik Industries AG (Essen, Germany). The catalyst was heated at 400 °C for 6 h in air to remove impurities. The Fe/TiO2 catalysts were prepared by the co-precipitation method, and the details of the process can be found in [28,54,55]. A calculated amount of Fe(NO3)3·9H2O (98.5%, Sinopharm Chemical Reagent, Shanghai, China) and Ti(SO4)2 (97%, Sinopharm Chemical Reagent, Shanghai, China) (the molar ratios of Fe/Ti were 0.5%, 1%, 2%, and 3%, respectively) were dissolved in ice-cold deionized water and stirred for 1 h, then standard ammonia solution (25%, Sinopharm Chemical Reagent, Shanghai, China) was added slowly to the solution under stirring until the pH rose to 10. Without aging, the obtained precipitate was filtered and washed by deionized water. The resulting powder was desiccated at 105 °C for 12 h and then calcined in air at 400 °C for 6 h. All samples were ground and sieved to 60–80 mesh for activity tests. The catalysts prepared by the co-precipitation procedure were labelled as TiO2, 0.5% Fe-TiO2, 1% Fe-TiO2, 2% Fe-TiO2, and 3% Fe-TiO2 in order based on the loading concentration of the iron element, whereas the TiO2 (P25) was named P25.
3.3. Catalyst Characterization
Visible-Raman spectra of the catalysts were collected on a UV resonance Raman spectrometer (LabRAM HR800, Horiba JobinYvon, Bensheim, Germany) using a 532 nm laser. The textural properties of the samples were specified using liquid nitrogen adsorption at −196 °C in a physisorption analyzer (Micromeritics ASAP 2020M, Micromeritics Instrument Corp., Norcross, GA, USA). The specific surface area was calculated by the Brunauer–Emmett–Teller (BET) method. The crystalline phase of the sample was identified by Powder X-ray Diffraction (XRD, PANalytical B.V., Almelo, The Netherlands) with a high-intensity Cu Kα radiation source (λ = 1.5406 Å). The XRD pattern was collected over a range of 2θ angles from 10° to 90° at a step size of 8° min−1. The average crystallite size of the sample was estimated using Debye–Scherrer’s equation (Equation (1)), where the shape factor K is a constant taken as 0.89, β is the full width at half maximum (FWHM) of the diffraction peak, θ is the Bragg angle, and λ is the X-ray wavelength that corresponds to Cu Kα radiation (λ = 1.5406 Å).
Field emission scanning electron microscopy (SEM, Hitachi SU-8010, Hitachi High Technologies Co., Hitachi, Japan) and transmission electron microscopy (TEM, FEI G2F30, FEI Co., Hillsboro, OR, USA) were used to identify the surface morphology of the samples. XPS measurements were recorded using a Thermo Scientific ESCALAB 250XI photoelectron spectrometer with Al Kα (hν = 1486.6 eV, Thermo Fisher Scientific Inc., Waltham, MA, USA) X-ray radiation. Additionally, the shift of the binding energy was corrected using the C1s level at 284.8 eV as an internal standard. The X-band (9.4 GHz) electron paramagnetic resonance (EPR) spectrum was collected on a Bruker EPR spectrometer (A300-9.5/12, Bruker Instruments, Karlsruhe, Germany) at room temperature. Temperature programmed reduction (TPR) measurements were carried out on a CHEMBET 3000 instrument (Quantachrome Instruments, Boynton Beach, FL, USA). Prior to the TPR experiments, a 100 mg sample was purged with helium gas for 15 min. Then, the sample was preheated to 300 °C and left for 30 min. After it cooled to ambient temperature, the catalyst was reduced in a flow rate of 10% H2/Ar (30 mL/min) and a linear heating rate of 5 °C/min to 670 °C. •OH was captured by 5,5-dimethyl-1-pyrroline N-oxide (DMPO, 97%, Sigma-Aldrich, St. Louis, MO, USA) and detected by ESR spectrometer. The details of the process can be found in Wiedmer and Sánchez [44,56]. Specially, the operating conditions were set as follows: modulation frequency (100 kHz), modulation amplitude (4 G), resonance frequency (9.87 GHz), sweep width (200 G), microwave power (19.22 mW), centre field (3522 G).
3.4. Data Process
The deNOX performance can be assessed separately for NO oxidation, NO2 selectivity, and NOX removal (NOX = NO + NO2) by using Equations (2)–(4) [28]. The values used were the average of those collected after 2 h at a steady state, and the tests were repeated three times to ensure their reproducibility. Meanwhile, the overall nitrogen mass balance was calculated in order to elucidate the catalytic oxidation ability of the catalysts.
4. Conclusions
A novel denitrification process with H2O2 vapor catalyzed by a TiO2-based catalyst was proposed. Meanwhile, a series of Fe-doped anatase TiO2 nanoparticles were prepared with the aim of complementing the developed system. Notably, the Fe/TiO2 exhibited remarkably high activity with a high utilization efficiency of H2O2. A detailed study was carried out on the Fe/TiO2 catalyst. The highest NOX removal efficiency achieved was 95.6%, and a molar NO3−/NO2− of 16.2 was also achieved. The catalyst characterization results demonstrated that the strong enhancement of the deep oxidation efficiency was evidenced to be related to the NO absorptivity of iron ions on the TiO2 surface and O vacancies caused by the Fe3+matrix.
Supplementary Materials
The following are available online at www.mdpi.com/2073-4344/7/12/386/s1, Figure S1. Removal efficiencies of NOX in blank tests; Figure S2. N2 adsorption/desorption isotherms of the samples. (a) P25, (b) TiO2, (c) 0.5% Fe-TiO2, (d) 1% Fe-TiO2, (e) 2% Fe-TiO2, and (f) 3% Fe-TiO2; Figure S3. FE-SEM images of the catalyst samples. (a) P25, (b) TiO2, (c) 0.5% Fe-TiO2, (d) 1% Fe-TiO2, (e) 2% Fe-TiO2, and (f) 3% Fe-TiO2; Figure S4. X-ray powder diffraction patterns of the samples calcined at different temperatures; Figure S5. X-ray photoelectron spectra for the samples calcined at different temperatures; Figure S6. EPR Spectra of the iron-loaded samples at different heating temperatures.
Acknowledgments
The authors appreciate greatly the financial support from the Research Fund for the “Fundamental Research Funds for the Central Universities” and the technical support from the Analytical and Testing Center in Huazhong University of Science & Technology (http://atc.hust.edu.cn). We appreciate deeply the help of Jinping Zhang, Jiajia Cui, and Penghui Guo for assistance and thank Maochang Liu, Haiping Yang, and Xianhua Wang for helpful suggestions of the manuscript.
Author Contributions
Lei Chen, Yuxin Li, Qiang Lu, and Qinxin Zhao conceived and designed the experiments; Lei Chen performed the experiments; Lei Chen, Qiang Lu, and Zhiyuan Liang analyzed the data; Lei Chen, Qiang Lu, and Yungang Wang contributed reagents/materials/analysis tools; and Lei Chen, Qiang Lu, and Qinxin Zhao wrote the paper.
Conflicts of Interest
The authors declare no conflict of interest.
References
- Skalska, K.; Miller, J.S.; Ledakowicz, S. Trends in NOX abatement: A review. Sci. Total Environ. 2010, 408, 3976–3989. [Google Scholar] [CrossRef] [PubMed]
- Marberger, A.; Elsener, M.; Ferri, D.; Kröcher, O. VOX surface coverage optimization of V2O5/WO3-TiO2 SCR catalysts by variation of the v loading and by aging. Catalysts 2015, 5, 1704–1720. [Google Scholar] [CrossRef]
- Dong, L.; Fan, Y.; Ling, W.; Yang, C.; Huang, B. Effect of Ce/γ Addition on Low-Temperature SCR Activity and SO2 and H2O Resistance of MnOX/ZrO2/MWCNTs Catalysts. Catalysts 2017, 7, 181. [Google Scholar] [CrossRef]
- Liu, Y.; Wang, Q.; Yin, Y.; Pan, J.; Zhang, J. Advanced oxidation removal of NO and SO2 from flue gas by using ultraviolet/H2O2/NaOH process. Chem. Eng. Res. Des. 2014, 92, 1907–1914. [Google Scholar] [CrossRef]
- Liu, Y.; Zhang, J.; Sheng, C.; Zhang, Y.; Zhao, L. Preliminary study on a new technique for wet removal of nitric oxide from simulated flue gas with an ultraviolet (UV)/H2O2 process. Energy Fuels 2010, 24, 4925–4930. [Google Scholar] [CrossRef]
- Ding, J.; Zhong, Q.; Zhang, S. Catalytic efficiency of iron oxides in decomposition of H2O2 for simultaneous NOX and SO2 removal: Effect of calcination temperature. J. Mol. Catal. A Chem. 2014, 393, 222–231. [Google Scholar] [CrossRef]
- Ding, J.; Zhong, Q.; Zhang, S.; Cai, W. Size-and shape-controlled synthesis and catalytic performance of iron–aluminum mixed oxide nanoparticles for NOX and SO2 removal with hydrogen peroxide. J. Hazard. Mater. 2015, 283, 633–642. [Google Scholar] [CrossRef] [PubMed]
- Ding, J.; Zhong, Q.; Zhang, S.; Song, F.; Bu, Y. Simultaneous removal of NOX and SO2 from coal-fired flue gas by catalytic oxidation-removal process with H2O2. Chem. Eng. J. 2014, 243, 176–182. [Google Scholar] [CrossRef]
- Zhao, Y.; Yuan, B.; Hao, R.; Tao, Z. Low-temperature conversion of no in flue gas by vaporized H2O2 and nanoscale zerovalent iron. Energy Fuels 2017, 31, 7282–7289. [Google Scholar] [CrossRef]
- Wu, B.; Xiong, Y.; Ge, Y. Simultaneous removal of SO2 and NO from flue gas with ·OH from the catalytic decomposition of gas-phase H2O2 over solid-phase Fe2(SO4)3. Chem. Eng. J. 2017. [Google Scholar] [CrossRef]
- Wu, B.; Xiong, Y. A novel low-temperature no removal approach with ·OH from catalytic decomposition of H2O2 over La1−XCaxFeO3 oxides. J. Chem. Technol. Biotechnol. 2017. [Google Scholar] [CrossRef]
- Gupta, S.M.; Tripathi, M. A review of TiO2 nanoparticles. Chin. Sci. Bull. 2011, 56, 1639. [Google Scholar] [CrossRef]
- Lousada, C.M.; Yang, M.; Nilsson, K.; Jonsson, M. Catalytic decomposition of hydrogen peroxide on transition metal and lanthanide oxides. J. Mol. Catal. A Chem. 2013, 379, 178–184. [Google Scholar] [CrossRef]
- Lousada, C.M.; LaVerne, J.A.; Jonsson, M. Enhanced hydrogen formation during the catalytic decomposition of H2O2 on metal oxide surfaces in the presence of HO radical scavengers. Phys. Chem. Chem. Phys. 2013, 15, 12674–12679. [Google Scholar] [CrossRef] [PubMed]
- Suh, M.; Bagus, P.S.; Pak, S.; Rosynek, M.P.; Lunsford, J.H. Reactions of hydroxyl radicals on titania, silica, alumina, and gold surfaces. J. Phys. Chem. B 2000, 104, 2736–2742. [Google Scholar] [CrossRef]
- Li, L.; Shen, Q.; Cheng, J.; Hao, Z. Catalytic oxidation of NO over TiO2 supported platinum clusters. II: Mechanism study by in situ FTIR spectra. Catal. Today 2010, 158, 361–369. [Google Scholar] [CrossRef]
- Ding, J.; Lin, J.; Xiao, J.; Zhang, Y.; Zhong, Q.; Zhang, S.; Guo, L.; Fan, M. Effect of fluoride doping for catalytic ozonation of low-temperature denitrification over cerium–titanium catalysts. J. Alloys Compd. 2016, 665, 411–417. [Google Scholar] [CrossRef]
- Liu, Y.; Zhang, J.; Pan, J.; Tang, A. Investigation on the removal of NO from SO2-containing simulated flue gas by an ultraviolet/Fenton-like reaction. Energy Fuels 2012, 26, 5430–5436. [Google Scholar] [CrossRef]
- Hao, R.; Zhao, Y.; Yuan, B.; Zhou, S.; Yang, S. Establishment of a novel advanced oxidation process for economical and effective removal of SO2 and NO. J. Hazard. Mater. 2016, 318, 224–232. [Google Scholar] [CrossRef] [PubMed]
- Liu, Y.X.; Zhang, J. Photochemical oxidation removal of NO and SO2 from simulated flue gas of coal-fired power plants by wet scrubbing using UV/H2O2 advanced oxidation process. Ind. Eng. Chem. Res. 2011, 50, 3836–3841. [Google Scholar] [CrossRef]
- Li, X.; Chen, C.; Zhao, J. Mechanism of photodecomposition of H2O2 on TiO2 surfaces under visible light irradiation. Langmuir 2001, 17, 4118–4122. [Google Scholar] [CrossRef]
- Setiabudi, A.; Chen, J.; Mul, G.; Makkee, M.; Moulijn, J.A. CeO2 catalysed soot oxidation: The role of active oxygen to accelerate the oxidation conversion. Appl. Catal. B Environ. 2004, 51, 9–19. [Google Scholar] [CrossRef]
- Sivachandiran, L.; Thevenet, F.; Gravejat, P.; Rousseau, A. Investigation of NO and NO2 adsorption mechanisms on TiO2 at room temperature. Appl. Catal. B Environ. 2013, 142, 196–204. [Google Scholar] [CrossRef]
- Mikami, M.; Nakamura, S.; Kitao, O.; Arakawa, H. Lattice dynamics and dielectric properties of TiO2 anatase: A first-principles study. Phys. Rev. B 2002, 66, 155213. [Google Scholar] [CrossRef]
- Ganesh, I.; Kumar, P.P.; Gupta, A.K.; Sekhar, P.S.; Radha, K.; Padmanabham, G.; Sundararajan, G. Preparation and characterization of Fe-doped TiO2 powders for solar light response and photocatalytic applications. Proc. Appl. Ceram. 2012, 6, 21–36. [Google Scholar] [CrossRef]
- Zhang, G.K.; Ding, X.M.; He, F.S.; Yu, X.Y.; Zhou, J.; Hu, Y.J.; Xie, J.W. Low-temperature synthesis and photocatalytic activity of TiO2 pillared montmorillonite. Langmuir 2008, 24, 1026–1030. [Google Scholar] [CrossRef] [PubMed]
- Tong, T.; Zhang, J.; Tian, B.; Chen, F.; He, D. Preparation of Fe3+-doped TiO2 catalysts by controlled hydrolysis of titanium alkoxide and study on their photocatalytic activity for methyl orange degradation. J. Hazard. Mater. 2008, 155, 572–579. [Google Scholar] [CrossRef] [PubMed]
- Wang, C.; Böttcher, C.; Bahnemann, D.W.; Dohrmann, J.K. A comparative study of nanometer sized Fe(III)-doped TiO2 photocatalysts: Synthesis, characterization and activity. J. Mater. Chem. 2003, 13, 2322–2329. [Google Scholar] [CrossRef]
- Adán, C.; Bahamonde, A.; Fernández-García, M.; Martínez-Arias, A. Structure and activity of nanosized iron-doped anatase TiO2 catalysts for phenol photocatalytic degradation. Appl. Catal. B Environ. 2007, 72, 11–17. [Google Scholar] [CrossRef]
- Asiltürk, M.; Sayılkan, F.; Arpaç, E. Effect of Fe3+ ion doping to TiO2 on the photocatalytic degradation of malachite green dye under UV and vis-irradiation. J. Photochem. Photobiol. 2009, 203, 64–71. [Google Scholar] [CrossRef]
- Shannon, R.T. Revised effective ionic radii and systematic studies of interatomic distances in halides and chalcogenides. Acta Crystallogr. Sect. A 1976, 32, 751–767. [Google Scholar] [CrossRef]
- Alqurashi, G.K.; Al-Shehri, A.; Narasimharao, K. Effect of TiO2 morphology on the benzyl alcohol oxidation activity of Fe2O3–TiO2 nanomaterials. RSC Adv. 2016, 6, 71076–71091. [Google Scholar] [CrossRef]
- Wu, Q.; Zheng, Q.; van de Krol, R. Creating oxygen vacancies as a novel strategy to form tetrahedrally coordinated Ti4+ in Fe/TiO2 nanoparticles. J. Phys. Chem. C 2012, 116, 7219–7226. [Google Scholar] [CrossRef]
- Kayhan, E.; Andonova, S.M.; Şentürk, G.S.; Chusuei, C.C.; Ozensoy, E. Fe promoted NOX storage materials: Structural properties and NOX uptake. J. Phys. Chem. C 2010, 114, 357–369. [Google Scholar] [CrossRef]
- Xiao, L.; Zhang, J.; Cong, Y.; Tian, B.; Chen, F.; Anpo, M. Synergistic effects of doped Fe3+ and deposited Au on improving the photocatalytic activity of TiO2. Catal. Lett. 2006, 111, 207–211. [Google Scholar] [CrossRef]
- Niu, Y.; Xing, M.; Zhang, J.; Tian, B. Visible light activated sulfur and iron co-doped TiO2 photocatalyst for the photocatalytic degradation of phenol. Catal. Today 2013, 201, 159–166. [Google Scholar] [CrossRef]
- Wu, Q.; van de Krol, R. Selective photoreduction of nitric oxide to nitrogen by nanostructured TiO2 photocatalysts: Role of oxygen vacancies and iron dopant. J. Am. Chem. Soc. 2012, 134, 9369–9375. [Google Scholar] [CrossRef] [PubMed]
- Chiang, Y.-M.; Birnie, D.P.; Kingery, W.D. Physical Ceramics: Principles for Ceramic Science and Engineering; John Wiley & Sons, Inc.: Hoboken, NJ, USA, 1997. [Google Scholar]
- Ding, J.; Zhong, Q.; Cai, H.; Zhang, S. Structural characterizations of fluoride doped ceti nanoparticles and its differently promotional mechanisms on ozonation for low-temperature removal of NOX (x = 1, 2). Chem. Eng. J. 2016, 286, 549–559. [Google Scholar] [CrossRef]
- Liu, F.; He, H. Selective catalytic reduction of NO with NH3 over manganese substituted iron titanate catalyst: Reaction mechanism and H2O/SO2 inhibition mechanism study. Catal. Today 2010, 153, 70–76. [Google Scholar] [CrossRef]
- Liu, F.; He, H. Structure-activity relationship of iron titanate catalysts in the selective catalytic reduction of NOX with NH3. J. Phys. Chem. C 2010, 114, 16929–16936. [Google Scholar] [CrossRef]
- Liu, F.; He, H.; Ding, Y.; Zhang, C. Effect of manganese substitution on the structure and activity of iron titanate catalyst for the selective catalytic reduction of NO with NH3. Appl. Catal. B Environ. 2009, 93, 194–204. [Google Scholar] [CrossRef]
- Hung, W.C.; Chen, Y.C.; Chu, H.; Tseng, T.K. Synthesis and characterization of TiO2 and Fe/TiO2 nanoparticles and their performance for photocatalytic degradation of 1,2-dichloroethane. Appl. Surf. Sci. 2008, 255, 2205–2213. [Google Scholar] [CrossRef]
- Farhangi, N.; Ayissi, S.; Charpentier, P.A. Fe doped TiO2–graphene nanostructures: Synthesis, DFT modeling and photocatalysis. Nanotechnology 2014, 25, 305601. [Google Scholar] [CrossRef] [PubMed]
- Wang, C.C.; Wang, K.W.; Perng, T.P. Electron field emission from Fe-doped TiO2 nanotubes. Appl. Phys. Lett. 2010, 96, 143102. [Google Scholar] [CrossRef]
- Zhang, J.; Chen, X.; Shen, Y.; Li, Y.; Hu, Z.; Chu, J. Synthesis, surface morphology, and photoluminescence properties of anatase iron-doped titanium dioxide nano-crystalline films. Phys. Chem. Chem. Phys. 2011, 13, 13096–13105. [Google Scholar] [CrossRef] [PubMed]
- Mihaylov, M.; Ivanova, E.; Drenchev, N.; Hadjiivanov, K. Coordination Chemistry of Fe2+ Ions in Fe, H-ZSM-5 Zeolite as Revealed by the IR Spectra of Adsorbed CO and NO. J. Phys. Chem. C 2010, 114, 1004–1014. [Google Scholar] [CrossRef]
- Ivanova, E.; Mihaylov, M.; Hadjiivanov, K.; Blasin-Aubé, V.; Marie, O.; Plesniar, A.; Daturi, M. Evidencing three distinct Fe II sites in Fe–FER zeolites by using CO and NO as complementary IR probes. Appl. Catal. B Environ. 2010, 93, 325–338. [Google Scholar] [CrossRef]
- Wang, Z.; Cen, K.; Zhou, J.; Fan, J. Simultaneous Multi-Pollutants Removal in Flue Gas by Ozone; Springer: Berlin/Heidelberg, Germany, 2014. [Google Scholar]
- Thomas, D.; Vanderschuren, J. Nitrogen oxides scrubbing with alkaline solutions. Chem. Eng. Technol. 2000, 23, 449–455. [Google Scholar] [CrossRef]
- Kameoka, Y.; Pigford, R.L. Absorption of nitrogen dioxide into water, sulfuric acid, sodium hydroxide, and alkaline sodium sulfite aqueous solutions. Ind. Eng. Chem. Fundam. 1977, 16, 163–169. [Google Scholar] [CrossRef]
- Liu, F.; He, H.; Zhang, C. Novel iron titanate catalyst for the selective catalytic reduction of NO with NH3 in the medium temperature range. Chem. Commun. 2008, 17, 2043–2045. [Google Scholar] [CrossRef] [PubMed]
- Liu, F.; Asakura, K.; He, H.; Shan, W.; Shi, X.; Zhang, C. Influence of sulfation on iron titanate catalyst for the selective catalytic reduction of NOX with NH3. Appl. Catal. B Environ. 2011, 103, 369–377. [Google Scholar] [CrossRef]
- Ma, J.; He, H.; Liu, F. Effect of Fe on the photocatalytic removal of NOX over visible light responsive Fe/TiO2 catalysts. Appl. Catal. B Environ. 2015, 179, 21–28. [Google Scholar] [CrossRef]
- Wiedmer, D.; Sagstuen, E.; Welch, K.; Haugen, H.J.; Tiainen, H. Oxidative power of aqueous non-irradiated TiO2-H2O2 suspensions: Methylene blue degradation and the role of reactive oxygen species. Appl. Catal. B Environ. 2016, 198, 9–15. [Google Scholar] [CrossRef]
- Sánchez, L.D.; Taxt-Lamolle, S.F.M.; Hole, E.O.; Krivokapić, A.; Sagstuen, E.; Haugen, H.J. TiO2 suspension exposed to H2O2 in ambient light or darkness: Degradation of methylene blue and EPR evidence for radical oxygen species. Appl. Catal. B Environ. 2013, 142, 662–667. [Google Scholar] [CrossRef]
Figure 1.
(a–d) Removal efficiencies of nitric oxide (NOX) under different reaction systems. Conditions: H2O2/NO molar ratio: 8:1, 12:1, 24:1, and 48:1; catalyst: TiO2 (P25, Evonik Industries AG); gas hourly space velocity (GHSV) = 60,000 h−1.
Figure 1.
(a–d) Removal efficiencies of nitric oxide (NOX) under different reaction systems. Conditions: H2O2/NO molar ratio: 8:1, 12:1, 24:1, and 48:1; catalyst: TiO2 (P25, Evonik Industries AG); gas hourly space velocity (GHSV) = 60,000 h−1.
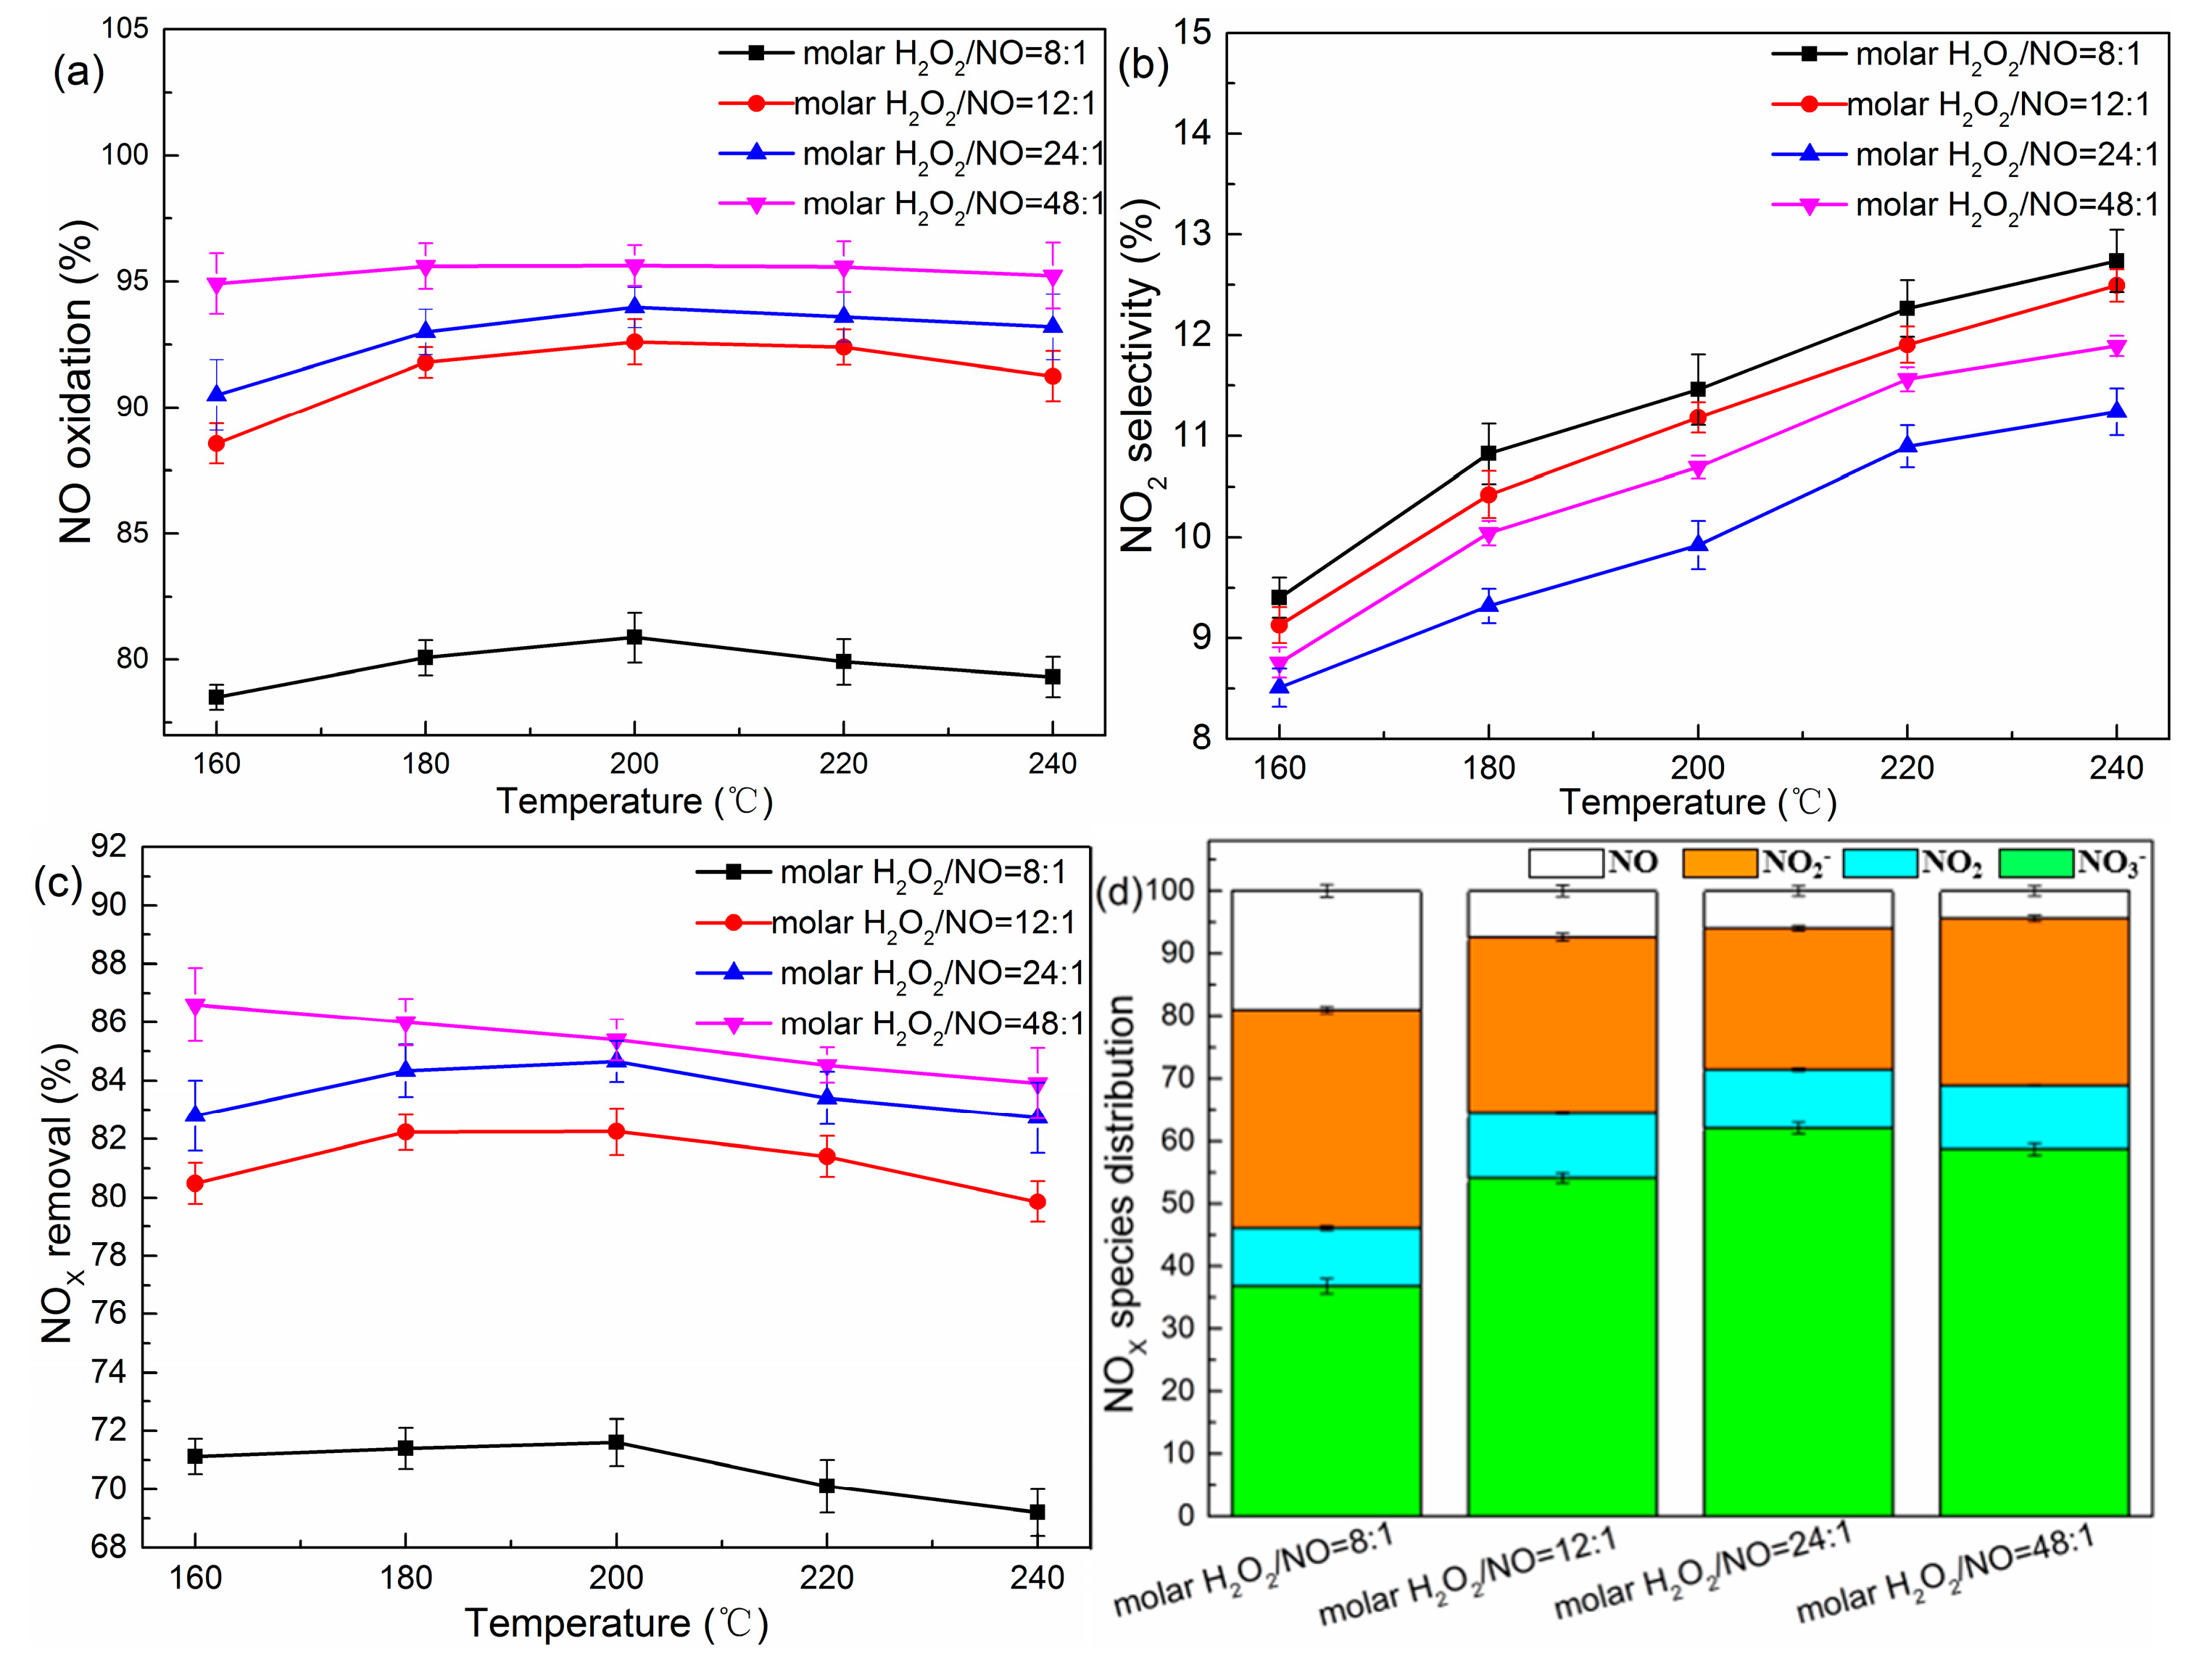
Figure 2.
(a–d) Removal efficiencies of NOX under different GHSV. Conditions: H2O2/NO molar ratio: 12:1; catalyst: P25.
Figure 2.
(a–d) Removal efficiencies of NOX under different GHSV. Conditions: H2O2/NO molar ratio: 12:1; catalyst: P25.

Figure 3.
(a–d) Removal efficiencies of NOX under different catalyst types. Conditions: H2O2/NO molar ratio: 12:1; GHSV: 60,000 h−1.
Figure 3.
(a–d) Removal efficiencies of NOX under different catalyst types. Conditions: H2O2/NO molar ratio: 12:1; GHSV: 60,000 h−1.

Figure 4.
Raman spectra of pure and iron oxide-supported TiO2 catalyst.

Figure 5.
XRD results of the tested catalysts.

Figure 6.
TEM and HRTEM results of the dopant Fe-TiO2 serial catalysts: (a) 0.5% Fe-TiO2 (b) 1% Fe-TiO2 (c) 2% Fe-TiO2 (d) 3% Fe-TiO2 (e) of 1% Fe-TiO2 sample (f) of 3% Fe-TiO2 sample (g–j) EDX mapping analyses for 2% Fe-TiO2.
Figure 6.
TEM and HRTEM results of the dopant Fe-TiO2 serial catalysts: (a) 0.5% Fe-TiO2 (b) 1% Fe-TiO2 (c) 2% Fe-TiO2 (d) 3% Fe-TiO2 (e) of 1% Fe-TiO2 sample (f) of 3% Fe-TiO2 sample (g–j) EDX mapping analyses for 2% Fe-TiO2.

Figure 7.
XPS spectra of 2% Fe-doped TiO2 samples (a) The Fe 2p1/2, Fe 2p3/2, Ti 2p1/2, and Ti 2p3/2 spectra for the 0.5%, 1%, 2%, and 3% Fe-doped TiO2 samples, respectively, are given in inset (a) and (b).
Figure 7.
XPS spectra of 2% Fe-doped TiO2 samples (a) The Fe 2p1/2, Fe 2p3/2, Ti 2p1/2, and Ti 2p3/2 spectra for the 0.5%, 1%, 2%, and 3% Fe-doped TiO2 samples, respectively, are given in inset (a) and (b).
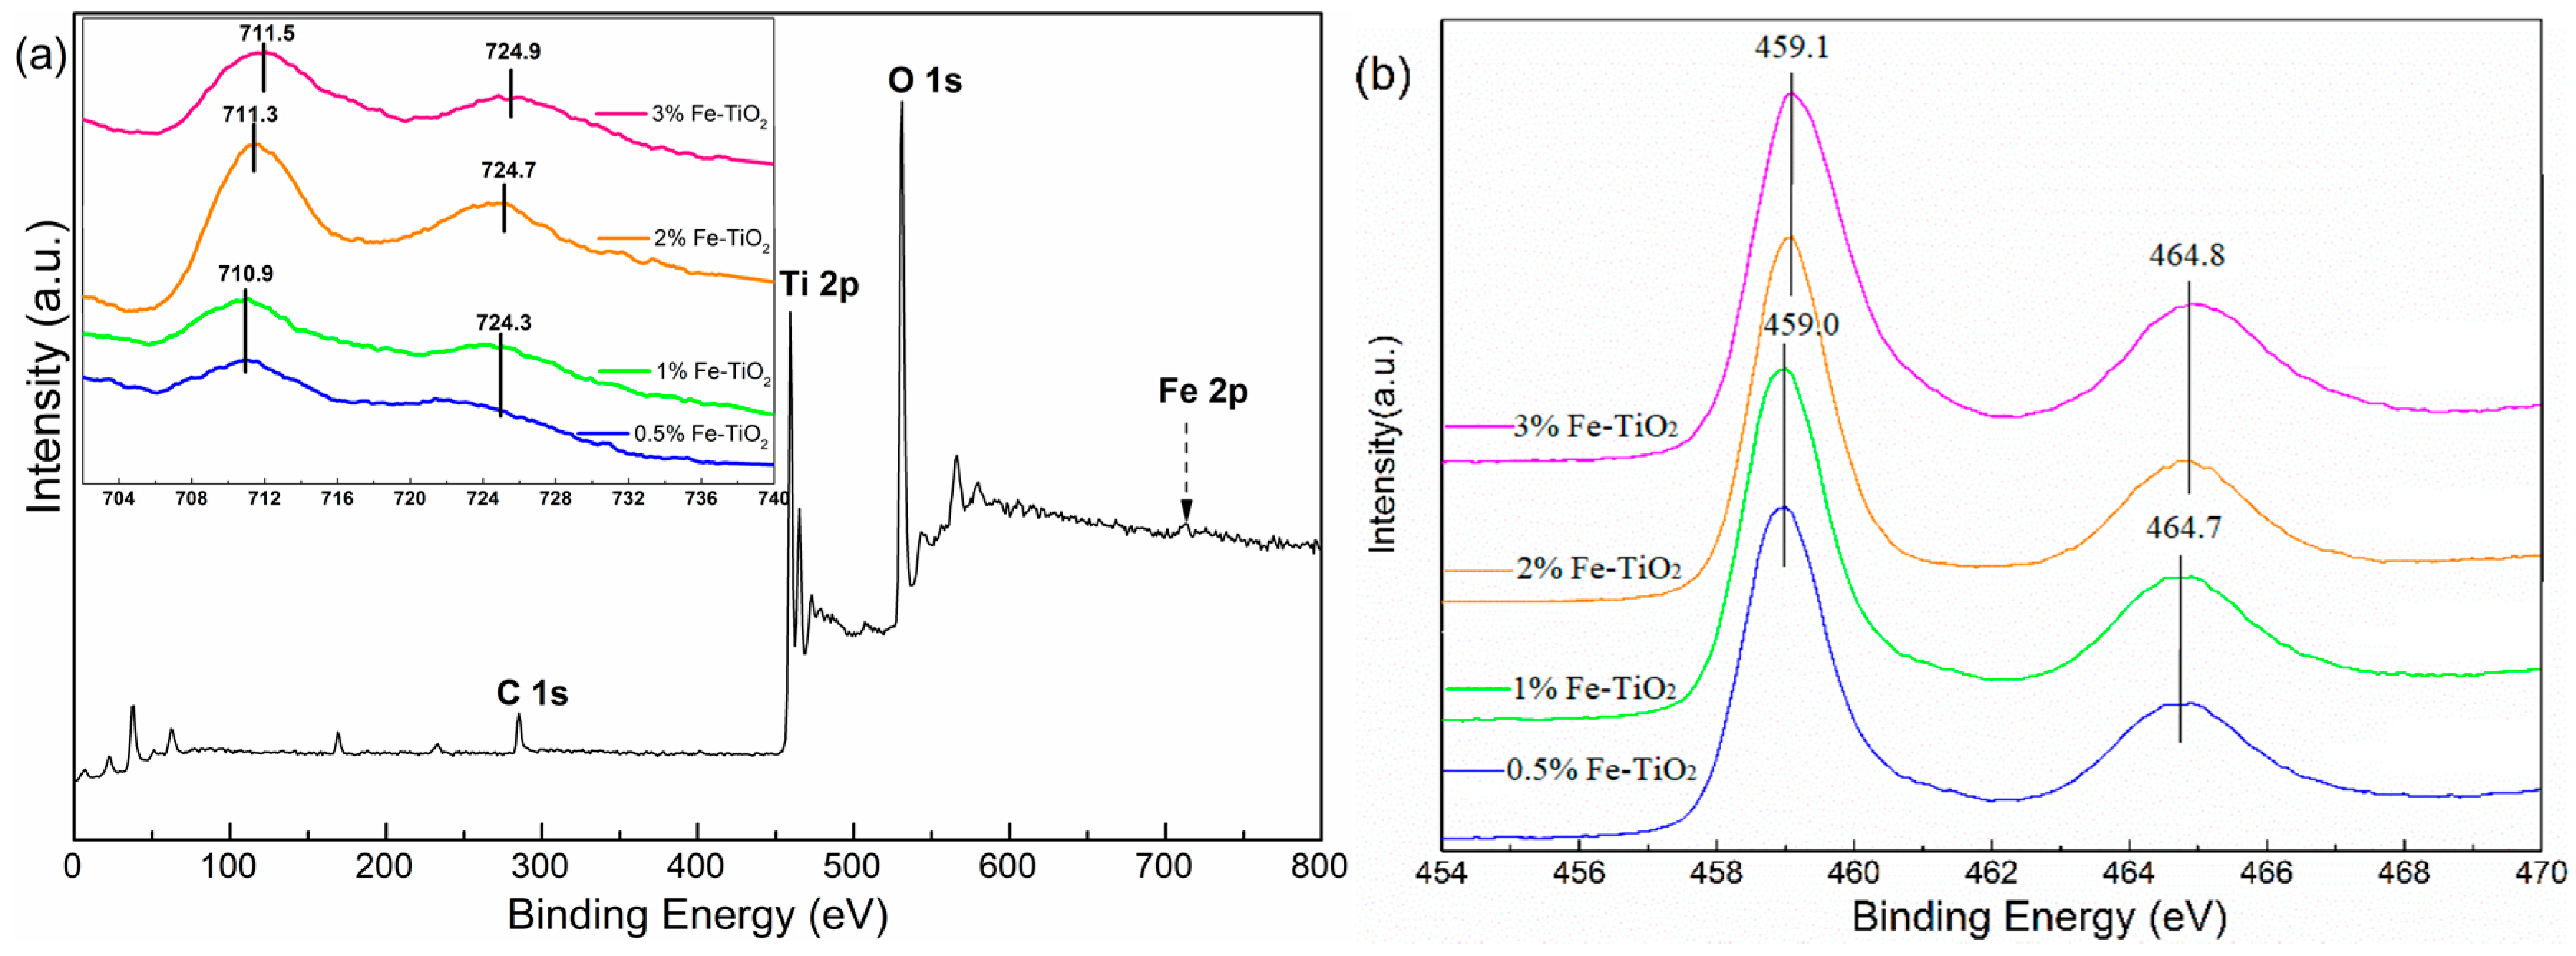
Figure 8.
Electron paramagnetic resonance (EPR) spectra of Fe-doped TiO2 samples.

Figure 9.
H2-TPR profiles of the pure and Fe-doped TiO2 samples.
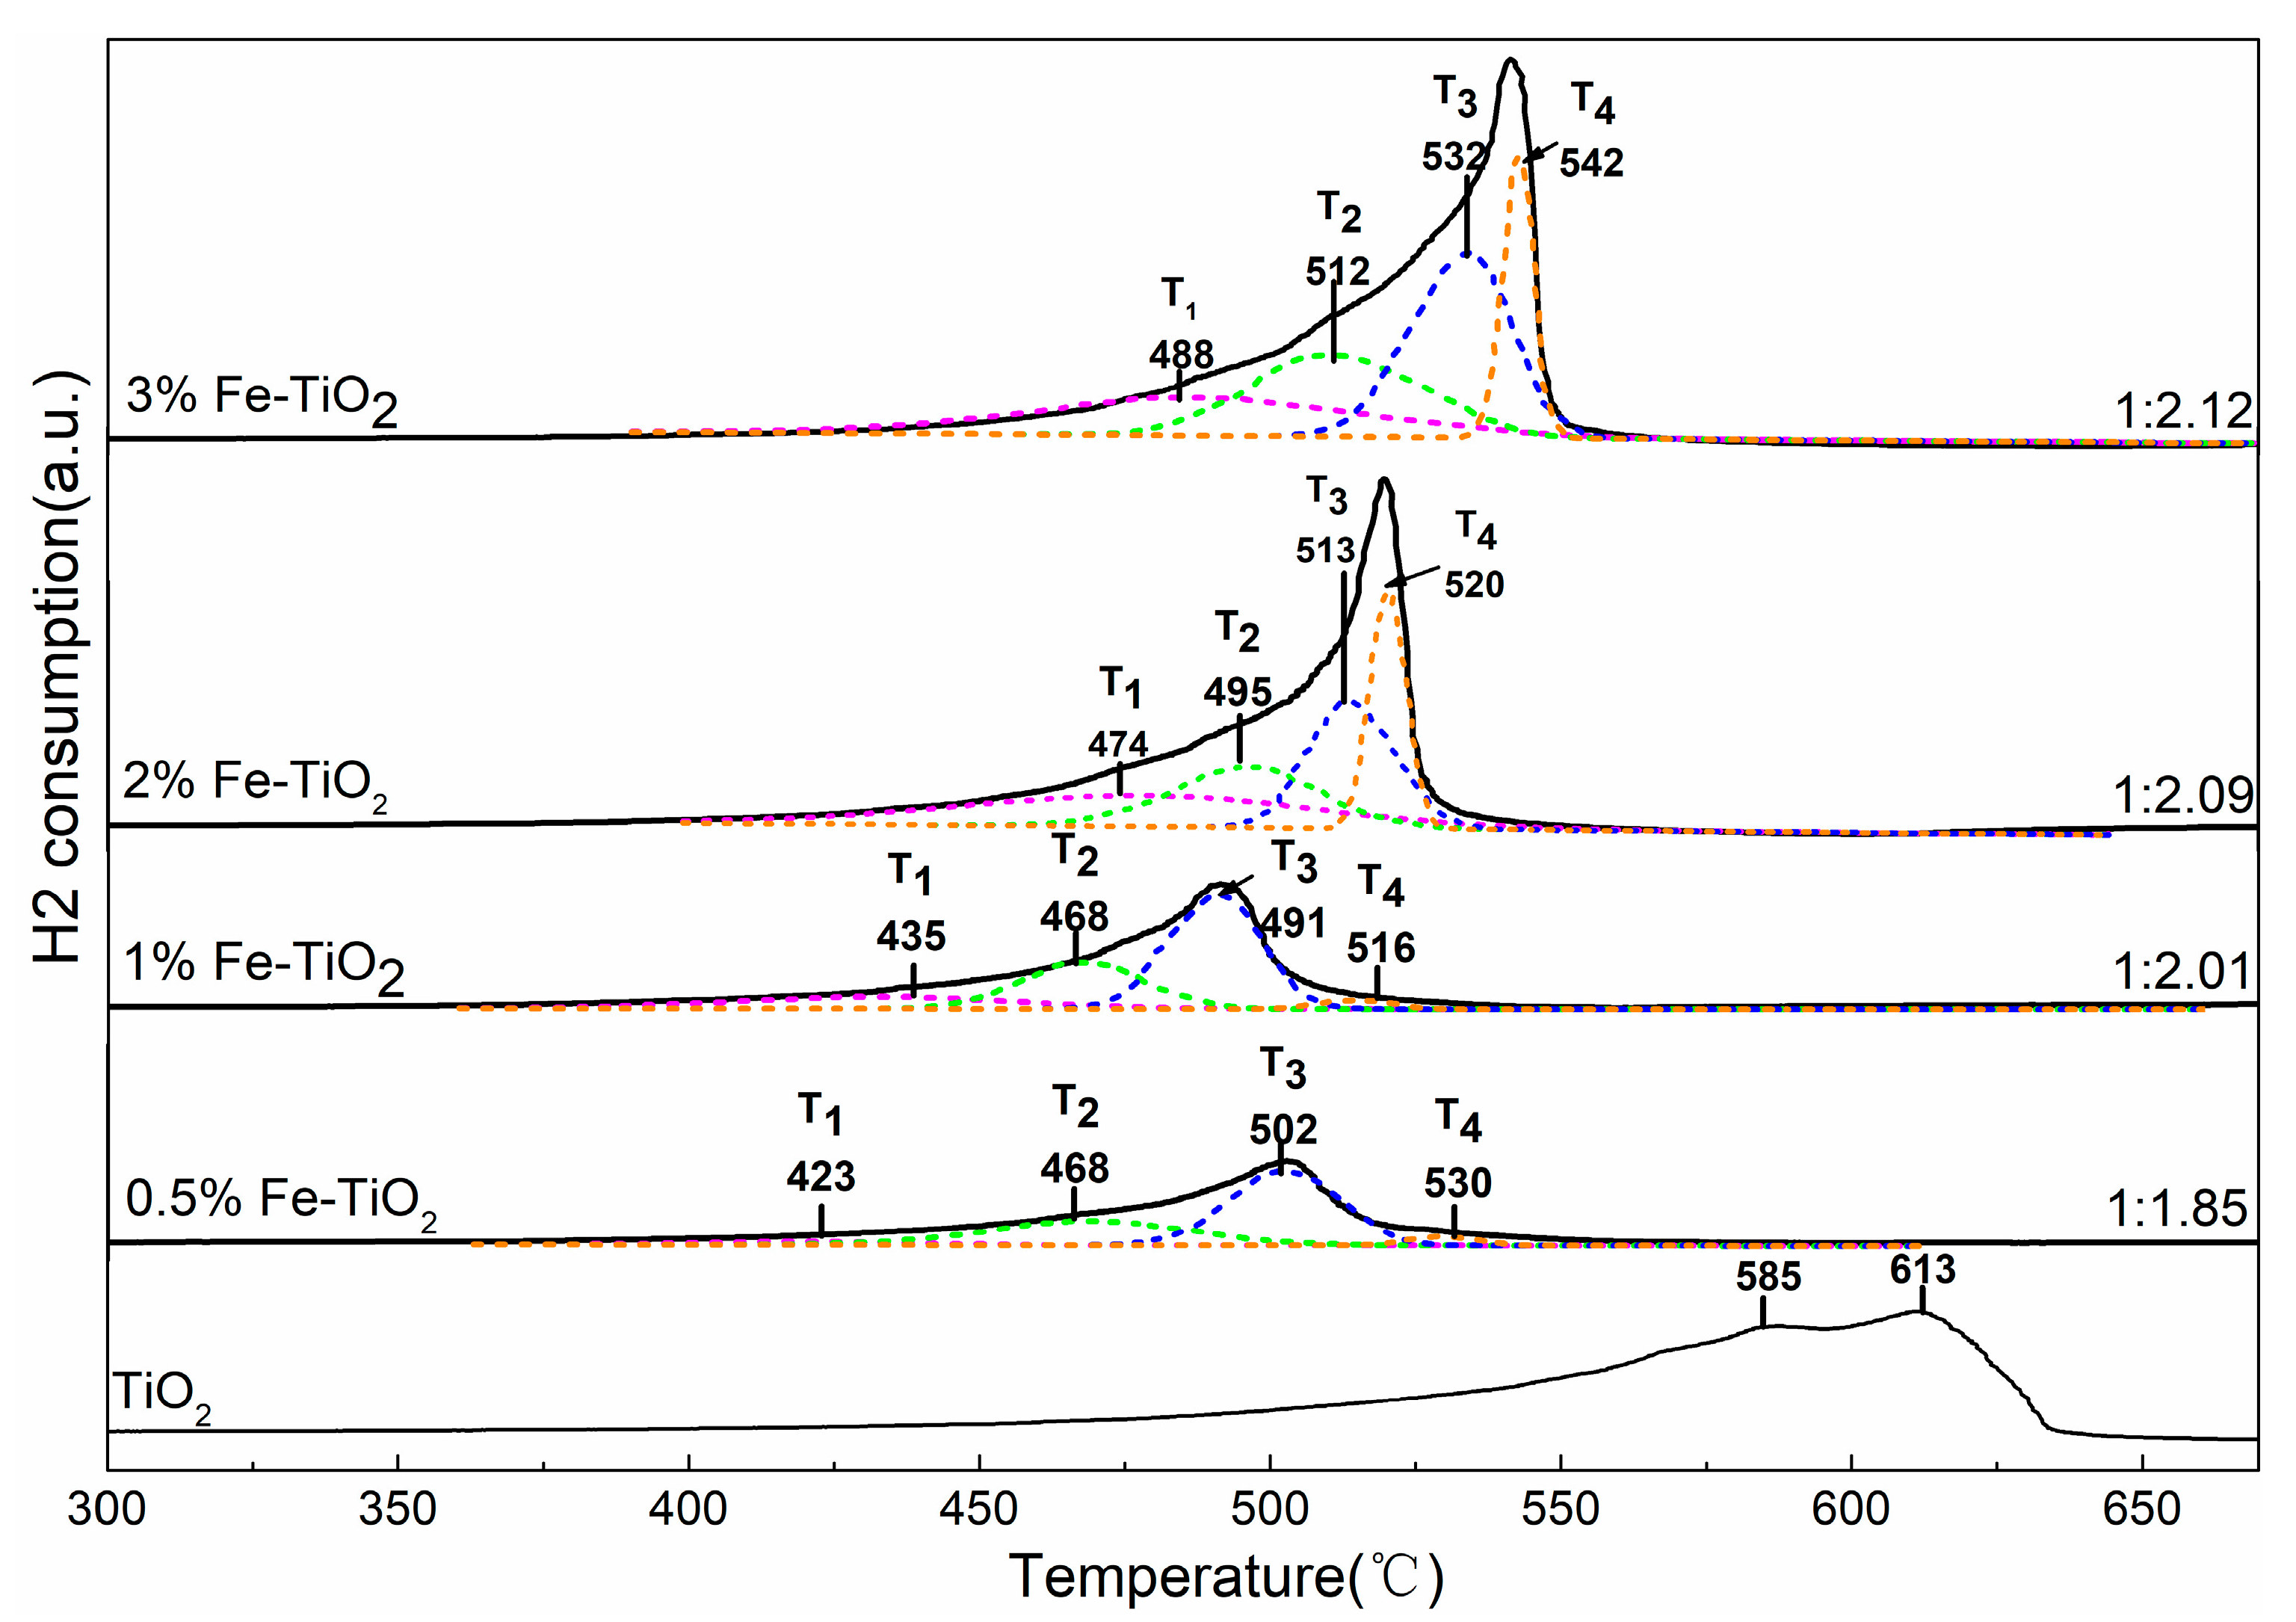
Figure 10.
EPR spectra of radical adducts with DMPO in H2O2, H2O2 + P25, H2O2 + TiO2, and H2O2 + 2% Fe/TiO2 systems.
Figure 10.
EPR spectra of radical adducts with DMPO in H2O2, H2O2 + P25, H2O2 + TiO2, and H2O2 + 2% Fe/TiO2 systems.
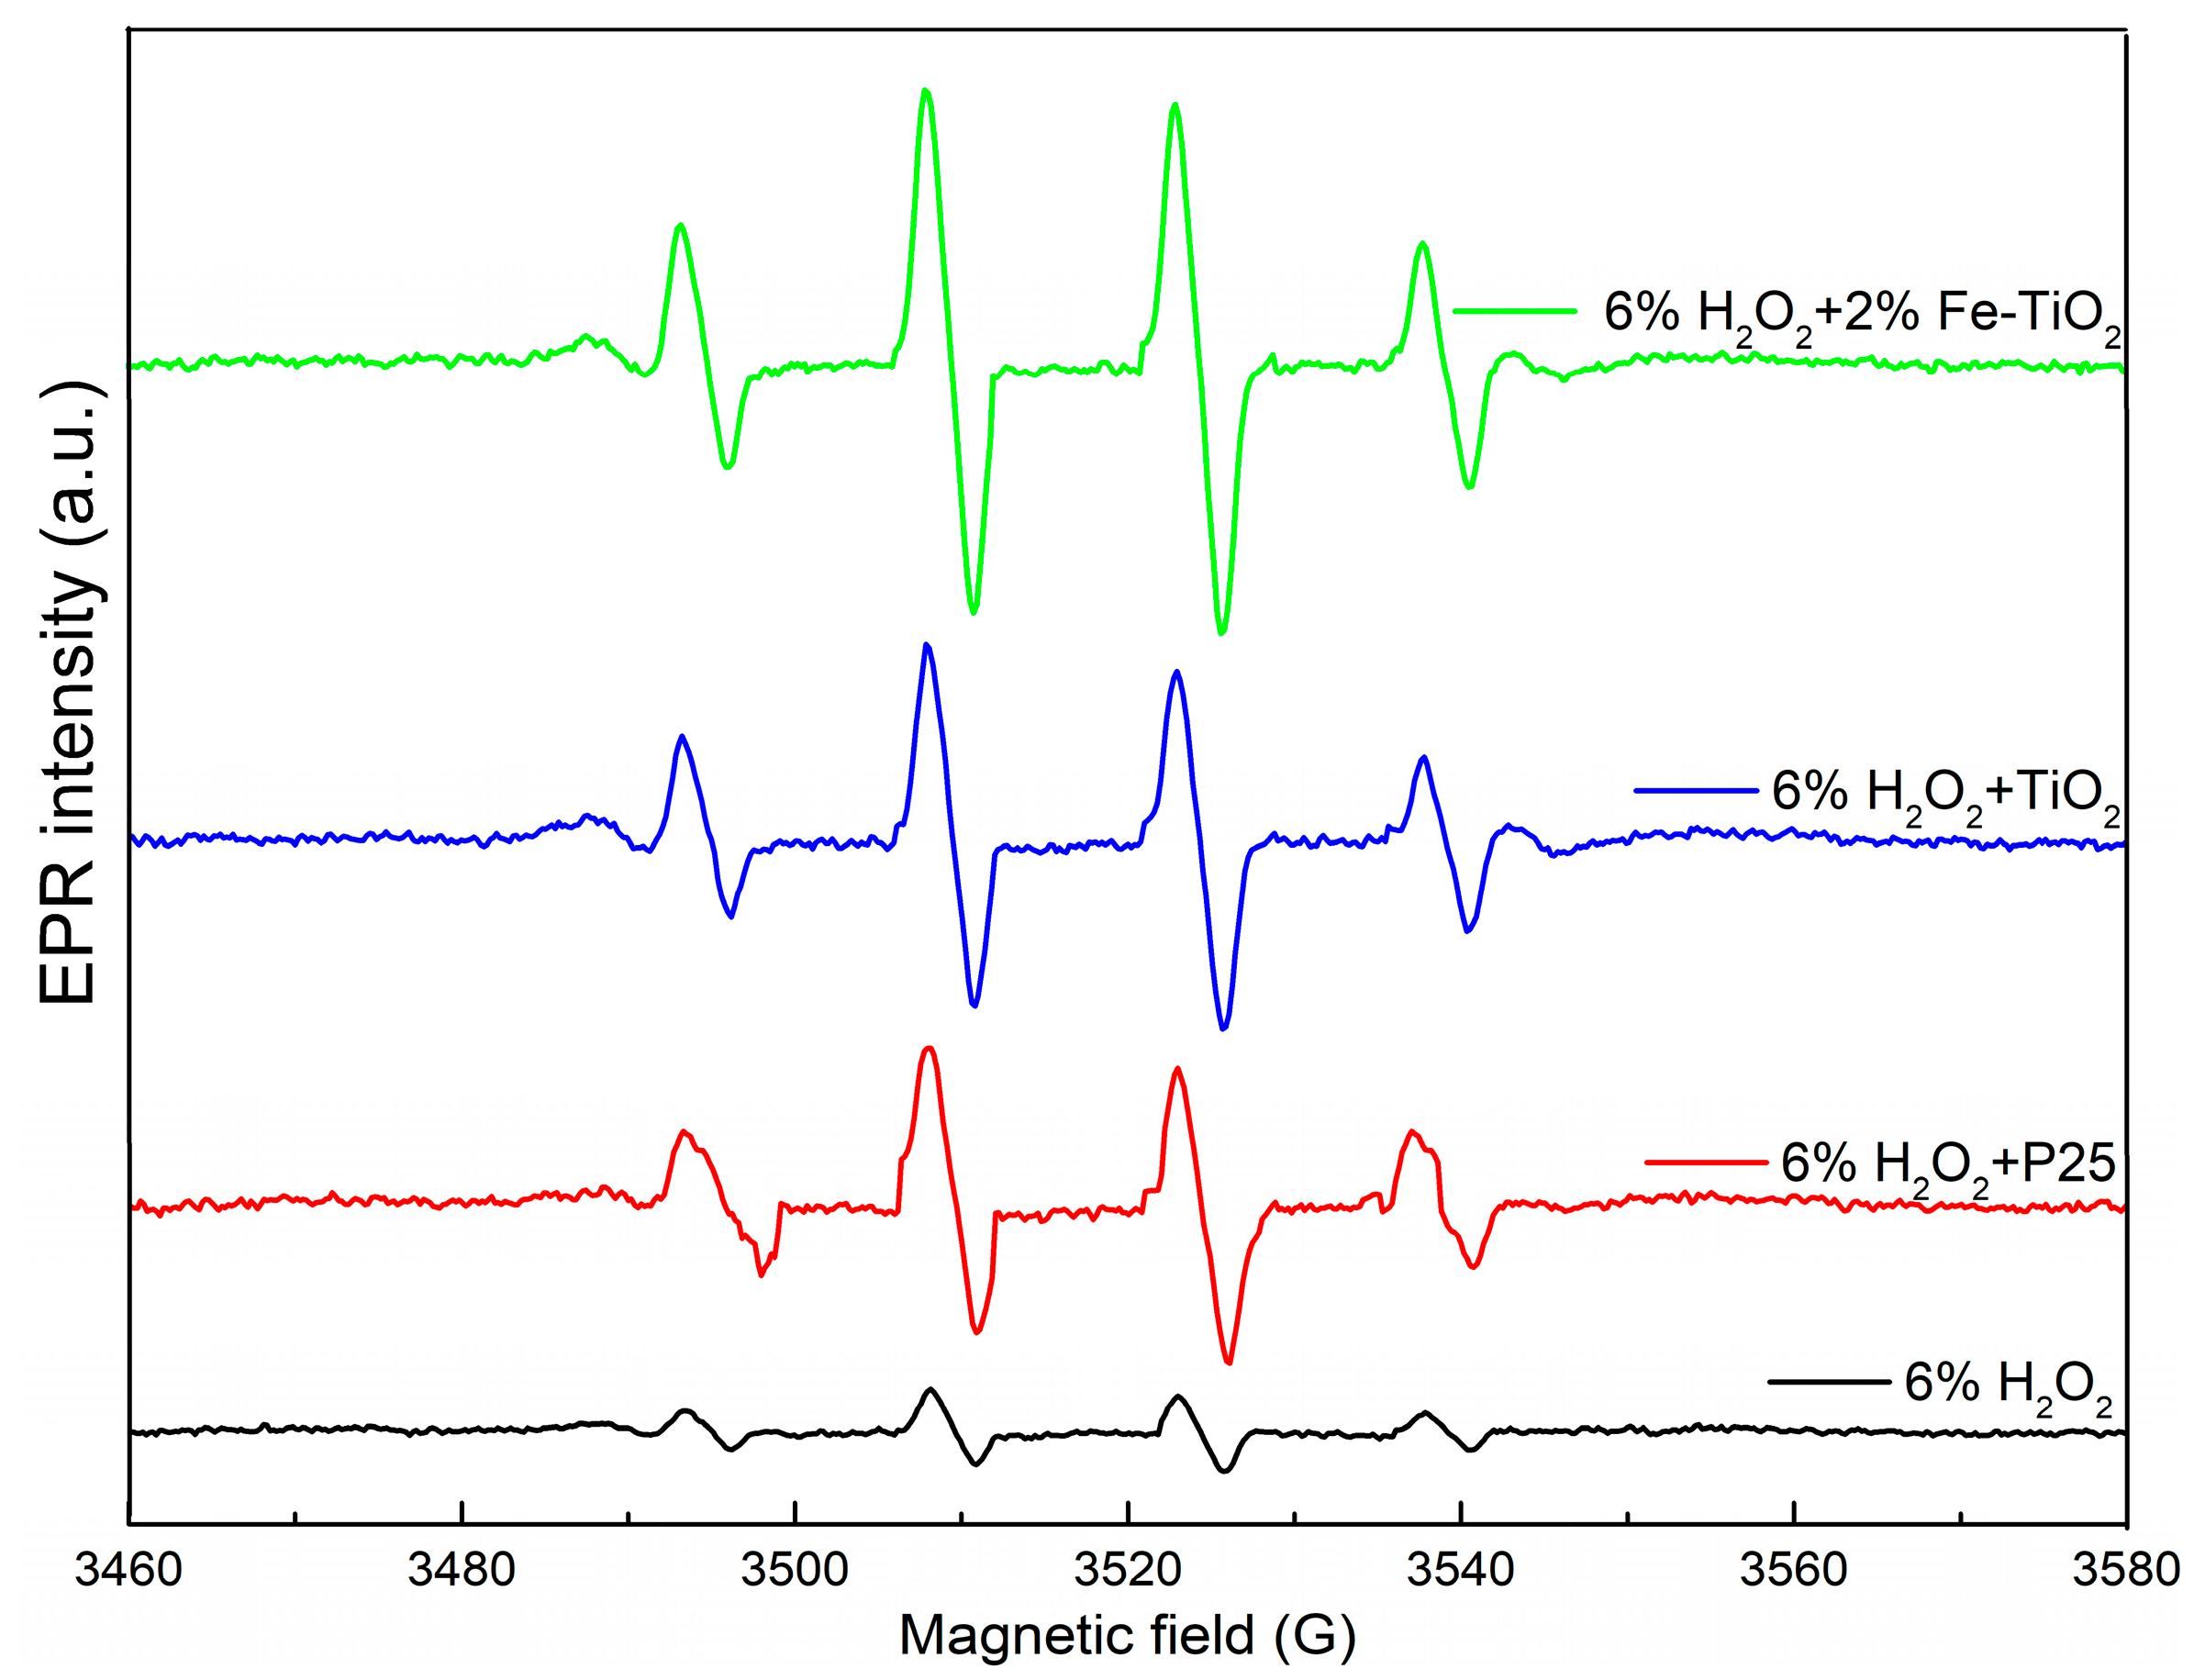
Figure 11.
(a–d) Removal efficiencies of NOX over Fe/TiO2 treated at different calcination temperatures. Conditions: H2O2/NO molar ratio: 12:1; GHSV: 60,000 h−1.
Figure 11.
(a–d) Removal efficiencies of NOX over Fe/TiO2 treated at different calcination temperatures. Conditions: H2O2/NO molar ratio: 12:1; GHSV: 60,000 h−1.

Figure 12.
Schematic diagram of the experimental setup.

Table 1.
Textural properties of the samples.
| Catalyst | Surface Area (m2·g−1) | Crystallite Size (nm) | Pore Volume (cm3·g−1) | Pore Radius (Å) |
|---|---|---|---|---|
| P25 | 36.7 | 26.23 | 0.087 | 106.1 |
| TiO2 | 98.6 | 11.16 | 0.162 | 41.3 |
| 0.5% Fe-TiO2 | 80.4 | 12.96 | 0.226 | 48.9 |
| 1% Fe-TiO2 | 92.3 | 11.75 | 0.213 | 42.8 |
| 2% Fe-TiO2 | 66.9 | 11.27 | 0.157 | 44.3 |
| 3% Fe-TiO2 | 66.4 | 10.62 | 0.079 | 25.8 |
© 2017 by the authors. Licensee MDPI, Basel, Switzerland. This article is an open access article distributed under the terms and conditions of the Creative Commons Attribution (CC BY) license (http://creativecommons.org/licenses/by/4.0/).
Share and Cite
MDPI and ACS Style
Chen, L.; Li, Y.; Zhao, Q.; Wang, Y.; Liang, Z.; Lu, Q. Removal of NOX Using Hydrogen Peroxide Vapor over Fe/TiO2 Catalysts and an Absorption Technique. Catalysts 2017, 7, 386. https://doi.org/10.3390/catal7120386
AMA Style
Chen L, Li Y, Zhao Q, Wang Y, Liang Z, Lu Q. Removal of NOX Using Hydrogen Peroxide Vapor over Fe/TiO2 Catalysts and an Absorption Technique. Catalysts. 2017; 7(12):386. https://doi.org/10.3390/catal7120386
Chicago/Turabian StyleChen, Lei, Yuxin Li, Qinxin Zhao, Yungang Wang, Zhiyuan Liang, and Qiang Lu. 2017. "Removal of NOX Using Hydrogen Peroxide Vapor over Fe/TiO2 Catalysts and an Absorption Technique" Catalysts 7, no. 12: 386. https://doi.org/10.3390/catal7120386
Note that from the first issue of 2016, this journal uses article numbers instead of page numbers. See further details here.