Article

Photocatalytic TiO2 Nanorod Spheres and Arrays Compatible with Flexible Applications

i3N/CENIMAT, Department of Materials Science, Faculty of Sciences and Technology, Universidade NOVA de Lisboa and CEMOP/UNINOVA, 2829-516 Campus de Caparica, Caparica, Portugal
*
Authors to whom correspondence should be addressed.
Catalysts 2017, 7(2), 60; https://doi.org/10.3390/catal7020060
Submission received: 29 December 2016 / Revised: 31 January 2017 / Accepted: 7 February 2017 / Published: 14 February 2017
(This article belongs to the Special Issue Titanium Dioxide Photocatalysis)

Abstract

:
In the present study, titanium dioxide nanostructures were synthesized through microwave irradiation. In a typical microwave synthesis, nanorod spheres in the powder form were simultaneously produced with nanorod arrays grown on polyethylene terephthalate (PET) substrates. The syntheses were performed in water or ethanol with limited temperature at 80 °C and 200 °C. A simple and low-cost approach was used for the arrays growth, which involved a PET substrate with a zinc oxide seed layer deposited by spin-coating. X-ray diffraction (XRD) and Raman spectroscopy revealed that synthesis in water result in a mixture of brookite and rutile phases, while using ethanol as solvent it was only observed the rutile phase. Scanning electron microscopy (SEM) showed that the synthesized spheres were in the micrometer range appearing as aggregates of fine nanorods. The arrays maintained the sphere nanorod aggregate structures and the synthesis totally covered the flexible substrates. Transmission electron microscopy (TEM) was used to identify the brookite structure. The optical band gaps of all materials have been determined from diffuse reflectance spectroscopy. Photocatalytic activity was assessed from rhodamine B degradation with remarkable degradability performance under ultraviolet (UV) radiation. Reusability experiments were carried out for the best photocatalyst, which also revealed notable photocatalytic activity under solar radiation. The present study is an interesting and competitive alternative for the photocatalysts existing nowadays, as it simultaneously results in highly photoactive powders and flexible materials produced with low-cost synthesis routes such as microwave irradiation.

Graphical Abstract

1. Introduction

Titanium dioxide (TiO2) has been extensively studied for applications ranging from sensors [1,2] to dye-solar cells [3]. However, recently, this material has been widely used as photocatalyst agents [4,5,6,7,8,9,10]. The great interest in TiO2 as photocatalyst is related to its low-cost, non-toxicity, high stability and photoactivity, and earth-abundance [5,6,7,11,12,13,14,15]. TiO2 commonly appears in the amorphous form or as three distinct crystalline phases: two tetragonal ones, anatase and rutile, and as an orthorhombic phase, brookite [16]. From these crystalline phases, rutile is the most stable, while anatase and brookite are metastable and can be converted to rutile upon heating [17]. Moreover, TiO2 typically exhibits n-type semiconductor character, displaying optical band gaps of 3.0 and 3.2 eV for rutile and anatase, respectively [18]. The band gap values reported for brookite in the literature are varied, and range from 3.13 to 3.40 eV [17,18].
TiO2 is usually used as a photocatalyst in the forms of anatase and rutile [19,20,21,22]. Recently, it has been found that the mixture of both phases displayed higher photocatalytic activity than pure phases [23]. Brookite, in contrast, is not explored for photocatalytic applications; as the other TiO2 crystalline phases, however, the interest on this material has been growing lately [17,24,25]. For these materials to act as photocatalysts, redox reactions on their surface must occur [5]. In general, the photocatalytic degradation will occur when TiO2 is exposed to radiation with higher energy than its band gap, creating electron–hole pairs. Then, electrons in the conduction band generate superoxides [26], while holes create hydroxyl radicals [5,27] which will decompose organic and inorganic compounds [28].
The improved photocatalytic activity of materials relies on several factors, in which the most expressive ones are crystal size, crystalline phase, specific surface area, impurities and exposed surface facets [5,6]. Several TiO2 micro- and nanomaterials with numerous shapes, such as sheets [29], spheres [30], rods [31], plumes [32], and wires [33], have been reported for photocatalytic applications. Moreover, it has been previously reported that multi-scaled structures, such as nanorods in micro-spheres, are promising for improving photocatalytic activity [34], since they combine the higher surface/volume ratio of nanorods, which results in higher density of active sites for surface reactions [35,36] to the micrometer size of spheres that can be easily recycled due to the enhanced intrinsic weight sedimentation ability [34]. TiO2 photocatalysts in the form of films or arrays are also frequently used, avoiding the recycling processes [5]. However, the films are often grown or deposited on rigid substrates [37], which limits their application on adaptable surfaces and increases production costs.
Several physical and chemical techniques have been reported to produce TiO2 nanostructures, arrays and films over the years [38]. These techniques include sol-gel method [39], atomic layer deposition [40], thermal evaporation [41], sputtering [42], hydrothermal and solvothermal synthesis [43,44,45,46], and microwave irradiation [5]. Indeed, microwave synthesis appears as a viable and inexpensive option for the TiO2 production due to its intrinsic characteristics and by the fact that it relies on the efficient heating of solvents and/or reagents [47], providing accurate temperature control, celerity, enhanced efficiency/cost balance [47,48,49,50] and uniformity [51]. Nevertheless, the type of solvent employed in microwave-assisted routes is a key parameter [47,52]. Several metal oxide-based materials have been synthesized under microwave irradiation, producing well-defined structures and morphologies, and specific phases or compositions with high purity [5,50,52,53,54,55,56].
The present work reports the production and photocatalytic activity of TiO2 nanorod spheres and nanorod arrays grown on PET, both simultaneously synthesized under microwave irradiation with water or ethanol as solvents, and where the synthesis temperature was fixed. The aim is to challenge the present state of the art concerning the exploitation of an easy, environmentally friendly, low-cost sustainable and reliable approach to produce improved TiO2 photocatalysts both in the powder form as micro-sized particles easily recycled and as uniform arrays on PET substrates that can be adaptable to different surfaces such as the ones required for water/wastewater treatment. Moreover, to the best of the author’s knowledge, TiO2 arrays grown at low temperatures on ZnO seeded PET substrates using inexpensive synthesis and seed deposition routes without any process to increase the PET adhesion to TiO2 has never been reported before. It is also intended to offer options to commercial TiO2 photocatalyst materials in the powder form, which normally presents limitations, especially in recovery due to its nanometer size (~30 nm) [20]. Structural and morphologic characterizations of the microwave synthesized materials have been carried out by X-ray diffraction (XRD), Raman spectroscopy, scanning electron microscopy (SEM) coupled with energy dispersive X-ray spectroscopy (EDS) and transmission electron microscopy (TEM). Optical properties were assessed through diffuse reflectance spectroscopy, and the photocatalytic activity has been evaluated from the evolution of rhodamine B degradation under ultraviolet (UV) and solar radiations. Rhodamine B was considered as a model-test contaminant and indicator due to its photocatalytic activity and absorption peaks in the visible range, thus its degradation can be easily monitored by optical absorption spectroscopy.

2. Results and Discussion

TiO2 nanorod spheres and arrays were synthesized under microwave irradiation using two distinct solvents and fixing the synthesis temperature to understand the influence of these parameters on the material properties and final photocatalytic behavior. Following an easy and low-cost approach, the TiO2 nanorod arrays were grown on seeded flexible substrates at low temperature, which opens to the possibility of employing these materials to a broad range of applications.

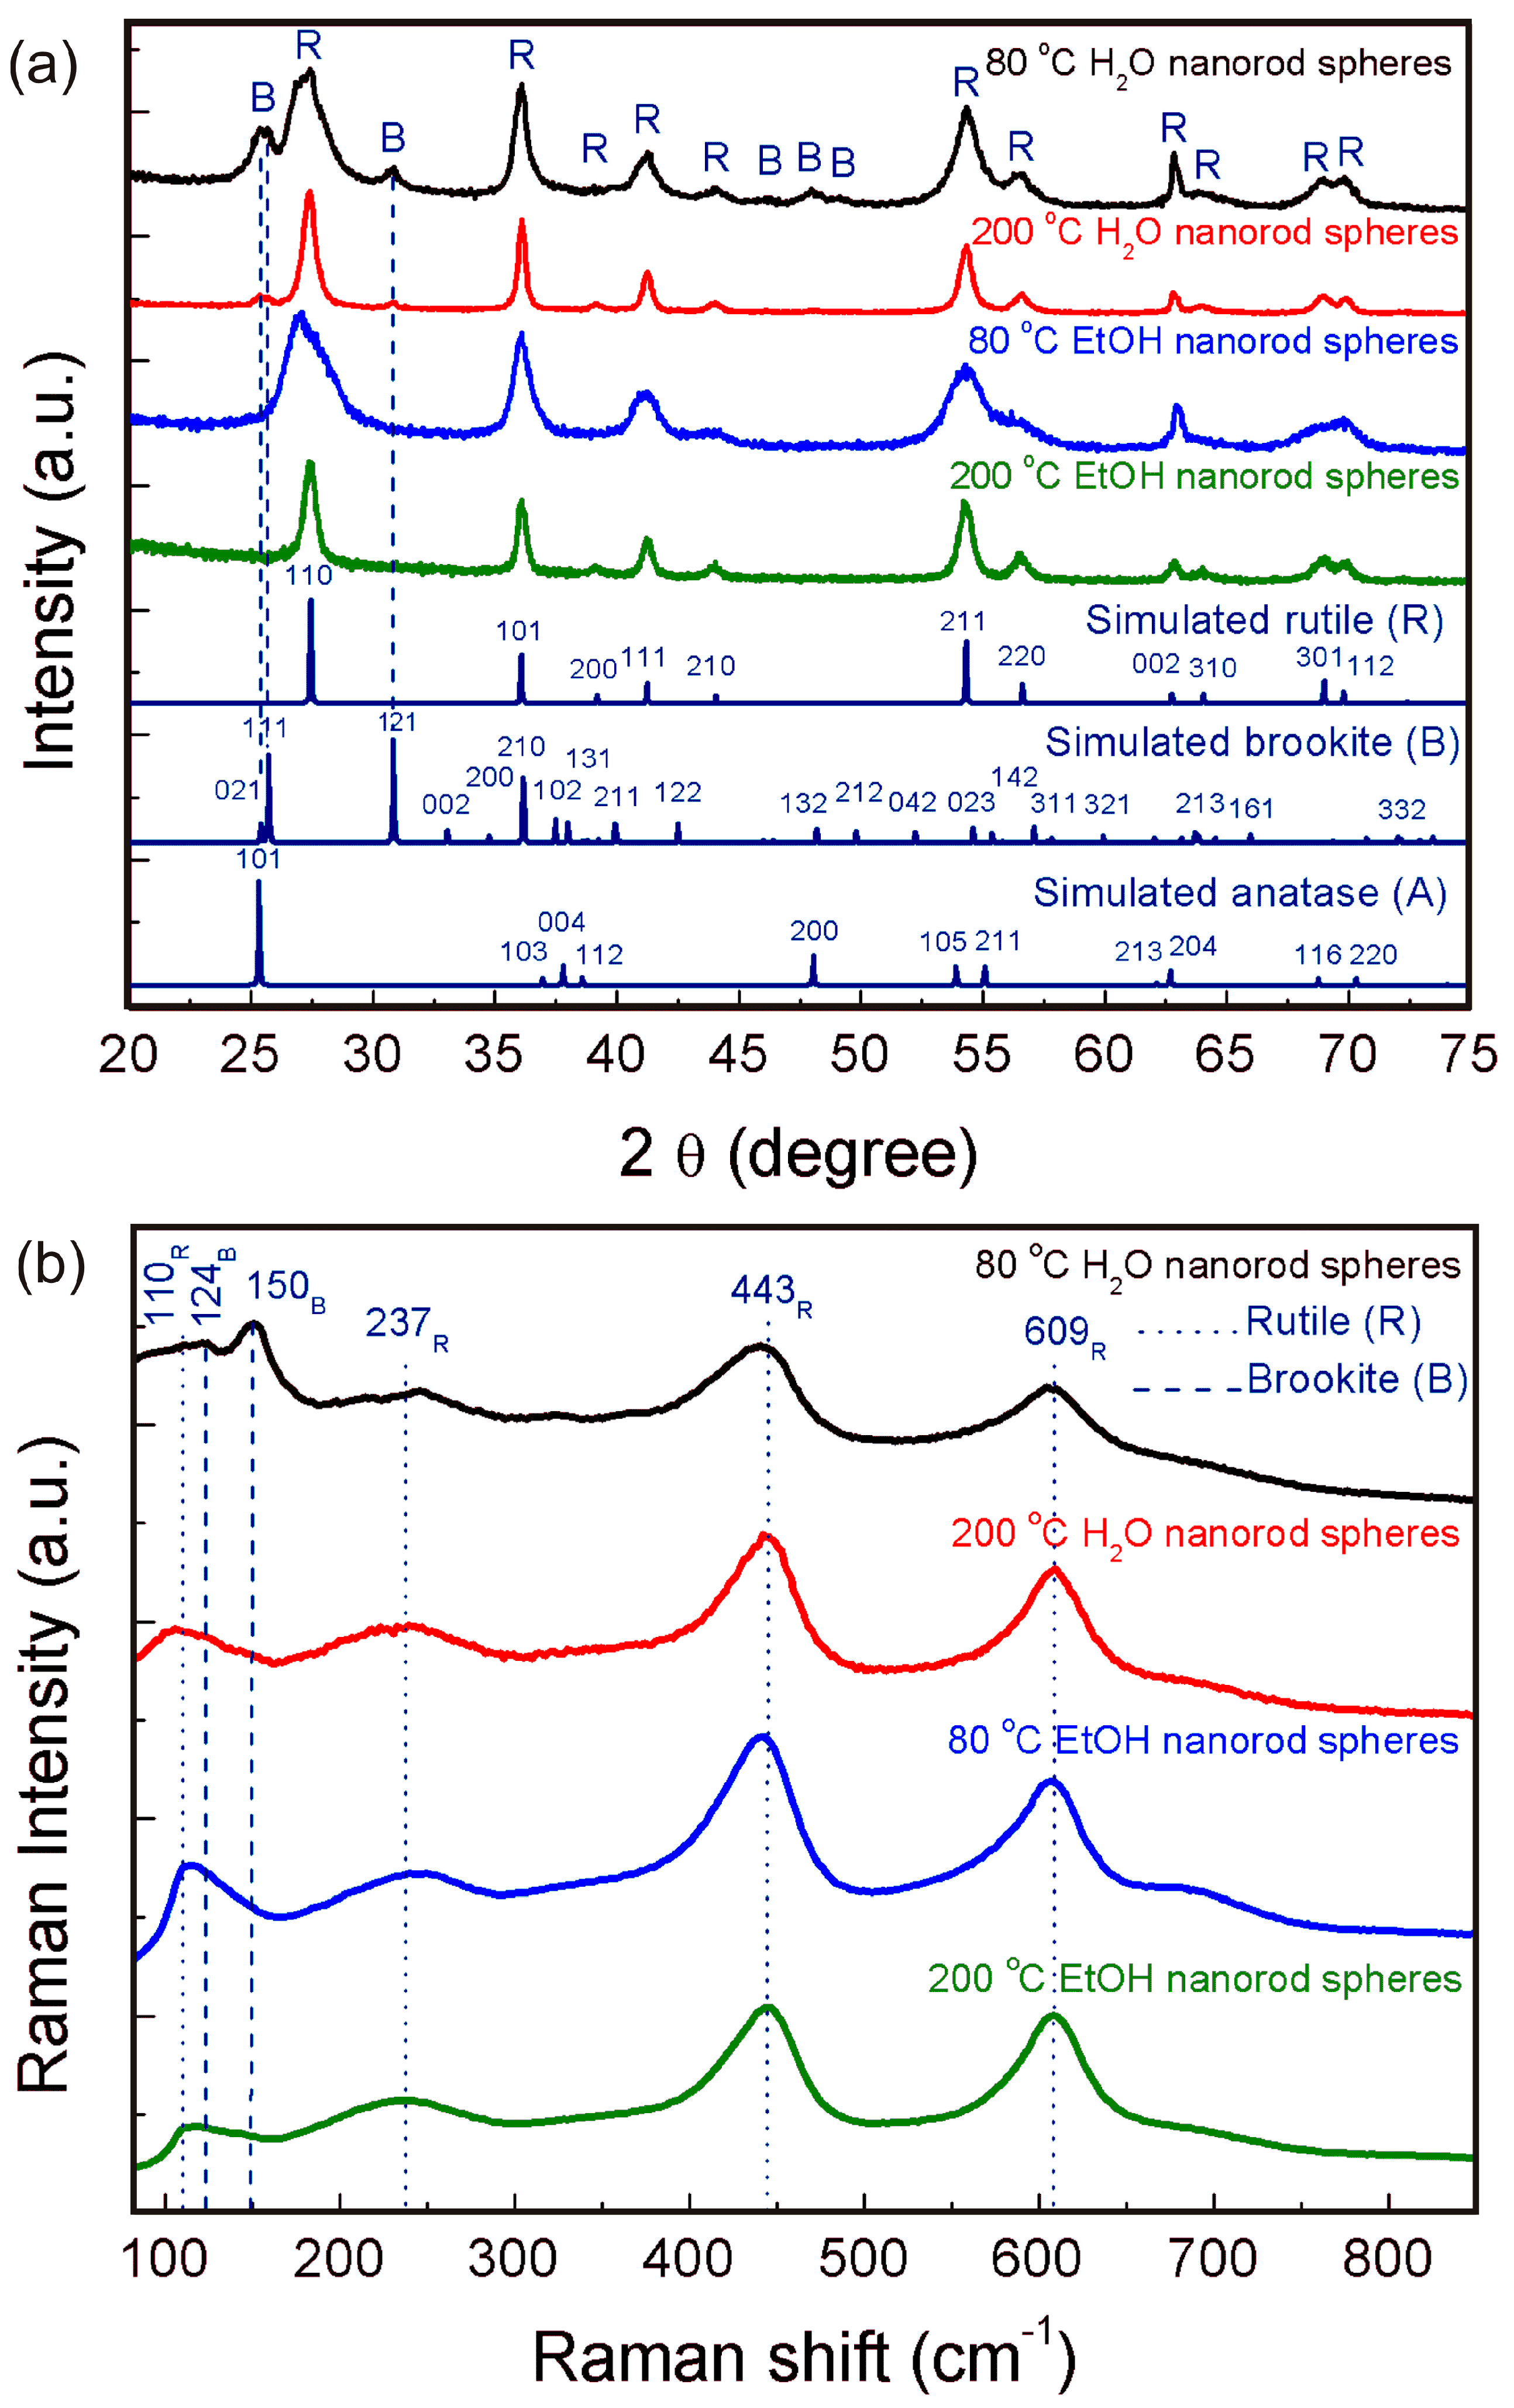
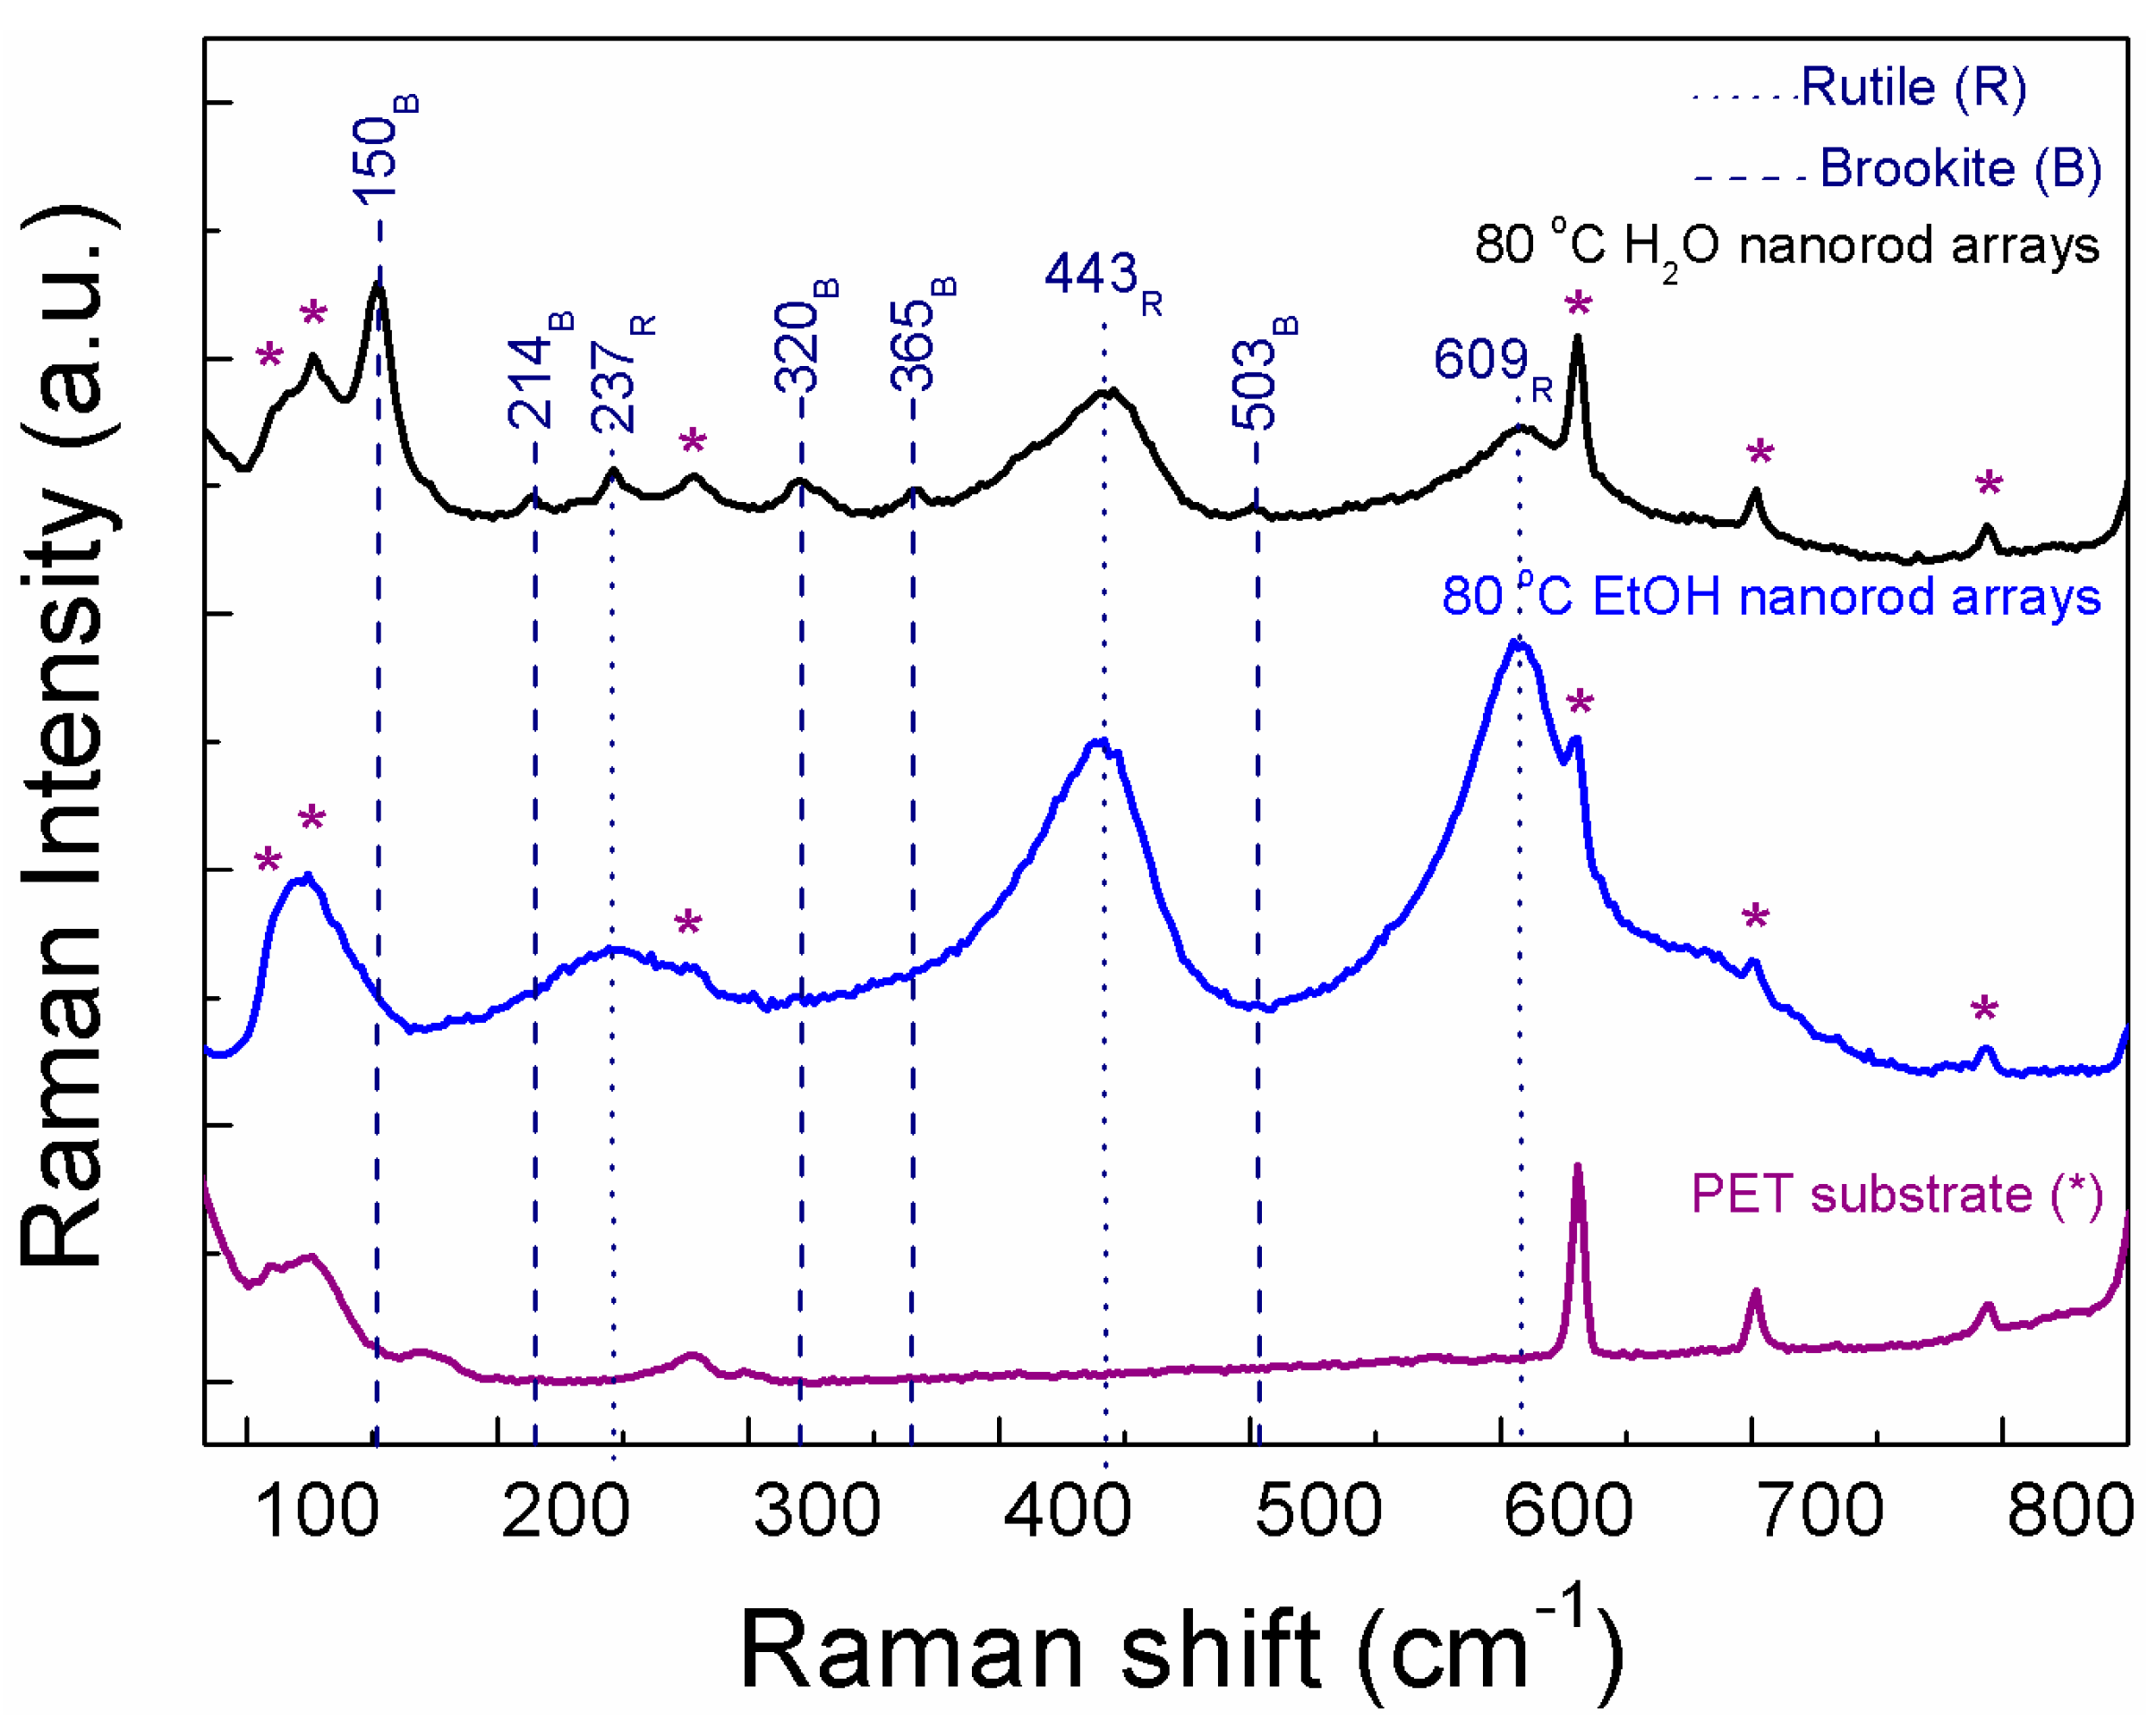
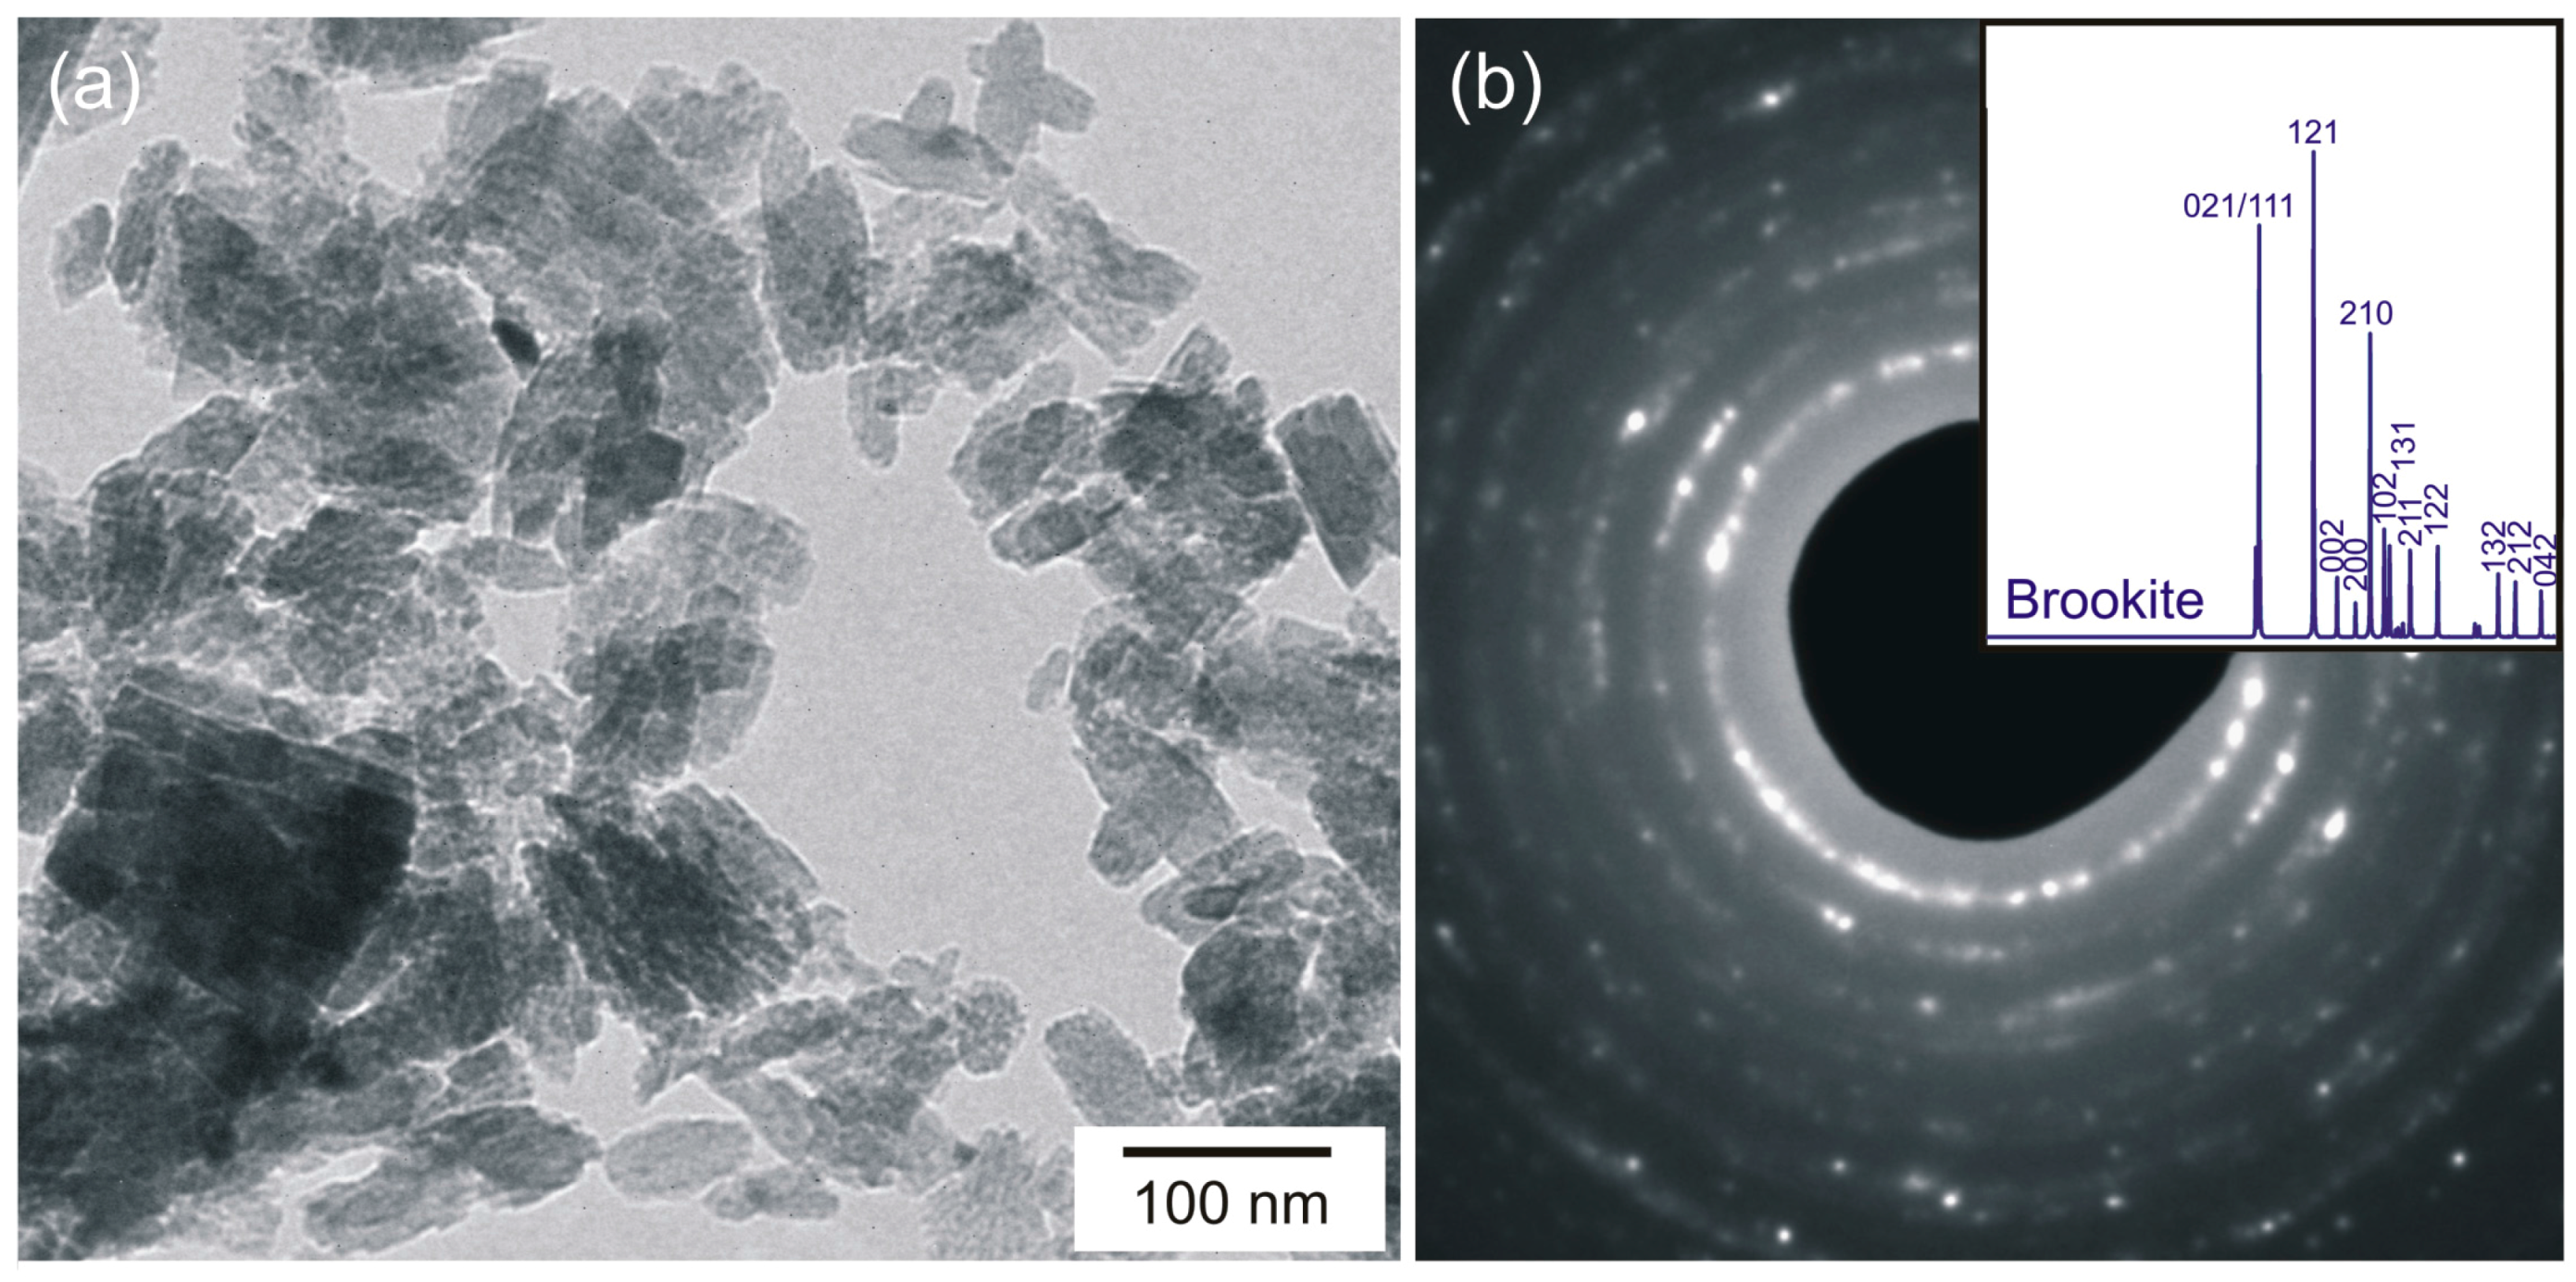
2.1. X-ray Diffraction and Raman Spectroscopy

Figure 1a shows powder diffractograms of the nanorod spheres (powder) synthesized using water and ethanol as solvents and with synthesis temperature of 80 °C and 200 °C. The solvent clear influences the final TiO2 phase of the materials produced. All peaks in the experimental diffractograms could be assigned to either brookite or rutile depending on the synthesis conditions used. The materials synthesized with water showed a mixture of brookite and rutile phases, with higher amounts of brookite to the 80 °C H2O material (53% of brookite (ICDD file No. 01-076-1937) and 47% of rutile (ICSD file No. 96-900-4143)). The 200 °C H2O material resulted in a proportion of 26% of brookite to 74% of rutile. The fact that higher temperatures resulted in lower amounts of brookite is due to a temperature threshold where all the brookite phase is converted into rutile [17]. Lower temperatures form higher amounts of brookite, and higher temperatures form rutile-rich structures. Both materials synthesized with ethanol formed single phased materials fully assigned to rutile. The use of ethanol has been reported previously to form rutile-rich nanostructures [57,58]. No peaks associated to impurities such as Ti(OH)4 were detected and all the peaks suggest that the materials are well crystallized. The broad width observed for the materials synthesized at 80 °C suggests the presence of small sized particles.
Raman measurements were also carried out (Figure 1b), as this technique allows distinguishing between TiO2 phases [59]. Raman spectra confirmed the presence of both brookite and rutile for the 80 °C H2O nanorod spheres. The Raman bands associated to rutile were also discernible for the 80 °C condition. Nevertheless, for the 200 °C condition, the phase mostly present is rutile. The nanorod spheres synthesized with ethanol revealed only the presence of the rutile phase for both the 80 °C and 200 °C conditions. The Raman bands associated to rutile can be assigned to B1g (110 cm−1), Eg (237 and 443 cm−1) and A1g (609 cm−1), respectively, while the Raman bands of brookite can be assigned to A1g (124, 150, 198 cm−1), B1g (214 and 278 cm−1), B2g (365 cm−1), and B3g (320 cm−1) [59]. For all conditions, the characteristic Raman band of ~518 cm−1 [59] associated to the presence of anatase was not detected, confirming the XRD results. No additional bands could be found in both spectra.
XRD measurements of the TiO2 arrays were not presented due to the broad and intense peaks coming from the substrate which obscured the TiO2 signal, nevertheless from Raman spectra, the TiO2 phases present at each material could be identified (Figure 2). The Raman spectrum from the PET substrate is presented for comparison. From the PET bands on both Raman spectra, it is possible to infer that the 80 °C EtOH nanorod arrays are thicker or denser than the ones synthesized with water (the PET bands (*) are more expressive on the 80 °C H2O material). Raman spectrum of the 80 °C H2O nanorod arrays confirmed the presence of both brookite and rutile for this material in accordance to the nanorod sphere results (see Figure 1a,b). The 80 °C EtOH revealed to be a single phased material fully assigned to rutile, such as the nanorod spheres (see Figure 1a,b). Some of the TiO2 Raman bands were overlapped by the PET bands, however the ones without overlapping were in accordance to the TiO2 Raman bands detected for the powder materials. Raman bands coming from the ZnO seed layer were not identified, nevertheless some ZnO Raman bands overlap with TiO2 ones [52].

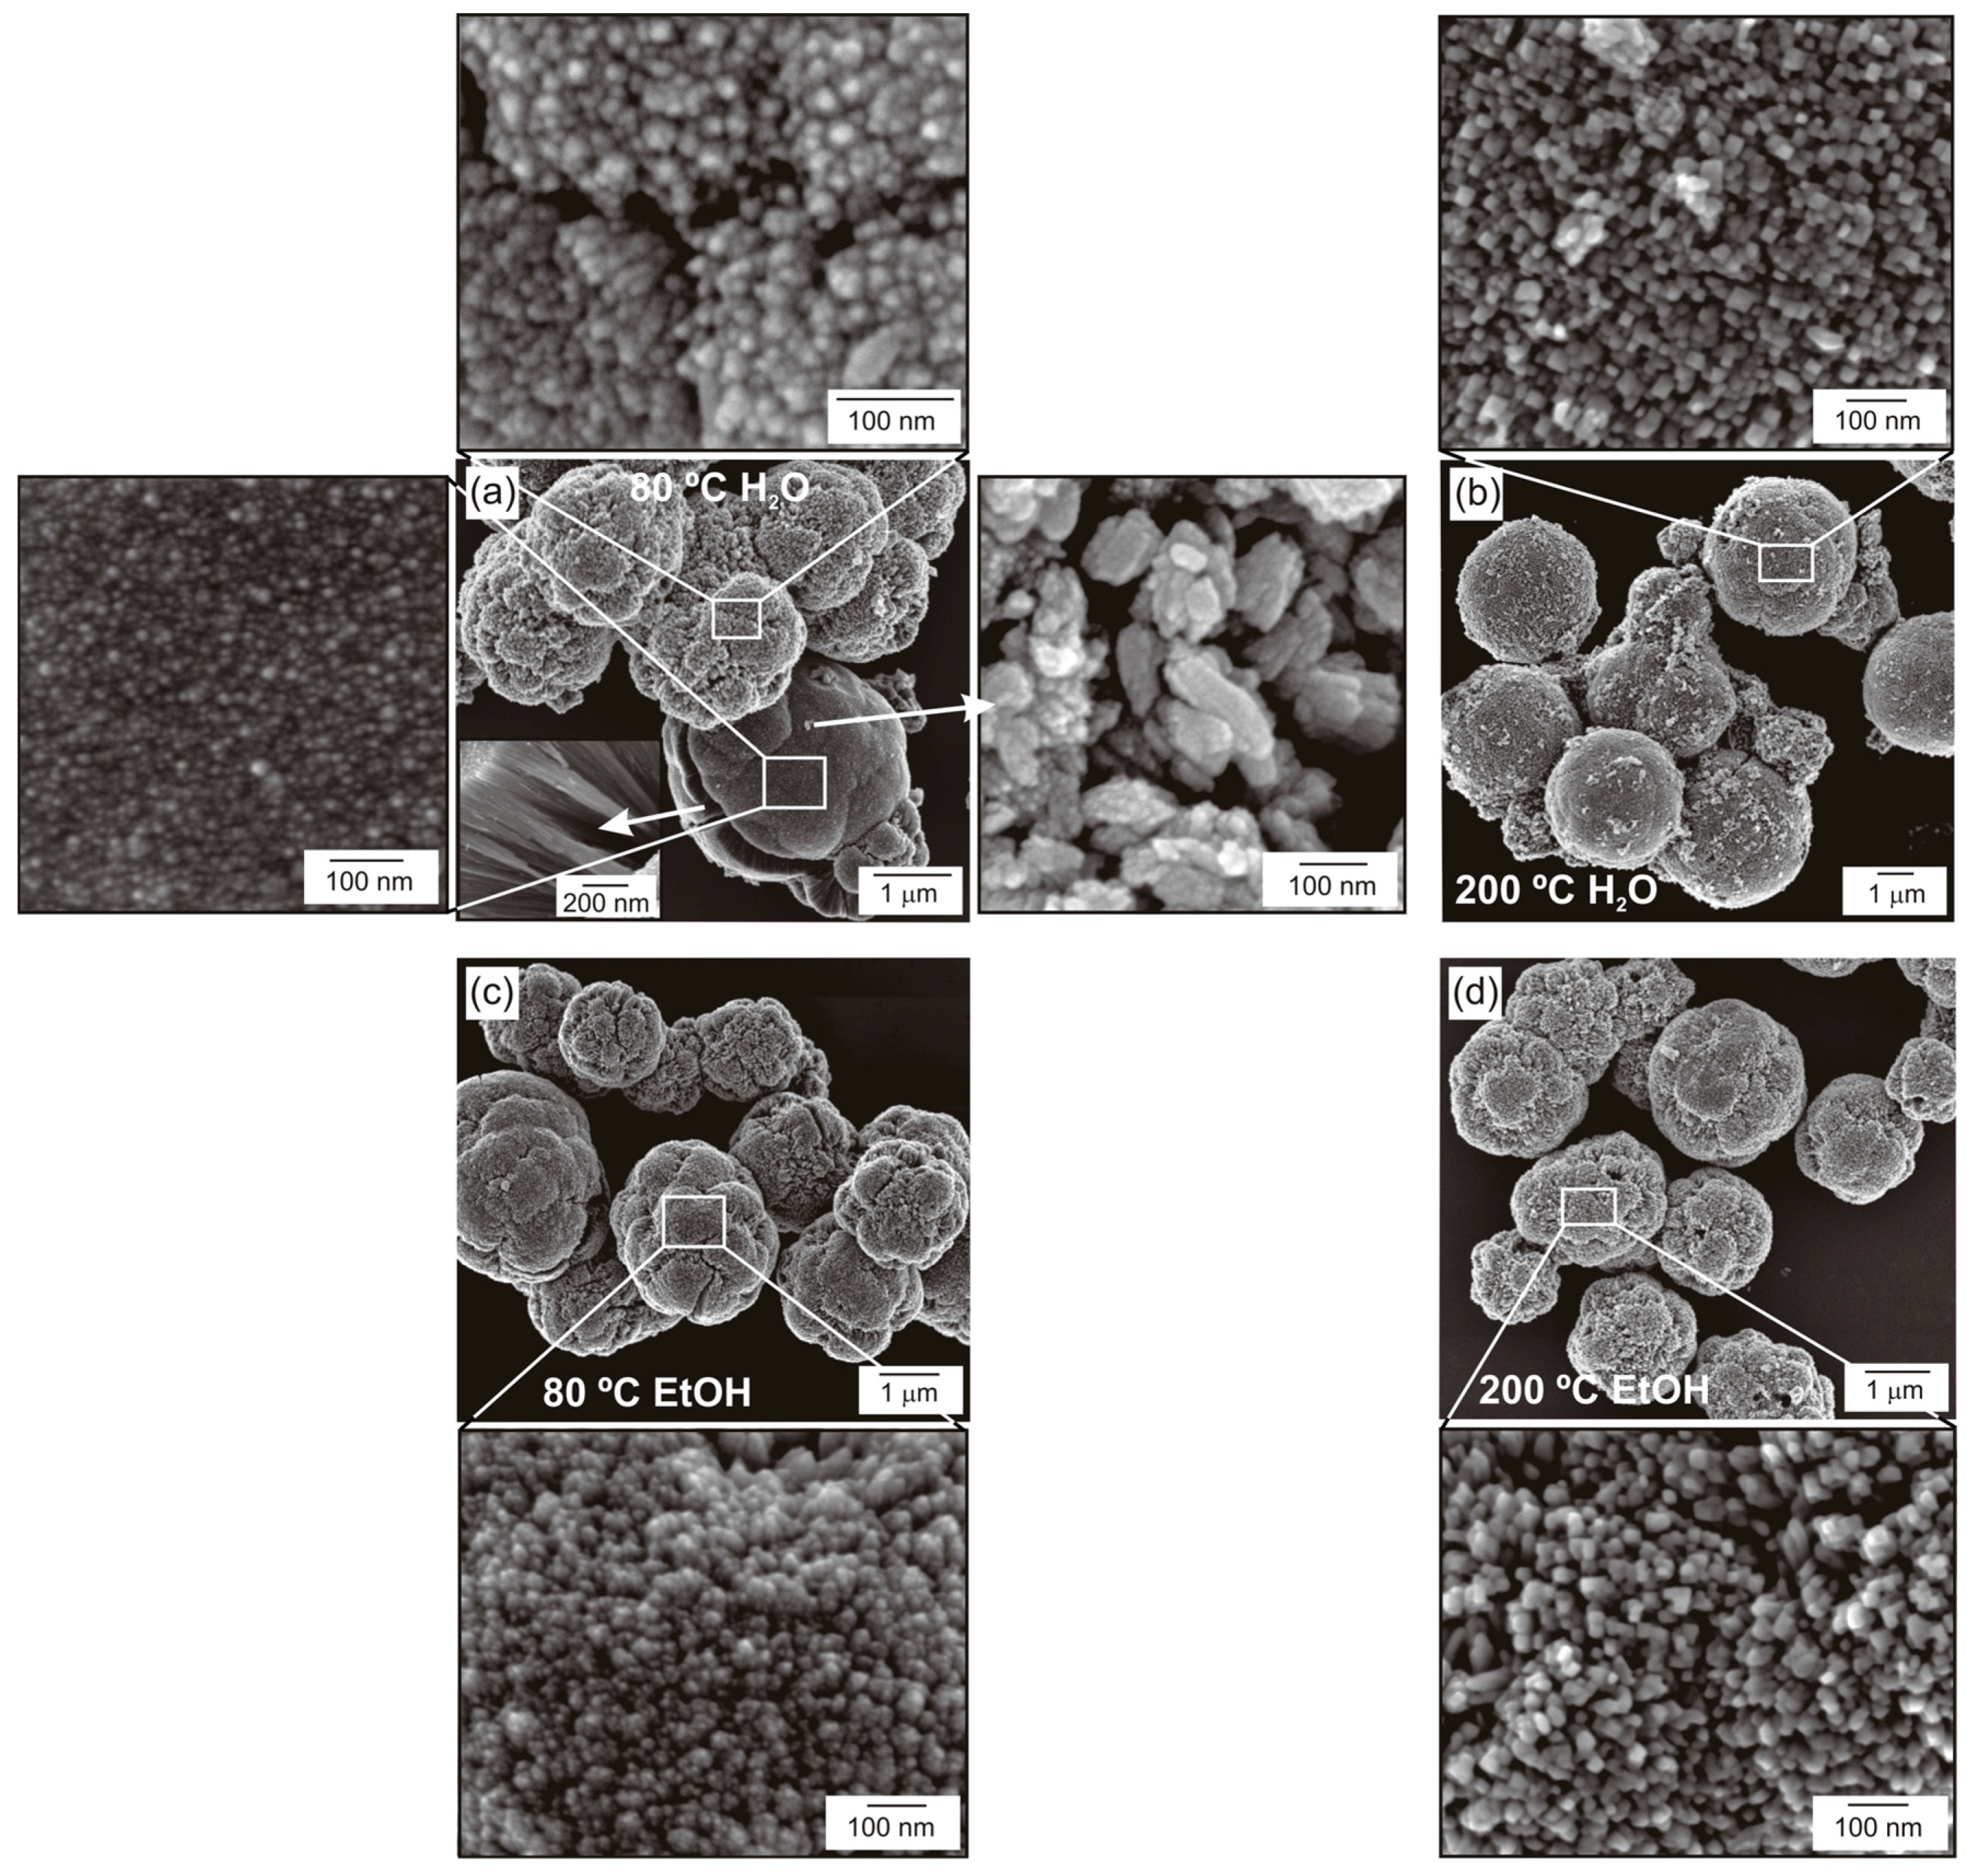
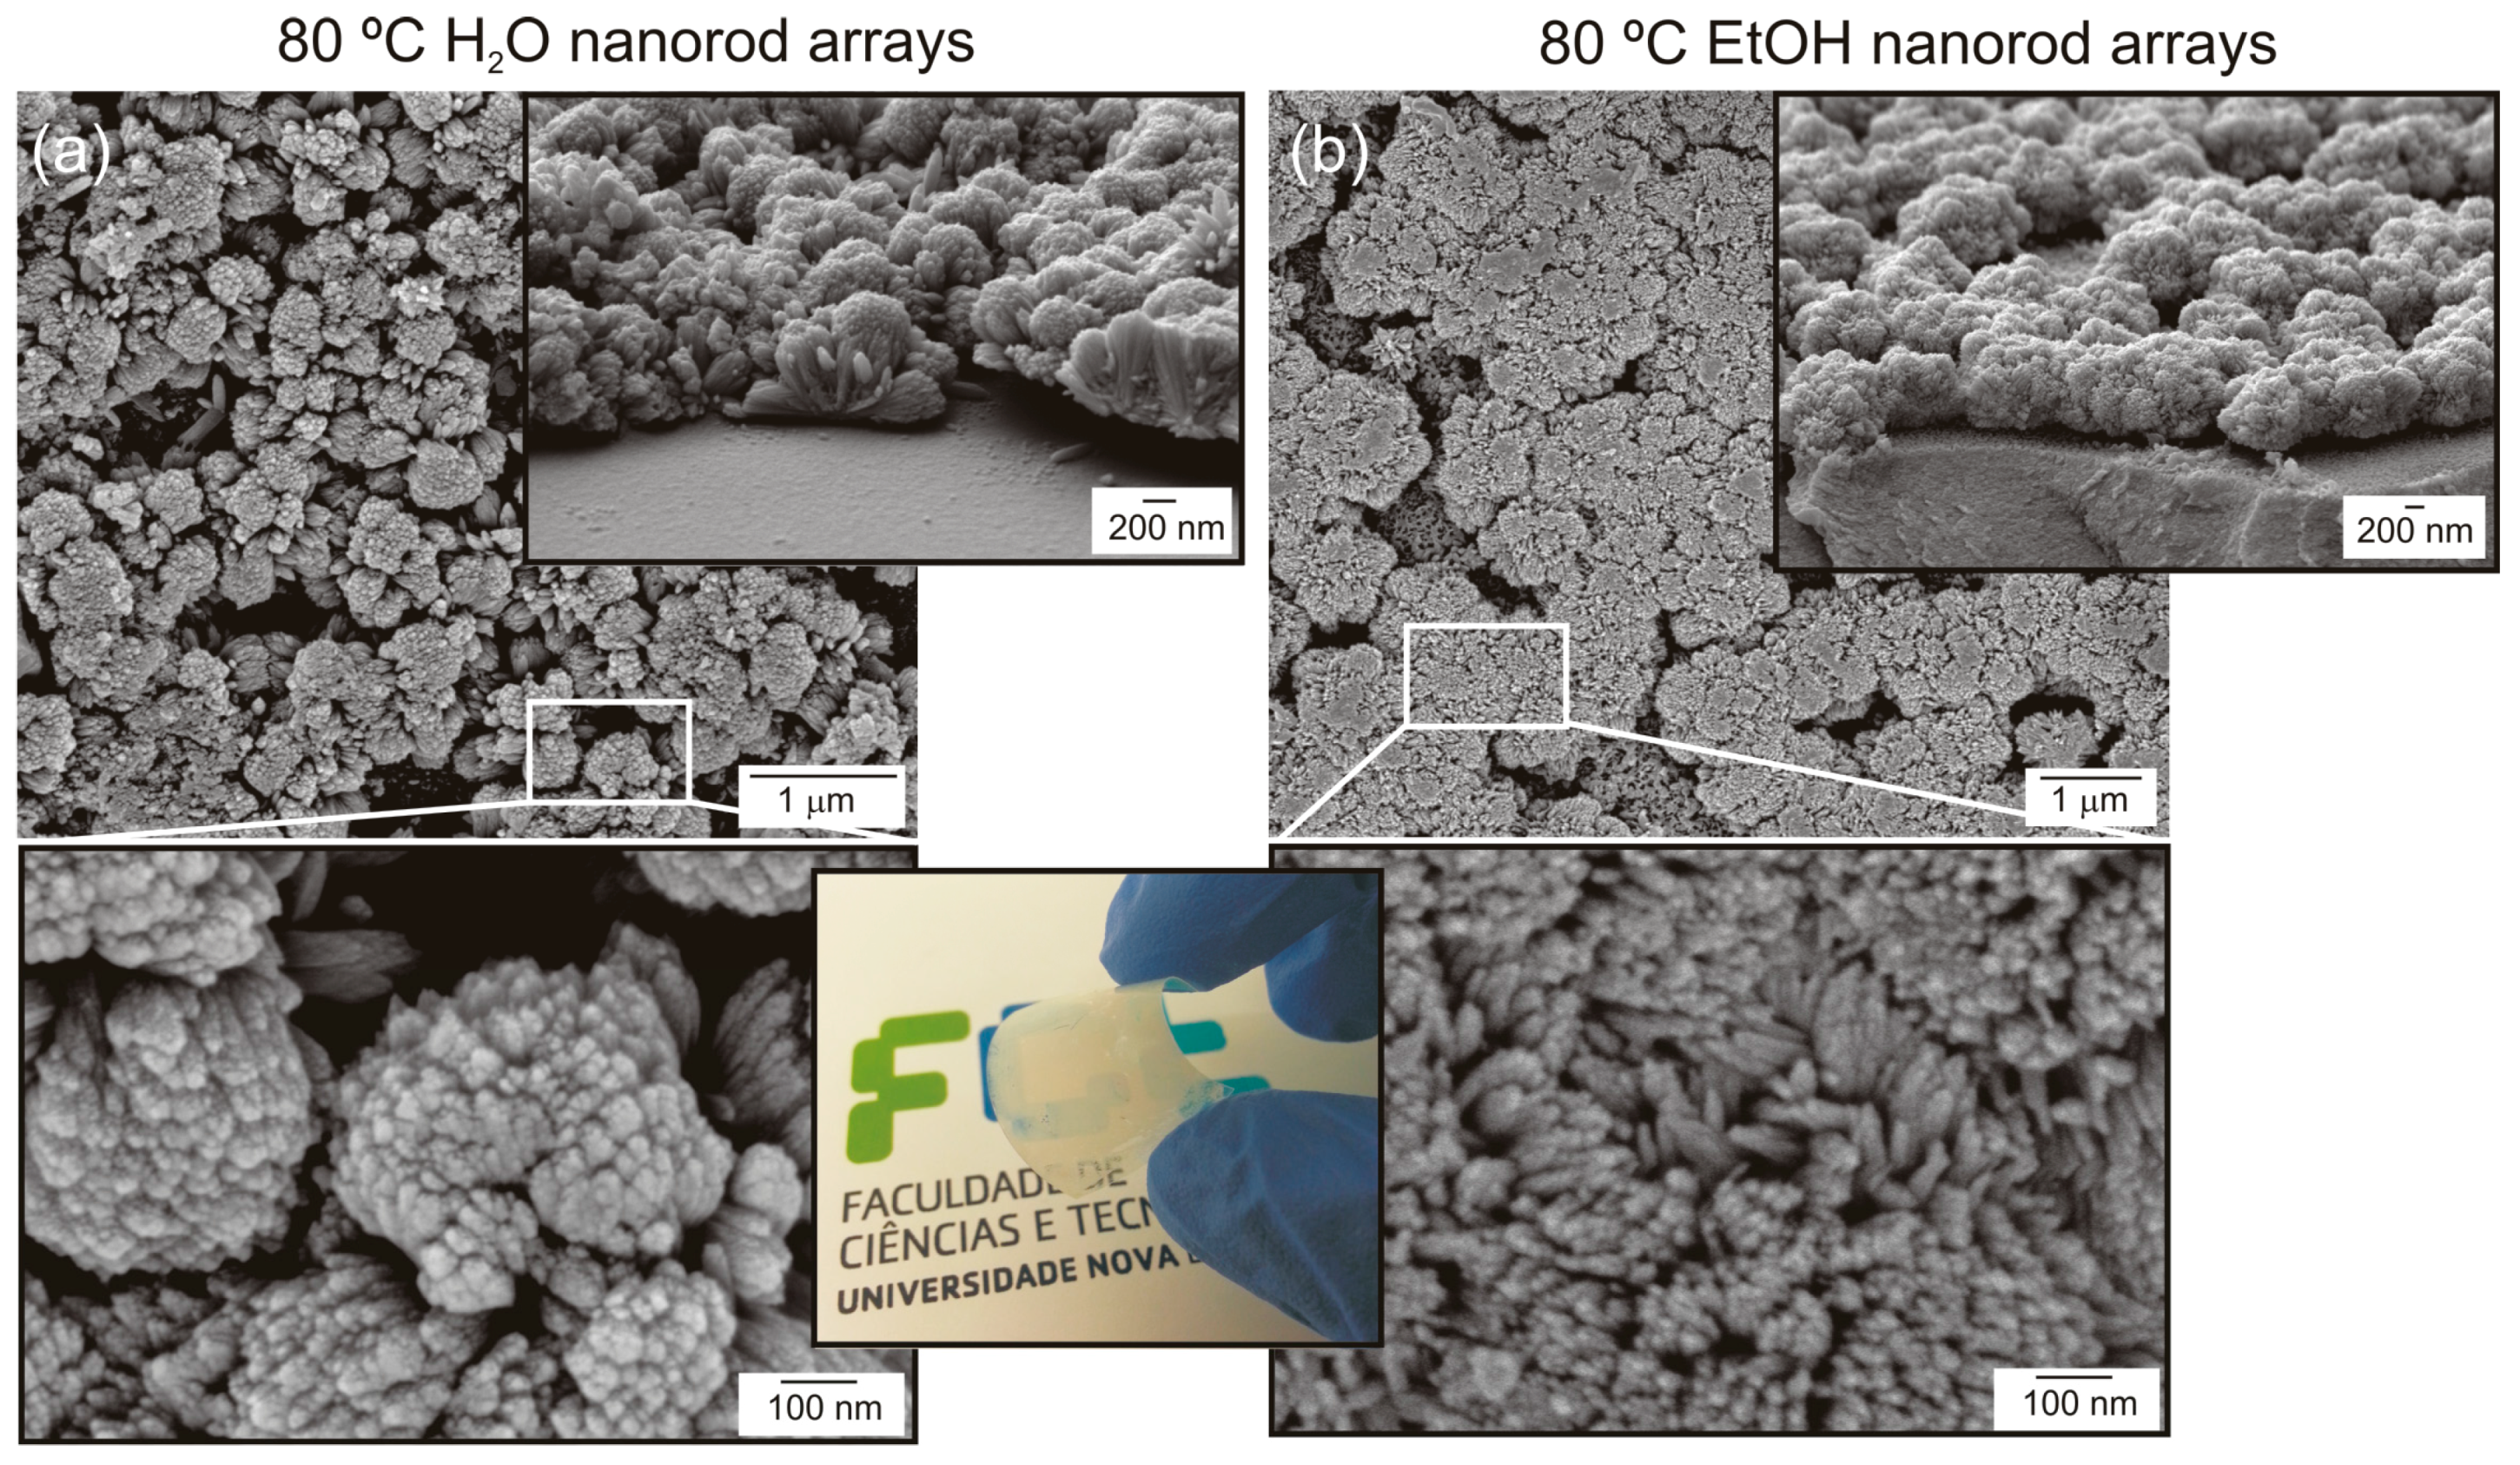
2.2. Electron Microscopy

Figure 3 shows the SEM images of TiO2 nanorod spheres. All the experimental conditions resulted in micro-sized spheres composed by fine nanorods appearing radially arranged. The 80 °C H2O material exhibited two sphere structures: one more spherical with cracks, and the other displaying a flower-like (cauliflower) structure. Nevertheless, both sphere types displaying closely packed nanorods. The average sphere diameter was 2.4 ± 0.9 μm. Moreover, a large amount of individual nanostructured particles was also detected for this condition (see the right inset pointed by the arrow in Figure 3a or Figure S1), demonstrating that a clear mixture of structures is present, as expected from XRD and Raman results (Figure 1). For the 200 °C H2O condition, the material evolved to homogeneous spherical structures with an average sphere diameter of 3.6 ± 0.8 μm. Other types of structures continued to surround the spheres for this synthesis condition. The 80 °C H2O nanorods presented average widths of 11.4 ± 3.1 nm, while with the increase of synthesis temperature, the nanorods increased their size (average widths of 31.6 ± 8.3 nm) and the square shape of the nanorods could be clearly discernible (compare insets in Figure 3a,b).
The 80 °C EtOH nanorod spheres are highly homogeneous with quasi-spherical structures, tending to a flower-like structure with closely packed nanorods. The average sphere diameter was 2.2 ± 0.4 μm, with nanorod widths of 10.8 ± 2.8 nm. Upon the temperature increase, the 200 °C EtOH spheres maintained the uniform structure, being highly comparable to the 80 °C EtOH material. The average sphere diameter is 2.1 ± 0.3 μm with nanorods presenting widths of 27.7 ± 6.2 nm and squared shape (see inset in Figure 3d).
Comparing the micro-sized spheres regarding the solvent used, it was observed that the nanorod spheres synthesized with alcohol were smaller than the ones synthesized with water, in agreement to previous reports [60]. This behavior can be approximated to the solvent characteristics under microwave irradiation. As water is a solvent with higher boiling point than ethanol and also with lower loss tangent [52], these properties lead to lower microwave coupling efficiency [61], lower heating rate and pressure inside the microwave vessel during synthesis. Thus, the length of the nanorods can be tuned and form longer nanorods in the presence of water (larger TiO2 nanorod spheres). Faster reaction rates result in smaller particle sizes [62], as observed for the materials synthesized with ethanol.
The 80 °C H2O nanorod spheres were further investigated by TEM, to identify the distinct TiO2 nanostructures observed in Figure 3a and Figure S1. A bright-field image and respective diffraction pattern are presented in Figure 4. Small sized rod-like structures are clearly seen, and are steadily compared to the ones observed by SEM analysis (see the inset pointed by the arrow in Figure 3a). These structures displayed an average width and length of 22.4 ± 6.7 and 73.7 ± 34.8 nm, respectively. The ring diffraction pattern attested that these particles are solely from the brookite phase.
The large TiO2 micro-sized nanorod spheres appeared as dark structures on TEM and have not been presented. TiO2 nanorod micro-sized spheres have been reported previously [3,34,63]. These spheres are formed during synthesis, as the nanorods produced initially in solution having the rutile phase, tend to aggregate in spheres in order to reduce the surface energy [60]. Thus, the nanorod spheres observed after microwave synthesis for all conditions studied are believed to have the rutile phase, with the individual TiO2 nanorods having a [001] growth direction, such as previous related studies [5,63]. The nanorod spheres produced at 80 °C with water presented significant structural differences, and it can be expected that these dissimilarities are related to the nanorod sphere evolution along synthesis. The compact structure is more likely to occur as it was observed previously for synthesis using water as solvent [5]. Moreover, with the temperature increase, spherical, larger and more compact spheres were observed, supporting the assumption of evolution to compact structures.
The TiO2 nanorod arrays were also successfully synthesized under microwave irradiation and using ZnO as seed layer on a PET substrate. The image of the produced material demonstrates that the substrates maintained their flexibility after microwave irradiation (see photograph in Figure 5). SEM images revealed that both TiO2 nanorod arrays ensued similar final materials composed by similar nanorods agglomerates forming TiO2 flower-like structures such as the ones observed for the powder spheres. The synthesis with water resulted in nanorod arrays organized as smaller individual aggregates along the substrate (Figure 5a). For the material synthesized with ethanol, it could also be observed that larger individual aggregates were also formed, but presenting a cauliflower aspect and more closed packed than the 80 °C H2O material (compare Figure 5a,b). These structures were grown side-by-side along the substrate appearing as a continuous material. These results confirm the Raman spectra where the 80 °C EtOH nanorod arrays appeared to be thicker and denser due to the lower contribution of the PET substrate to the Raman spectrum (see Figure 2). The TiO2 nanorods grown on the arrays presented widths comparable to the nanorods observed at the micro-sized spheres for both materials. The average aggregate sizes (thickness) were 570 ± 86.7 nm and 760 ± 114.6 nm for the 80 °C H2O and 80 °C EtOH, respectively.
EDS analyses were carried out in the material cross-sections, which revealed homogeneous distributions of Ti and O in all materials produced (see Figure S2). The presence of ZnO (Zn map) could not be confirmed through EDS due to the reduced thickness of the film [64].

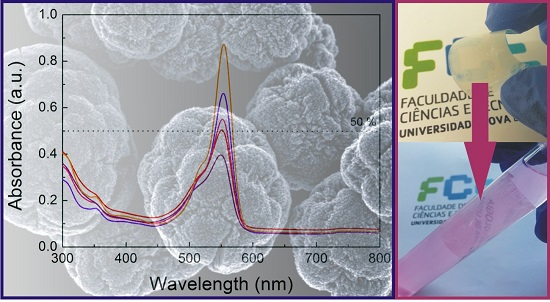
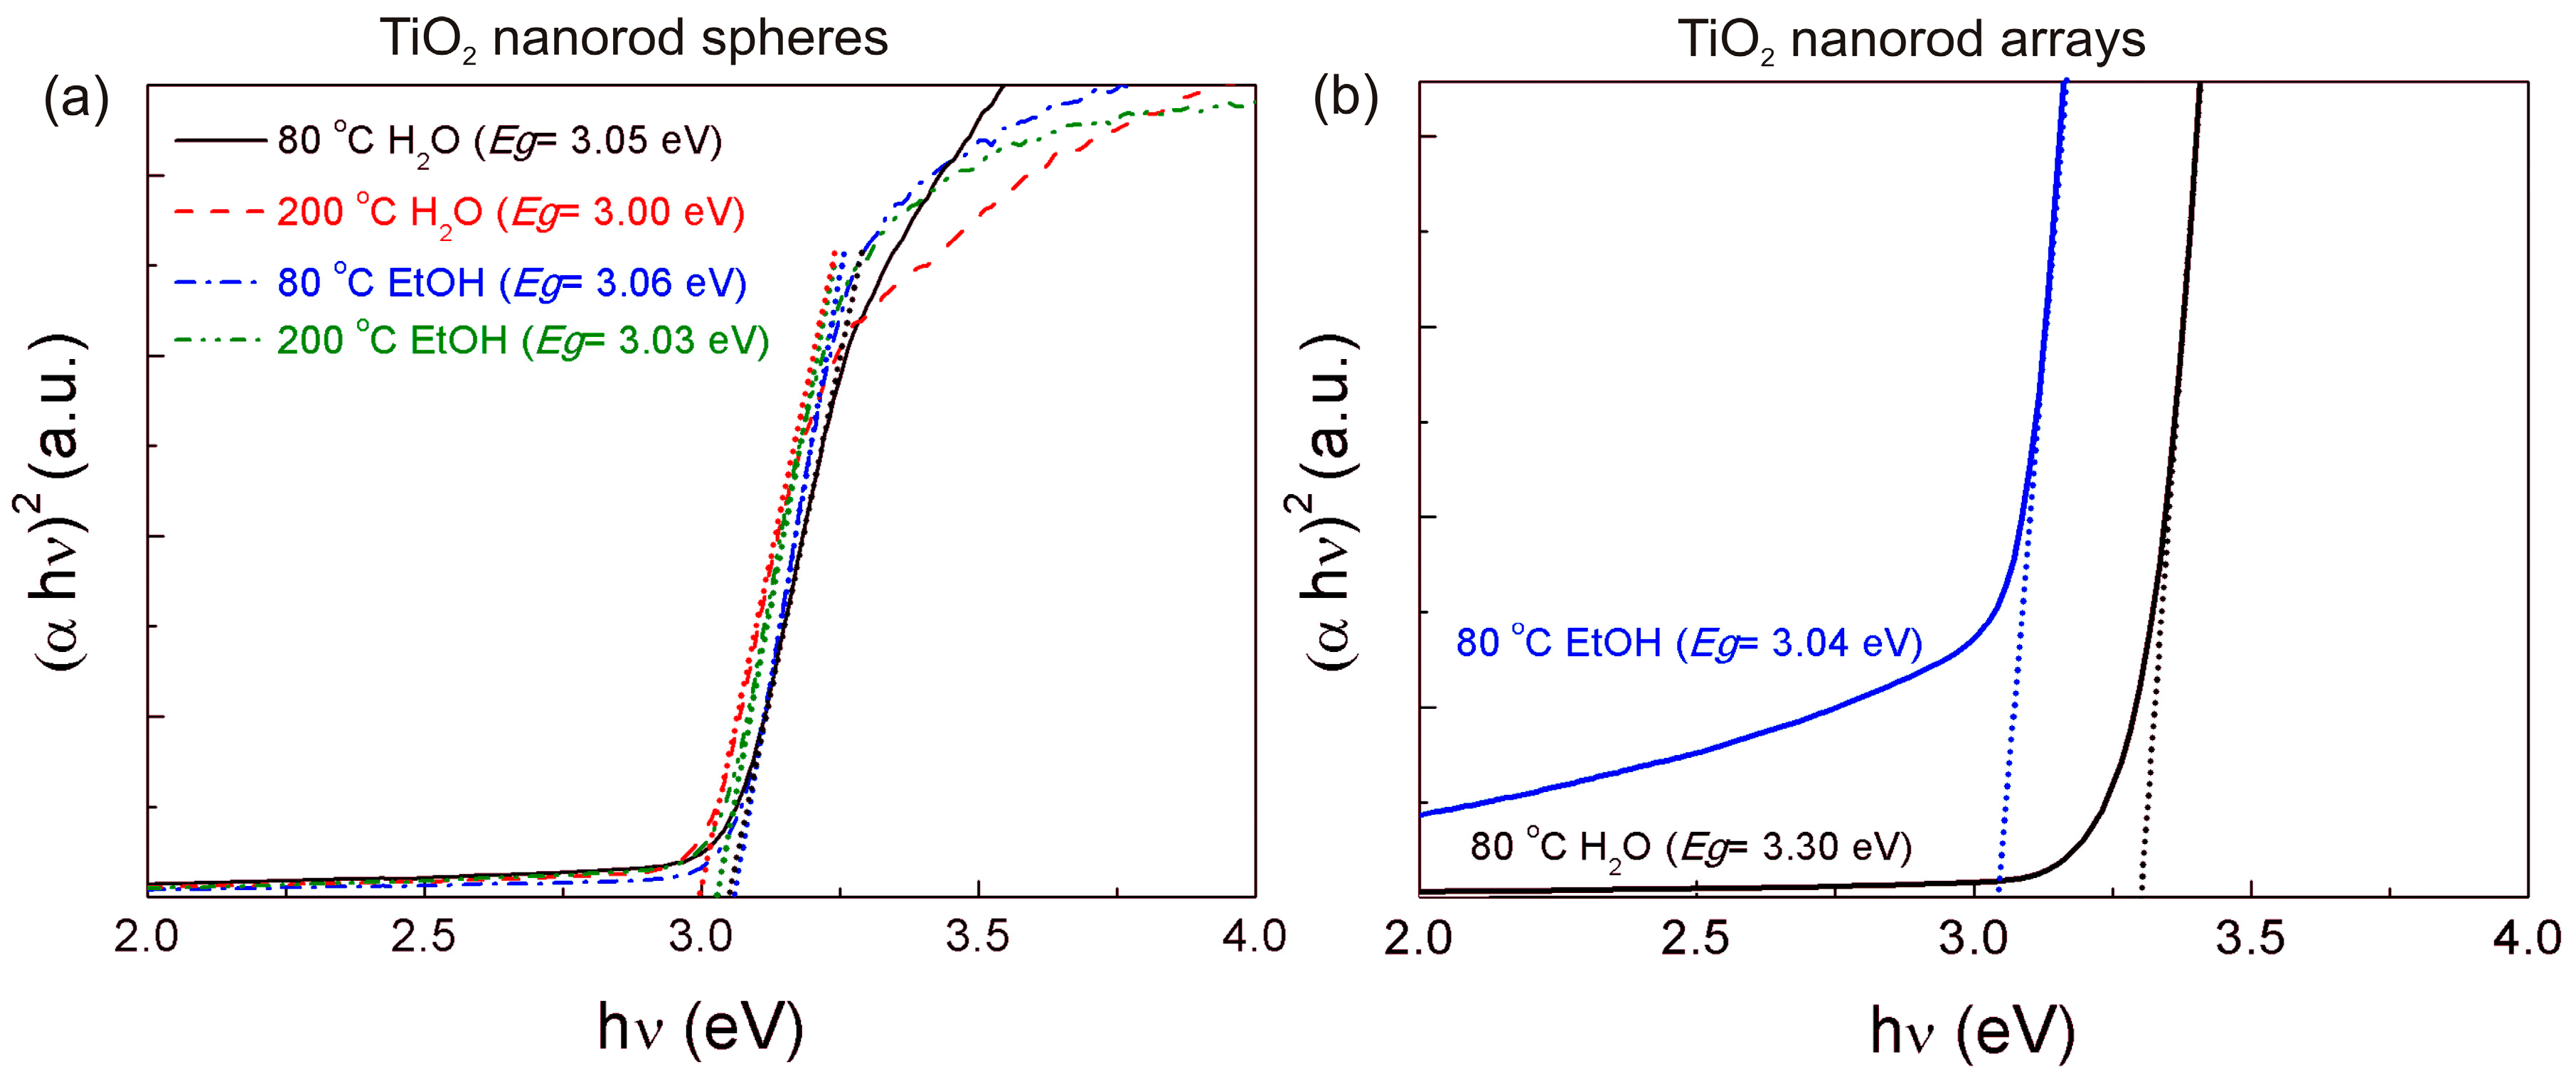
2.3. Optical Characterization

Optical band gaps have been evaluated from reflectance data through the Tauc plot. The optical band gap (Eg) is related to the optical absorption coefficient and the incident photon energy as follows [65,66]:
α h ν = A ( h ν E g ) n
where α is the linear absorption coefficient of the material, is the photon energy, A is a proportionality constant and n is a constant exponent which determines the type of optical transitions (n = 1/2 for direct allowed transition and n = 2 for indirect ones). Moreover, for determining the band gap, the (α)2 against is plotted, and extracted through the intersection of the extrapolation of the linear portion with 0. The band gaps were estimated for all the produced TiO2 nanorod spheres and arrays. The band gaps were 3.05 eV, 3.00 eV, 3.06 eV, and 3.03 eV for 80 °C H2O, 200 °C H2O, 80 °C EtOH and 200 °C EtOH nanorod spheres, respectively (Figure 6a). No significant band gap differences were observed between the solvents and temperatures tested. Moreover, the evaluated band gaps are within the reported values for the different TiO2 phases [18,67,68]. The band gaps obtained for the TiO2 nanorod arrays synthesized at 80 °C were 3.30 eV for the 80 °C H2O and 3.04 eV for the 80 °C EtOH, respectively (Figure 6b), with both values within the values typically reported for the TiO2 phases. A contribution from the ZnO seed layer could be expected to the values obtained (ZnO band gap has been reported to be 3.37 eV [52]), nevertheless this contribution was not evident for the 80 °C EtOH condition. An analogous study, demonstrated that the ZnO seed layer deposited by spin-coating and annealed at 200 °C, resulted in an optical band gap value of 3.26 eV [64]. Structural characteristics as array thickness and compactness can also largely influence the final band gap value [5], which may justify the differences observed. The presence of other phases with larger band gaps than rutile (brookite in the case of the 80 °C H2O nanorod arrays) could also have played a role in the higher band gap observed; nevertheless, this effect was not confirmed for the nanorod spheres, and thus a direct relation cannot be inferred.

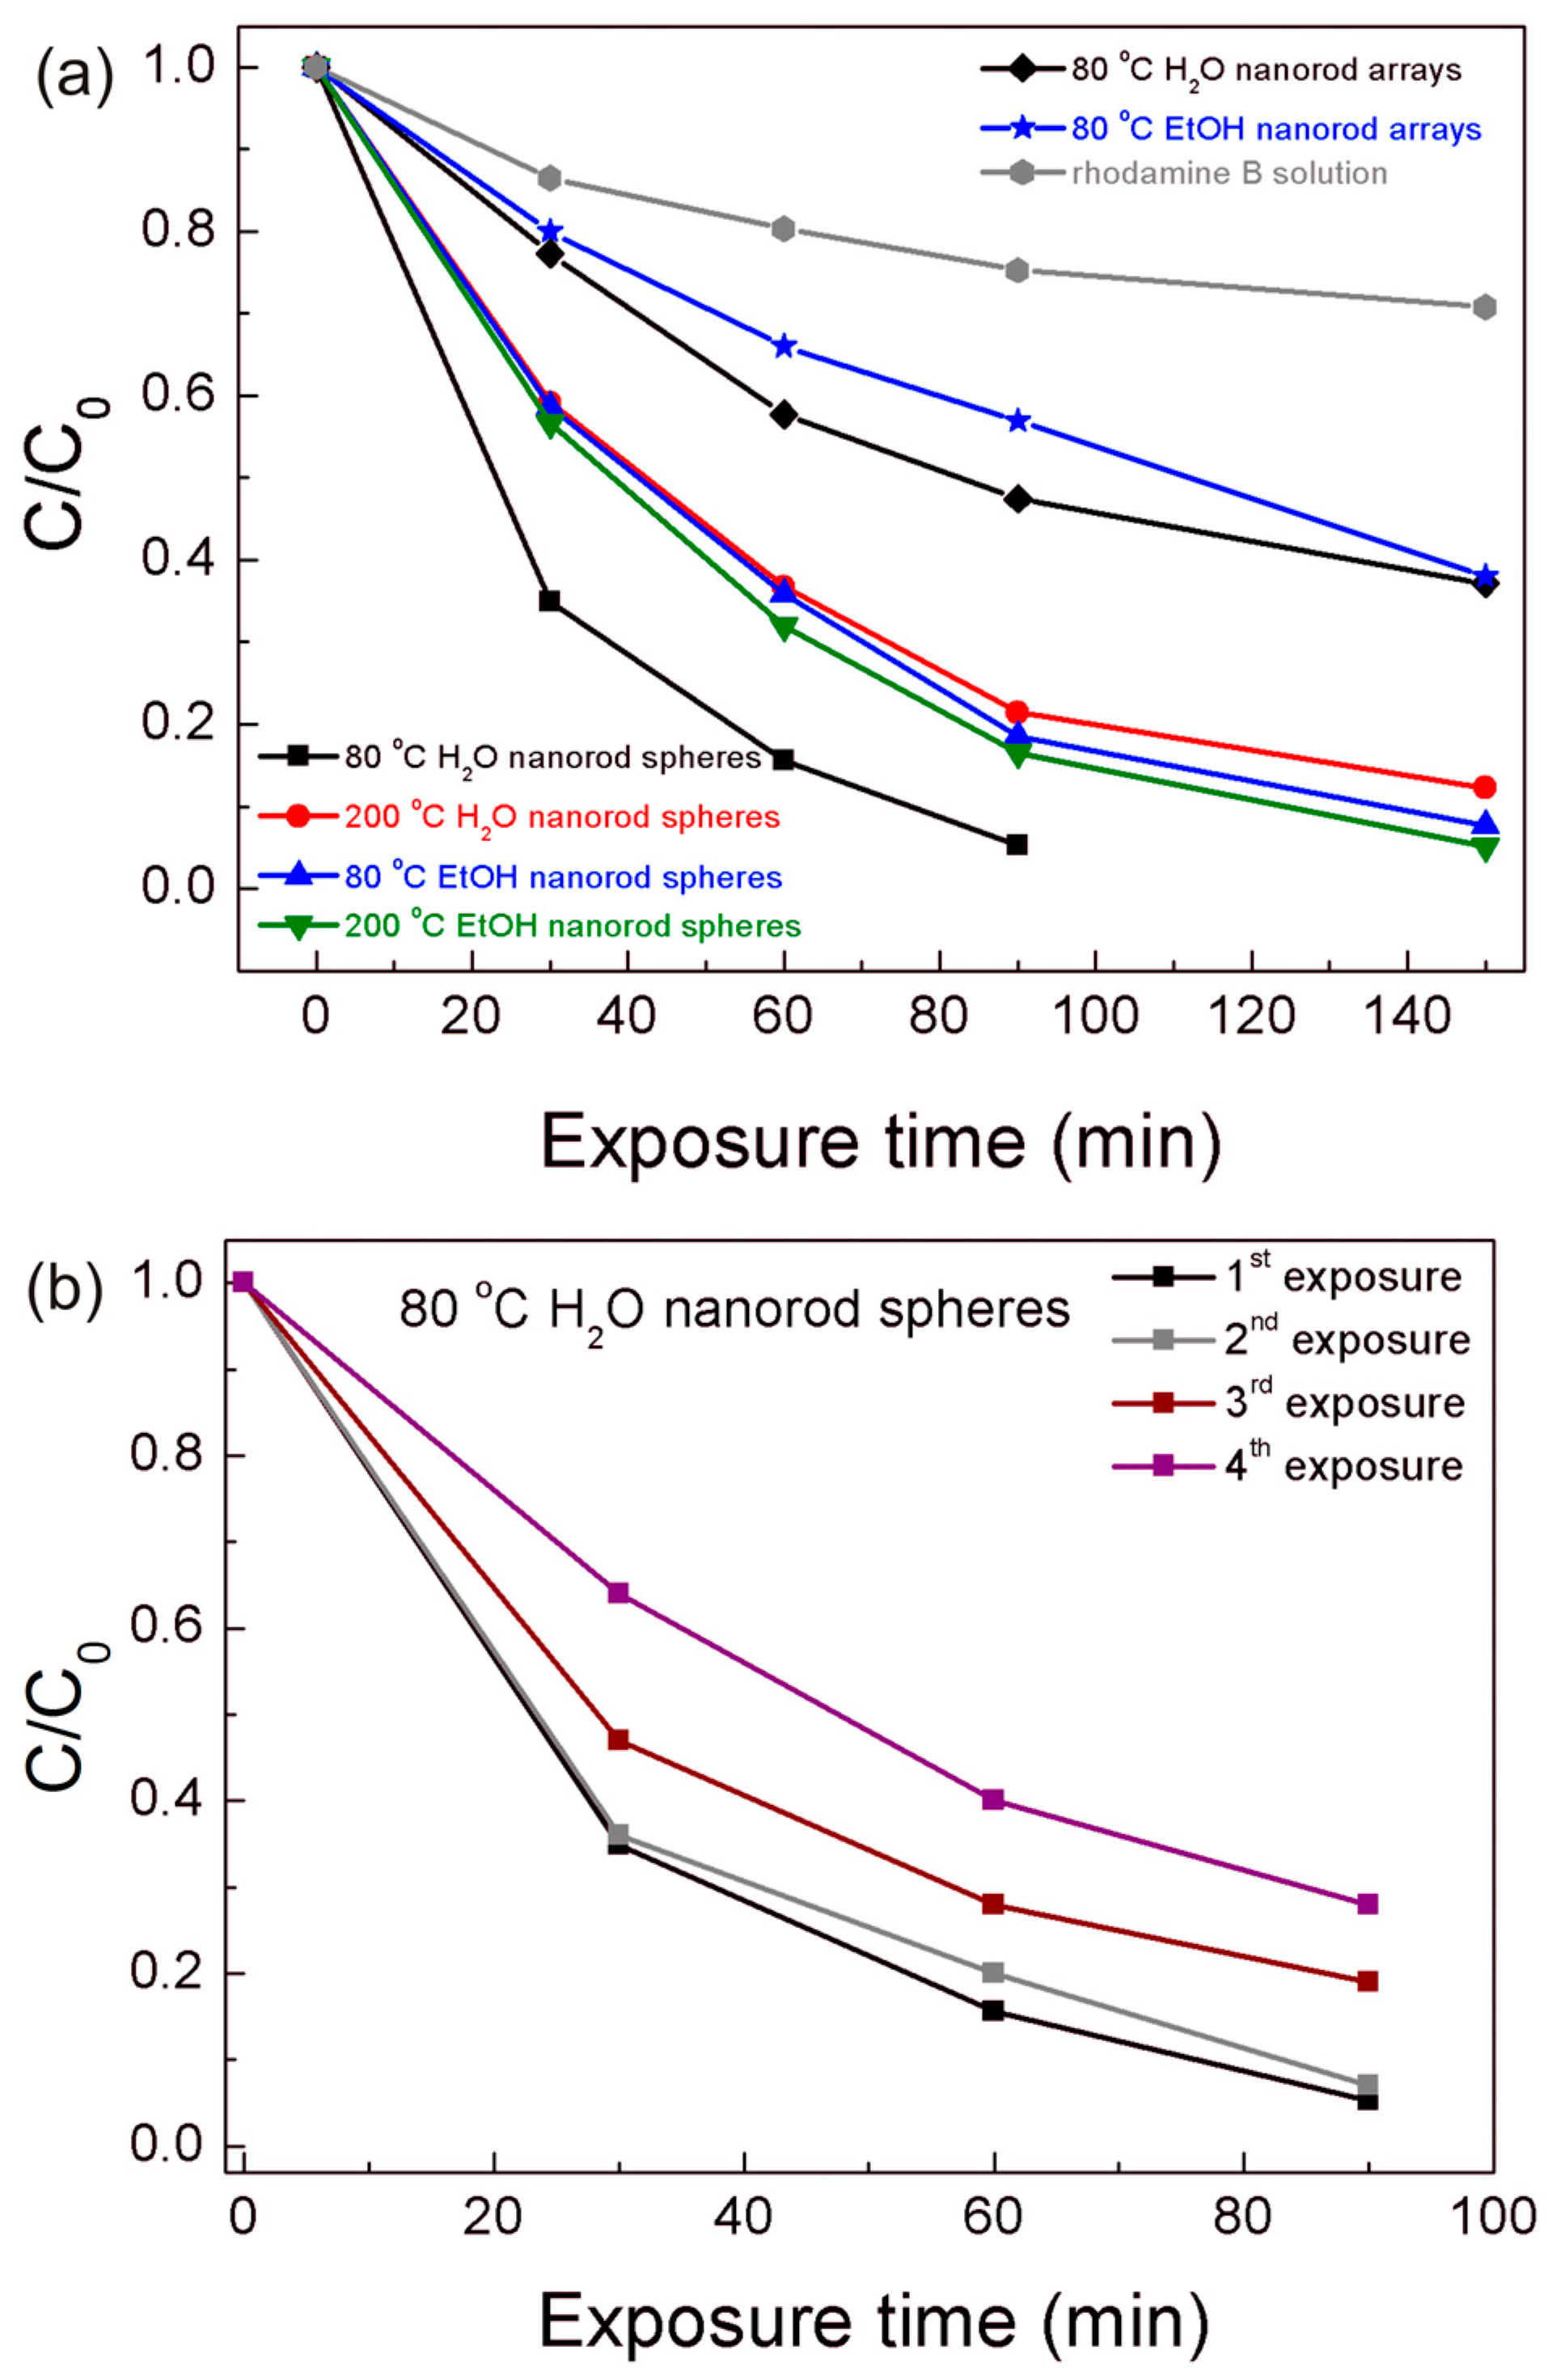
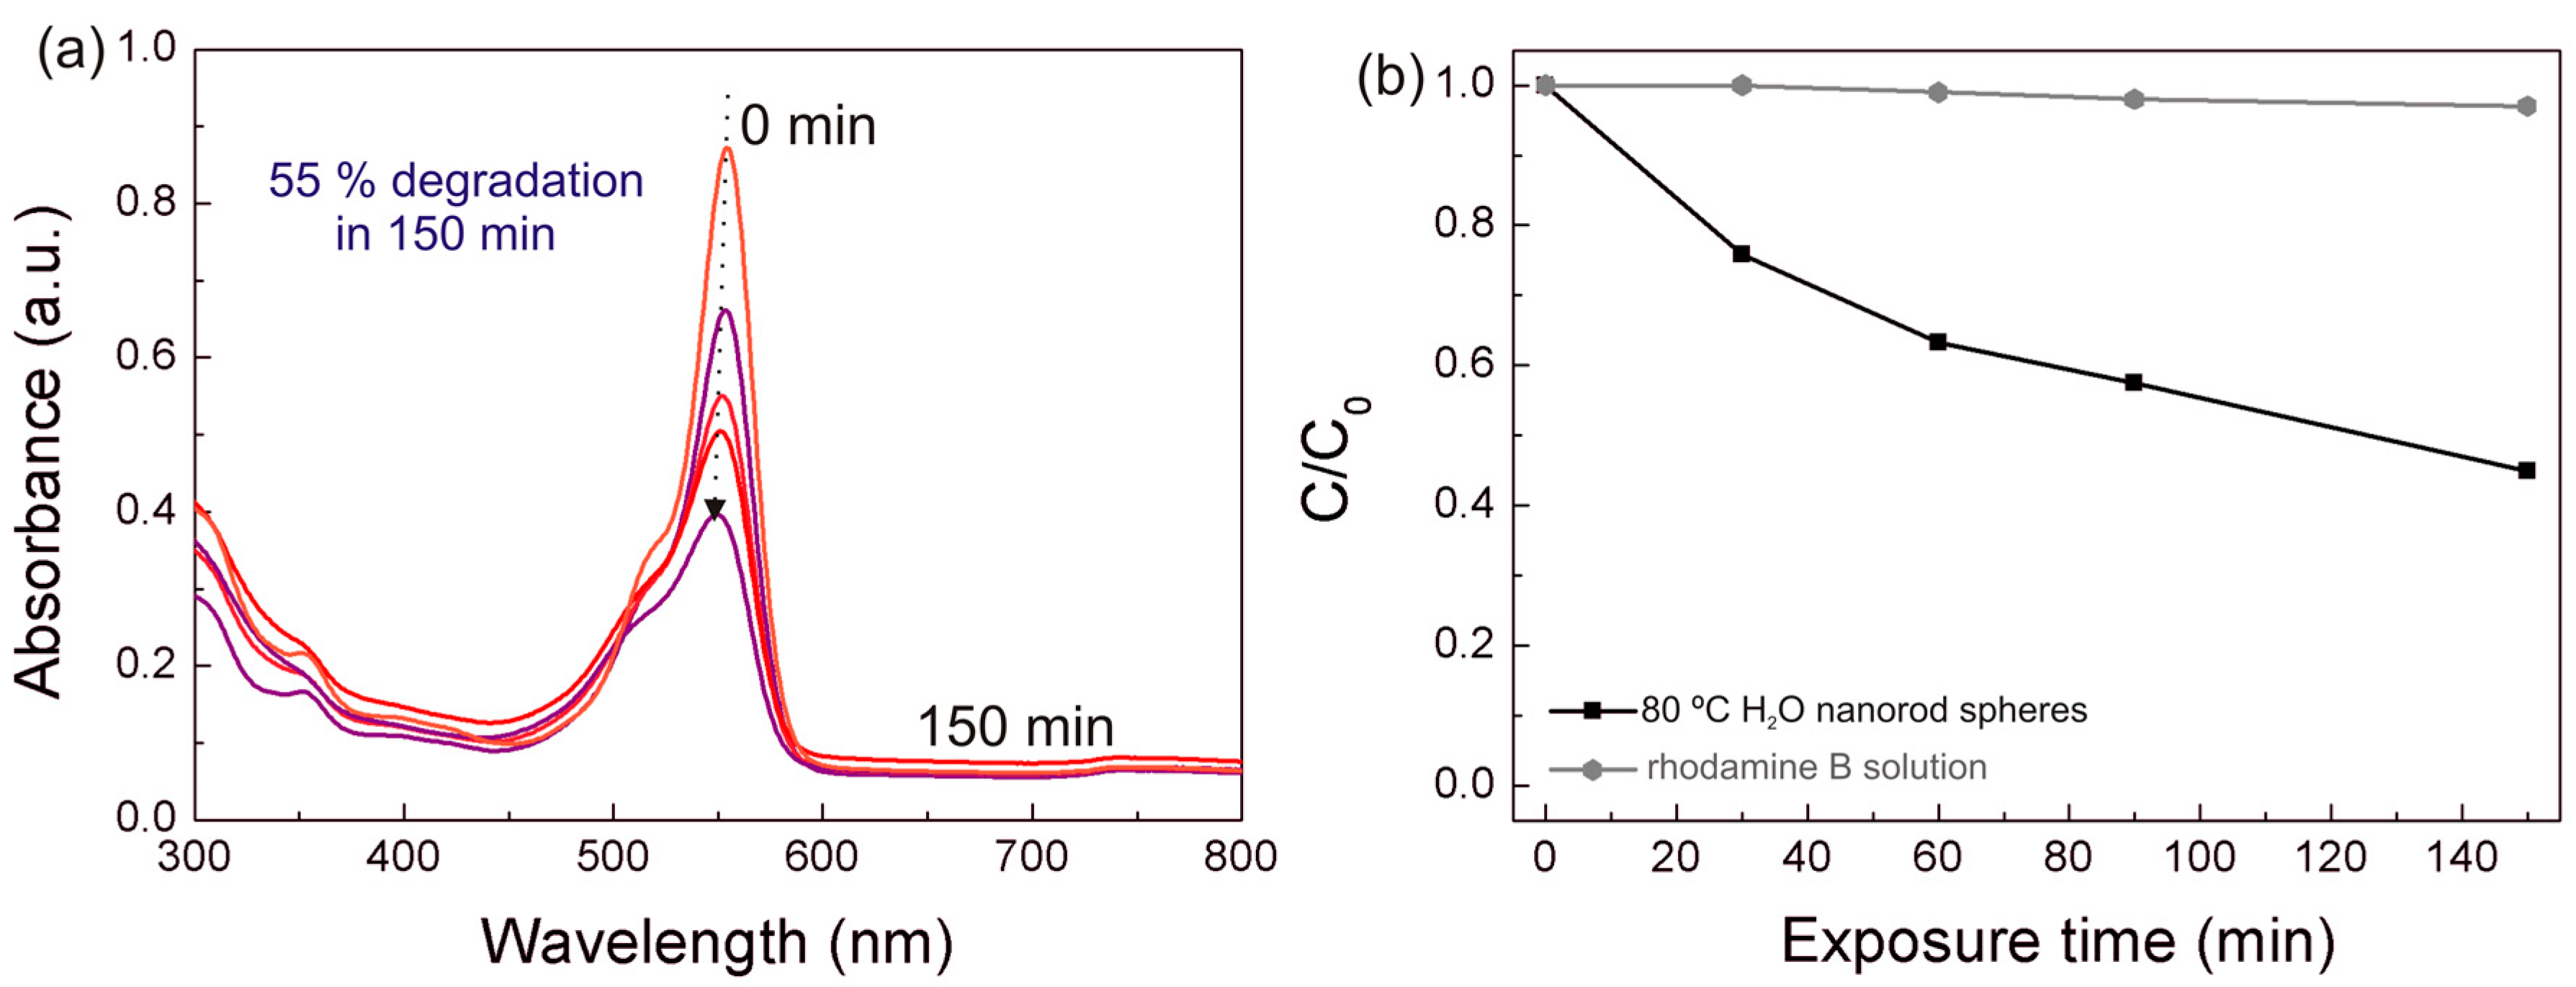
2.4. Photocatalytic Activity

The photocatalytic activity of both the TiO2 nanorod spheres and arrays were evaluated through the rhodamine B degradation efficiency under UV and solar radiation. For the best photocatalyst material, reusability tests were carried out. The degradation ratio (C/C0) vs. UV exposure time is presented in Figure 7, where C is the concentration of the pollutant in the aqueous solution at each exposure time and C0 is the initial solution concentration. The gradual rhodamine B degradation under UV radiation in all conditions could be observed in Figure 7 and Figure S3, where the 80 °C H2O nanorod spheres showed the highest photocatalytic activity. This material reached values of 95% after 90 min, while the other powder materials required 150 min to reach closer degradation values, i.e., 87% for the 200 °C H2O, 92% for the 80 °C EtOH, and 94% for the 200 °C EtOH. From Figure 7b, it can also be observed that the 80 °C H2O powder photocatalyst can be reutilized despite the activity deterioration observed over the exposures [20,69], which can be related to the powder saturation of rhodamine B [69] or photocatalyst weight loss during experiments [70]. Moreover, a comparable degradation behavior was observed to the Degussa P25 catalyst (see Figure S4), however the synthesized photocatalyst has the advantage of being easily recovered and recycled due to its micrometer size.
The TiO2 arrays on PET substrates with 150 min of UV exposure time reached 64% and 61% for the 80 °C H2O and 80 °C EtOH nanorod arrays, respectively. The powder materials were more effective in rhodhamine B degradation; nevertheless, this performance is expected, as powders have a better adsorption activity and photocatalytic efficiency than films due to the larger surface area and higher amount of material [71]. A blank rhodamine B solution was also measured during the UV exposure experiments, presenting some degradation without the catalyst, however significantly lower than the degradation observed for all materials (Figure 7a).
The photocatalytic activity depends on several properties such as band gap, crystallite size, crystalline phase, specific surface area and active facets [5,13]. The TiO2 active facets are {110} > {001} > {100} for rutile [22] and {210} for brookite [17]. In the present study, two synthesis temperatures and solvents were investigated ensuing different TiO2 phases, as well as distinct nanorod sphere and aggregate sizes. A clear relation between the band gaps of all the materials and their photocatalytic behavior cannot be established, as no significant variations were determined (Figure 6).
Regarding the size effect, a relation with fine particles and photocatalytic activity can be stated. In the case of the materials synthesized with water, the 80 °C condition formed smaller nanorods than the 200 °C one. Thus, the spheres with finer nanorod widths resulted in the highest degradation performance (Figure 7a). The nanorod lengths must also be considered, which is deeply related to the TiO2 sphere size as the nanorods are radially aligned forming the sphere (the 80 °C H2O formed smaller spheres). A size effect contribution from the reduced size of the brookite particles is also expected (see Figure 3, Figure 4 and Figure S1), along with other property contributions such as active facets [17]. Moreover, fractions of another TiO2 phase were identified by XRD, Raman, SEM and TEM (Figure 1, Figure 3 and Figure 4) resulting in a material with a mixture of TiO2 phases (brookite and rutile), which largely increases the photocatalytic performance [72]. Brookite has been reported to display higher photocatalytic activity than anatase or rutile [59], thus an expressive contribution to the photocatalytic performance of the 80 °C H2O material, is expected to be from the higher amount of brookite phase. The 200 °C H2O nanorod spheres still presented a mixture of TiO2 phases, however with lower fractions of brookite than the 80 °C H2O one, and when compared with the pure rutile materials, the poorer rhodamine B degradation performance of the 200 °C H2O material could be justified by the larger sphere sizes detected among all materials.
No significant differences in rhodamine B degradation under UV exposure have been detected between both spheres synthesized with ethanol. Both rutile materials resulted in similar sphere diameters despite the difference in nanorod widths. Nevertheless, the 200 °C EtOH spheres appeared to have a more open structure, which can lead to the higher specific surface area [73], justifying the slight higher rhodamine B degradation (~2% higher than the 80 °C EtOH spheres).
The TiO2 nanorod arrays followed similar photocatalytic behavior than the spheres, where the arrays produced with water, revealed an enhanced photocatalytic activity under UV exposure than the ones synthesized with ethanol. Raman spectroscopy revealed that the 80 °C H2O nanorod arrays is a mixture of TiO2 phases (brookite and rutile), while the 80 °C EtOH is fully composed of the rutile phase. Additionally, a nanorod aggregate size effect can also be approached, where the smaller aggregates formed in water associated with the mixture of the crystalline phases may have resulted in an increase of the photocatalytic performance. Moreover, the 80 °C H2O aggregates are expected to have higher surface area than the ones of the 80 °C EtOH material, in which the latter presented a closed structure with cauliflower aspect and nanorods closely packed.
All the TiO2 nanorod spheres and arrays were then exposed to solar radiation to mimic ambient conditions (Figure 8). Once again, the 80 °C H2O nanorod spheres revealed the greater photocatalytic activity under the solar light simulating source. This behavior was expected due to the enhanced properties of this material and to confirm these results, the absorption in function to the exposure time at a fixed wavelength of 500 nm, was measured in all powder materials (Figure S5). The 80 °C H2O nanorod spheres revealed the higher absorption value at this wavelength suggesting that this material can be employed for pollutant degradation under visible/solar radiation. The degradation ratio (C/C0) vs. solar light exposure time is also presented in Figure 8b. The photocatalytic activity of 80 °C H2O material is higher under UV than under solar simulating light source (compare Figure 7a and Figure 8b), which is expectable, however the degradation under solar radiation is expressive (55% after 150 min). The blank rhodamine B solution was not influenced under solar light so all the photocatalytic effect is due to the presence of the catalyst. The TiO2 nanorod arrays also revealed some rhodamine B degradation under solar light; however, further investigation is required to improve the degradation rate (17.5% rhodamine B degradation after 150 min for the best array photocatalyst, i.e., the 80 °C H2O material). Nevertheless, the TiO2 nanorod arrays on flexible substrates show very promising results as these materials can adapt to unlike surfaces, i.e., in a photocatalytic auto-cleaning tubular line for water/wastewater treatment, moreover the approach suggested in this work is an interesting option, as it results in highly malleable materials and uses low-cost production routes.

3. Experimental

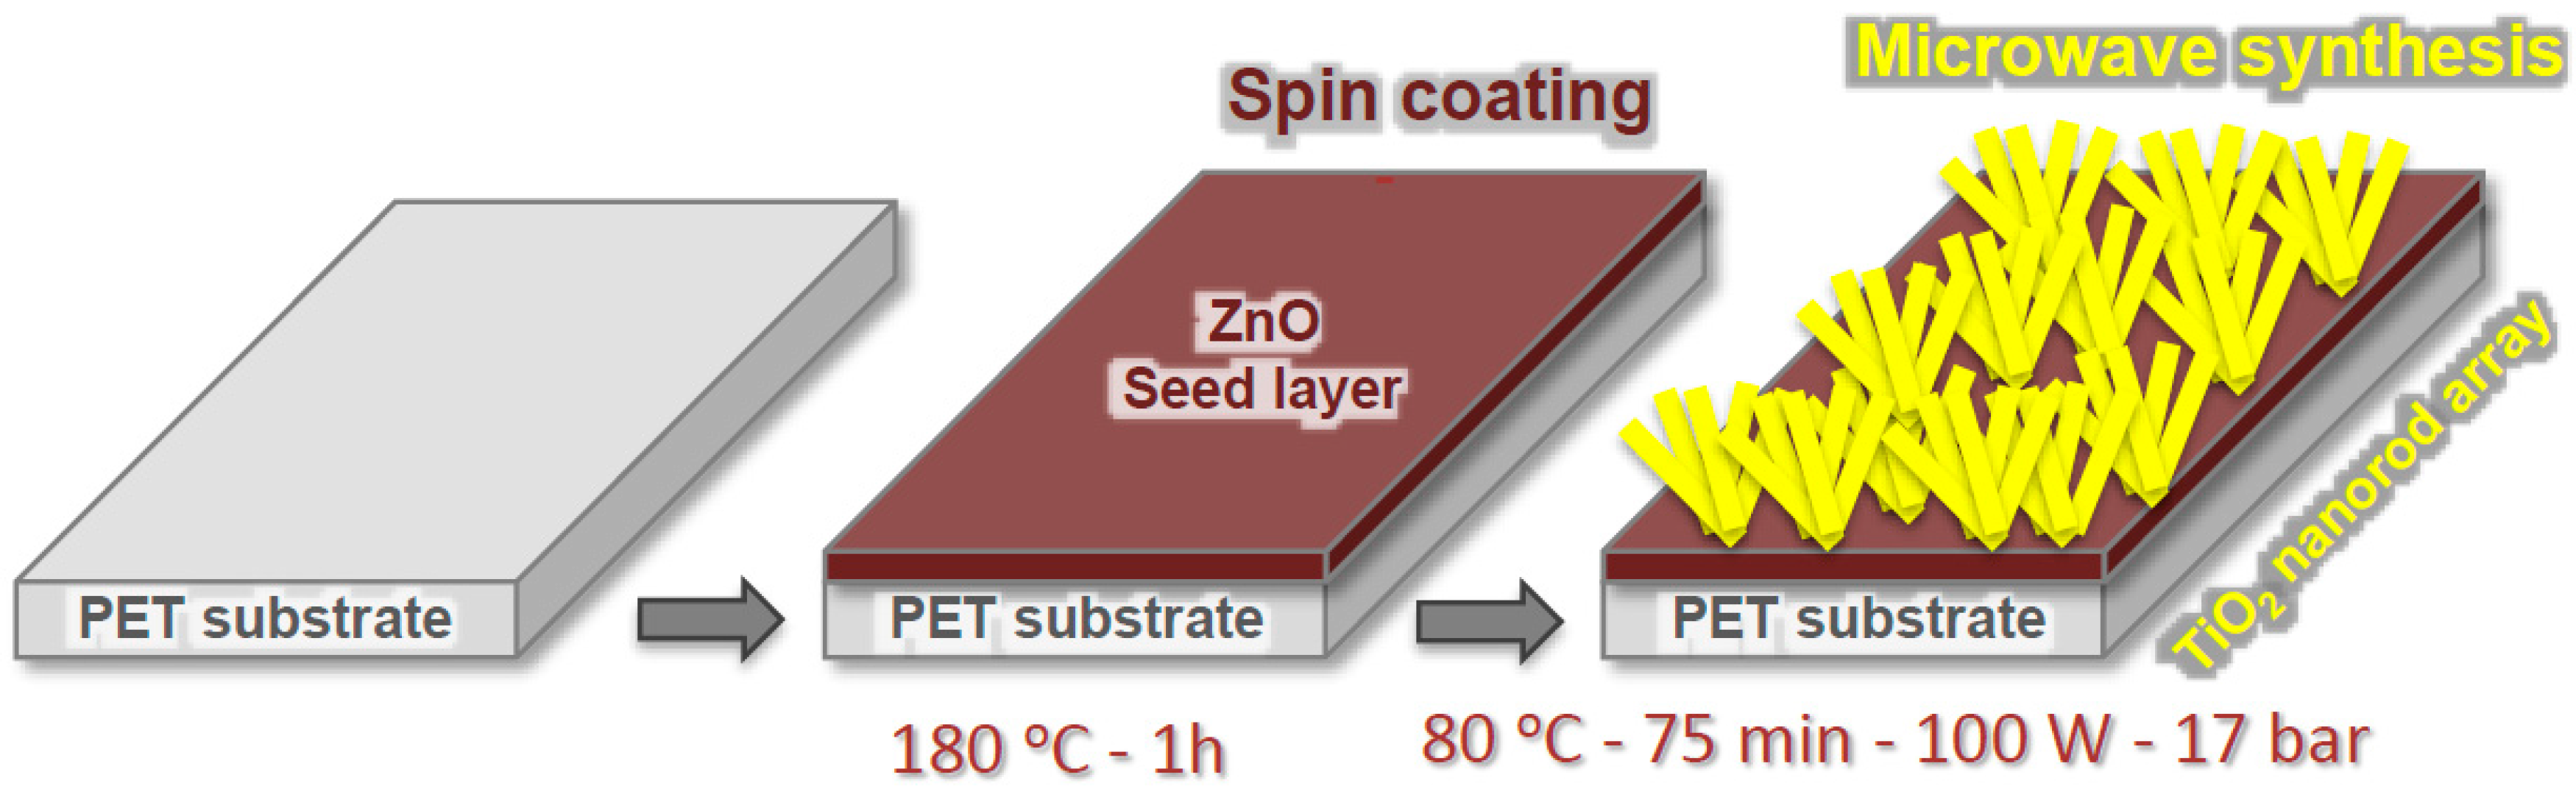
3.1. TiO2 Nanorod Sphere and Array Productions

The TiO2 nanorod spheres and arrays have been synthesized simultaneously under microwave irradiation. The TiO2 microwave solution has been prepared using titanium (IV) isopropoxide (Ti[OCH(CH3)2]4, TTIP, 97%) and hydrochloric acid (HCl, 37%) both from Sigma Aldrich, St. Louis, MO, USA. Deionized water or ethanol (CH3CH2OH, EtOH, 99.5%) were used as solvents. In a typical synthesis, 45 mL of each solvent was mixed to 15 mL of HCl and stirred for 5 min. Afterwards, 2 mL of TTIP was added and the final mixture stirred for 10 min before microwave synthesis.
Microwave synthesis was performed using a CEM Focused Microwave Synthesis System Discover SP. Time, power and maximum pressure have been set at 75 min, 100 W and 17 bar, respectively. Solution volumes of 20 mL were transferred into capped quartz vessels of 35 mL, which were kept sealed by the constraining surrounding pressure. The synthesis temperature was fixed to 80 °C and 200 °C, and the materials produced were named: 80 °C H2O, 200 °C H2O, 80 °C EtOH, and 200 °C EtOH regarding the temperature and solvent used.
Each microwave reaction resulted in powder and arrays grown on the flexible substrate. In the case of the spheres, the powder composed of micro-sized spheres were collected from the bottom of the microwave vessel, washed with deionized water, centrifuged for 5 min at 4000 rpm for several times, and dried at 50 °C for 3 h. The TiO2 arrays were grown on seeded substrate, i.e., polyethylene terephthalate, following a simple and efficient approach (Figure 9). For the microwave reaction, a piece of seeded PET substrate (20.0 mm × 20.0 mm) was placed at an angle against the vessel with the seed layer facing down [5]. The flexible substrates exposed to 200 °C and higher pressure became fragile after synthesis, and this condition has not been investigated. The nanorod arrays were synthesized at 80 °C and substrate kept malleable. After the synthesis, the materials were cleaned with deionized water and dried in air.
Regarding the ZnO thin films to act as seed layers, their deposition was carried out using the spin-coating method. The ZnO solution was prepared from zinc acetate dihydrate (Zn(CH3COO)2·2H2O, 98%), ethanolamine (C2H7NO, 99%) and 2-methoxiethanol (C3H8O2, 99.8%). The reagents are from Sigma Aldrich and were used without further purification. In a typical reaction, the seed layer solution was prepared by dissolving zinc acetate in 2-methoxiethanol and then adding the ethanolamine. The proportion between zinc acetate and ethanolamine is 1:1, and the final mixture concentration was kept at 0.35 M [64]. The mixture was stirred for 1 h at 60 °C and filtered before depositing the ZnO thin films by the spin-coating method. Before deposition, the PET substrate was ultrasonically cleaned in isopropanol (10 min) and dried with compressed air. No treatment to increase adhesion has been performed. The film deposition was carried out at 3000 rpm for 35 s at room temperature. After each deposition, the films were dried at 180 °C for 10 min to remove the solvents, until completing a total of 6 depositions. In the final layer, the substrate with the deposited film was annealed for 1 h at 180 °C. The annealing temperature selected is between the PET glass transition temperature (~80 °C) and its melting temperature (~ 250 °C) [74], however an analogous study revealed that this temperature range is necessary to properly eliminate the reagents [64]. The thickness of the ZnO seed layer cannot be properly estimated as some ZnO chemical etching is expected during microwave synthesis. Nevertheless, prior to synthesis, in Figure S6, the estimated seed layer thickness was 50.7 ± 3.6 nm. Some increment to the photocatalytic behavior of the TiO2 arrays can be expected from the ZnO seed layer. In fact, the use of ZnO thin films as seed layers for growth TiO2 materials has been reported previously [75,76], where the combination of both oxides with high chemical stability and UV absorption, result in enhanced photocatalytic activity [75].

3.2. Structural and Optical Characterizations

X-ray diffraction experiments were performed using a PANalytical’s X’Pert PRO MPD diffractometer equipped with a X’Celerator 1D detector and using CuKα radiation. The XRD data were acquired in the 20°–75° 2θ range with a step size of 0.05°. The XRD data were employed to determine the phase and composition of TiO2 nanorod spheres. The PET substrate originates very broad and intense peaks on XRD, obscuring the signal of the TiO2 arrays. For comparison, powder diffractograms of rutile, anatase, brookite have been simulated with PowderCell [77] using crystallographic data from Reference [78]. Raman spectroscopy experiments were performed at room temperature, using a Xplora plus Horiba spectrometer and a 532 nm laser.
Surface and cross-section SEM observations were carried out using a Carl Zeiss AURIGA CrossBeam FIB-SEM workstation equipped for EDS measurements. The dimensions of individual nanorods, spheres and arrays have been determined from SEM micrographs using the ImageJ software [79] and considering 30 distinct structures for each measurement. TEM observations were carried out with a Hitachi H8100 microscope operated at 200 kV. A drop of the sonicated dispersion was deposited onto 200-mesh copper grids covered with formvar and allowed to dry before observation.
Diffuse reflectance spectroscopy measurements of the nanorod spheres (dried powders) and arrays (TiO2 nanorod arrays + ZnO seed layer + PET substrate) were performed in the 250–800 nm range with a PerkinElmer lambda 950 UV/VIS/NIR spectrophotometer equipped with a 150 mm diameter integrating sphere integrating sphere. The calibration of the system was achieved by using a standard reflector sample (reflectance, R = 1.00 from Spectralon disk). The optical band gap of the TiO2 films was estimated from reflectance spectra using the Tauc plot method [65,80,81].

3.3. Photocatalytic Activity

The photocatalytic activity of the produced materials was evaluated at room temperature from the degradation of rhodamine B from Sigma Aldrich. The experiments considered the International standard ISO 10678. For each experiment, 25 mg of each powder containing the TiO2 nanorod spheres was dispersed in 50 mL of the rhodamine B solution (5 mg/L) and then stirred for 30 min in the dark to establish absorption-desorption equilibrium. The TiO2 nanorod arrays were used without any further preparation, where the flexible substrates with the arrays were placed on the bottom of the recipient and kept in the dark under stirring for 30 min prior to exposure. UV exposure was carried out using 3 lamps of 95 W aligned in parallel, from Osram, with an emission wavelength of 254 nm (ozone free). The distance between the light sources and the materials was 10 cm. Absorption spectra were recorded using a PerkinElmer lambda 950 UV/VIS/NIR spectrophotometer with intervals of 30 min for the first 90 min, and one more exposure of 60 min to complete a total exposure time of 150 min. For powder materials, after each exposure, 4 mL of the rhodamine B solution with the catalyst was collected and centrifuged for 5 min at 4000 rpm. After the absorption spectrum acquisition, the solution measured was returned to the recipient for further measurements. To perform reusability experiments, the powder was recovered by centrifugation, discarding the liquid from the previous exposure and drying the remaining material at 50 °C for 3 h. The reusability tests were carried out by the repeated UV exposure of the same sample in fresh solutions for 90 min along several weeks. The commercial TiO2 (Degussa P25) was used for comparison (see Supplementary Materials). All the photocatalysts (TiO2 nanorod spheres and arrays) were exposed to a solar light simulating source for equal exposure times as the UV experiments using a Xe lamp at room temperature with intensity of 100 mW/cm2 and AM1.5 spectrum. Exposure experiments at a fixed wavelength of 500 nm over time were carried out using the PerkinElmer lambda 950 UV/VIS/NIR spectrophotometer.

4. Conclusions

Microwave irradiation proved to be an effective synthesis route to produce TiO2 powders and arrays at low process temperatures, compatible with the use of flexible and low-cost substrates as PET. The approach proposed in this study appears as a valid option due to the low-priced characteristics of the synthesis and seed layer deposition routes. The material characteristics and final properties can be tuned by selecting the solvent and limiting the synthesis temperature. Water revealed to be the most adequate solvent for synthesizing materials with a mixture of phases and higher photocatalytic activities; nevertheless, ethanol formed homogeneous rutile-based materials with good photocatalytic degradation under UV radiation. Photocatalytic activity was assessed from rhodamine B degradation, with the 80 °C H2O nanorod spheres showing the highest photocatalytic activity of all materials tested under UV radiation (95% after 90 min) and displaying reusability characteristics over time. All the materials were further exposed to solar radiation and the 80 °C H2O powder resulted in a rhodamine B degradation of 55% after 150 min. The presence of the brookite phase in this material was determined as the main responsible for the increased photocatalytic activity. Nevertheless, a relation between the nanorod, sphere and aggregate sizes and their photocatalytic activity has been suggested for all materials tested. In the present study, both the nanorod spheres and arrays presented remarkable photocatalytic activity and, depending on the application desired, the materials can be employed as powders that are easily recycled, as they appear in the micrometer range, or as arrays grown on flexible substrates that can be adapted to several surfaces.

Supplementary Materials

The following are available online at www.mdpi.com/2073-4344/7/2/60/s1. Figure S1: SEM images of the 80 °C H2O nanorod spheres showing the nanorods radially arranged. The inset evidences the nanorod structures inside the sphere. Figure S2: Cross-section SEM images (artificial colored) of the: (a) 80 °C H2O; and (e) 80 °C EtOH nanorod arrays grown on ZnO seeded PET substrates, together with the corresponding X-ray maps of Ti: (b,f); O (c,g); and C (d,h). Figure S3: Rhodamine B absorbance spectra at different UV exposure times for the TiO2 nanorod spheres produced with water at: (a) 80 °C; and (b) 200 °C; and with ethanol at: (d) 80 °C; and (e) 200 °C. The TiO2 nanorod arrays grown on PET were also tested as photocatalystis at 80 °C for: (c) water; and (f) ethanol. The photograph illustrates the PET substrate with the TiO2 nanorod arrays covering a tube containing the pollutant solution. The absorbance spectra have not been normalized. Figure S4: Rhodamine B degradation ratio (C/C0) vs. UV exposure time for the 80 °C H2O nanorod spheres and Degussa P25. Figure S5: Absorbance measurements over time at 500 nm for all the TiO2 nanorod spheres. Figure S6: Cross-section SEM image of the ZnO seed layer prior to microwave synthesis.

Acknowledgments

The work was supported by the FCT—Portuguese Foundation for Science and Technology, through the scholarship BPD/84215/2012, as well as by the European project CEOPS with the grant agreement No.: 309984. The work was also supported by FEDER funds through the COMPETE 2020 Programme and National Funds through FCT under the project UID/CTM/50025/2013.

Author Contributions

Daniela Nunes synthesized the materials; Daniela Nunes and Ana Pimentel performed the photocatalytic experiments and structural characterization; optical characterization was performed by Lidia Santos; and the work and paper was under the supervision of Pedro Barquinha, Rodrigo Martins and Elvira Fortunato.

Conflicts of Interests

The authors declare no conflict of interest.

References

  1. Bai, J.; Zhou, B. Titanium dioxide nanomaterials for sensor applications. Chem. Rev. 2014, 114, 10131–10176. [Google Scholar] [CrossRef] [PubMed]
  2. Bernacka-Wojcik, I.; Senadeera, R.; Wojcik, P.J.; Silva, L.B.; Doria, G.; Baptista, P.; Aguas, H.; Fortunato, E.; Martins, R. Inkjet printed and “doctor blade” TiO2 photodetectors for DNA biosensors. Biosens. Bioelectron. 2010, 25, 1229–1234. [Google Scholar] [CrossRef] [PubMed]
  3. Lin, J.; Heo, Y.-U.; Nattestad, A.; Sun, Z.; Wang, L.; Kim, J.H.; Dou, S.X. 3D hierarchical rutile TiO2 and metal-free organic sensitizer producing dye-sensitized solar cells 8.6% conversion efficiency. Sci. Rep. 2014, 4. [Google Scholar] [CrossRef] [PubMed]
  4. Pimentel, A.; Nunes, D.; Pereira, S.; Martins, R.; Fortunato, E. Photocatalytic activity of TiO2 nanostructured arrays prepared by microwave-assisted solvothermal method. In Semiconductor Photocatalysis—Materials, Mechanisms and Applications; Cao, W., Ed.; InTech: Rijeka, Croatia, 2016. [Google Scholar]
  5. Nunes, D.; Pimentel, A.; Pinto, J.V.; Calmeiro, T.R.; Nandy, S.; Barquinha, P.; Pereira, L.; Carvalho, P.A.; Fortunato, E.; Martins, R. Photocatalytic behavior of TiO2 films synthesized by microwave irradiation. Catal. Today 2016, 278, 262–270. [Google Scholar] [CrossRef]
  6. Nakata, K.; Fujishima, A. TiO2 photocatalysis: Design and applications. J. Photochem. Photobiol. C Photochem. Rev. 2012, 13, 169–189. [Google Scholar] [CrossRef]
  7. Schneider, J.; Matsuoka, M.; Takeuchi, M.; Zhang, J.; Horiuchi, Y.; Anpo, M.; Bahnemann, D.W. Understanding TiO2 photocatalysis: Mechanisms and materials. Chem. Rev. 2014, 114, 9919–9986. [Google Scholar] [CrossRef] [PubMed]
  8. Jin, X.; Xu, J.; Wang, X.; Xie, Z.; Liu, Z.; Liang, B.; Chen, D.; Shen, G. Flexible TiO2/cellulose acetate hybrid film as a recyclable photocatalyst. RSC Adv. 2014, 4, 12640–12648. [Google Scholar] [CrossRef]
  9. Sunada, K.; Kikuchi, Y.; Hashimoto, K.; Fujishima, A. Bactericidal and detoxification effects of TiO2 thin film photocatalysts. Environ. Sci. Technol. 1998, 32, 726–728. [Google Scholar] [CrossRef]
  10. Vukoje, I.; Kovač, T.; Džunuzović, J.; Džunuzović, E.; Lončarević, D.; Ahrenkiel, S.P.; Nedeljković, J.M. Photocatalytic ability of visible-light-responsive TiO2 nanoparticles. J. Phys. Chem. C 2016, 120, 18560–18569. [Google Scholar] [CrossRef]
  11. Kerkez, Ö.; Boz, İ. Efficient removal of methylene blue by photocatalytic degradation with TiO2 nanorod array thin films. React. Kinet. Mech. Catal. 2013, 110, 543–557. [Google Scholar] [CrossRef]
  12. Chen, D.Y.; Tsao, C.C.; Hsu, C.Y. Photocatalytic TiO2 thin films deposited on flexible substrates by radio frequency (RF) reactive magnetron sputtering. Curr. Appl. Phys. 2012, 12, 179–183. [Google Scholar] [CrossRef]
  13. Guo, Y.; Li, H.; Chen, J.; Wu, X.; Zhou, L. TiO2 mesocrystals built of nanocrystals with exposed {001} facets: Facile synthesis and superior photocatalytic ability. J. Mater. Chem. A 2014, 2, 19589–19593. [Google Scholar] [CrossRef]
  14. Kenanakis, G.; Vernardou, D.; Dalamagkas, A.; Katsarakis, N. Photocatalytic and electrooxidation properties of TiO2 thin films deposited by sol–gel. Catal. Today 2015, 240, 146–152. [Google Scholar] [CrossRef]
  15. Kazuhito, H.; Hiroshi, I.; Akira, F. TiO2 photocatalysis: A historical overview and future prospects. Jpn. J. Appl. Phys. 2005, 44, 8269–8285. [Google Scholar]
  16. Rathee, D.; Arya, S.; Kumar, M. Analysis of TiO2 for microelectronic applications: Effect of deposition methods on their electrical properties. Front. Optoelectron. China 2011, 4, 349–358. [Google Scholar] [CrossRef]
  17. Di Paola, A.; Bellardita, M.; Palmisano, L. Brookite, the least known TiO2 photocatalyst. Catalysts 2013, 3, 36–73. [Google Scholar] [CrossRef]
  18. Reyes-Coronado, D.; Rodríguez-Gattorno, G.; Espinosa-Pesqueira, M.; Cab, C.; De Coss, R.; Oskam, G. Phase-pure TiO2 nanoparticles: Anatase, brookite and rutile. Nanotechnology 2008, 19, 145605. [Google Scholar] [CrossRef] [PubMed]
  19. Kawahara, T.; Konishi, Y.; Tada, H.; Tohge, N.; Nishii, J.; Ito, S. A patterned TiO2(anatase)/TiO2 (rutile) bilayer-type photocatalyst: Effect of the anatase/rutile junction on the photocatalytic activity. Angew. Chem. 2002, 114, 2935–2937. [Google Scholar] [CrossRef]
  20. Wang, R.; Cai, X.; Shen, F. Preparation of TiO2 hollow microspheres by a novel vesicle template method and their enhanced photocatalytic properties. Ceram. Int. 2013, 39, 9465–9470. [Google Scholar] [CrossRef]
  21. Andersson, M.; Österlund, L.; Ljungström, S.; Palmqvist, A. Preparation of nanosize anatase and rutile TiO2 by hydrothermal treatment of microemulsions and their activity for photocatalytic wet oxidation of phenol. J. Phys. Chem. B 2002, 106, 10674–10679. [Google Scholar] [CrossRef]
  22. Luttrell, T.; Halpegamage, S.; Tao, J.; Kramer, A.; Sutter, E.; Batzill, M. Why is anatase a better photocatalyst than rutile?—Model studies on epitaxial TiO2 films. Sci. Rep. 2014, 4, 4043. [Google Scholar] [CrossRef] [PubMed]
  23. Nakajima, H.; Mori, T.; Shen, Q.; Toyoda, T. Photoluminescence study of mixtures of anatase and rutile TiO2 nanoparticles: Influence of charge transfer between the nanoparticles on their photoluminescence excitation bands. Chem. Phys. Lett. 2005, 409, 81–84. [Google Scholar] [CrossRef]
  24. Kandiel, T.A.; Robben, L.; Alkaim, A.; Bahnemann, D. Brookite versus anatase TiO2 photocatalysts: Phase transformations and photocatalytic activities. Photochem. Photobiol. Sci. 2013, 12, 602–609. [Google Scholar] [CrossRef] [PubMed]
  25. Boppella, R.; Basak, P.; Manorama, S.V. Viable method for the synthesis of biphasic TiO2 nanocrystals with tunable phase composition and enabled visible-light photocatalytic performance. ACS Appl. Mater. Int. 2012, 4, 1239–1246. [Google Scholar] [CrossRef] [PubMed]
  26. Rochkind, M.; Pasternak, S.; Paz, Y. Using dyes for evaluating photocatalytic properties: A critical review. Molecules 2014, 20, 88–110. [Google Scholar] [CrossRef] [PubMed]
  27. Lee, J.H.; Kang, M.; Choung, S.-J.; Ogino, K.; Miyata, S.; Kim, M.-S.; Park, J.-Y.; Kim, J.-B. The preparation of TiO2 nanometer photocatalyst film by a hydrothermal method and its sterilization performance for giardia lamblia. Water Res. 2004, 38, 713–719. [Google Scholar] [CrossRef] [PubMed]
  28. Paramasivam, I.; Jha, H.; Liu, N.; Schmuki, P. A review of photocatalysis using self-organized TiO2 nanotubes and other ordered oxide nanostructures. Small 2012, 8, 3073–3103. [Google Scholar] [CrossRef] [PubMed]
  29. Tan, Z.; Sato, K.; Takami, S.; Numako, C.; Umetsu, M.; Soga, K.; Nakayama, M.; Sasaki, R.; Tanaka, T.; Ogino, C.; et al. Particle size for photocatalytic activity of anatase TiO2 nanosheets with highly exposed {001} facets. RSC Adv. 2013, 3, 19268–19271. [Google Scholar] [CrossRef]
  30. Tang, H.; Zhang, D.; Tang, G.; Ji, X.; Li, C.; Yan, X.; Wu, Q. Low temperature synthesis and photocatalytic properties of mesoporous TiO2 nanospheres. J. Alloys Compd. 2014, 591, 52–57. [Google Scholar] [CrossRef]
  31. Hafez, H.S. Synthesis of highly-active single-crystalline TiO2 nanorods and its application in environmental photocatalysis. Mater. Lett. 2009, 63, 1471–1474. [Google Scholar] [CrossRef]
  32. Scuderi, V.; Impellizzeri, G.; Zimbone, M.; Sanz, R.; Di Mauro, A.; Buccheri, M.A.; Miritello, M.; Terrasi, A.; Rappazzo, G.; Nicotra, G.; et al. Rapid synthesis of photoactive hydrogenated TiO2 nanoplumes. Appl. Catal. B Environ. 2016, 183, 328–334. [Google Scholar] [CrossRef]
  33. Jitputti, J.; Suzuki, Y.; Yoshikawa, S. Synthesis of TiO2 nanowires and their photocatalytic activity for hydrogen evolution. Catal. Commun. 2008, 9, 1265–1271. [Google Scholar] [CrossRef]
  34. Bai, H.; Liu, Z.; Liu, L.; Sun, D.D. Large-scale production of hierarchical TiO2 nanorod spheres for photocatalytic elimination of contaminants and killing bacteria. Chem. Eur. J. 2013, 19, 3061–3070. [Google Scholar] [CrossRef] [PubMed]
  35. Wang, W.-Y.; Chen, B.-R. Characterization and photocatalytic activity of TiO2 nanotube films prepared by anodization. Int. J. Photoenergy 2013, 2013. [Google Scholar] [CrossRef]
  36. Xingtao, J.; Wen, H.; Xudong, Z.; Hongshi, Z.; Zhengmao, L.; Yingjun, F. Microwave-assisted synthesis of anatase TiO2 nanorods with mesopores. Nanotechnology 2007, 18, 075602. [Google Scholar]
  37. Gregori, D.; Benchenaa, I.; Chaput, F.; Therias, S.; Gardette, J.L.; Leonard, D.; Guillard, C.; Parola, S. Mechanically stable and photocatalytically active TiO2/SiO2 hybrid films on flexible organic substrates. J. Mater. Chem. A 2014, 2, 20096–20104. [Google Scholar] [CrossRef]
  38. Chen, X.; Mao, S.S. Titanium dioxide nanomaterials: Synthesis, properties, modifications, and applications. Chem. Rev. 2007, 107, 2891–2959. [Google Scholar] [CrossRef] [PubMed]
  39. Antonelli, D.M.; Ying, J.Y. Synthesis of hexagonally packed mesoporous TiO2 by a modified sol–gel method. Angew. Chem. Int. Ed. Engl. 1995, 34, 2014–2017. [Google Scholar] [CrossRef]
  40. Scuderi, V.; Impellizzeri, G.; Romano, L.; Scuderi, M.; Nicotra, G.; Bergum, K.; Irrera, A.; Svensson, B.G.; Privitera, V. TiO2-coated nanostructures for dye photo-degradation in water. Nanoscale Res. Lett. 2014, 9, 458. [Google Scholar] [CrossRef] [PubMed]
  41. Wu, J.-M.; Shih, H.C.; Wu, W.-T.; Tseng, Y.-K.; Chen, I.C. Thermal evaporation growth and the luminescence property of TiO2 nanowires. J. Cryst. Growth 2005, 281, 384–390. [Google Scholar] [CrossRef]
  42. Boyadzhiev, S.; Georgieva, V.; Rassovska, M. Characterization of reactive sputtered TiO2 thin films for gas sensor applications. J. Phys. 2010, 253, 012040. [Google Scholar]
  43. Lee, D.; Rho, Y.; Allen, F.I.; Minor, A.M.; Ko, S.H.; Grigoropoulos, C.P. Synthesis of hierarchical TiO2 nanowires with densely-packed and omnidirectional branches. Nanoscale 2013, 5, 11147–11152. [Google Scholar] [CrossRef] [PubMed]
  44. Yu, J.; Wang, Y.; Xiao, W. Enhanced photoelectrocatalytic performance of SnO2/TiO2 rutile composite films. J. Mater. Chem. A 2013, 1, 10727–10735. [Google Scholar] [CrossRef]
  45. Zhao, X.; Liu, M.; Zhu, Y. Fabrication of porous TiO2 film via hydrothermal method and its photocatalytic performances. Thin Solid Films 2007, 515, 7127–7134. [Google Scholar] [CrossRef]
  46. Chen, Q.; Qian, Y.; Chen, Z.; Wu, W.; Chen, Z.; Zhou, G.; Zhang, Y. Hydrothermal epitaxy of highly oriented TiO2 thin films on silicon. Appl. Phys. Lett. 1995, 66, 1608–1610. [Google Scholar] [CrossRef]
  47. Bilecka, I.; Niederberger, M. Microwave chemistry for inorganic nanomaterials synthesis. Nanoscale 2010, 2, 1358–1374. [Google Scholar] [CrossRef] [PubMed]
  48. Zhao, Y.; Zhu, J.-J.; Hong, J.-M.; Bian, N.; Chen, H.-Y. Microwave-induced polyol-process synthesis of copper and copper oxide nanocrystals with controllable morphology. Eur. J. Inorg. Chem. 2004, 2004, 4072–4080. [Google Scholar] [CrossRef]
  49. Lidström, P.; Tierney, J.; Wathey, B.; Westman, J. Microwave assisted organic synthesis—A review. Tetrahedron 2001, 57, 9225–9283. [Google Scholar] [CrossRef]
  50. Nunes, D.; Pimentel, A.; Barquinha, P.; Carvalho, P.A.; Fortunato, E.; Martins, R. Cu2O polyhedral nanowires produced by microwave irradiation. J. Mater. Chem. C 2014, 2, 6097–6103. [Google Scholar] [CrossRef]
  51. Yang, M.; Ding, B.; Lee, S.; Lee, J.-K. Carrier transport in dye-sensitized solar cells using single crystalline TiO2 nanorods grown by a microwave-assisted hydrothermal reaction. J. Phys. Chem. C 2011, 115, 14534–14541. [Google Scholar] [CrossRef]
  52. Pimentel, A.; Rodrigues, J.; Duarte, P.; Nunes, D.; Costa, F.M.; Monteiro, T.; Martins, R.; Fortunato, E. Effect of solvents on ZnO nanostructures synthesized by solvothermal method assisted by microwave radiation: A photocatalytic study. J. Mater. Sci. 2015, 50, 5777–5787. [Google Scholar] [CrossRef]
  53. Pimentel, A.; Nunes, D.; Duarte, P.; Rodrigues, J.; Costa, F.M.; Monteiro, T.; Martins, R.; Fortunato, E. Synthesis of long ZnO nanorods under microwave irradiation or conventional heating. J. Phys. Chem. C 2014, 118, 14629–14639. [Google Scholar] [CrossRef]
  54. Marques, A.C.; Santos, L.; Costa, M.N.; Dantas, J.M.; Duarte, P.; Gonçalves, A.; Martins, R.; Salgueiro, C.A.; Fortunato, E. Office paper platform for bioelectrochromic detection of electrochemically active bacteria using tungsten trioxide nanoprobes. Sci. Rep. 2015, 5, 9910. [Google Scholar] [CrossRef] [PubMed]
  55. Gonçalves, A.; Resende, J.; Marques, A.C.; Pinto, J.V.; Nunes, D.; Marie, A.; Goncalves, R.; Pereira, L.; Martins, R.; Fortunato, E. Smart optically active VO2 nanostructured layers applied in roof-type ceramic tiles for energy efficiency. Sol. Energy Mater. Sol. C 2016, 150, 1–9. [Google Scholar] [CrossRef]
  56. Herring, N.P.; Panda, A.B.; AbouZeid, K.; Almahoudi, S.H.; Olson, C.R.; Patel, A.; El-Shall, M.S. Microwave synthesis of metal oxide nanoparticles. In Metal Oxide Nanomaterials for Chemical Sensors; Carpenter, A.M., Mathur, S., Kolmakov, A., Eds.; Springer: New York, NY, USA, 2013. [Google Scholar]
  57. Wang, Y.; Zhang, L.; Deng, K.; Chen, X.; Zou, Z. Low temperature synthesis and photocatalytic activity of rutile TiO2 nanorod superstructures. J. Phys. Chem. C 2007, 111, 2709–2714. [Google Scholar] [CrossRef]
  58. Yan, J.; Feng, S.; Lu, H.; Wang, J.; Zheng, J.; Zhao, J.; Li, L.; Zhu, Z. Alcohol induced liquid-phase synthesis of rutile titania nanotubes. Mater. Sci. Eng. B 2010, 172, 114–120. [Google Scholar] [CrossRef]
  59. Wang, Y.; Li, L.; Huang, X.; Li, Q.; Li, G. New insights into fluorinated TiO2 (brookite, anatase and rutile) nanoparticles as efficient photocatalytic redox catalysts. RSC Adv. 2015, 5, 34302–34313. [Google Scholar] [CrossRef]
  60. Wang, M.; Li, Q.; Yu, H.; Hur, S.H.; Kim, E.J. Phase-controlled preparation of TiO2 films and micro(nano)spheres by low-temperature chemical bath deposition. J. Alloys Compd. 2013, 578, 419–424. [Google Scholar] [CrossRef]
  61. Hayes, B.L. Microwave Synthesis: Chemistry at the Speed of Light; CEM Pub.: Matthews, NC, USA, 2002. [Google Scholar]
  62. Cao, G.; Wang, Y. Nanostructures and Nanomaterials: Synthesis, Properties, and Applications; World Scientific: Singapore, 2011. [Google Scholar]
  63. Zhou, W.; Liu, X.; Cui, J.; Liu, D.; Li, J.; Jiang, H.; Wang, J.; Liu, H. Control synthesis of rutile TiO2 microspheres, nanoflowers, nanotrees and nanobelts via acid-hydrothermal method and their optical properties. CrystEngComm 2011, 13, 4557–4563. [Google Scholar] [CrossRef]
  64. Pimentel, A.; Ferreira, S.; Nunes, D.; Calmeiro, T.; Martins, R.; Fortunato, E. Microwave synthesized ZnO nanorod arrays for UV sensors: A seed layer annealing temperature study. Material 2016, 9, 299. [Google Scholar] [CrossRef]
  65. Du, Y.; Zhang, M.S.; Wu, J.; Kang, L.; Yang, S.; Wu, P.; Yin, Z. Optical properties of SrTiO3 thin films by pulsed laser deposition. Appl. Phys. A 2003, 76, 1105–1108. [Google Scholar] [CrossRef]
  66. Aydın, C.; Benhaliliba, M.; Al-Ghamdi, A.; Gafer, Z.; El-Tantawy, F.; Yakuphanoglu, F. Determination of optical band gap of ZnO:ZnAl2O4 composite semiconductor nanopowder materials by optical reflectance method. J. Electroceram. 2013, 31, 265–270. [Google Scholar] [CrossRef]
  67. Yu, J.-G.; Yu, H.-G.; Cheng, B.; Zhao, X.-J.; Yu, J.C.; Ho, W.-K. The effect of calcination temperature on the surface microstructure and photocatalytic activity of TiO2 thin films prepared by liquid phase deposition. J. Phys. Chem. B 2003, 107, 13871–13879. [Google Scholar] [CrossRef]
  68. Wu, J.-M.; Shih, H.C.; Wu, W.-T. Formation and photoluminescence of single-crystalline rutile TiO2 nanowires synthesized by thermal evaporation. Nanotechnology 2006, 17, 105. [Google Scholar] [CrossRef]
  69. Nagaveni, K.; Sivalingam, G.; Hegde, M.S.; Madras, G. Solar photocatalytic degradation of dyes: High activity of combustion synthesized nano TiO2. Appl. Catal. B Environ. 2004, 48, 83–93. [Google Scholar] [CrossRef]
  70. Chen, L.; Yang, S.; Mader, E.; Ma, P.-C. Controlled synthesis of hierarchical TiO2 nanoparticles on glass fibres and their photocatalytic performance. Dalton Trans. 2014, 43, 12743–12753. [Google Scholar] [CrossRef] [PubMed]
  71. Chen, Y.-H.; Tu, K.-J. Thickness dependent on photocatalytic activity of hematite thin films. Int. J. Photoenergy 2011, 2012. [Google Scholar] [CrossRef]
  72. Wang, H.; Gao, X.; Duan, G.; Yang, X.; Liu, X. Facile preparation of anatase–brookite–rutile mixed-phase N-doped TiO2 with high visible-light photocatalytic activity. J. Environ. Chem. Eng. 2015, 3, 603–608. [Google Scholar] [CrossRef]
  73. Qiu, S.; Ben, T. Porous Polymers: Design, Synthesis and Applications; Royal Society of Chemistry: Cambridge, UK, 2015. [Google Scholar]
  74. Fann, D.M.; Huang, S.K.; Lee, J.Y. DSC studies on the crystallization characteristics of poly(ethylene terephthalate) for blow molding applications. Polym. Eng. Sci. 1998, 38, 265–273. [Google Scholar] [CrossRef]
  75. Kim, W.-Y.; Kim, S.-W.; Yoo, D.-H.; Kim, E.J.; Hahn, S.H. Annealing effect of ZnO seed layer on enhancing photocatalytic activity of ZnO/TiO2 nanostructure. Int. J. Photoenergy 2013, 2013. [Google Scholar] [CrossRef]
  76. Chou, H.-T.; Hsu, H.-C. The effect of annealing temperatures to prepare ZnO seeds layer on ZnO nanorods array/TiO2 nanoparticles photoanode. Solid-State Electr. 2016, 116, 15–21. [Google Scholar] [CrossRef]
  77. Kraus, W.; Nolze, G. Powder cell—A program for the representation and manipulation of crystal structures and calculation of the resulting X-Ray powder patterns. J. Appl. Crystallogr. 1996, 29, 301–303. [Google Scholar] [CrossRef]
  78. Pearson, W.B.; Villars, P.; Calvert, L.D. Pearson’s Handbook of Crystall Ographic Data for Intermetallic Phases; American Society for Metals: Cleveland, OH, USA, 1985. [Google Scholar]
  79. Schneider, C.A.; Rasband, W.S.; Eliceiri, K.W. NIH image to image J: 25 years of image analysis. Nat. Methods 2012, 9, 671–675. [Google Scholar] [CrossRef]
  80. Santos, L.; Nunes, D.; Calmeiro, T.; Branquinho, R.; Salgueiro, D.; Barquinha, P.; Pereira, L.; Martins, R.; Fortunato, E. Solvothermal synthesis of gallium-indium-zinc-oxide nanoparticles for electrolyte-gated transistors. ACS Appl. Mater. Interface 2015, 7, 638–646. [Google Scholar] [CrossRef] [PubMed]
  81. Tauc, J. Optical properties and electronic structure of amorphous Ge and Si. Mater. Res. Bull. 1968, 3, 37–46. [Google Scholar] [CrossRef]
Figure 1. (a) XRD diffractograms from the TiO2 nanorod spheres produced using water and ethanol at 80 and 200 °C. For comparison, experimental data are presented together with the simulated rutile, brookite and anatase diffractograms; (b) Raman spectra of the TiO2 nanorod spheres. Dot lines indicate the rutile bands and dashed ones point out to the brookite ones.
Catalysts 07 00060 g001
Figure 2. Raman spectra of the TiO2 nanorod arrays produced with water and ethanol at 80 °C, together with the PET substrate for comparison. Dot lines indicate the rutile bands and dashed ones point out to the brookite ones.
Catalysts 07 00060 g002
Figure 3. SEM images showing the TiO2 nanorod spheres produced under microwave irradiation with water as solvent at: (a) 80 °C; and (b) 200 °C; and using ethanol at: (c) 80 °C; and (d) 200 °C. The insets magnify the nanorod structures, and the arrows in (a) point to the nanorod structure inside the sphere (left side) and to the distinct TiO2 structure observed on the powder synthesized at 80 °C (right side) and using water as solvent.
Catalysts 07 00060 g003
Figure 4. (a) Bright field TEM image of the TiO2 structure detected at the 80 °C H2O nanorod spheres; (b) Ring diffraction pattern confirming the TiO2 brookite phase (TiO2 brookite simulation is included).
Catalysts 07 00060 g004
Figure 5. SEM images showing the TiO2 nanorod arrays produced under microwave irradiation and using: (a) water; and (b) ethanol as solvents. Both arrays were synthesized with temperature limited to 80 °C. The insets show the magnified image of the arrays and the cross-section of the arrays produced. The array pile-up observed for the 80 °C H2O condition is expected to be due to electron beam interactions with the flexible substrate during SEM analysis, causing the array detachment. A photograph of the bended PET substrate with the TiO2 nanorod arrays is also shown.
Catalysts 07 00060 g005
Figure 6.)2 variation versus photon energy for the TiO2 nanorod: (a) spheres; and (b) arrays.
Catalysts 07 00060 g006
Figure 7. (a) Rhodamine B degradation ratio (C/C0) vs. UV exposure time for all the materials produced. (b) Rhodamine B degradation ratio (C/C0) vs. UV exposure time for the 80 °C H2O nanorod spheres after several UV exposure experiments to attest the reusability of the material. The blank rhodamine B solution was simultaneously exposed during the degradation experiments.
Catalysts 07 00060 g007
Figure 8. (a) Rhodamine B absorbance spectra at different solar light exposure times for the 80 °C H2O nanorod spheres. (b) Rhodamine B degradation ratio (C/C0) vs. solar light exposure time. The blank rhodamine B solution was simultaneously exposed during the degradation experiments. The absorbance spectra have not been normalized.
Catalysts 07 00060 g008
Figure 9. Scheme of the ZnO seed layer deposition and TiO2 array growth. ZnO seed layer deposition on PET substrates by spin-coating and TiO2 nanorod arrays growth under microwave irradiation.
Catalysts 07 00060 g009

