
Promotive Effect of Sn2+ on Cu0/Cu+ Ratio and Stability Evolution of Cu/SiO2 Catalyst in the Hydrogenation of Dimethyl Oxalate

1
School of Chemical Engineering and Technology, Tianjin University, Tianjin 300072, China
2
School of Chemistry and Chemical Engineering of Shihezi University, Shihezi 832000, China
*
Author to whom correspondence should be addressed.
Catalysts 2017, 7(4), 122; https://doi.org/10.3390/catal7040122
Submission received: 26 March 2017
/
Revised: 13 April 2017
/
Accepted: 14 April 2017
/
Published: 19 April 2017
(This article belongs to the Special Issue Small Molecule Activation and Catalysis)
Abstract
:The influence of Sn2+doping on the structure and performance of silica supported copper catalyst was systematically investigated and characterised. Catalytic evaluation showed that the suitable content of Sn2+ introduced into a Cu/SiO2 catalyst evidently improved the catalytic activity and stability of ethylene glycol synthesis from dimethyl oxalate. X-ray diffraction and X-ray auger electron spectroscopy indicated that the Cu0/Cu+ ratio gradually increased with increasing Sn2+ content, and an appropriate proportion of Cu0/Cu+ ratio played a very significant role in this reaction. Transmission electron microscopy revealed that the active copper particles in the Cu-xSn/SiO2 catalyst were smaller than those of the Cu/SiO2 catalyst. This result may be due to the introduction of Sn2+ species transformed into SnO2. Furthermore, SnO2 effectively segregated the active copper. These effects are beneficial in inhibiting the aggregation of copper in the catalysts, thereby improving the stability of the catalyst and prolonging the life span.
1. Introduction
Hydrogenation of dimethyl oxalate (DMO) to ethylene glycol (EG) with coal as raw material is of industrial interest. This process has also become an important research topic considering various applications of EG and the growing market outlook. Copper-supported catalysts show potential catalytic activities for hydrogenation of DMO [1,2,3]. Copper catalyst exhibits high activity and selectivity for EG synthesis from DMO. However, the stability of the catalyst remains to be improved. Several factors, including metal dispersion, Cu0/Cu+ ratio, metal-support interaction, active-component sintering and carbon deposition, affect the stability of the catalyst [4,5,6,7,8]. Given the difficulty of improving the stability with a single copper catalyst, copper is modified by a second additive (Cr, Ni, B, Zn, Cu, Ag, Co and La), which favours catalytic stability in several recent studies [9,10,11]. In spite of some progress in this research direction, further study remains necessary. In addition, the use of tin additives to improve the stability of copper catalysts for hydrogenation of DMO to EG is seldom reported.
Sn species is a kind of promoter that improves the dispersion of active metals and stability of the catalyst [12,13,14,15]. Wang et al., reported that the selectivity and stability of isobutane dehydrogenation can be significantly enhanced by the addition of tin in Ni/SiO2 catalyst [16]. Such improvement is ascribed to the fact that tin doping can successfully reduce the size of nickel particles, and the presence of SnOx suppresses the migration of carbon deposition to prolong the lifetime. De Oliveira et al. found that a Co-Sn/ZnO2 catalyst with an atomic Sn/Co ratio of 1 exhibits the most desirable activity and selectivity for the hydrogenation of methyl oleate to oleyl alcohol [17]. Furthermore, the selectivity to unsaturated alcohol is considerably improved by doping tin to cobalt. These results indicated that the addition of tin in the catalyst may play a positive role in the hydrogenation of esters to alcohols. In addition, Sn2+ could play a certain role in adjusting the Cu0/Cu+ ratio in view of its strong reduction which is considered to influence the hydrogenation of DMO to EG.
In the present study, we aimed to investigate and explain the effect of Sn2+ content on metal dispersion, Cu0/Cu+ ratio and catalytic stability evolution of Cu-xSn/SiO2 catalysts during EG synthesis from DMO. We synthesised Cu/SiO2 catalysts and impregnated different Sn2+ contents onto these catalysts to generate Cu-xSn/SiO2. The Sn2+ content was adjusted over the range 0.3–2%. Consequently, part of Cu+ was effectively reduced to Cu0 due to the reduction of Sn2+. Therefore, we adjusted and optimised the Cu0/Cu+ ratio. We also embedded Sn species onto the surface of the catalyst to help separate and partially fix the copper. The catalytic activity and stability of the catalyst were obviously enhanced with Sn doping when compared with that of the Cu/SiO2 catalyst. Low-temperature N2 adsorption (Brunauer–Emmett–Teller (BET) method), transmission electron microscopy (TEM), X-ray diffraction (XRD), temperature-programmed reduction (TPR), X-ray photoelectron spectroscopy (XPS), X-ray auger electron spectroscopy (XAES) and inductively coupled plasma atomic emission spectrometry (ICP-AES) were used to analyse the structures and properties of the catalysts. Moreover, we investigated in detail the influence of Sn promoter on the structural changes and catalytic performance improvements in Cu/SiO2.
2. Results and Discussion
2.1. Characterisation of the Catalysts
The textural structures and chemical compositions of Cu/SiO2 and Cu-Sn/SiO2 catalysts after calcination at 450 °C for 5 h were analysed by ICP-AES. The actual amount of copper in the catalyst was about 11% (Table 1), which may be due in part to the residual copper in the solution. Another part of the weakly adsorbed copper on silicon dioxide was subsequently washed off. Tin loading was basically equal to the theoretical value because of the use of the impregnation method without loss of tin solution.
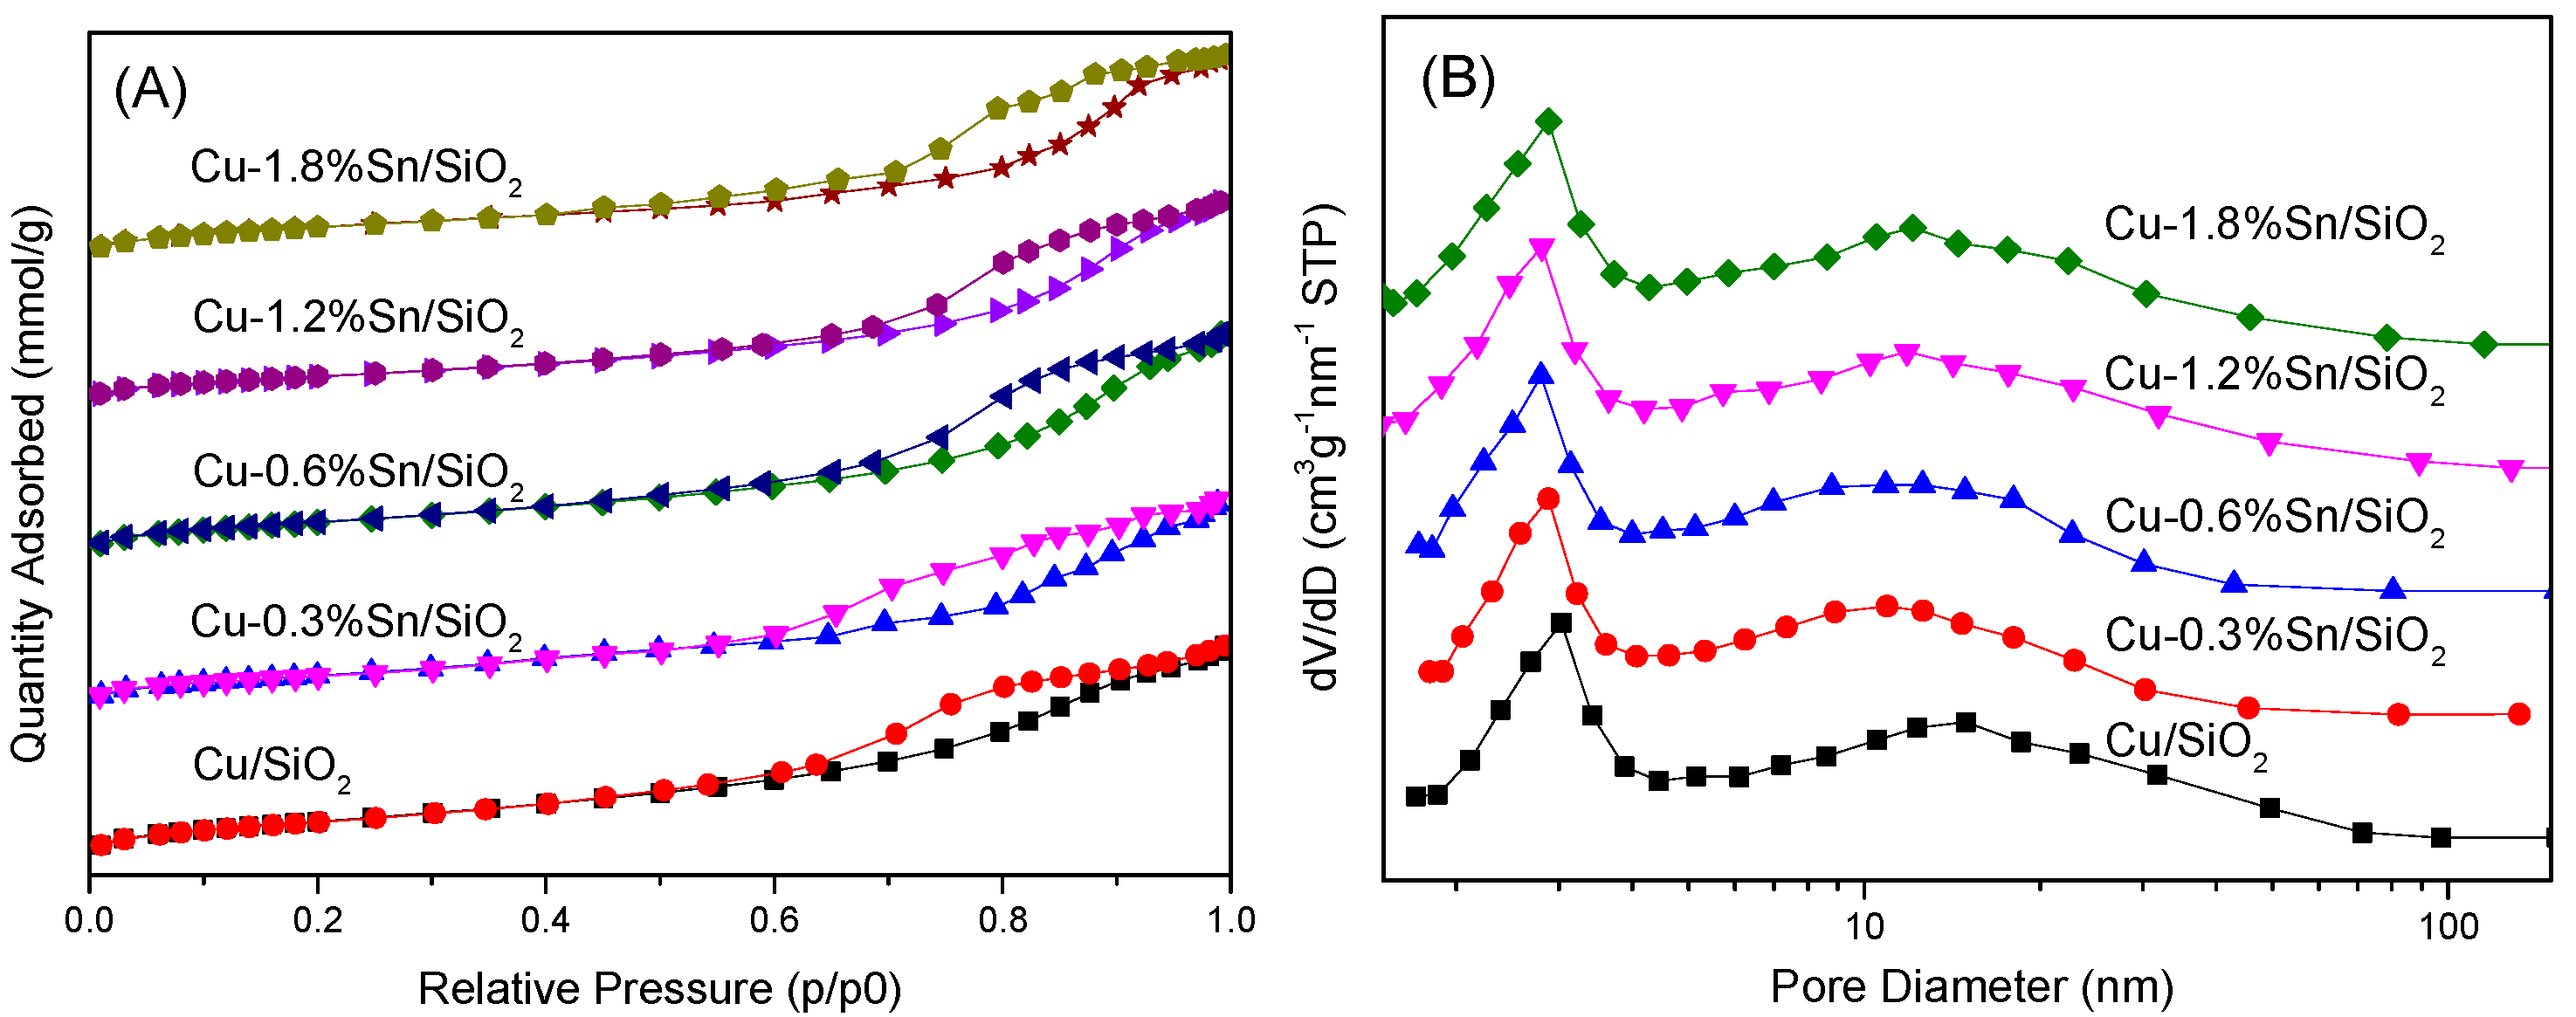
Figure 1 shows the N2 adsorption–desorption profiles and Barrett–Joyner–Halenda (BJH) pore size distribution curves of Cu/SiO2 and Cu-xSn/SiO2 catalysts. The N2 adsorption–desorption isotherms of all the catalysts belonged to type IV. The profiles of the N2 adsorption–desorption and BJH pore size distribution between Cu/SiO2 and the Cu-xSn/SiO2 catalysts showed no obvious change. This result indicated that the catalyst retained the type IV isotherms with shape similar to that of the H-type hysteresis loop.
The SBET was in the range of 221.8–246.7 m2·g−1. The specific surface area of the catalysts decreased from 246.7 to 221.8 m2·g−1 when the Sn content increased from 0.3% to 1.8%. This observation suggested that a small amount of Sn doping slightly affected the SBET of the catalysts.
The curve of the BJH pore size distribution showed that the catalyst possessed a double mesoporous structure. The average pore size of the catalysts was in the range of 10.1–10.5 nm, and the pore volumes ranged within 0.59–0.67 cm3·g−1. The average pore size of the catalyst increased with increasing tin content, whereas the pore volumes gradually decreased. This effect may have resulted from the partial covering of tin on the catalyst surface and the slight blocking of hole channels.
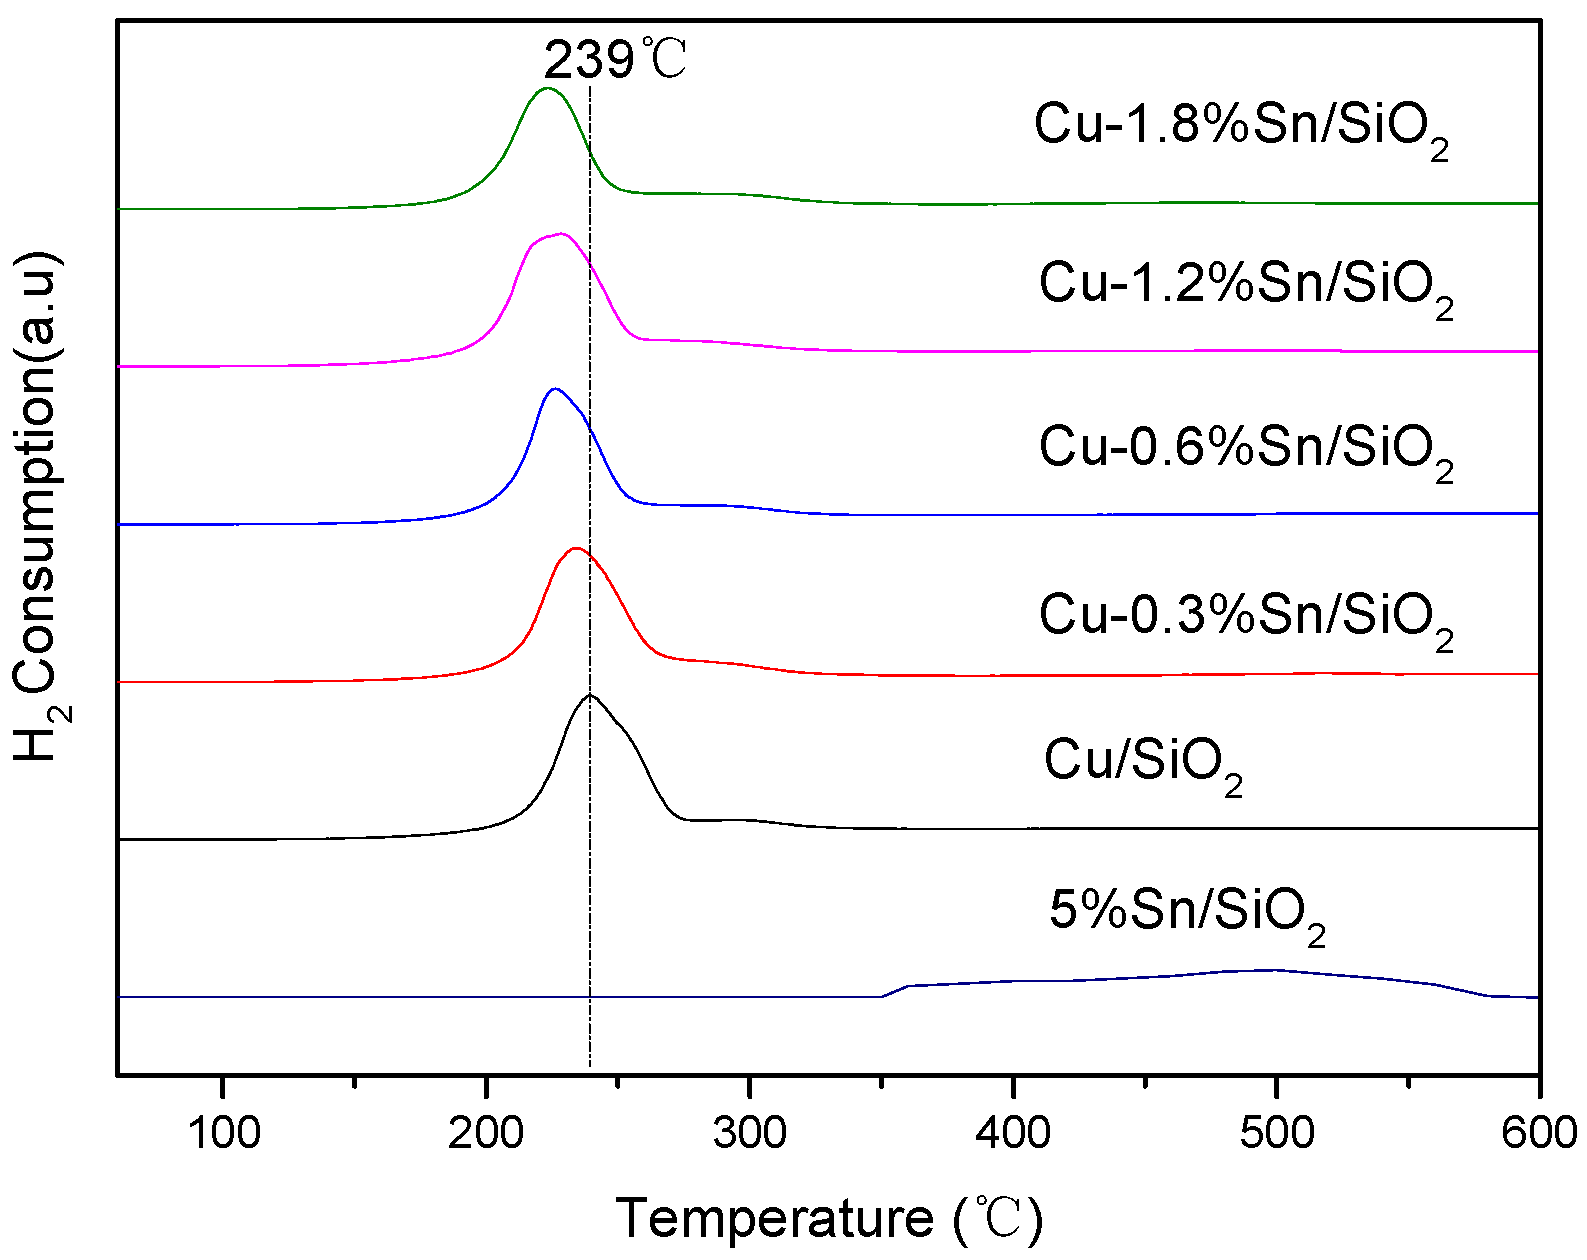
H2-TPR measurements were performed in order to study the reducibility of 5% Sn/SiO2, Cu/SiO2 and Cu-xSn/SiO2 catalysts (Figure 2). For 5% Sn/SiO2 catalyst, TPR showed two weak peaks at around 400 and 500 °C, which should be attributed to the reduction peak of tin oxides. It is obvious that tin oxides supported on silica are difficult to reduce at low temperature. Two reduction peaks can be observed in the Cu/SiO2 catalyst. One sharp and large reduction peak at about 239 °C was attributed to the highly dispersed CuO. Another weak peak located at around 300 °C was related to the reduction of large-particle CuO [18,19]. For Cu-xSn/SiO2 catalysts, three reduction peaks could be observed. The low and middle temperature reduction peaks corresponded to the reduction of cupric oxide, while the peak detected at 400–500 °C could be ascribed to the reduction of tin oxides. The first large reduction peak of the Cu-xSn/SiO2 catalysts gradually shifted to the low-temperature with increasing tin content compared with the Cu/SiO2 catalyst. This finding illustrated that part of the copper species was likely reduced by Sn2+ which confirmed that Sn2+ doping was favorable for the reduction of CuO. The third reduction peak at high temperature that belongs to the reduction of tin oxide was considerably weak due to the low content of Sn doping.
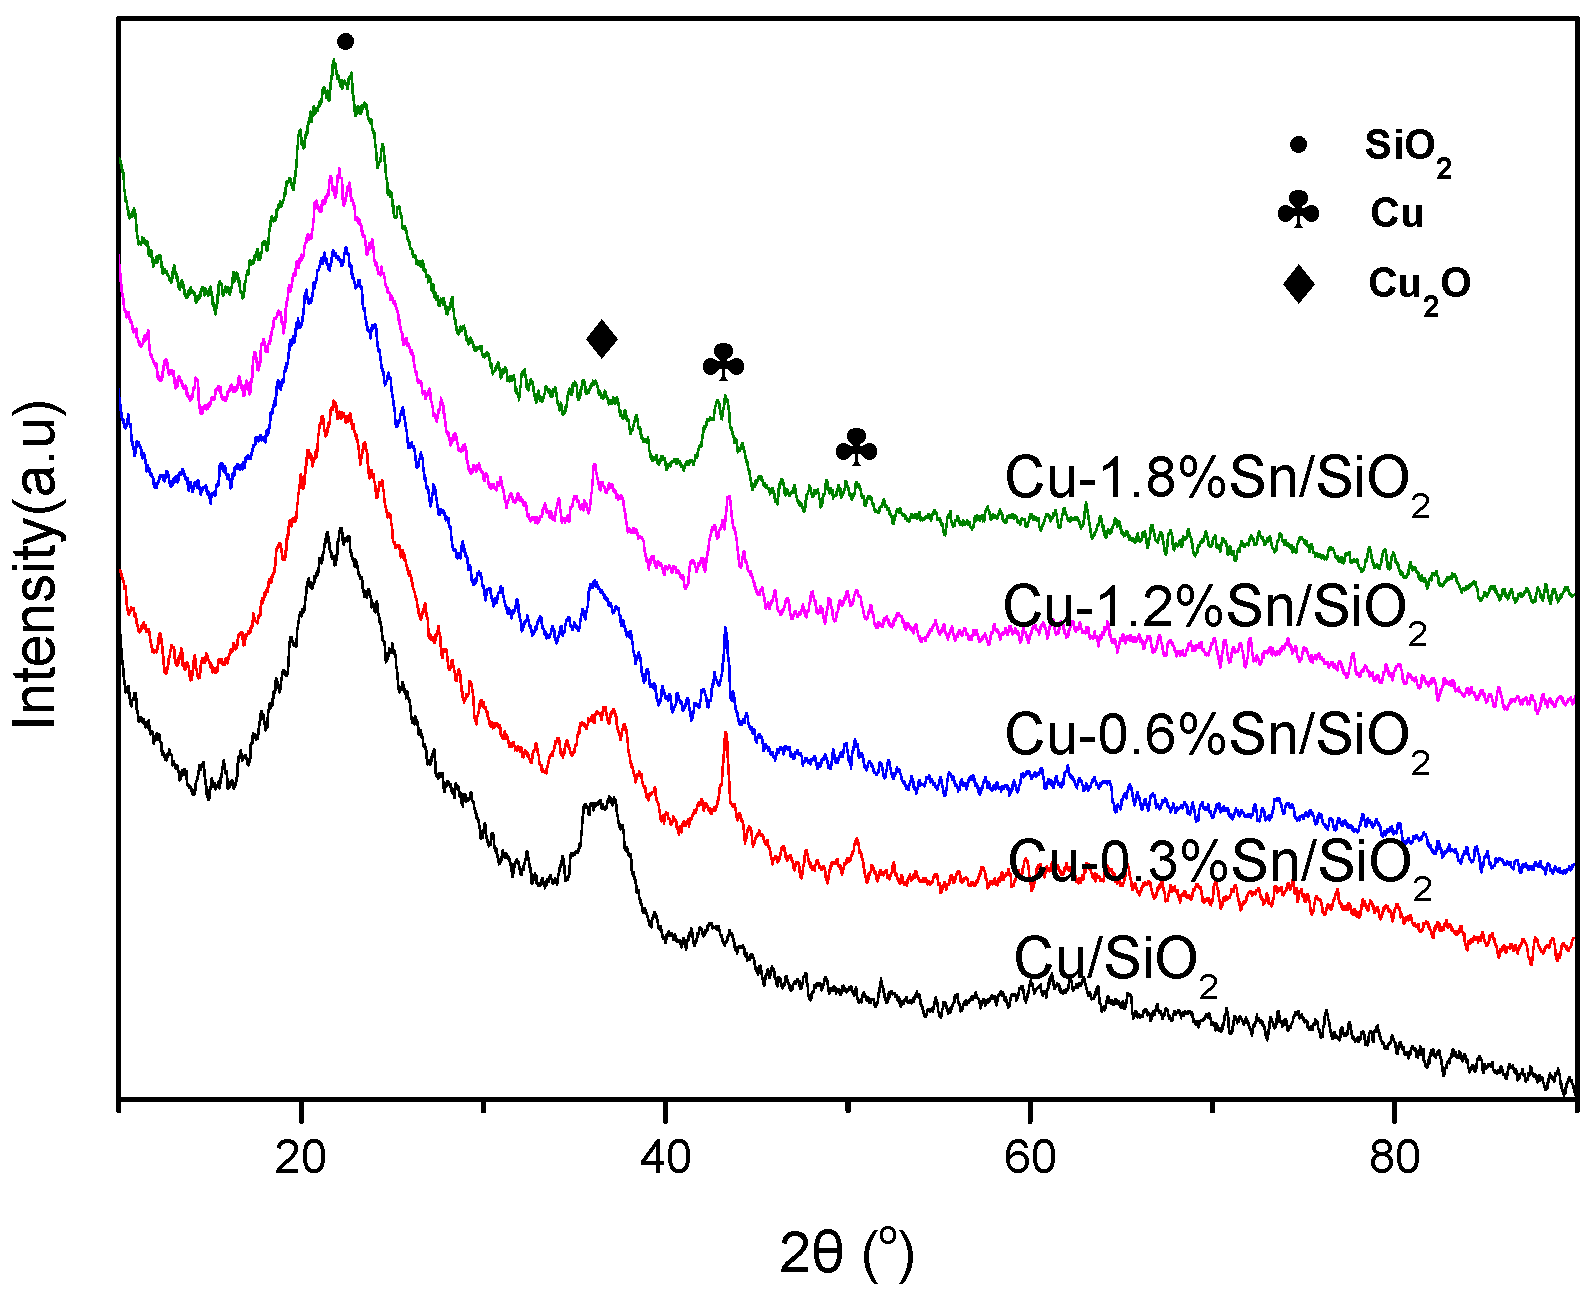
To investigate the possible Sn2+ doping-induced phase changes between Cu0 and Cu+, all reduced Cu/SiO2 and Cu-xSn/SiO2 catalysts were analysed by XRD. Four diffraction peaks were observed in all of the catalysts (Figure 3). These diffraction peaks of 2θ were located at 21.7°, 36.4°, 43.3° and 50.4°. The first diffraction peak at 2θ of 21.7° exhibited an amorphous silica structure. The peak position was located at the 2θ of 36.4°attached to the Cu2O phase. The two other diffraction peaks at the 2θ of 36.4° and 43.3° belonged to metallic Cu. The diffraction peaks of Cu and Cu2O were relatively weak, thereby suggesting that copper particles were remarkably small, and Cu species were well dispersed on the surface of the supports. The diffraction peaks of cuprous oxide evidently decreased gradually with increasing amount of tin doping, whereas the peak of copper increased gradually. This result indicated that part of Cu+ was reduced to Cu0, and the Cu0/Cu+ ratio was effectively adjusted. No obvious diffraction peak was detected for Sn and SnO2 phases, which may be due to the low level of Sn2+ doping in the catalysts.
The TEM images of the reduced Cu/SiO2 with and without Sn doping are presented in Figure 4. For all the catalysts, the supports involved numerous irregular spheres of ~20 nm diameter, and the metallic nanoparticles resembled small black spots scattered on the surface of the supports. The average particle sizes of the metal nanoparticles of the Cu/SiO2 and Cu-xSn/SiO2 catalysts were 4.33, 3.31, 3.68, 3.13 and 3.21 nm. The copper particles in the Cu-xSn/SiO2 catalysts were smaller than those of the Cu/SiO2, which may be due to the conversion of Sn2+ to SnO2 during immersion. Furthermore, tin oxide hindered the growth and aggregation of active copper particles in hydrogen reduction at low temperatures.
2.2. Catalytic Activity and Stability
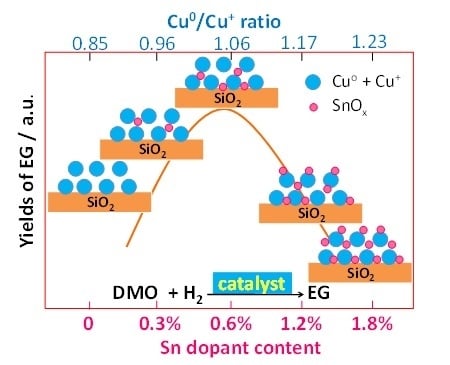
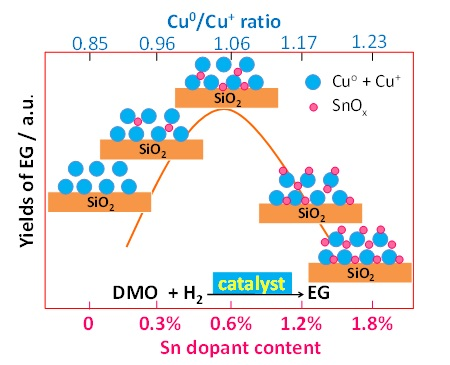
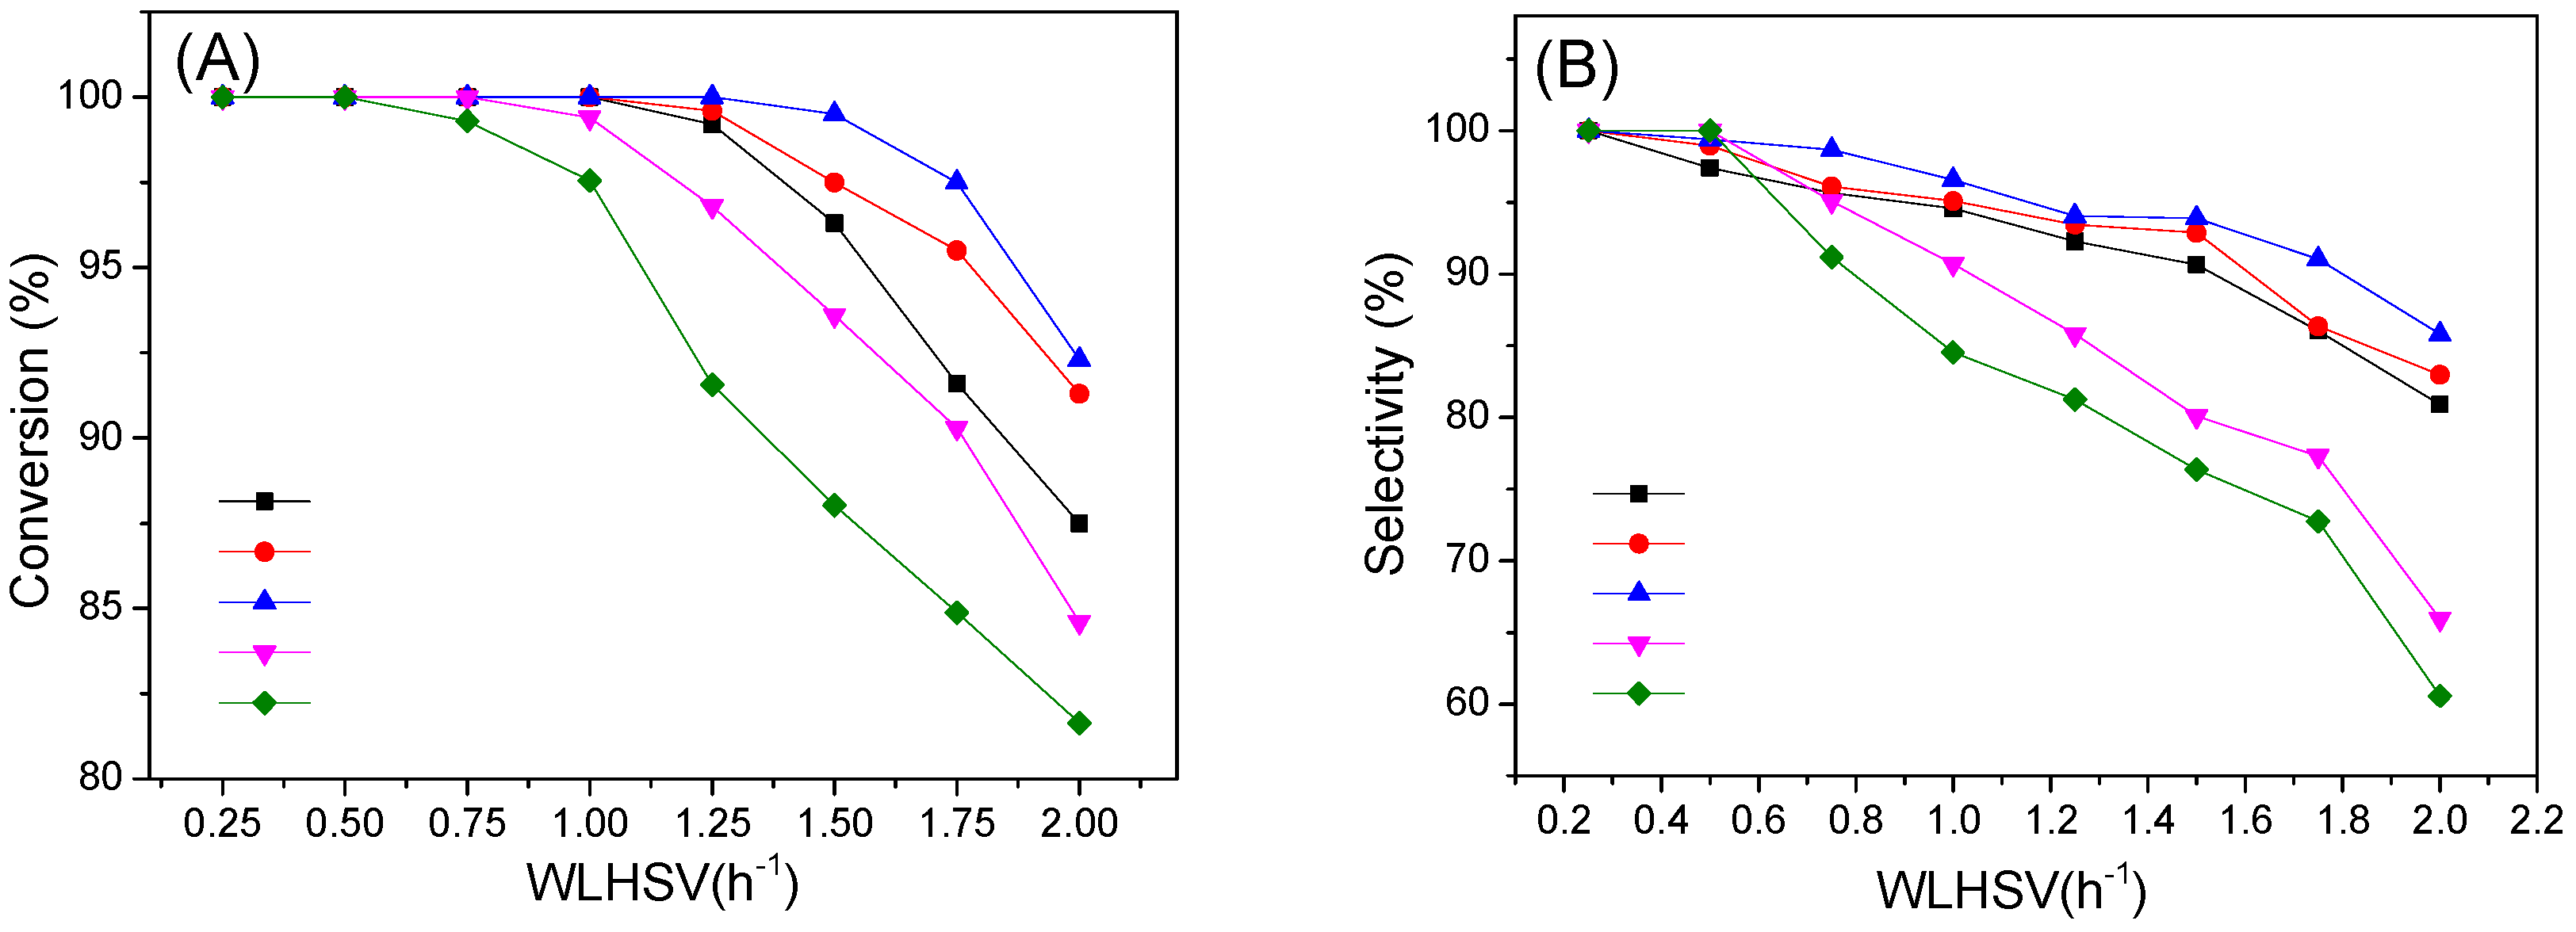
The experiments on DMO hydrogenation were carried out to study the effect of tin doping on the catalytic performance of copper catalyst. Figure 5 shows the comparison of DMO conversion (Figure 5A) and EG selectivity (Figure 5B) in Cu/SiO2 and Cu-xSn/SiO2 catalysts with varied weight liquid hour space velocity (WLHSVs). The reaction conditions were 2.5 MPa H2, 200 °C and H2/DMO ratio of 90. The catalytic performance exhibited a volcanic-like trend with the increase of tin doping in the copper catalysts. The Cu-0.6%Sn/SiO2 catalyst showed the most remarkable DMO conversion and EG selectivity, the conversion and selectivity of Cu-xSn/SiO2 catalyst with tin content higher than 1.2% evidently decreased, whereas the catalytic performance of Cu-1.8%Sn/SiO2 catalyst was the worst among all of the catalysts. This result may be due to excessive tin doping, which covered the copper surface and blocked the active site of the copper. Moreover, a large amount of Cu2+ was reduced to Cu0 with excessive Sn2+ so as to break the balance of Cu0 and Cu+.
Long-duration experiments were employed to investigate the stability of the catalyst. A comparison of the DMO conversion and EG selectivity of the Cu/SiO2 and Cu-0.6%Sn/SiO2 catalysts is shown in Figure 6. Cu-0.6%Sn/SiO2 exhibited satisfactory activity and lifetime. The DMO was completely transformed, the selectivity of EG was 96% in the Cu-0.6%Sn/SiO2 catalyst, and no decreasing trend was observed after about 200 h of reaction. However, the catalytic performance of Cu/SiO2 declined evidently after 90 h of reaction. This result indicated that a reasonable content of Sn doping improves the stability of the catalyst.
2.3. Characterisation of the Used Catalysts
To further investigate the reasons for improving the activity and stability, the XPS spectra of Sn 3d5/2 and Cu 2p of Cu/SiO2 and Cu-xSn/SiO2 catalysts for 8 h reaction were investigated. In Figure 7, an asymmetric Sn 3d5/2 peak at the binding energy (BE) of 487 eV implied the existence of tin oxides in the Cu-xSn/SiO2 catalysts. Although the BEs of Sn2+ (486.5 eV) and Sn4+ (487.3 eV) were close and difficult to distinguish by XPS, we deduced that the oxidised tin species were mainly composed of Sn4+ because the reaction between Sn2+ and Cu2+ can produce SnO2 easily. By contrast, SnO2 is difficult to reduce by hydrogen during reduction at 300 °C and reaction at 200 °C.
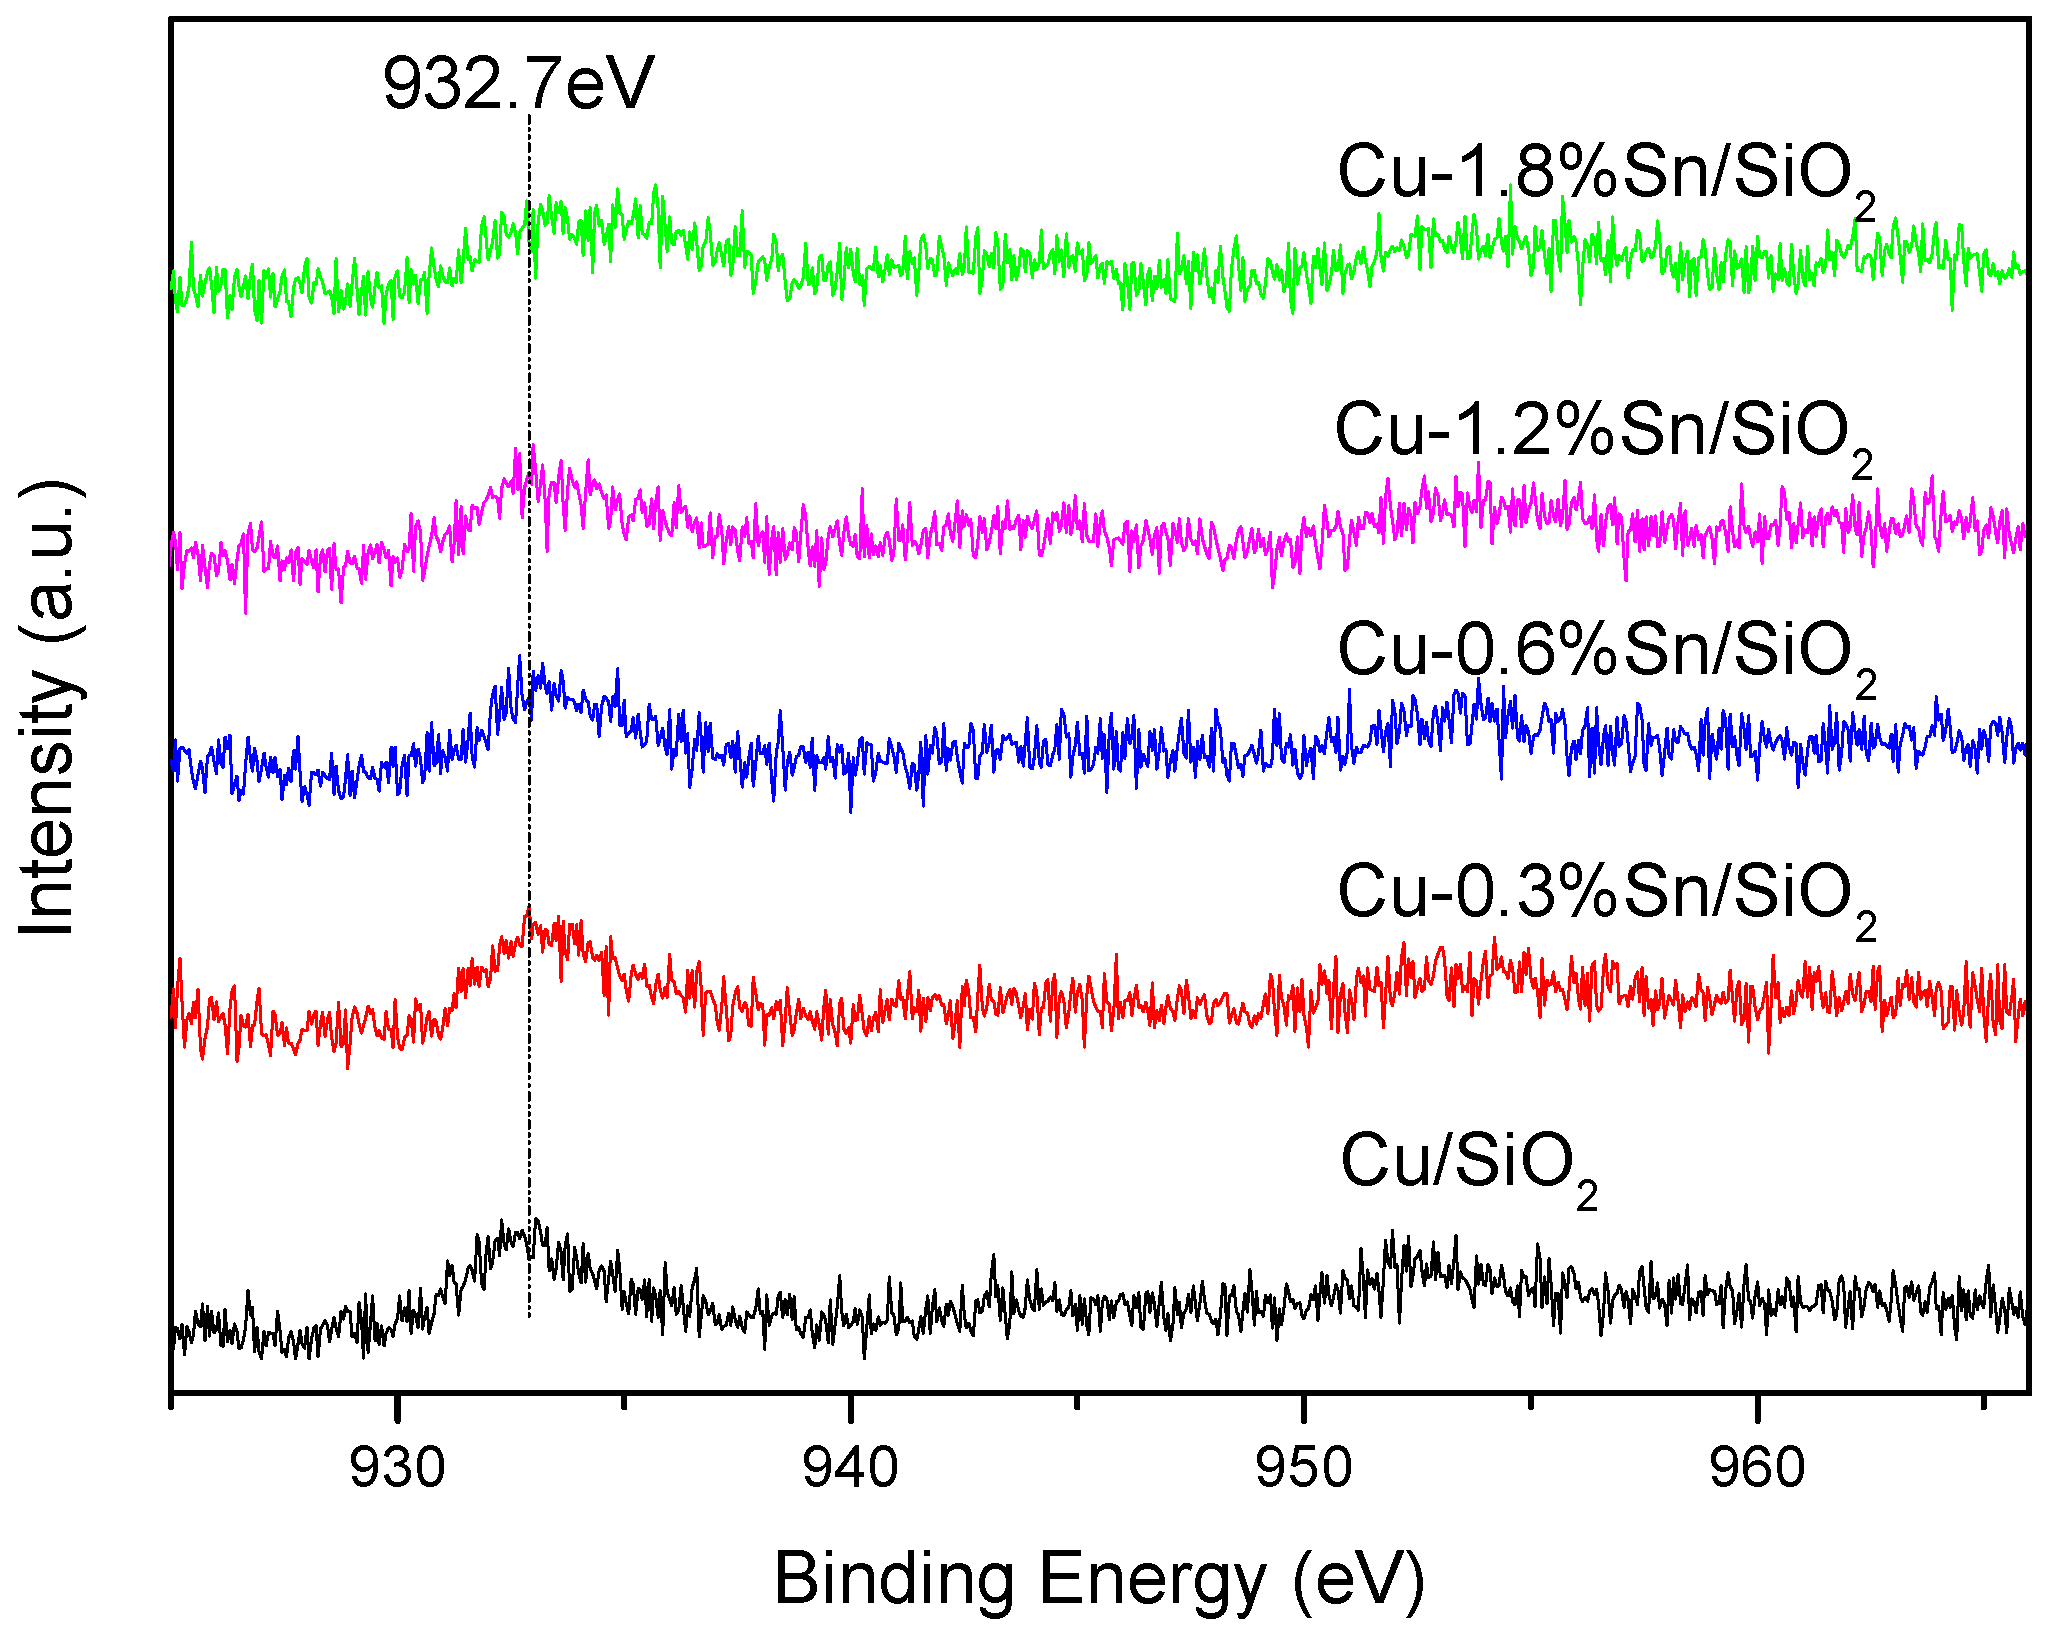
Figure 8 displays the XPS spectra of Cu 2p of Cu/SiO2 and Cu-xSn/SiO2 catalysts under an 8 h reaction. The BEs of Cu0 (about 932.7 eV) and Cu+ (about 932.5 eV) were located near each other. Hence, dividing the peaks of Cu0 and Cu+ was difficult. Conversely, the peak of Cu0 and Cu+ can be distinguished effectively by XAES with peak fitting.
Figure 9 presents the Cu LMM XAES profiles of these catalysts after 8 h reaction. A wide but asymmetrical folding peak with kinetic energy ranging from 907 to 924 eV was observed in each catalyst. Two symmetrical peaks located at approximately 916.2 and 918.6 eV and related to Cu+ and Cu0 were fitted and distinguished by a peak separation software. The peak areas of Cu0 and Cu+ were calculated, and we found the proportion of Cu0 and Cu+ to increase with increasing Sn content. The Cu0/Cu+ ratios in the Cu/SiO2 and Cu-xSn/SiO2 catalysts were 0.85, 0.96, 1.06, 1.17 and 1.23. This result suggested that a part of Cu2+ was reduced to Cu0 because of doping Sn2+, which played an effective role in regulating the Cu0/Cu+ ratio. Cu0 is responsible for activate hydrogen and ester, and Cu+ is believed to be polarized by C=O bonds in the ester and is favourable for the formation and stabilization of the intermediate states. Accordingly, an appropriate Cu+/Cu0 ratio is highly important to the reaction. However, there are different views on the Cu+/Cu0 ratio. Some literatures reported that Cu+/Cu0 > 1 is beneficial for hydrogenation of DMO to EG, but the opposite view is also presented [2,5,20]. In order to explain this phenomenon rationally, Ma et al. investigated and found that there is a dynamic cycle between Cu0 and Cu+ during ester hydrogenation. Cu0 can be oxidised to Cu+ by ester, while H2 can also reduce Cu+ into Cu0 in the reaction [21]. LaGrow et al. also observed the interface transition of Cu and Cu2O using ESTEM via switching hydrogen and oxygen environments [22]. It is reasonable to explain why different catalytic systems have different Cu+/Cu0 ratios that are favorable for the reaction; that may be why the Cu-0.6%Sn/SiO2 catalyst with the Cu0/Cu+ ratio of 1.06 has the best catalytic activity and stability in our catalysts.
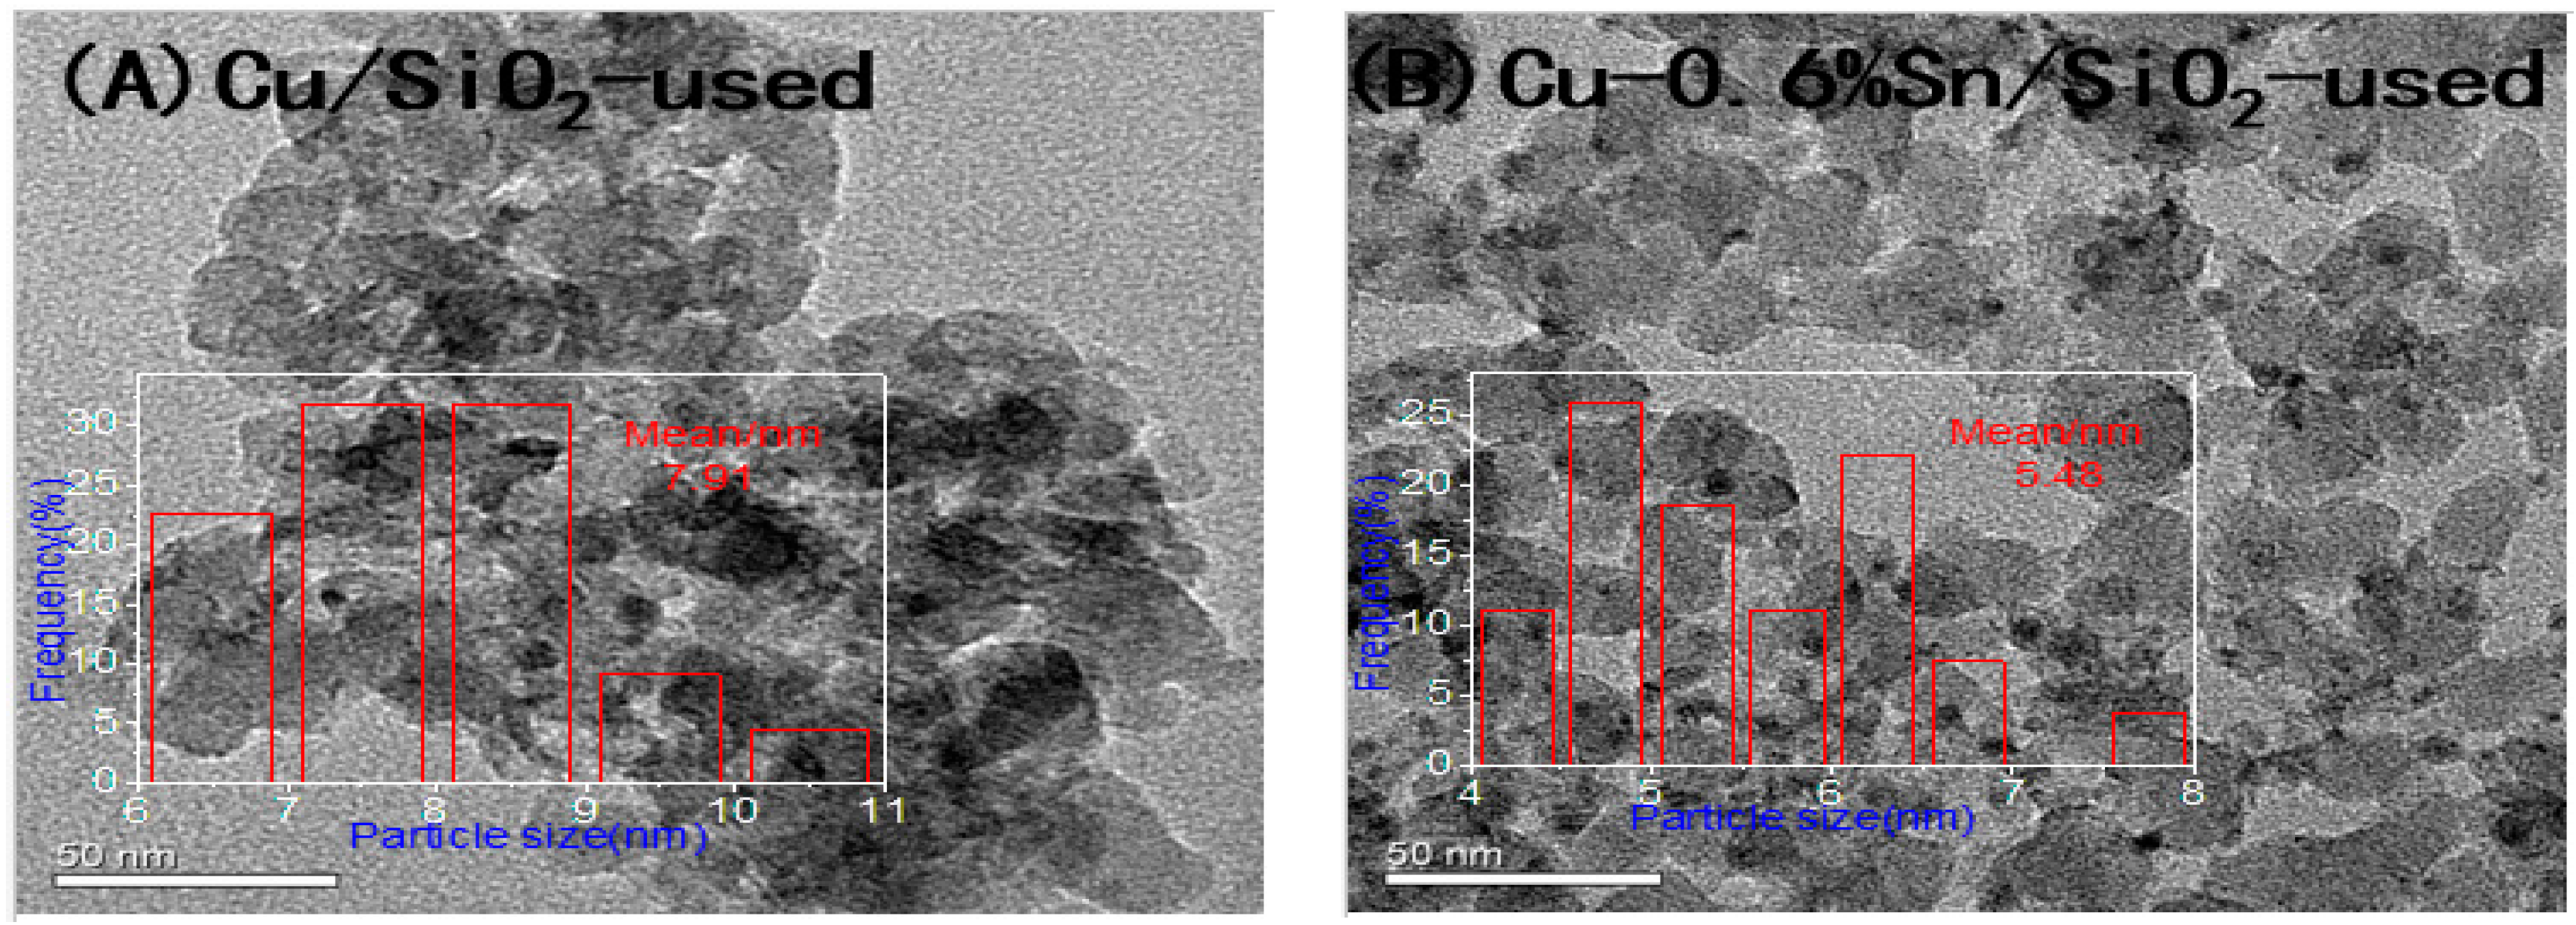
The TEM images of used Cu/SiO2 (130 h) and Cu-0.6%Sn/SiO2 (200 h) catalysts after long-time tests are shown in Figure 10. Notably, the average particle size of the monometallic copper catalyst increased from 4.33 to 7.91 nm and that of Cu-0.6%Sn/SiO2 catalysts increased from 3.68 to 5.48 nm. This result indicated that tin doping helps prevent the growth of copper particles during the reaction.
Raman spectroscopy was used to test carbon-coke on the used catalysts. Figure S1 was the Raman spectrum of the Cu/SiO2-used catalyst and Cu-0.6%Sn/SiO2-used catalysts. As can be seen from Figure S1, there were two peaks at 1350 cm−1 (amorphous carbon) and 1580 cm−1 (graphitized carbon) in the Cu/SiO2-used catalyst [23,24,25] which indicated that carbon deposits were formed in the Cu/SiO2 catalyst during the reaction. However, the carbon peaks located at 1350 and 1580 cm−1 could not be seen in the Cu-0.6%Sn/SiO2-used catalysts. This may be due to the fact that the amount of carbon deposition was very small or the distribution of carbon was very uniform. Raman spectroscopic results demonstrated that the doping of tin was beneficial to prevent the formation of carbon deposition.
3. Experimental Section
3.1. Catalyst Preparation
Cu-xSn/SiO2 was fabricated through ammonia evaporation and subsequent tin impregnation. Silica sol (20 nm, A.R., Alfa Aesar, London, UK) was used as support material. Cupric nitrate and stannous oxide (Sinopharm Chemical Reagent Co., Ltd., Shanghai, China) were prepared as metal precursor salts. All samples were produced to achieve a copper content of 12 wt % in the catalyst. The tin content was changed to investigate the effect of Sn doping. Firstly, 0.4 mol·L−1 Cu(NO3)2 aqueous solution was prepared in a round-bottomed flask. Ammonia aqueous solution (28 mL) was dropped into 100 mL of copper nitrate solution with electromagnetic stirring for 30 min. Subsequently, 30 g of 40% silica sol was added to the mixture dropwise. The obtained mixture was successively stirred at room temperature for 3 h and at 90 °C for another 4 h. A Cu/SiO2 catalyst was prepared after further filtering, washing, drying and calcined. Secondly, Cu-xSn/SiO2(x = 0.3, 0.6, 1.2 and 1.8 wt %) catalysts were prepared by impregnating the promoter Sn2+ on the Cu/SiO2 catalysts. A certain amount of stannous oxide was dissolved in 10 mL of dilute nitric acid solution, and the pH of the solution was adjusted to 4–5 by dropping ammonia solution. The required quantities of Cu/SiO2 sample were immersed into the mixture solution at 25 °C for 24 h. The obtained slurry was dried at 120 °C for 10 h and calcined under argon atmosphere at 450 °C for 5 h. The resulting catalysts were labelled as Cu-xSn/SiO2, where x refers to the mass content of Sn in the final catalysts.
3.2. Characterisation
ICP-AES was applied to analyse the mass content of active copper and tin additive in the catalysts. The XRD spectra of catalysts were obtained with a D8 ADVANCE XRD (Bruker Company, Karlsruhe, Germany) using Cu Kα radiation source at 40 kV to investigate the crystalline phases of the samples. The microstructure and active metal particle size were examined by TEM (A JEM 2010 TEM, Japan Electron Optics Laboratory Co. Ltd., Tokyo, Japan) with an acceleration voltage of 200 kV. TEM was also used to study the metal particle size and dispersion of samples. The XPS spectra were analysed by an Axis Ultra spectrometer (Shimadzu Corporation, Kyoto, Japan) using monochromatic Mg Kα X-ray of 1253.6 eV as the radioactive source to measure the valence state and surface content of metallic elements on the catalysts. All binding energy (BE) values were calibrated according to the BE of carbon (C 1s = 284.5 eV). XAES was also performed to determine the valence state of copper on the catalyst surface. A Micromeritics ASAP 2720 instrument (Micromeritics Instrument Corporation, Norcross, GA, USA) was used to detect the reduction behaviour of Cu and Sn-promoted catalysts. The temperature of the TPR ranged from 25 to 600 °C at 5 °C·min−1, and 45 mL/min 10% H2/Ar was fed into the reactor.
3.3. Activity Measurements
The hydrogenation of DMO was operated in a 400-mm long and 6-mm diameter stainless steel miniature reactor equipped with a back-pressure control system. For a typical experiment, 0.5 g of catalysts was loaded into the reactor, and then a certain amount of 5% H2/Ar atmosphere was introduced to reduce the catalysts. The reduction temperature was increased from room temperature to 300 °C with a heating rate of 2.5 °C·min−1 for 4 h. After completing the catalyst reduction process, the system was cooled to the reaction temperature of 200 °C. Feedstock of pure H2 and 15 wt % DMO methanol solution were fed into the system. The reactions were conducted at 2.5 MPa, H2/DMO molar ratio of 90 and weight hour space velocity of DMO in the range of 0.25–2.0 h−1. Hydrogenation products were analysed on a gas chromatograph (Shimadzu GC-9A, Shimadzu Corporation) equipped with a flame ionisation detector and a Wondacap WAX column (30 m × 0.53 mm × 1.0 μm).
4. Conclusions
This study focused on the effect of Sn2+ doping on the structure and catalytic performance of Cu/SiO2 catalysts for the hydrogenation of DMO. The introduction of Sn2+ into Cu/SiO2 catalysts resulted in distinct changes in catalytic performance. The conversion and selectivity of the catalyst displayed a volcano-like trend with increasing tin content. The optimum amount of tin doping was about 0.6% of the catalyst. Long-period experimental results showed that the DMO was completely transformed. The selectivity of EG was above 96% in Cu-0.6%Sn/SiO2 catalyst, and no decreasing trend was obtained after approximately 200 h. By contrast, the activity and stability of Cu/SiO2 catalyst declined rapidly. This effect may be attributed to the fact that the addition of a suitable amount of tin could adjust the Cu0/Cu+ ratio reasonably. Furthermore, the SnO2 that formed during reduction segregated the active copper and inhibited the aggregation of copper on the catalyst surface. This phenomenon could be responsible for the increased activity and stability of EG.
Supplementary Materials
The following are available online at www.mdpi.com/2073-4344/7/4/122/s1, Figure S1: The Raman spectrum of the Cu/SiO2-used catalyst and Cu-0.6%Sn/SiO2-used catalysts.
Author Contributions
Bin Dai conceived and designed the experiments, and provided financial support; Chuancai Zhang performed the experiments, analyzed the data and wrote the manuscript; Denghao Wang participated in the operation of experiment and data analysis.
Conflicts of Interest
The authors declare no conflict of interest.
References
- Zhang, S.; Liu, Q.; Fan, G.; Li, F. Highly dispersed copper-based catalysts from Cu–Zn–Al layered double hydroxide precursor for gas-phase hydrogenation of dimethyl oxalate to ethylene glycol. Catal. Lett. 2012, 142, 1121–1127. [Google Scholar] [CrossRef]
- Chen, L.; Guo, P.; Qiao, M.; Yan, S.; Li, H.; Shen, W.; Xu, H.; Fan, K. Cu/SiO2 catalysts prepared by the ammonia-evaporation method: Texture, structure, and catalytic performance in hydrogenation of dimethyl oxalate to ethylene glycol. J. Catal. 2008, 257, 172–180. [Google Scholar] [CrossRef]
- Yin, A.; Guo, X.; Dai, W.-L.; Li, H.; Fan, K. Highly active and selective copper-containing HMS catalyst in the hydrogenation of dimethyl oxalate to ethylene glycol. Appl. Catal. A 2008, 349, 91–99. [Google Scholar] [CrossRef]
- Zhu, Y.Y.; Wang, S.R.; Zhu, L.J.; Ge, X.L.; Li, X.B.; Luo, Z.Y. The influence of copper particle dispersion in Cu/SiO2 catalysts on the hydrogenation synthesis of ethylene glycol. Catal. Lett. 2010, 135, 275–281. [Google Scholar] [CrossRef]
- Gong, J.; Yue, H.; Zhao, Y.; Zhao, S.; Zhao, L.; Lv, J.; Wang, S.; Ma, X. Synthesis of ethanol via syngas on Cu/SiO2 catalysts with balanced Cu0–Cu+ sites. J. Am. Chem. Soc. 2012, 134, 13922–13925. [Google Scholar] [CrossRef] [PubMed]
- Li, F.; Lu, C.-S.; Li, X.-N. The effect of the amount of ammonia on the Cu0/Cu+ ratio of Cu/SiO2 catalyst for the hydrogenation of dimethyl oxalate to ethylene glycol. Chin. Chem. Lett. 2014, 25, 1461–1465. [Google Scholar] [CrossRef]
- He, Z.; Lin, H.; He, P.; Yuan, Y. Effect of boric oxide doping on the stability and activity of a Cu–SiO2 catalyst for vapor-phase hydrogenation of dimethyl oxalate to ethylene glycol. J. Catal. 2011, 277, 54–63. [Google Scholar] [CrossRef]
- Yue, H.; Zhao, Y.; Zhao, S.; Wang, B.; Ma, X.; Gong, J. A copper-phyllosilicate core-sheath nanoreactor for carbon-oxygen hydrogenolysis reactions. Nat. Commun. 2013, 4, 2339. [Google Scholar] [CrossRef] [PubMed]
- Wang, Y.-N.; Duan, X.; Zheng, J.; Lin, H.; Yuan, Y.; Ariga, H.; Takakusagi, S.; Asakura, K. Remarkable enhancement of Cu catalyst activity in hydrogenation of dimethyl oxalate to ethylene glycol using gold. Catal. Sci. Technol. 2012, 2, 1637. [Google Scholar] [CrossRef]
- Huang, Y.; Ariga, H.; Zheng, X.; Duan, X.; Takakusagi, S.; Asakura, K.; Yuan, Y. Silver-modulated SiO2-supported copper catalysts for selective hydrogenation of dimethyl oxalate to ethylene glycol. J. Catal. 2013, 307, 74–83. [Google Scholar] [CrossRef]
- Kaddouri, A.; Mazzocchia, C.; Tempesti, E. Sol-gel processing of copper-chromium catalysts for ester hydrogenation. J. Therm. Anal. Calorim. 1998, 53, 533–545. [Google Scholar] [CrossRef]
- Coupé, J.N.; Jordão, E.; Fraga, M.A.; Mendes, M.J. A comparative study of SiO2 supported Rh–Sn catalysts prepared by different methods in the hydrogenation of citral. Appl. Catal. A 2000, 199, 45–51. [Google Scholar]
- Luo, G.; Yan, S.; Qiao, M.; Zhuang, J.; Fan, K. Effect of tin on Ru-B/γ-Al2O3 catalyst for the hydrogenation of ethyl lactate to 1,2-propanediol. Appl. Catal. A 2004, 275, 95–102. [Google Scholar] [CrossRef]
- Vicente, A.; Lafaye, G.; Especel, C.; Marécot, P.; Williams, C.T. The relationship between the structural properties of bimetallic Pd–Sn/SiO2 catalysts and their performance for selective citral hydrogenation. J. Catal. 2011, 283, 133–142. [Google Scholar] [CrossRef]
- Esmaeili, E.; Mortazavi, Y.; Khodadadi, A.A.; Rashidi, A.M.; Rashidzadeh, M. The role of tin-promoted Pd/MWNTs via the management of carbonaceous species in selective hydrogenation of high concentration acetylene. Appl. Surf. Sci. 2012, 263, 513–522. [Google Scholar] [CrossRef]
- Wang, G.; Wang, H.; Zhang, H.; Zhu, Q.; Li, C.; Shan, H. Highly selective and stable NiSn/SiO2 catalyst for isobutane dehydrogenation: Effects of Sn addition. Chemcatchem 2016, 8, 3137–3145. [Google Scholar] [CrossRef]
- De Oliveira, K.; Pouilloux, Y.; Barrault, J. Selective hydrogenation of methyl oleate into unsaturated alcohols in the presence of cobalt–tin supported over zinc oxide catalysts. J. Catal. 2001, 204, 230–237. [Google Scholar] [CrossRef]
- Lin, H.; Zheng, X.; He, Z.; Zheng, J.; Duan, X.; Yuan, Y. Cu/SiO2 hybrid catalysts containing HZSM-5 with enhanced activity and stability for selective hydrogenation of dimethyl oxalate to ethylene glycol. Appl. Catal. A 2012, 445, 287–296. [Google Scholar] [CrossRef]
- Marchi, A.J.; Fierro, J.L.G.; Santamaria, J.; Monzón, A. Dehydrogenation of isopropylic alcohol on a Cu/SiO2 catalyst: A study of the activity evolution and reactivation of the catalyst. Appl. Catal. A 1996, 142, 375–386. [Google Scholar] [CrossRef]
- Yin, A.; Guo, X.; Dai, W.-L.; Fan, K. Effect of initial precipitation temperature on the structural evolution and catalytic behavior of Cu/SiO2 catalyst in the hydrogenation of dimethyloxalate. Catal. Commun. 2011, 12, 412–416. [Google Scholar] [CrossRef]
- Ma, X.; Yang, Z.; Liu, X.; Tan, X.; Ge, Q. Dynamic redox cycle of Cu0 and Cu+ over Cu/SiO2 catalyst in ester hydrogenation. RSC Adv. 2015, 5, 37581. [Google Scholar] [CrossRef]
- LaGrow, A.P.; Ward, M.R.; Lloyd, D.C.; Gai, P.L.; Boyes, E.D. Visualizing the Cu/Cu2O interface transition in nanoparticles with environmental scanning transmission electron microscopy. J. Am. Chem. Soc. 2017, 139, 179–185. [Google Scholar] [CrossRef] [PubMed]
- Goula, M.A.; Charisiou, N.D.; Siakavelas, G.; Tzounis, L.; Tsiaoussis, I.; Panagiotopoulou, P.; Goula, G.; Yentekakis, I.V. Syngas production via the biogas dry reforming reaction over Ni supported on zirconia modified with CeO2 or La2O3 catalysts. Int. J. Hydrogen Energ. 2016, 1–17. [Google Scholar] [CrossRef]
- Papageridis, K.N.; Siakavelas, G.; Charisiou, N.D.; Avraam, D.G.; Tzounis, L.; Kousi, K.; Goula, M.A. Comparative study of Ni, Co, Cu supported on γ-alumina catalysts for hydrogen production via the glycerol steam reforming reaction. Fuel Process. Technol. 2016, 152, 156–175. [Google Scholar] [CrossRef]
- Charisiou, N.D.; Siakavelas, G.; Papageridis, K.N.; Baklavaridis, A.; Tzounis, L.; Avraam, D.G.; Goula, M.A. Syngas production via the biogas dry reforming reaction over nickel supported on modified with CeO2 and/or La2O3 alumina catalysts. J. Nat. Gas Sci. Eng. 2016, 31, 164–183. [Google Scholar] [CrossRef]
Figure 1.
N2 adsorption–desorption profiles (A) and Barrett–Joyner–Halenda (BJH) pore-size distribution curves (B) of calcined Cu/SiO2 and Cu-xSn/SiO2 catalysts.
Figure 1.
N2 adsorption–desorption profiles (A) and Barrett–Joyner–Halenda (BJH) pore-size distribution curves (B) of calcined Cu/SiO2 and Cu-xSn/SiO2 catalysts.

Figure 2.
H2-temperature-programmed reduction of 5% Sn/SiO2, Cu/SiO2 and Cu–xSn/SiO2 catalysts after calcination at 300 °C.
Figure 2.
H2-temperature-programmed reduction of 5% Sn/SiO2, Cu/SiO2 and Cu–xSn/SiO2 catalysts after calcination at 300 °C.

Figure 3.
X-ray diffraction patterns of the reduced catalysts.

Figure 4.
The TEM images of the reduced catalysts: (A) Cu/SiO2, (B) Cu-0.3%Sn/SiO2, (C) Cu-0.6%Sn/SiO2, (D) Cu-1.2%Sn/SiO2 and (E) Cu-1.8%Sn/SiO2.
Figure 4.
The TEM images of the reduced catalysts: (A) Cu/SiO2, (B) Cu-0.3%Sn/SiO2, (C) Cu-0.6%Sn/SiO2, (D) Cu-1.2%Sn/SiO2 and (E) Cu-1.8%Sn/SiO2.
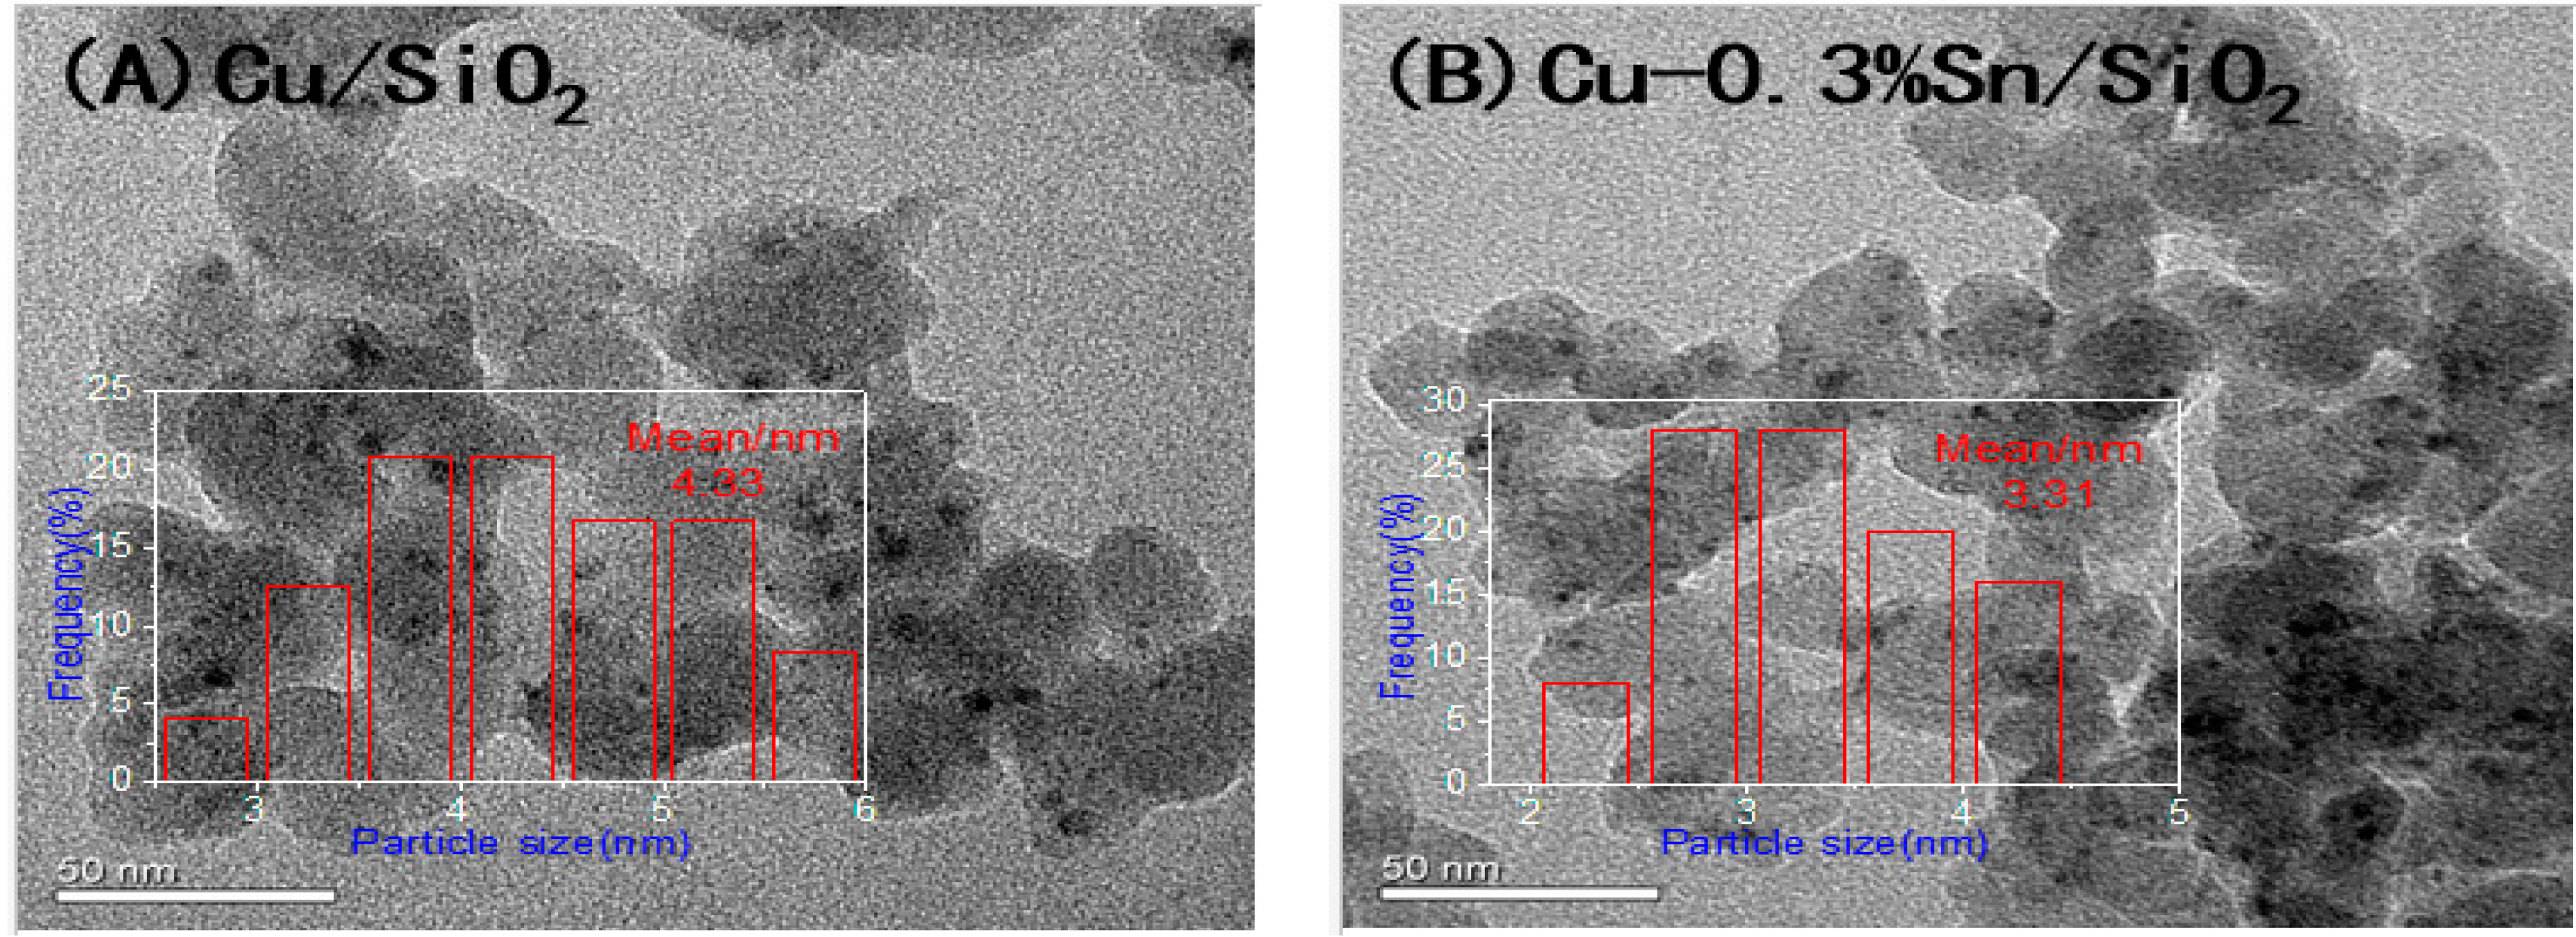
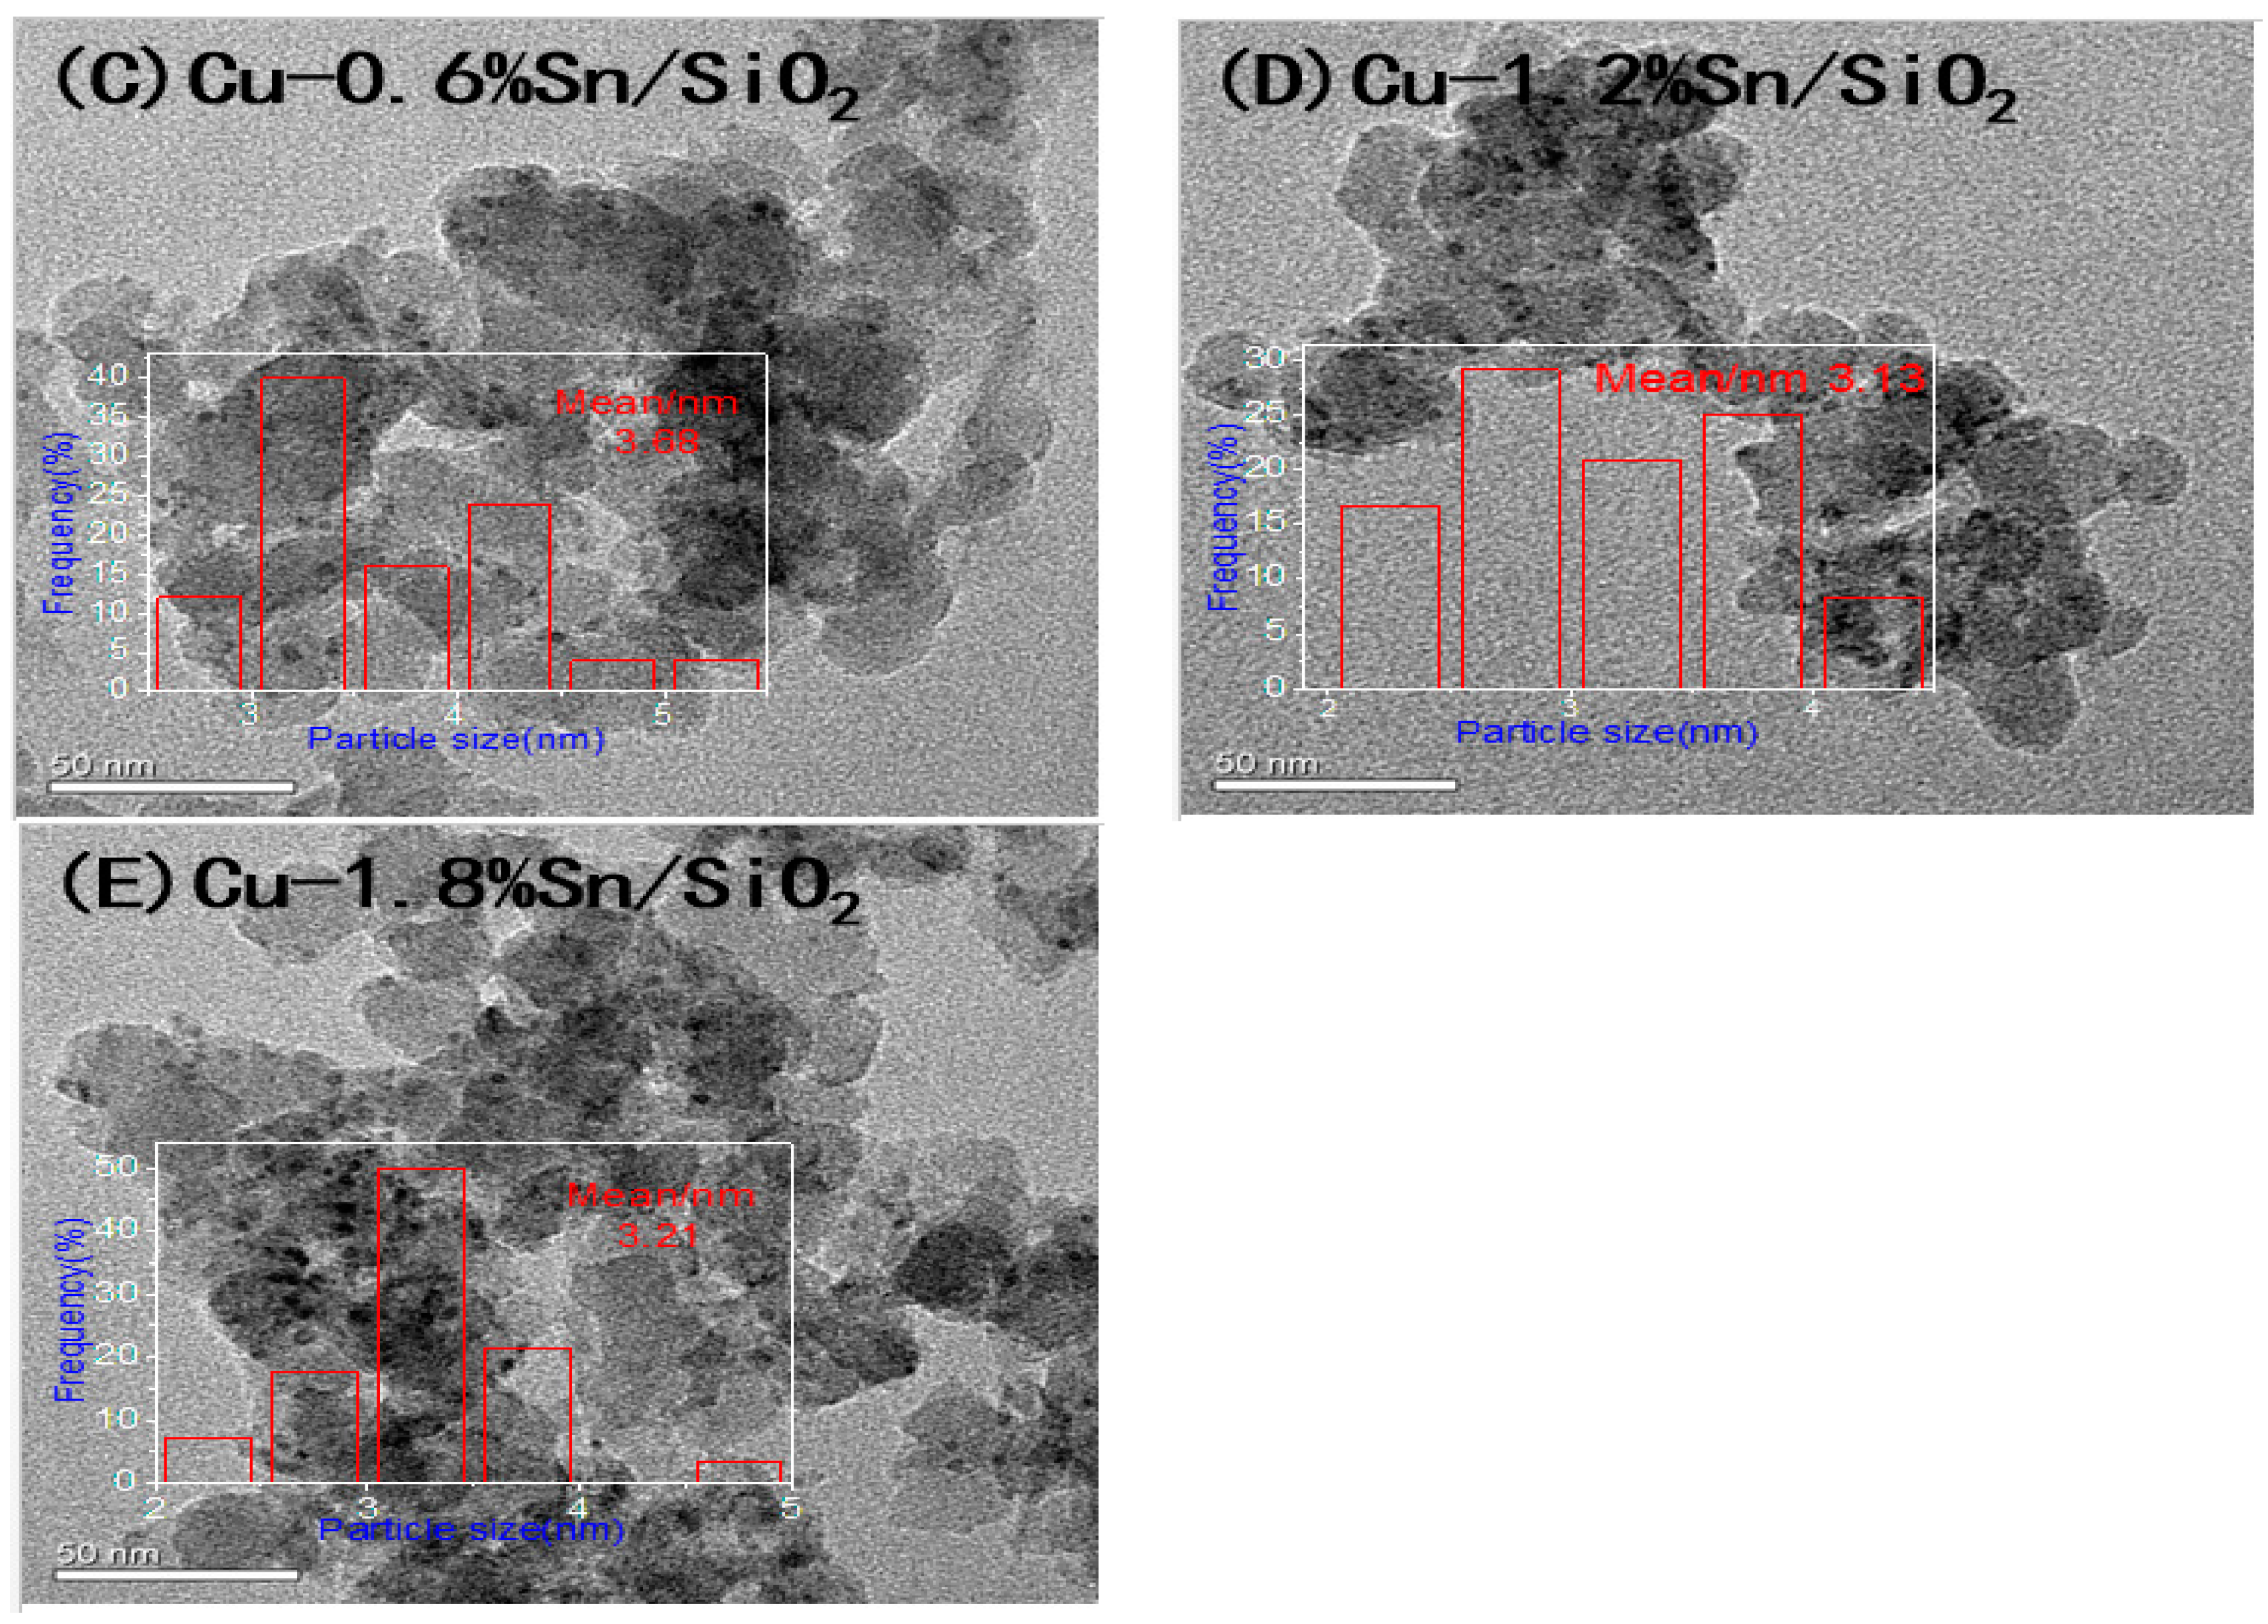
Figure 5.
Comparison of dimethyl oxalate (DMO) conversion (A) and ethylene glycol (EG) selectivity (B) in Cu/SiO2 and Cu-xSn/SiO2 catalysts with varied WLHSVs.
Figure 5.
Comparison of dimethyl oxalate (DMO) conversion (A) and ethylene glycol (EG) selectivity (B) in Cu/SiO2 and Cu-xSn/SiO2 catalysts with varied WLHSVs.

Figure 6.
Long experimental periods of Cu/SiO2 and Cu-x0.6%Sn/SiO2 catalysts. The reaction conditions were 2.5 MPa H2, 200 °C, H2/DMO ratio of 90 and WLHSV of 1 h−1.
Figure 6.
Long experimental periods of Cu/SiO2 and Cu-x0.6%Sn/SiO2 catalysts. The reaction conditions were 2.5 MPa H2, 200 °C, H2/DMO ratio of 90 and WLHSV of 1 h−1.
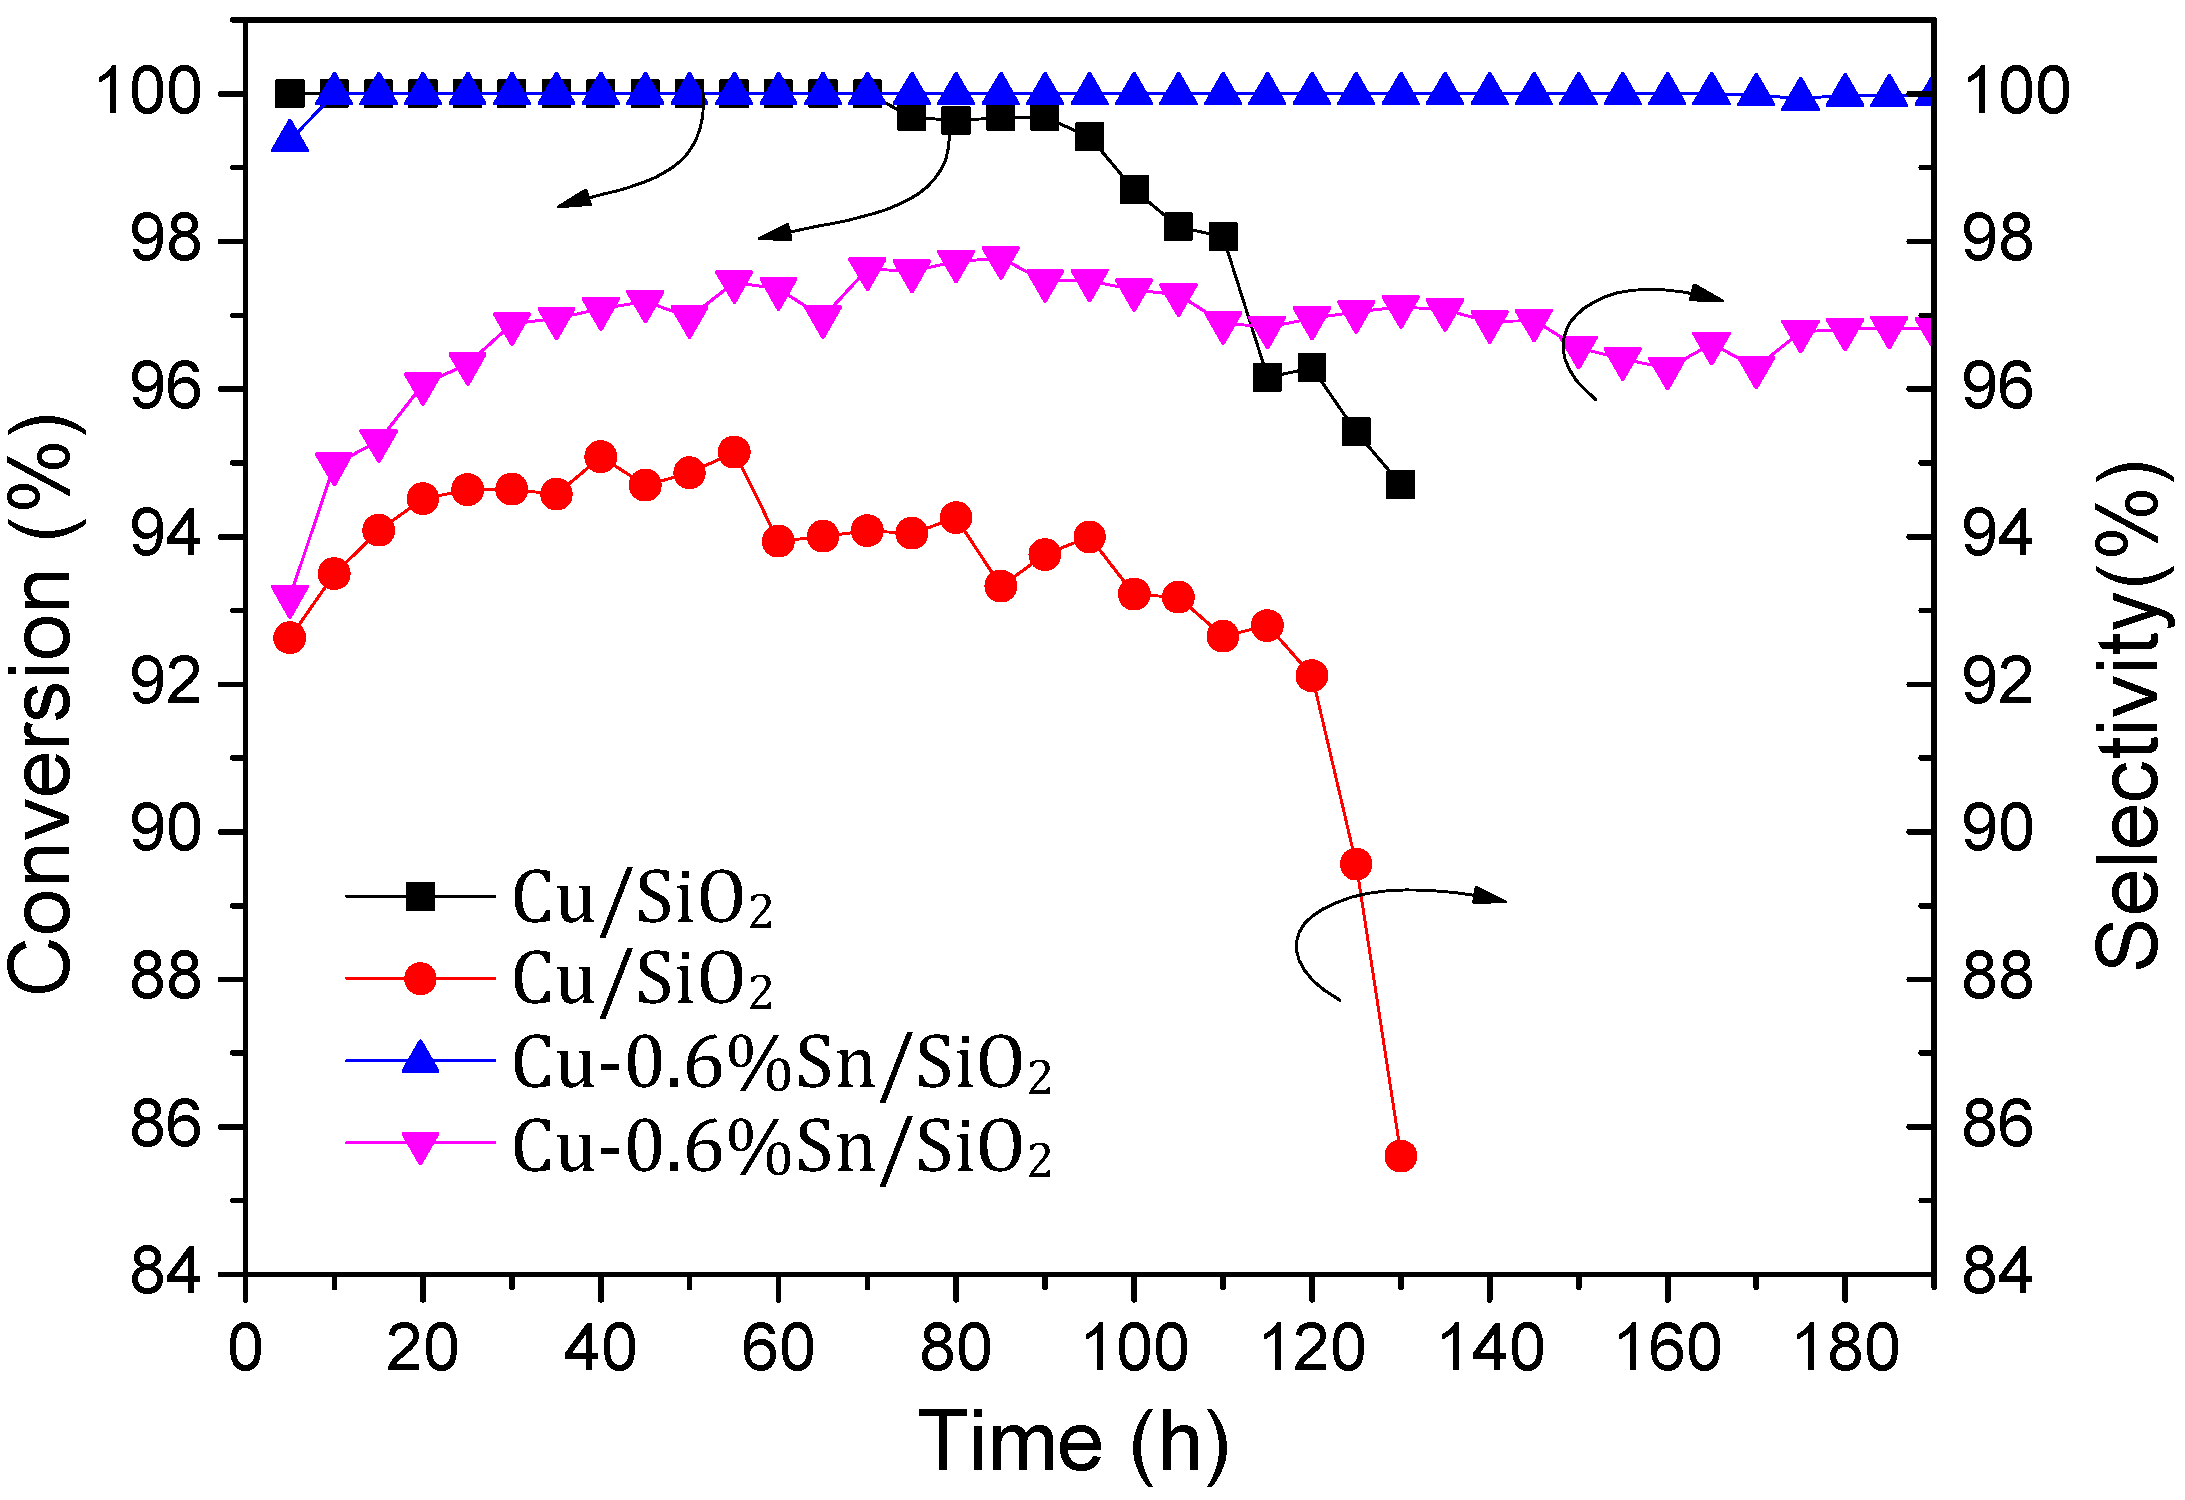
Figure 7.
X-ray photoelectron spectroscopy (XPS) spectra of Sn 3d5/2 of Cu/SiO2 and Cu-xSn/SiO2 catalysts under an 8 h reaction.
Figure 7.
X-ray photoelectron spectroscopy (XPS) spectra of Sn 3d5/2 of Cu/SiO2 and Cu-xSn/SiO2 catalysts under an 8 h reaction.
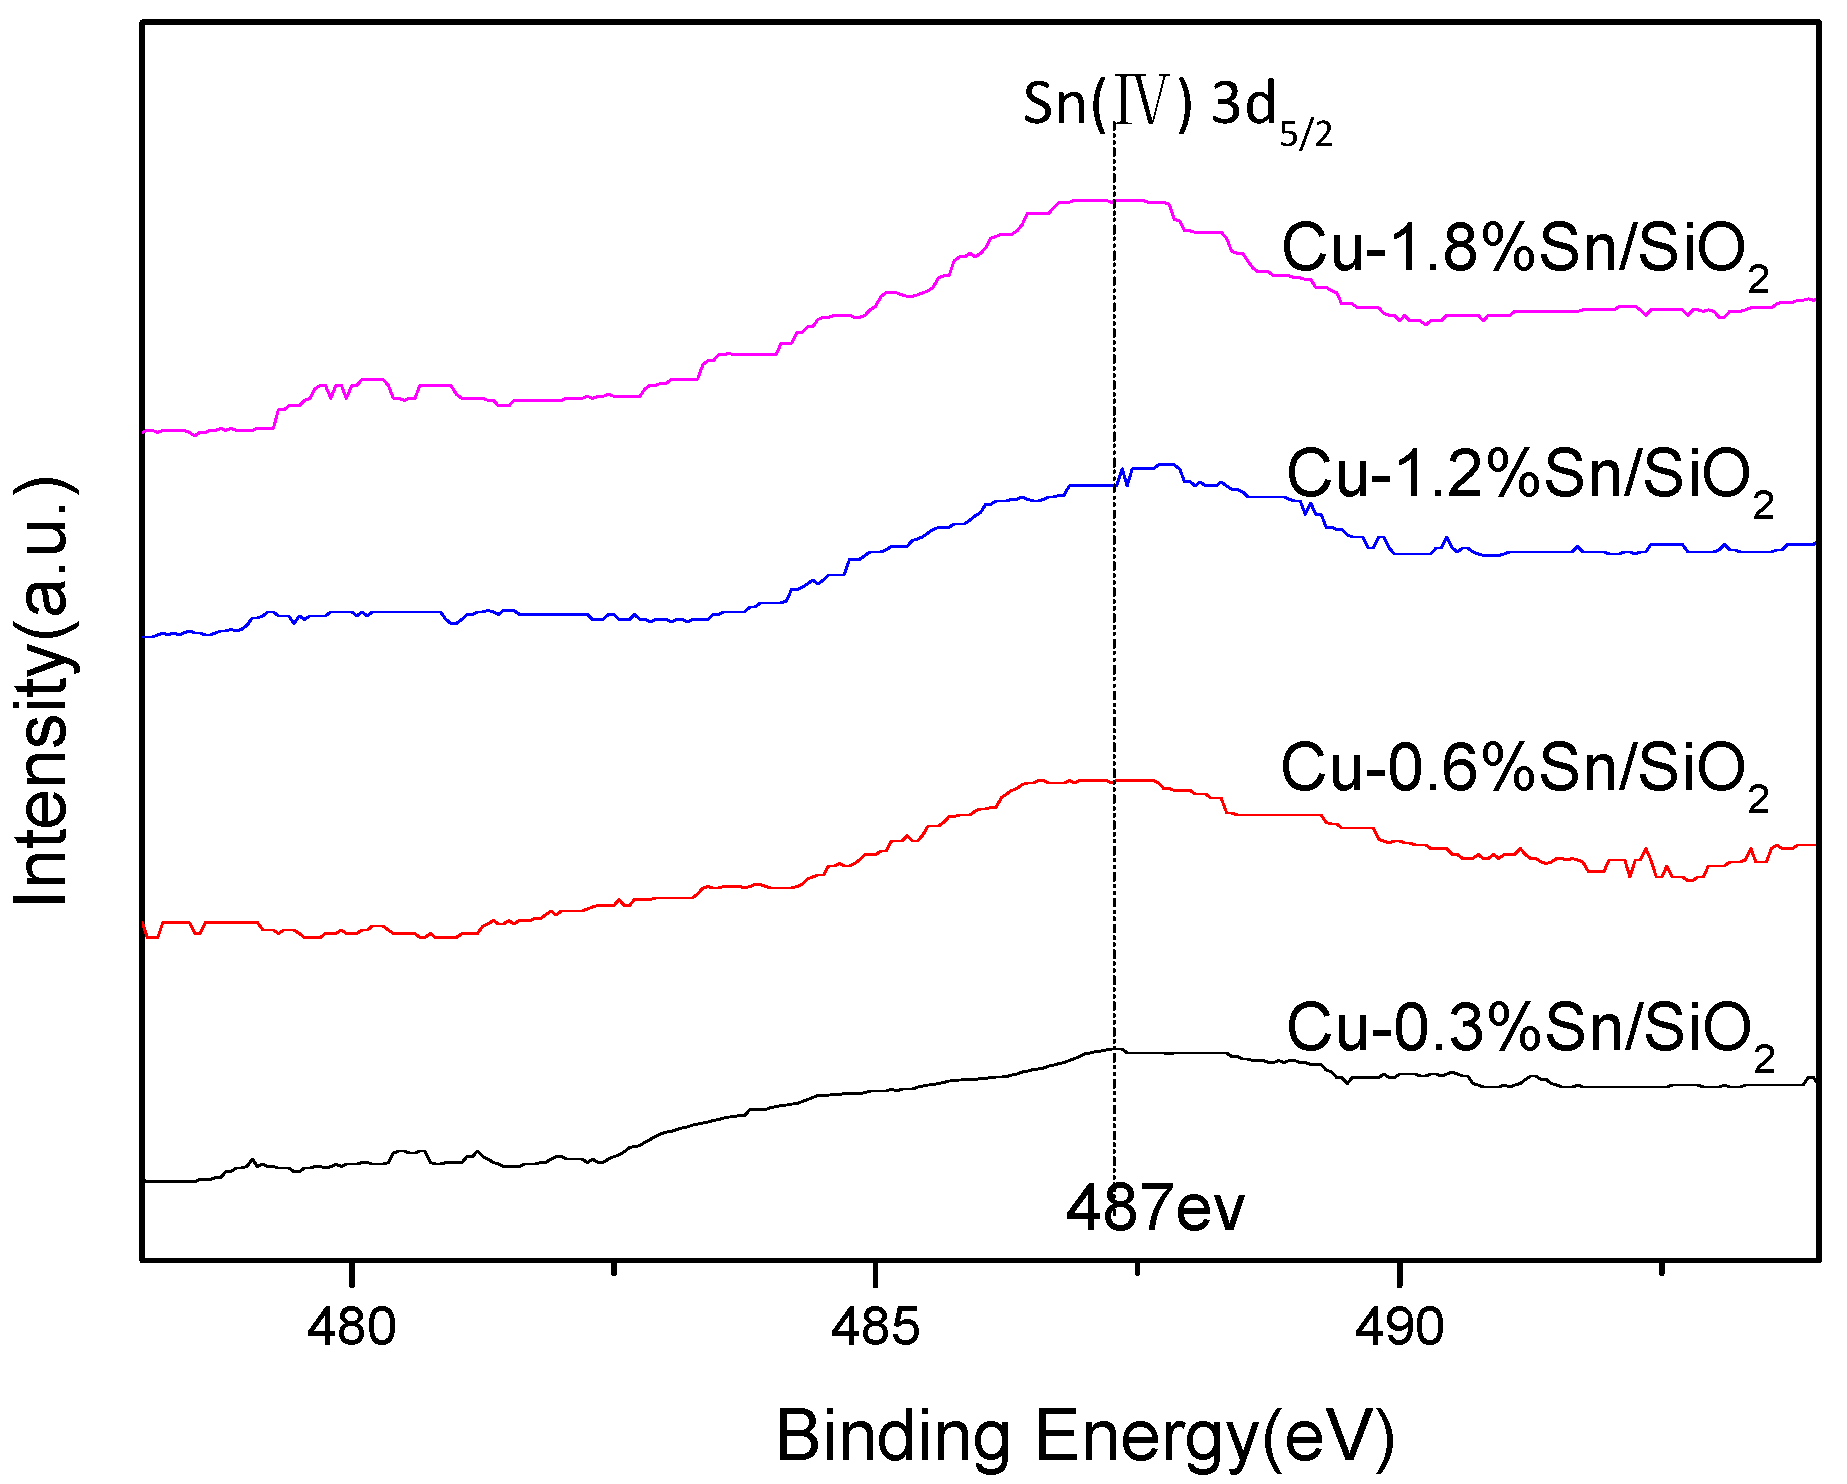
Figure 8.
XPS spectra of Cu 2p of Cu/SiO2 and Cu-xSn/SiO2 catalysts under an 8 h reaction.

Figure 9.
Curve fitting results of the Cu LMM XAES spectra of catalysts: (a) Cu/SiO2, (b) Cu-0.3%Sn/SiO2, (c) Cu-0.6%Sn/SiO2, (d) Cu-1.2%Sn/SiO2 and (e) Cu-1.8%Sn/SiO2 after 8 h reaction.
Figure 9.
Curve fitting results of the Cu LMM XAES spectra of catalysts: (a) Cu/SiO2, (b) Cu-0.3%Sn/SiO2, (c) Cu-0.6%Sn/SiO2, (d) Cu-1.2%Sn/SiO2 and (e) Cu-1.8%Sn/SiO2 after 8 h reaction.
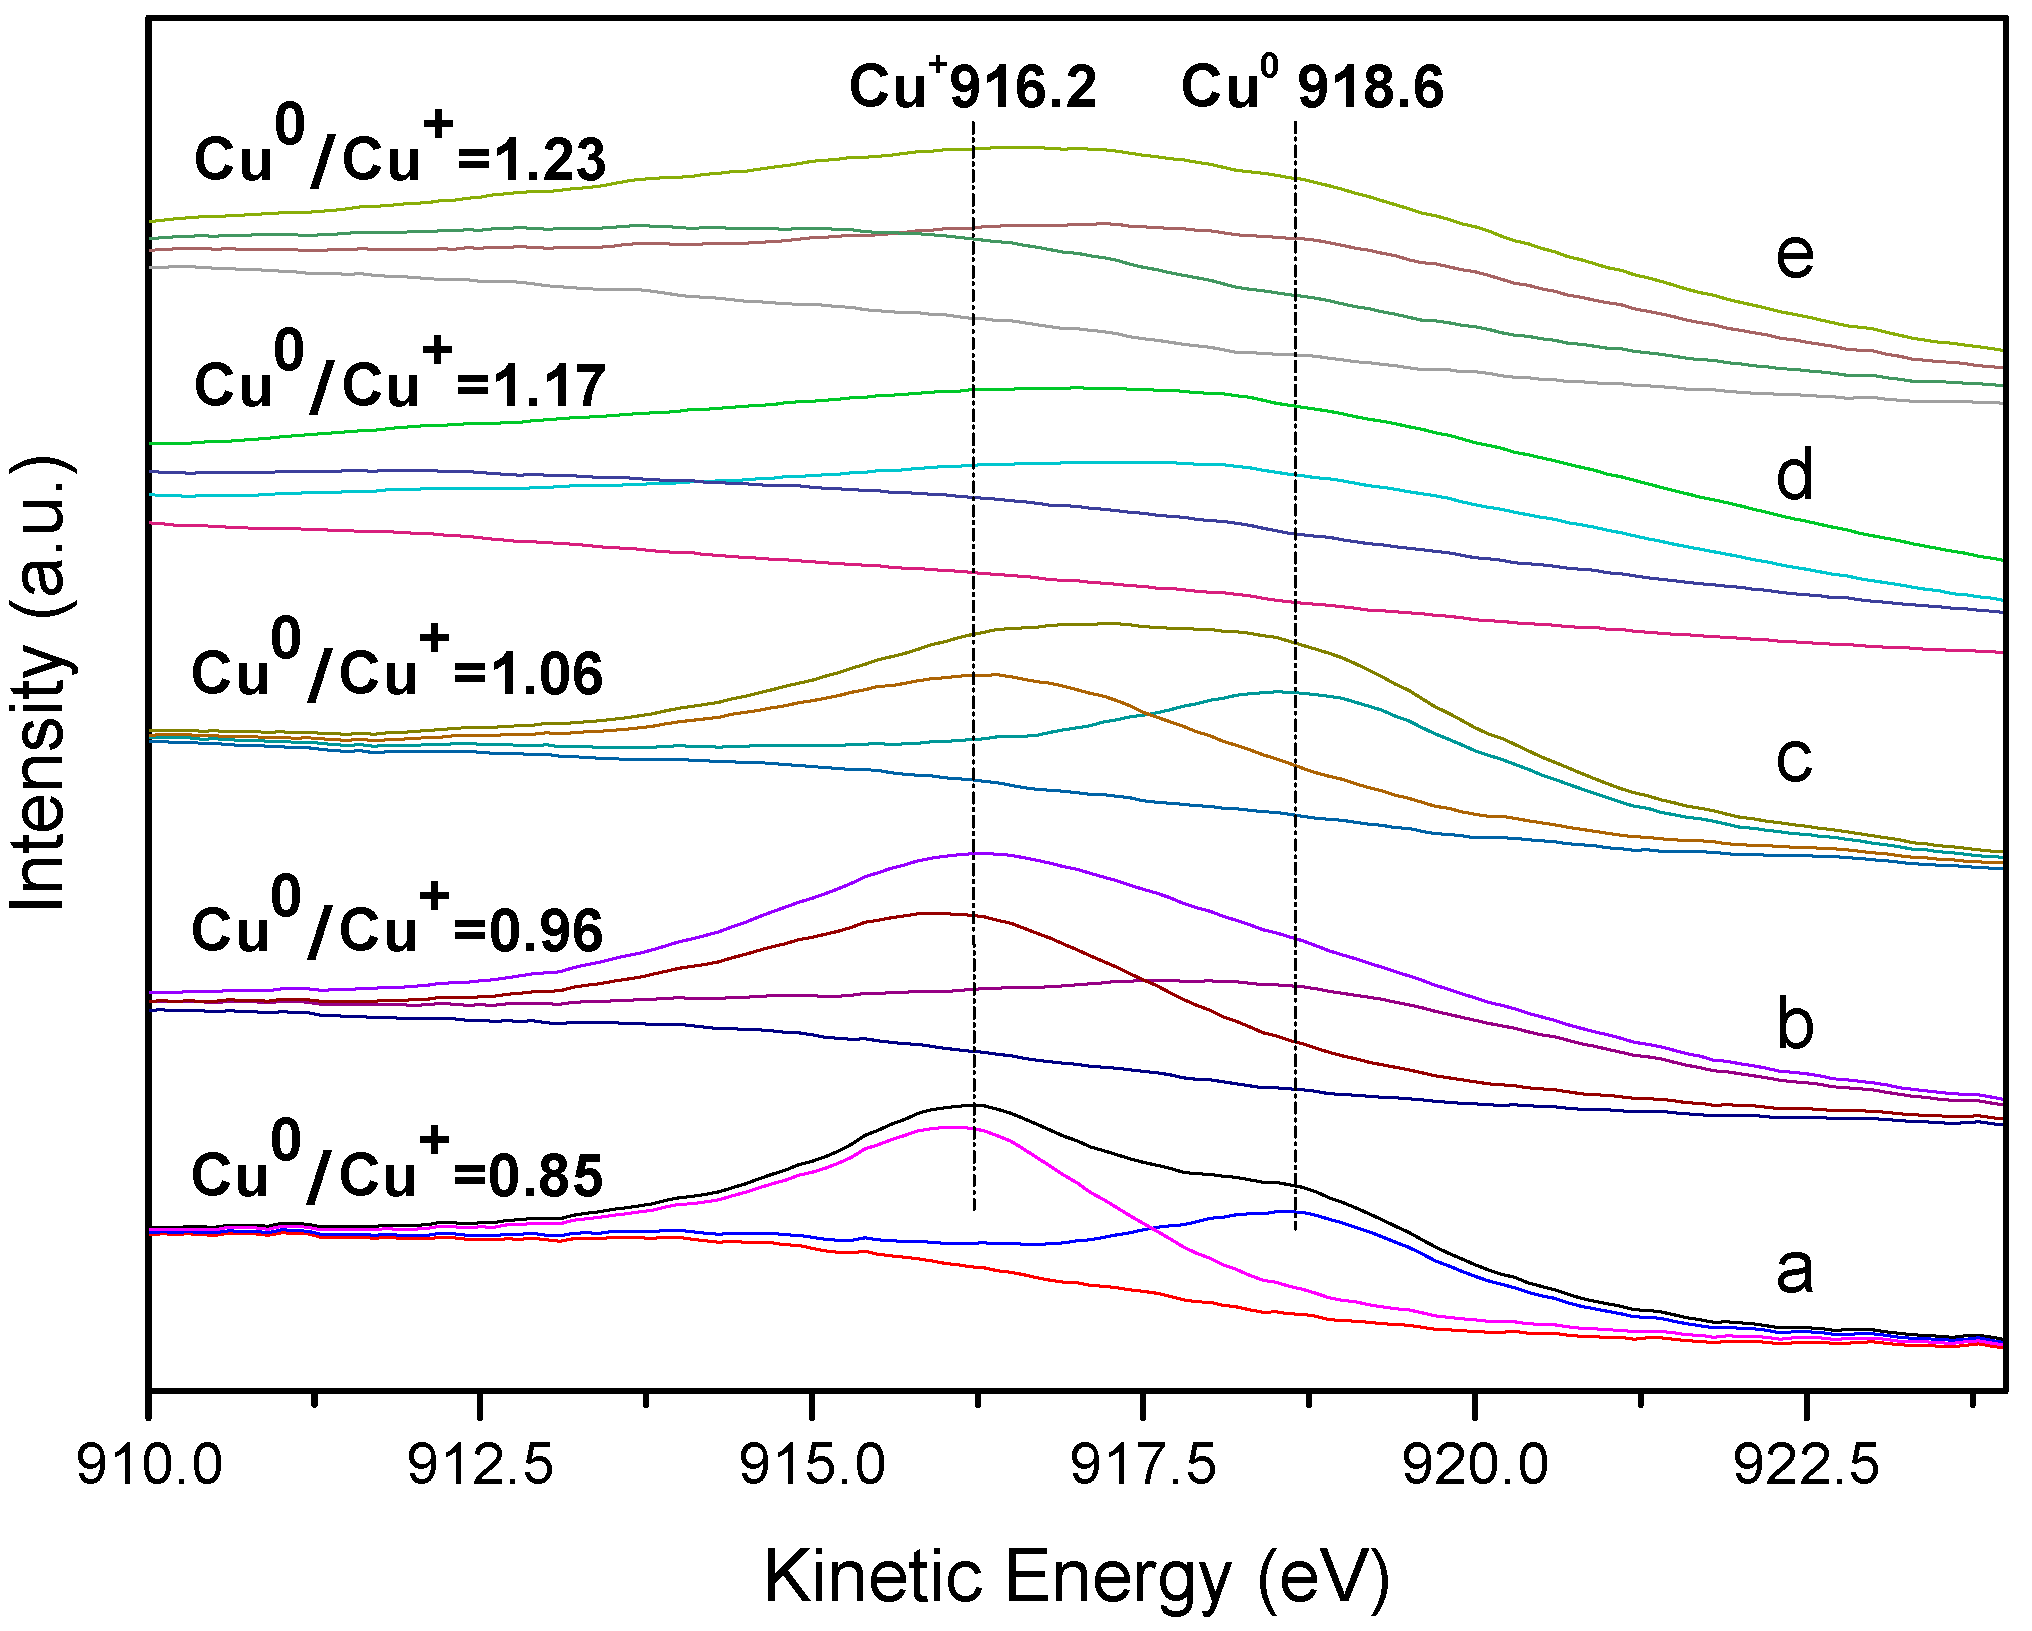
Figure 10.
TEM images of used catalysts: (A) Cu/SiO2-used (130 h) and (B) Cu-0.6%Sn/SiO2-used (200 h).
Figure 10.
TEM images of used catalysts: (A) Cu/SiO2-used (130 h) and (B) Cu-0.6%Sn/SiO2-used (200 h).

Table 1.
Lists of the chemical compositions and textural features of the reduced Cu/SiO2 and Cu-xSn/SiO2.
Table 1.
Lists of the chemical compositions and textural features of the reduced Cu/SiO2 and Cu-xSn/SiO2.
| Sample | Cu (wt %) | Sn (wt %) | SBET (m2·g−1) | Vpore (cm3·g−1) | Dpore (nm) |
|---|---|---|---|---|---|
| Cu/SiO2 | 10.94 | - | 246.7 | 0.67 | 10.1 |
| Cu-0.3%Sn/SiO2 | 10.82 | 0.29 | 244.9 | 0.65 | 10.2 |
| Cu-0.6%Sn/SiO2 | 10.86 | 0.58 | 244.3 | 0.64 | 10.2 |
| Cu-1.2%Sn/SiO2 | 10.81 | 1.18 | 236.3 | 0.62 | 10.3 |
| Cu-1.8%Sn/SiO2 | 10.79 | 1.82 | 221.8 | 0.59 | 10.5 |
© 2017 by the authors. Licensee MDPI, Basel, Switzerland. This article is an open access article distributed under the terms and conditions of the Creative Commons Attribution (CC BY) license (http://creativecommons.org/licenses/by/4.0/).
Share and Cite
MDPI and ACS Style
Zhang, C.; Wang, D.; Dai, B. Promotive Effect of Sn2+ on Cu0/Cu+ Ratio and Stability Evolution of Cu/SiO2 Catalyst in the Hydrogenation of Dimethyl Oxalate. Catalysts 2017, 7, 122. https://doi.org/10.3390/catal7040122
AMA Style
Zhang C, Wang D, Dai B. Promotive Effect of Sn2+ on Cu0/Cu+ Ratio and Stability Evolution of Cu/SiO2 Catalyst in the Hydrogenation of Dimethyl Oxalate. Catalysts. 2017; 7(4):122. https://doi.org/10.3390/catal7040122
Chicago/Turabian StyleZhang, Chuancai, Denghao Wang, and Bin Dai. 2017. "Promotive Effect of Sn2+ on Cu0/Cu+ Ratio and Stability Evolution of Cu/SiO2 Catalyst in the Hydrogenation of Dimethyl Oxalate" Catalysts 7, no. 4: 122. https://doi.org/10.3390/catal7040122
Note that from the first issue of 2016, this journal uses article numbers instead of page numbers. See further details here.