1. Introduction
The release of volatile organic compounds (VOCs) into the atmosphere has been related to long term environmental impacts such as the formation of ground level ozone and ozone depletion, and they also act as greenhouse gases [
1,
2]. There are a number of methods for conversion of VOCs but one of the most efficient is the catalytic oxidation as low temperatures are required for elevated conversions [
3]. VOCs are widely emitted by numerous different sources as they are a primary source of fuel, but not all VOCs affect the environment on the same scale because longer carbon chain VOCs are much easier to remove than smaller VOCs such as short chain alkanes (methane, ethane and propane) [
4,
5]. For example, methane is the second most abundant greenhouse gas and has a global warming potential ca. 20 times that of CO
2. Another common short chain alkane is propane, which, although more reactive than methane, requires intermediate/high reaction temperatures to be activated. Propane is increasing in usage as a fuel in transport vehicles although to a lesser extent than that expected 10–20 years ago. A catalyst that totally oxidises propane is essential to reduce the negative impact to the environment.
Noble metals have been found to be highly effective but expensive in the total oxidation of VOCs. Instead, research into enhancing metal oxides and their conversion to standards that are similar to those of noble metals would be highly interesting, since metal oxides present lower price, better resistance to poisoning and also, depending on the process conditions, higher thermal stability [
6]. Among the oxides of non-noble metals, those of cerium are amongst the most promising catalysts. Ceria is a well-known oxide of a rare-earth element which has a suitable combination of physical and chemical characteristics. Thus, ceria has shown reasonable activity in the total oxidation of a range of volatile organic compounds and, in some cases, such as in the combustion of polycyclic aromatic hydrocarbons [
7], have demonstrated to be highly active. However, the elimination of propane by total oxidation has not provided optimal performance using conventionally prepared ceria [
8].
The main positive features of ceria to be used as a catalyst are its high oxygen storage capacity (OSC) and its redox properties. On the other hand, copper oxide is a versatile catalyst which is active for a range of reactions [
9,
10,
11,
12], showing interesting results for the total oxidation of several VOCs [
13]. Interestingly, the addition of copper to ceria has been reported to increase the OSC due to the formation of structural defects [
14] and consequently substantial increases of the catalytic activity have been observed in a range of reactions. Thus, Cu-Ce-O based catalysts have shown high efficiency in the preferential oxidation of CO [
15,
16] and in the total oxidation of different types of VOCs such as alkanes [
17,
18,
19], aromatics [
20,
21] and polycyclic aromatic hydrocarbons [
22,
23].
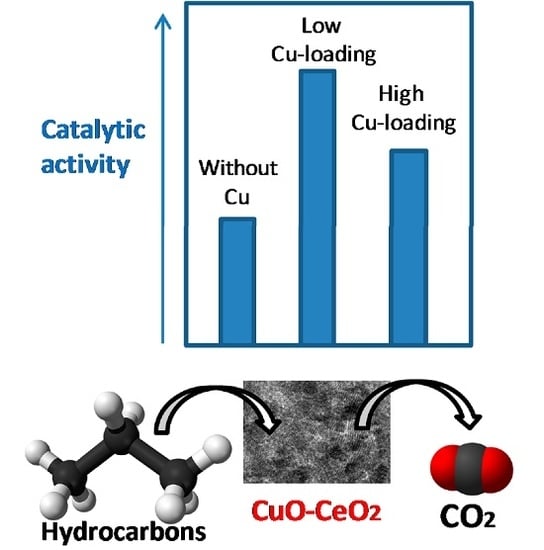
In this paper, we describe the preparation of ceria and CuO-CeO2 catalysts using different methods, with the objective of producing materials with optimal catalytic performances in the catalytic elimination of propane by total oxidation. The effect of the CuO-loading as well as the influence of the preparation method on the catalytic performance has been studied. Three different methods have been employed to prepare the catalysts: (i) using urea as a soft template; (ii) using an activated carbon with a mesoporous structure (CMK-3) as a hard template; and (iii) using a polymer (PMMA) as a soft template. The use of the different templates has as a main purpose the expansion of the structure of the ceria derived material, thus increasing the surface area of the final catalysts and therefore the number of active catalytic sites.
2. Results and Discussion
Pure ceria as well as Cu-Ce-O catalysts with CuO contents of 5 and 13 wt % were synthesized using urea (U), carbon hard template (C) and polymer soft template (P). The final catalysts were named CuCe x-support.
The catalysts were characterized by several physicochemical techniques and then tested as catalysts in the propane total oxidation.
Table 1 shows the specific surface area of the different samples. The surface area always increases compared to pure ceria when 5 wt % of copper oxide is added. However, a drop in the surface area is observed for the highest copper oxide loading (13 wt %). It can also be seen that catalysts prepared using the polymer present the highest surface area (154 m
2/g in the case of CuCe5-P) followed by those with the CMK-3 carbon and finally those prepared with urea.
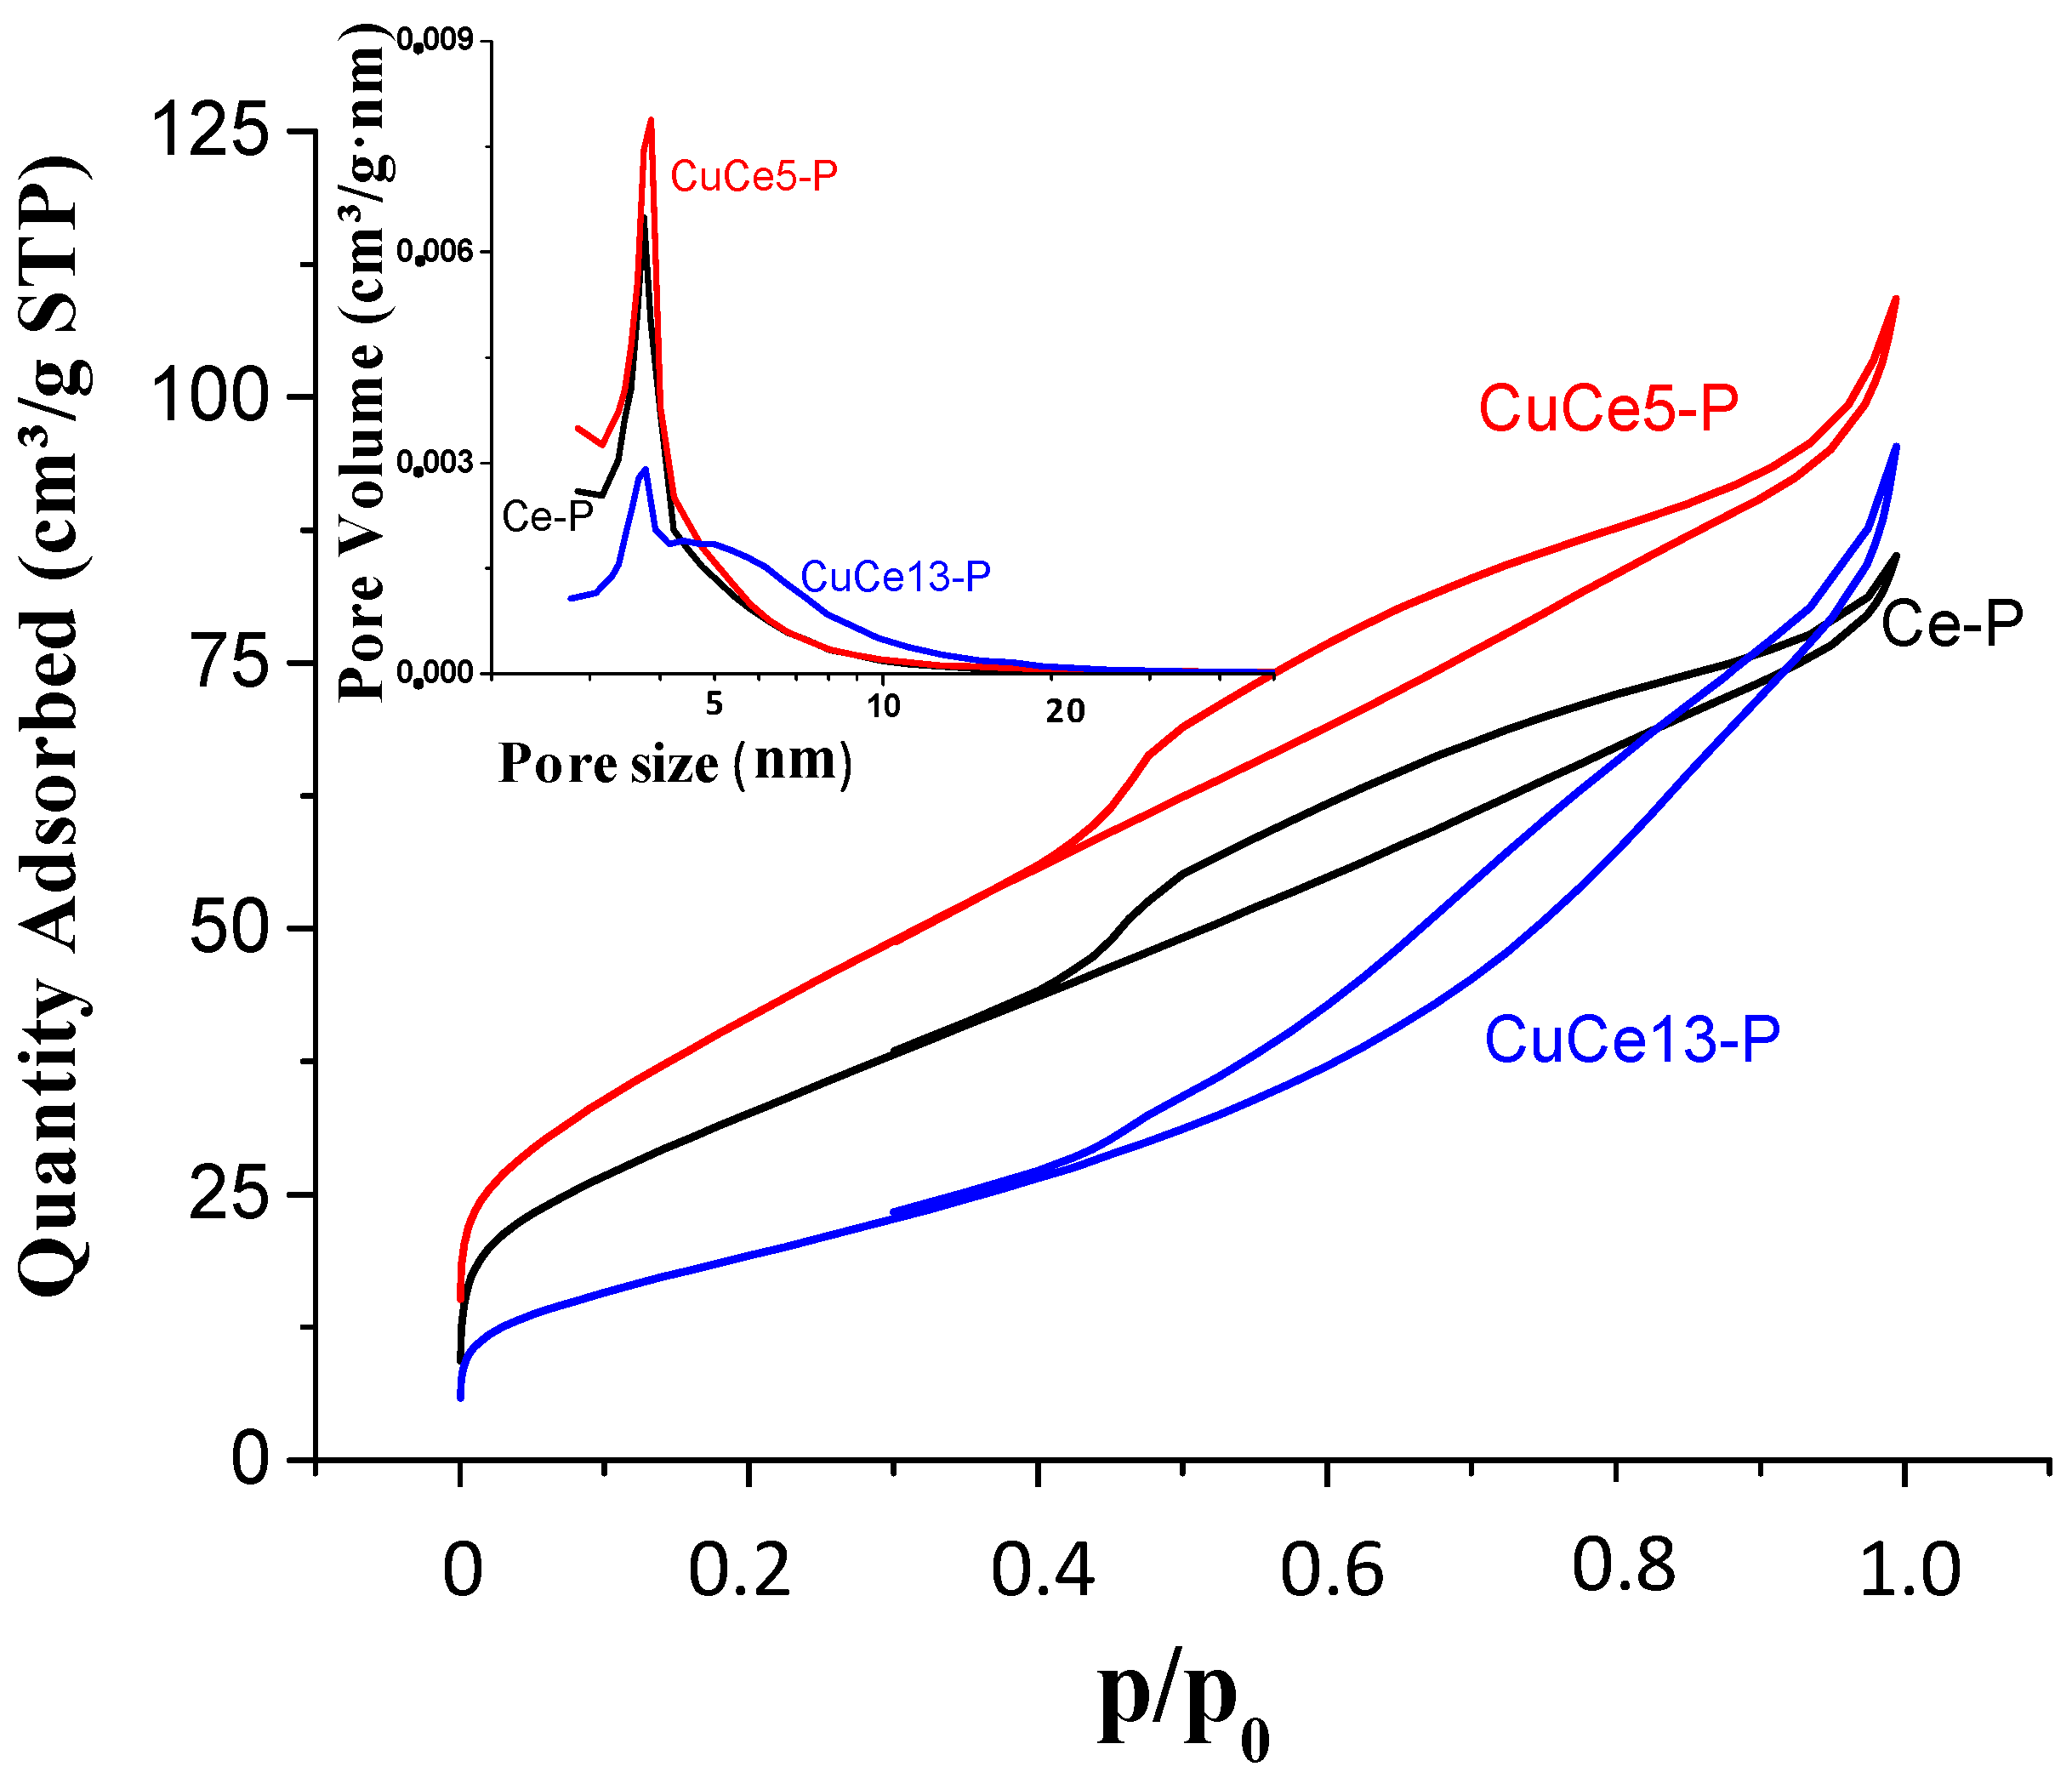
Figure 1 shows the adsorption-desorption isotherms as well as the pore size distribution for the catalysts of the P-series. The isotherm shape of these catalysts is intermediate between type II and type IV, showing a clear mesoporous structure. The incorporation of 5 wt % CuO favours the incorporation of mesoporosity compared to the pure ceria, which leads to an increase in the surface area from 120 to 154 m
2·g
−1. In the inset of
Figure 1, it can be seen that the pore size distribution is similar with a narrow peak centred at ca. 3.7 nm. In contrast, the incorporation of 13 wt % CuO decreases the mesoporosity and widens the pore distribution beyond 10 nm. CuO crystallites seem to be blocking the mesopores and this involves a drastic decrease of the surface area until 71 m
2/g.
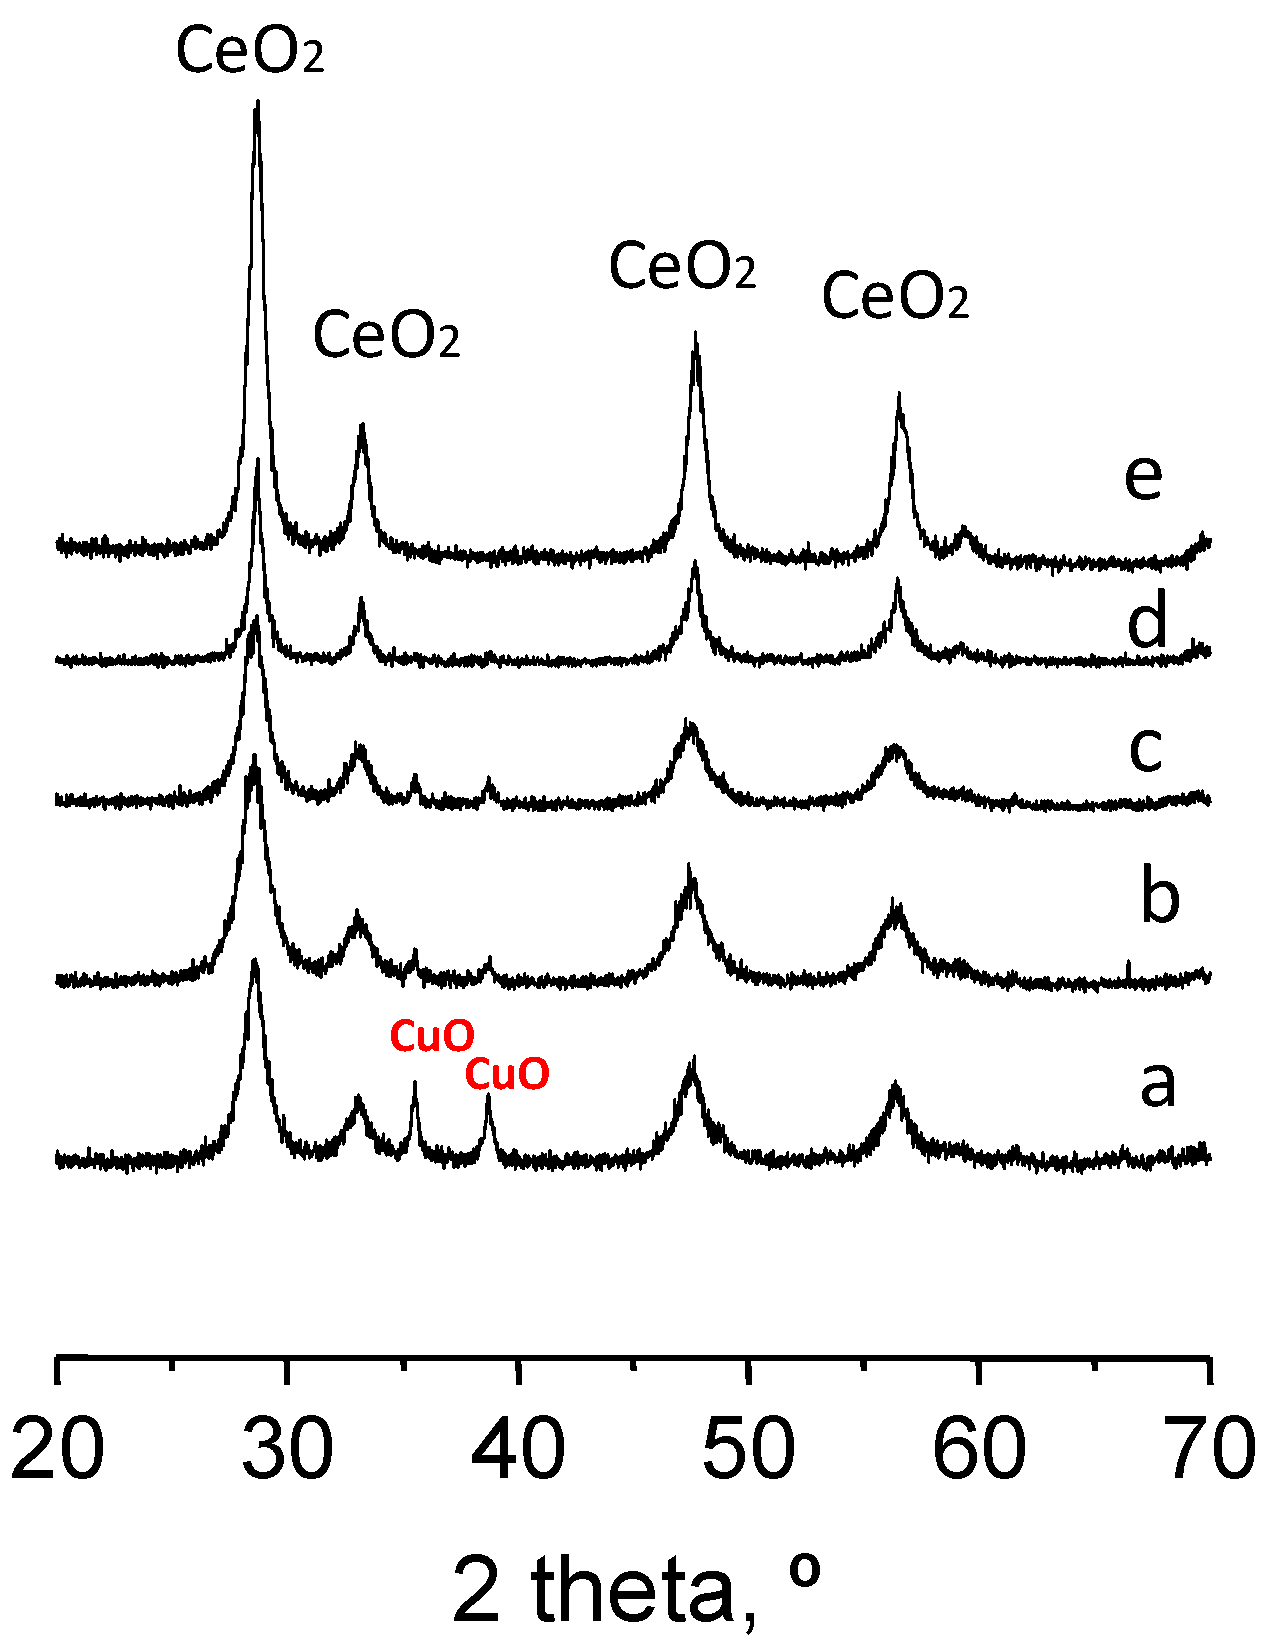
XRD experiments were conducted on representative ceria and Cu-ceria catalysts (XRD patterns shown in
Figure 2). It can be seen that in all cases diffraction peaks at ca. 28.5, 33.0, 47.4 and 56.3° are the most intense. These reflections correspond to the crystalline planes of the pure cubic cerium oxide (ceria fluorite structure, JCPDS 34-0394). Only small differences in the width of the ceria peaks, that mean a different size of the ceria domains, were observed. The crystallite sizes, determined using the Williamson-Hall method, indicate that the catalysts synthesized using urea in the preparation method present larger ceria crystallites (16 to 22 nm) than the other catalysts (6 to 8 nm). Moreover, in the catalysts with copper, reflections typical of CuO (copper oxide, JCPDS: 45-0937) at 35.5 and 38.6° are evident. The intensity of the CuO peaks increases with the copper loading of the catalyst and, among the different preparation methods, the lowest intensities corresponded to the samples prepared with urea. The CuO crystallite size observed ranges between 30 and 40 nm. Lattice parameters of ceria were also determined (
Table 1). No significant differences were observed between pure ceria and Cu-ceria catalysts. Although the incorporation of copper into the CeO
2 crystalline structure cannot be ruled out, the lack of shift in the XRD bands after Cu addition points out that most of the Cu species are CuO nanoparticles in close contact to CeO
2. We must note that in the CuCe5-U catalyst the peaks of CuO are almost undetectable and then the crystallite size of CuO must be very low.
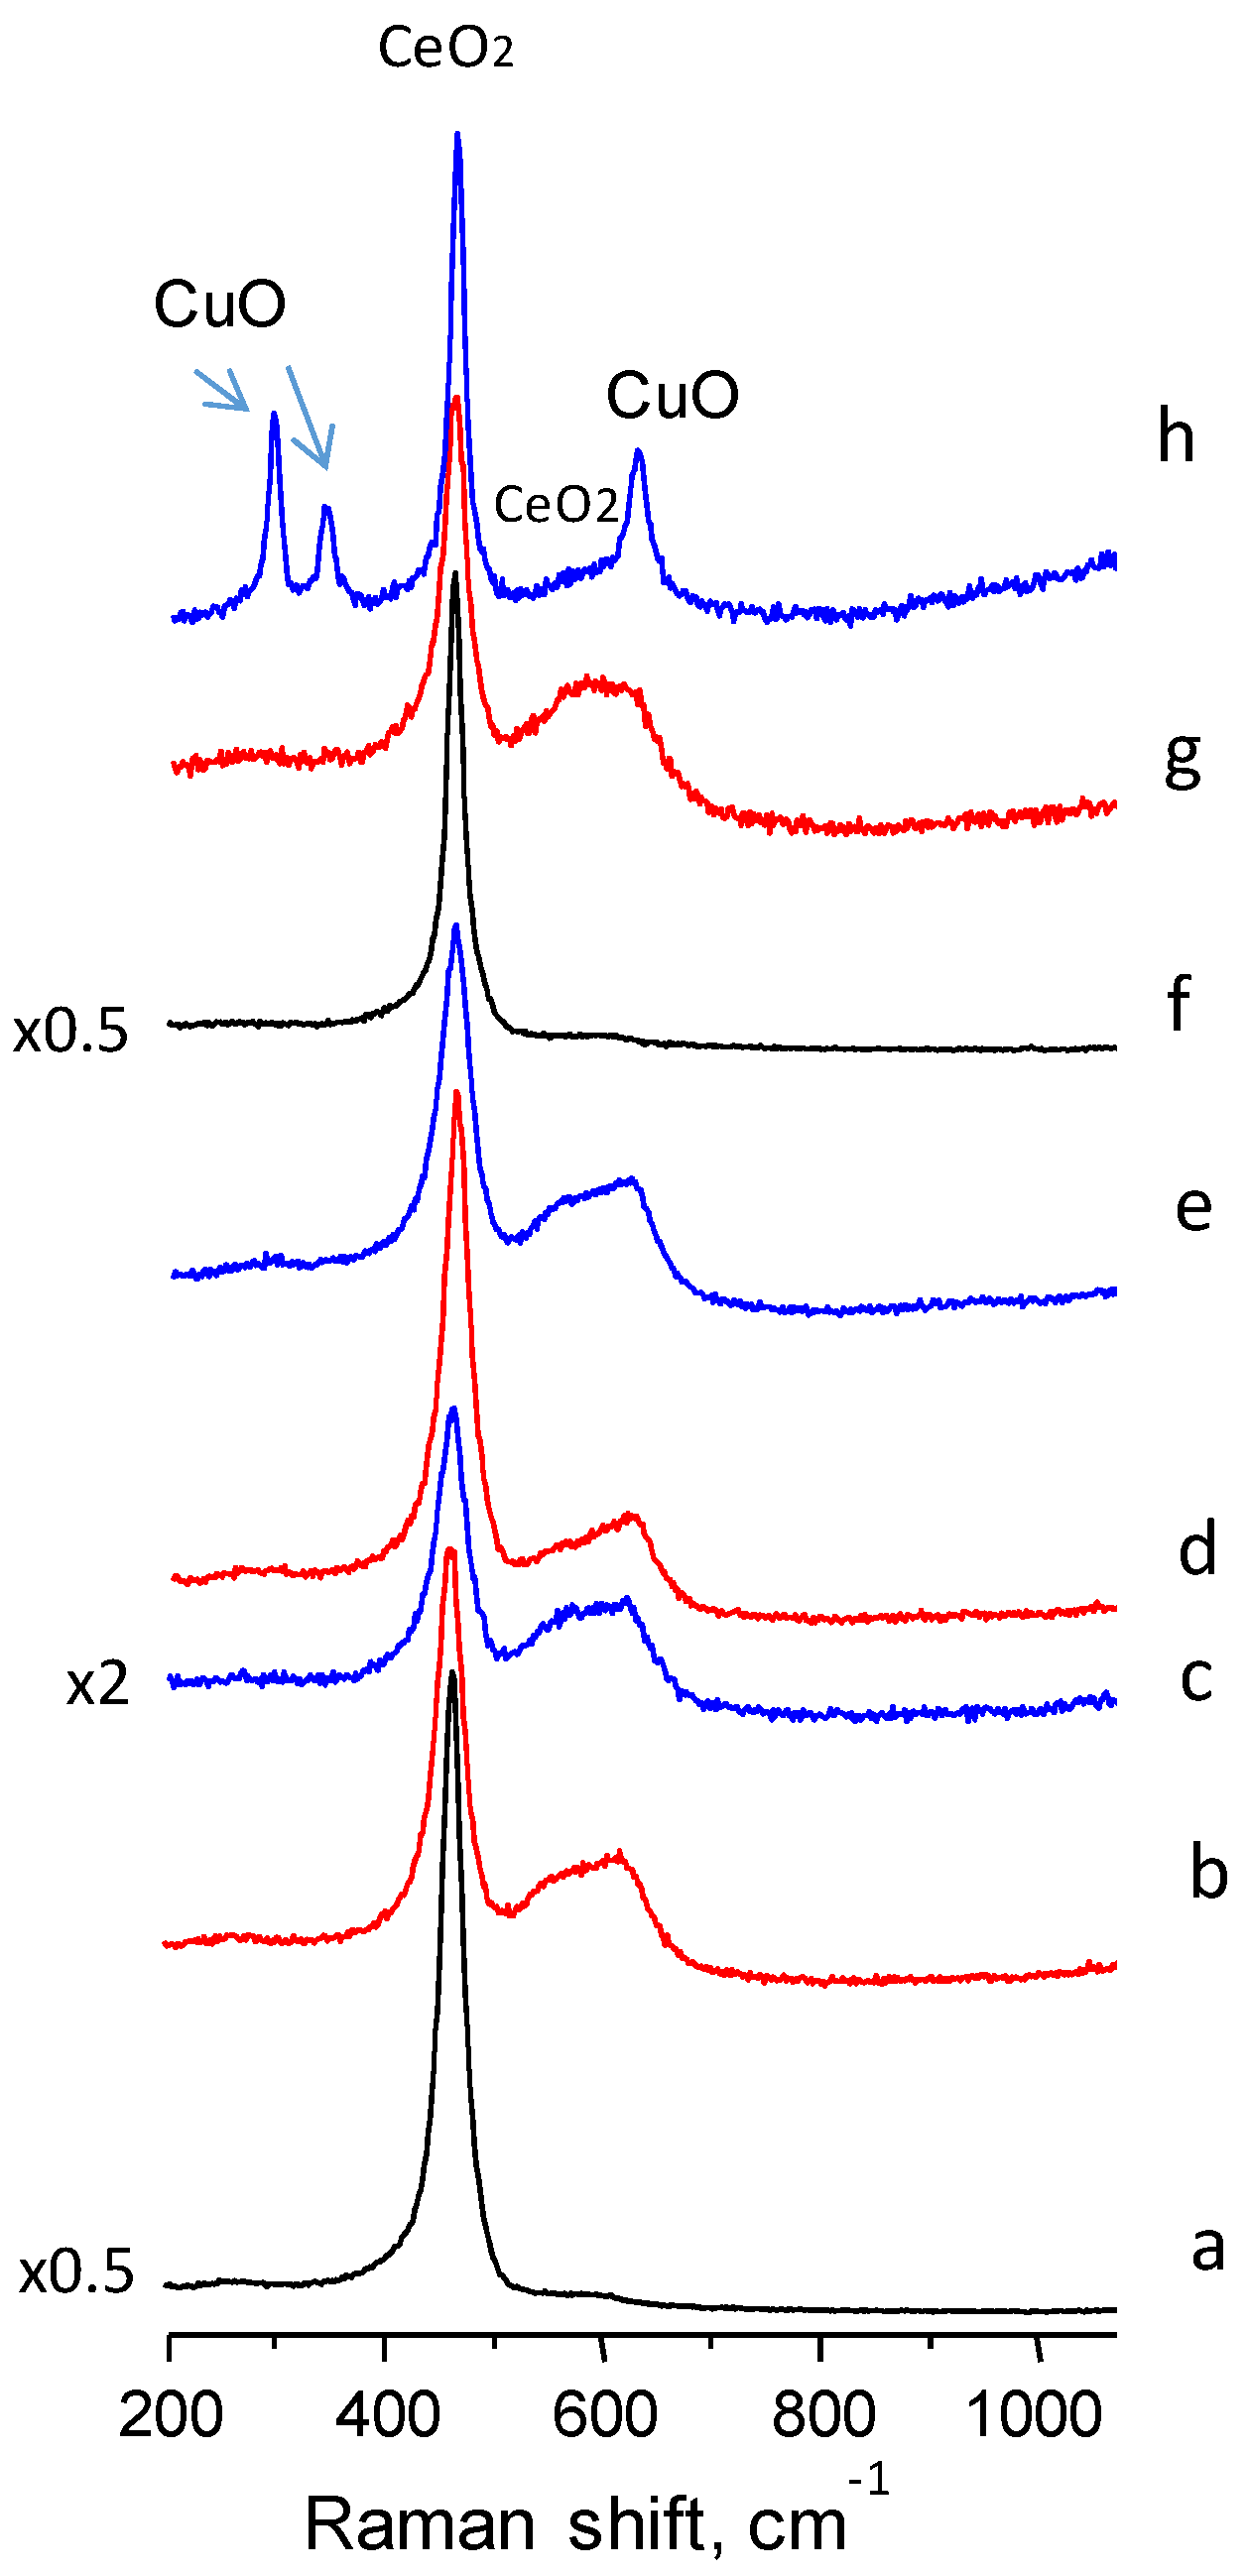
The Raman spectra of the ceria and Cu doped ceria catalysts (
Figure 3) show a predominant band centred at a frequency of 462 cm
−1, typical of CeO
2 vibrations (the triply degenerated TO mode). Another band of lower intensity was observed at ca. 600 cm
−1, especially in the copper containing ceria catalysts. This band has been assigned to defect induced (D) mode associated with the presence of oxygen vacancies due to the existence of Ce
3+ ions [
24]. Therefore, if the intensity of the 600 cm
−1 band is strong it can involve the presence of a large concentration of oxygen defects. Thus, the ratio of the intensities of the two main bands in ceria samples (I
600/I
460) can be used as an estimate of the relative oxygen vacancy concentration [
25]. In
Table 1, it is shown that the I
600/I
460 ratio is remarkably higher in the copper containing than in pure ceria catalysts, suggesting that the inclusion of copper increases the concentration of oxygen defects. Among the differently prepared catalysts, those prepared with urea present the highest ratio. Accurate information cannot be drawn with this ratio since CuO presents a Raman band at 625 cm
−1 which can interfere with the ceria band at 600 cm
−1. Bands in the range of 240–340 nm or 600–800 nm related to O
2− → Cu
2+ CT and d–d transitions, respectively, have been reported for crystalline CuO in UV-Vis diffuse reflectance measurements [
26,
27,
28]. Indeed, typical bands of copper oxide at 300, 340 and 625 cm
−1 are apparent in the high Cu-loading ceria prepared using the polymer (CuCe13-P).
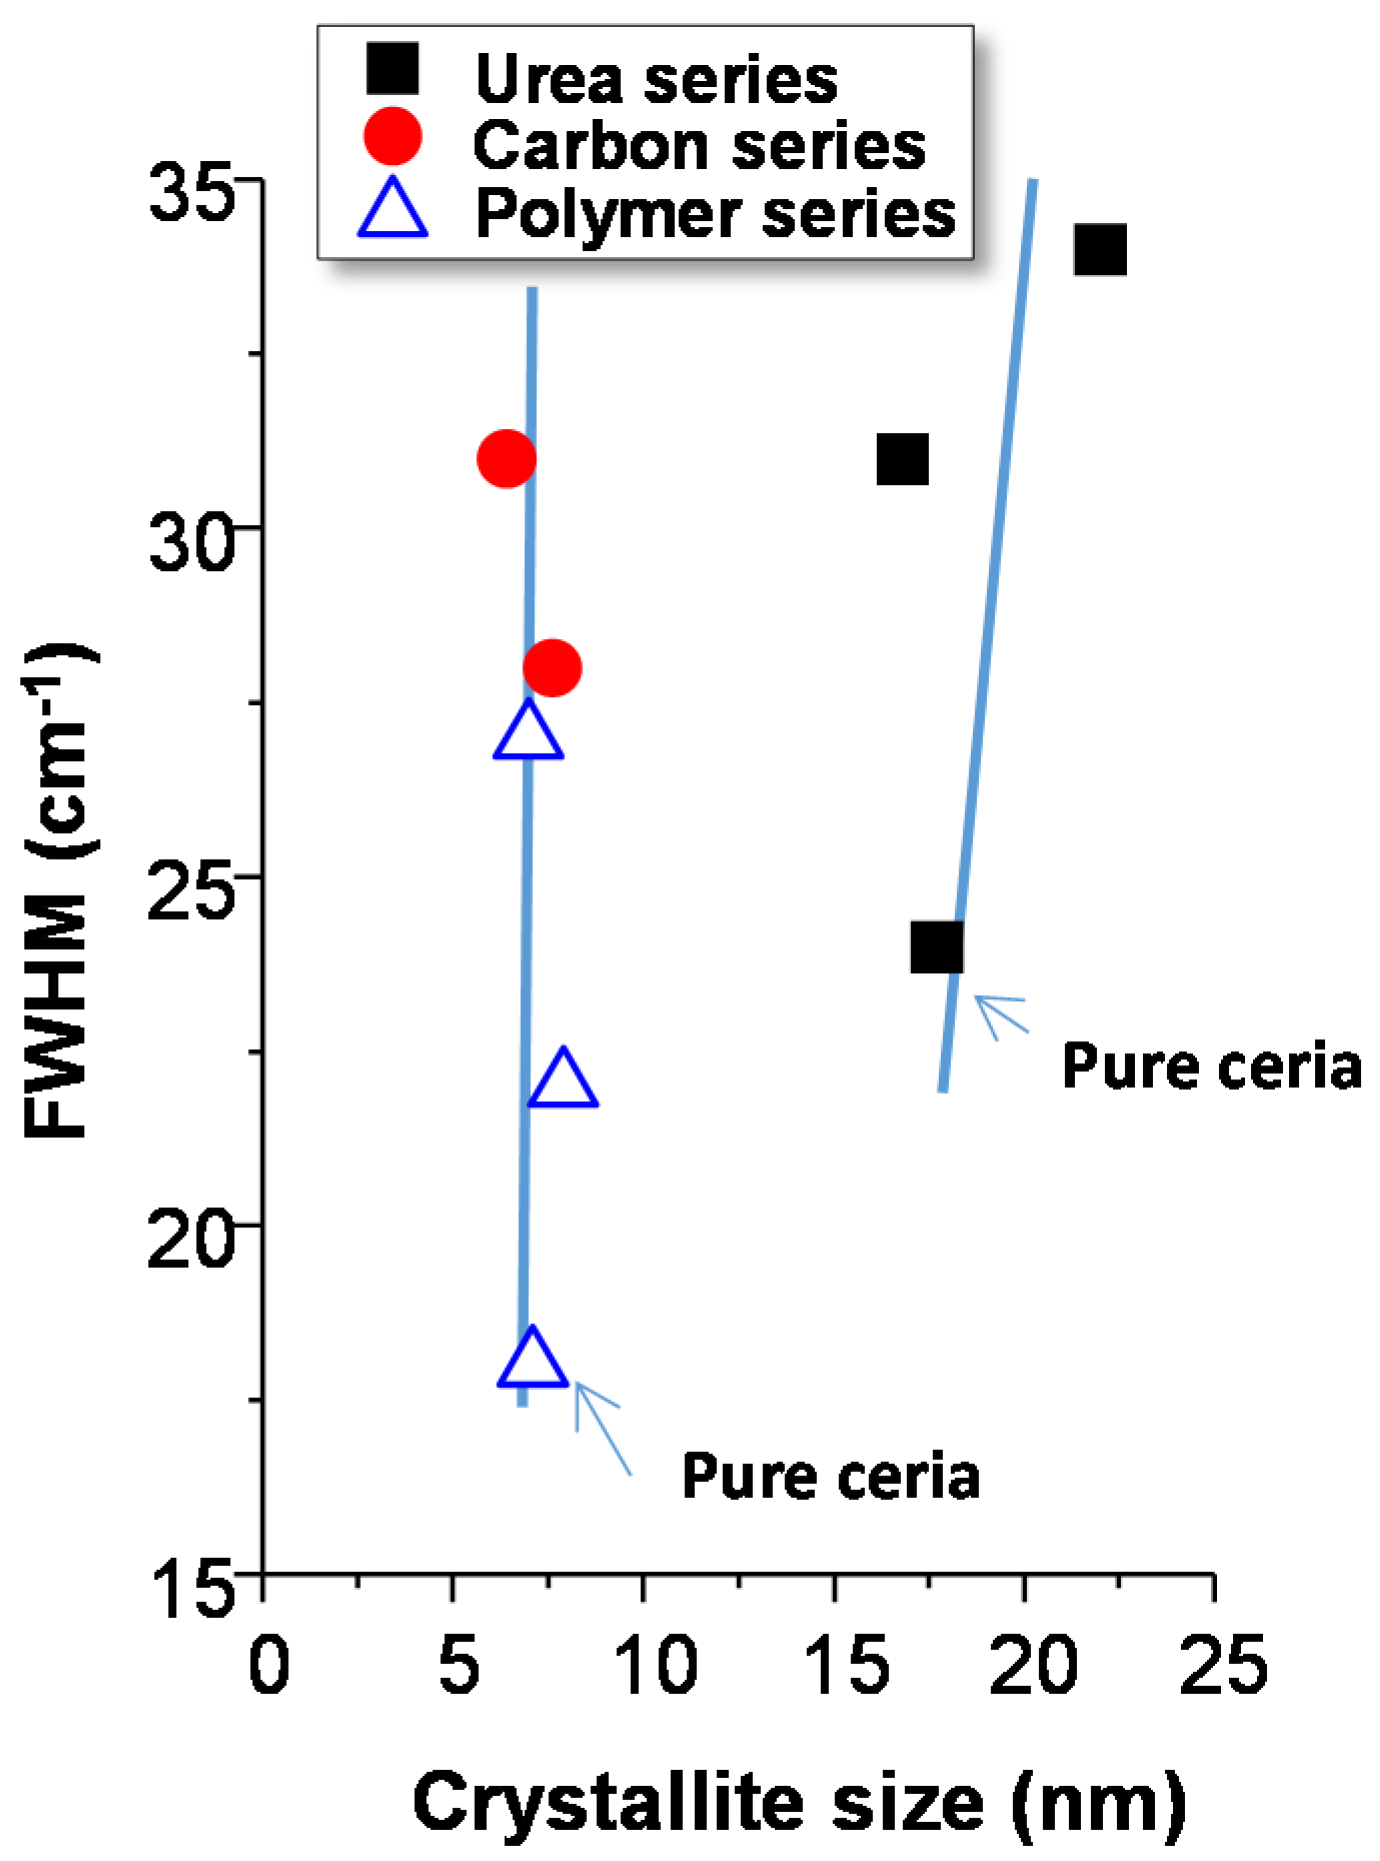
On the other hand, the width of Raman bands (usually quantified by the FWHM of the main ceria band at 460 cm
−1) has been related to both the size of the ceria crystallites and the concentration of oxygen vacancies of ceria [
29]. Thus, the wider the band the lower is the ceria crystallite size and/or the higher is the number of oxygen defects. In order to estimate the number of vacancies, the FWHM of the band at 460 cm
−1 is represented with the ceria crystallite size estimated by XRD (
Figure 4). It can be observed that the catalysts prepared using carbon or polymer present a particle size remarkably lower than those prepared using urea. However, the width of the Raman band of the Cu-ceria catalysts is similar or even higher in the urea catalysts. This seems to indicate that the urea catalysts present the highest concentration of oxygen defects, which is the same conclusion obtained when the I
600/I
460 ratio is considered. Similarly, it is shown that the crystallite size between pure ceria and copper doped ceria prepared by the same method is similar. However, the FWHM values of pure ceria catalysts are lower than the corresponding copper-containing samples, suggesting again that the addition of Cu increases the concentration of oxygen defects.
By the Raman spectra it was concluded that the urea catalysts present the highest number of bulk/sub-surface vacancies. This conclusion matches with the fact that in the XRD patterns of Cu-ceria catalysts prepared with urea, the diffraction lines of copper oxide are hardly visible, suggesting that copper oxide particles are very small and/or copper has entered into the CeO2 lattice creating more defects. As XRD analysis does not show variations in the lattice parameters Cu must be mainly present as small CuO crystallites.
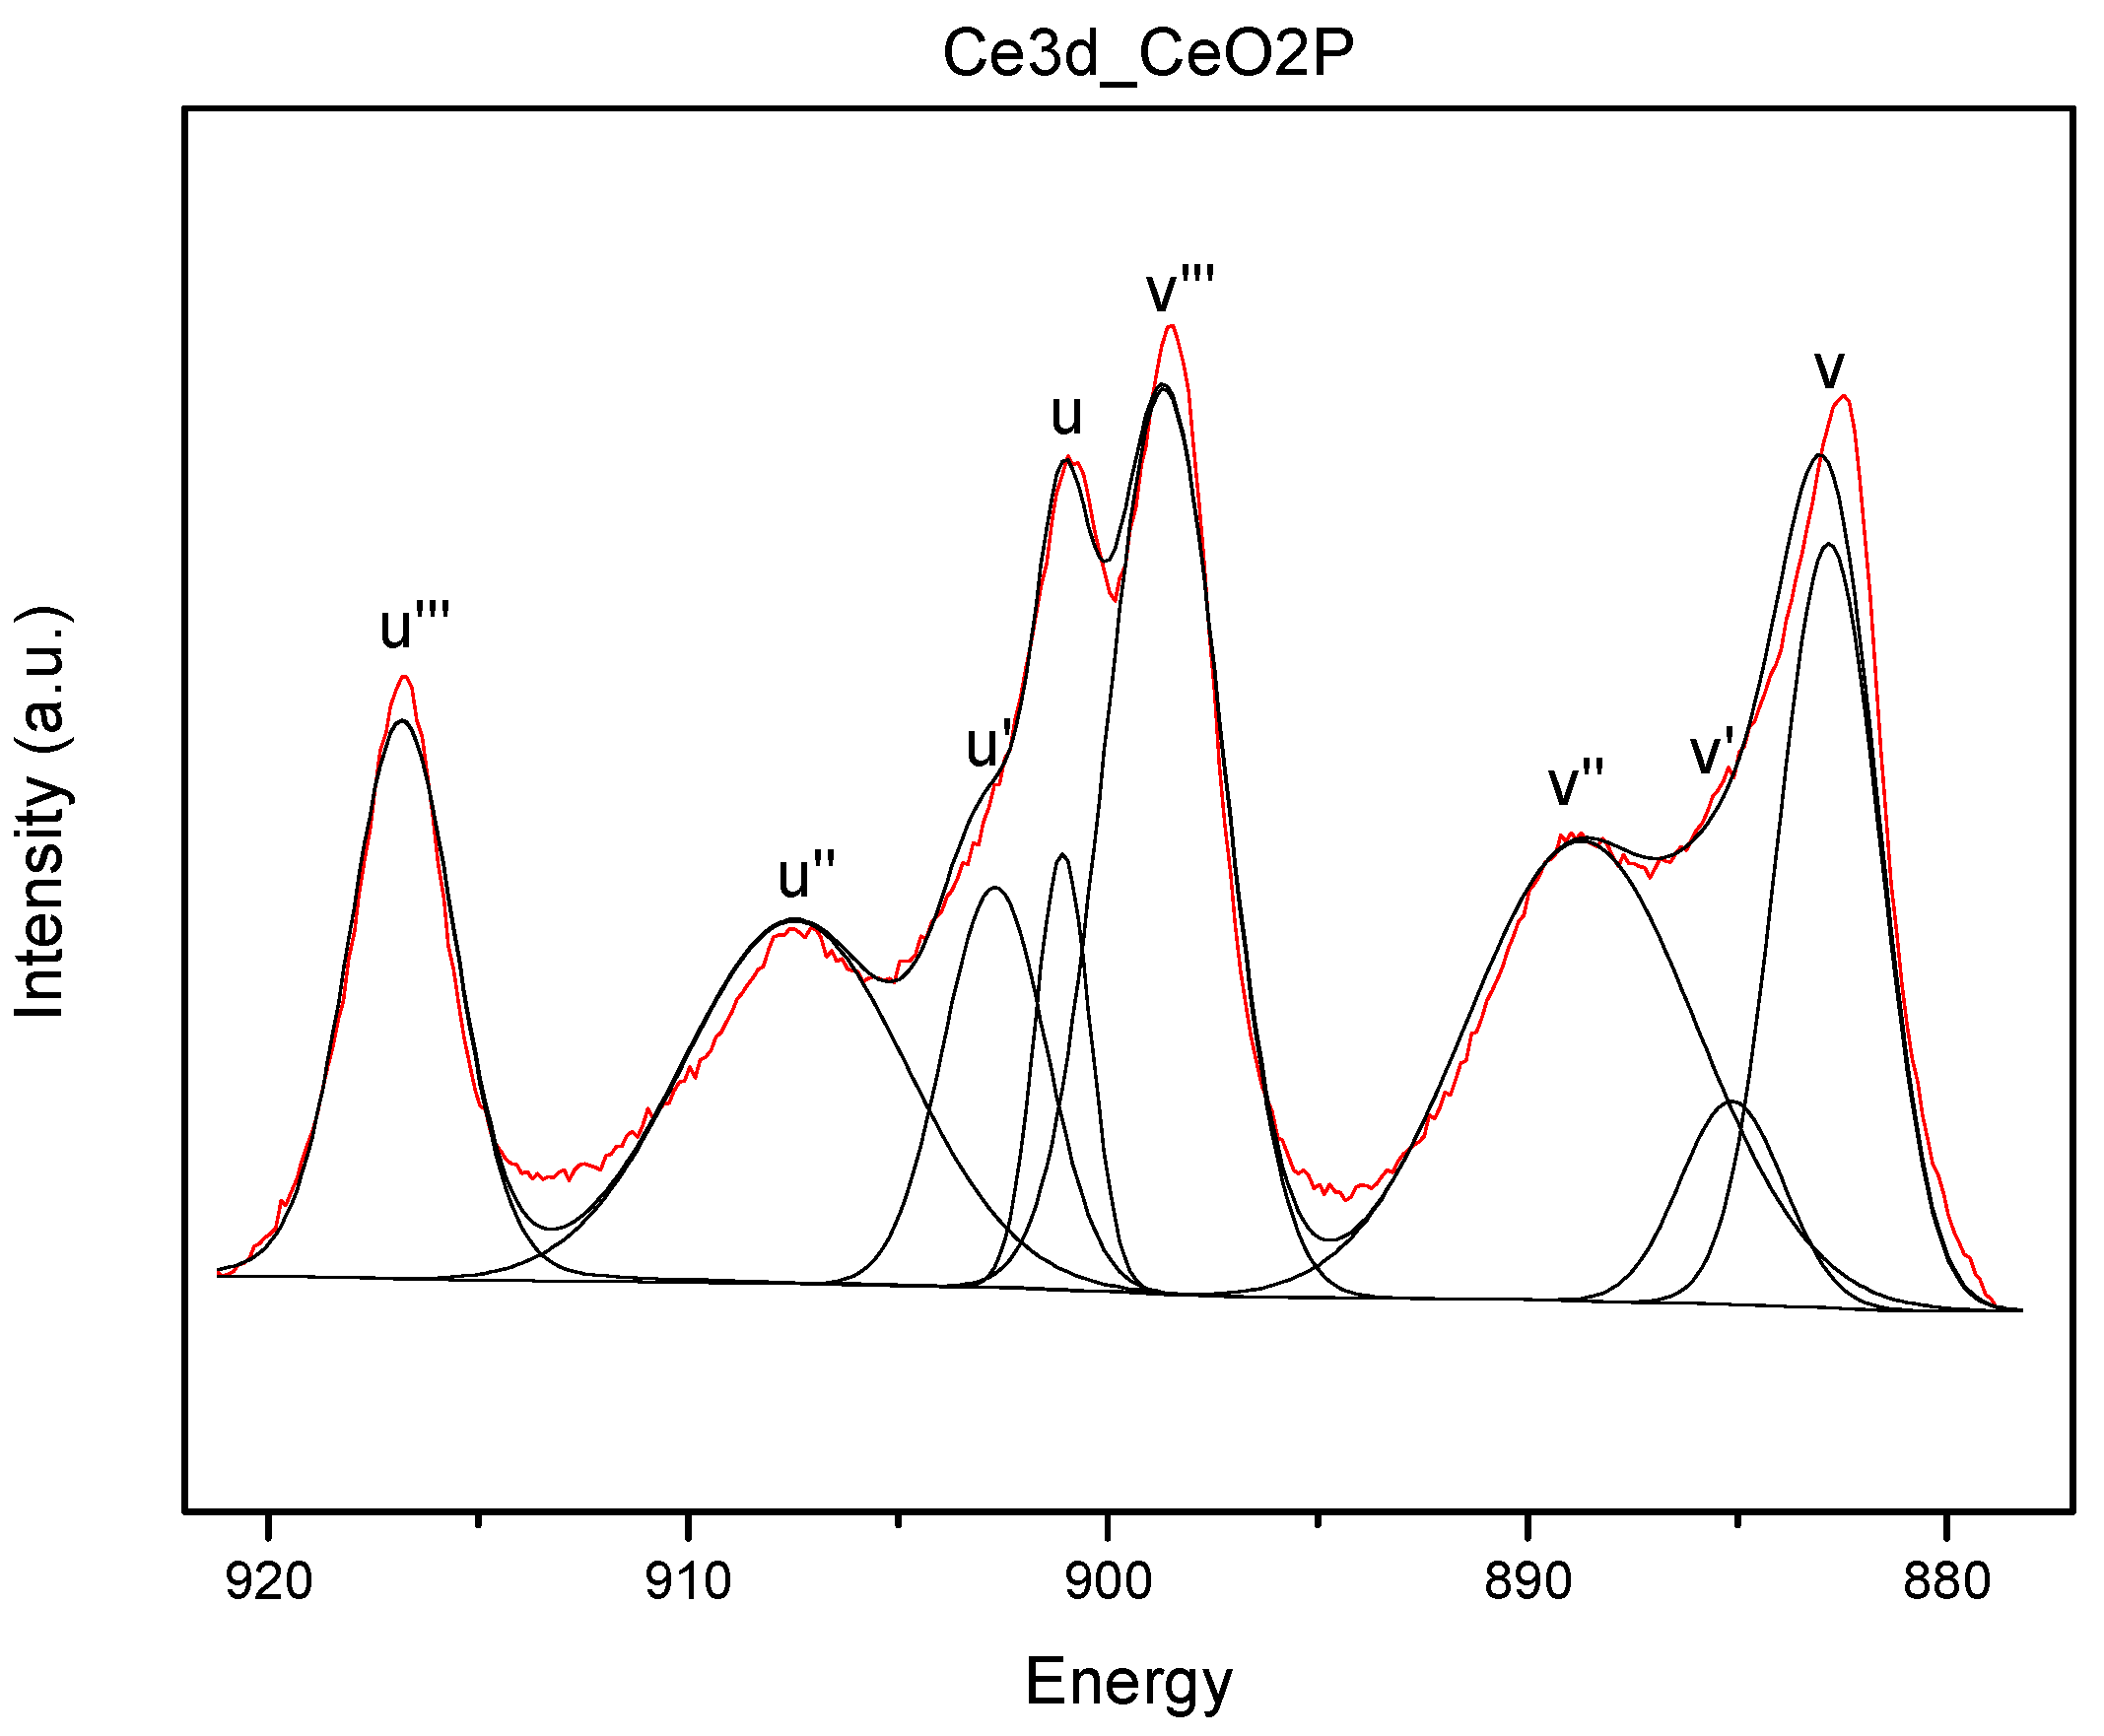
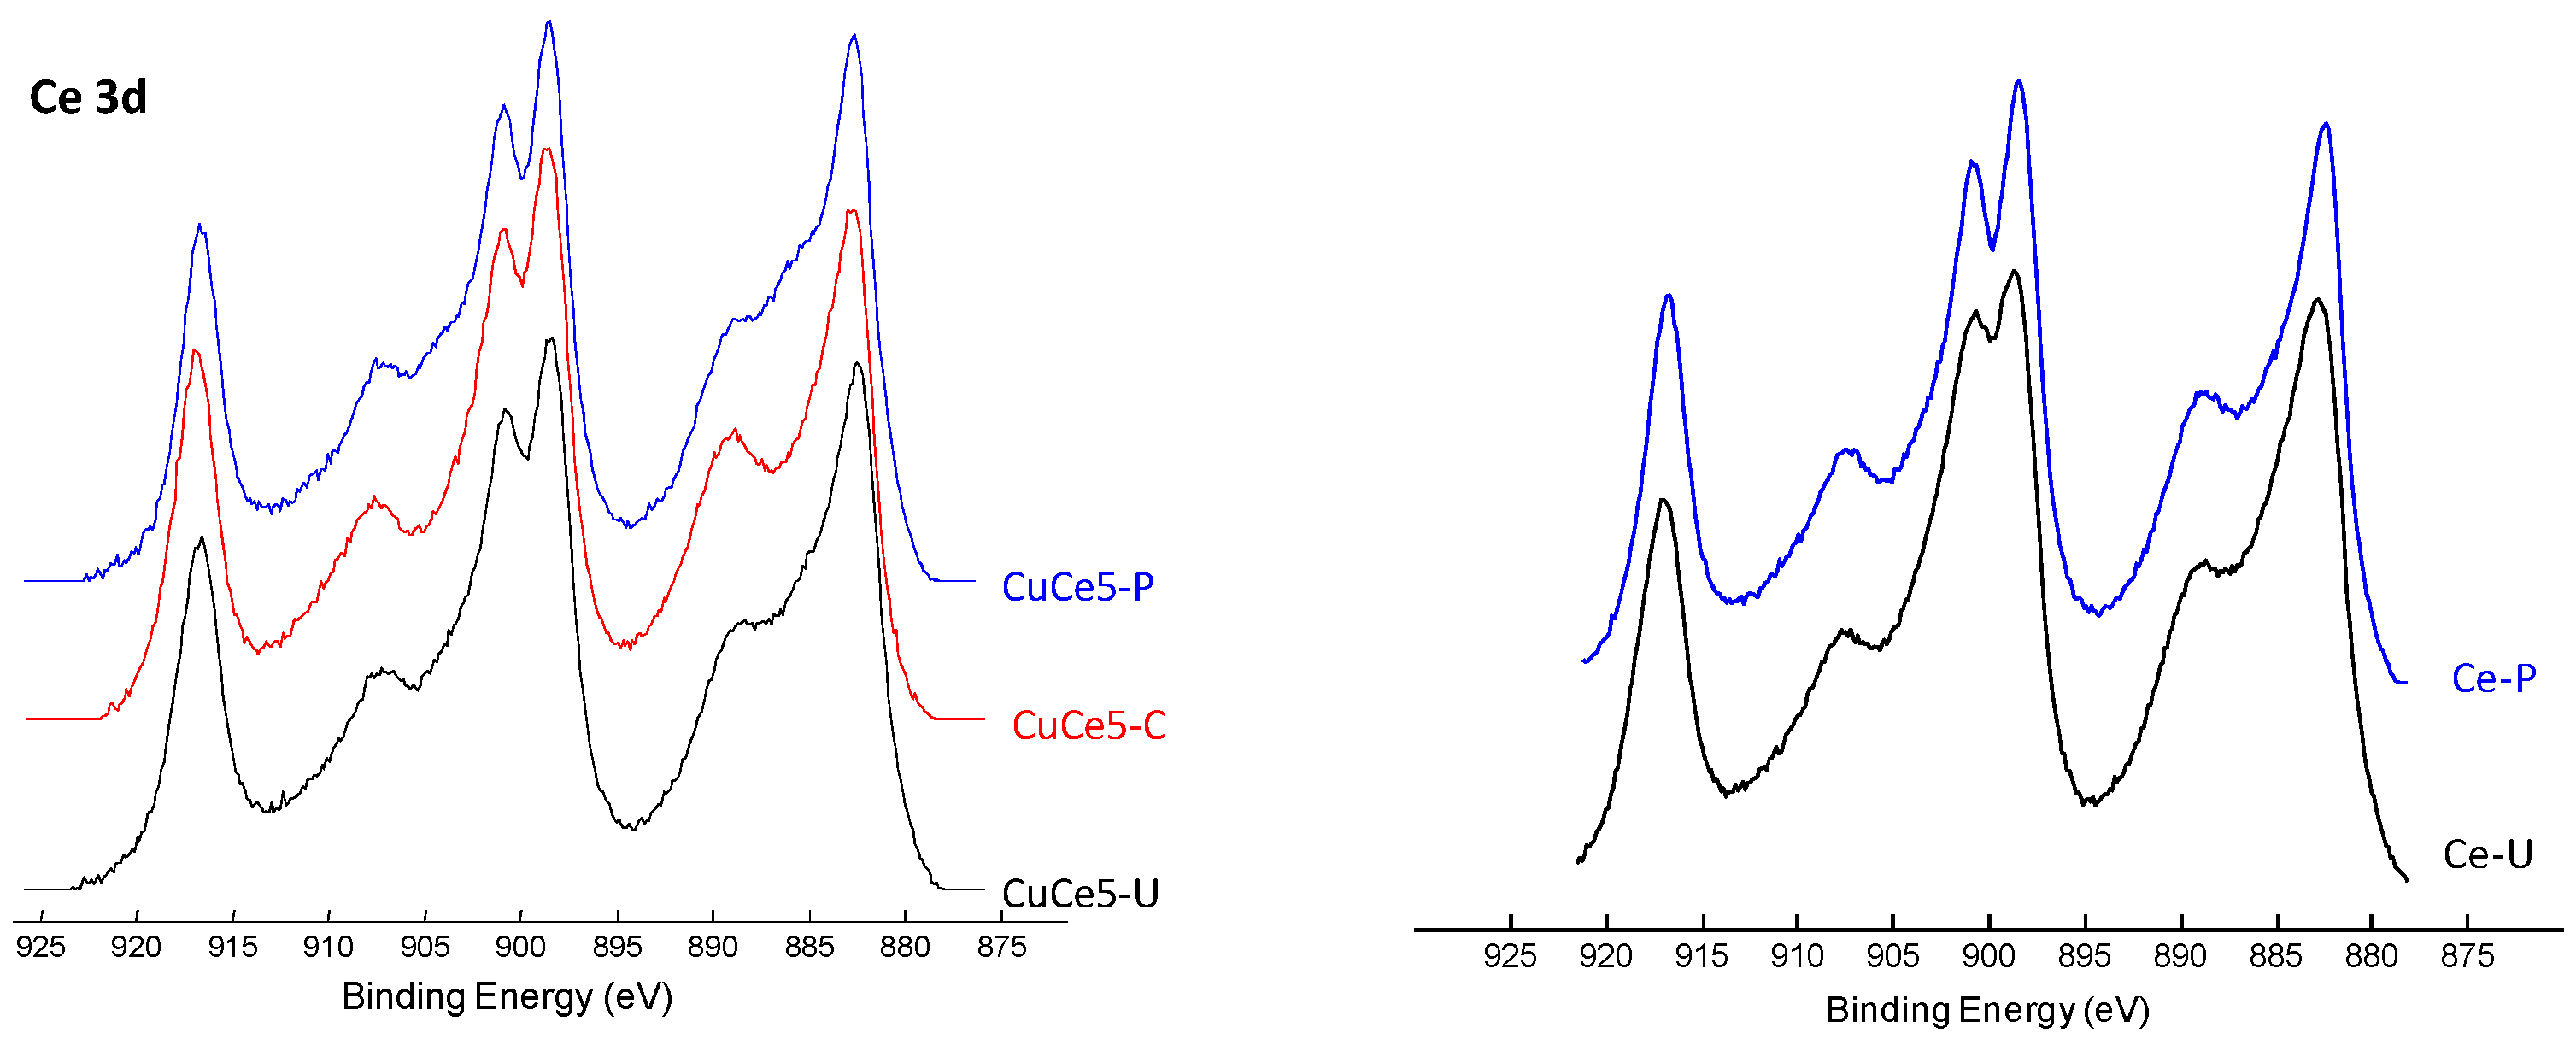
X-ray photoelectron spectroscopy was conducted on the catalysts without and with 5 wt % CuO (
Figure 5), in order to provide information about the oxidation state of cerium on the surface and the possible outer vacancies (XPS extends from the first layer to a depth of only 50–70 Å). The interpretation of the XPS spectrum of Ce3d (
Figure A1) is very complex with overlapped peaks, although a rather precise deconvolution can be made [
30,
31]. The spectra show two main signals at binding energies about 901 and 883 eV, which are assigned to Ce 3d3/2 and Ce 3d5/2, respectively. These peaks together with additional satellite peaks at ca. 917.1, 907.8, 898.5 and 889.2 eV are related to their ionization processes and are typical of Ce
4+ species. On the other hand, peaks at 902.6, 898.8, 884.4 and 880.7 eV are characteristic of Ce
3+ species. The number of reduced, non-stoichiometric cerium species in the outer layers of the catalysts shows no difference regardless of the preparation methods and of the presence of copper. Thus, in all cases Ce
3+/(Ce
3++Ce
4+) is 0.11–0.12.
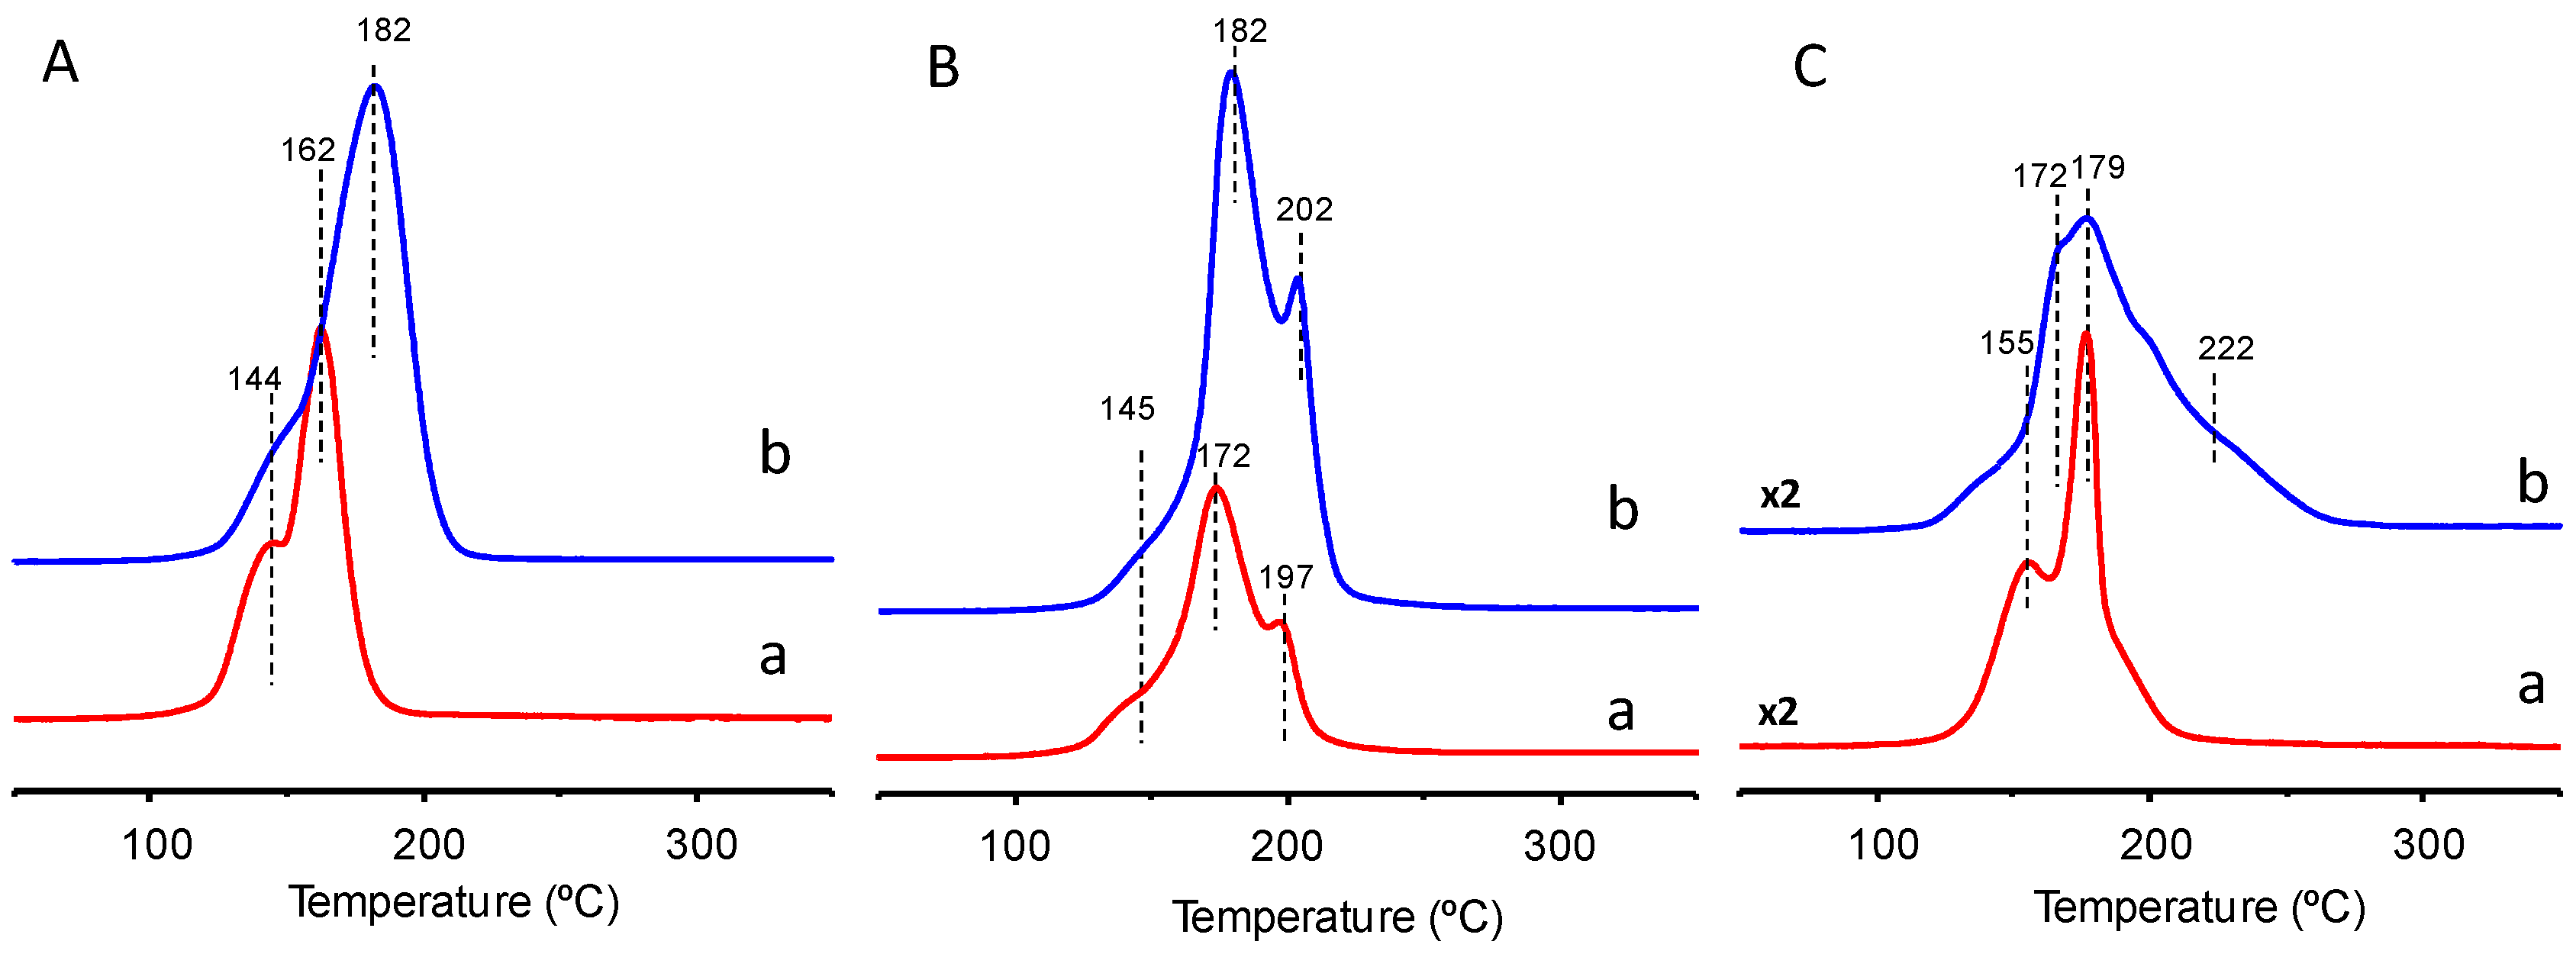
Figure 6 shows the TPR profiles of Cu-Ce-O mixed oxide catalysts. In our case, all pure CeO
2 samples show two single peaks at ca. 475 °C and 800 °C (not shown), which are related to the reduction of surface ceria species (removal of surface capping oxygen of ceria) and the reduction of the bulk CeO
2, respectively [
32]. Thus, the reduction peaks observed in the range of 100–300 °C can be attributed to the reduction of Cu species in mixed oxides [
33,
34,
35]. In general, it is known that in the case of CuO-CeO
2 samples, the TPR profiles show the presence of several reduction peaks at three different temperature regions: (i) in the 140–165 °C region, associated with the reduction of the finely dispersed CuO species strongly interacting with ceria; (ii) in the 170–190 °C region, reduction of larger CuO particles weakly associated with CeO
2; and (iii) in the 200–225 °C region, associated to bulk CuO or supported CuO without interaction between CuO and support. In addition, the intensity and position of the reduction peaks strongly depend on the catalyst preparation procedure and the Cu-content. But it is also clear that the crystal sizes can modify slightly the position of the maxima. According to our results only subtle differences are observed among the different Cu-Ce-O catalysts. We must note that the H
2 consumptions during the TPR experiments in the 100–300 °C temperature range are, for all Cu-Ce-O catalysts, slightly higher than those corresponding to the reduction of all the CuO sites present in those catalysts. This suggests that all (or almost all) the copper oxide is reduced, along with a small portion of ceria.
Ceria and Cu-containing ceria synthesized by different preparation methods were tested in the total oxidation of propane. In all cases carbon dioxide was the main reaction product observed. Propylene and carbon monoxide were identified in some experiments but always with low yield, never exceeding 1%.
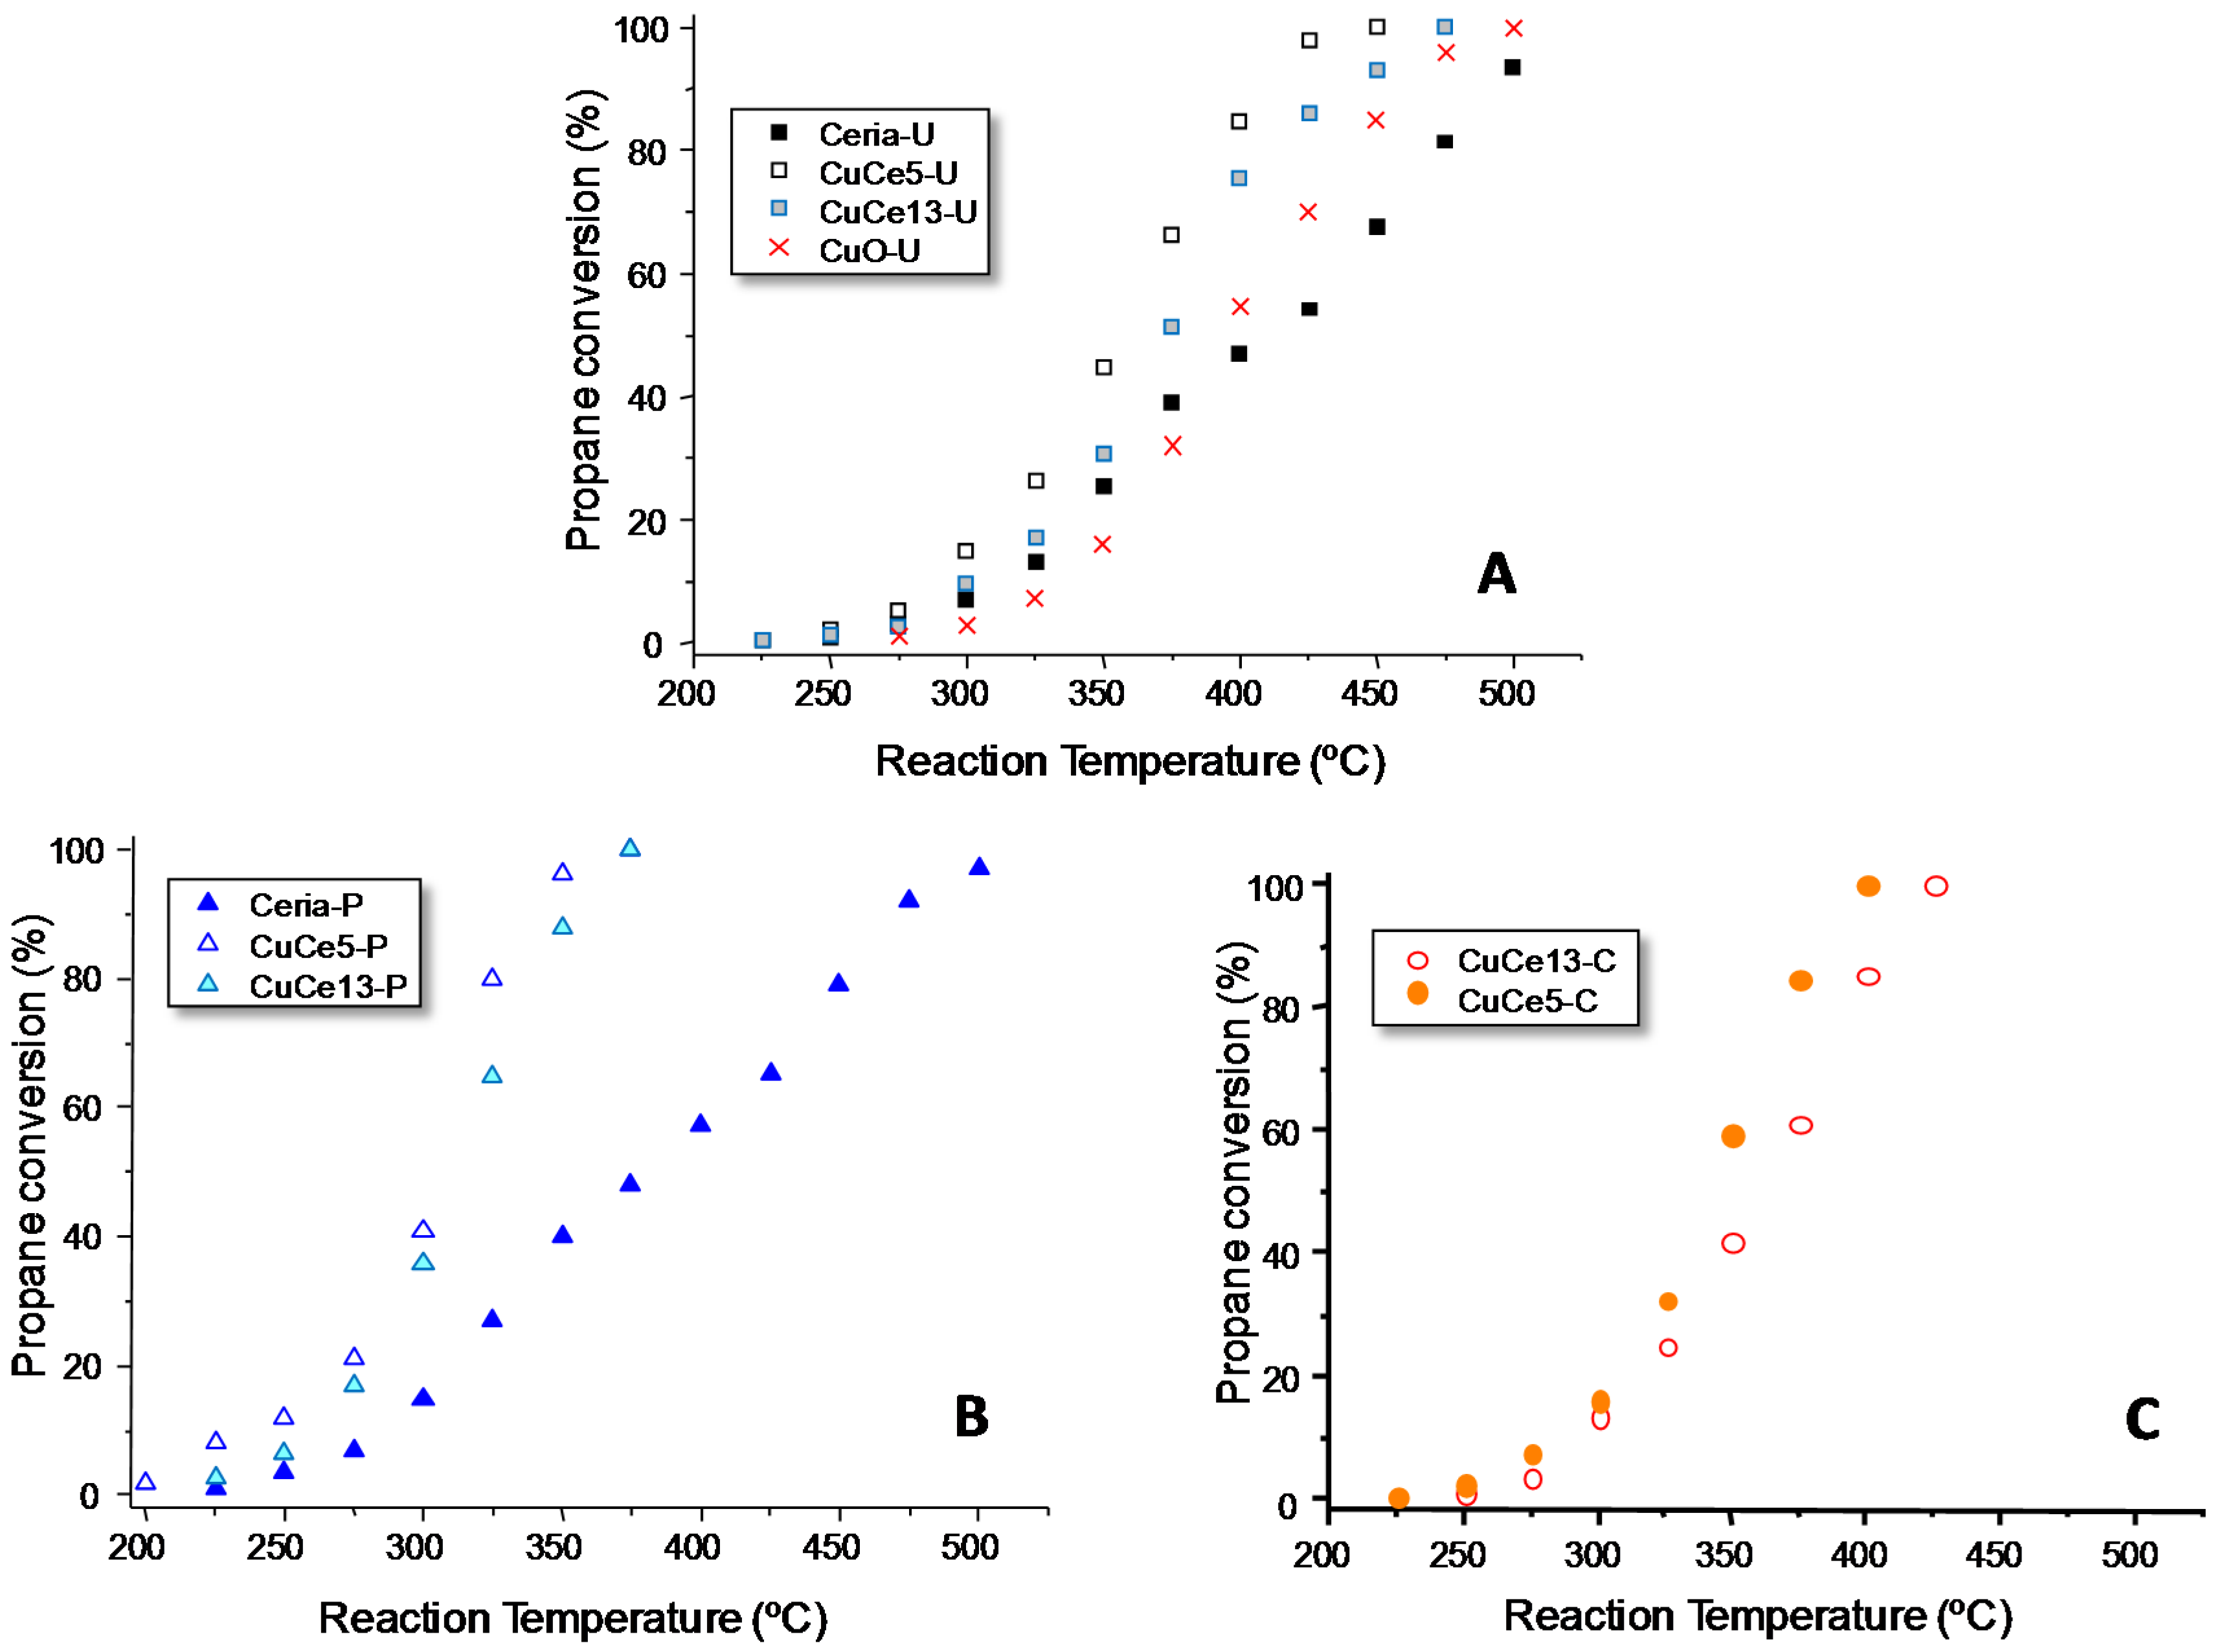
Figure 7 plots the variation of the catalytic activity, expressed as propane conversion, as a function of the reaction temperature for the differently prepared ceria catalysts. The results obtained indicate that all mixed Cu-containing ceria are more active than their corresponding pure ceria catalysts, the Cu-ceria with 5 wt % CuO being the most active in all series (see T20, T50 and T80 values,
Table A1). Thus, the catalytic activity decreases according to the following trend: CuCe5 > CuCe13 > CeO
2 (although in the case of the CuCe-C series, pure ceria has not been tested).
For comparison, the activity of the CuO synthesized by the urea method has been also included. Pure CuO presented lower catalytic activity than Cu-ceria catalysts. It is worth mentioning that pure ceria presents higher conversions than pure CuO at low temperature, but this trend is reverted at high temperature. Comparison at reaction temperatures in which low conversions are obtained is usually a more reliable measurement of the catalytic activity than at high conversions, due to the fact that at high conversion mass transfer can be predominant in detriment of catalysis.
Among the different CuO-ceria catalysts tested, those synthesized using the polymer, CuCe5-P and CuCe13-P, are the most active, followed by the catalysts prepared using the carbon as a template. Finally, the catalysts prepared with urea lead to the poorest performance.
Stability tests (not shown here) have been undertaken for 24 h on three representative catalysts (CeO2-P, CuCe5-P and CuCe5-U) showing that the conversion keeps unaltered for the whole experiments.
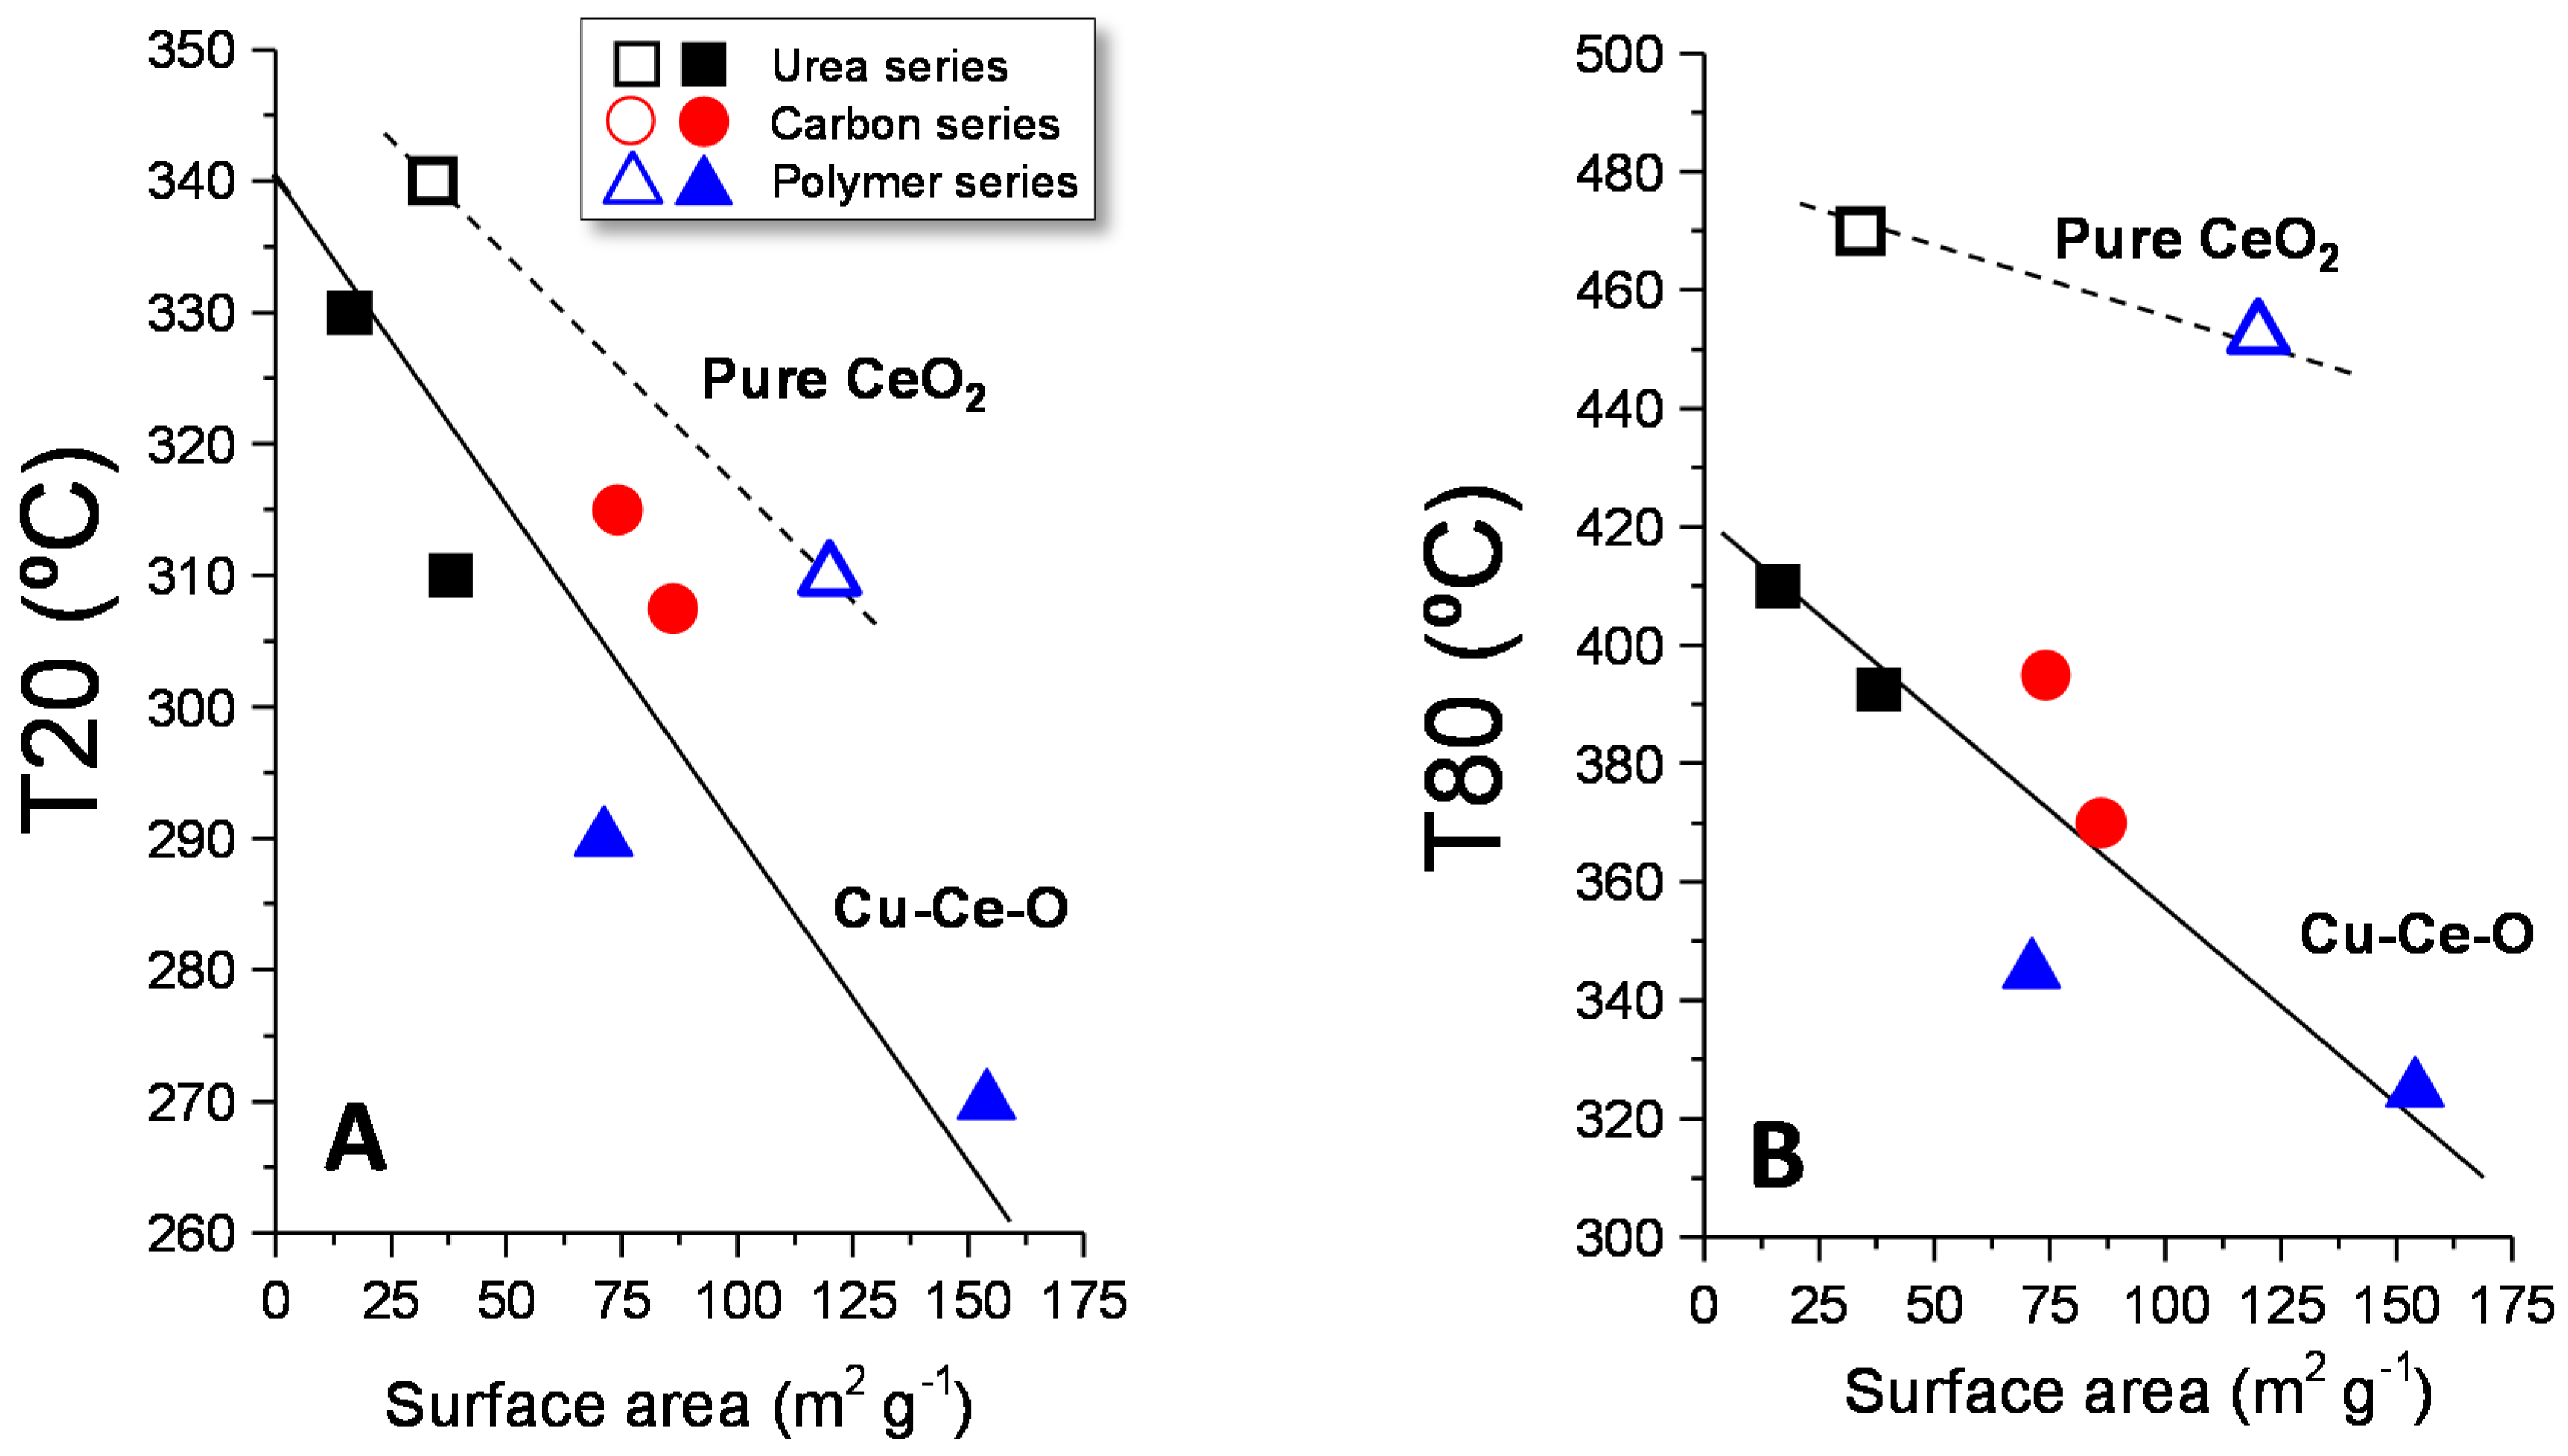
Figure 8 shows the variation of T20 and T80 (the reaction temperatures needed to reach 20% and 80% conversion, respectively, which are shown in
Table A1) with the surface area of the catalysts. Thus, the higher T20 or T80, the lower the catalytic activity of the studied catalysts. A clear influence of the surface area can be observed, in a way that the higher the surface area, the higher the catalytic activity (the lower the T20 or T80). However, it seems that there are two trends; one is for pure ceria and another one for Cu-Ce-O samples. Thus, the values of T20 and T80 for pure ceria samples are higher than those of Cu-Ce-O, indicating that, for a given surface area, the catalytic activity is higher in the catalysts containing copper. This is in agreement with the fact that the incorporation of copper to ceria increases the number of sub-surface/bulk vacancies, as suggested by Raman. Interestingly, the number of surface oxygen vacancies (as observed by XPS) is similar for all the samples studied and therefore this is not a factor that could explain the differences observed in the catalytic activity.
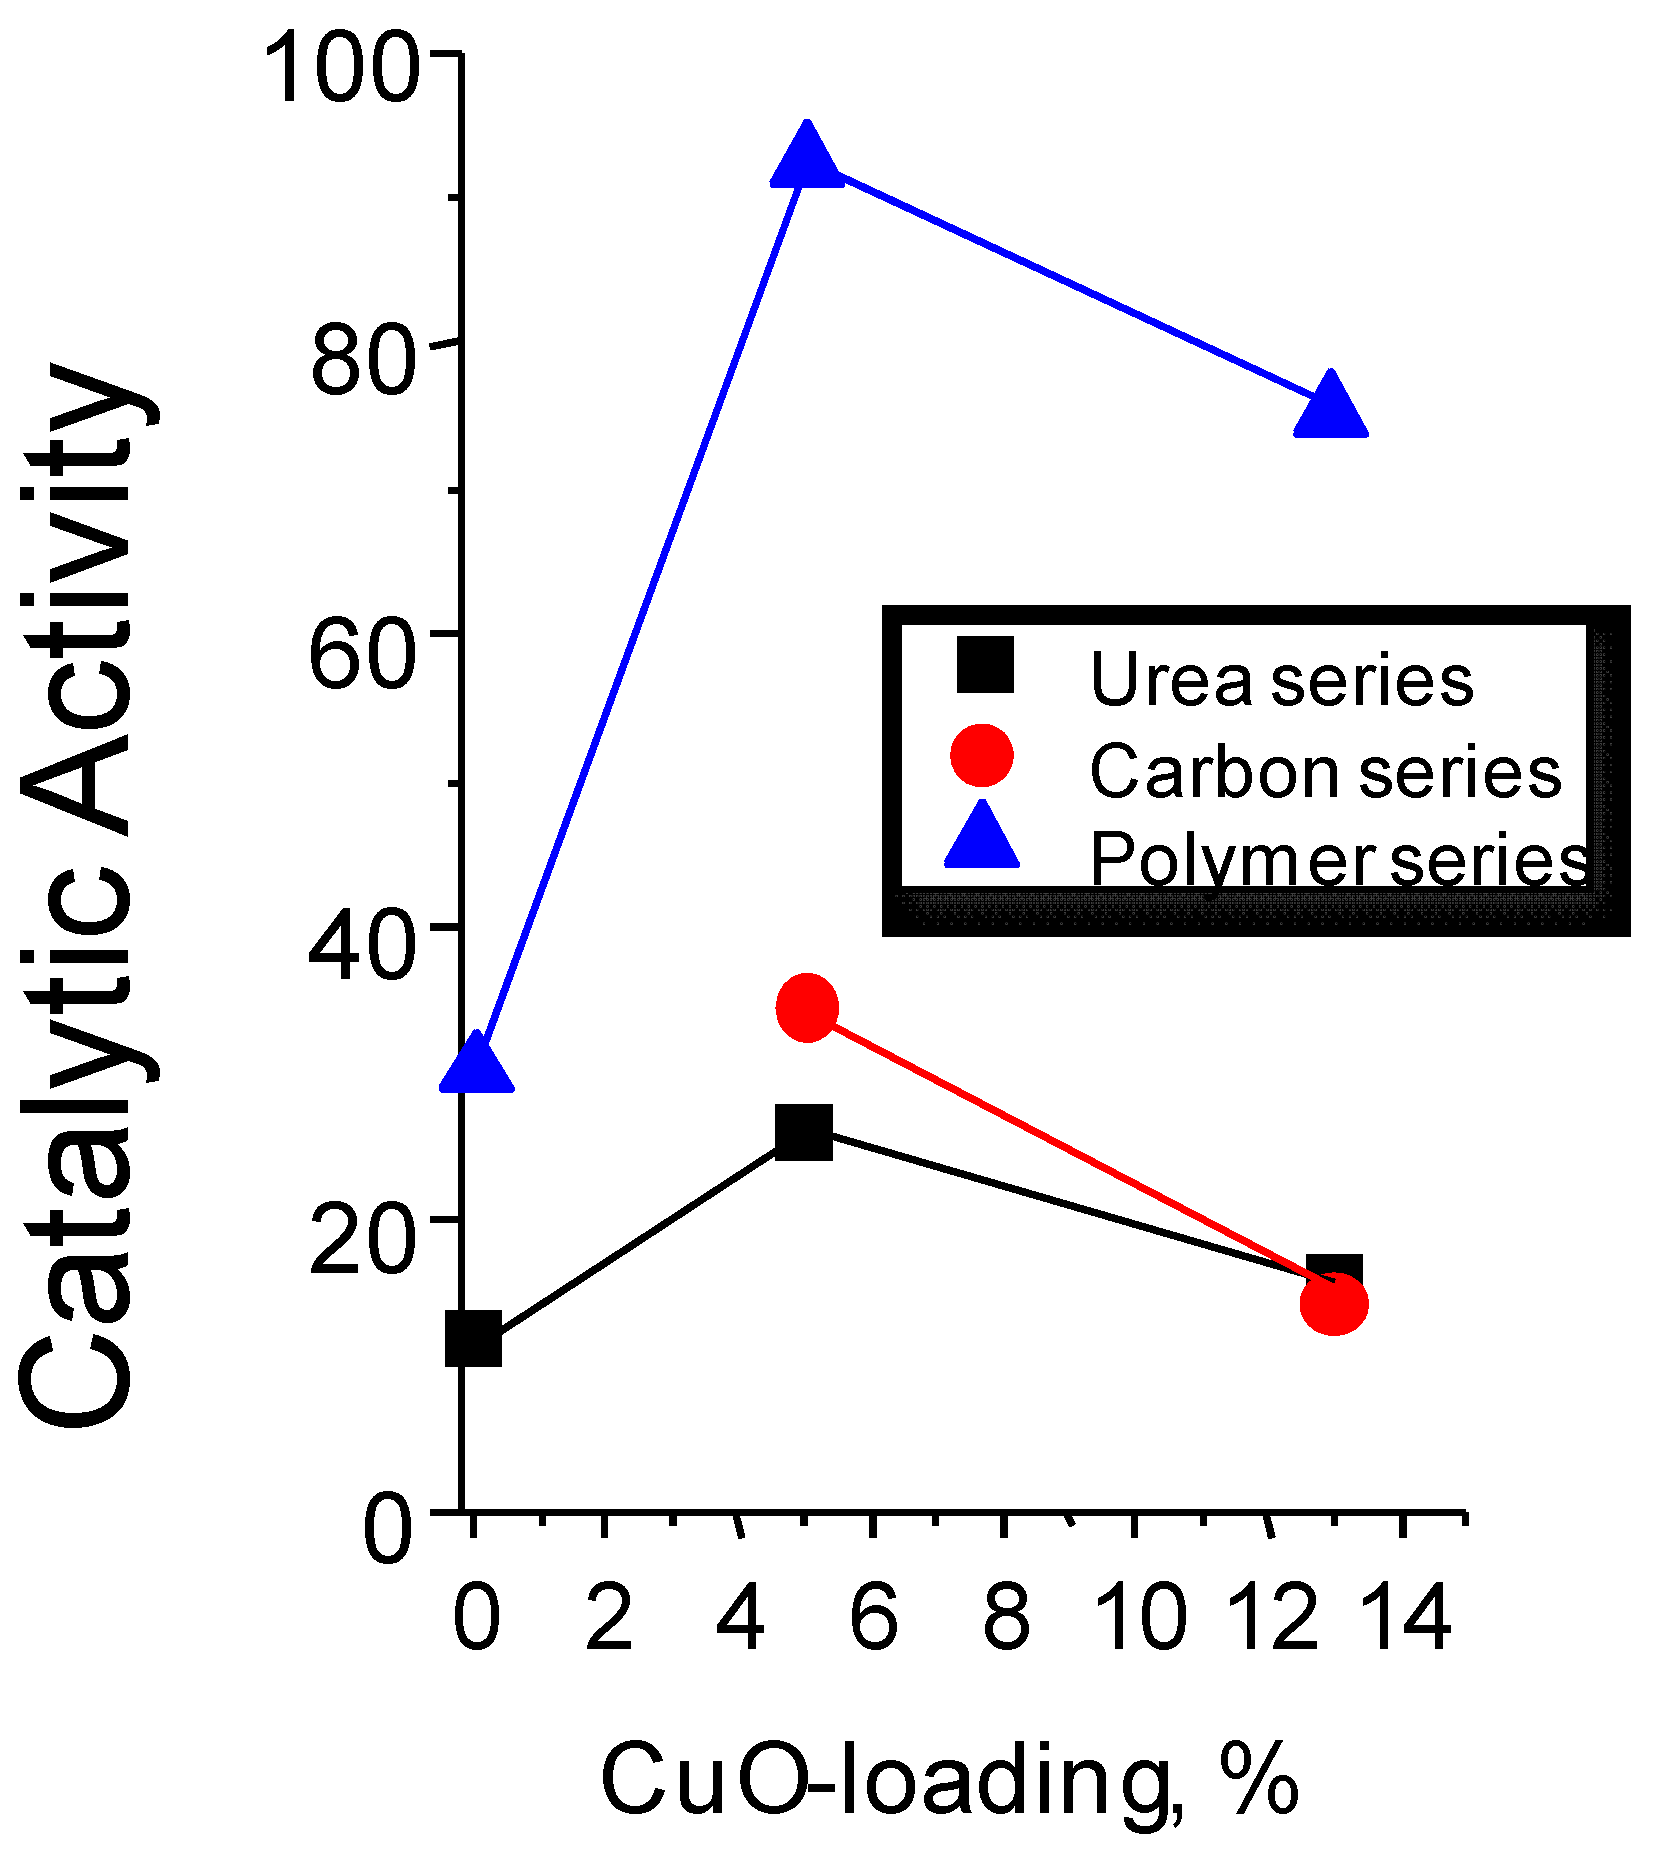
Moreover, in all series, the highest activity was obtained by the catalysts with low Cu-loading (five percent), see
Figure 9. This fact is in line with the decrease observed in the surface area in those samples with higher copper loading.
We also conducted an experiment using the CuCe5-P catalyst employing the same space velocity (contact time) at 325 °C replacing the oxygen of the feed by helium. We observed that, even without O2 in the feed, CO2 was the main product observed with propene present as minority. The conversion is remarkably lower than that obtained in the experiment with oxygen in the feed. With oxygen in the feed, propane conversion of ca. 80% is obtained, whereas without oxygen the initial conversion was ca. 8%. As expected, this conversion decreases with the time on line, in agreement with the depletion of the active surface lattice oxygen. The detection of an oxygen containing compound such as CO2 involves the participation of lattice oxygen. Therefore, this result suggests that the mechanism is, at least partly, redox.
The adsorption/chemisorption/activation of propane on the surface of the catalyst is determined by the number and characteristics of the surface sites. This step is likely to be similar in all the catalysts studied as the TPR and XPS results suggest. Apparently both the reducibility and the number of surface defects are similar for all catalysts. However, the number of bulk/sub-surface defects (estimated by Raman), which affects the migration of oxygen species from bulk to the surface and the further oxidation, differs among the catalysts studied and this influences the reactivity. However, the main factor determining activity was demonstrated to be the surface area. We must mention that CuO is also active although less than ceria. Due to this, the role of copper oxide in activating propane could also explain some of the differences observed.
3. Materials and Methods
3.1. Synthesis of Catalysts
All catalysts made with urea were produced using a molar ratio of components of 1 mole of the catalyst base ingredients to 3 moles of urea. The catalyst base ingredients were cerium (III) nitrate and copper (II) nitrate; these were used to form their oxide counterparts when the dried product was calcined. This was dissolved in water for a period of 4 h at 90 °C under constant volume and afterwards evaporated to form a paste. The paste was placed in the furnace to evaporate the remaining water at 120 °C. The remaining solid was placed in an oven to be calcined for 6 hours at 500 °C. These catalysts were named CuCe x-U, where x represents the CuO wt %.
Catalysts using a CMK-3 (Mesoporous Carbon) support were produced by adding cerium (III) nitrate (Sigma-Aldrich, St. Louis, MO, USA) and copper (II) nitrate (Sigma-Aldrich, St. Louis, MO, USA) of different wt % to 25 g of ethanol and mixed with 0.5 g CMK-3; the final CuO wt % were 5% and 13%. This was stirred until it evaporated and calcined at 500 °C for 5 h using a temperature gradient of 1 °C/min. Ideally these CuO-CeO2 catalysts will present the shape and size of the pores of the mesoporous carbon. Although this was never fully achieved, a high surface area material with low crystallite size was obtained. These catalysts were named CuCe x-C, where x represents the CuO wt %.
Catalysts using a PMMA polymer as a template were produced by using a variety of weights of cerium (III) nitrate and copper (II) nitrate; the final CuO at % were 5% and 13%, and adding water to them until the pH was 4. Once the pH was 4, PMMA was added and stirred until it dried at room temperature, using 1 h at 60 °C to further dry it. Once it was dried, it was calcined at 500 °C for 3 h with a temperature gradient of 0.3 °C/min. These catalysts were named as CuCe x-P, where x represents the CuO wt %.
For comparison, pure ceria with both the urea method (U) and using the polymer (P) were synthesized. The urea and the polymer methods were chosen because CuCe-U and CuCe-P catalysts presented the highest catalytic activity per surface area and per gram of catalyst, respectively.
3.2. Characterization Techniques
Catalysts were characterized by N2 adsorption at −196 °C, using a Micromeritics ASAP 2020 apparatus. Samples were degassed at 150 °C prior to analysis. From these data, the following textural parameters were calculated: multipoint Brunauer-Emmet-Teller (BET) surface area (SBET) was estimated from the relative pressure range from 0.05 to 0.25. Pore size distribution and mesopore volumes of these materials were analysed using the Barrett-Joyner-Halenda (BJH) method applied to the adsorption branch of the isotherm.
Powder X-ray diffraction was used to identify the crystalline phases present in the catalysts. An Enraf Nonius FR590 sealed tube diffractometer, with a monochromatic CuKα1 source operated at 40 kV and 30 mA was used. XRD patterns were calibrated against a silicon standard and phases were identified by matching experimental patterns to the JCPDS powder diffraction file.
Temperature programmed reduction was performed using a Micromeritics Autochem 2910 apparatus with a TCD detector. The reducing gas used was 10% H2 in argon with a total flow rate of 50 mL·min−1 (GHSV ca. 8000 h−1). The temperature range explored was from room temperature to 900 °C with a heating rate of 10 °C·min−1.
Raman spectra were obtained with an ‘in via’ Renishaw spectrometer (Renishaw, Wotton-under-Edge, UK), equipped with an Olympus microscope (Olympus, Shinjuku, Tokyo, Japan). The 514 nm line of an Ar+−ion laser (Spectra Physics, Santa Clara, CA, USA) was used for excitation, with a power of 1.25 mW on the sample. The spectra were recorded at 10 s exposure time and 20 accumulations. The spot size was 0.5 μm and an average of three sampling spots was collected for each sample.
The chemical characterization of the surface of the samples was performed by XPS. A Physical Electronics spectrometer (PHI Versa Probe II Scanning XPS Microprobe) was used (Physical Electronics, Lake Drive East, Chanhassen, MN, USA), with scanning monochromatic X-ray Al Kα radiation (100 μm, 100 W, 20 kV, 1486.6 eV) as the excitation source, and a dual beam charge neutralizer. High-resolution spectra were recorded at a given take-off angle of 45° by a concentric hemispherical analyzer operating in the constant pass energy mode at 23.5 eV, using a 1400 μm line (with a 100 μm diameter of the x-ray highly focused beam) analysis area. Under a constant pass energy mode at 23.5 eV condition, the Au 4f7/2 line was recorded with 0.73 eV FWHM at a binding energy (BE) of 84.0 eV. The spectrometer energy scale was calibrated using Cu 2p3/2, Ag 3d5/2, and Au 4f7/2 photoelectron lines at 932.7, 368.2, and 84.0 eV, respectively. Samples were mounted on a sample holder and kept overnight at high vacuum in the preparation chamber before being transferred to the analysis chamber of the spectrometer for testing. Each spectral region was scanned several sweeps until a good signal to noise ratio was observed. The pressure in the analysis chamber was maintained lower than 5 × 10⁻⁶ Pa. PHI Smart Soft-VP 2.6.3.4 software package was used for acquisition and data analysis (Physical Electronics, Lake Drive East, Chanhassen, MN, USA). A Shirley-type background was subtracted from the signals. Recorded spectra were always fitted using Gauss-Lorentz curves. Atomic concentration percentages of the characteristic elements of the surfaces were determined, taking into account the corresponding area sensitivity factor for the different measured spectral regions.
3.3. Catalytic Evaluation
Catalytic activity tests were performed using laboratory flow apparatus, with a fixed bed reactor. The catalyst (100 mg) with a defined particle size (between 0.25–0.75 mm) was diluted with silicon carbide (CSi/catalyst = 4 wt. ratio) and placed inside a quartz reactor that was heated inside an aluminium heating block. The reaction mixture composition was 0.8% propane and 99.2% synthetic air (21% oxygen, 79% helium). The gas hourly space velocity was in all cases of 75,000 h−1.
The catalytic behavior was studied from 150 °C to 500 °C, which is the temperature the catalysts were heat treated. The C-balance of all experiments was in all cases 100% ± 4%. C-balance was undertaken by comparing the amount of CO2 (and occasionally propene) formed with respect to the fall of the area of propane (referred to a blank run).


 ,
, 
