
Cellulose with a High Fractal Dimension Is Easily Hydrolysable under Acid Catalysis
by
 ,
,
Mariana Díaz
1, 
Magali Hernández
1,
Ilich A. Ibarra
1,
Ariel Guzmán
2,
Victor Lara
3 and
Enrique Lima
1,* 1
Laboratorio de Fisicoquímica y Reactividad de Superficies (LaFReS), Instituto de Investigaciones en Materiales, Universidad Nacional Autónoma de México, Circuito Exterior s/n, Cd. Universitaria, Del. Coyoacán CP, Ciudad de México 04510, Mexico
2
Instituto Politécnico Nacional-ESIQIE, Avenida IPN UPALM Edificio 7, Zacatenco, Ciudad de México 07738, Mexico
3
Universidad Autónoma Metropolitana, Iztapalapa, A. P. 55-532, Av. San Rafael Atlixco No. 186, Col. Vicentina, Ciudad de México 09340, Mexico
*
Author to whom correspondence should be addressed.
Catalysts 2017, 7(5), 162; https://doi.org/10.3390/catal7050162
Submission received: 2 March 2017
/
Revised: 16 April 2017
/
Accepted: 12 May 2017
/
Published: 19 May 2017
Abstract
:The adsorption of three diverse amino acids couples onto the surface of microcrystalline cellulose was studied. Characterisation of modified celluloses included changes in the polarity and in roughness. The amino acids partially break down the hydrogen bonding network of the cellulose structure, leading to more reactive cellulose residues that were easily hydrolysed to glucose in the presence of hydrochloric acid or tungstophosphoric acid catalysts. The conversion of cellulose and selectivity for glucose was highly dependent on the self-assembled amino acids adsorbed onto the cellulose and the catalyst.
1. Introduction
Cellulose is one of the most abundant natural polymers on earth. Cellulose-based raw materials are used in various fields. Furthermore, numerous novel cellulose-based functional materials have also been developed. However, many cellulosic products are, at present, not renewable [1,2] because of the high cost of the processes involved in renewing cellulose. For example, it is common for no cellulosic bio-fuel production to be registered for sale and use under the renewable fuel standard.
Cellulose is a polydisperse linear homopolymer consisting of β-1,4-glycosidic linked d-glucopyranose units. Based on the OH groups and the oxygen atoms of both the pyranose ring and glycosidic bonds, ordered hydrogen bond systems form various supramolecular structures. Intermolecular hydrogen bonding in cellulose is responsible for the sheet-like nature of the native polymer.
The cellulose structure includes an extensive network of intra- and intermolecular hydrogen bonds [3,4], which confers remarkable chemical stability and makes the direct utilisation of cellulose a challenge. Cellulose gives rise to glucose upon hydrolysis. Many approaches have been reported to convert cellulose into glucose [5,6,7]. Traditional dilute acid hydrolysis processes are performed at elevated temperatures under high pressure or in the presence of enzymes, and hydrolysis remains inefficient at present [8,9] and is mainly associated with pretreatments that also negatively impact the environment due to the heavy use of chemicals. All of these proposed methods have significant disadvantages, e.g., they consume a significant amount of energy and form undesired by-products. On the other hand, catalysis can result in waste stream diminution. Many works have emphasised the importance of pre-treatment to break down cellulose. In this context, the depolymerisation of cellulose is improved by adopting microwave irradiation [10] or heating in two steps: pre-hydrolysis at low temperatures and a successive conversion step at 200 °C. It has also been found that steam explosion combined with superfine grinding leads to a reduction of the particle size and an increase of the specific surface area, which enhances the accessibility of cellulose [11,12]. By mechanically grinding the correct catalyst and reactant, it was reported that it was feasible to induce solid–solid catalysis, allowing the implementation of catalysts in the mechanocatalytic depolymerisation of cellulose [13].
Recently, Hernández et al. [14] reported that the hydrogen-bonding network of cellulose can be destabilised through a new approach: the adsorption of polar small molecules, such as amino acids. However, Hernandez et al. followed the catalytic oxidation of amino acid-treated celluloses to gluconic acid using gold catalysts but, evidently, the depolymerisation had to occur prior to the oxidation. It is clear that hydrolysis is the most important step in converting cellulose to precious products [15]. Furthermore, single amino acids can be adsorbed on the surface of microcrystalline cellulose, leading to the conclusion that adsorption of the smallest amino acids and those containing aromatic rings is suitable to highly perturb the surface and may increase damage to the surface by adsorbing more than one amino acid. Thus, the aims of this study were to verify the damage that the adsorption of amino acid couples causes at the surface of cellulose and to determine the consequences of the reactivity in a hydrolysis reaction. The selected amino acids were the same as those used in previous work [14], keeping in mind that these are three of the smallest molecules among amino acids but that they are very different structurally, including aliphatic and aromatic rings.
2. Results and Discussion
2.1. Modification of the Cellulose Surface
The spectroscopic results demonstrate the grafting of amino acids on the cellulose surface. Table 1 contains data on the amount of amino acid in the samples. The amino acid percentage did not differ significantly for the three samples; it was close to 4 wt % for each sample. Thus, according to other works dealing with grafting cellulose [16], the percentage of OH groups kinetically available was close to 3%. From Table 1, the amino acid content does not significantly differ in the three modified celluloses, and only the celluloses containing proline exhibited a slightly lower amount of amino acids. This difference can be explained by the isoelectric points for proline, alanine and phenyl alanine, which are 6.48, 6.01 and 5.48, respectively [17]. Thus, the three chemical equilibriums are stablished and the ionic species in solution are not the same for the three amino acids. In other words, the interactions beween ion-(dipole) cellulose and (dipole) amino acid-(dipole) cellulose vary, and drive the amount of amino acids finally adsorbed. The lower the isoelectric point, the higher the amount of amino acids adsorbed in the cellulose. Thus, it seems that in modified celluloses, even the total amount of amino acids is near 4%, and the amount from each amino acid is not strictly the same.
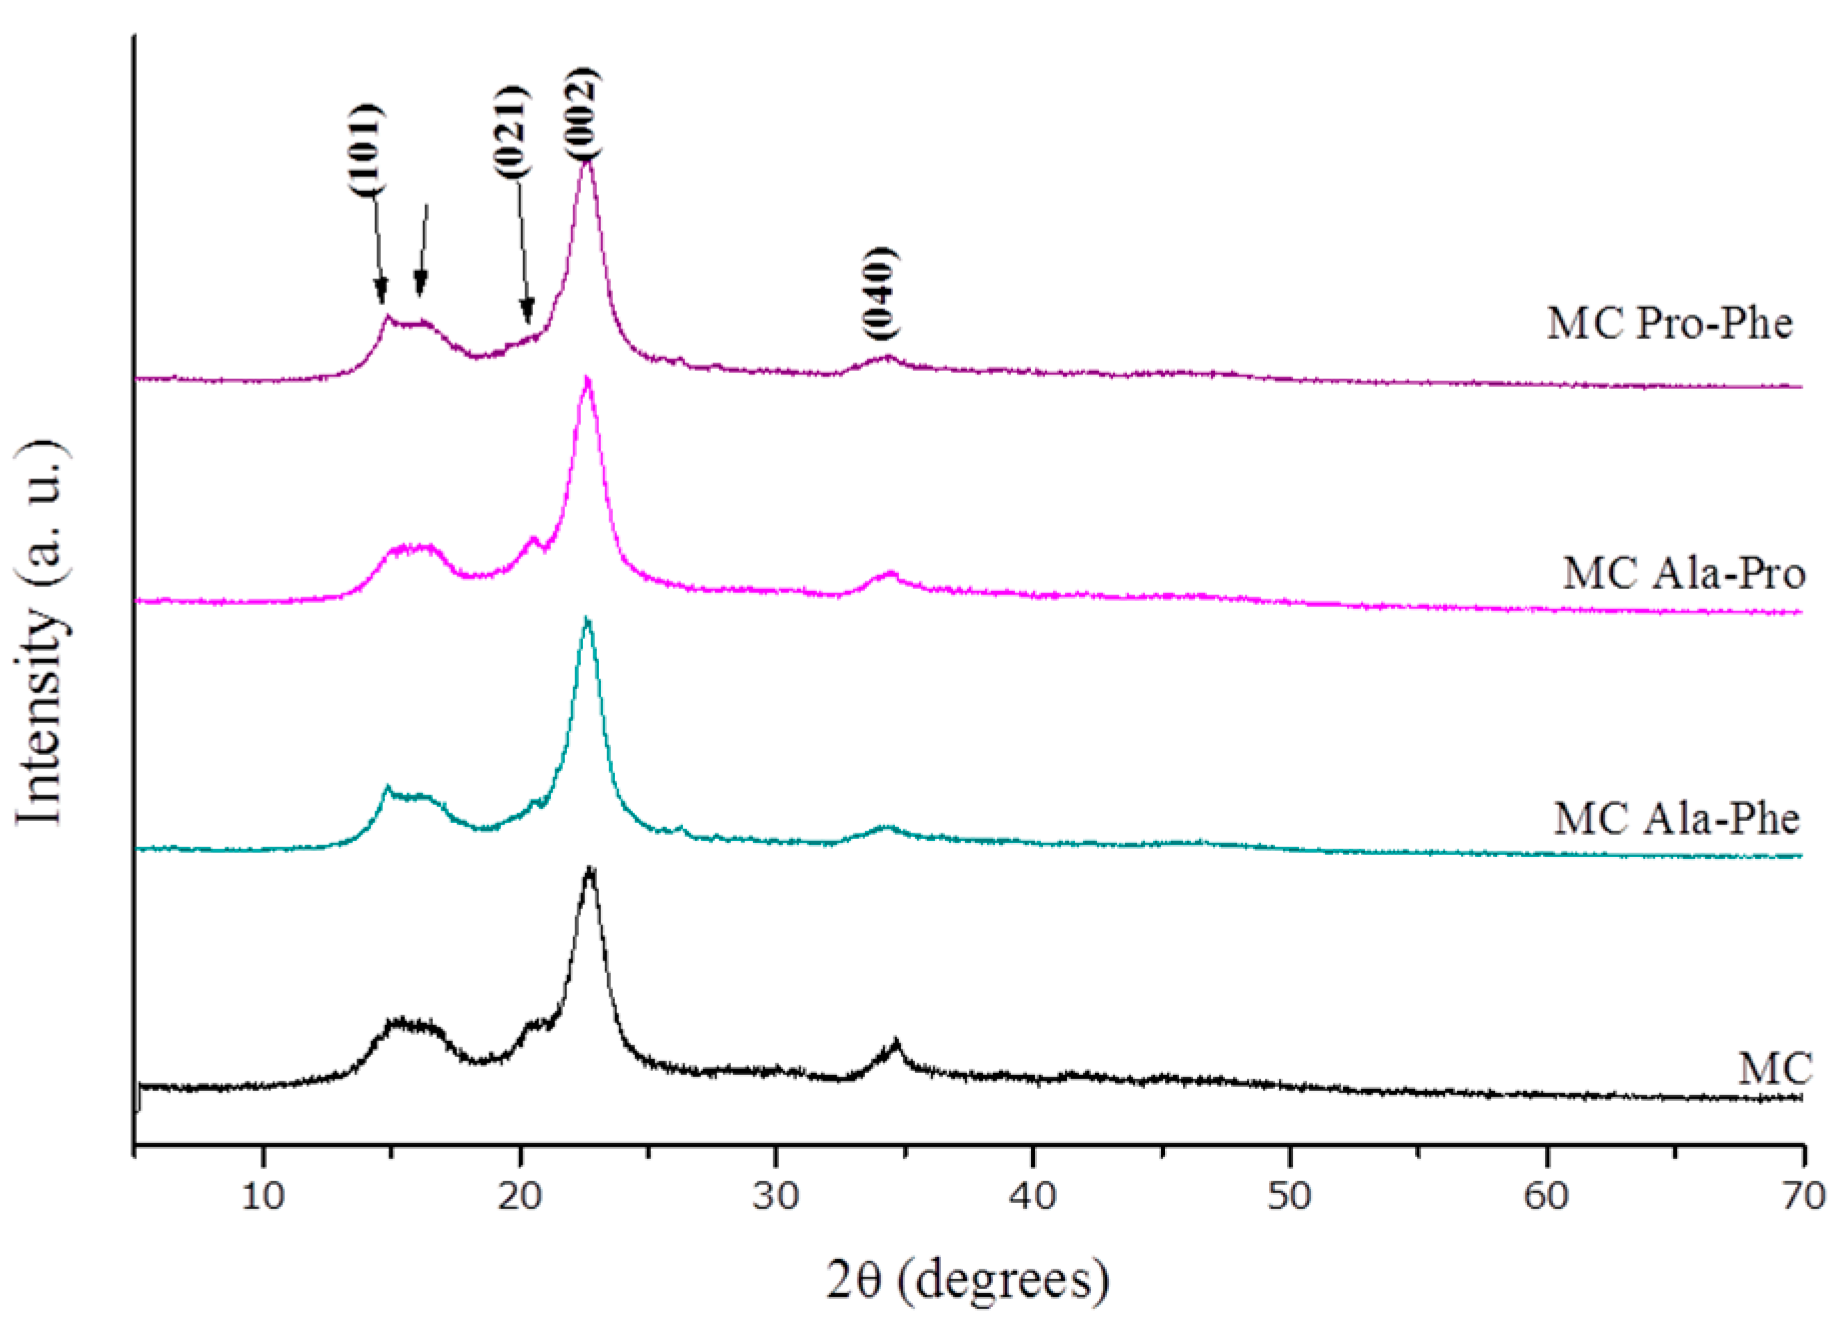
The XRD patterns of pure cellulose and amino acid-cellulose are displayed in Figure 1. All four patterns matched that of microcrystalline cellulose [18].
The position of the peak (002) corresponded to an interplanar distance of 3.9 Å, which is in agreement with a previously reported value [19]. This distance did not change with the amino acid treatment and, in general, one can see that the presence of amino acids does not significantly influence the crystalline order of cellulose. However, some minor differences were observed: only the pattern of sample MC Ala-Pro had a peak at 2θ = 20.5°, corresponding to the (021) plane, suggesting that chains of cellulose can be arranged differently as a consequence of the type of amino acids used as modifiers of cellulose.
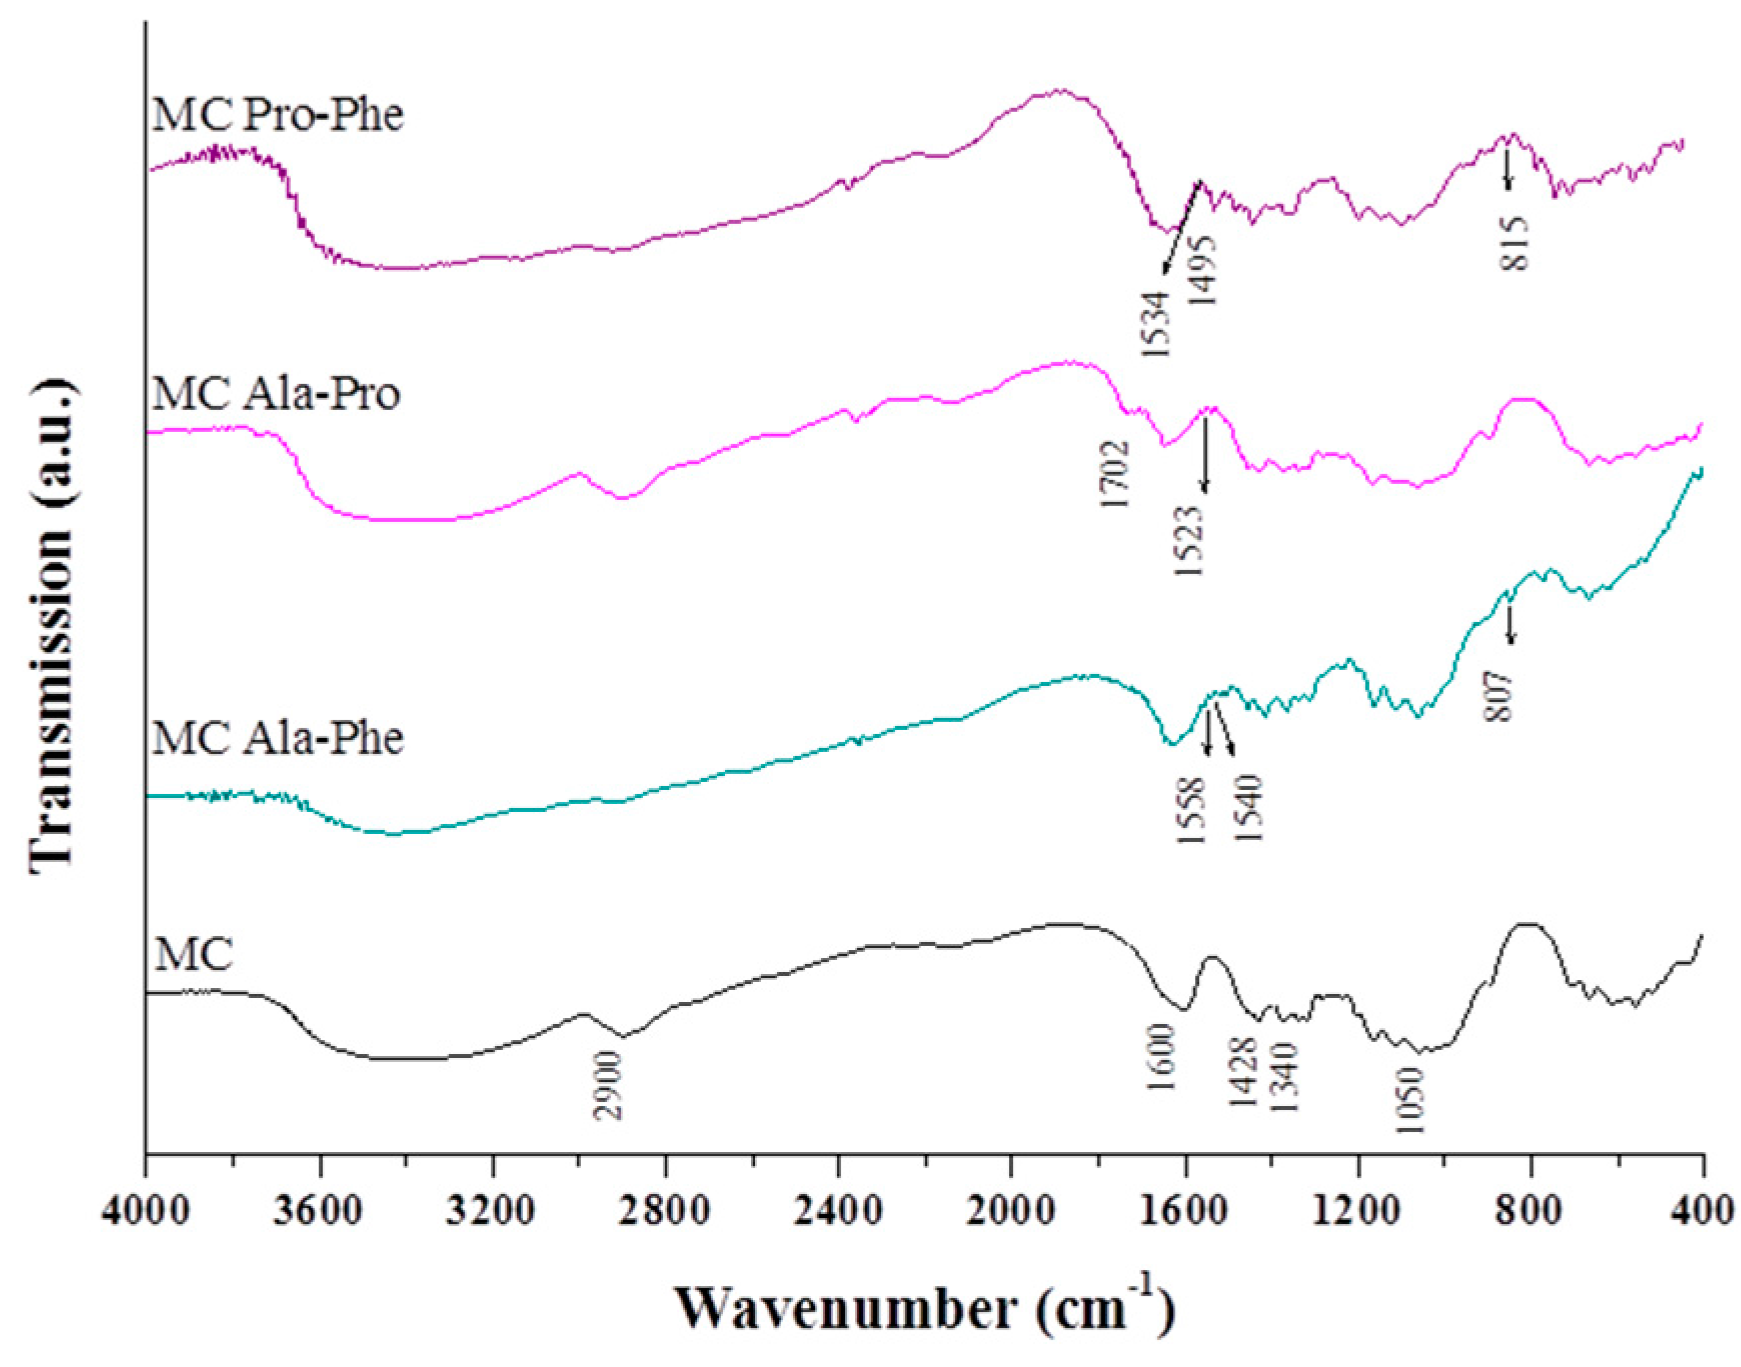
Figure 2 shows the FTIR spectra of celluloses, modified and unmodified. In all spectra, the absorption bands due to the cellulose structure [20,21] are clearly observed:
- (1)
- The broad band between 3200 and 3400 cm−1 was assigned to the ν vibration mode of O–H bonds.
- (2)
- The band due to the stretching C–H mode was observed close to 2900 cm−1.
- (3)
- The band at 1600 cm−1 was assigned to the deformation δ vibration coming from H–O–H (adsorbed onto cellulose surface).
- (4)
- The band between 1426 and 1430 cm−1 was due to flexion δ vibration of CH2 groups.
- (5)
- The band resulting from the stretching vibration of C–O and C–C bonds was observed close to 1000 cm−1.
In the spectra of the treated amino acid celluloses, key bands from amino acids were observed. For instance, in the spectrum of the MC Ala-Phe sample, there was a band at 2120 cm−1 that was assigned to the stretching of the C=C bond in phenylalanine. Additionally, a band was observed at 1558 cm−1 due to the asymmetric stretching of C=O, and at 1540 cm−1, a band due to flexion of NH was observed. The position of these two bands of the C=O and NH groups in treated cellulose differed from those observed in pure amino acids, which were observed at 1551 and 1549 cm−1. Thus, this result suggests that polar groups of amino acids could interact with polar (O–H) groups in cellulose.
This behaviour was also observed in spectra for the other two celluloses that were simply treated with amino acids.
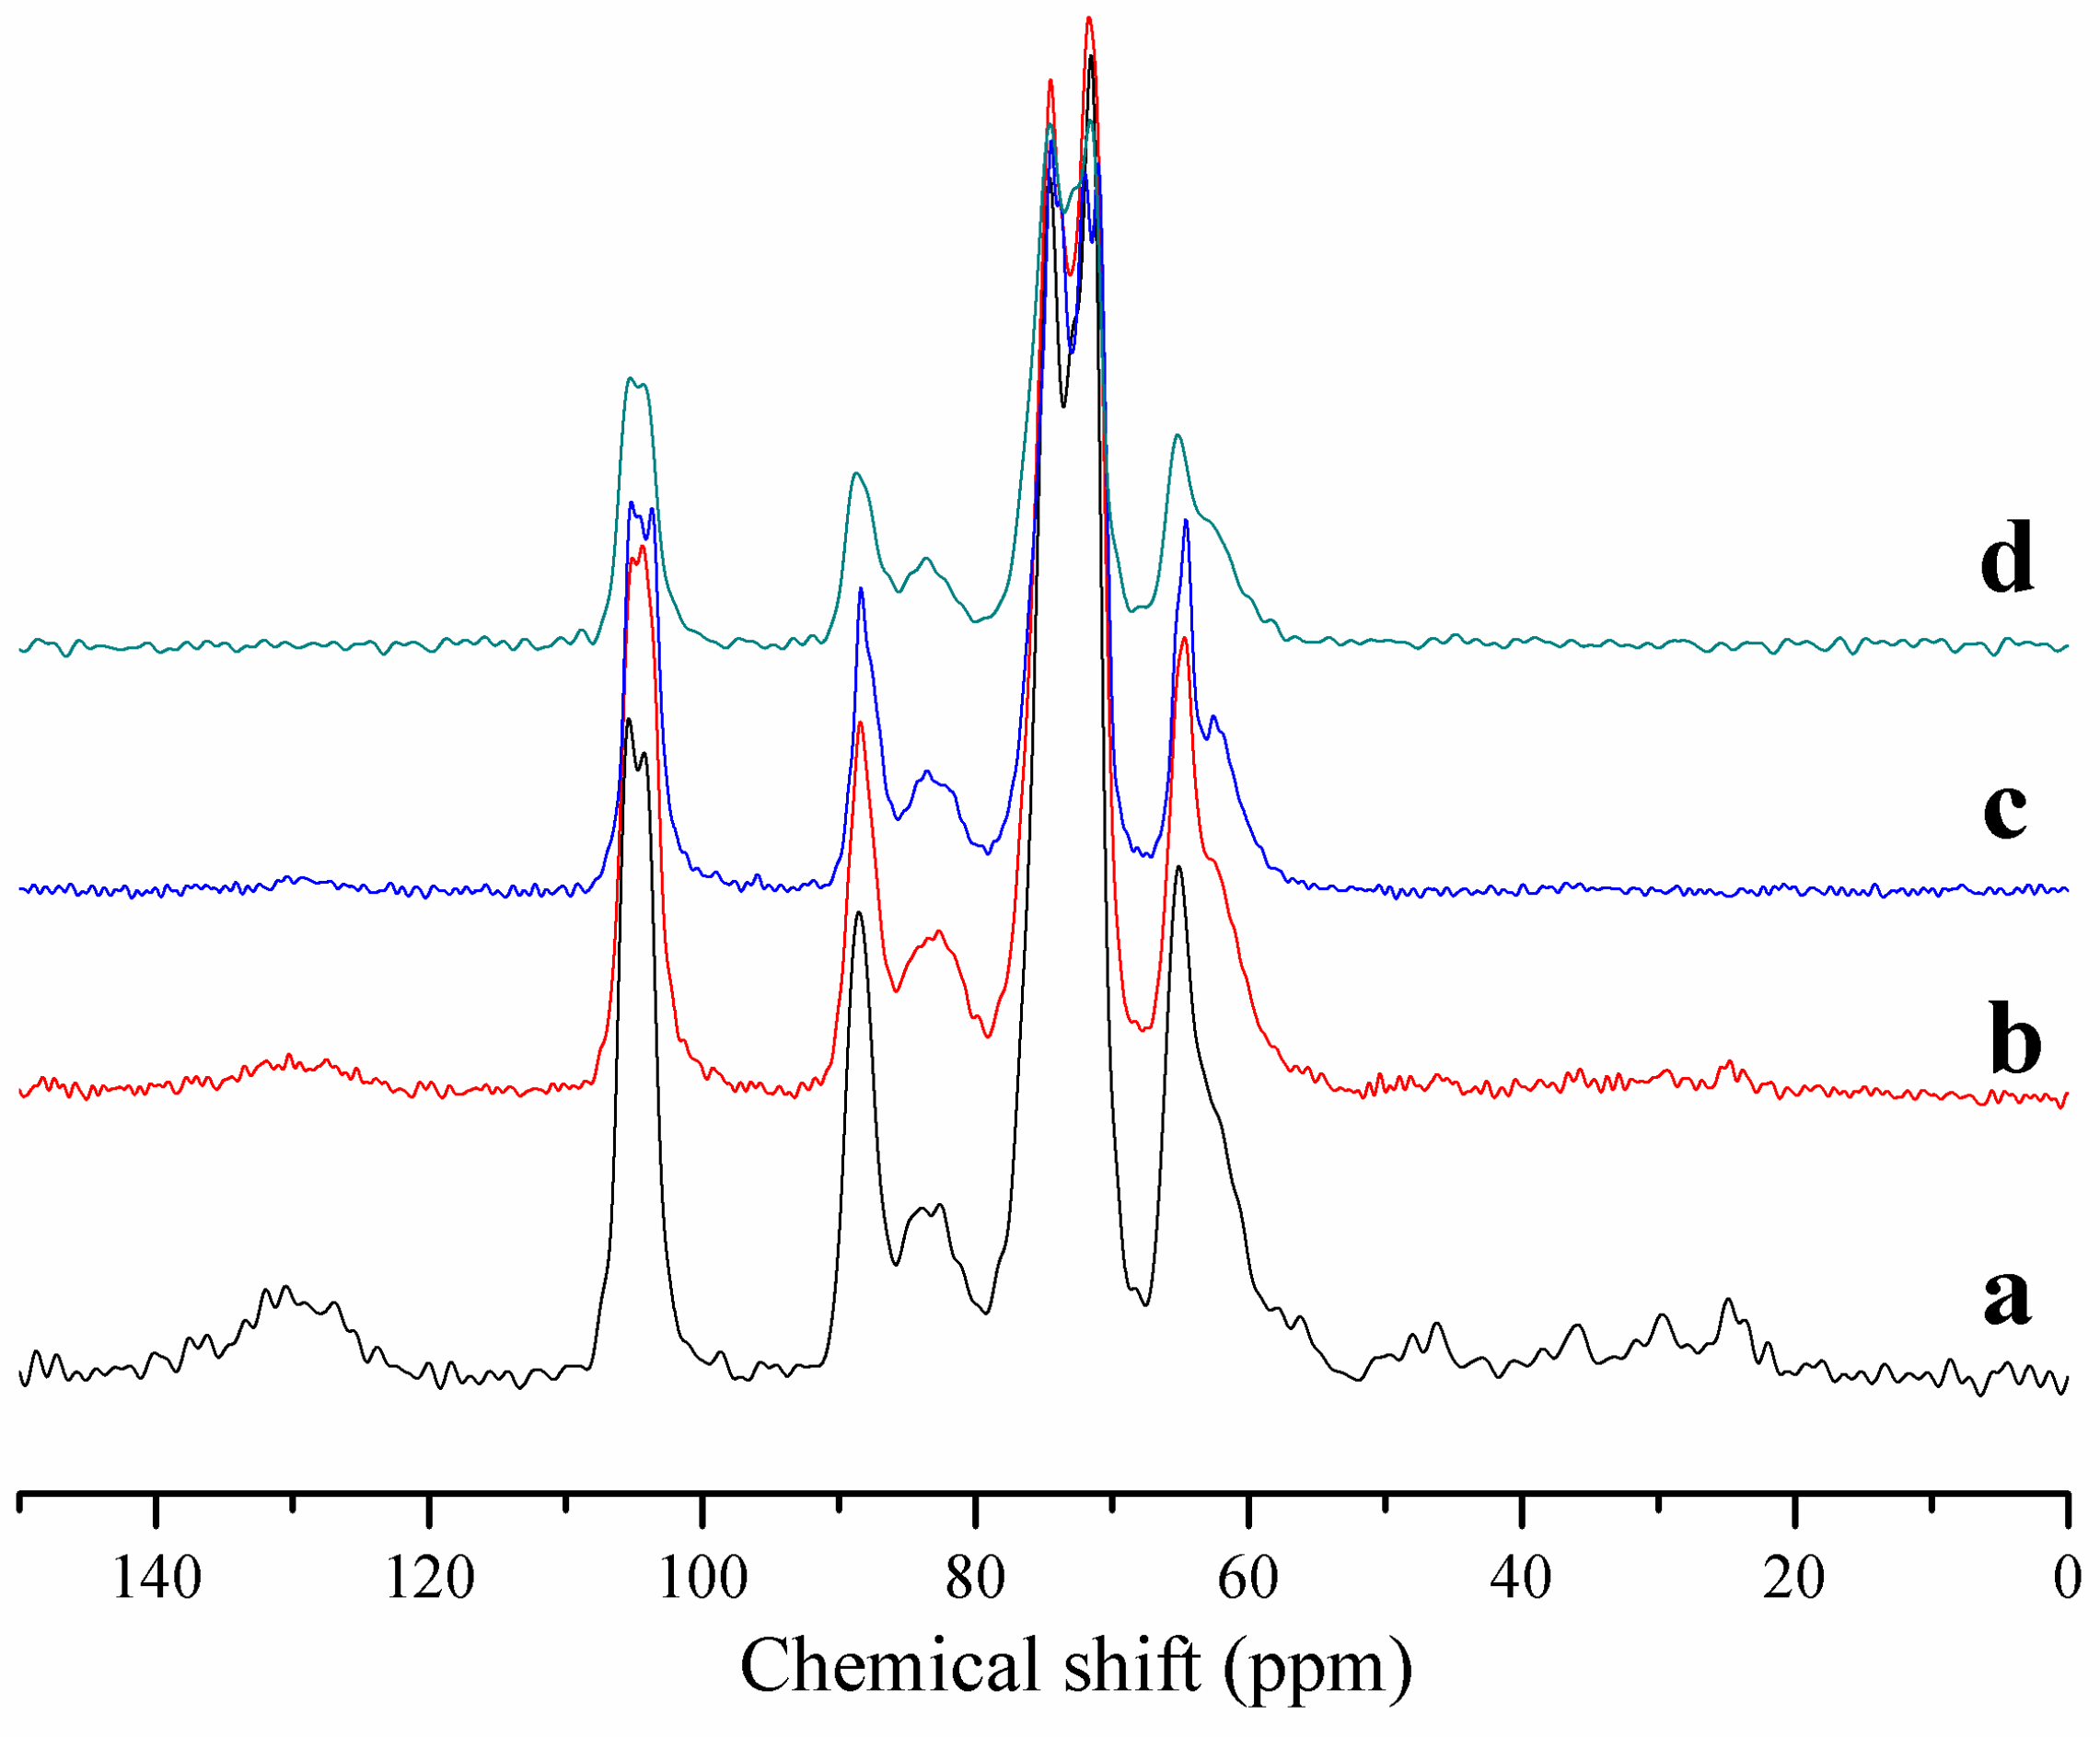
Figure 3 displays the 13C CP MAS NMR spectra of the cellulose samples. The peaks of cellulose were labelled according to the carbon number of the chemical structures reported in Figure 4. The presence of peaks labelled with A indicate that the cellulose sample contained some amorphous cellulose [22,23]. In the case of modified celluloses, the spectra were very close to that of untreated cellulose, but the signals of the amino acids were also observed. Three spectra of modified celluloses exhibited a peak at 174 ppm due to the carboxylic group of three amino acids (the carbon numbered 1 in the structure of the amino acids, Figure 4). In the case in which the spectra of the samples contained phenylalanine, a large NMR signal between 125 and 135 ppm was observed, which was due to the carbon of the aromatic ring in this amino acid (the carbons numbered 4, 5, 6 and 7, Figure 4). Aliphatic carbons were also present in three amino acids, and their NMR signals were observed within 15–50 ppm.
In the spectra of cellulose samples, the NMR signals from amino acids were significantly broader than those of pure amino acids, which is in line with the FTIR results, suggesting strong dipolar interactions between amino and carbonyl groups from the amino acids and hydroxyl groups of cellulose. This interpretation is strongly supported by our previous results analysing the polarity and polarisability of cellulose surfaces treated with amino acids [14].
The SEM images presented in Figure 5 confirm the presence of significant modification in cellulose as a consequence of amino acid loading. At the same scale, the surface of cellulose without amino acids appears as fibers that are highly disordered. Clearly, the amino acid-free cellulose surface was smoother than those containing amino acids. Particularly, in the two samples where phenylalanine was used, the surface became scaly-like. When phenylalanine was absent (samples treated with alanine and proline), the surface tended to be mixed, with rough zones, but also some smooth zones. It seems that, in this case, the amino acids partially covered the cellulose surface.
The SEM results confirmed the modification of the surface following amino acid treatment. A parameter to quantify this modification is the fractal dimension, which can be interpreted as a proportional parameter to roughness [24,25]. The fractal dimension values, as calculated from small angle X-ray scattering (SAXS) data, are included in Table 2. The scattered objects should be globular aggregates of fibers, as suggested by SAXS profiles in Figure 6, where it is observed that I(h) is proportional to h−4 for large h values and to h−2 for moderate h values. Hence, the Kratky plot exhibits a clear peak, as occurs in the case of spherical particles. The amino acid-free cellulose had a fractal dimension near 2, i.e., it was the cellulose with the smoothest surface. The modified celluloses in which phenylalanine was present were the materials that tended to be the roughest. The combination of phenylalanine and proline had the roughest surface. In Table 2, a sample is shown that only contains one amino acid. The sample labelled MC Phe contains 3.7wt % of phenylalanine, and its characterisation was reported earlier [14] and is included in this work to draw conclusions as to the significance of adsorbing amino acids to enhance the reactivity of the cellulose surface.
Another physical parameter that can be sensitive to the changes induced by amino acid treatment is the particle size. Table 2 shows that the presence of amino acids increases the particle size, and this increase is sensitive to the nature of the amino acid with the highest increase observed in the sample treated with phenylalanine and proline. This sample almost duplicated the particle size of untreated cellulose. Thus, it is important to note that dipolar interactions between amino acids and cellulose changed not only the roughness of the cellulose but also the particle size. In other words, the perturbation was able to weaken the hydrogen bonding network in cellulose, and consequently, their chains were rearranged, creating voided spaces and bigger particles.
2.2. Catalytic Hydrolysis of Amino Acid-Modified Cellulose Materials
Initially, hydrolysis of cellulose was tested on untreated cellulose and cellulose modified with proline and phenylalanine. A typical time course of the reaction is shown in Figure 7 and Table 3. Both catalysts, H2SO4 and H3PW12O40, promoted the hydrolysis of cellulose to SRSs (soluble reducing sugars) with selectivity to glucose above 80% for reaction times as long as 20 h. Clearly, the modification of cellulose with amino acids significantly increased both the activity of the reaction and glucose selectivity. The maximal activity was reached for times as long as 20 h and, at this reaction time, the concentration of water soluble products decayed, with a practically constant high yield of glucose. The chromatographic results suggest that after 20 h of reaction, glucose is produced from oligosaccharides [2]. For long reaction times, this behavior has been previously reported. It should then be concluded that treating the cellulose surface with amino acids only allows the cellulose reactivity to increase, but the mechanism seems to be similar to that of non-treated materials.
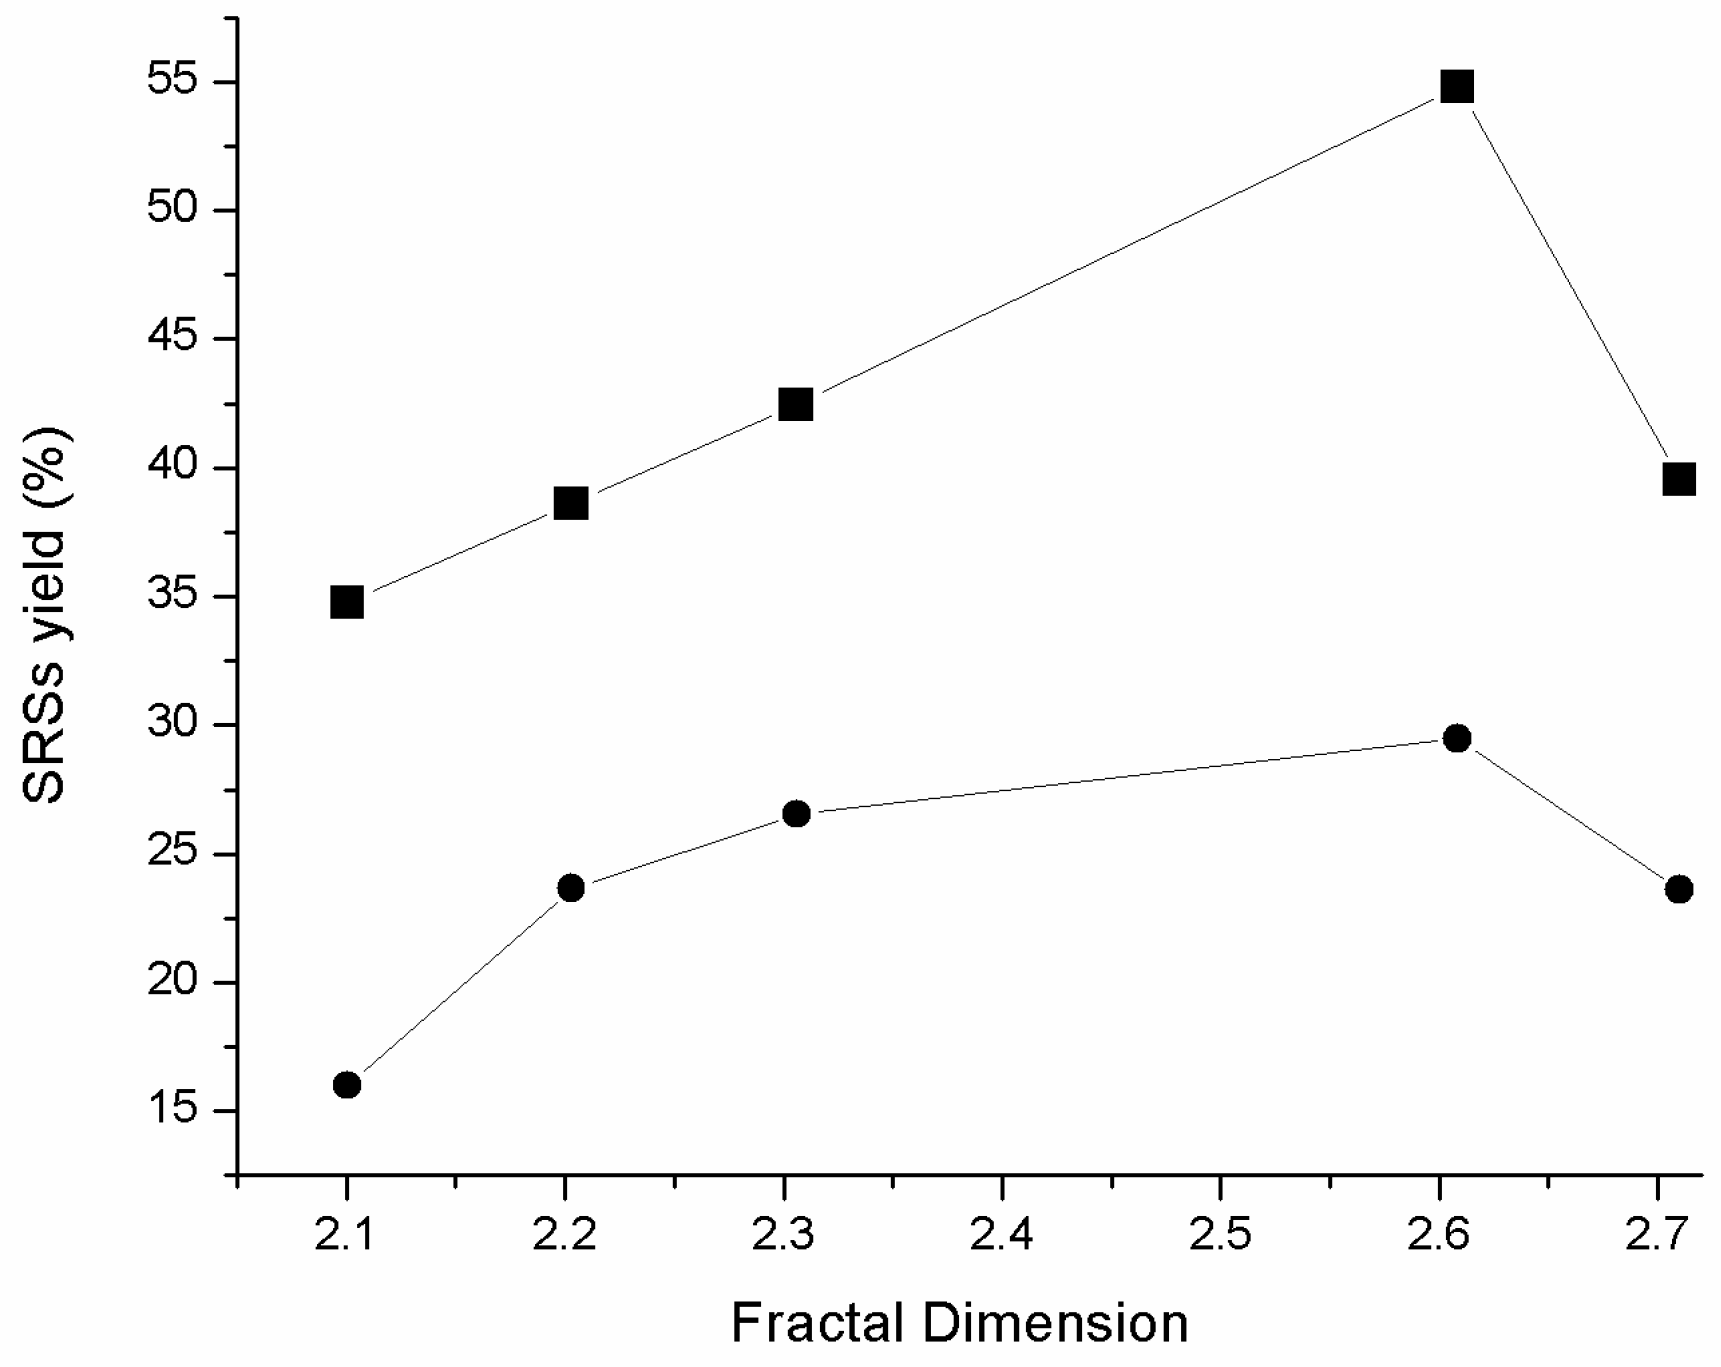
Figure 8 compares the activity and glucose selectivity after 20 h of reaction, and one can see that amino acid-free cellulose was less decomposable than the modified celluloses. Both catalysts decompose celluloses and, in both cases, the degradation of cellulose was in the following sequence: MC < MC-Ala-Pro < MC Phe < MC Ala-Phe < MC Pro-Phe. The same sequence was obtained if materials were organised according to the fractal dimension value, except for the material with only one amino acid, which had a high fractal dimension. The activity in this material was lower than that observed for MC Ala-Phe and MC Pro-Phe. Thus, it is suggested that the degree of modification to the cellulose surface is a key parameter to increase the catalytic decomposition of cellulose, but the presence of two amino acids also contributes to an exposed or more disordered surface that can interact with catalysts. In other words, it seems that the presence of phenylalanine is a determinant to create rougher surfaces, and this roughness is enhanced in the presence of a second amino acid such as proline and alanine. The reactivity of cellulose was found to be proportional to this roughness of surface. Figure 8 confirms a linear relationship between the fractal dimension and catalytic activity. Catalyst H3PW12O40 was always more active than H2SO4, which is in agreement with previous works [26,27,28,29,30] that emphasised the importance of acidity in the catalysis of cellulose.
As mentioned above, treatment with amino acids also changed the particle size of cellulose. From Table 2 and Table 3, it is clear that cellulose reactivity was associated with particle size; the higher the particle size, the more reactive the cellulose. However, this trend was not linear, as in the case of the fractal dimension. Further, one can expect the opposite behavior, i.e., the higher the particle the lower the reactivity. However, taking into account the fractal dimension values of scattered objects, the cellulose particles became rougher or less dense, i.e., the surface/volume ratio increased.
The presence of amino acids in cellulose indisputably has an effect on the reactivity of cellulose. This effect is comparable to that obtained with other pre-treatments of cellulose previous to catalysis. Actually, the gain in reactivity reported in this manuscript was comparable to that obtained with pre-treatment with physical activities, such as ultrasound, ball-milling or ionic liquids [31,32]. However, it should be emphasised that the mechanisms to increase reactivity seem to be different when cellulose is treated with amino acids than when it is treated by ultrasound or ball-milling. As noted above, in this work, we reported that large and roughed particles were more highly reactive as a result of the roughness and voided spaces of the particles. In contrast with the other two methods, a decrease in cellulose particle size was observed, leading to a better interaction with the catalyst. From the viewpoint of green chemistry, the pre-treatment with amino acids has clear advantages, such as the use of water as unique solvent, soft conditions with no need for excessive energy (thermal or mechanical) and no polluting waste produced. In this context, the ball-milling pre-treatment has to be performed for periods as long as 20 h [33], spending approximately 2.2 × 10⁵ kJ of energy. In contrast, the proposed pre-treatment with amino acids only requires approximately 6 × 10³ kJ.
2.3. The Surface of Amino Acid-Modified Cellulose under Catalysis Conditions
The modification of cellulose with amino acids seems to proceed through dipolar interactions, weakening the bond-hydrogen network of cellulose. One can ask, what is the role of amino acids during catalysis? In contact with the aqueous reaction mixture, amino acids release from cellulose and dissolve in an acid solution, mainly in their zwitterionic forms, because the isoelectric points of Ala, Phe, and Pro are 6.01, 5.48 and 6.48, respectively. 1H NMR analysis of amino acids released from modified cellulose suggests that the amino acids are lost completely after approximately 12 h of contact with the acid solution.
It is clear that, after losing amino acids, the modified cellulose tends to organise their fibers, recover stability and become almost non-reactive. However, this recovery is not immediate, and the damage to the surface should be permanent for periods longer than catalysis. To verify this hypothesis, we performed the following experiment. A catalytic test was performed as described in the experimental section; the reaction was stopped at different times and the cellulose was recovered and characterised by 13C MAS NMR and SAXS. The NMR results (Figure 9) clearly showed a net diminution of NMR signals coming from amino acids as time progressed. By contrast, Table 4 shows that the fractal dimension did not diminish in the first hours of the reaction, and surprisingly, the fractal dimension was augmented for reaction times of as long as 10 h. This result is explained by the surface being eroded as a consequence of the reaction taking place on the damaged surface of the modified cellulose.
3. Materials and Methods
Microcrystalline cellulose, proline, phenylalanine, alanine, and all other reagents and solvents were provided by Sigma Aldrich (Sigma-Aldrich, St. Louis, MO, USA).
Hydrothermal treatment of cellulose (MC) proceeded as follows: 8 g of MC were added to 110 mL of an aqueous solution where previously was dissolved 1 g of amino acid (0.5 g of each amino acid). The suspension was stirred for 1 h and then temperature was increased to reach reflux. After 10 min of refluxing, HCl was added in order to adjust pH at 5. This procedure was carried out in order to assure that amino acids were mainly present in the zwitterion form. Refluxing was maintained for 5 h, and the solid was then removed by centrifugation and washed until the rinse water pH became neutral. The solids were dried and labelled according to the amino acids used in the treatment. For instance, MC functionalised with alanine and proline was named MC Ala-Pro.
To confirm that some change in the reactivity of cellulose was due to the presence of amino acids, a cellulose sample was thermally treated in the absence of amino acids. This reference sample was named MC. Chemical analysis of the celluloses is reported in Table 1.
The cellulose samples were characterised by the following spectroscopy: X-ray photoelectron (XPS), infrared (FTIR) and 13C nuclear magnetic resonance (MAS NMR).
Chemical analyses were conducted using XPS. The experiments were carried out using a VG Microtech ESCA2000 Multilab UHV system, with a Mg Kα X-ray source (1253.6 eV) and a CLAM4 MCD analyser. The base pressure during the analysis was 1.37 × 10⁻⁸ Pa. the C 1s hydrocarbon groups at the 284.50 eV central peak position was used as a reference of the peak positions. The XPS spectra were fitted by means of the SDP program v. 4.1 [34].
The X-ray diffractograms were collected by means of a diffractometer (D8 Advance-Bruker) where Kα radiation (40 kV and 30 mA), and a wavelength of 1.315 Å was selected with a diffracted beam monochromator. Crystalline phase content was determined by fitting the diffraction pattern to the equivalent Joint Committee Powder Diffraction Standards (JCPDS).
The SAXS profiles were acquired by a Kratky camera using Cu Kα radiation. The distance between the sample and linear proportional counter was 25 cm. Intensity, I(h), was measured for 9 min to determine statistical significance. The ITP program [35,36,37] was used to process SAXS data This program defines the scattering vector (h) as h = 4π sin θ/λ, where θ and λ corresponds to X-ray scattering angle and wavelength, respectively. The scattered intensity is expressed by I(q) = ΣiIi(0) exp[-(Rgiq)2/3], where Ii(0) indicates the scattering intensity at q = 0 of the scattering centre, i, with the radius of gyration, Rgi [36]. The fractal dimension of the scattering objects was evaluated from the slope of the curve log I(h) versus log(h) according to Porod’s law [38,39].
Particle size data for each sample were determined using a laser light scattering system (Microtrac S3500). All measurements were carried out in triplicate, and the results were averaged to obtain mean particle diameter.
Attenuated total reflectance (ATR-FTIR) spectra were collected on a Perkin Elmer Series spectrophotometer (Model 6X). Data were collected within the spectral range of 400–4000 cm−1. All spectra were acquired at 4 cm−1 spectral resolution.
13C cross-polarisation (CP) MAS NMR spectra were obtained at a frequency of 100.58 MHz using a 4-mm CP MAS probe. Samples were packed in circonia rotors and spun at a rate of 5 kHz. Typical 13C CP MAS NMR conditions for the 1H-13C polarisation experiment used a π/2 pulse of 4 µs, a contact time of 1 ms and a delay time of 5 s. Chemical shifts were referenced to the peak of adamantane at 38.2 ppm relative to TMS (tetramethyl silane).
The morphology of the samples was studied with a SEM Jeol 7600 scanning electron microscope.
Sulphuric acid (H2SO4) and phosphotungstic acid (H3PW12O40) were purchased from Aldrich (St. Louis, MO, USA) and were used as catalysts in the hydrolysis reaction of the treated celluloses.
The conversion of cellulose was carried out in a 50-mL Teflon-lined stainless-steel autoclave. Cellulose samples (0.7 g) and an amount of the catalyst required to reach 1.1 × 10⁻² M were added into the autoclave pre-charged with H2O (35 mL). The vessel was sealed and purged with nitrogen for 15 min to evacuate oxygen, and the temperature was increased to 150 °C at a rate of 10 °C/min to start the reaction (stirring rate = 400 rpm). The evolution of the reaction was analysed by HPLC using a Perkin Elmer chromatograph equipped with a refractive index (RI) detector and an SCR-101C column. After the reaction, the filtrates were collected and an analysis of soluble reducing sugars (SRSs) was carried out using total organic carbon analyses.
The SRSs yield and glucose selectivity were calculated as follows:
SRSs yield (%) = (carbon mass of SRSs/carbon mass of cellulose) × 100%
Glucose selectivity (%) = (carbon mass of glucose/carbon mass of SRSs) × 100%
4. Conclusions
The surface of cellulose was modified by adsorption of amino acid couples, alanine-proline, alanine-phenylalanine or proline-phenylalanine. Roughness was proportional to the degree of modification induced by amino acid incorporation. Untreated and modified celluloses were hydrolysed in the presence of acid-catalysts. Cellulose hydrolysis was highly influenced by the degree of cellulose modification. With similar damage to the cellulose surface, the presence of a second amino acid, instead of only one, was suitable to enhance acid hydrolysis and selectivity to glucose.
Acknowledgments
This work was financially supported by CONACYT (Grant 220436) and PAPIIT-IN106517. Guzmán gratefully acknowledge to LaFRes, IIM-UNAM for sabbatical position. We are also grateful to A. Tejeda, O. Novelo and G. Cedillo for their technical assistance.
Author Contributions
Enrique Lima and Ariel Guzmán conceived and designed the experiments; Mariana Díaz, Magali Hernández and Victor Lara performed the experiments; Ilich A. Ibarra analysed the data; Enrique Lima wrote the paper.
Conflicts of Interest
The authors declare no conflict of interest.
References
- Kamm, B. Production of Platform Chemicals and SynGas from biomass. Angew. Chem. 2007, 119, 5146–5149. [Google Scholar] [CrossRef]
- Fan, L.T.; Gharpuray, M.Y.; Lee, H. Cellulose Hydrolysis; Springer: Berlin, Germany, 1987. [Google Scholar]
- Krassig, H.A. Cellulose-Structure; Accessibility and Reactivity; Gordon and Breach Science Publisher: Yverdon, Switzerland, 1993. [Google Scholar]
- Yang, X.; Cranston, E.D. Chemically Cross-Linked Cellulose Nanocrystal Aerogels with Shape Recovery and Superabsorbent Properties. Chem. Mater. 2014, 26, 6016–6025. [Google Scholar] [CrossRef]
- Takagaki, A.; Tagusagawa, C.; Domen, K. Glucose production from saccharides using layered transition metal oxide and exfoliated nanosheets as a water-tolerant solid acid catalyst. Chem. Commun. 2008, 5363–5365. [Google Scholar] [CrossRef] [PubMed]
- Huang, Y.-B.; Fu, Y. Hydrolysis of cellulose to glucose by solid acid catalysts. Green Chem. 2013, 15, 1095–1111. [Google Scholar] [CrossRef]
- Tagusagawa, C.; Takagaki, A.; Iguchi, A.; Takanabe, K.; Kondo, J.N.; Ebitani, K.; Hayashi, S.; Tatsumi, T.; Domen, K. Highly active mesoporous Nb-W oxide solid acid catalyst. Angew. Chem. Int. Ed. 2010, 49, 1128–1132. [Google Scholar] [CrossRef] [PubMed]
- Engel, P.; Mladenov, R.; Wulfhorst, H.; Jager, G.; Spiess, A.C. Point by point analysis: How ionic liquid affects the enzymatic hydrolysis of native and modified cellulose. Green Chem. 2010, 12, 1959–1966. [Google Scholar] [CrossRef]
- Mok, W.S.; Antal, M.J., Jr.; Varhegyi, G. Productive and parasitic pathways in dilute acid-catalyzed hydrolysis of cellulose. Ind. Eng. Chem. Res. 1992, 31, 94–100. [Google Scholar] [CrossRef]
- Galletti, A.M.R.; Antonetti, C.; De Luise, V.; Licursi, D.; Nassi, N. Levulinic acid production from waste biomass. BioResources 2012, 7, 1824–1835. [Google Scholar]
- Chen, H.; Yu, B.; Jin, S. Production of levulinic acid from steam exploded rice straw via solid superacid. Bioresour. Technol. 2011, 102, 3568–3570. [Google Scholar] [CrossRef] [PubMed]
- Bin, Y.; Hongzhang, C. Effect of the ash on enzymatic hydrolysis of steam-exploded rice straw. Bioresour. Technol. 2010, 101, 9114–9119. [Google Scholar] [CrossRef] [PubMed]
- Hick, S.M.; Griebel, C.; Restrepo, D.T.; Truitt, J.H.; Buker, E.J.; Bylda, C.; Blair, R.G. Mechanocatalysis for biomass-derived chemicals and fuels. Green Chem. 2010, 12, 468–474. [Google Scholar] [CrossRef]
- Hernández, M.; Lima, E.; Guzmán, A.; Vera, M.; Novelo, O.; Lara, V. A small change in the surface polarity of cellulose causes a significant improvement in its conversion to glucose and subsequent catalytic oxidation. Appl. Catal. B Environ. 2014, 144, 528–537. [Google Scholar] [CrossRef]
- Himmel, M.E.; Ding, S.-Y.; Johnson, D.K.; Adney, W.S.; Nimlos, M.R.; Brady, J.W.; Foust, T.D. Biomass Recalcitrance: Engineering Plants and Enzymes for Biofuels Production. Science 2007, 315, 804–807. [Google Scholar] [CrossRef] [PubMed]
- Trejo-O´Reily, J.A.; Cavaille, J.Y.; Gandini, A. The surface chemical modification of cellulosic fibers in view of their use in composite materials. Cellulose 1997, 4, 305–320. [Google Scholar] [CrossRef]
- Chan, W.C.; Higton, A.; Davies, J.S. Amino Acids. In Amino Acids, Peptides and Proteins; Davies, J.S., Ed.; RSC Publishing: Cambridge, UK, 2006; Volume 35, pp. 1–73. [Google Scholar]
- Park, S.; Baker, J.O.; Himmel, M.; Parrilla, P.; Johnson, D.K. Cellulose crystallinity index: Measurement techniques and their impact on interpreting cellulase performance. Biotechnol. Biofuels 2010, 3, 1–10. [Google Scholar] [CrossRef] [PubMed]
- Johnson Ford, E.; Sharathkumar, M.; Shelby, T.; Rawlins, J. X-ray Diffraction of Cotton Treated with Neutralized Vegetable Oil-based Macromolecular Crosslinkers. J. Eng. Fibers Fabrics 2010, 5, 10–20. [Google Scholar]
- Oh, S.; Yoo, D.; Shin, Y.; Seo, G. FTIR analysis of cellulose treated with sodium hydroxide and carbon dioxide. Carbohydr. Res. 2005, 340, 417–428. [Google Scholar] [CrossRef] [PubMed]
- Hinterstoisser, B.; Salmén, L. Application of dynamic 2D FTIR to cellulose. Vib. Spectrosc. 2000, 22, 111–118. [Google Scholar] [CrossRef]
- Wickholm, K.; Larsson, P.T.; Iversen, T. Assignment of non-crystalline forms in cellulose I by CP/MAS 13C NMR spectroscopy. Carbohydr. Res. 1998, 312, 123–129. [Google Scholar] [CrossRef]
- Pu, Y.; Ziemer, C.; Ragauskas, A.J. CP/MAS 13C NMR analysis of cellulase treated bleached softwood kraft pulp. Carbohydr. Res. 2006, 341, 591–597. [Google Scholar] [CrossRef] [PubMed]
- Hotař, V. Fractal geometry for industrial data evaluation. Computers and Mathematics with Applications. Comput. Math. Appl. 2013, 66, 113–121. [Google Scholar] [CrossRef]
- Dubuc, B.; Tricot, C.; Zucker, S.W. Evaluating the fractal dimension of profiles. Phys. Rev. A Gen. Phys. 1989, 39, 1500–1512. [Google Scholar] [CrossRef] [PubMed]
- Tian, J.; Fan, C.; Cheng, M.; Wang, X. Hydrolysis of cellulose over CsxH3-xPW12O40 (X = 1–3) Heteropoly acid catalysts. Chem. Eng. Technol. 2011, 34, 482–486. [Google Scholar] [CrossRef]
- Shimizu, K.; Furukawa, H.; Kobayashi, N.; Itaya, Y.; Satsuma, A. Effects of Brønsted and Lewis acidities on activity and selectivity of heteropolyacid-based catalysts for hydrolysis of cellobiose and cellulose. Green Chem. 2009, 11, 1627–1632. [Google Scholar] [CrossRef]
- Camacho, F.; Gonzalez-Tello, P.; Jurado, E.; Robles, A. Microcrystalline-Cellulose Hydrolysis with Concentrated Sulphuric Acid. J. Chem. Tech. Biotechnol. 1996, 67, 350. [Google Scholar] [CrossRef]
- Wu, Y.; Fu, Z.; Yin, D.; Xu, Q.; Liu, F.; Lu, C.; Mao, L. Microwave-assisted hydrolysis of crystalline cellulose catalyzed by biomass char sulfonic acids. Green Chem. 2010, 12, 696–700. [Google Scholar] [CrossRef]
- Zhang, Z.; Zhao, Z.K. Solid acid and microwave-assisted hydrolysis of cellulose in ionic liquid. Carbohydr. Res. 2009, 344, 2069–2072. [Google Scholar] [CrossRef] [PubMed]
- Zhang, Q.; Benoit, M.; De Oliveira Vigier, K.; Barrault, J.; Jégou, G.; Philippe, M.; Jérôme, F. Pretreatment of microcrystalline cellulose by ultrasounds: Effect of particle size in the heterogeneously-catalyzed hydrolysis of cellulose to glucose. Green Chem. 2013, 15, 963–969. [Google Scholar] [CrossRef]
- Fang, Z.; Zhang, F.; Zeng, H.-Y.; Guo, F. Production of glucose by hydrolysis of cellulose at 423 K in the presence of activated hydrotalcite nanoparticles. Bioresour. Technol. 2011, 102, 8017–8021. [Google Scholar] [CrossRef] [PubMed]
- Zhao, H.; Kwak, J.H.; Wang, Y.; Franz, J.A.; White, J.M.; Holladay, J.E. Effects of crystallinity on dilute acid hydrolysis of cellulose by cellulose ball-milling study. Energy Fuel 2006, 20, 807–811. [Google Scholar] [CrossRef]
- SDP v4.1 Copyright© 2004. XPS International, LLC; Compiled 17 January 2004.
- Glatter, O. Convolution square root of band-limited symmetrical functions and its application to small-angle X-ray scattering. J. Appl. Crystallogr. 1981, 14, 101–108. [Google Scholar] [CrossRef]
- Glatter, O.; Hainish, B. Improvements in real-space deconvolution of small angle scattering data. J. Appl. Crystallogr. 1984, 17, 435–441. [Google Scholar] [CrossRef]
- Glatter, O. Scattering studies on colloids of biological interest (amphiphilic systems). Prog. Colloid Polym. Sci. 1991, 84, 46–54. [Google Scholar]
- Harrison, A. Fractals in Chemistry; Oxford University Press Inc.: New York, NY, USA, 1995. [Google Scholar]
- Ibarra, I.A.; Loera, S.; Laguna, H.; Lima, E.; Lara, V. Irreversible adsorption of an Aztec dye on fractal surfaces. Chem. Mater. 2005, 17, 5763–5769. [Google Scholar] [CrossRef]
Figure 1.
X-ray diffraction patterns of microcrystalline cellulose and microcrystalline cellulose loaded with amino acids.
Figure 1.
X-ray diffraction patterns of microcrystalline cellulose and microcrystalline cellulose loaded with amino acids.

Figure 2.
FTIR spectra of microcrystalline cellulose and microcrystalline cellulose loaded with amino acids.
Figure 2.
FTIR spectra of microcrystalline cellulose and microcrystalline cellulose loaded with amino acids.

Figure 3.
13C CP MAS NMR spectra of microcrystalline cellulose and microcrystalline cellulose loaded with amino acids.
Figure 3.
13C CP MAS NMR spectra of microcrystalline cellulose and microcrystalline cellulose loaded with amino acids.
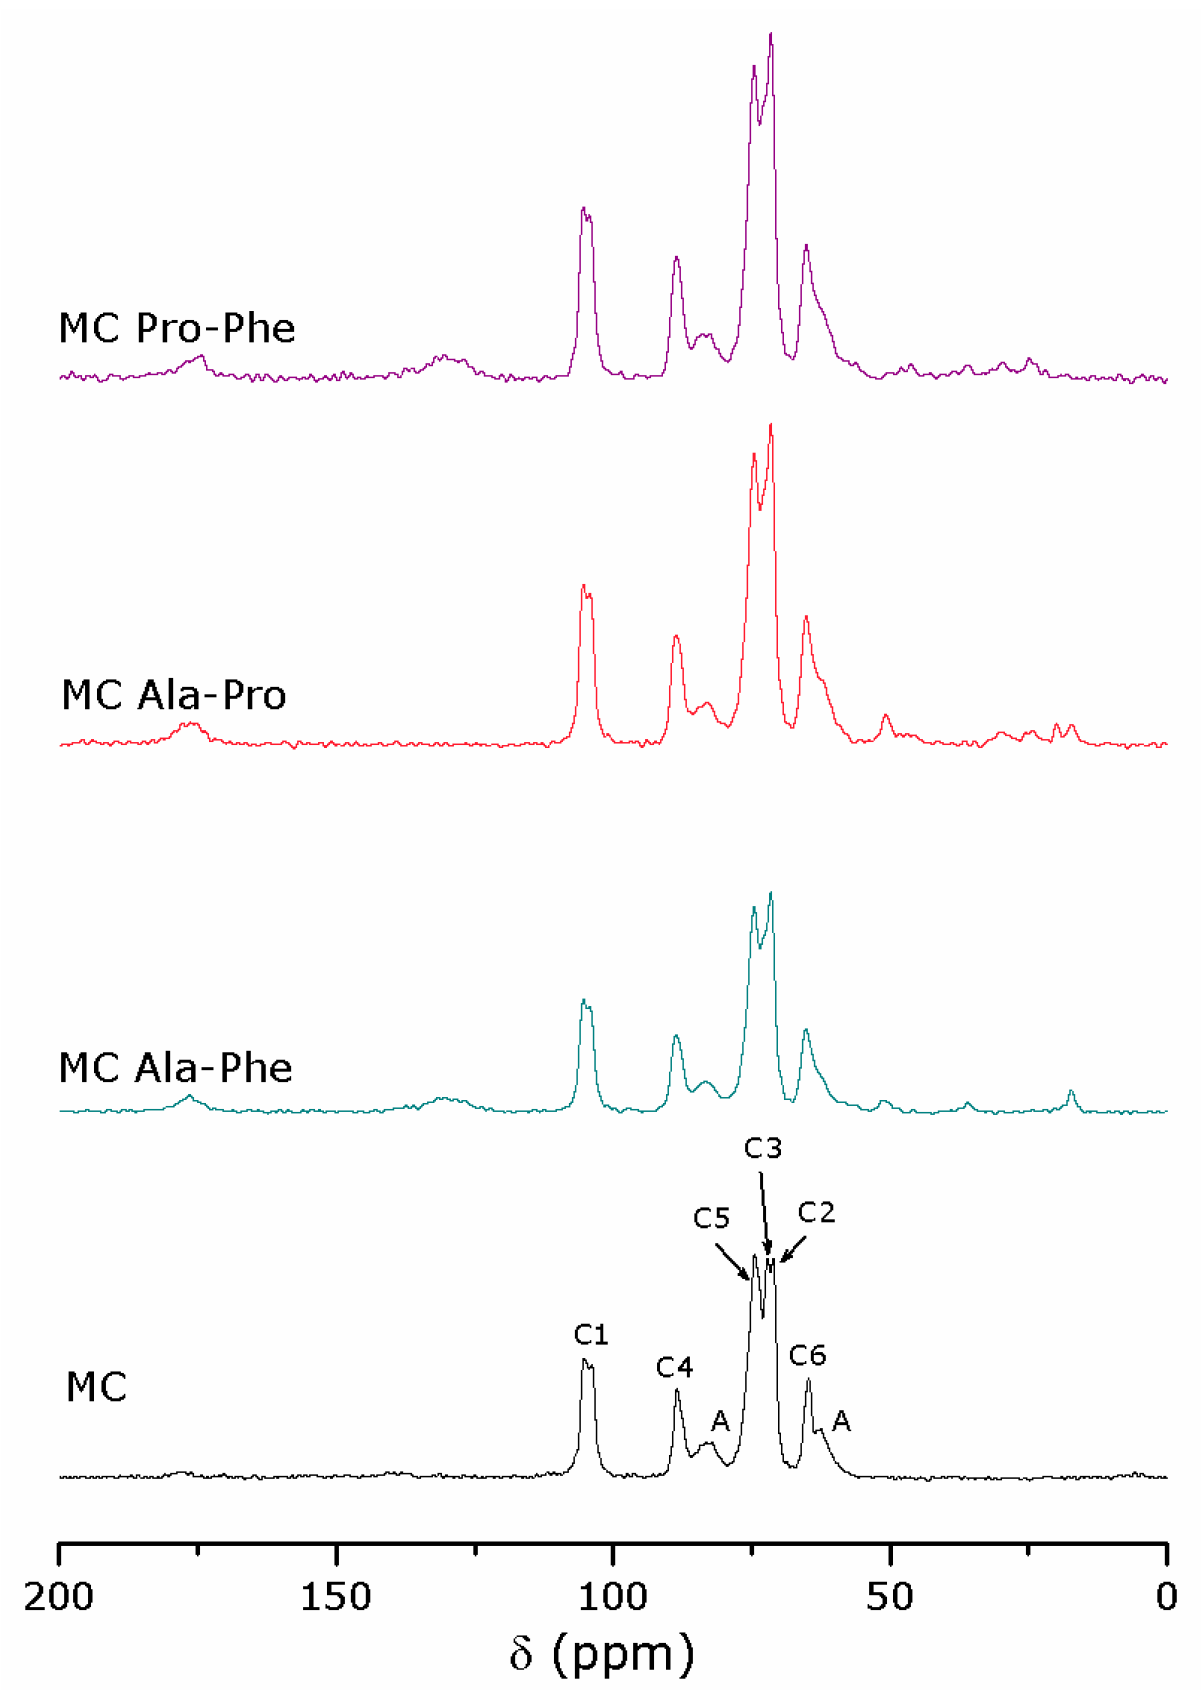
Figure 4.
Chemical structure of amino acids and cellulose. Carbon numbering was used for the assignment of the NMR signals (spectra in Figure 3).
Figure 4.
Chemical structure of amino acids and cellulose. Carbon numbering was used for the assignment of the NMR signals (spectra in Figure 3).
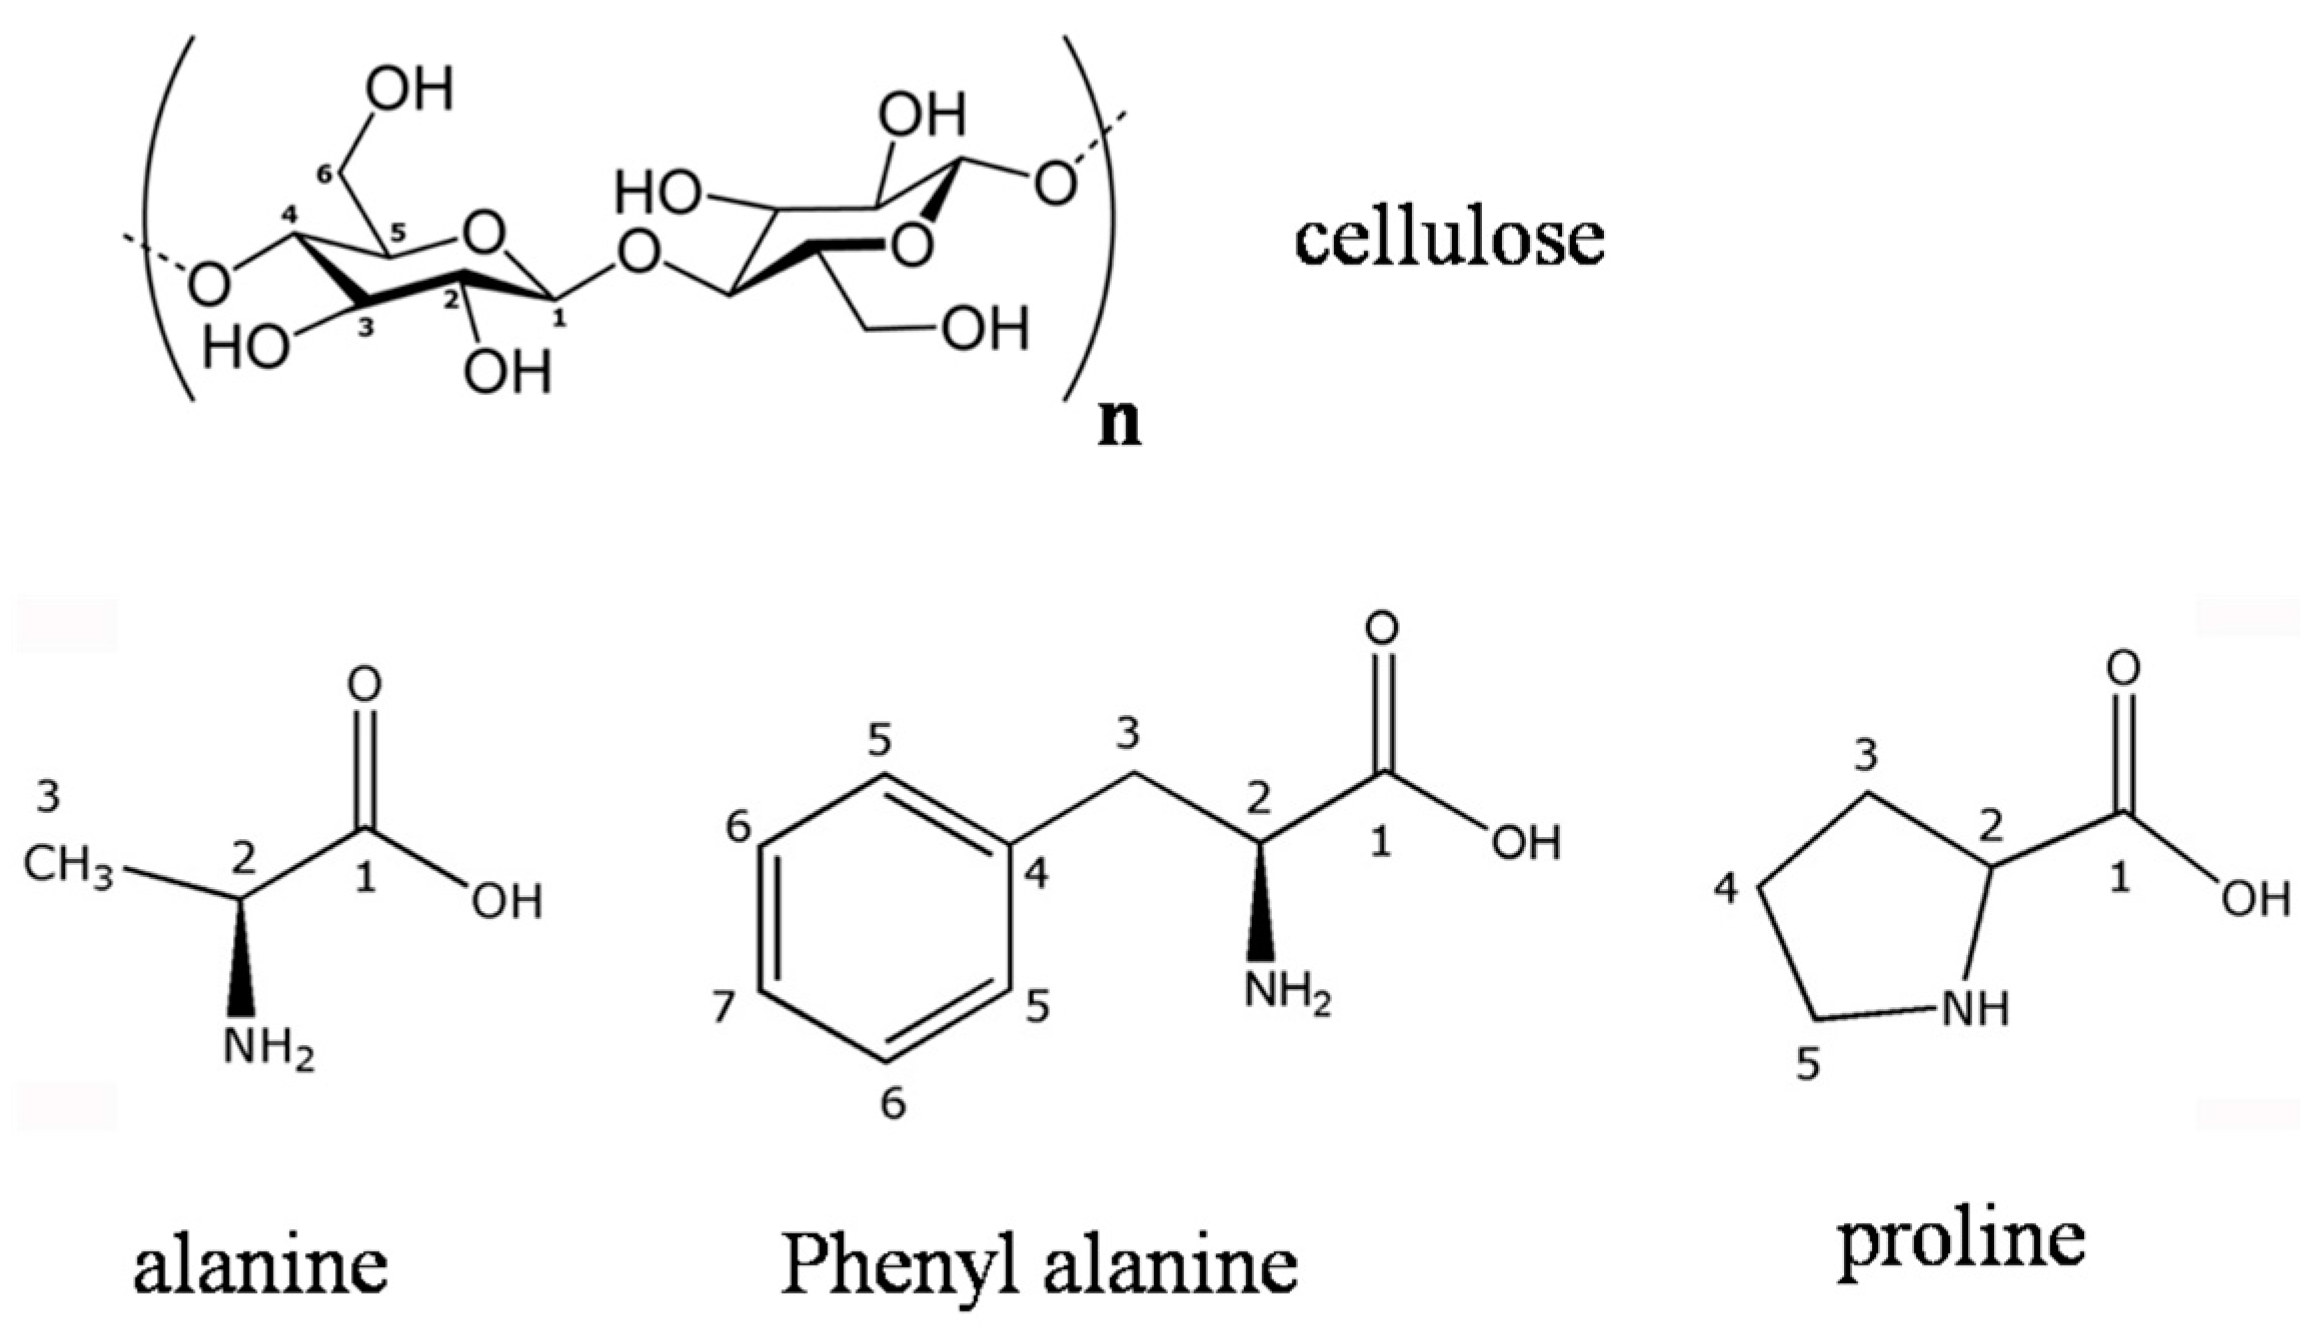
Figure 5.
SEM images (10,000×) of microcrystalline cellulose (a) and microcrystalline cellulose loaded with alanine and phenylalanine (b), proline and alanine (c), or proline and phenylalanine (d).
Figure 5.
SEM images (10,000×) of microcrystalline cellulose (a) and microcrystalline cellulose loaded with alanine and phenylalanine (b), proline and alanine (c), or proline and phenylalanine (d).
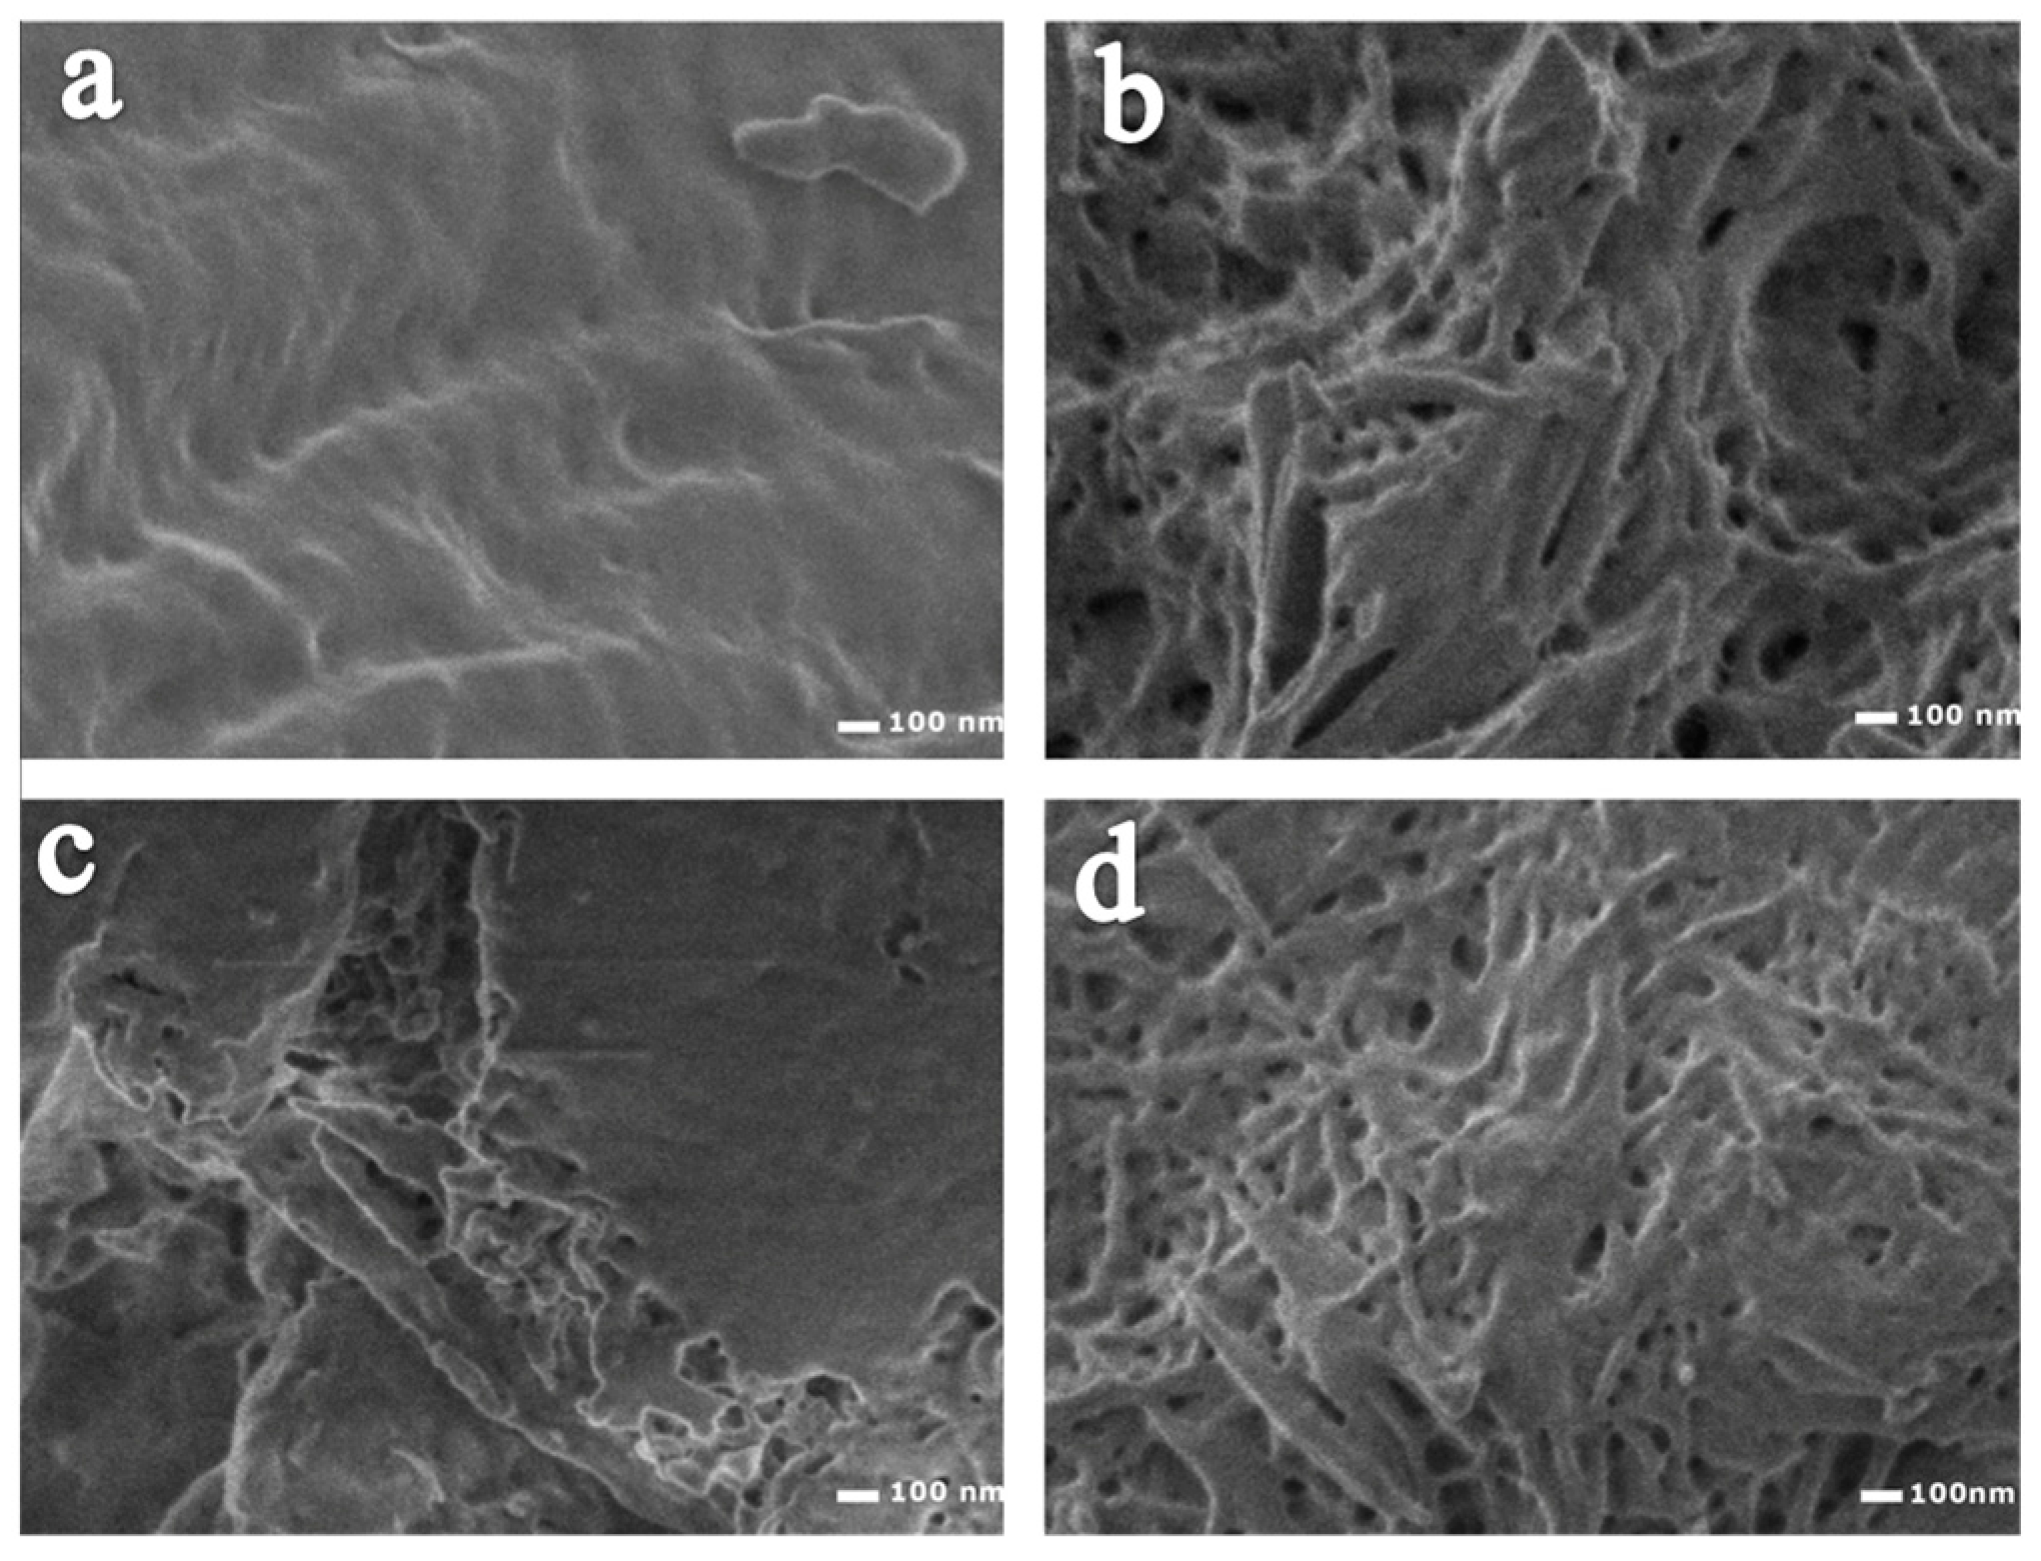
Figure 6.
Kratky plots of samples (a) MC, (b) MC Ala-Phe, (c) MC Ala-Pro and (d) MC Pro-Phe.
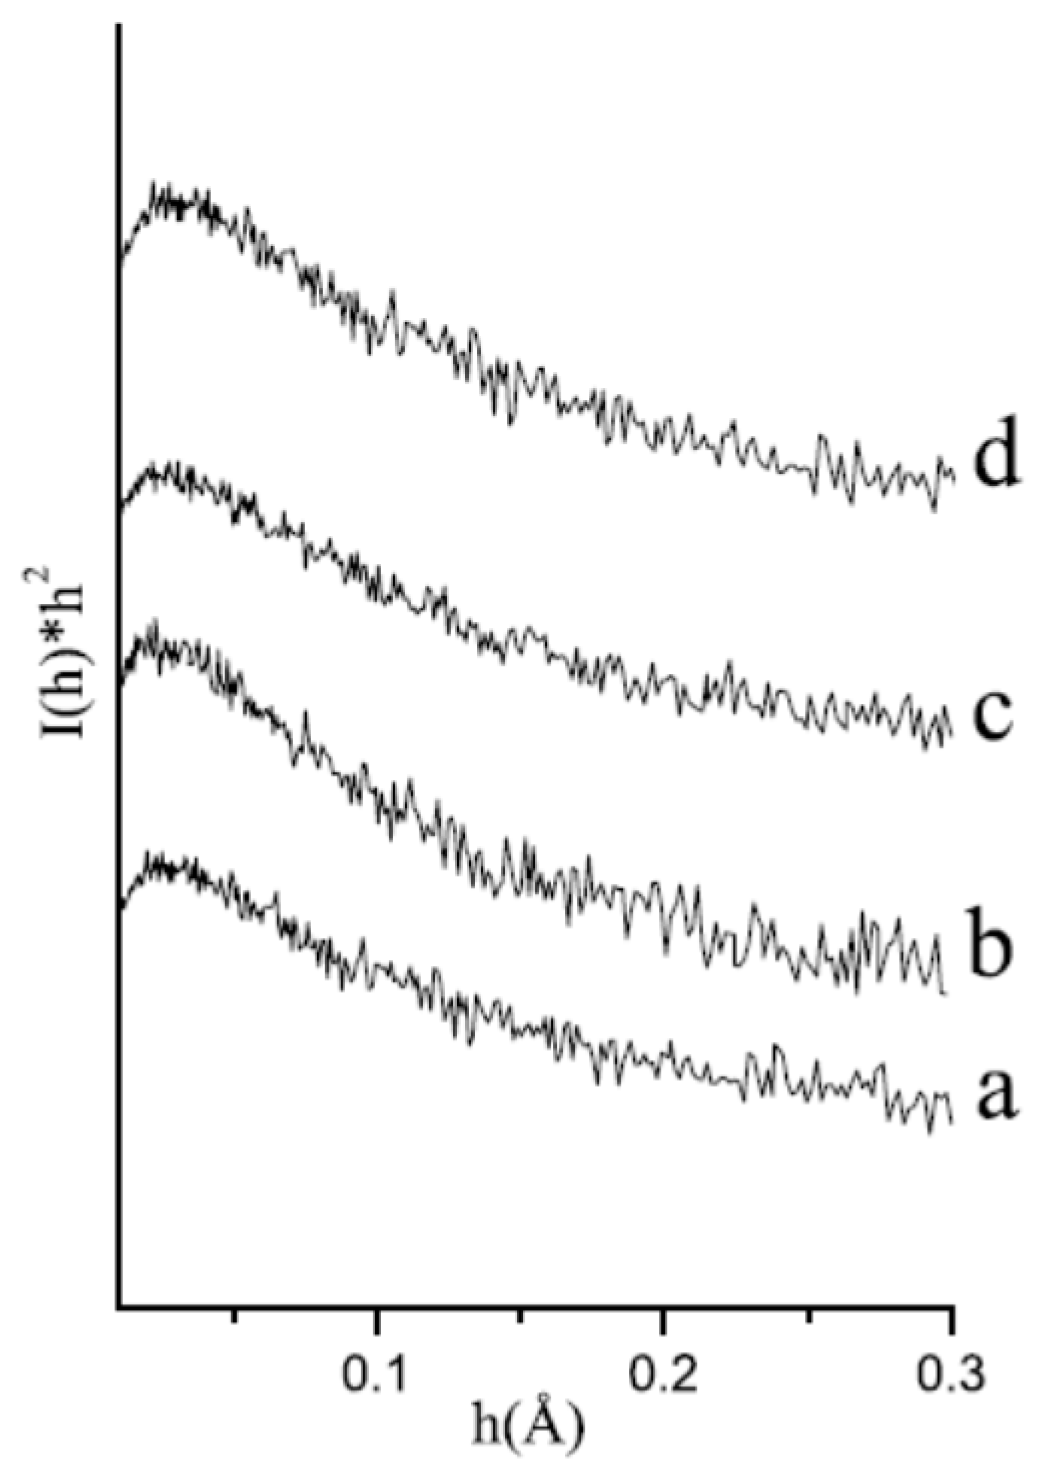
Figure 7.
Changes in aqueous product yields (water soluble organic compounds: galactose, glucose, xylose and mannose) versus reaction time during cellulose hydrolysis. (-○-) MC, catalyst H2SO4; (-●-) MC, H3PW12O40 catalyst; (-□-) MC Pro-Phe, catalyst H2SO4; (-■-) MC Pro-Phe, H3PW12O40 catalyst.
Figure 7.
Changes in aqueous product yields (water soluble organic compounds: galactose, glucose, xylose and mannose) versus reaction time during cellulose hydrolysis. (-○-) MC, catalyst H2SO4; (-●-) MC, H3PW12O40 catalyst; (-□-) MC Pro-Phe, catalyst H2SO4; (-■-) MC Pro-Phe, H3PW12O40 catalyst.
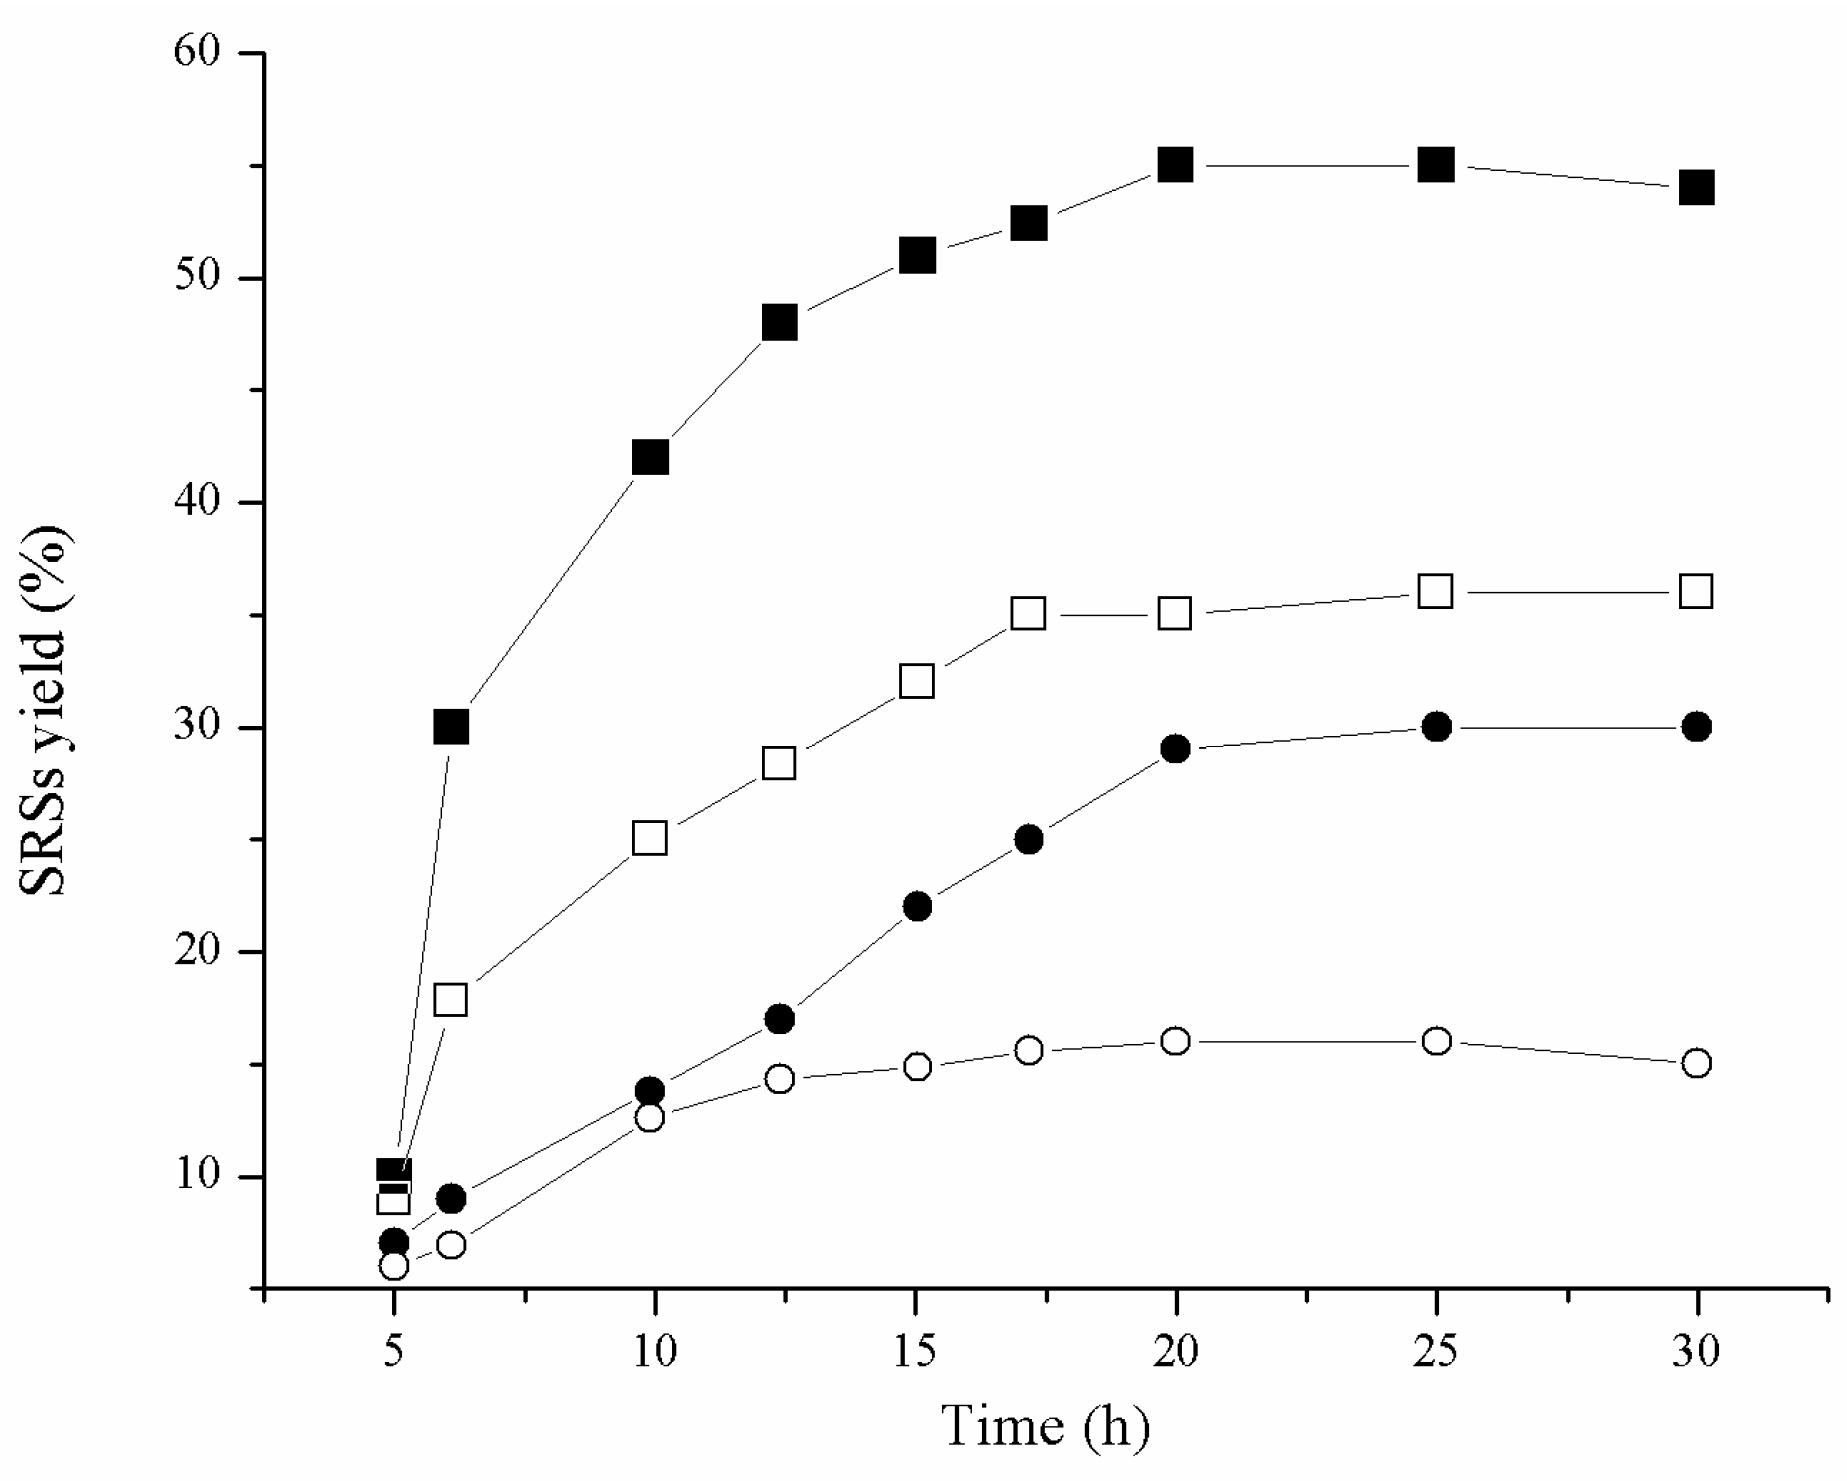
Figure 8.
Catalytic activity (cellulose conversion) as a function of the fractal dimension of the cellulose surface. Hydrolysis catalysed by (-●-) H2SO4 and (-■-) H3PW12O40.
Figure 8.
Catalytic activity (cellulose conversion) as a function of the fractal dimension of the cellulose surface. Hydrolysis catalysed by (-●-) H2SO4 and (-■-) H3PW12O40.

Figure 9.
13C MAS NMR spectra of MC Pro-Phe before reaction (a), and recovered after 1 (b), 5 (c) and 12 (d) h of hydrolysis reaction using H3PW12O40 as the catalyst.
Figure 9.
13C MAS NMR spectra of MC Pro-Phe before reaction (a), and recovered after 1 (b), 5 (c) and 12 (d) h of hydrolysis reaction using H3PW12O40 as the catalyst.


Table 1.
Elemental analysis of the untreated and amino acid-treated samples of cellulose.
| Code Sample | Amino Acids | Amount (wt %) of Chemical Elements | Amount (wt %) of Amino Acids | ||
|---|---|---|---|---|---|
| C | O | N | Data | ||
| MC | - | 47.40 | 52.60 | - | - |
| MC Ala-Pro | Alanine and proline | 47.64 | 51.80 | 0.56 | 3.8 |
| MC Ala-Phe | Alanine and phenylalanine | 48.33 | 51.17 | 0.50 | 4.2 |
| MC Pro-Phe | Proline and phenylalanine | 48.01 | 51.58 | 0.41 | 3.9 |
Table 2.
Physical properties of cellulose samples. Fractal dimension as determined by small angle X-ray scattering (SAXS) data under the Porod law, and particle size as determined by light scattering.
Table 2.
Physical properties of cellulose samples. Fractal dimension as determined by small angle X-ray scattering (SAXS) data under the Porod law, and particle size as determined by light scattering.
| Sample | Fractal Dimension | Particle Size (µm) |
|---|---|---|
| MC | 2.1 | 49 |
| MC Ala-Pro | 2.2 | 68 |
| MC Ala-Phe | 2.3 | 72 |
| MC Pro-Phe | 2.6 | 86 |
| MC Phe | 2.7 | 70 |
Table 3.
Glucose selectivity in hydrolysis reaction of cellulose using two catalysts.
| Sample | Time (h) | Cellulose Conversion (%) | Glucose Selectivity (%) | ||
|---|---|---|---|---|---|
| H2SO4 | H3PW12O40 | H2SO4 | H3PW12O40 | ||
| MC | 5 | 3 | 7 | 21 | 26 |
| 10 | 5 | 15 | 33 | 39 | |
| 15 | 13 | 26 | 49 | 70 | |
| 20 | 15 | 34 | 87 | 89 | |
| 25 | 15 | 33 | 91 | 90 | |
| MC Pro-Phe | 5 | 5 | 6 | 6 | 28 |
| 10 | 10 | 15 | 35 | 43 | |
| 15 | 20 | 51 | 79 | 87 | |
| 20 | 29 | 54 | 86 | 91 | |
| 25 | 29 | 55 | 93 | 92 | |
Table 4.
Glucose selectivity in hydrolysis reaction of cellulose using two catalysts.
| Sample | Reaction Time (h) | Fractal Dimension |
|---|---|---|
| MC | 1 | 2.2 |
| 5 | 2.2 | |
| 10 | 2.3 | |
| 12 | 2.3 | |
| MC Pro-Phe | 1 | 2.6 |
| 5 | 2.7 | |
| 10 | 2.9 | |
| 12 | 2.9 |
© 2017 by the authors. Licensee MDPI, Basel, Switzerland. This article is an open access article distributed under the terms and conditions of the Creative Commons Attribution (CC BY) license (http://creativecommons.org/licenses/by/4.0/).
Share and Cite
MDPI and ACS Style
Díaz, M.; Hernández, M.; Ibarra, I.A.; Guzmán, A.; Lara, V.; Lima, E. Cellulose with a High Fractal Dimension Is Easily Hydrolysable under Acid Catalysis. Catalysts 2017, 7, 162. https://doi.org/10.3390/catal7050162
AMA Style
Díaz M, Hernández M, Ibarra IA, Guzmán A, Lara V, Lima E. Cellulose with a High Fractal Dimension Is Easily Hydrolysable under Acid Catalysis. Catalysts. 2017; 7(5):162. https://doi.org/10.3390/catal7050162
Chicago/Turabian StyleDíaz, Mariana, Magali Hernández, Ilich A. Ibarra, Ariel Guzmán, Victor Lara, and Enrique Lima. 2017. "Cellulose with a High Fractal Dimension Is Easily Hydrolysable under Acid Catalysis" Catalysts 7, no. 5: 162. https://doi.org/10.3390/catal7050162
Note that from the first issue of 2016, this journal uses article numbers instead of page numbers. See further details here.