Cerium Coordination Polymer Based Composite Mimicking Peroxidase for Detection of Nitroaniline

Department of Chemical Engineering, Beijing University of Chemical Technology, Beijing 100029, China
*
Author to whom correspondence should be addressed.
†
These authors contributed equally to this work.
Catalysts 2017, 7(7), 206; https://doi.org/10.3390/catal7070206
Submission received: 7 May 2017
/
Revised: 21 June 2017
/
Accepted: 23 June 2017
/
Published: 7 July 2017
Abstract
:Cerium coordination polymer (CeCP) was synthesized with 1,3,5-benzenetricarboxylic acid as the ligand. By using the carboxyl groups on the surface of CeCP as the anchors, platinum nanoparticles were formed on CeCP forming the composite CeCP@Pt. The composite was characterized by measuring TEM images, and EDS and XPS spectra. CeCP@Pt was used to catalyze the oxidation of 3,3,5,5-tetramethylbenzidine in the presence of H2O2. The activity assay demonstrated that CeCP@Pt exhibited an activity similar to that of horseradish peroxidase, but with a much higher activity. CeCP@Pt was utilized to detect nitroaniline, being able to detect trace amount of nitroaniline (>3.125 × 10⁻⁴ mg/mL).
1. Introduction
Peroxidases have been extensively used in environmental, pharmaceutical, biomedical, agricultural, biochemical applications [1]. Natural peroxidases have demonstrated their high catalytic activity and substrate specificity in the presence of H2O2 [2]. However, environmental changes can easily cause the loss of catalytic activity and substrate specificity of natural peroxidases. Nanomaterials such as enzyme mimetics are stable and easy to prepare and store. The research in artificial enzymes is highly significant for developing efficient catalysts. Various nanomaterials have been synthesized and utilized as peroxidase mimics, including Cu2+-Modified graphene oxide nanoparticles [3], nanodiamond–gold nanocomposites [1], nano-MoS2 [4], Pd–Ir Core–Shell nanocubes [5], and CeO2 on TiO2 nanocomposite [6]. Platinum composites have also been extensively investigated as peroxidase mimics, Pt–DNA complexes for detection of H2O2 and glucose [7], platinum/gold nanoparticles for detection of mercury ions [8], Platinum on graphene oxide for electrocatalysis [9] and for cysteine detection [10], Au@Ag@Pt nanoparticles for Raman sensing [11], dendrimer-encapsulated Pt for colorimetric analyses [12], enhanced peroxidase mimetic activity by carbon dots–Pt nanocomposites [13], platinum nanoparticles for detection of DNA sequence [14], platinum/carbon dot hybrid nanoparticles for detection of protein phosphorylation [15], and Palladium nanoparticles on CoFe2O4 nanotubes for detection of hydrogen peroxide [16]. Despite the great achievements, developing efficient nano-sized peroxidase mimics is always pursued in order to improve the catalytic performance of peroxidase mimics.
Nitroanilines are environmentally toxic. They are commonly generated by azo dyes undergoing degradation in dye contaminated wastewater [17]. Among the most commonly used methods for monitoring and detecting nitroanilines is chromatography [18,19]. High-performance liquid chromatography is able to analyze low concentrations of nitroanilines. Generally, a long time is needed to obtain the analyzed results. Fluorescence sensors were also investigated for detecting nitroaniline [20].
In this work, Cerium coordination polymer (CeCP) was synthesized using 1,3,5-benzenetricarboxylic acid as the ligand. Platinum nanoparticles were formed and deposited on the surface of CeCP. The nanocomposite CeCP@Pt was investigated for the peroxidase-like activity. The activity of the peroxidase mimic was evaluated using the peroxidase substrate 3,3,5,5-tetramethylbenzidine (TMB) in the presence of H2O2. By measuring UV-vis spectra, using CeCP@Pt to oxidize the mixture of 3,3,5,5-tetramethylbenzidine (TMB) and nitroaniline in the presence of H2O2, the nitroaniline concentration can be determined. Thus, this method can be used to detect low concentrations of nitroaniline.
2. Results and Discussion
2.1. Characterization of Pt Deposited Ce Coordination Polymer
Different CeCP to H2PtCl6 mass ratios were used for the preparation of CeCP@Pt. The Pt content of the obtained CeCP@Pt was 5.4%, 10%, 19.9%, 32.6%, and 52.7%, respectively, and was examined using inductively coupled plasma atomic emission spectrometric analysis. TEM images for the samples of CeCP and CeCP@Pt are shown in Figure 1a–f. CeCP itself exhibited a rod-like morphology (Figure 1a). The carboxyl groups on the surface of CeCP were used as anchors, the Pt nanoparticles were formed in situ on CeCP. After loading Pt, CeCP kept its original morphology. The Pt nanoparticles were well distributed on the surface of CeCP. The size of Pt nanoparticles was affected by the amounts loaded. With more Pt deposited on CeCP, larger Pt nanoparticles were formed. The size-distributions of Pt nanoparticles are shown in Figure 2a–e, and the averaged sizes of the Pt nanoparticles are listed in Table 1.
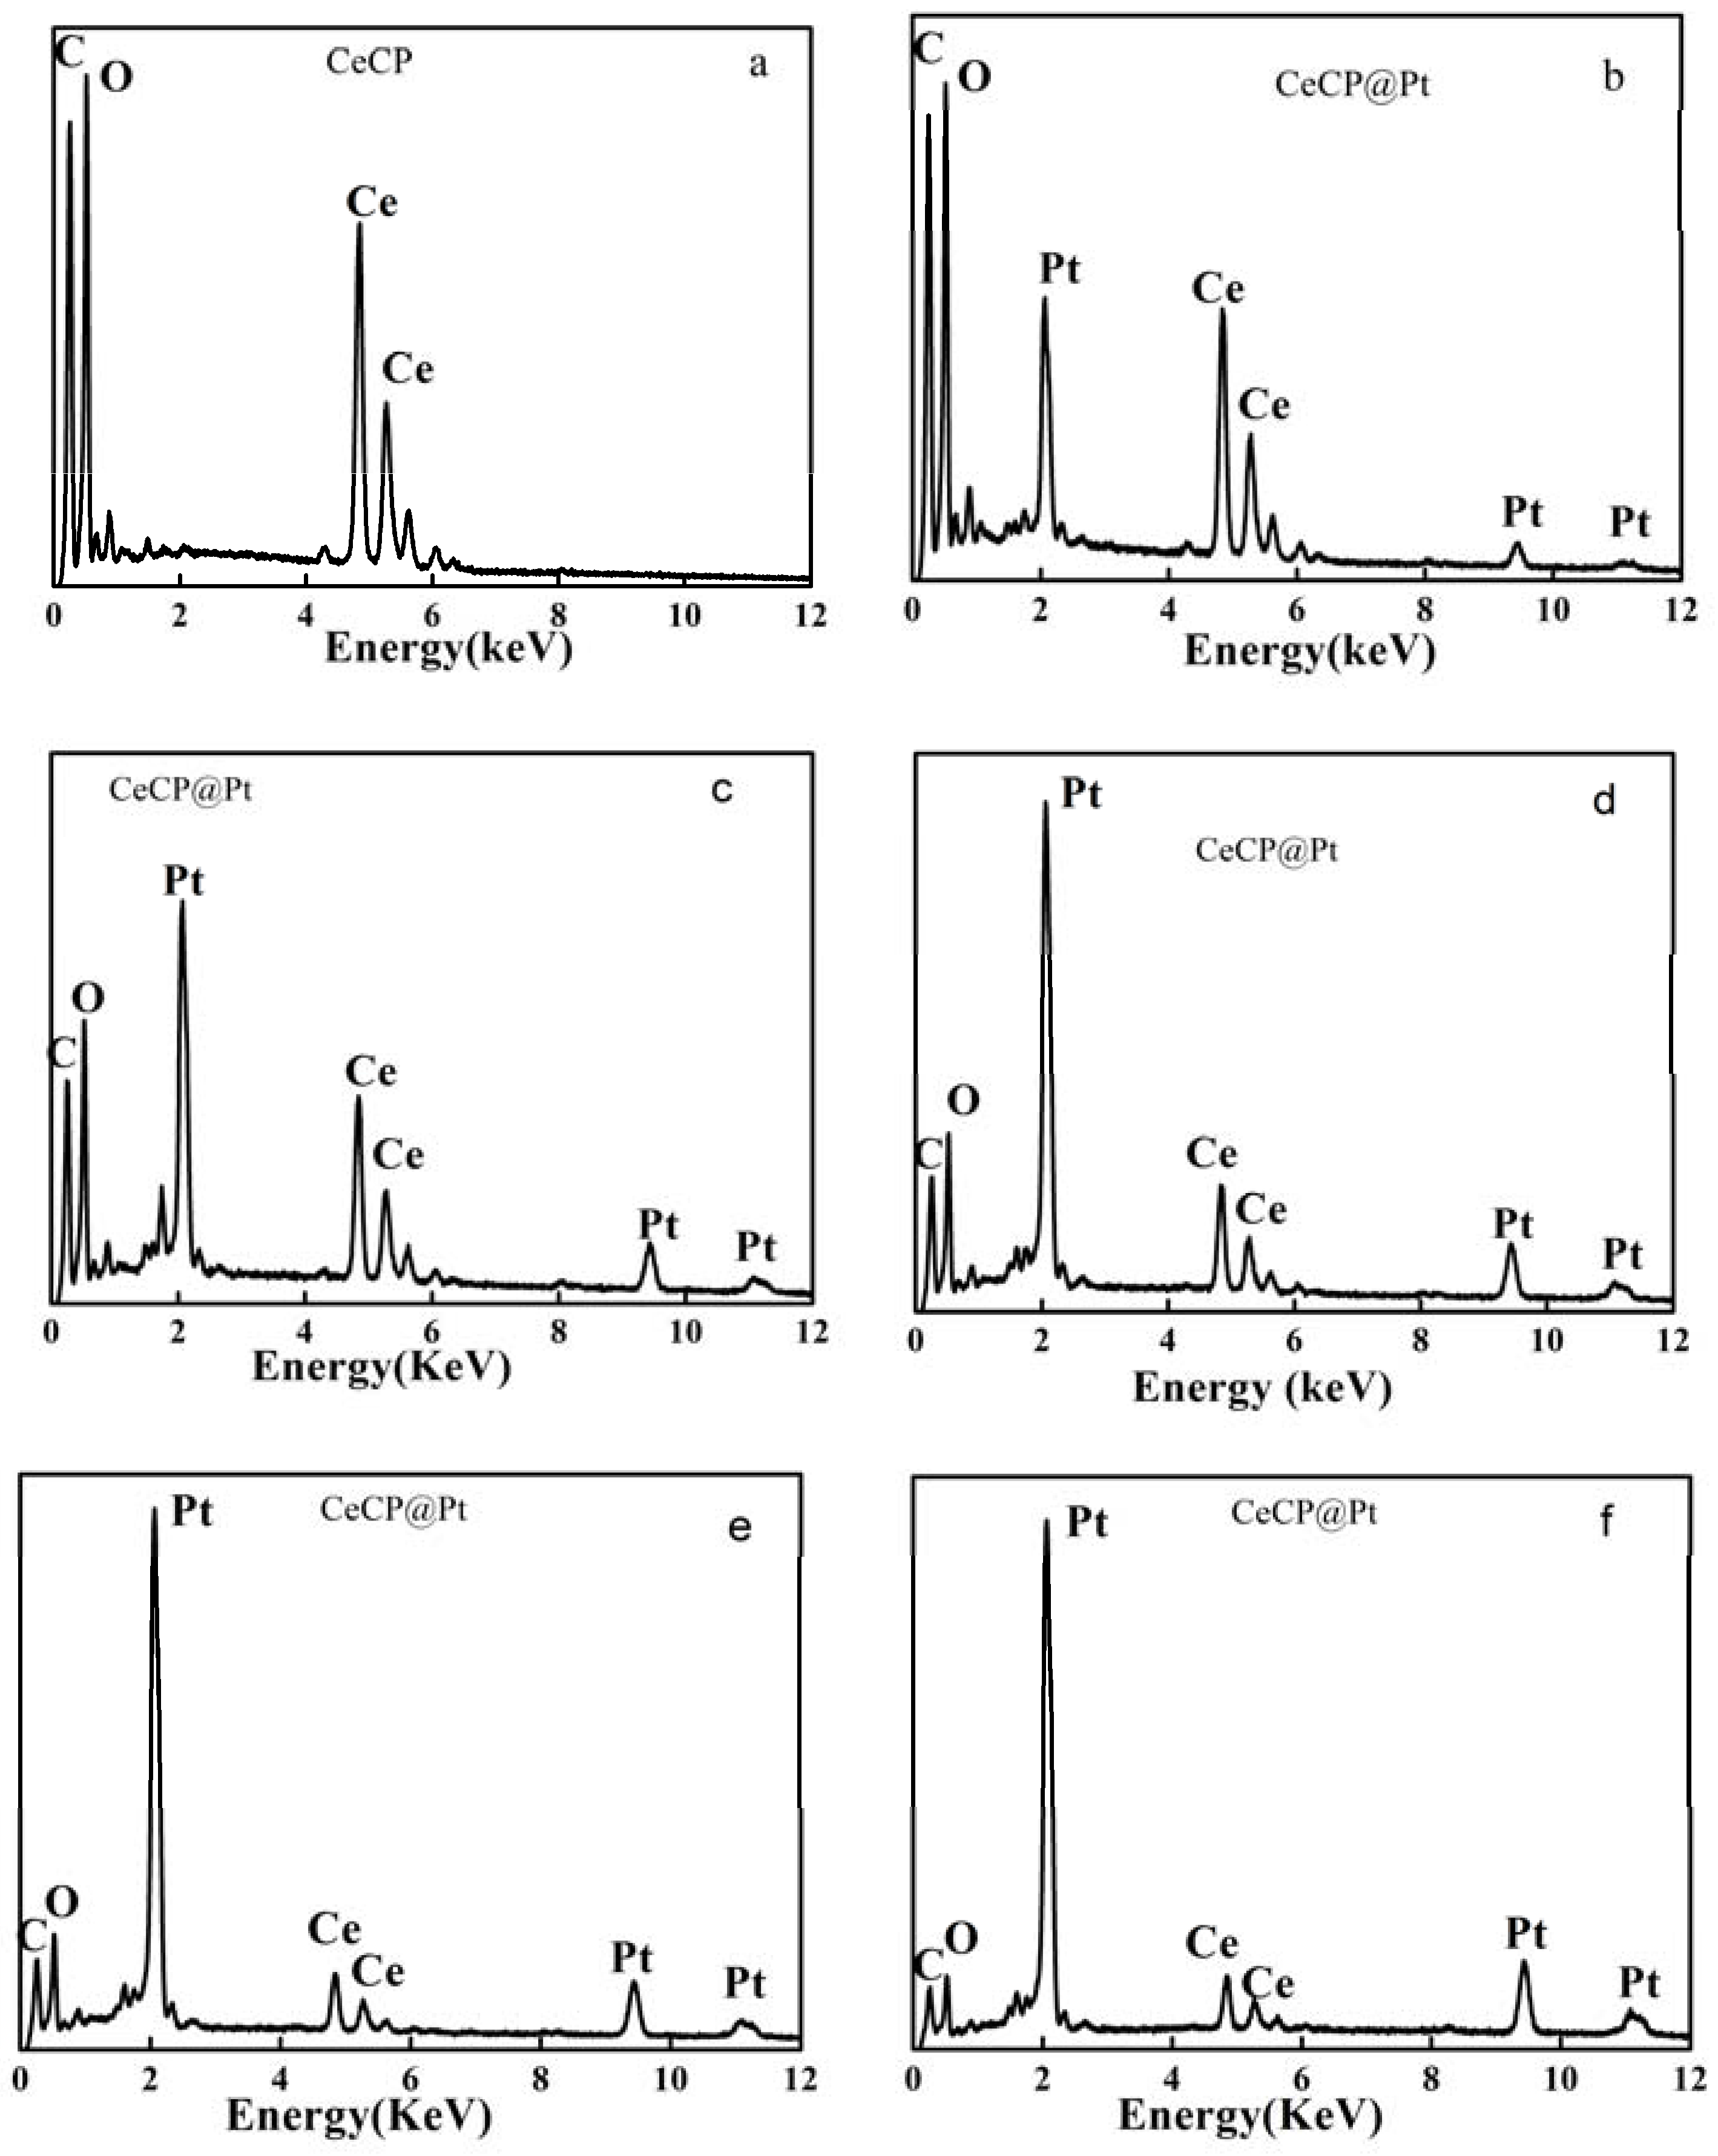
Energy-dispersive X-ray spectroscopy (EDS) was used to analyze the elements [21]. The obtained EDS spectra are shown in Figure 3a–f. Figure 3a is the control for CeCP with peaks for C at 0.235 keV, O at 0.52 keV, and Ce at 4.85 and 5.28 keV [21]. The spectra in Figure 3b–f are for the CeCP@Pt samples with different loading of Pt. The peaks for Pt appeared at 2.66, 9.44, and 11.13 keV [22], confirming the deposition of Pt on CeCP. When loading more Pt, the peak intensity of Pt increased relatively, as shown in Figure 3b–f. The percentage of Pt is indicated in the brackets of the subtitle, and was determined by inductively coupled plasma (ICP) atomic emission spectrometric analysis [23]. X-ray photoelectron spectroscopy (XPS) spectra were also measured for the samples, as shown in Figure 4. For the CeCP@Pt samples, Pt peaks appeared. With more Pt deposited on CeCP, the peak intensity for Pt increased.
2.2. Peroxidase Activity of CeCP@Pt
The peroxidase-like activity of CECP@Pt was investigated, by performing catalytic oxidation of the substrate 3,5,3’5’-tetramethylbenzidine (TMB) in the presence of H2O2 [7]. UV-vis spectra were measured for the solutions. As shown in Figure 5b, the blue color was observed upon the addition of CeCP@Pt to the TMB solution in the presence of H2O2; while the color change was not observed with the addition of CeCP. The appearance of the blue color was ascribed to the catalytic oxidation of TMB forming blue color product. The control sample of the CeCP@Pt solution itself was colorless. Upon the addition of CeCP@Pt, the peak absorbance at 652 nm appeared during the incubation (Figure 5a), while there was no peak absorbance at 652 nm in the absence of CeCP@Pt (Figure 5a). Only adding CeCP did not result in the absorbance at 652 nm (Figure 5a), which indicates that the oxidation of TMB is not caused by CeCP. These results confirmed that the oxidation of TMB in the presence of H2O2 is ascribed to the Pt nanoparticles loaded on CeCP. The above results demonstrate that the synthesized CeCP@Pt exhibited intrinsic peroxidase-like activity.
The effect of the Pt particle size on the activity was investigated. The same amount of Pt was used for each investigation. Figure 6a,b shows that the CeCP@Pt with a smaller size of Pt particle exhibited a larger activity. For the investigated systems, the catalyst CeCP@Pt with a Pt particle size of 4.5 nm exhibited the largest activity among the samples.
It was found that the activity of CeCP@Pt is dependent on H2O2 concentration and pH condition, and temperature, in accordance with the enzyme horseradish peroxidase and other peroxidase-mimetic nanomaterials. The optimal pH condition is pH 4.0, being close to the values of horseradish peroxidase and other peroxidase mimics. Under this pH condition, CeCP@Pt exhibited the largest activity (Figure 7a,b). Figure 8a,b shows that the optimal temperature for CeCP@Pt is 35 °C. Peroxidase enzyme catalyzes the transfer of electrons from hydrogen peroxide to a colorimetric indicator. Hydrogen peroxide has an oxidative damage to enzymes. That is the reason that the peroxidase enzyme is generally used under low hydrogen peroxide concentration. The activity of CeCP@Pt under different hydrogen peroxide concentrations was investigated. Figure 9a,b shows that CeCP@Pt exhibited activity for a wide H2O2 concentration range. While horseradish peroxidase can only tolerate low H2O2 concentration.
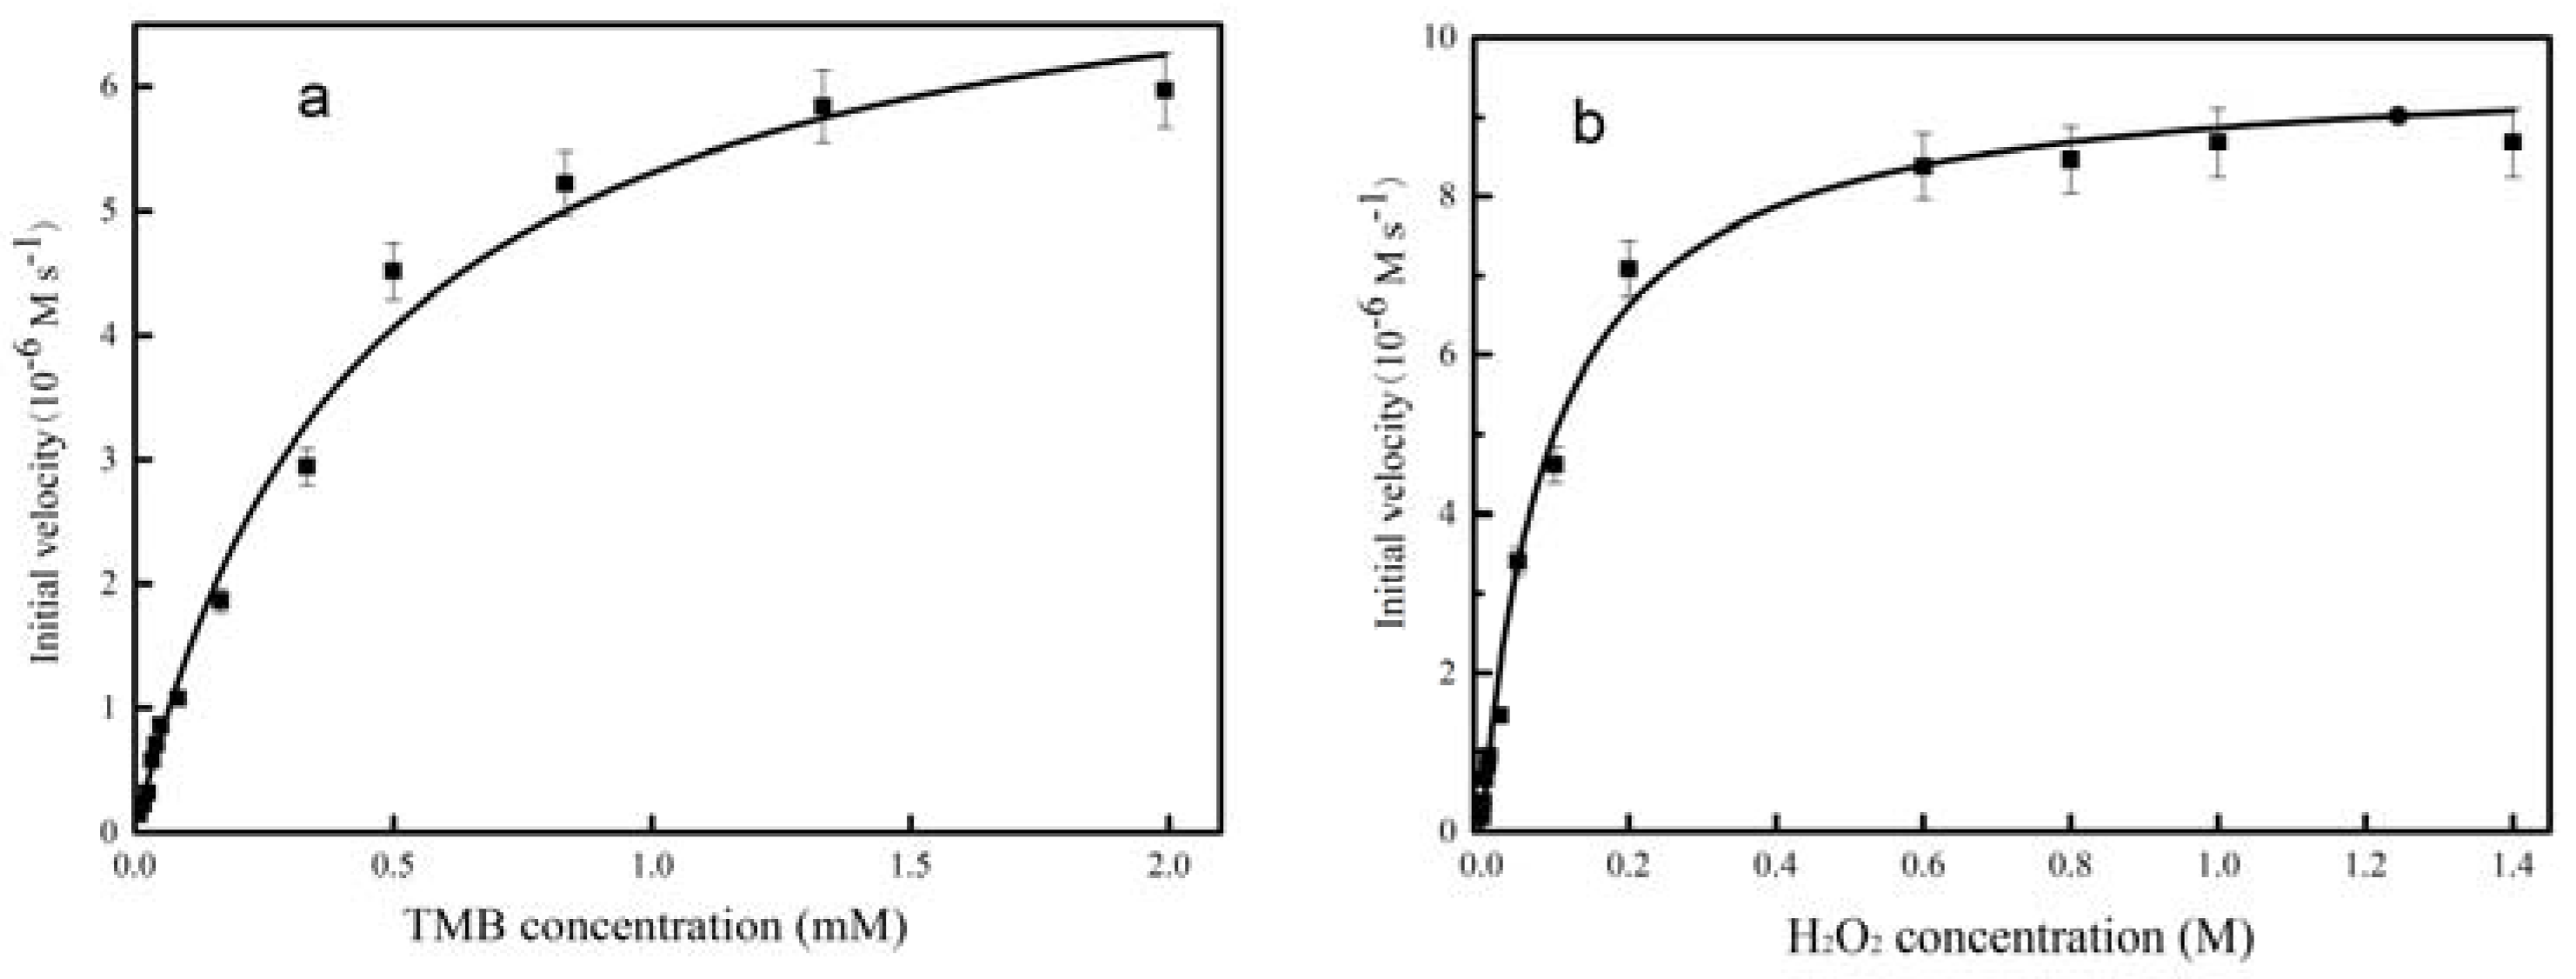
Under optimal conditions, apparent steady-state kinetics for the TMB oxidation reaction were investigated; the peroxidase-like activity of CeCP@Pt was compared with that of horseradish peroxidase and other peroxidase mimics. As shown in Figure 10a,b, the Michaelis-Menten curves were obtained for CeCP@Pt catalysis over a range of TMB and H2O2 concentrations. Based on the plots for the TMB and H2O2 concentrations (Figure 10a,b), the Michaelis-Menten constant kcat, which was used to measure the catalysis efficiency [24], was obtained. The apparent kcat value of CeCP@Pt with TMB was found to be 1.19 × 10⁹ s−1, which is superior to that of horseradish peroxidase and most other peroxidase-mimetic nanomaterials (Table 2). Additionally, it was found that CeCP@Pt exhibited a typical Michaelis–Menten curve for the H2O2 substrate. The apparent kcat value of CeCP@Pt with H2O2 was found to be 0.947 × 10⁹ s−1, which is superior to that of horseradish peroxidase and most other peroxidase-mimetic nanomaterials. The above results indicate that the synthesized CeCP@Pt exhibited peroxidase-like activity, superior to that of horseradish peroxidase and most other peroxidase-mimetic nanomaterials, towards the typical peroxidase substrate TMB.
2.3. Detection of Nitroaniline by CeCP@Pt
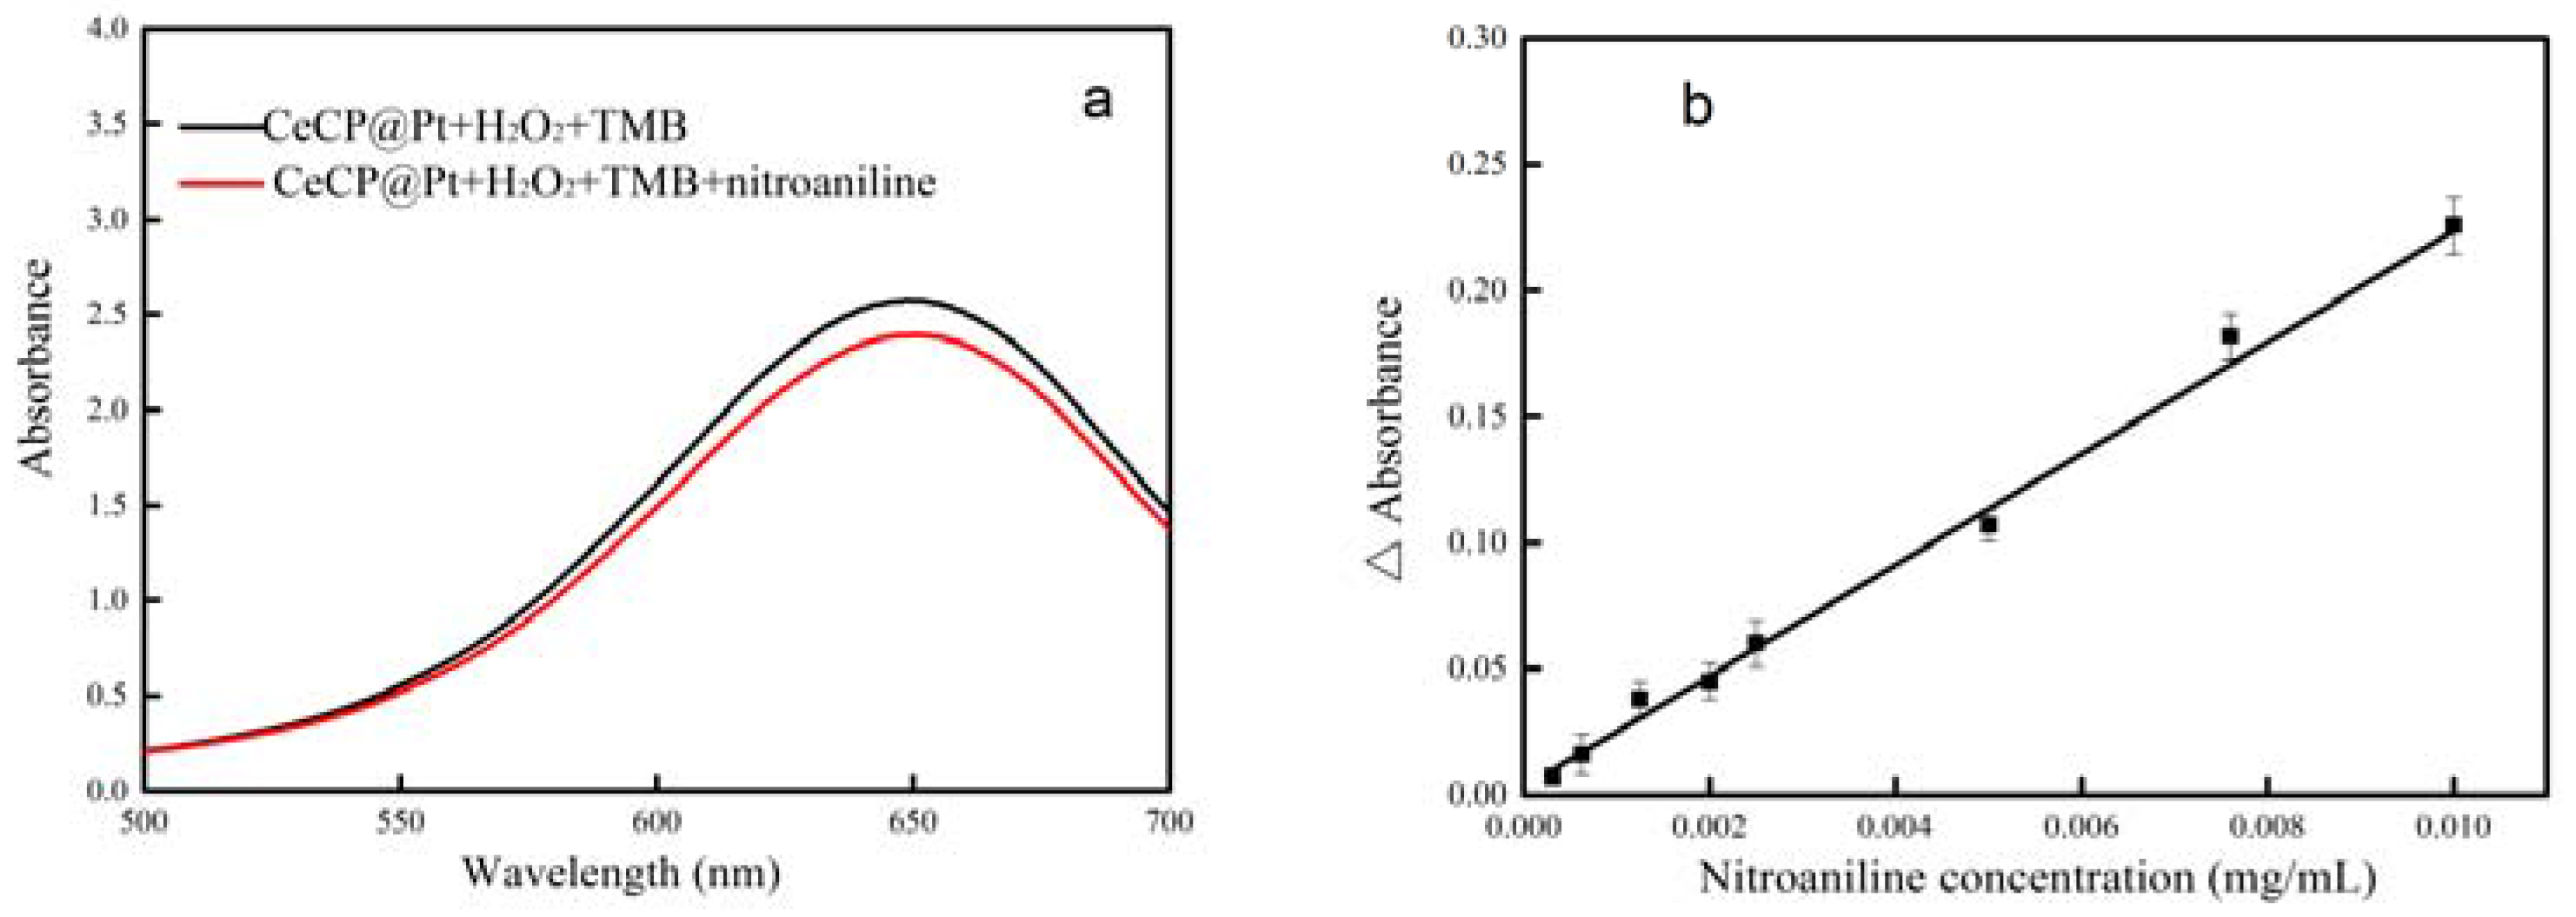
As described above, CeCP@Pt exhibited peroxidase-like activity. The solution of CeCP@Pt + H2O2 + TMB has an adsorption at 652 nm due to the oxidized TMB. When nitroaniline was added to the solution of CeCP@Pt + H2O2 + TMB, some H2O2 was used to oxidize nitroaniline, and less TMB was oxidized. Thus, the adsorption at 652 nm was reduced (Figure 11a). The adsorption difference at 652 nm between the solutions CeCP@Pt + H2O2 + TMB and CeCP@Pt + H2O2 + TMB + nitroaniline can be used to detect the amount of nitroaniline. The adsorption difference versus the nitroaniline concentration is shown in Figure 11b, which shows a linear relationship between the adsorption and the concentration. The low limit for the detected nitroaniline concentration is 3.125 × 10⁻⁴ mg/mL, which is lower than some published results [20] and comparable to other’s work [29].
In previously published articles, Ce-based materials were used as oxidase mimetics. This is because the Ce was in oxidized states, such as CeO2. While in CeCP, Ce ions are coordinated with the ligand 1,3,5-benzenetricarboxylic acid, not in oxidized states. The oxidase function of CeCP@Pt arises from the Pt particles loaded on CeCP. The detection of nitrocellulose using CeCP@Pt is based on following mechanism. When H2O2 was added to the solution, the H2O2 oxidized the nitroaniline. As a result, less H2O2 was available to oxidize TMB under the catalysis of CeCP@Pt. This led to a smaller UV-vis absorbance at 652 nm. By a comparison of the UV-vis absorbance between the systems CeCP@Pt + TMB + H2O2 and CeCP@Pt + TMB + H2O2 + nitroaniline, the concentration of nitroaniline can be determined.
3. Experimental Section
3.1. Materials
Ce (NO3)3·6H2O, 1,3,5-benzenetricarboxylic acid, chloroplatinic acid, citrate, and NaBH4 were purchased from Sigma-Aldrich (Shanghai, China).
3.2. Preparation of CeCP@Pt
2.17 g Ce(NO3)3·6H2O was dissolved in 45 mL H2O, the solution was designated as solution A. 1.05 g 1,3,5-benzenetricarboxylic acid was dissolved in 15 mL ethanol/water (v:v = 1:1), the solution was designated as solution B. At 60 °C under stirring, solution A was added dropwise to solution B, and the stirring was carried out for 2 h. Then the mixture was cooled to room temperature. The mixture was then filtered, washed first with water and then with ethanol until the filtrate being neutral. The synthesized CeCP was finally dried at 60 °C under vacuum for 12 h.
CeCP@Pt nanocomposites were prepared using CeCP and chloroplatinic acid hydrate (H2PtCl6). Different CeCP to H2PtCl6 mass ratios were used. 5 mg CeCP was dispersed in 40 mL ethanol and sonicated for 10 min. Then 0.23, 0.27, 0.54, 0.81, and 1.35 mL of the solutions of chloroplatinic acid (15.8 mg/mL) were separately added dropwise and sonicated for 10 min. Then the freshly prepared sodium borohydride solution (NaBH4, 30 mM, 1 mL) was added and sonicated for 5 min. Under the sonication, CeCP can be well dispersed. The resulting products were centrifuged (7000 rpm for 20 min) and washed with ultrapure water by filtration through 450 nm pore size membrane. The centrifugation and washing steps were repeated 3 times.
3.3. Measurement of Peroxidase Activity of CeCP@Pt
UV-vis adsorption was recorded every minute on a Shimadzu UV2550-PC spectrophotometer. The intensity at 652 nm was monitored for calculation of peroxidase activity.
The initial rate of the reaction can be obtained by the following equation:
where A652 is the intensity of the absorption peak at 652 nm, ε the molar absorption coefficient of the product ( M−1 cm−1), L the optical path (1 cm), Cp the concentration of the product, t the time, the initial rate.
The percentage conversion (X) can be obtained by using the following equation:
where A is the theoretical absorbance of the product if the conversion rate is equal to 100%, CTMB the concentration of the substrate. Ainit is the absorbance of the product at initial time and Aend is the absorbance at the end of the reaction.
X = (Aend − Ainit)/Ainit × 100
3.4. Characterization
The morphology of CeCP@Pt was observed by transmission electron microscopy (TEM) images, which were recorded on a FEI Tecnai G2 F20 S-TWIN instrument. XPS spectra were measured using an X-ray photoelectron spectrometer (Thermo VG ESCALAB250, Beijing, China). The measurement was carried out at a pressure of 2 × 10⁻⁹ Pa. Mg KX-ray was used as the excitation source. The weight percentage of Pt in the CeCP@Pt composite was analyzed by energy dispersive X-ray spectroscopy (EDS) using a JEOL JSM-6700F microscope and determined by inductively coupled plasma (ICP) atomic emission spectrometric analysis (PerkinElmer OPTIMA 3300DV, Waltham, MA, USA).
4. Conclusions
The CeCP@Pt nanocomposite exhibited a high peroxidase-like activity. Cerium coordination polymer (CeCP) was synthesized with 1,3,5-benzenetricarboxylic acid as the ligand. By using the carboxyl groups on the surface of CeCP as the anchors, platinum nanoparticles were formed on CeCP forming the composite CeCP@Pt. The composite was characterized by measuring TEM images, EDS spectra, and XPS spectra. CeCP@Pt was used to catalyze the oxidation of 3,3,5,5-tetramethylbenzidine with H2O2 as cosubstrate. The activity assay demonstrated that CeCP@Pt exhibited an activity similar to that of horseradish peroxidase, but with a much higher activity. CeCP@Pt was utilized to detect nitroaniline, being able to detect trace amount of nitroaniline (>3.125 × 10⁻⁴ mg/mL).
Acknowledgments
This work was supported by the National Science Foundation of China (21476023).
Author Contributions
Peijun Ji provided the idea and design for the study; Xi Wang and Kunkun Zheng performed the experiments; Xi Wang and Kunkun Zheng drafted the manuscript; Peijun Ji revised it.
Conflicts of Interest
The authors declare no conflict of interest.
References
- Kim, M.C.; Lee, D.; Jeong, S.H.; Lee, S.Y.; Kang, E. Nanodiamond–Gold Nanocomposites with the Peroxidase-Like Oxidative Catalytic Activity. ACS Appl. Mater. Interfaces 2016, 8, 34317–34326. [Google Scholar] [CrossRef] [PubMed]
- Woolridge, E.M. Mixed Enzyme Systems for Delignification of Lignocellulosic Biomass. Catalysts 2014, 4, 1–35. [Google Scholar] [CrossRef]
- Wang, S.; Cazelles, R.; Liao, W.C.; Vázquez-González, M.; Zoabi, A.; Abu-Reziq, R.; Willner, I. Mimicking Horseradish Peroxidase and NADH Peroxidase by Heterogeneous Cu2+-Modified Graphene Oxide Nanoparticles. Nano Lett. 2017, 17, 2043–2048. [Google Scholar] [CrossRef] [PubMed]
- Yin, W.; Yu, J.; Lv, F.; Yan, L.; Zheng, L.R.; Gu, Z.; Zhao, Y. Functionalized Nano-MoS2 with Peroxidase Catalytic and Near-Infrared Photothermal Activities for Safe and Synergetic Wound Antibacterial Applications. ACS Nano 2016, 10, 11000–11011. [Google Scholar] [CrossRef] [PubMed]
- Xia, X.; Zhang, J.; Lu, N.; Kim, M.J.; Ghale, K.; Xu, Y.; McKenzie, E.; Liu, J.; Ye, H. Pd–Ir Core–Shell Nanocubes: A Type of Highly Efficient and Versatile Peroxidase Mimic. ACS Nano 2015, 9, 9994–10004. [Google Scholar] [CrossRef] [PubMed]
- Zhao, H.; Dong, Y.; Jiang, P.; Wang, G.; Zhang, J. Highly Dispersed CeO2 on TiO2 Nanotube: A Synergistic Nanocomposite with Superior Peroxidase-Like Activity. ACS Appl. Mater. Interfaces 2015, 7, 6451–6461. [Google Scholar] [CrossRef] [PubMed]
- Chen, X.; Zhou, X.; Hu, J. Pt–DNA Complexes as Peroxidase Mimetics and Their Applications in Colorimetric Detection of H2O2 and Glucose. Anal. Methods 2012, 4, 2183–2187. [Google Scholar] [CrossRef]
- Tseng, C.W.; Chang, H.Y.; Chang, J.Y.; Huang, C.C. Detection of Mercury Ions Based on Mercury-Induced Switching of Enzyme-Like Activity of Platinum/Gold Nanoparticles. Nanoscale 2012, 4, 6823–6830. [Google Scholar] [CrossRef] [PubMed]
- Wang, H.; Li, S.; Si, Y.; Zhang, N.; Sun, Z.; Wu, H.; Lin, Y. Platinum Nanocatalysts Loaded on Graphene Oxide Dispersed Carbon Nanotubes with Greatly Enhanced Peroxidase-Like Catalysis and Electrocatalysis Activities. Nanoscale 2014, 6, 8107–8116. [Google Scholar] [CrossRef] [PubMed]
- Lin, X.Q.; Deng, H.H.; Wu, G.W.; Peng, H.P.; Liu, A.L.; Lin, X.H.; Xia, X.H.; Chen, W. Platinum Nanoparticles/Graphene-Oxide Hybrid with Excellent Peroxidase-Like Activity and its Application for Cysteine Detection. Analyst 2015, 140, 5251–5256. [Google Scholar] [CrossRef] [PubMed]
- Li, J.; Lv, L.; Zhang, G.; Zhou, X.; Shen, A.; Hu, J. Core–Shell Fructus Broussonetia-Like Au@Ag@Pt Nanoparticles as Highly Efficient Peroxidase Mimetics for Supersensitive Resonance-Enhanced Raman Sensing. Anal. Methods 2016, 8, 2097–2105. [Google Scholar] [CrossRef]
- Ju, Y.; Kim, J. Dendrimer-Encapsulated Pt Nanoparticles with Peroxidase-Mimetic Activity as Biocatalytic Labels for Sensitive Colorimetric Analyses. Chem. Commun. 2015, 51, 13752–13755. [Google Scholar] [CrossRef] [PubMed]
- Dong, Y.; Zhang, J.; Jiang, P.; Wang, G.; Wu, X.; Zhao, H.; Zhang, C. Superior Peroxidase Mimetic Activity of Carbon Dots–Pt Nanocomposites Relies on Synergistic Effects. New J. Chem. 2015, 39, 4141–4146. [Google Scholar] [CrossRef]
- Chau, L.Y.; He, Q.; Qin, A.; Yipand, S.P.; Lee, T.M.H. Platinum Nanoparticles on Reduced Graphene Oxide as Peroxidase Mimetics for the Colorimetric Detection of Specific DNA Sequence. J. Mater. Chem. B 2016, 4, 4076–4083. [Google Scholar] [CrossRef]
- Wang, Y.; Qi, W.; Song, Y. Antibody-Free Detection of Protein Phosphorylation Using Intrinsic Peroxidase-Like Activity of Latinum/Carbon Dot Hybrid Nanoparticles. Chem. Commun. 2016, 52, 7994–7997. [Google Scholar] [CrossRef] [PubMed]
- Yang, Z.; Zhang, Z.; Jiang, Y.; Chi, M.; Nie, G.; Lu, X.; Wang, C. Palladium Nanoparticles Modified Electrospun CoFe2O4 Nanotubes with Enhanced Peroxidase-Like Activity for Colorimetric Detection of Hydrogen Peroxide. RSC Adv. 2016, 6, 33636–33642. [Google Scholar] [CrossRef]
- Karunanayake, A.G.; Todd, O.A.; Crowley, M.L.; Ricchetti, L.B.; Pittman, C.U.; Anderson, R.; Mlsna, T.E. Rapid Removal of Salicylic Acid, 4-Nitroaniline, Benzoic Acid and Phthalic Acid from Wastewater Using Magnetized Fast Pyrolysis Biochar from Waste Douglas Fir. Chem. Eng. J. 2017, 319, 75–88. [Google Scholar] [CrossRef]
- Zhao, L.; Zhu, L.; Lee, H.K. Analysis of Aromatic Amines in Water Samples by Liquid-Liquid-Liquid Microextraction with HollowFibers and High-Performance Liquid Chromatography. J. Chromatogr. A 2002, 963, 239–248. [Google Scholar] [CrossRef]
- Tong, C.; Guo, Y.; Liu, W. Simultaneous Determination of Five Nitroaniline and Dinitroaniline Isomers in Wastewaters by Solid-Phase Extraction and High-Performance Liquid Chromatography with Ultraviolet Detection. Chemosphere 2010, 81, 430–435. [Google Scholar] [CrossRef] [PubMed]
- Yu, Z.; Wang, F.; Lin, X.; Wang, C.; Fu, Y.; Wang, X.; Zhao, Y.; Li, G. Selective Fluorescence Sensors for Detection of Nitroaniline and Metal Ions Based on Ligand-Based Luminescent Metal-Organic Frameworks. J. Solid State Chem. 2015, 232, 96–101. [Google Scholar] [CrossRef]
- Ezugwu, C.I.; Mousavi, B.; Asraf, M.A.; Luo, Z.; Verpoort, F. Post-Synthetic Modified MOF for Sonogashira Cross-Coupling and Knoevenagel Condensation Reactions. Chem. Eng. J. 2016, 300, 177–184. [Google Scholar] [CrossRef]
- Chen, J.; Yu, C.; Zhao, Y.; Niu, Y.; Zhang, L.; Yu, Y.; Wu, J.; He, J. A Novel Non-Invasive Detection Method for the FGFR3 Gene Mutation in Maternal Plasma for a Fetal Achondroplasia Diagnosis Based on Signal Amplification by Hemin-MOFs/PtNPs. Biosens. Bioelectron. 2017, 91, 892–899. [Google Scholar] [CrossRef] [PubMed]
- Wang, Z.; Zheng, J.; Ni, Y.; Men, W.; Tagami, K.; Uchida, S. High-Performance Method for Determination of Pu Isotopes in Soil and Sediment Samples by Sector Field-Inductively Coupled Plasma Mass Spectrometry. Anal. Chem. 2017, 89, 2221–2226. [Google Scholar] [CrossRef] [PubMed]
- Sun, J.; Dun, K.; Song, X.; Gao, Q.; Wu, H.; Ma, J.; Ji, P.; Feng, W. Specific Immobilization of d-amino Acid Oxidase Mimicking Multi-Enzyme Catalysis. Green Chem. 2015, 17, 4465–4472. [Google Scholar] [CrossRef]
- Su, L.; Feng, J.; Zhou, X. Colorimetric Detection of Urine Glucose Based ZnFe2O4 Magnetic Nanoparticles. Anal. Chem. 2012, 84, 5753–5758. [Google Scholar] [CrossRef] [PubMed]
- Gao, Z.; Xu, M.; Li, H. Irregular-Shaped Platinum Nanoparticles as Peroxidase Mimics for Highly Efficient Colorimetric Immunoassay. Anal. Chim. Acta 2013, 776, 79–86. [Google Scholar] [CrossRef] [PubMed]
- He, W.; Liu, Y.; Yuan, J. Au@Pt Nanostructures as Oxidase and Peroxidase Mimetics for Use in Immunoassays. Biomaterials 2011, 32, 1139–1147. [Google Scholar] [CrossRef] [PubMed]
- Siyo, B.; Schneider, M.; Pohl, M.M. Synthesis, Characterization, and Application of PVP-Pd NP in the Aerobic Oxidation of 5-Hydroxymethylfurfural (HMF). Catal. Lett. 2014, 144, 498–506. [Google Scholar] [CrossRef]
- Deshmukh, A.; Bandyopadhyay, S.; James, A.; Patra, A. Trace level detection of nitroanilines using a solution processable fluorescent porous organic polymer. J. Mater. Chem. C 2016, 4, 4427–4433. [Google Scholar] [CrossRef]
Figure 1.
TEM images for CeCP and CeCP@Pt with different loading of Pt. (a) CeCP; (b) CeCP@Pt (5.4%); (c) CeCP@Pt (10%); (d) CeCP@Pt (19.9%); (e) CeCP@Pt (32.6%); (f) CeCP@Pt (52.7%). The numbers in brackets indicate the weight percentage of Pt.
Figure 1.
TEM images for CeCP and CeCP@Pt with different loading of Pt. (a) CeCP; (b) CeCP@Pt (5.4%); (c) CeCP@Pt (10%); (d) CeCP@Pt (19.9%); (e) CeCP@Pt (32.6%); (f) CeCP@Pt (52.7%). The numbers in brackets indicate the weight percentage of Pt.
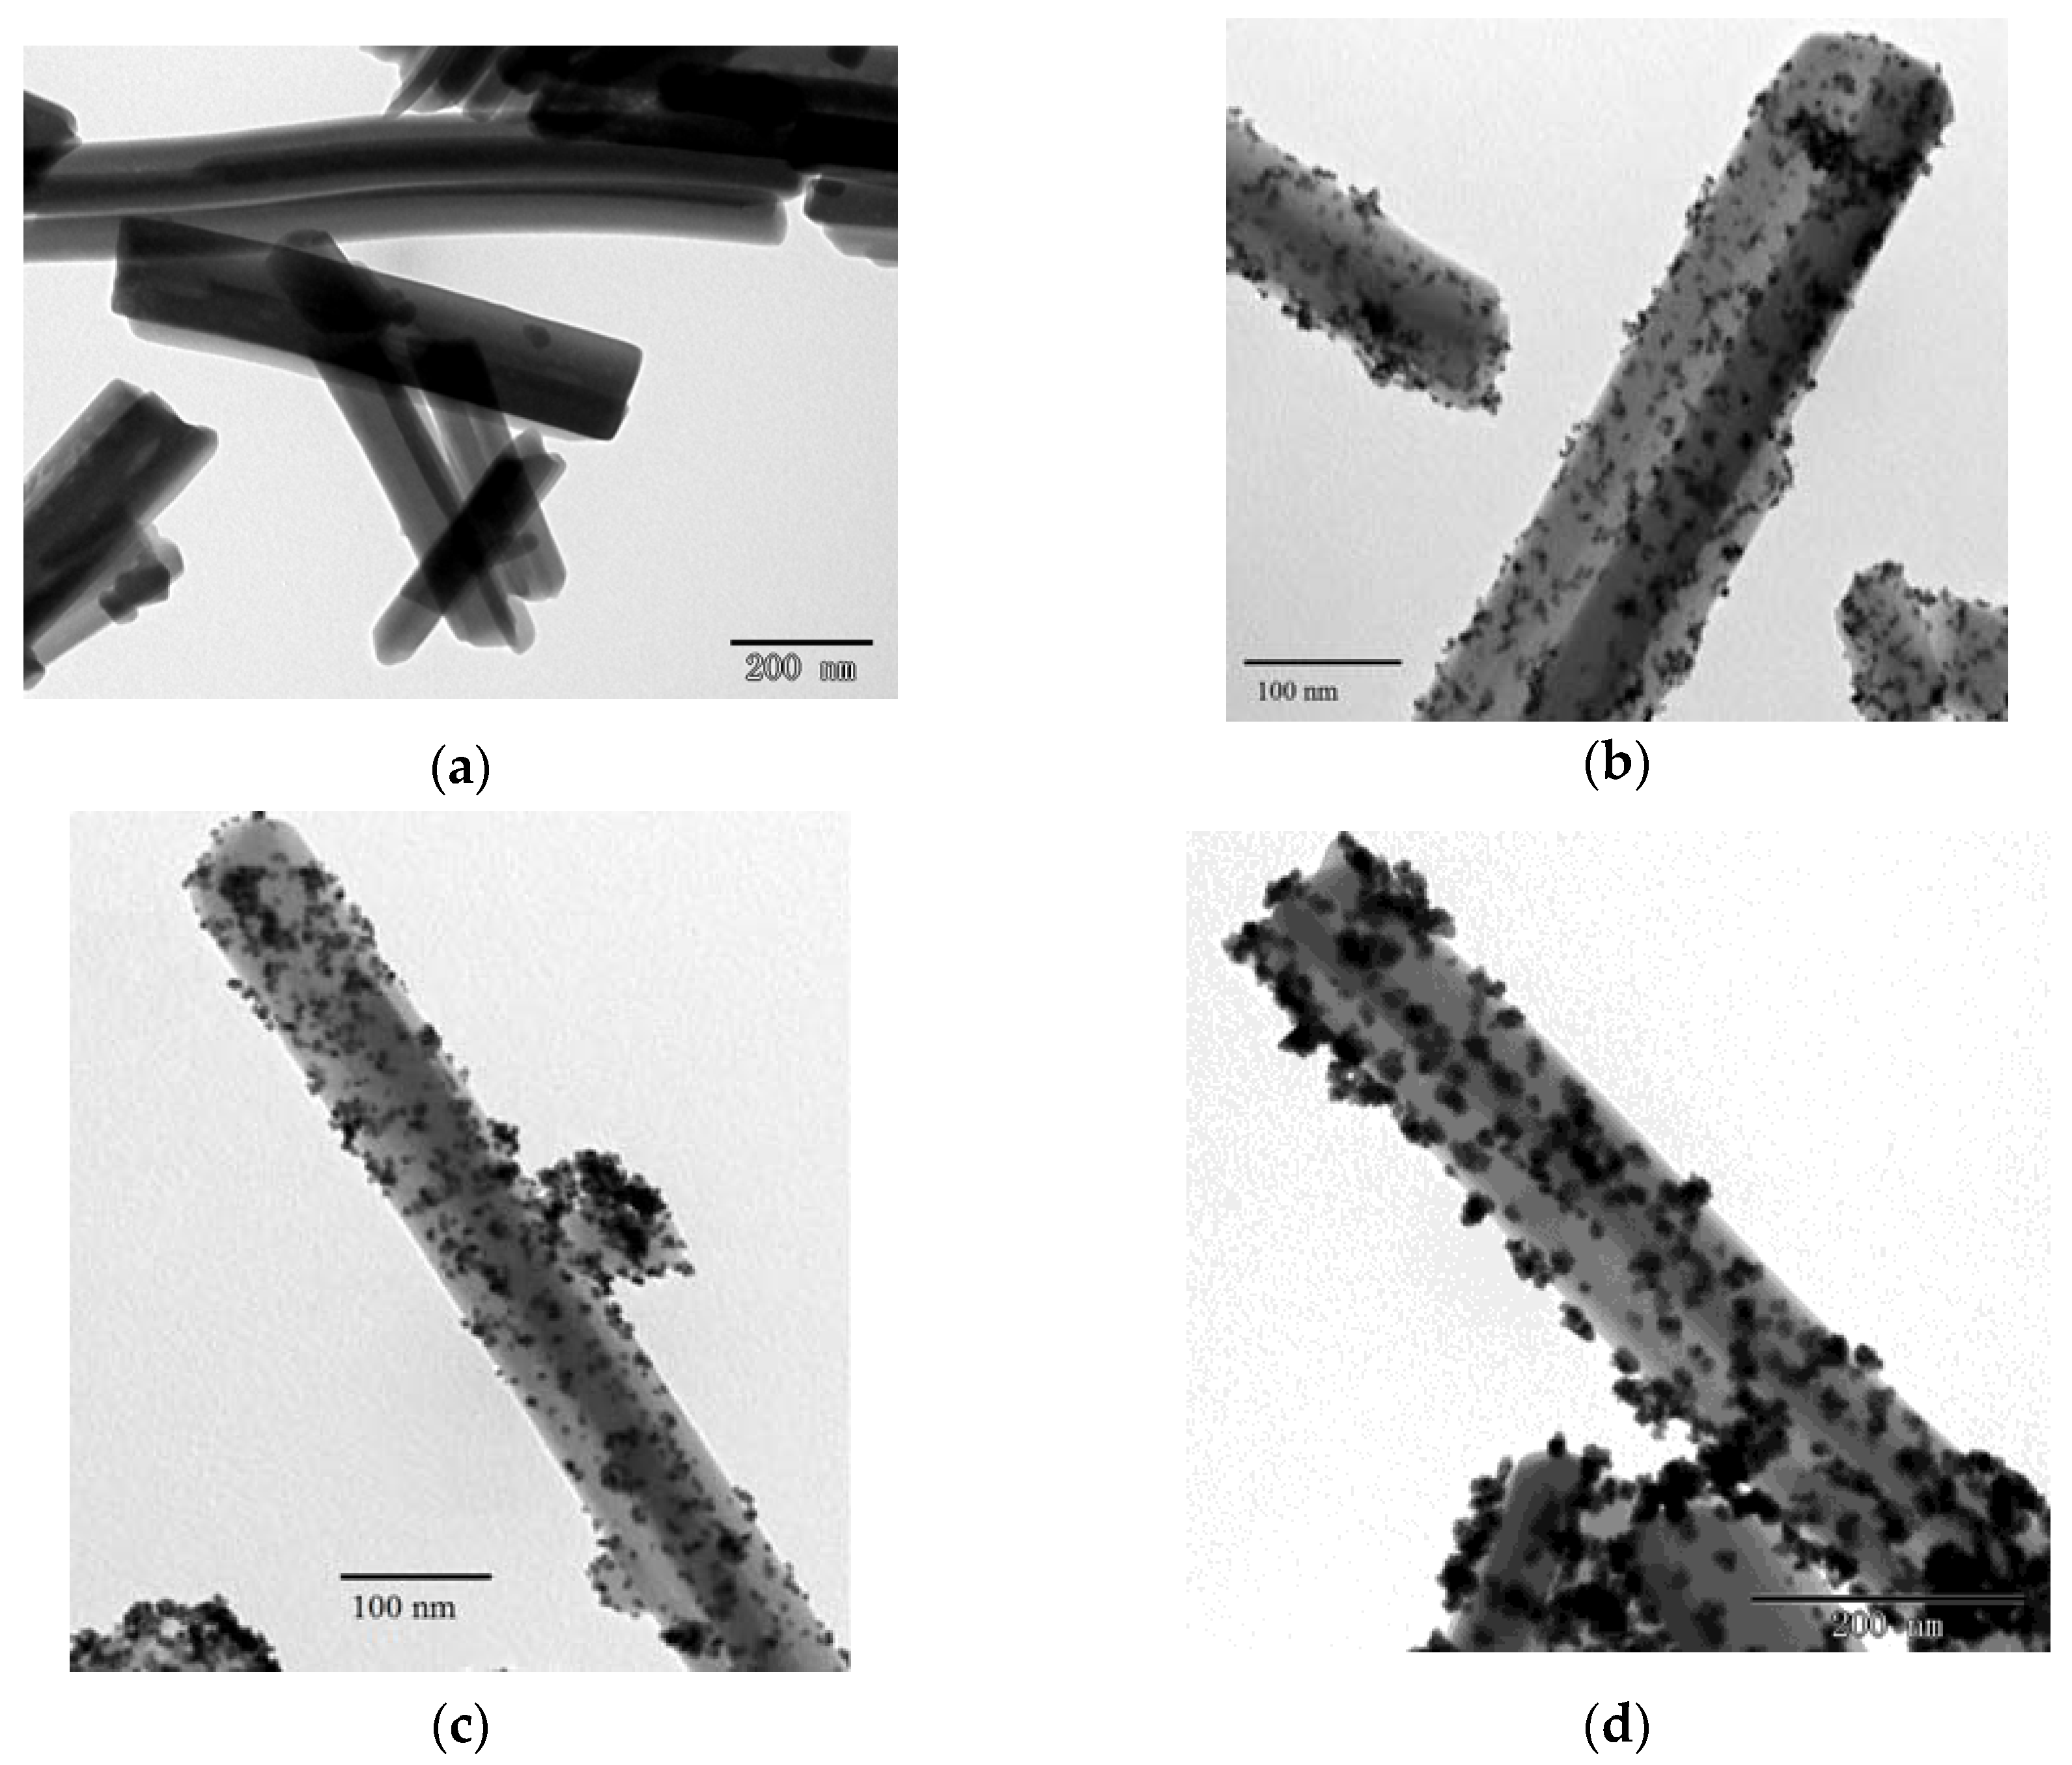
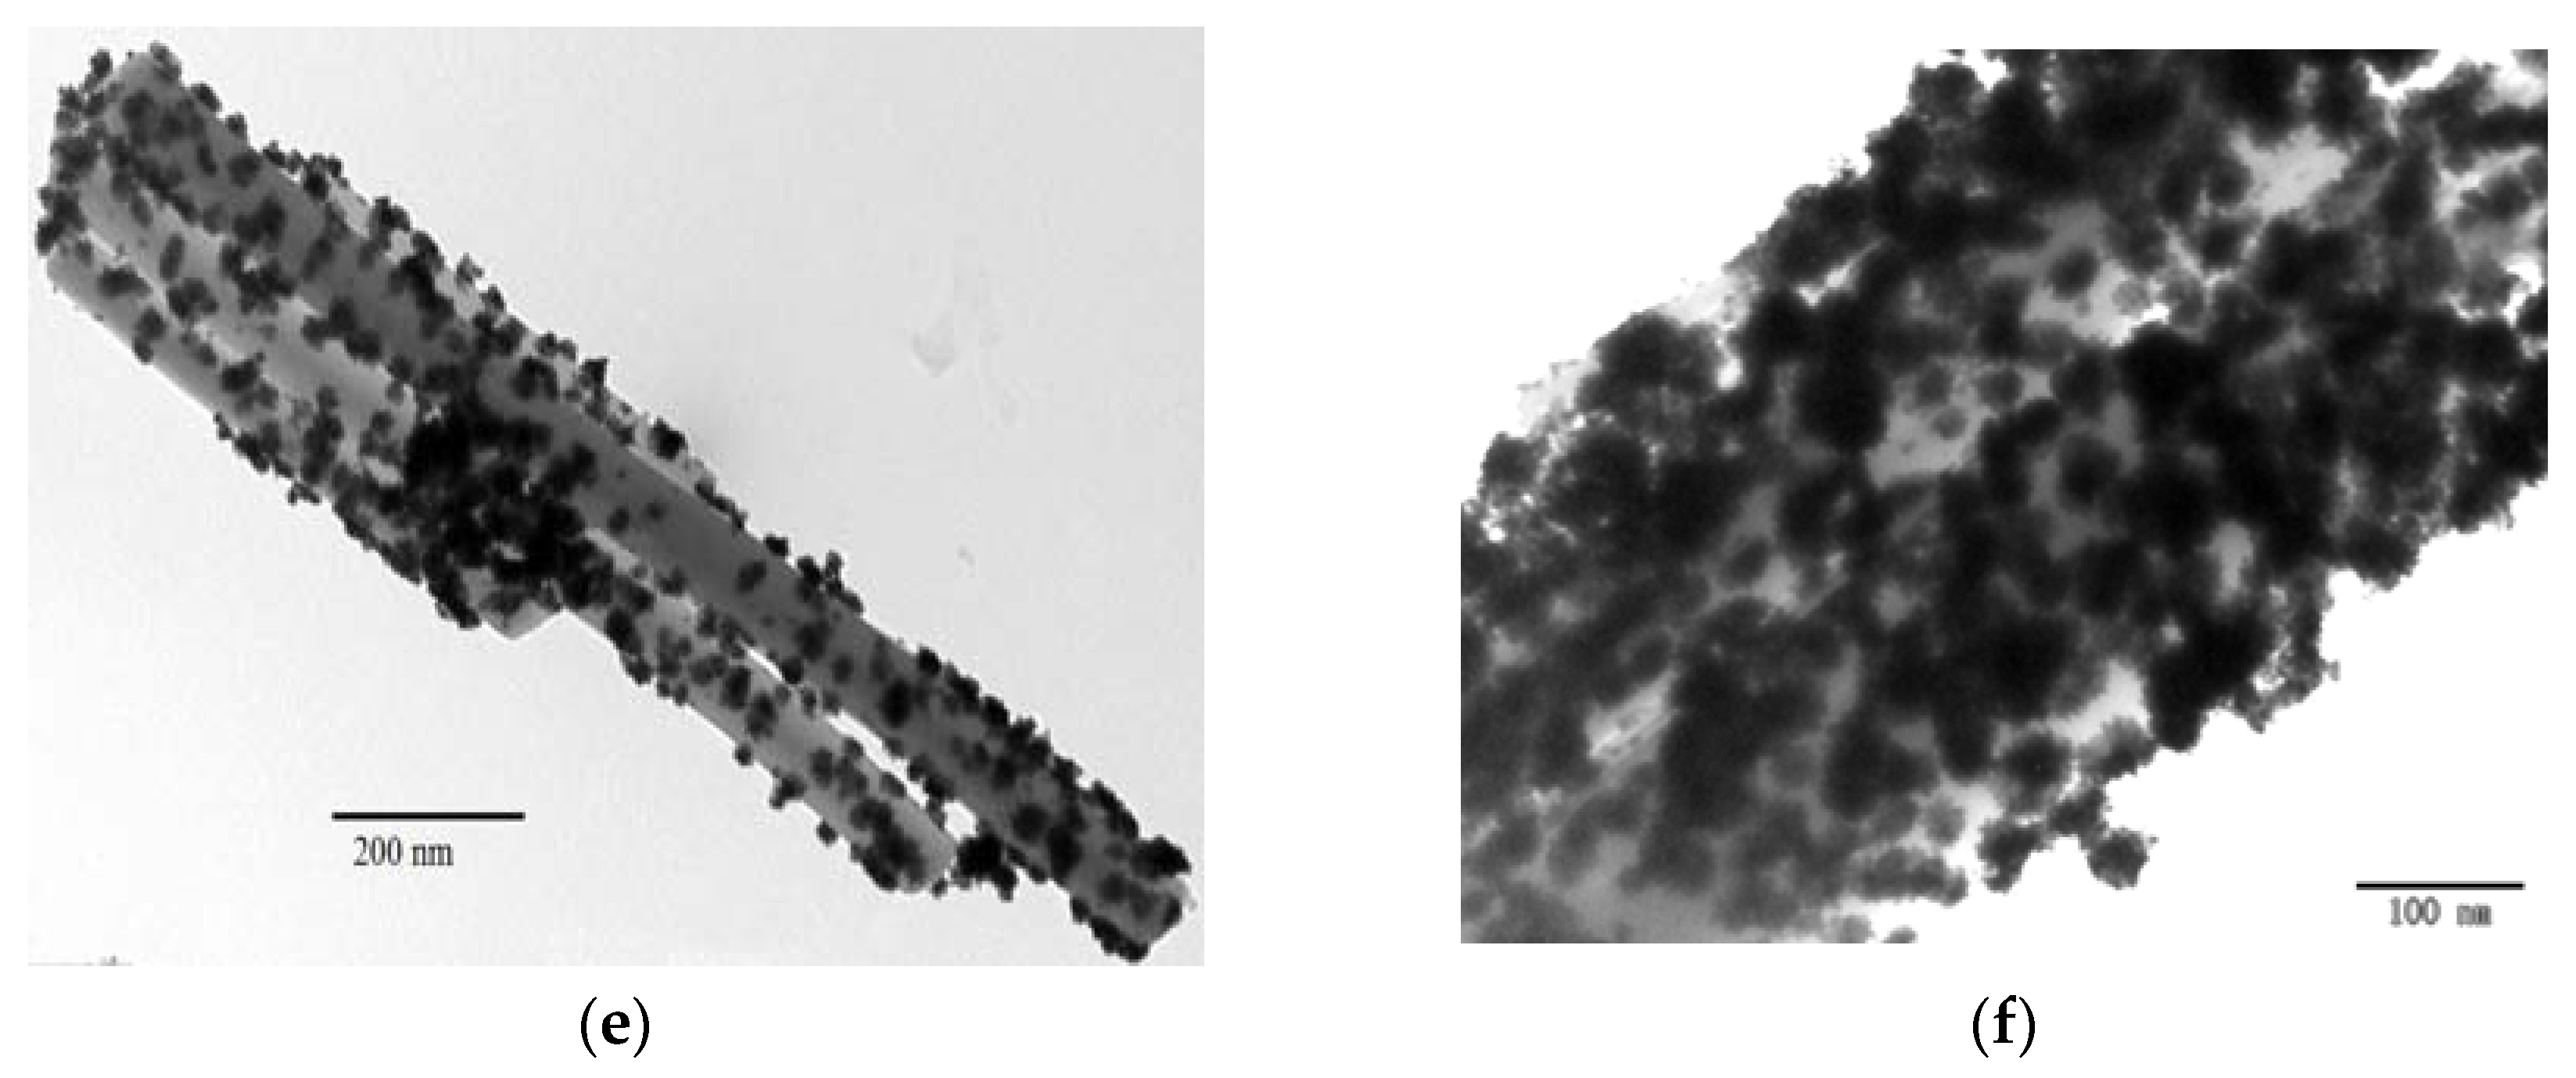
Figure 2.
Pt particle size distribution of various samples. (a) CeCP@Pt (5.4%); (b) CeCP@Pt (10%); (c) CeCP@Pt (19.9%); (d) CeCP@Pt (32.6%); (e) CeCP@Pt (52.7%). The numbers in brackets indicate the weight percentage of Pt.
Figure 2.
Pt particle size distribution of various samples. (a) CeCP@Pt (5.4%); (b) CeCP@Pt (10%); (c) CeCP@Pt (19.9%); (d) CeCP@Pt (32.6%); (e) CeCP@Pt (52.7%). The numbers in brackets indicate the weight percentage of Pt.
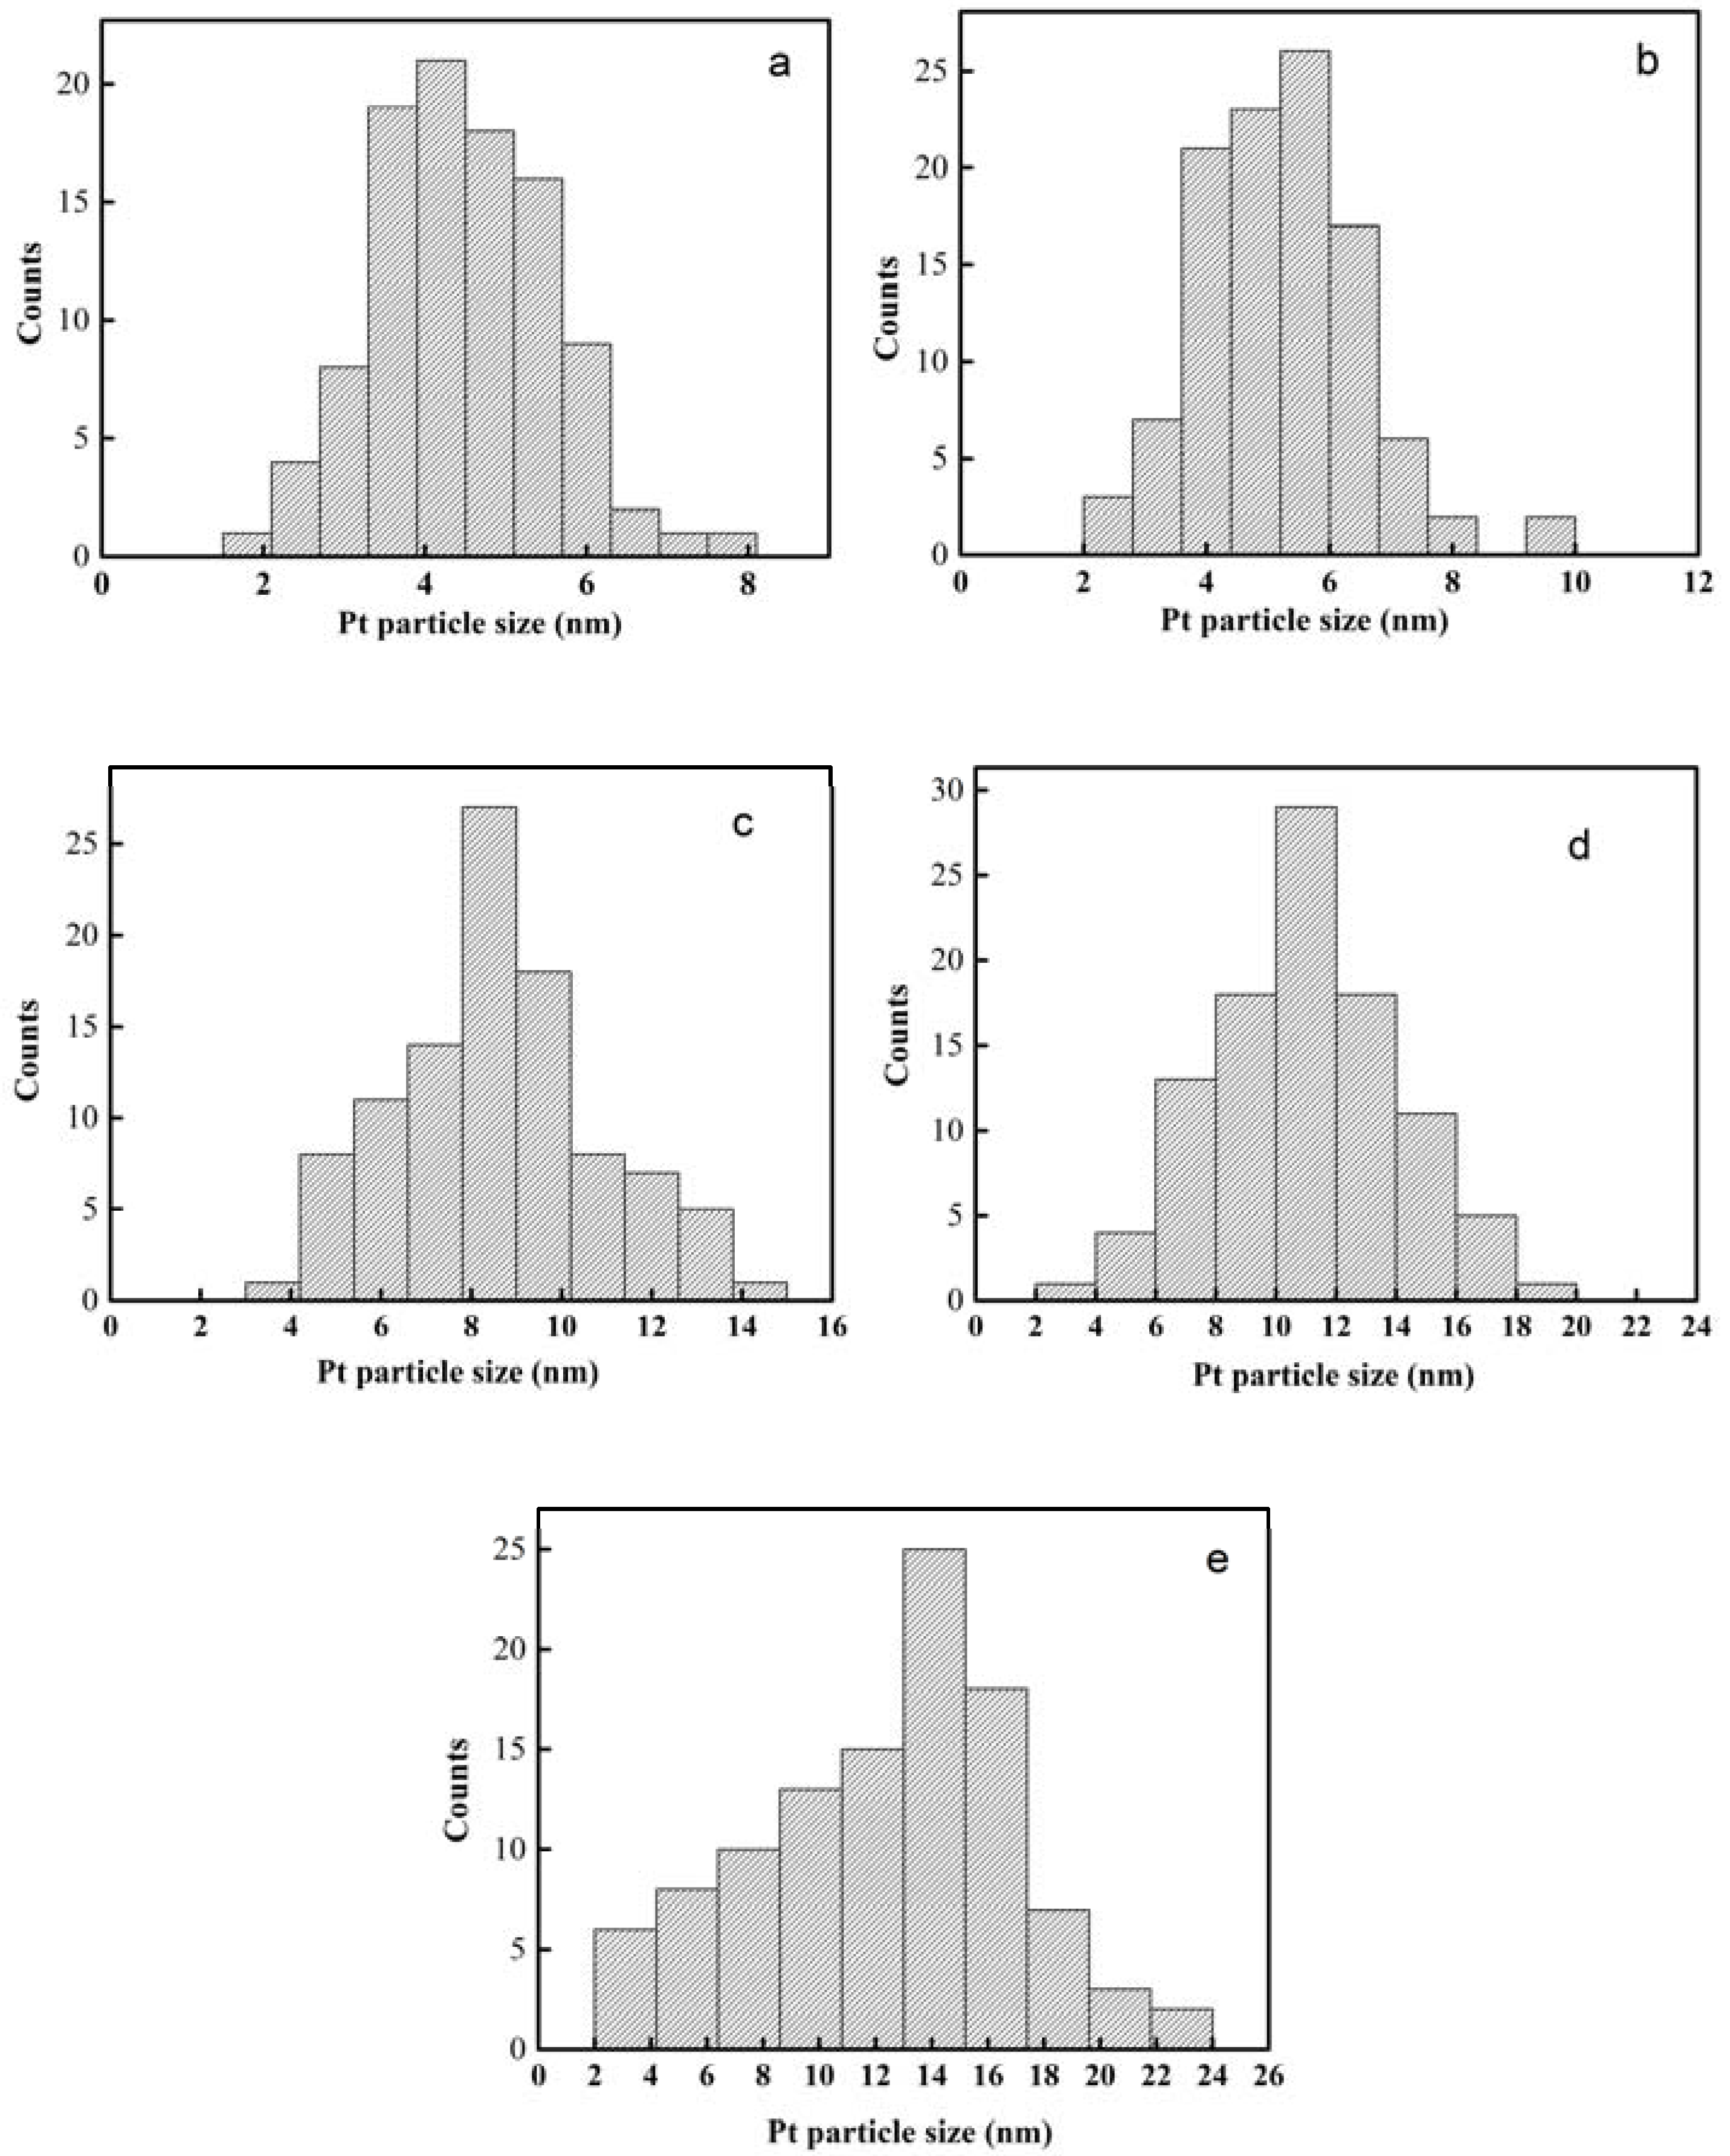
Figure 3.
EDS spectra for CeCP@Pt with different loading of Pt. (a) CeCP; (b) CeCP@Pt (5.4%); (c) CeCP@Pt (10%); (d) CeCP@Pt (19.9%); (e) CeCP@Pt (32.6%); (f) CeCP@Pt (52.7%). The numbers in brackets indicate the weight percentage of Pt.
Figure 3.
EDS spectra for CeCP@Pt with different loading of Pt. (a) CeCP; (b) CeCP@Pt (5.4%); (c) CeCP@Pt (10%); (d) CeCP@Pt (19.9%); (e) CeCP@Pt (32.6%); (f) CeCP@Pt (52.7%). The numbers in brackets indicate the weight percentage of Pt.

Figure 4.
XPS spectra for CeCP@Pt with different loading of Pt. The numbers in brackets indicate the weight percentage of Pt.
Figure 4.
XPS spectra for CeCP@Pt with different loading of Pt. The numbers in brackets indicate the weight percentage of Pt.
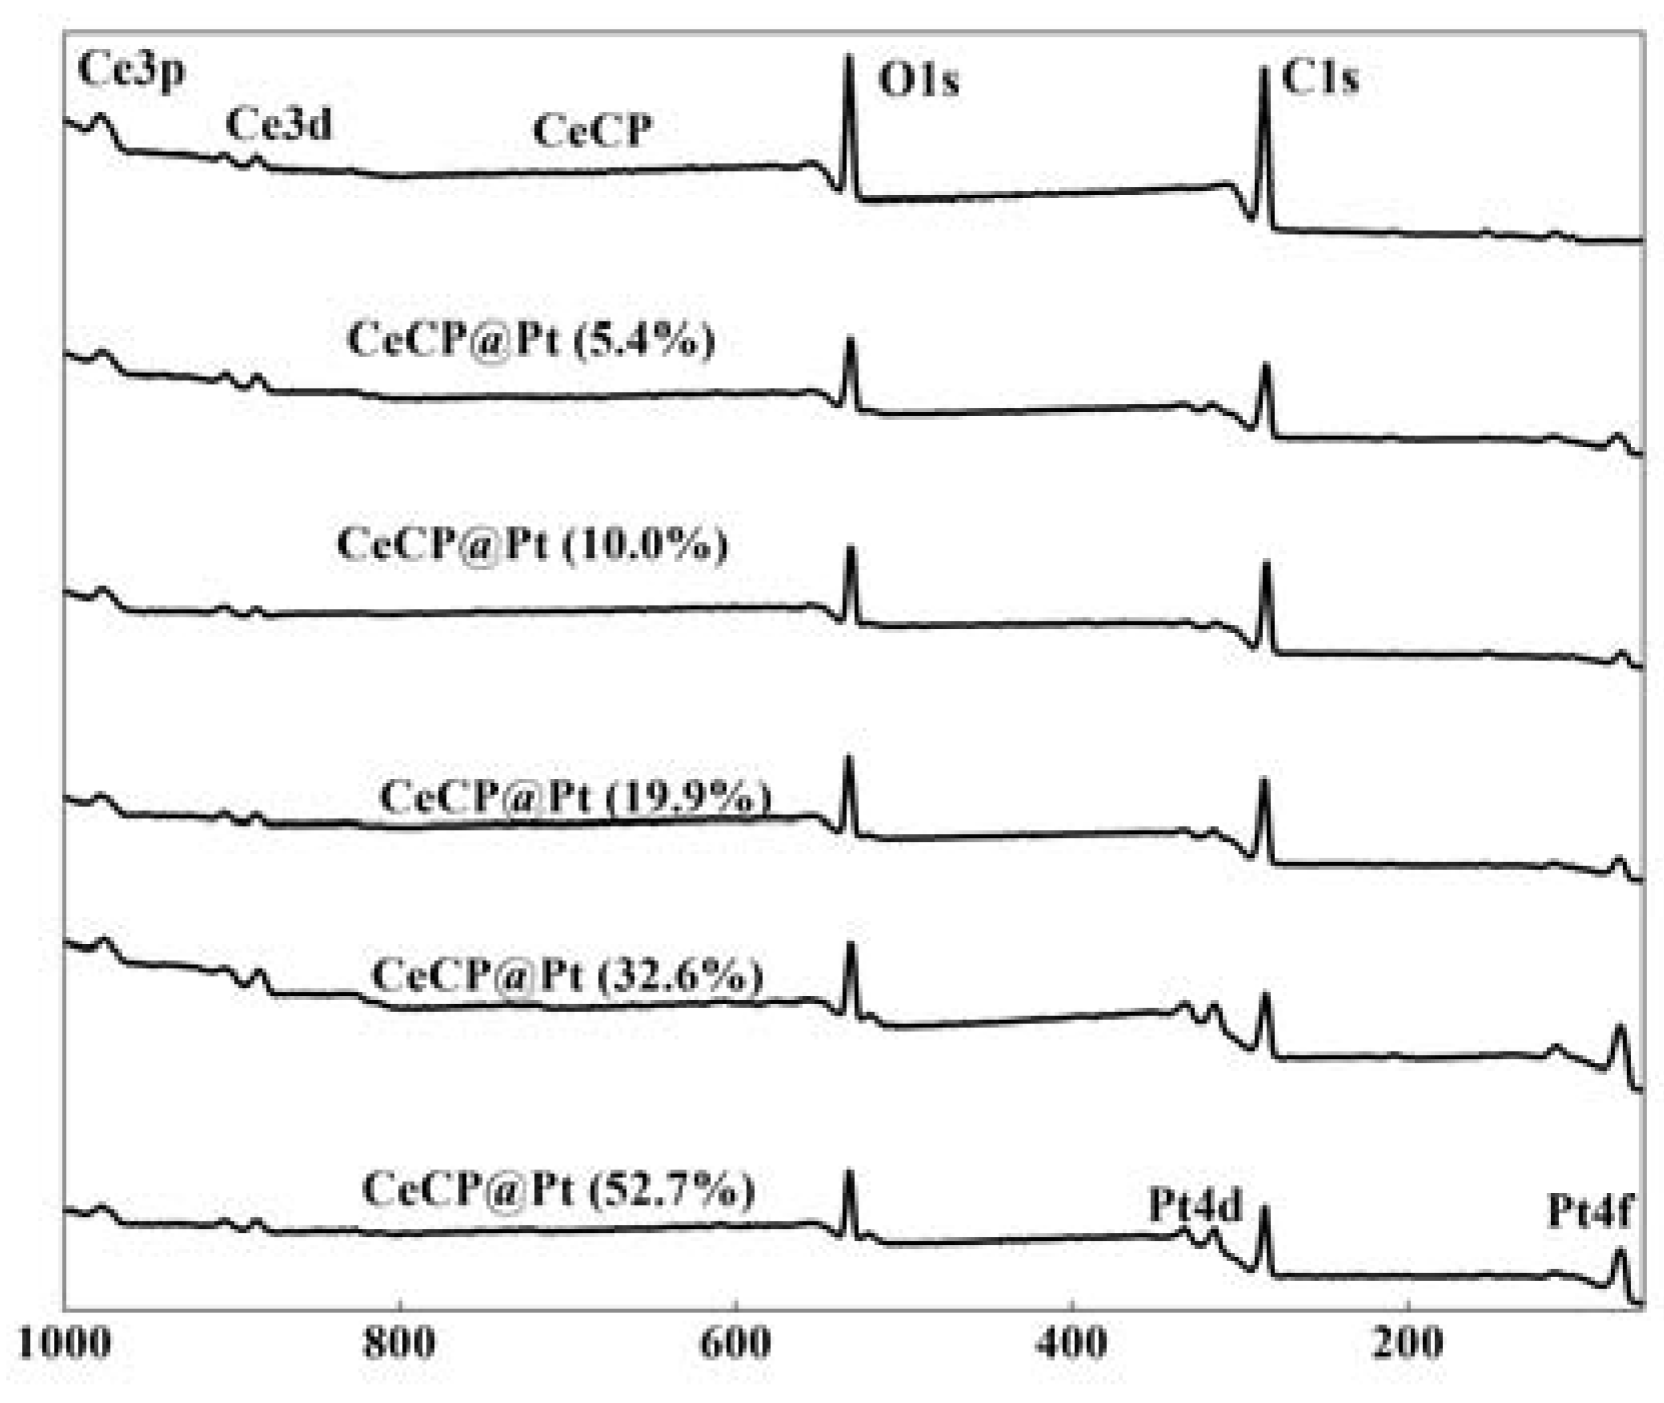
Figure 5.
(a) UV-vis spectra and (b) photographs for various systems. Systems: (A) 200 mM H2O2 + 0.0832 mM TMB + 0.00017 mg/mLCeCP@Pt; (B) 200 mM H2O2 + 0.0832 mM TMB; (C) 200 mM H2O2 + 0.0832 mM TMB + 0.00017 mg/mLCeCP; (D) 0.00017 mg/mL CeCP@Pt + H2O2. All the reactions were carried out in a citrate buffer (pH 4) at room temperature for 8 min.

Figure 6.
Effect of particle size on the peroxidase-like activity of CeCP@Pt. (a) UV-vis spectra; (b) relative activity. Reaction conditions: TMB 0.0832 mM, H2O2 200 mM, citrate buffer (5 mL, pH 4), room temperature. Catalysts: 0.8 μg CeCP@Pt (5.4%), 0.4 μg CeCP@Pt (10%), 0.2 μg CeCP@Pt (19.9%), 0.15 μg CeCP@Pt (32.6%), 0.8 μg CeCP@Pt (52.7%).
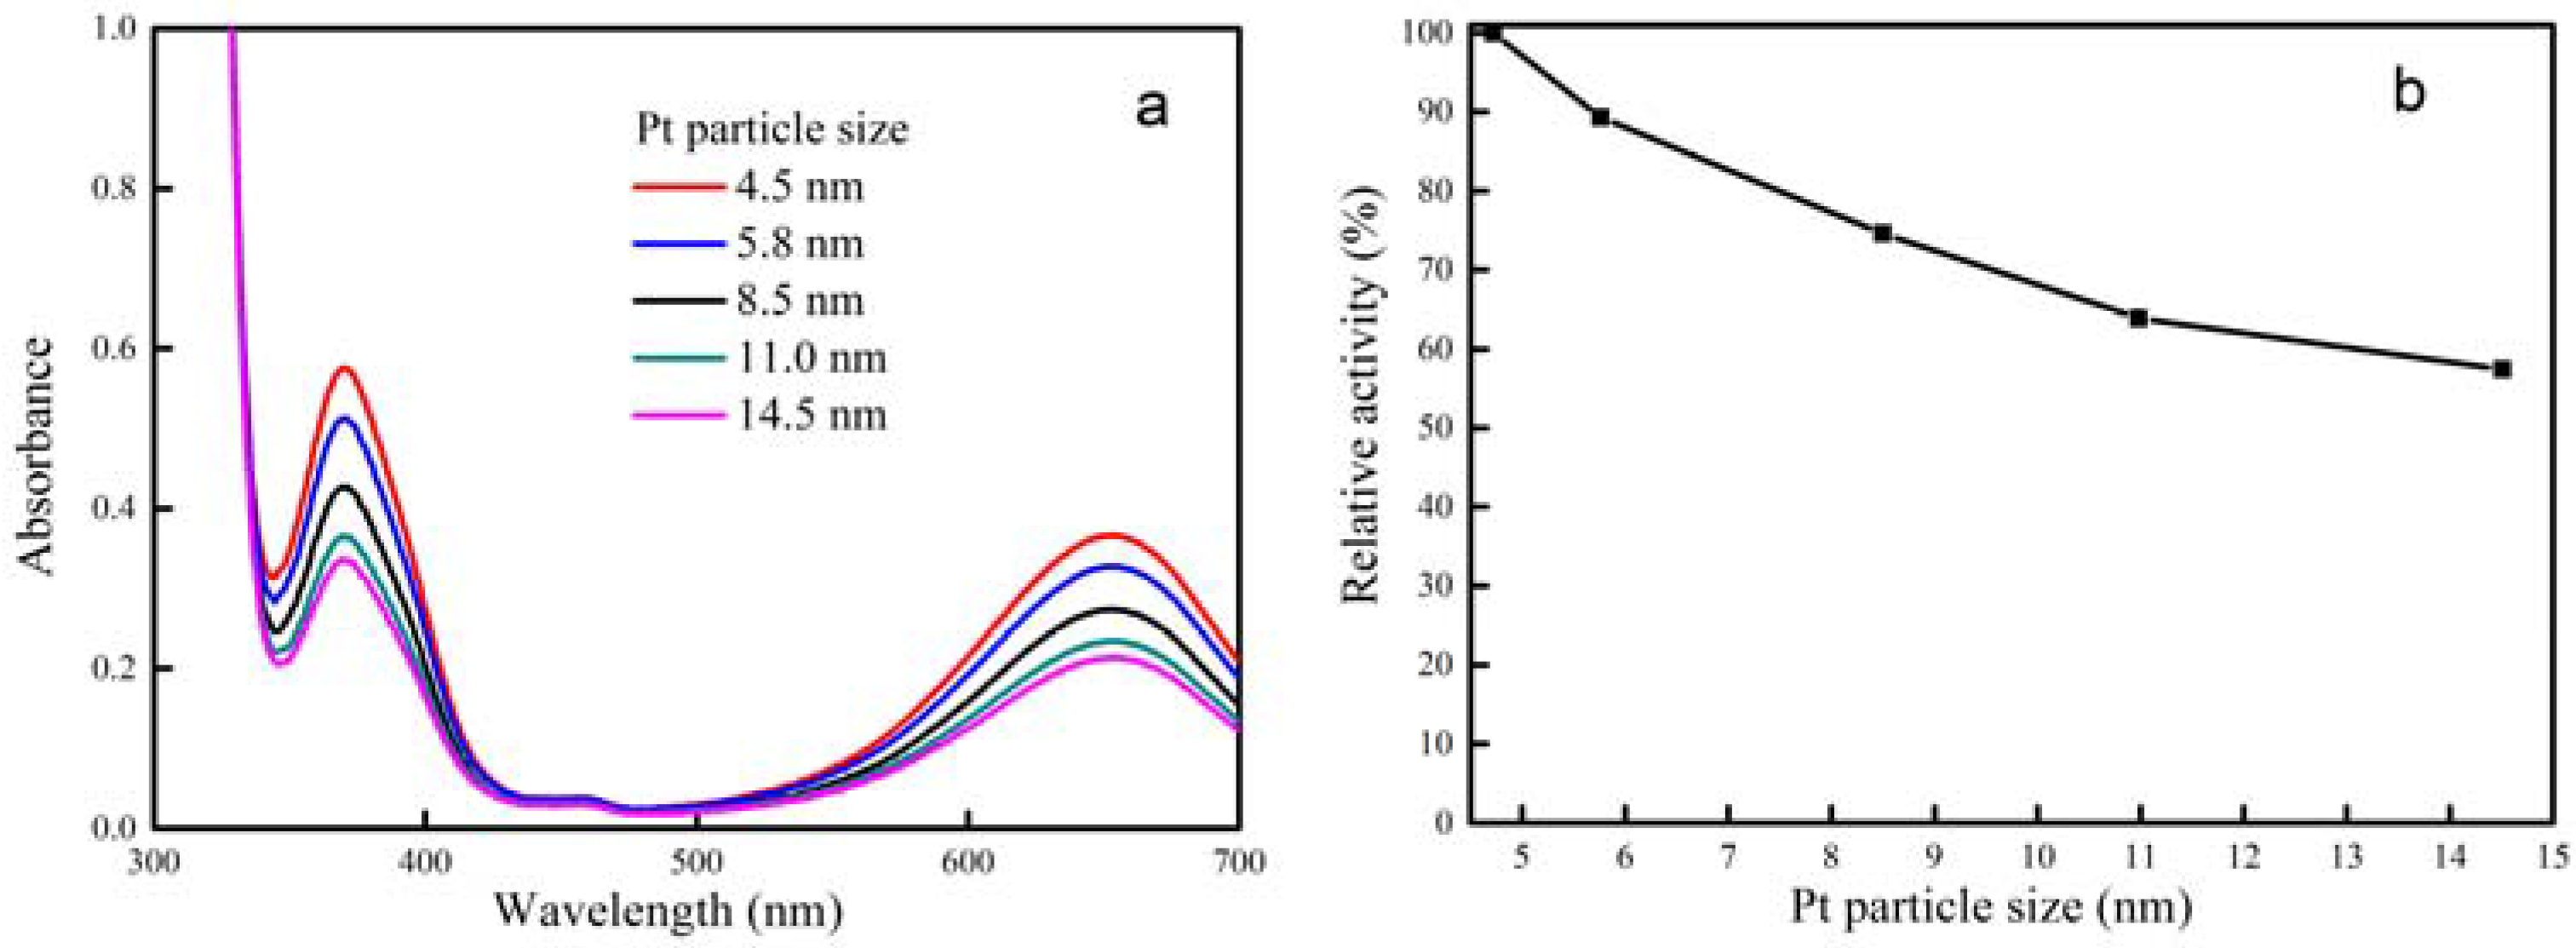
Figure 7.
Effect of pH condition on the peroxidase-like activity of CeCP@Pt. (a) UV-vis spectra; (b) relative activity. Reaction conditions: TMB 0.832 mM, H2O2 800 mM, citrate buffer (5 mL), 0.8 μg CeCP@Pt.
Figure 7.
Effect of pH condition on the peroxidase-like activity of CeCP@Pt. (a) UV-vis spectra; (b) relative activity. Reaction conditions: TMB 0.832 mM, H2O2 800 mM, citrate buffer (5 mL), 0.8 μg CeCP@Pt.

Figure 8.
(a) UV-vis spectra of system of CeCP@Pt + TMB + H2O2 at different temperatures. (b) Relative activity at different temperatures; Reaction conditions: TMB 0.832 mM, H2O2 800 mM, citrate buffer (pH 4, 5 mL), 0.8 μg CeCP@Pt.
Figure 8.
(a) UV-vis spectra of system of CeCP@Pt + TMB + H2O2 at different temperatures. (b) Relative activity at different temperatures; Reaction conditions: TMB 0.832 mM, H2O2 800 mM, citrate buffer (pH 4, 5 mL), 0.8 μg CeCP@Pt.
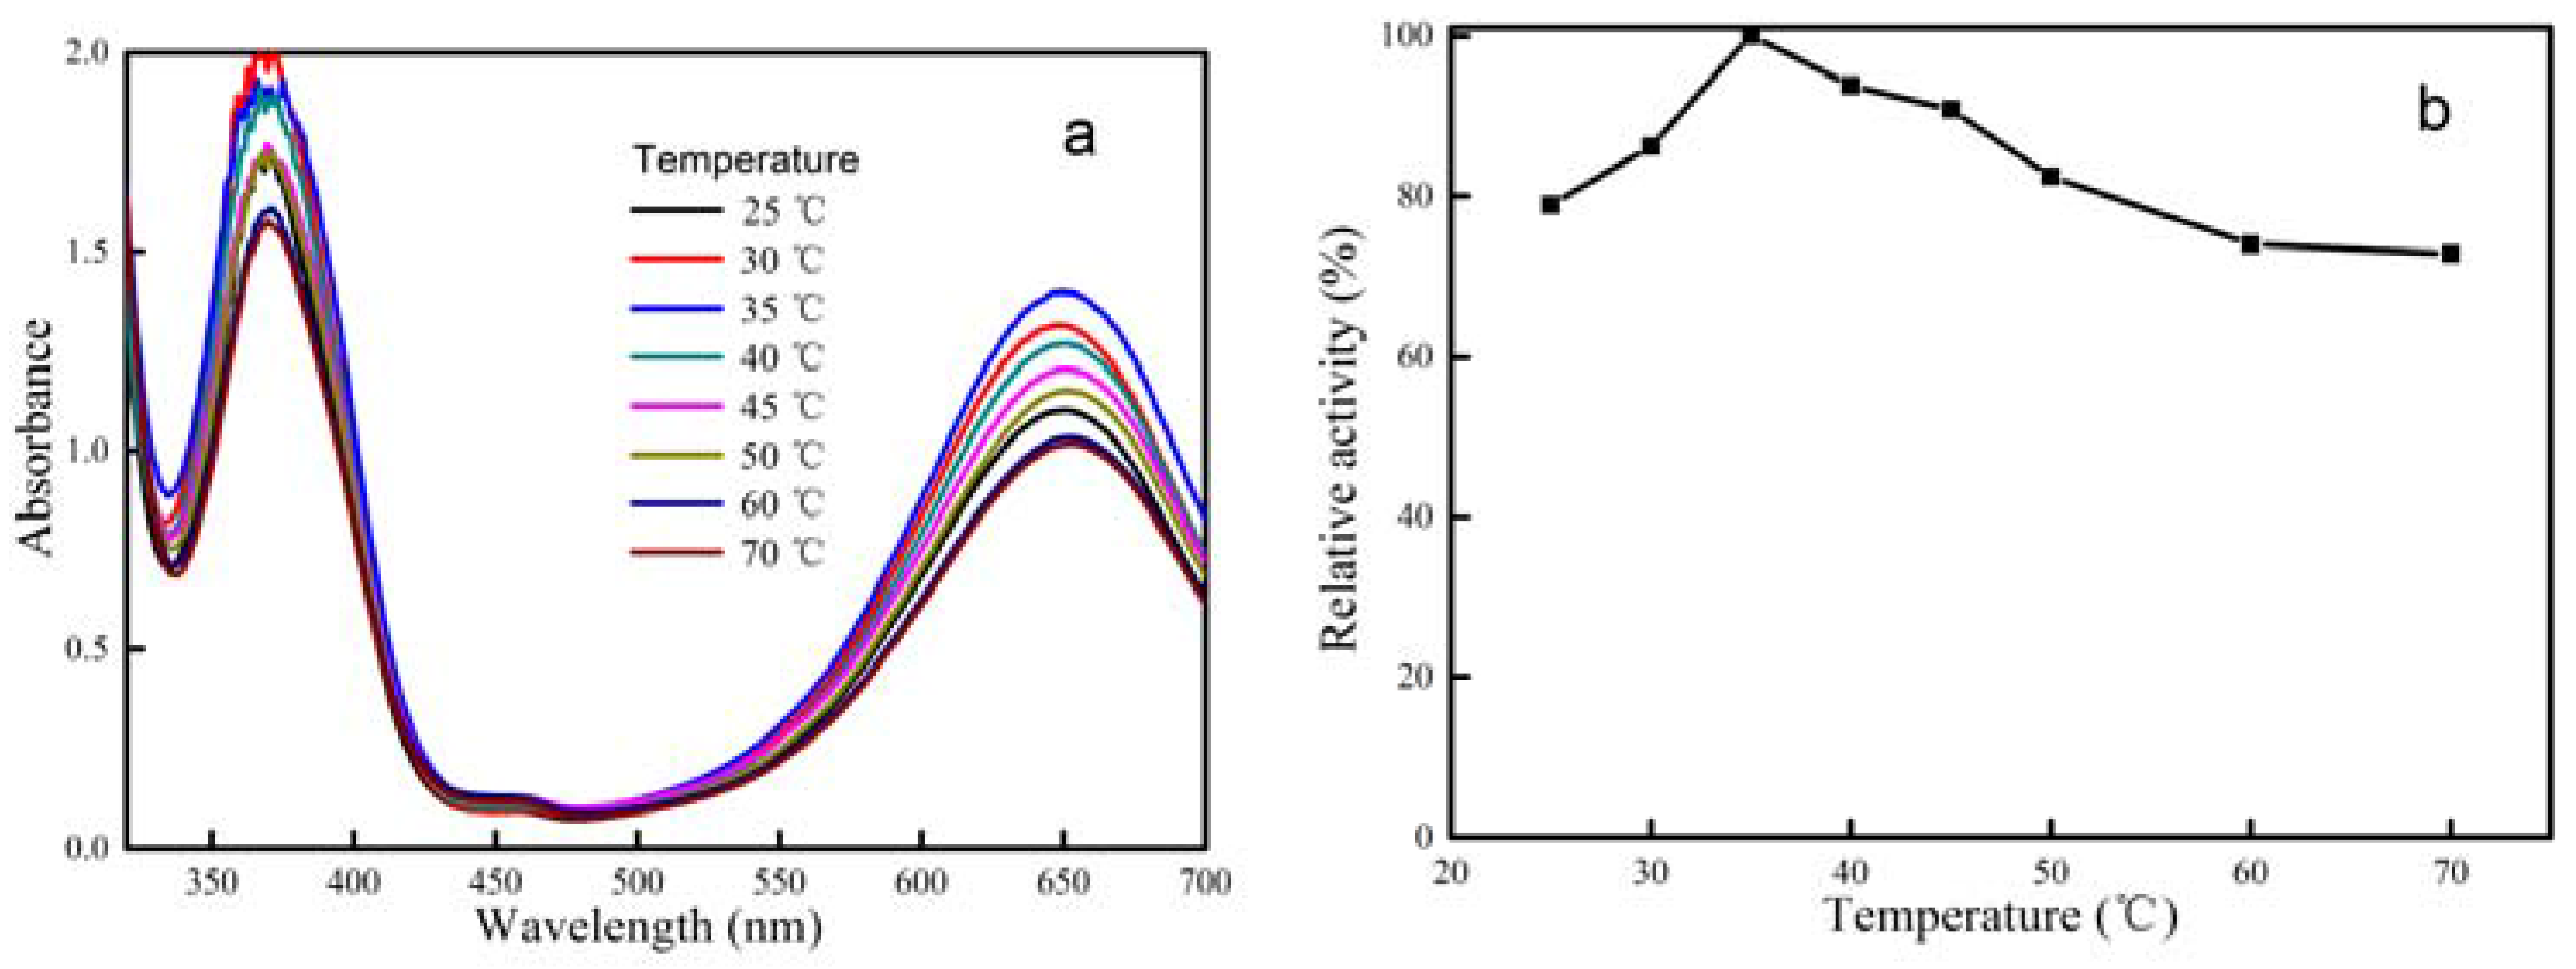
Figure 9.
Effect of the concentration of H2O2 on the peroxidase-like activity of CeCP@Pt. (a) UV-vis spectra; (b) relative activity. Reaction conditions: TMB 0.832 mM, citrate buffer (5 mL, pH 4), 0.8 μg CeCP@Pt.
Figure 9.
Effect of the concentration of H2O2 on the peroxidase-like activity of CeCP@Pt. (a) UV-vis spectra; (b) relative activity. Reaction conditions: TMB 0.832 mM, citrate buffer (5 mL, pH 4), 0.8 μg CeCP@Pt.
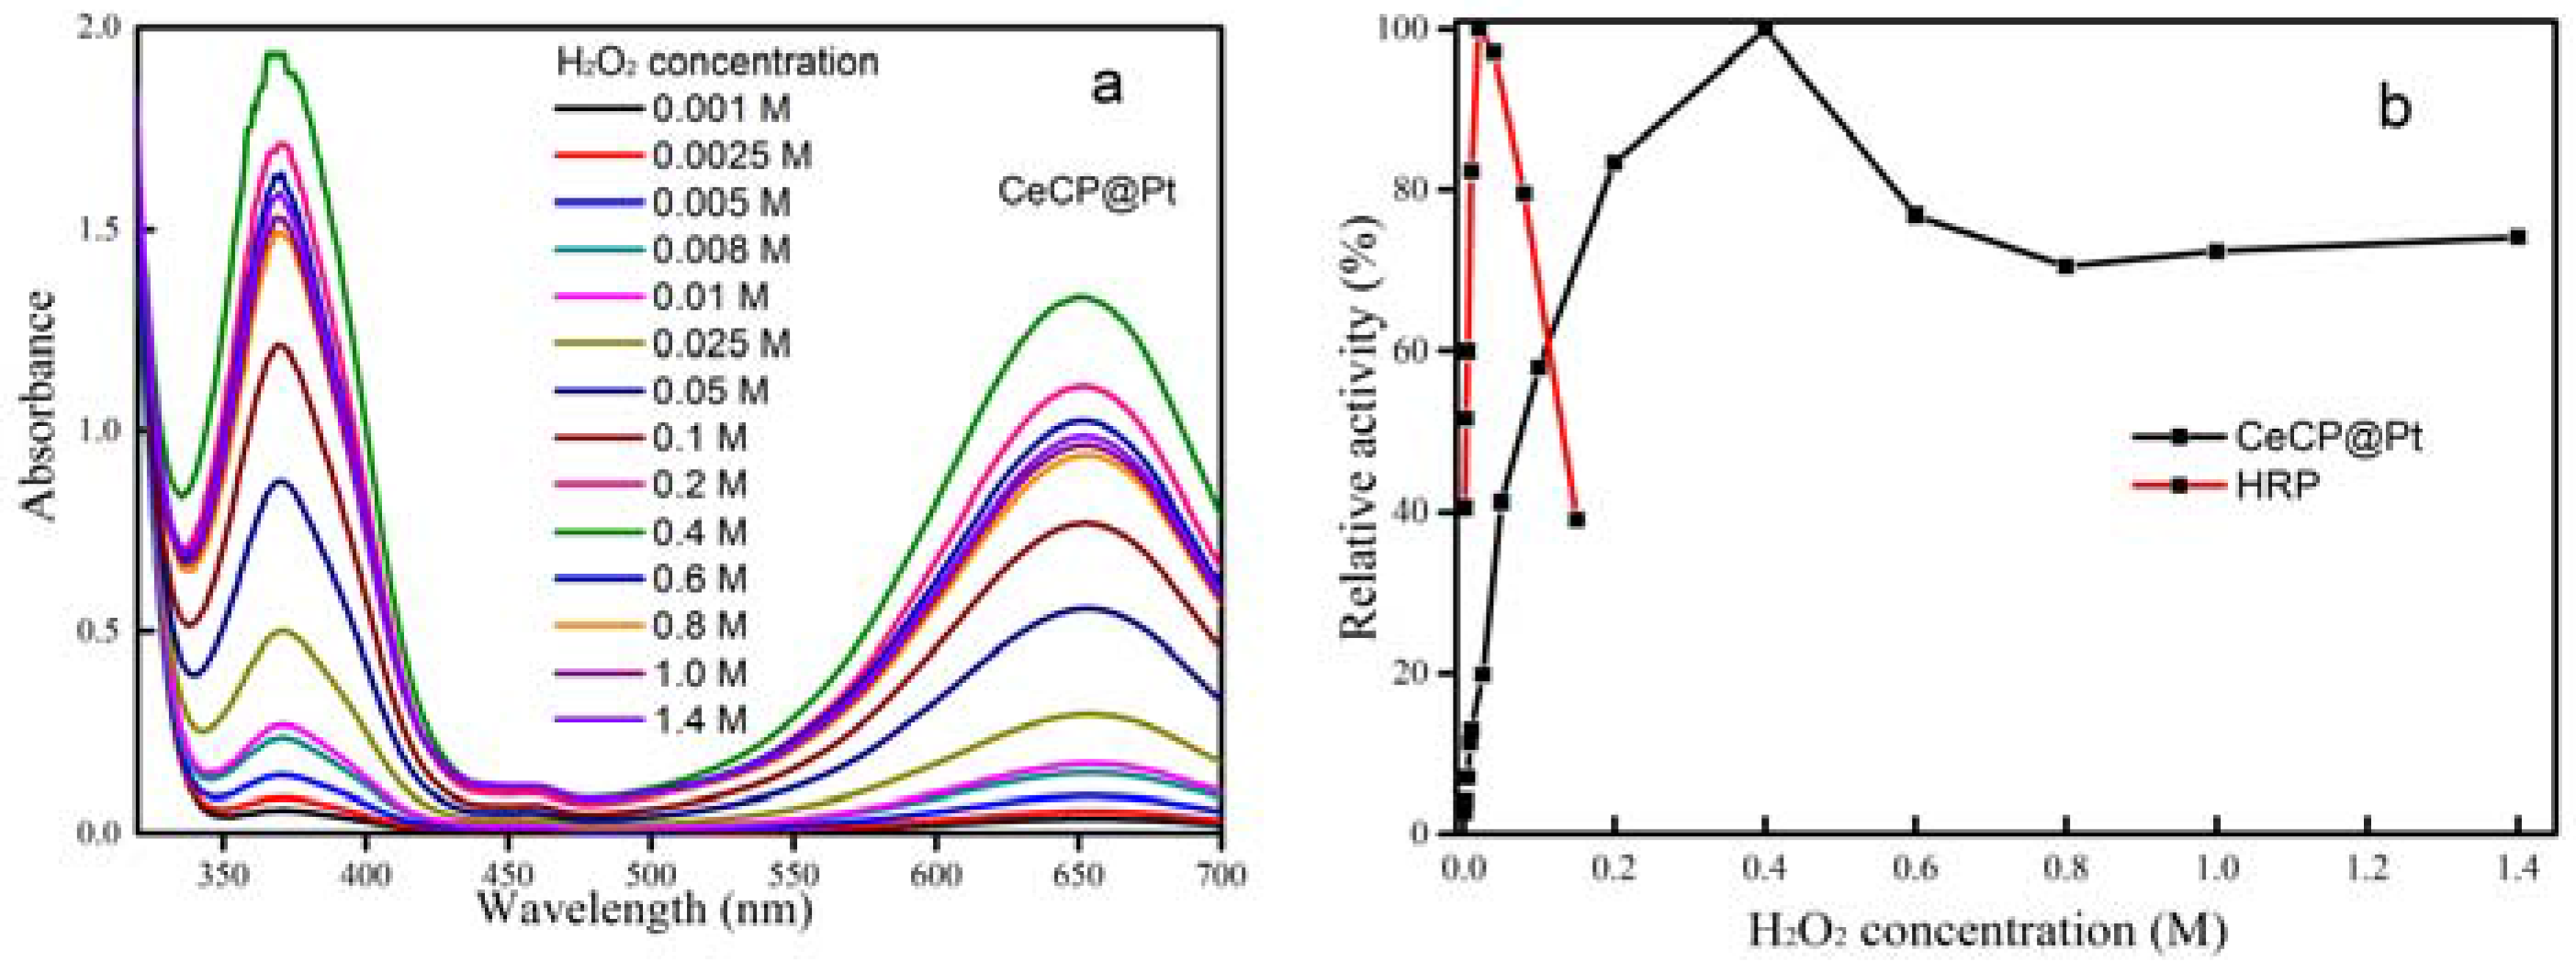
Figure 10.
Steady-state kinetic assays of CeCP@Pt. Michaelis–Menten plots for the TMB substrate (a) and for the H2O2 substrate (b). Reaction conditions: (a) H2O2 800 mM, citrate buffer (5 mL, pH 4), 0.8 μg CeCP@Pt; (b) TMB 0.832 mM, citrate buffer (5 mL, pH 4), 0.8 μg CeCP@Pt.
Figure 10.
Steady-state kinetic assays of CeCP@Pt. Michaelis–Menten plots for the TMB substrate (a) and for the H2O2 substrate (b). Reaction conditions: (a) H2O2 800 mM, citrate buffer (5 mL, pH 4), 0.8 μg CeCP@Pt; (b) TMB 0.832 mM, citrate buffer (5 mL, pH 4), 0.8 μg CeCP@Pt.

Figure 11.
(a) UV-vis spectra of CeCP@Pt + H2O2 + TMB and CeCP@Pt + H2O2 + TMB + nitroaniline (0.01 mg/mL); (b) Absorption difference versus nitroaniline concentration. Reaction conditions: 0.04 mg CeCP@Pt, 0.832 mM TMB, 20 mM H2O2, pH 4, 35 °C, solution volume 5 mL.
Figure 11.
(a) UV-vis spectra of CeCP@Pt + H2O2 + TMB and CeCP@Pt + H2O2 + TMB + nitroaniline (0.01 mg/mL); (b) Absorption difference versus nitroaniline concentration. Reaction conditions: 0.04 mg CeCP@Pt, 0.832 mM TMB, 20 mM H2O2, pH 4, 35 °C, solution volume 5 mL.

Table 1.
Average size of Pt particles.
| Percentage of Pt Loaded (%) | Average Size of Pt Particle (nm) |
|---|---|
| 5.4 | 4.5 |
| 10 | 5.8 |
| 19.9 | 8.5 |
| 32.6 | 11.0 |
| 52.7 | 14.5 |
Table 2.
Michaelis–Menten kinetics parameters.
| Catalyst | Substrate | Km [mM] | Vmax [Ms−1] | Kcat [s−1] | Refrences |
|---|---|---|---|---|---|
| Au@Pd particles | TMB | 0.17 | 2.00 × 10⁻⁶ | 2.1 × 10⁴ | [6] |
| H2O2 | 1100 | 4.40 × 10⁻⁶ | 4.6 × 10⁴ | [6] | |
| HRP | TMB | 0.434 | 10 × 10−8 | 0.4 × 10⁴ | [25] |
| H2O2 | 3.70 | 8.71 × 10⁻⁸ | 0.348 × 10⁴ | [25] | |
| Fe3O4 particles | TMB | 0.098 | 3.4 × 10⁻⁸ | 3.0 × 10⁴ | [25] |
| H2O2 | 150 | 9.8 × 10⁻⁸ | 8.6 × 10⁴ | [25] | |
| Pt particles | TMB | 1.2 | 1.30 × 10⁻⁶ | 2.3 × 10⁴ | [26] |
| H2O2 | 770 | 1.9 × 10⁻⁶ | 1.6 × 10⁴ | [26] | |
| Pd-Ir cubes | TMB | 0.13 | 6.5 × 10⁻⁸ | 1.90 × 10⁶ | [27] |
| H2O2 | 340 | 5.1 × 10⁻⁸ | 1.50 × 10⁶ | [27] | |
| ZnFe2O4 | TMB | 0.85 | 1.33 × 10⁻⁷ | 4.36 × 10¹⁰ | [28] |
| H2O2 | 1.66 | 7.74 × 10⁻⁸ | 2.54 × 10¹⁰ | [28] | |
| CeCP@Pt | TMB | 0.4585 | 7.71 × 10⁻⁶ | 1.19 × 10⁹ | This work |
| H2O2 | 92.7 | 9.69 × 10⁻⁶ | 0.947 × 10⁹ | This work |
© 2017 by the authors. Licensee MDPI, Basel, Switzerland. This article is an open access article distributed under the terms and conditions of the Creative Commons Attribution (CC BY) license (http://creativecommons.org/licenses/by/4.0/).
Share and Cite
MDPI and ACS Style
Wang, X.; Zheng, K.; Ji, P. Cerium Coordination Polymer Based Composite Mimicking Peroxidase for Detection of Nitroaniline. Catalysts 2017, 7, 206. https://doi.org/10.3390/catal7070206
AMA Style
Wang X, Zheng K, Ji P. Cerium Coordination Polymer Based Composite Mimicking Peroxidase for Detection of Nitroaniline. Catalysts. 2017; 7(7):206. https://doi.org/10.3390/catal7070206
Chicago/Turabian StyleWang, Xi, Kunkun Zheng, and Peijun Ji. 2017. "Cerium Coordination Polymer Based Composite Mimicking Peroxidase for Detection of Nitroaniline" Catalysts 7, no. 7: 206. https://doi.org/10.3390/catal7070206
Note that from the first issue of 2016, this journal uses article numbers instead of page numbers. See further details here.