
Sulfur-Doped TiO2: Structure and Surface Properties


Department of Chemistry, NIS (Nanostructured Interfaces and Surfaces) Inter-Departmental Centre and INSTM Centro di Riferimento, University of Torino, Via P. Giuria, 7, 10125 Torino, Italy
*
Authors to whom correspondence should be addressed.
Catalysts 2017, 7(7), 214; https://doi.org/10.3390/catal7070214
Submission received: 29 May 2017
/
Revised: 30 June 2017
/
Accepted: 11 July 2017
/
Published: 18 July 2017
(This article belongs to the Special Issue Titanium Dioxide Photocatalysis)
Abstract
:A comprehensive study on the sulfur doping of TiO2, by means of H2S treatment at 673 K, has been performed in order to highlight the role of sulfur in affecting the properties of the system, as compared to the native TiO2. The focus of this study is to find a relationship among the surface, structure, and morphology properties, by means of a detailed chemical and physical characterization of the samples. In particular, transmission electron microscopy images provide a simple tool to have a direct and immediate evidence of the effects of H2S action on the TiO2 particles structure and surface defects. Furthermore, from spectroscopy analyses, the peculiar surface, optical properties, and methylene blue photodegradation test of S-doped TiO2 samples, as compared to pure TiO2, have been investigated and explained by the effects caused by the exchange of S species with O species and by the surface defects induced by the strong H2S treatment.
1. Introduction
Titanium dioxide (TiO2) is widely used for photocatalysis. It has attracted considerable attention because of its characteristics, including optical properties, reactivity and chemical stability, as well as its non-toxicity [1,2]. In particular, TiO2-based photocatalysts have been used for significant applications, such as antibacterial actions [3], medical research [4], drug delivery [5], and self-cleaning fields [6]. Most of all, this material is widely used in the degradation of pollutants in air and water by the decomposition of organic compounds [7,8].
Despite its outstanding photocatalytic properties, TiO2 is only able to absorb a small range of the UV portion of the solar spectrum [9], because of its relatively high band gap. To solve this problem, the most-used strategy is the engineering and shift of the TiO2 band gap to the visible light region, in such a way to enhance its photocatalytic activity. In this regard, the surface modification obtained by anchoring selected species, such as MoS2 or graphene-like systems [10,11], or by the incorporation of metal or non-metal dopants into the TiO2 structure [12], allows one to harvest the visible spectrum or to increase the reactivity in the UV spectrum. It has been found that metals are able to induce a desired band gap shift, but also induces recombination centers, thus reducing the photocatalysis capability in combination with thermal instability [13].
On the other hand, the incorporation of non-metals, including nitrogen, carbon, sulfur, fluorine, or iodine [14,15,16,17,18,19,20,21], possibly as quantum dots [22], was found to be a more efficient way to lower the band gap of TiO2, thus obtaining a photocatalyst with higher activity.
Indeed, sulfur-doped TiO2 has attracted much attention due to the fact that increasing quantities of S can reduce the band gap [23], as well as show a strong absorption in the visible light [24].
Many strategies have been adopted to synthesize S-doped TiO2 nanocatalysts, from the oxidative annealing of TiS2, to catalyzed hydrolysis, hydrothermal and solvothermal synthesis, as well as sol-gel and co-precipitation methods [25,26,27,28]. In this regard, H2S can be used as a precursor to obtain an S-doped TiO2 surface [29].
According to some authors, the mechanism of H2S adsorption on the TiO2 surface is explained with dissociative pathways, causing S to fill the O vacancies to obtain S-doped surfaces [29].
However, the integration mechanism of S in TiO2, from a structural point of view, is still under debate, being to a great extent affected by the synthesis conditions. It has been reported that sulfur could be adsorbed predominantly in the form of SO42− species at the surface of TiO2 nanoparticles [30], or could be embedded within the TiO2 lattice, thus creating S-Ti-O bonds [31].
Therefore, to better understand and describe the properties and then the possible applications of the so-obtained S-doped TiO2, it is fundamental to investigate the nature of the H2S interaction with the TiO2 surface.
Moreover, a further aspect to take into account is the role of H2S as a reactant in catalytic hydro-treatment and Claus reactions [32,33]. It is noteworthy that, nowadays, the emission limits of SOx are becoming very rigorous, because air pollution has become a serious global problem. Oil and gas extraction sites are one of the main sources of H2S emissions, and they are usually removed by means of the well-known Claus process. The reaction occurs via dissociative adsorption of H2S on a metal oxide [34], mainly on Al2O3 but also on TiO2, used as catalyst.
In both processes, H2S was found to modify the surface properties of the metal oxide support catalyst. According to the literature, many theoretical studies concerning H2S reaction and adsorption on TiO2 are known, particularly those on anatase and rutile phases [35,36,37,38,39].
To our knowledge, only a few experimental studies have focused on the effects originated by H2S dosage on TiO2 surface, concerning the relationship among surface, structure, and morphology properties. Our study aims to contribute to these themes, as it reports a quite extensive chemical and physical characterization of the surface properties of S-doped TiO2, obtained after H2S treatment. The samples are investigated by X-ray diffraction (XRD), and high resolution transmission electron microscopy (HRTEM), in addition to Raman, Fourier Transform-Infrared (FTIR) and UV-visible (UV-Vis) spectroscopies. The obtained results are compared to those of pure TiO2.
2. Results and Discussion
2.1. Structure and Morphology by XRD, Raman, and HRTEM Analyses
2.1.1. XRD Analysis
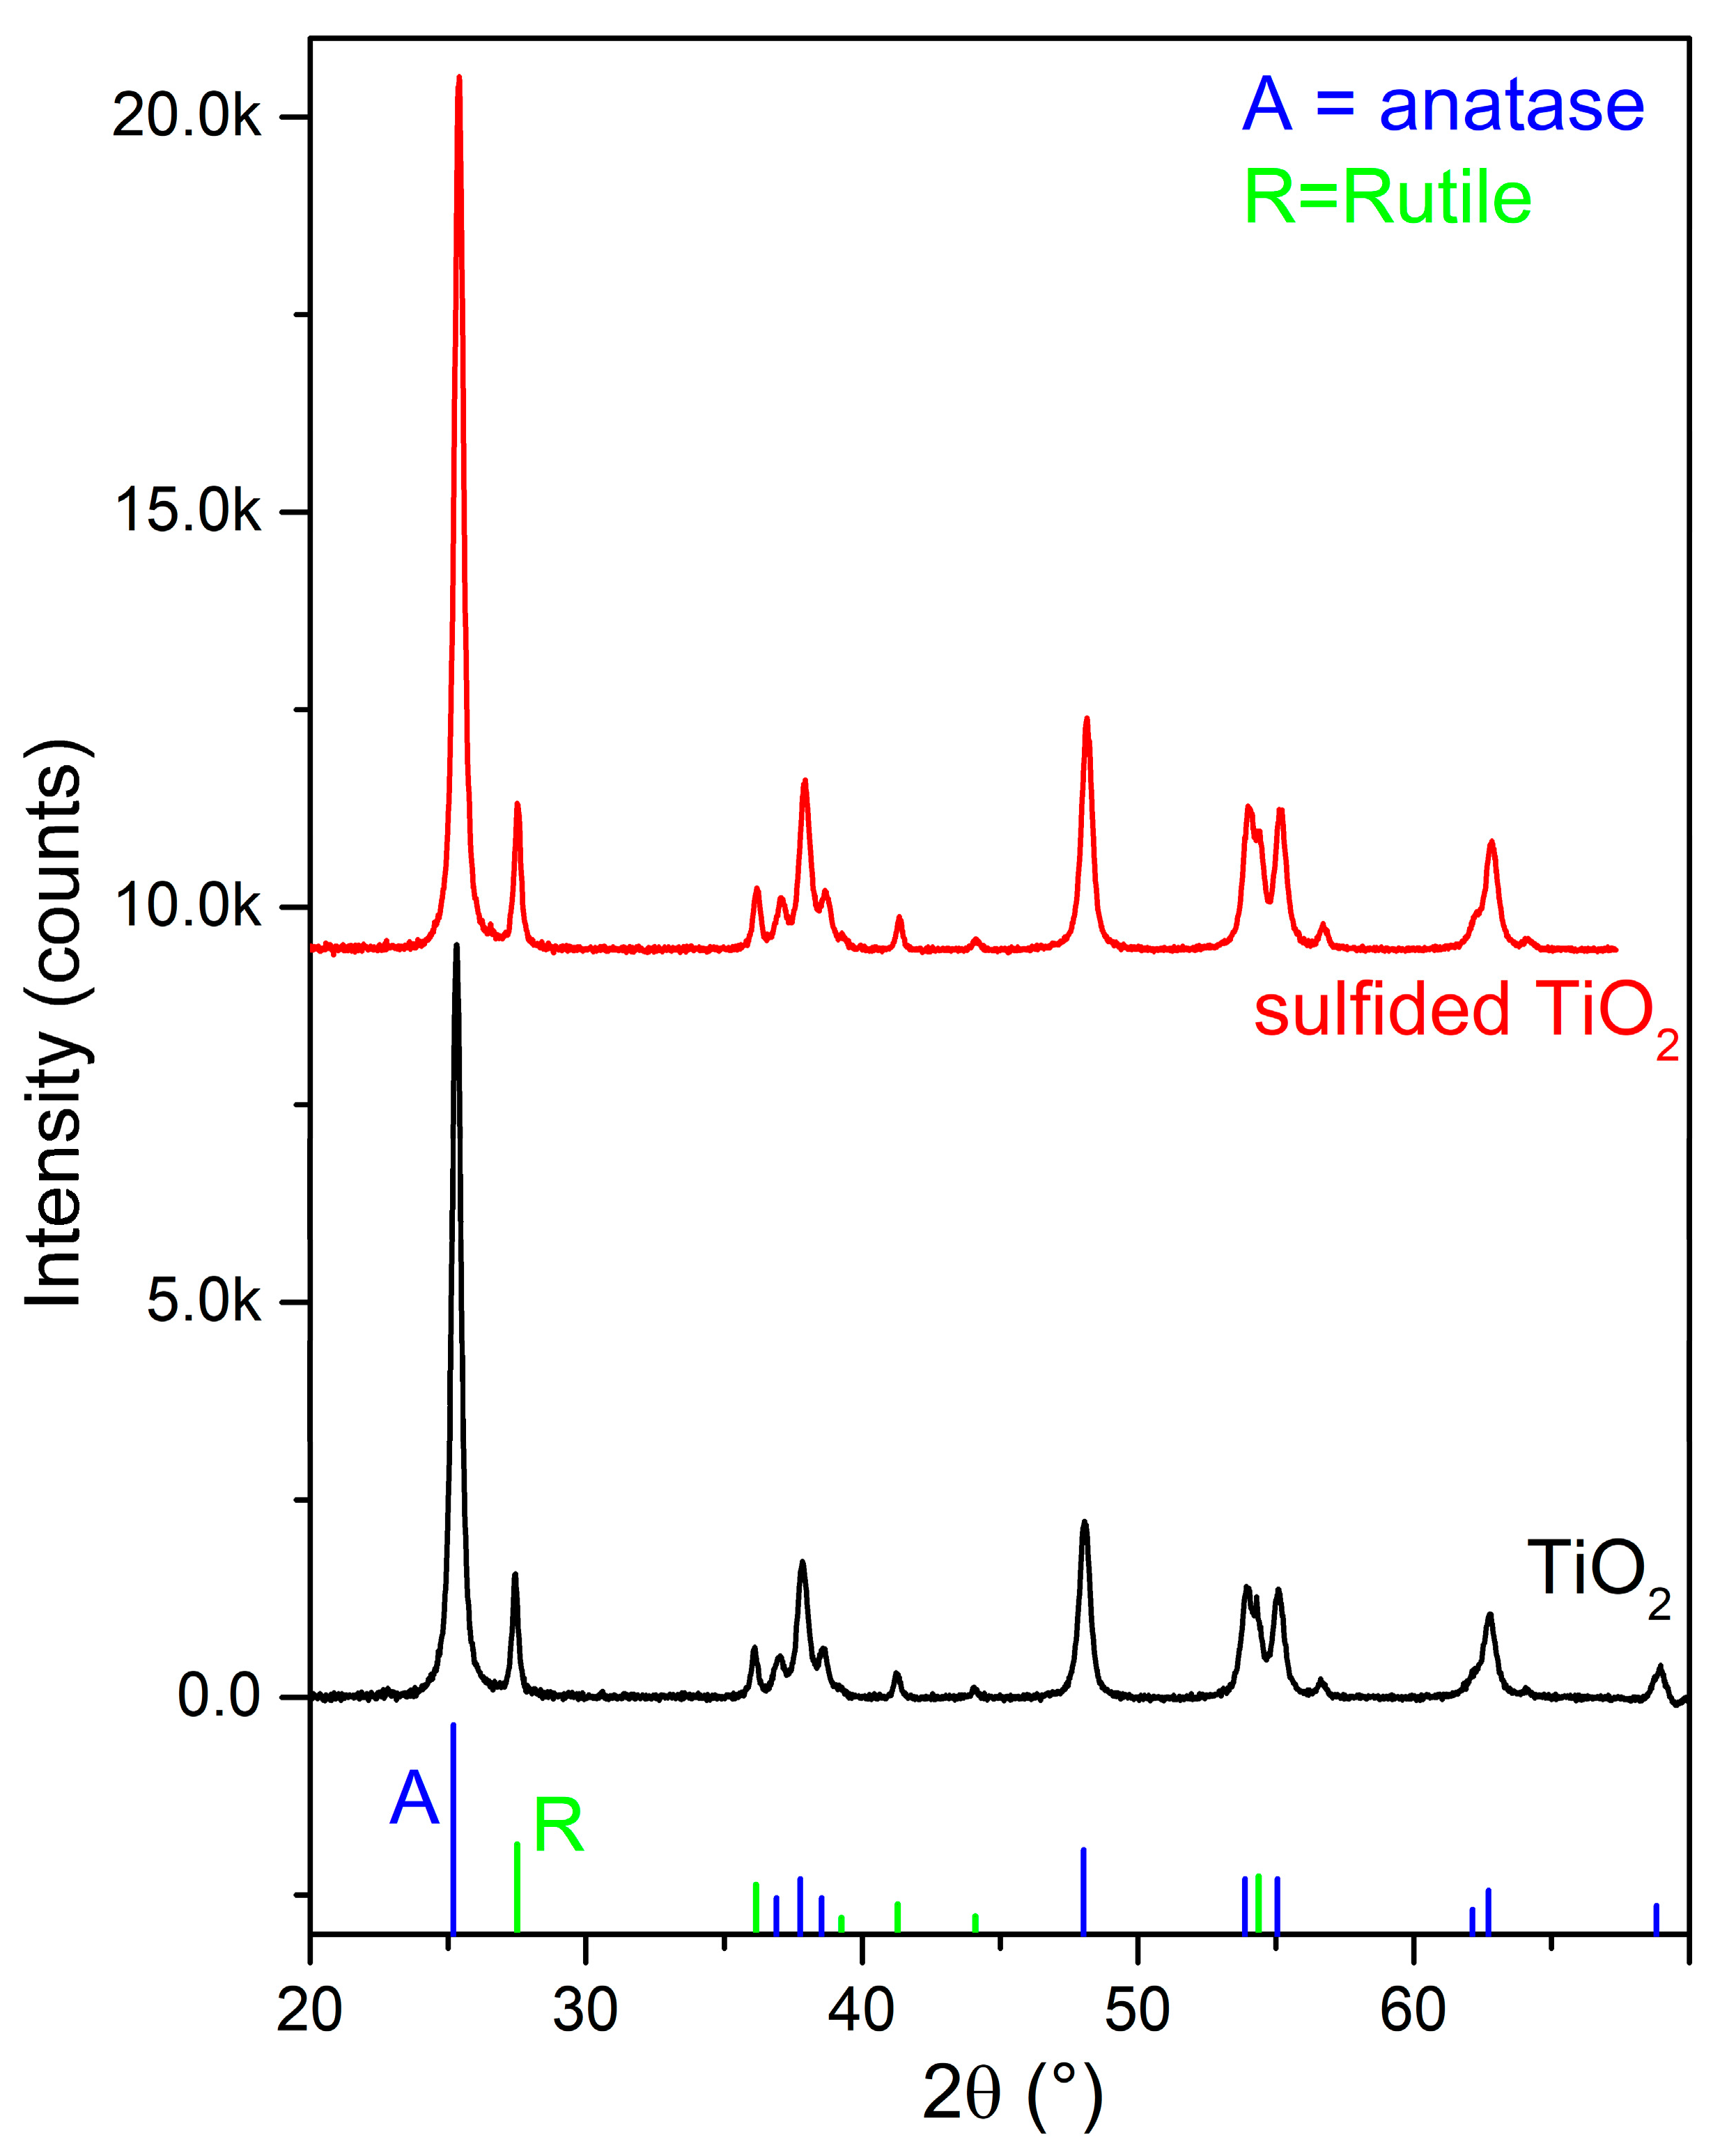
The XRD patterns of TiO2 before and after H2S dosage at 673 K for 1 h are shown in Figure 1 (black and red lines, respectively), together with the typical crystalline features of anatase (PDF card # 21-1272) and rutile (PDF card # 21-1276) phases, as highlighted by blue and green lines (anatase and rutile, respectively).
From the pattern of TiO2 after the sulfidation procedure, no considerable modifications of the peculiar peaks of anatase and rutile are observed, thus remarking that the amount of S species inside the S-doped TiO2 does not affect the lattice under the adopted preparation conditions. We shall return to this point by analyzing the amount of sulfur via elemental analysis, as illustrated in Figure S1.
2.1.2. Raman Spectroscopy
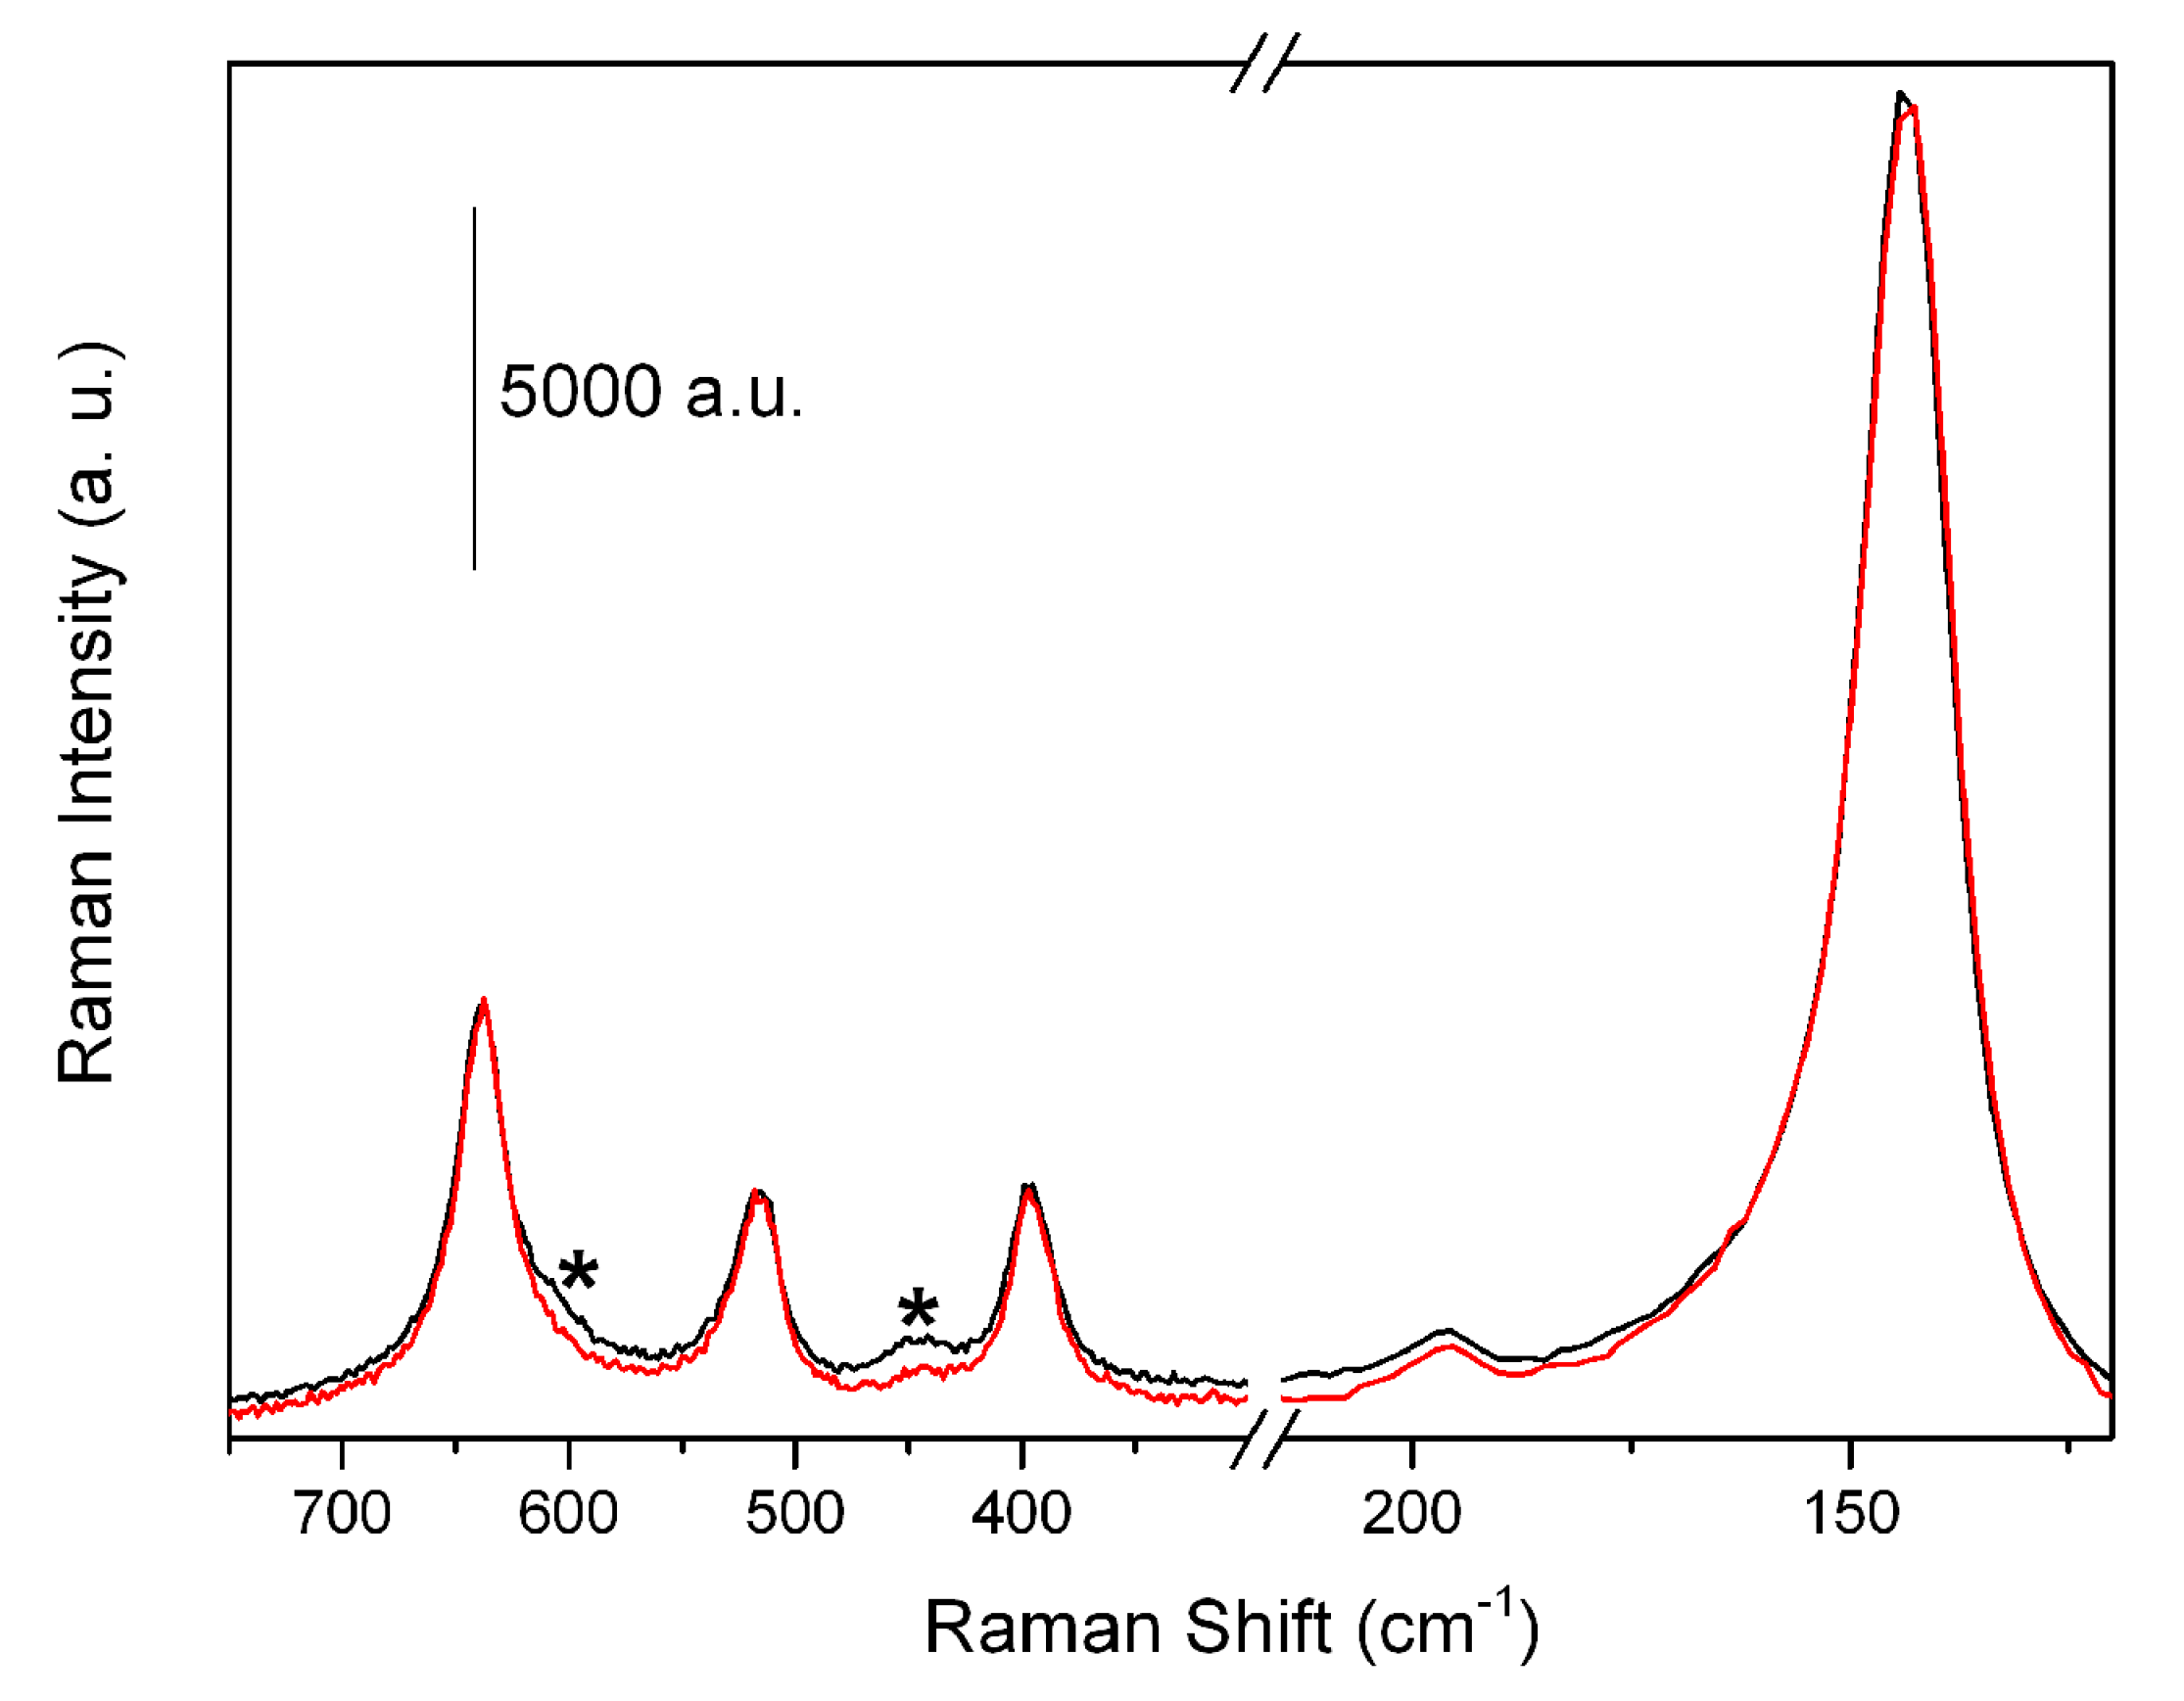
Figure 2 shows the Raman spectrum of S-doped TiO2 compared with pure TiO2, used as a reference material, both recorded with a 514 nm laser line.
In detail, concerning the spectrum of pure TiO2 (black curve), the four bands at 144, 396, 514, and 636 cm−1 are ascribed to the Eg, B1g, A1g, Eg Raman active modes, respectively, of the anatase phase, as described in the literature [10,18,40]. Furthermore, the shoulder at 608 cm−1 and the small peak at 444 cm−1 (labelled by asterisks) are due to the A1g and Eg modes of the rutile phase [40]. As for the S-doped TiO2 sample, as obtained after the sulfidation step (red curve), the typical Raman fingerprints of TiO2 are still present, even if a clear explanation of the erosion of the weak modes labelled by asterisks remains unclear [29,35].
2.1.3. Surface Area and HRTEM Analysis
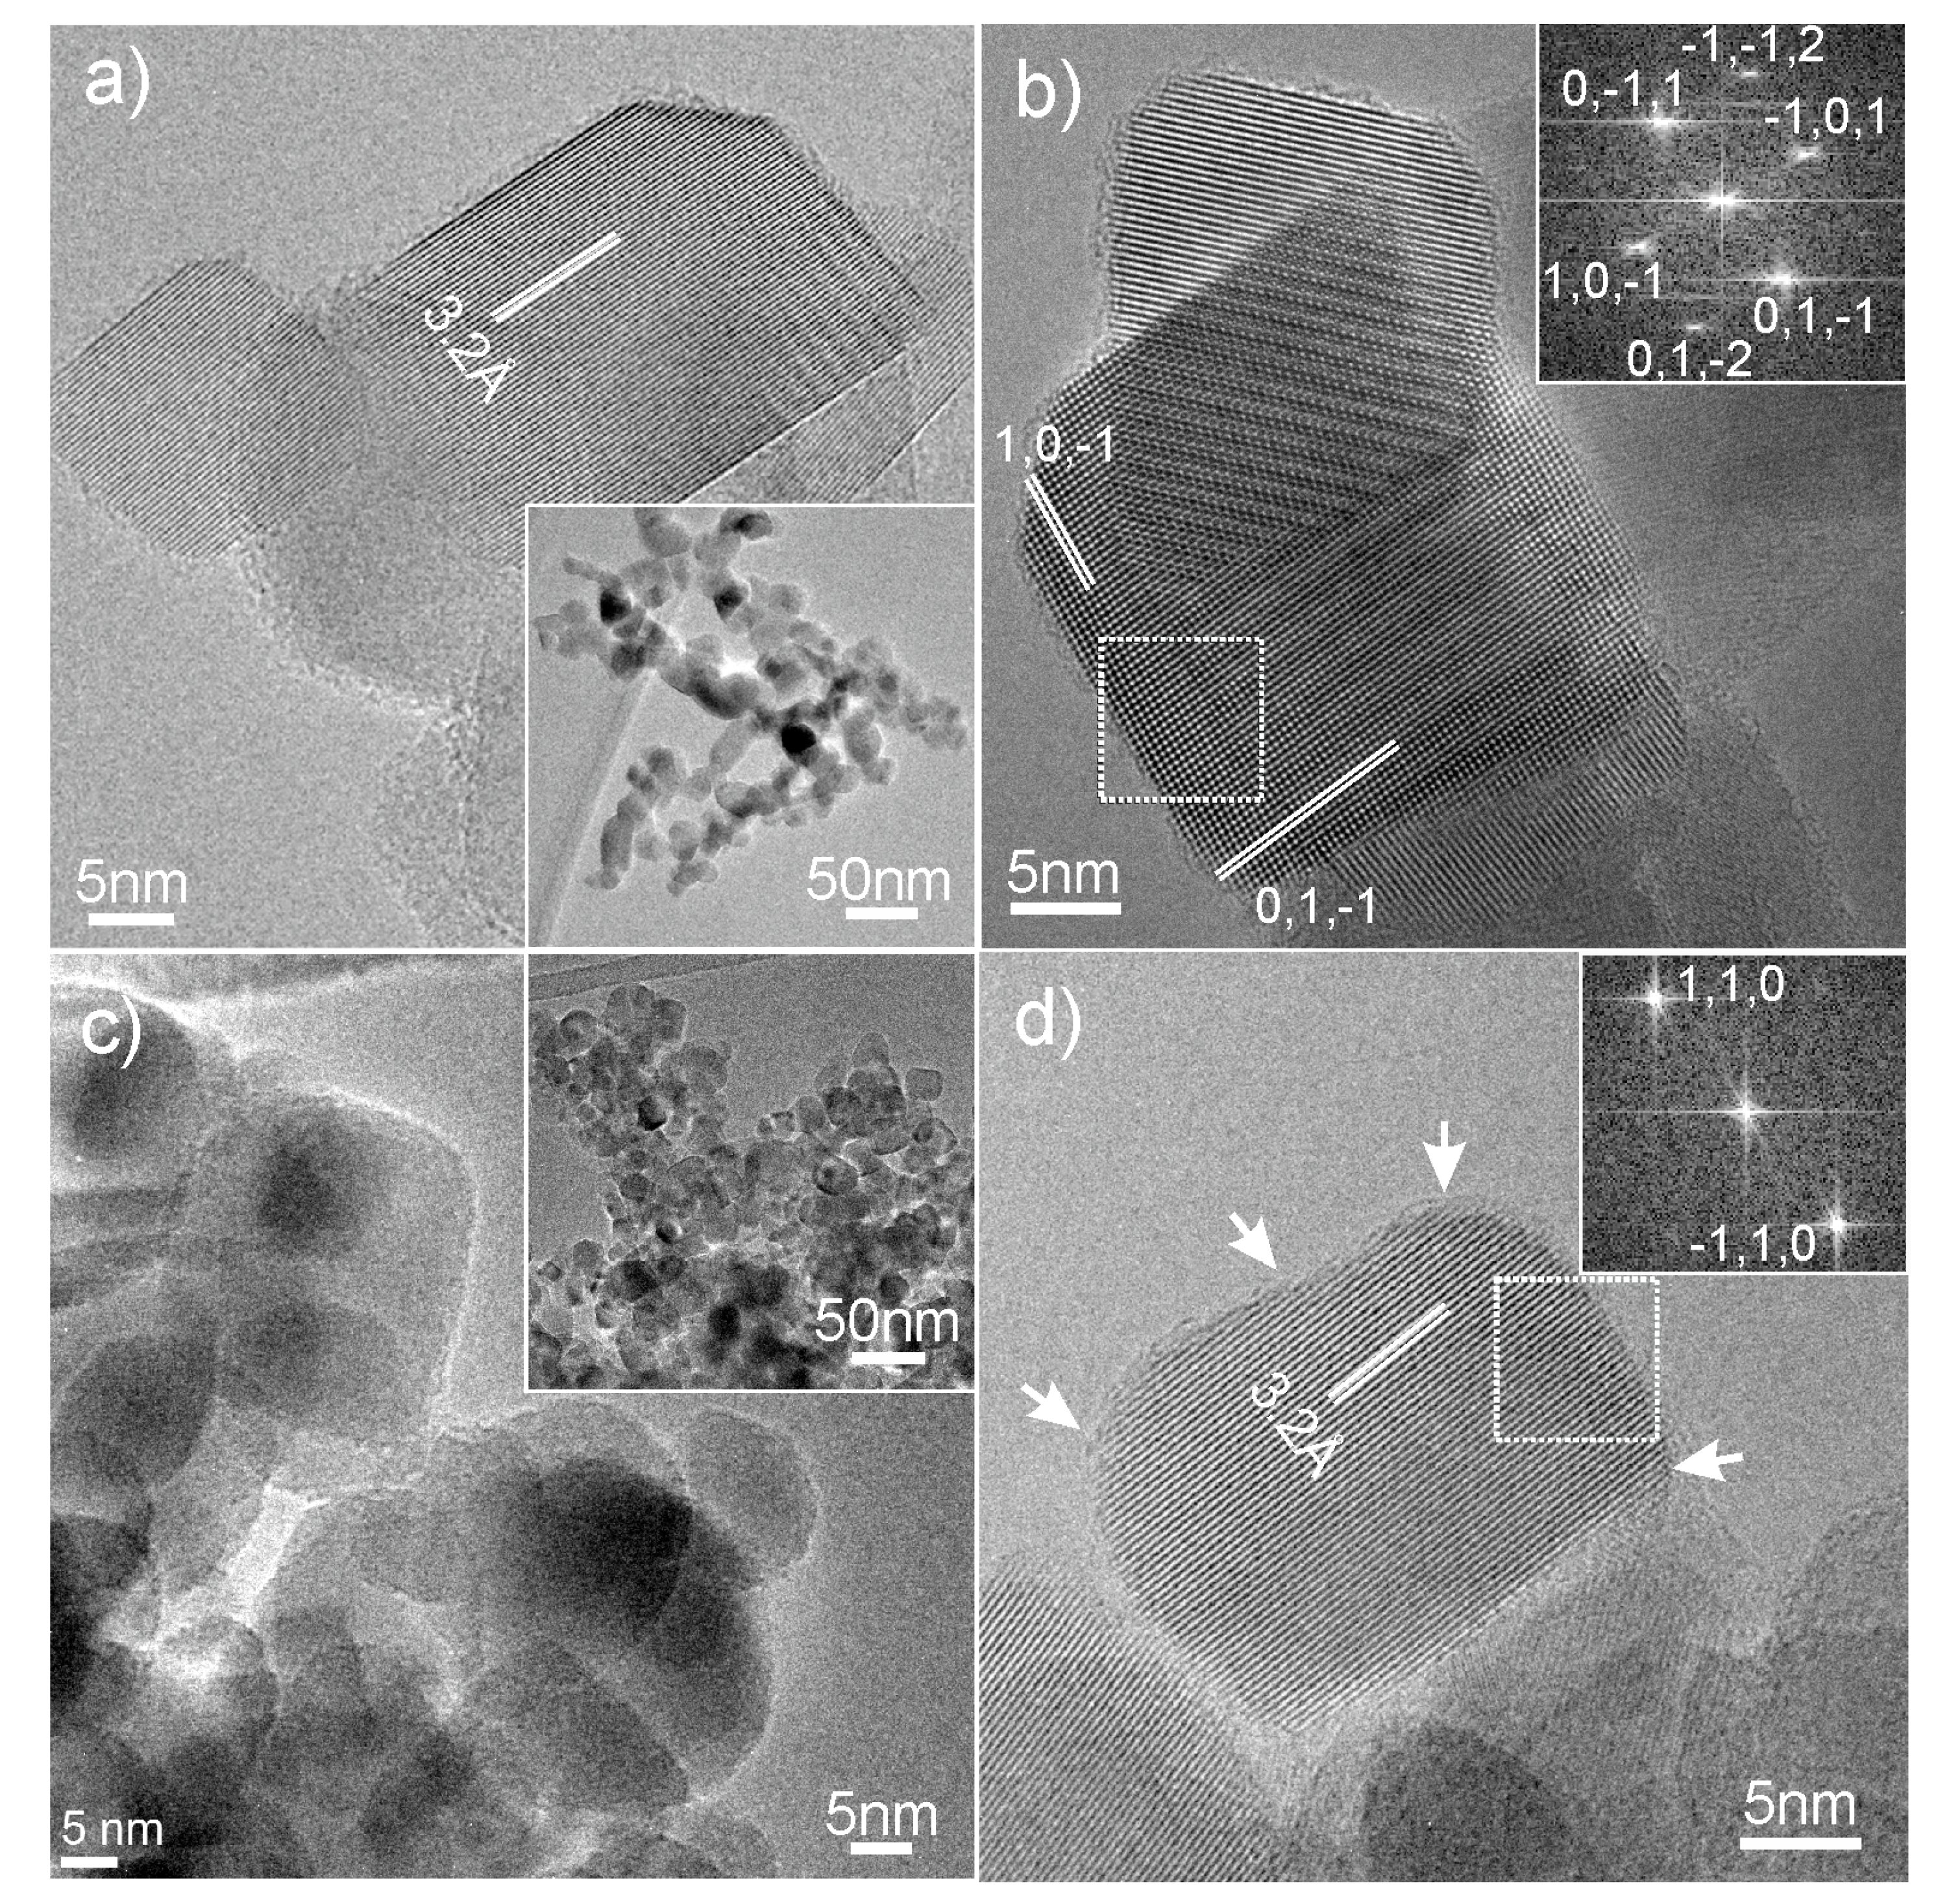
Figure 3a,b depict HRTEM images of nanoparticles of ~15–50 nm in size, exposing lattice fringes spaced ~0.32 nm or 0.35 nm, corresponding to (110) and (101) planes of rutile and anatase, respectively, as confirmed by the fast Fourier transform (FFT) investigations (insets of Figure 3b,d).
In particular, rutile (Figure 3a) and anatase (which reveals its diffraction pattern from [111] zone axis) nanoparticles (Figure 3b), which have a well-defined structure and shape, show extended faces with highly regular terminations, together with sharp corners and edges. Conversely, in Figure 3c,d, S-doped TiO2 particles with rounded shapes are shown, as highlighted by the white arrows. From Figure 3d, it can be observed that the borders of the particle appear to be completely indented, with corners and edges sensitively smoothed, which is caused by the formation of local defective regions at the atomic level. The explanation of this phenomenon could be plausibly ascribed to the action of H2S, whose strong acidic character could lead to remarkably defective surfaces of TiO2 particles.
For a deeper understanding of the effects of H2S treatment, the TiO2 and S-doped TiO2 samples were investigated by low resolution TEM (insets in Figure 3a,c, respectively). From the comparison of the related particle size distributions shown in Figure S2 (Supplementary Materials), a slight increment of particle dimensions for S-doped TiO2 is detectable, as confirmed by the mean crystal sizes provided by the anatase (101) and rutile (110) XRD peak broadenings (Scherrer’s equation) shown in Table S1 (Supplementary Materials).
Moreover, the slight decreasing of the specific surface area (38 m2/g) of S-doped TiO2 observed, as compared with TiO2 (50 m2/g), in addition to the slight increasing of the particle size in the case of S-doped TiO2 samples, can be explained by the moderate sintering effect due to annealing treatment conditions occurring at 673 K under an H2S atmosphere.
Furthermore, the impressive action of H2S on the nature of TiO2 particles has been also confirmed by FTIR investigation (vide infra).
2.2. Surface Properties by FTIR and UV-Vis Spectroscopies
2.2.1. FTIR Spectroscopy
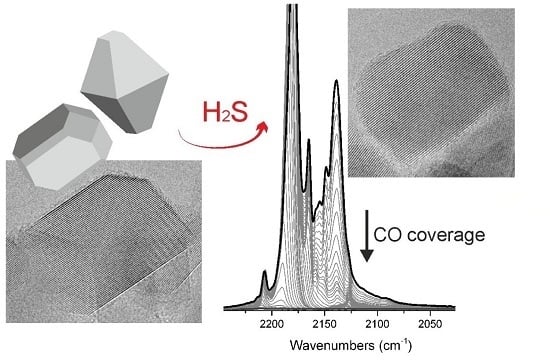
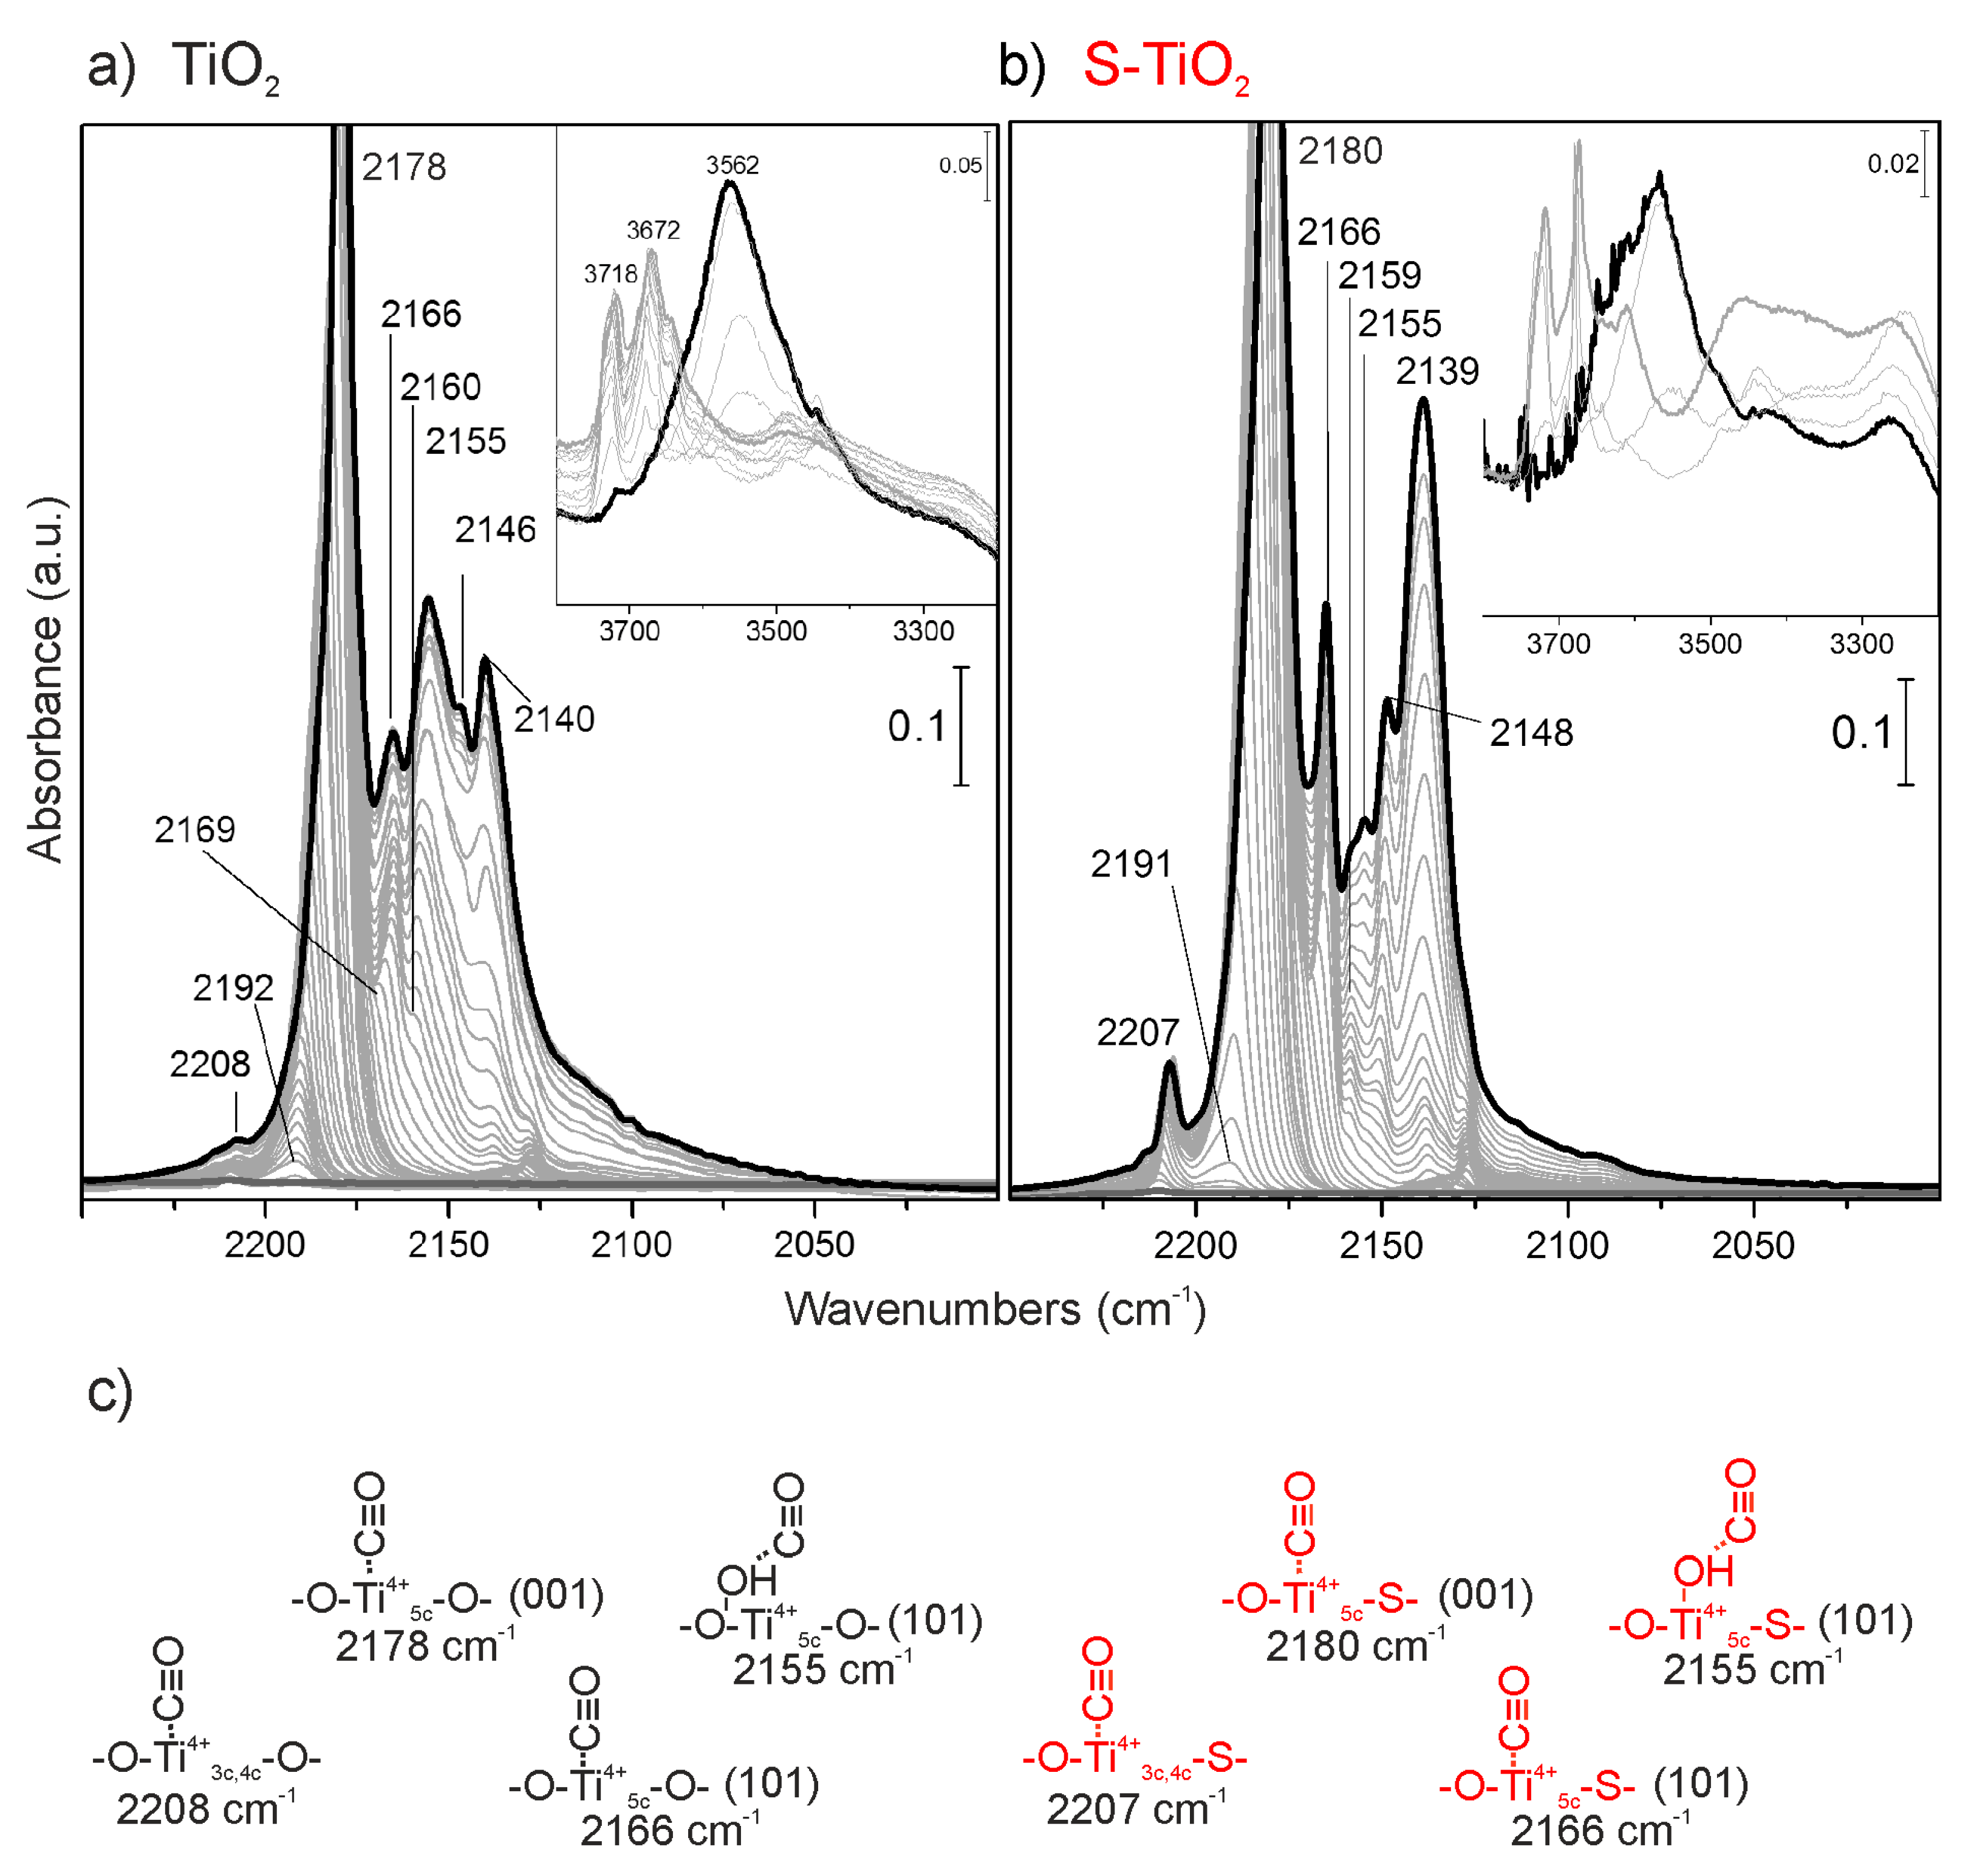
FTIR spectra collected at 100 K at decreasing CO coverage on TiO2 were compared to a similar sequence on the S-doped TiO2 sample (Figure 4a,b). The spectra were acquired by increasing an initial CO dose (70 Torr) to reach equilibrium conditions, i.e., the maximum CO coverage, after which the system was progressively outgassed up to the complete removal of the adsorbed CO molecules.
TiO2 spectra show the typical features due to the adsorption of CO on the different Ti sites on activated TiO2 surfaces, as discussed in the literature (Figure 4a) [41,42,43].
As can be seen from Figure 4a, the intense main peak observed at 2179 cm−1 can be explained by the building up of lateral interactions among an array of parallel CO oscillators, adsorbed on Ti4+ sites on flat (101) surfaces [41], while that at 2155 cm−1 is due to CO molecules interacting by hydrogen bonds with residual OH groups. The main band, in the 2178 cm−1–2192 cm−1 range (Figure 4a), undergoes a frequency shift upon decreasing CO pressure, due to the changing of the lateral interactions between CO oscillators on the TiO2 surface [43,44]. Notice that a higher frequency shift is indicative of a highly regular and extended face.
Coming back to OH groups, which remain on the surface despite the activation treatment at 673 K, their presence is confirmed by the stretching modes observed at 3718 cm−1 and 3672 cm−1 (inset of Figure 4a). These features are shifted to lower frequency as a consequence of CO adsorption, thus giving rise to a broad and more intense feature centered at 3562 cm−1. Notice that the spectral features of the OH groups are then completely restored at a lower CO pressure together with the progressively disappearing and shifting of the 2155 cm−1 band to 2160 cm−1. These two events indicate that the complete and reversible CO desorption from OH groups is occurring [42,45].
The sharp band at 2140 cm−1 is easily associated to physically adsorbed CO, which forms a multi-layer surface when the liquid nitrogen temperature brings CO to a “liquid-like” state [46]. On the other hand, the band at 2146 cm−1 that, by decreasing CO coverage, gradually shifts upward and merges with the 2155 cm−1 band, is due to the CO species on rutile facelets present in TiO2 P25 [41].
The weak feature at 2166 cm−1 was assigned to CO adsorbed on Ti Lewis centers on (001) surfaces, where Ti sites along Ti-O rows are strongly bound to two oxygens, which cause a screened electrostatic potential at these Ti sites, as concluded by Mino et al. [47] in a combined FTIR/Density Functional Theory (DFT) study on the CO adsorption on anatase (001) and (101) facets.
The weak band at 2208 cm−1 was assigned to CO adsorbed on highly acid Ti Lewis sites located on defective situations such as edges, steps, and corners, thus exhibiting very low coordination [41].
After H2S dosage (Figure 3b), some modifications can be highlighted. In particular, a slightly wider Full Width at Half Maximum (FWHM) for the main feature at 2180 cm−1 is observed due to a more disordered system, caused by the presence of S species interrupting the regularity of the extended faces.
Notice that the 2180 cm−1–2191 cm−1 main band for S-doped TiO2 (Figure 4b) undergoes a quite similar frequency shift upon decreasing CO pressure, as compared to pure TiO2 (Figure 4a).
The 2166 cm−1 band, previously assigned to Ti Lewis centers on flat (001) faces and strongly bound to O anions, presents an increased intensity and can be ascribed to a reduced screening electrostatic potential due to the O → S exchange. In fact, the presence of sulfur could cause an increased acidity followed by the observed increased intensity (Figure 4b). Conversely, the reduced intensity of the 2160–2155 cm−1 envelope can be explained by the weaker interaction of CO molecules with the residual OH groups (Figure 4b).
Moreover, notice that the band at 2207 cm−1, ascribed to CO on highly cus (coordinatively unsaturated) Ti sites on S-doped TiO2 [41], shows higher intensity with respect to pure TiO2 and is the last one to disappear by outgassing. It can be hypothesized that the larger S atoms replace the smaller O ones, thus favoring the formation of defects such as edges, steps, and corners.
These results can be confirmed by the wide band observed in the 3400–3200 cm−1 region, before CO dosage, due to the formation of surface H2O as a consequence of oxygen-sulfur exchange (inset of Figure 4b), as explained in the next paragraph.
On the basis of studies concerning the dissociative adsorption of H2S on TiO2 [48], it was found that above a temperature of 593 K, the Ti–SH bond is still strong, being –SH irreversibly adsorbed on the surface of TiO2. However, by increasing the temperature, S-H bonds become weaker and finally break. H moves to a neighboring O, forming –OH groups. Finally H2O is formed at the surface and S moves to oxygen vacancy positions [29].
Moreover, besides the dissociative adsorption, H2S molecules can also interact with surface –OH groups (bonded to Ti4+) to give rise to hydrogen bonds.
2.2.2. UV-Vis Spectroscopy
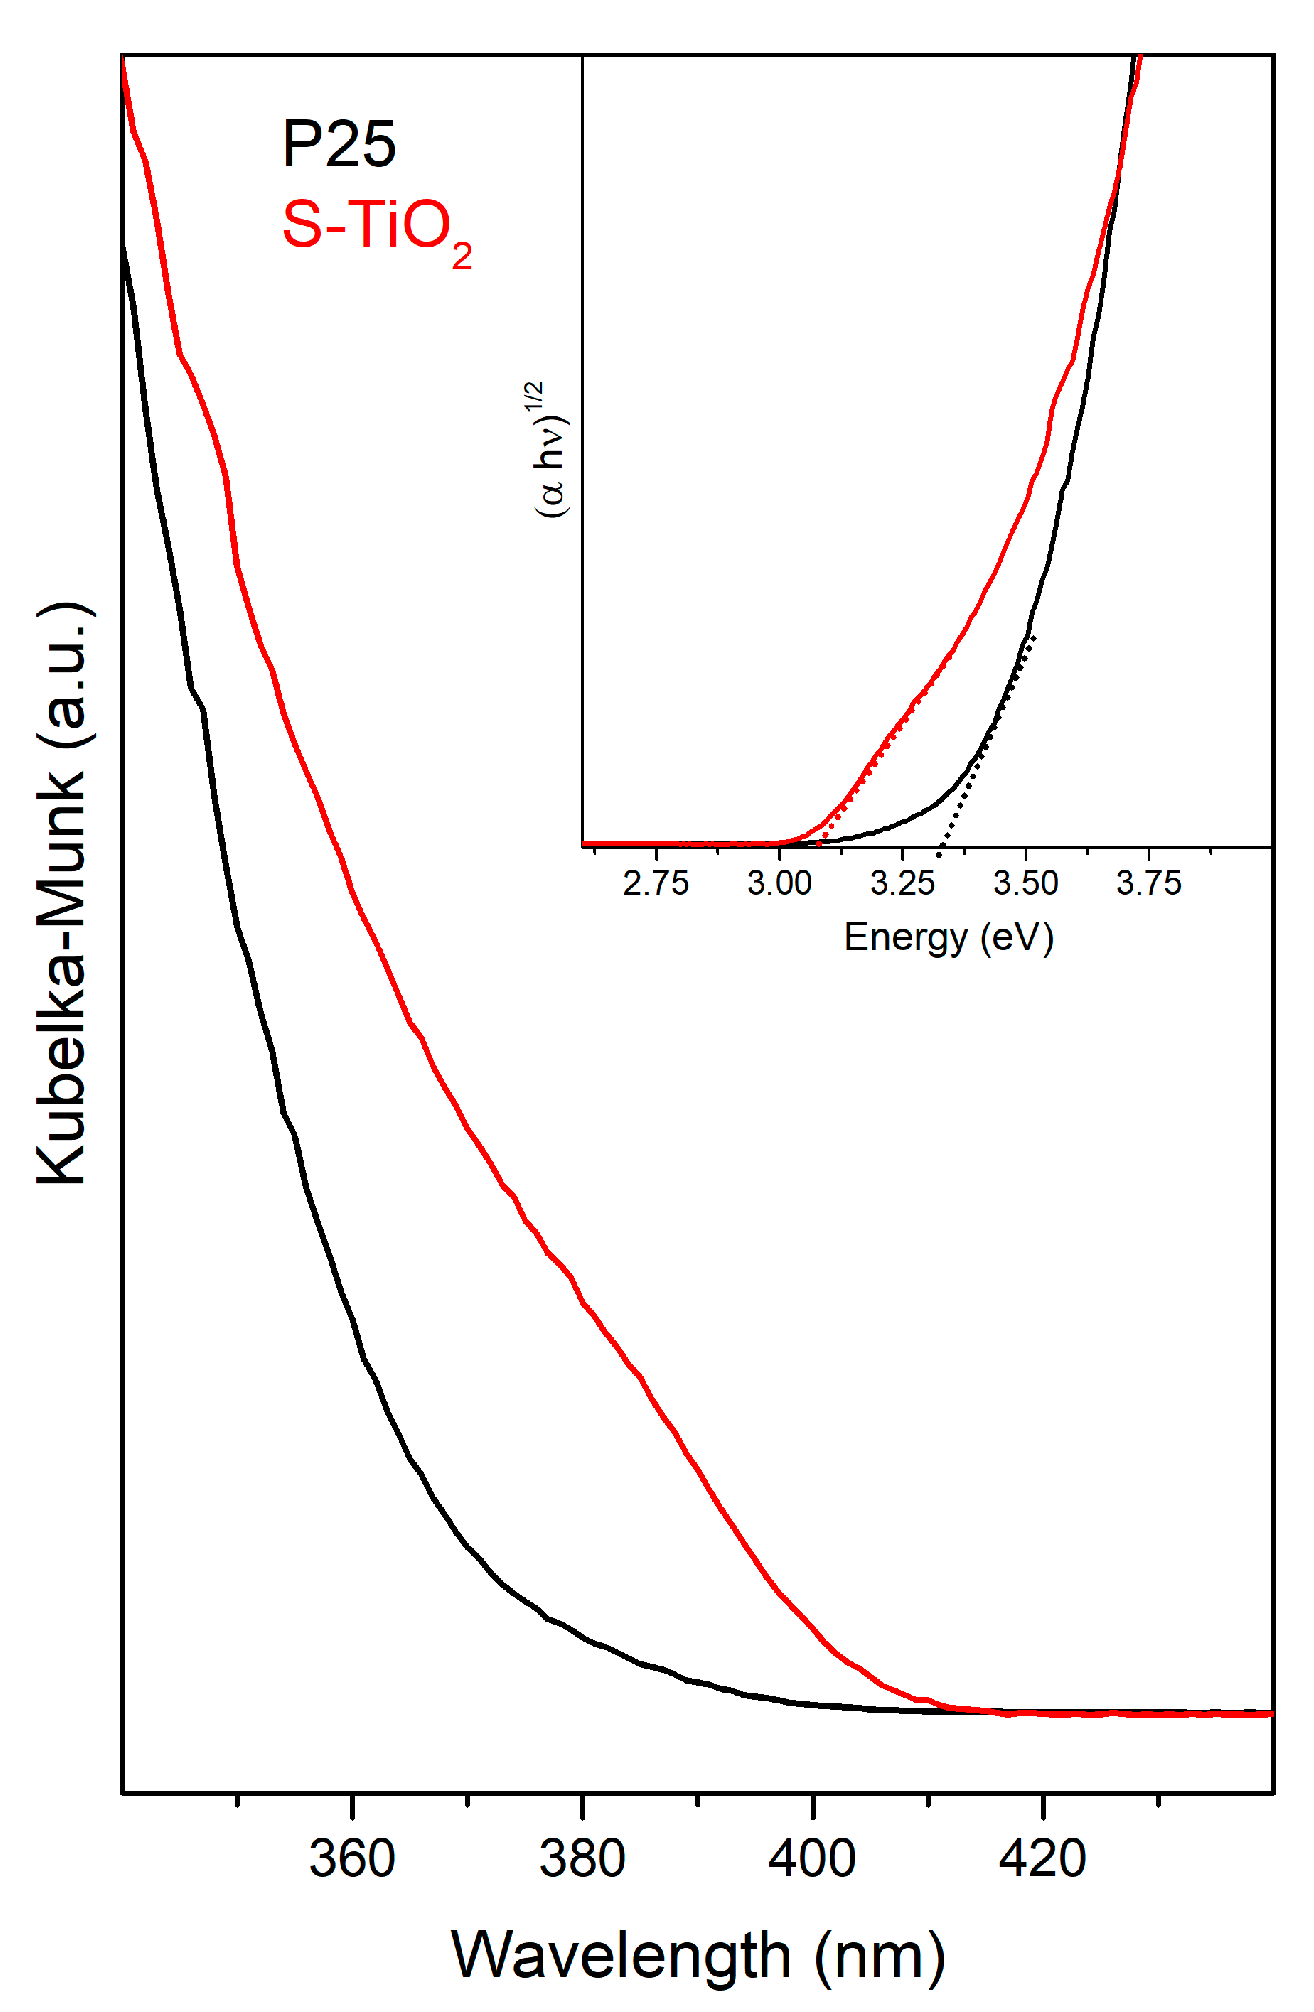
The UV-Vis spectrum of S-doped TiO2 (red curve) as compared to pure TiO2 (black curve), is shown in Figure 5. From this, a wide shift of the absorption edge for the S-doped TiO2 sample towards higher wavelengths (lower energies) is clearly detectable, together with an additional wide absorption centered at around 390 nm.
In particular, the band gap shift is emphasized by the Tauc plot (see inset in Figure 5), where the intercepts with the abscissa axis of the extrapolation of the linear part of the curves clearly highlight a red shift of the absorption edge for S-doped TiO2 (see black and red dotted lines for TiO2 and S-doped TiO2, respectively).
In general, this energy red-shift is associated with a change of TiO2 electronic structure, after the treatment with H2S, which causes the S → O exchange at the surface of TiO2 [50,51]. Taking into consideration this aspect, it is well known that the formation of doping states involves additional electronic levels that can be formed between the valence (VB) and the conduction (CB) bands, thus reducing the electron transition energy [21,52]. Along this line, the features in the UV-visible range can be ascribed to the presence of additional electronic states above the valence band edge of pure TiO2, due to S species, as well supported by XPS measurements [52,53]. These states can be attributed to sulfur 3p atomic orbitals mixing with the VB of TiO2. In addition, another plausible mechanism to explain the observed absorption shift could also involve O vacancies caused by the thermal treatment at 673 K under vacuum conditions [54].
The S-doped TiO2 sample was testedfor the photodegradation of methylene blue (MB) in water solution under solar light irradiation as compared to the TiO2 P25 benchmark (Figure S4, Supplementary Materials). In this figure, the MB C/C0 vs. time plots of S-TiO2 and of the TiO2 P25 are shown. Although the MB photodegradation of S-doped TiO2 is definitely high, under solar light irradiation its photocatalytic activity is lower than that of pure TiO2 P25. We think that the explanation for this lower photocatalytic performance in the degradation of MB is the balance of two opposite effects. The first one, associated with the sulfur doping which allows the solar light harvesting, is beneficial. However, the defective surface, as a result of the heavy H2S treatment, has a strong, definitely detrimental effect in the charge separation efficiency. It is safely concluded that, upon the adopted H2S conditions (673 K, vacuum), the non-reversible surface modification does not help to increase the photocatalytic efficiency with respect to the TiO2 P25 powder used as a starting material.
3. Materials and Methods
TiO2 (P25, Evonik), in pellet form, was activated at 673 K for 30 min under dynamic vacuum, then oxidized in an oxygen (40 Torr) atmosphere at the same temperature for 30 min, twice. By keeping the temperature at 673 K, the obtained sample was sulfided in an H2S atmosphere (30 Torr) for 1 h, twice, and then outgassed. The sample was further sulfided following the same method.
FTIR spectra of CO adsorbed at 100 K on TiO2 and S-doped TiO2 at decreasing coverages were obtained in an IR cell designed for liquid nitrogen flowing, and were recorded by means of a Bruker IFS-28 spectrometer, equipped with a Mercury Cadmium Telluride (MCT) cryogenic detector, with a resolution of 4 cm−1 (64 interferograms were averaged for each spectrum). The spectra were acquired in the 4000–400 cm−1 interval, where the fundamental vibration modes are observed.
Raman spectra were recorded using a Renishaw Raman InVia Reflex spectrophotometer equipped with an Ar+ laser emitting at 514 nm, using both static and rotating configurations.
UV-Vis measurements were collected by using a UV-Vis-NIR spectrophotometer (Varian Cary 5000, equipped with a reflectance sphere. Due to their strong optical absorption, the samples were diluted in BaSO4 powder.
X-ray diffraction patterns were collected by means of a diffractometer (PANalytical PW3050/60 X’Pert PRO MPD) with a Ni-filtered Cu anode, working with a reflectance Bragg-Brentano geometry, by using the spinner mode. The mean crystal sizes were calculated from XRD measurements by Scherrer’s equation: L = Kλ/β cosθ (λ is the X-ray wavelength, β is the full width at half maximum (FWHM) of the diffraction line corrected by the instrumental broadening, θ is the diffraction angle, and K is a constant assumed to be 0.9). Peak fitting of XRD patterns was adopted, using the Pseudo-Voigt function of anatase (101) and rutile (110) XRD peaks.
High resolution transmission electron microscopy images were acquired with a JEOL 3010-UHR instrument operating at 300 kV, equipped with a 2 k × 2 k pixels Gatan US1000 CCD camera.
N2 adsorption-desorption experiments were carried out at 77 K (Micromeritics ASAP 2020 instrument) to determine the Brunauer-Emmett-Teller (BET) surface area. The surface area of the samples was determined after outgassing at RT, overnight.
For the photodegradation test, the same quantities of S-doped TiO2 and TiO2 powder (used as a reference) were dispersed in aliquots of a methylene blue (MB) water solution 12.5 mg/L and kept in the dark for 1 h at RT. After exposure, for increasing times, to a solar lamp (SOL2/500S lamp, Honle UV technology, Munchen, Germany) ranging from ultraviolet to infrared radiation (295–3000 nm), the dispersions were centrifuged for 30 min at 10,000 rpm. Photocatalytic degradation of MB was investigated by means of UV-Vis spectroscopy in the transmission mode. The integrated intensity of the adsorbed MB manifestations (C) was used to obtain C/C0 vs. time plots, where C0 is the concentration at the initial intensity before illumination (Figure S4).
4. Conclusions
In this work, S-doped TiO2 samples were synthesized by means of H2S treatment at 673 K. From several ex situ investigations, including XRD, Raman spectroscopy, and HRTEM, the structure and morphology of samples were obtained. In particular, even if XRD and Raman analyses, due to detection limits, did not give sensitive information concerning the effects of H2S dosage on TiO2, HRTEM images showed remarkable changes of TiO2 particle shapes as a consequence of H2S, which causes strong erosion of the faces, corners, and edges of the nanoparticles. This impressive action was also confirmed by FTIR spectra, where remarkable differences in the relative intensity of all peaks in S-doped TiO2, when compared to pure TiO2, were observed. Moreover, the changes in the OH groups range can be ascribed to oxygen-sulfur exchange phenomena, explained with the dissociative adsorption of H2S on TiO2.
Finally, UV-Vis spectroscopy demonstrated how also the electronic structure of TiO2 can be deeply modified by H2S. The red shift of the S-doped TiO2 absorption edge can be explained with additional extrinsic electronic levels introduced by the sulfur doping. This affected the optical properties of TiO2, whose absorption edge was extended to the visible-light region.
From all these considerations, it can be safety concluded that H2S treatment of TiO2, to achieve an S-doped TiO2 material, has a deep and strong effect on TiO2, such as on the morphological, surface, electronic, and optical properties. However, the photocatalysis efficiency of TiO2 in the degradation of methylene blue is not improved by the H2S treatment at the adopted conditions, due to the strongly defective surface of S-doped TiO2 which decreases the charge separation efficiency.
Supplementary Materials
The following are available online at www.mdpi.com/2073-4344/7/7/214/s1, Figure S1: EDAX spectrum of TiO2/H2S, Figure S2: Particle size distributions (PSDs) of TiO2 P25 (left panel) and of S-TiO2 (right panel), Figure S3: Time dependence of C/C0 upon solar light exposure of S-TiO2 (red line) as compared to the TiO2 P25 (black dotted line), for photodegradation of methylene blue, Figure S4: FTIR spectra, recorded before CO dosage, of TiO2 (black curve) and TiO2/H2S (red curve), Table S1: Mean crystal sizes of anatase and rutile nanoparticles in TiO2 P25 and S-TiO2 samples, as obtained from XRD peak broadening (black and red patters in Figure 1).
Acknowledgments
This work was supported by MIUR (Ministero dell’Istruzione, dell’Università e della Ricerca), INSTM Consorzio and NIS (Nanostructured Interfaces and Surfaces) Inter-Departmental Centre of University of Torino. The authors thank the vibrational Raman spectroscopy laboratory of Chemistry Department and in particular Alessandro Damin, for the precious support in Raman experiments.
Author Contributions
Sara Cravanzola, Federico Cesano and Fulvio Gaziano conceived, designed and performed the experiments and characterizations, analyzing the data; Sara Cravanzola, Federico Cesano and Domenica Scarano wrote the paper. All authors read and approved the paper.
Conflicts of Interest
The authors declare no conflict of interest.
References
- Nakata, K.; Fujishima, A. TiO2 photocatalysis: Design and applications. J. Photochem. Photobiol. C 2012, 13, 169–189. [Google Scholar] [CrossRef]
- Schneider, J.; Matsuoka, M.; Takeuchi, M.; Zhang, J.; Horiuchi, Y.; Anpo, M.; Bahnemann, D.W. Understanding TiO2 photocatalysis: Mechanisms and materials. Chem. Rev. 2014, 114, 9919–9986. [Google Scholar] [CrossRef] [PubMed]
- Kubacka, A.; Diez, M.S.; Rojo, D.; Bargiela, R.; Ciordia, S.; Zapico, I.; Albar, J.P.; Barbas, C.; Martins dos Santos, V.A.P.; Fernández-García, M.; et al. Understanding the antimicrobial mechanism of TiO2-based nanocomposite films in a pathogenic bacterium. Sci. Rep. 2014, 4, 1–9. [Google Scholar] [CrossRef] [PubMed]
- Yin, Z.F.; Wu, L.; Yang, H.G.; Su, Y.H. Recent progress in biomedical applications of titanium dioxide. Phys. Chem. Chem. Phys. 2013, 15, 4844–4858. [Google Scholar] [CrossRef] [PubMed]
- Song, Y.-Y.; Schmidt-Stein, F.; Baue, S.; Schmuki, P. Amphiphilic TiO2 nanotube arrays: An actively controllable drug delivery system. J. Am. Chem. Soc. 2009, 131, 4230–4232. [Google Scholar] [CrossRef] [PubMed]
- Banerjee, S.; Dionysioub, D.D.; Pillai, S.C. Self-cleaning applications of TiO2 by photo-induced hydrophilicity and photocatalysis. Appl. Catal. B 2015, 176–177, 396–428. [Google Scholar] [CrossRef]
- Ao, C.H.; Lee, S.C. Indoor air purification by photocatalyst TiO2 immobilized on an activated carbon filter installed in an air cleaner. Chem. Eng. Sci. 2005, 60, 103–109. [Google Scholar] [CrossRef]
- Cesano, F.; Pellerej, D.; Scarano, D.; Ricchiardi, G.; Zecchina, A. Radially organized pillars of TiO2 nanoparticles: Synthesis, characterization and photocatalytic tests. J. Photochem. Photob. A Chem. 2012, 242, 51–58. [Google Scholar] [CrossRef]
- Chatterjee, D.; Mahata, A. Visible light induced photo-degradation of organic pollutants on dye adsorbed TiO2 surface. J. Photochem. Photobiol. A 2002, 153, 199–204. [Google Scholar] [CrossRef]
- Cravanzola, S.; Cesano, F.; Gaziano, F.; Scarano, D. Carbon domains on MoS2/TiO2 system via catalytic acetylene oligomerization: Synthesis, structure and surface properties. Front. Chem. 2017. submitted. [Google Scholar]
- Cravanzola, S.; Muscuso, L.; Cesano, F.; Agostini, G.; Damin, A.; Scarano, D.; Zecchina, A. MoS2 nanoparticles decorating titanate-nanotube surfaces: Combined microscopy, spectroscopy, and catalytic studies. Langmuir 2015, 31, 5469–5478. [Google Scholar] [CrossRef] [PubMed]
- Uddin, M.J.; Cesano, F.; Bertarione, S.; Bonino, F.; Bordiga, S.; Scarano, D.; Zecchina, A. Tailoring the activity of Ti-based photocatalysts by playing with surface morphology and silver doping. J. Photochem. Photob. A Chem. 2008, 196, 165–173. [Google Scholar] [CrossRef]
- Asahi, R.; Morikawa, T.; Ohwaki, T.; Aoki, K.; Taga, Y. Visible-light photocatalysis in nitrogen-doped titanium oxides. Science 2001, 293, 269–271. [Google Scholar] [CrossRef] [PubMed]
- Hong, X.; Wang, Z.; Cai, W.; Lu, F.; Zhang, J.; Yang, Y.; Ma, N.; Liu, Y. Visible-light-activated nanoparticle photocatalyst of iodine-doped titanium dioxide. Chem. Mater. 2005, 17, 1548–1552. [Google Scholar] [CrossRef]
- Dozzi, M.V.; D’Andrea, C.; Ohtani, B.; Valentini, G.; Selli, E. Fluorine-doped TiO2 materials: Photocatalytic activity vs. time-resolved photoluminescence. J. Phys. Chem. C 2013, 117, 25586–25595. [Google Scholar] [CrossRef]
- Cravanzola, S.; Jain, S.M.; Cesano, F.; Damin, A.; Scarano, D. Development of a multifunctional TiO2/MWCNT hybrid composite grafted on a stainless steel grating. RSC Adv. 2015, 5, 103255–103264. [Google Scholar] [CrossRef]
- Ansari, S.A.; Khan, M.M.; Ansaric, M.O.; Cho, M.H. Nitrogen-doped titanium dioxide (N-doped TiO2) for visible light photocatalysis. New J. Chem. 2016, 40, 3000–3009. [Google Scholar] [CrossRef]
- Cesano, F.; Bertarione, S.; Damin, A.; Agostini, G.; Usseglio, S.; Vitillo, J.G.; Lamberti, C.; Spoto, G.; Scarano, D.; Zecchina, A. Oriented TiO2 nanostructured pillar arrays: Synthesis and characterization. Adv. Mater. 2008, 20, 3342–3348. [Google Scholar] [CrossRef]
- Ramandi, S.; Entezari, M.H.; Ghows, N. Sono-synthesis of solar light responsive S–N–C–tri doped TiO2 photo-catalyst under optimized conditions for degradation and mineralization of diclofenac. Ultrason. Sonochem. 2017, 38, 234–245. [Google Scholar] [CrossRef] [PubMed]
- Brindha, A.; Sivakumar, T. Visible active N, S co-doped TiO2/graphene photocatalysts for the degradation of hazardous dyes. J. Photochem. Photobiol. A 2017, 340, 146–156. [Google Scholar] [CrossRef]
- Cesano, F.; Agostini, G.; Scarano, D. Nanocrystalline TiO2 micropillar arrays grafted on conductive glass supports: Microscopic and spectroscopic studies. Thin Solid Films 2015, 590, 200–206. [Google Scholar] [CrossRef]
- Uddin, M.J.; Daramola, D.E.; Velasquez, E.; Dickens, T.J.; Yan, J.; Hammel, E.; Cesano, F.; Okoli, O.I. A high efficiency 3D photovoltaic microwire with carbon nanotubes (CNT)-quantum dot (QD) hybrid interface. PSS RRL 2014, 8, 898–903. [Google Scholar] [CrossRef]
- Hui, F.; Bu, C. DFT description on electronic structure and optical absorption properties of anionic S-doped anatase TiO2. J. Phys. Chem. B 2006, 110, 17866–17871. [Google Scholar]
- Smith, M.F.; Setwong, K.; Tongpool, R.; Onkaw, D.; Naphattalung, S.; Limpijumnong, S.; Rujirawat, S. Identification of bulk and surface sulfur impurities in TiO2 by synchrotron X-ray absorption near edge structure. Appl. Phys. Lett. 2007, 91, 142107. [Google Scholar] [CrossRef]
- Liu, G.; Sun, C.; Smith, S.C.; Wang, L.; Lu, G.Q.; Cheng, H.-M. Sulfur doped anatase TiO2 single crystals with a high percentage of {0 0 1} facets. J. Colloid Interface Sci. 2010, 349, 477–483. [Google Scholar] [CrossRef] [PubMed]
- Nam, S.-H.; Kim, T.K.; Boo, J.-H. Physical property and photo-catalytic activity of sulfur doped TiO2 catalysts responding to visible light. Catal. Today 2012, 185, 259–262. [Google Scholar] [CrossRef]
- Yang, G.; Yan, Z.; Xiao, T. Low-temperature solvothermal synthesis of visible-light-responsive S-doped TiO2 nanocrystal. Appl. Surf. Sci. 2012, 258, 4016–4022. [Google Scholar] [CrossRef]
- Dozzi, M.V.; Livraghi, S.; Giamello, E.; Selli, E. Photocatalytic activity of S- and F-doped TiO2 in formic acid mineralization. Photochem. Photobiol. Sci. 2011, 10, 343–349. [Google Scholar] [CrossRef] [PubMed]
- Chen, Y.; Jiang, Y.; Li, W.; Jin, R.; Tang, S.; Hu, W. Adsorption and interaction of H2S/SO2 on TiO2. Catal. Today 1999, 50, 39–47. [Google Scholar]
- Wei, F.; Ni, L.; Cui, P. Preparation and characterization of N–S-codoped TiO2 photocatalyst and its photocatalytic activity. J. Hazard. Mater. 2008, 156, 135–140. [Google Scholar] [CrossRef] [PubMed]
- Li, H.; Zhang, X.; Huo, Y.; Zhu, J. Supercritical preparation of a highly active S-doped TiO2 photocatalyst for methylene blue mineralization. Environ. Sci. Technol. 2007, 41, 4410–4414. [Google Scholar] [CrossRef] [PubMed]
- Travert, A.; Maugé, F. IR study of hydrotreating catalysts in working conditions: Comparison of the acidity present on the sulfided phase and on the alumina support. Stud. Surf. Sci. Catal. 1999, 127, 269–277. [Google Scholar]
- Barba, D.; Cammarota, F.; Vaiano, V.; Salzano, E.; Palma, V. Experimental and numerical analysis of the oxidative decomposition of H2S. Fuel 2017, 198, 68–75. [Google Scholar] [CrossRef]
- Jüngst, E.; Nehb, W. Hydrogen sulfide to sulfur (Claus process). In Handbook of Heterogeneous Catalysis; Wiley-VCH: Weinheim, Germany, 2008; pp. 2609–2623. [Google Scholar]
- Huang, W.-F.; Chen, H.-T.; Lin, M.C. Density functional theory study of the adsorption and reaction of H2S on TiO2 rutile (110) and anatase (101) surfaces. J. Phys. Chem. C 2009, 113, 20411–20420. [Google Scholar] [CrossRef]
- Arrouvel, C.; Toulhoat, H.; Breysse, M.; Raybaud, P. Effects of PH2O, PH2S, PH2 on the surface properties of anatase-TiO2 and g-Al2O3: A DFT study. J. Catal. 2004, 226, 260–272. [Google Scholar] [CrossRef]
- Fahmi, A.; Ahdjoudj, J.; Minot, C. A theoretical study of H2S and MeSH adsorption on TiO2. Surf. Sci. 1996, 352–354, 529–533. [Google Scholar] [CrossRef]
- Markovits, A.; Ahdjoudj, J.; Minot, C. Theoretical study of the TiO2 and MgO surface acidity and the adsorption of acids and bases. Mol. Eng. 1997, 7, 245–261. [Google Scholar] [CrossRef]
- Abbasi, A.; Sardroodi, J.J. Adsorption and dissociation of H2S on nitrogen-doped TiO2 anatase nanoparticles: Insights from DFT computations. Surf. Interface 2017, 8, 15–27. [Google Scholar] [CrossRef]
- Ma, H.L.; Yang, J.Y.; Dai, Y.; Zhang, Y.B.; Lu, B.; Ma, G.H. Raman study of phase transformation of TiO2 rutile single crystal irradiated by infrared femtosecond laser. Appl. Surf. Sci. 2007, 253, 7497–7500. [Google Scholar] [CrossRef]
- Mino, L.; Spoto, G.; Bordiga, S.; Zecchina, A. Particles morphology and surface properties as investigated by HRTEM, FTIR, and periodic DFT calculations: From pyrogenic TiO2 (P25) to nanoanatase. J. Phys. Chem. C 2012, 116, 17008–17018. [Google Scholar] [CrossRef]
- Martra, G. Lewis acid and base sites at the surface of microcrystalline TiO2 anatase: Relationships between surface morphology and chemical behaviour. Appl. Catal. A 2000, 200, 275–285. [Google Scholar] [CrossRef]
- Spoto, G.; Morterra, C.; Marchese, L.; Orio, L.; Zecchina, A. The morphology of TiO2 microcrystals and their adsorptive properties towards CO: A HRTEM and FTIR study. Vacuum 1990, 41, 37–39. [Google Scholar] [CrossRef]
- Signorile, M.; Damin, A.; Budnyk, A.; Lamberti, C.; Puig-Molina, A.; Beato, P.; Bordiga, S. MoS2 supported on P25 titania: A model system for the activation of a HDS catalyst. J. Catal. 2015, 328, 225–235. [Google Scholar] [CrossRef]
- Cesano, F.; Bertarione, S.; Uddin, M.J.; Agostini, G.; Scarano, D.; Zecchina, A. Designing TiO2 based nanostructures by control of surface morphology of pure and silver loaded titanate nanotubes. J. Phys. Chem. C 2010, 114, 169–178. [Google Scholar] [CrossRef]
- Bordiga, S.; Scarano, D.; Spoto, G.; Zecchina, A.; Lamberti, C.; Otero Areán, C. Infrared study of carbon monoxide adsorption at 77 K on faujasites and ZSM-5 zeolites. Vib. Spectrosc. 1993, 5, 69–74. [Google Scholar] [CrossRef]
- Mino, L.; Ferrari, A.M.; Lacivita, V.; Spoto, G.; Bordiga, S.; Zecchina, A. CO adsorption on anatase nanocrystals: A combined experimental and periodic DFT study. J. Phys. Chem. C 2011, 115, 7694–7700. [Google Scholar] [CrossRef]
- Davydov, A.; Chuang, K.T.; Sanger, A.R. Mechanism of H2S oxidation by ferric oxide and hydroxide surfaces. J. Phys. Chem. B 1998, 102, 4745–4752. [Google Scholar] [CrossRef]
- Murphy, A.B. Band-gap determination from diffuse reflectance measurements of semiconductor films, and application to photoelectrochemical water-splitting. Sol. Energy Mater. Sol. Cells 2007, 91, 1326–1337. [Google Scholar] [CrossRef]
- Li, N.; Zhang, X.; Zhou, W.; Liu, Z.; Xie, G.; Wang, Y.; Du, Y. High quality sulfur -doped titanium dioxide nanocatalysts with visible light photocatalytic activity from non-hydrolytic thermolysis synthesis. Inorg. Chem. Front. 2014, 1, 521–525. [Google Scholar] [CrossRef]
- Ho, W.; Yu, J.C.; Lee, S. Low-temperature hydrothermal synthesis of S-doped TiO2 with visible light photocatalytic activity. J. Solid State Chem. 2006, 179, 1171–1176. [Google Scholar] [CrossRef]
- Chen, X.; Burda, C. The electronic origin of the visible-light absorption properties of C-, N- and S-doped TiO2 nanomaterials. J. Am. Chem. Soc. 2008, 130, 5018–5019. [Google Scholar] [CrossRef] [PubMed]
- Tang, X.; Li, D. Sulfur-doped hhighly ordered TiO2 nanotubular arrays with visible light response. J. Phys. Chem. C 2008, 112, 5405–5409. [Google Scholar] [CrossRef]
- Umebayashi, T.; Yamaki, T.; Itoh, H.; Asai, K. Band gap narrowing of titanium dioxide by sulfur doping. Appl. Phys. Lett. 2002, 81, 454–456. [Google Scholar] [CrossRef]
Figure 1.
XRD patterns of TiO2 (black line) and S-doped TiO2 (red line). Anatase (PDF card # 21-1272) and rutile (PDF card # 21-1276) phases (blue and green lines, respectively) are shown for comparison.
Figure 1.
XRD patterns of TiO2 (black line) and S-doped TiO2 (red line). Anatase (PDF card # 21-1272) and rutile (PDF card # 21-1276) phases (blue and green lines, respectively) are shown for comparison.

Figure 2.
Raman spectra of TiO2 and S-doped TiO2 (black and red lines, respectively). Raman fingerprints of rutile are marked by asterisks.
Figure 2.
Raman spectra of TiO2 and S-doped TiO2 (black and red lines, respectively). Raman fingerprints of rutile are marked by asterisks.

Figure 3.
TEM images of TiO2 (a,b) and S-doped TiO2 (c,d). In the insets of (a,c) low resolution images of TiO2 and S-doped TiO2 are shown, while in the insets of (b,d) two selected regions are Fast Fourier Transform (FFT) imaged.
Figure 3.
TEM images of TiO2 (a,b) and S-doped TiO2 (c,d). In the insets of (a,c) low resolution images of TiO2 and S-doped TiO2 are shown, while in the insets of (b,d) two selected regions are Fast Fourier Transform (FFT) imaged.

Figure 4.
FTIR spectra of CO adsorbed at 100K on (a) TiO2 and (b) S-doped TiO2 at decreasing coverages (black bold line, maximum coverage: pCO = 70 Torr, grey bold line, minimum coverage: pCO → 0); (c) scheme modelling of Ti sites on two different faces interacting with CO molecules and the frequency values of the corresponding bands at maximum coverage (black bold line).

Figure 5.
UV-Vis spectra of S-doped TiO2 (red curve) and pure TiO2 (black curve) used as a reference material. The Tauc plot of both samples is shown in the inset. An example of a Tauc Plot is reported in ref. [49].
Figure 5.
UV-Vis spectra of S-doped TiO2 (red curve) and pure TiO2 (black curve) used as a reference material. The Tauc plot of both samples is shown in the inset. An example of a Tauc Plot is reported in ref. [49].

© 2017 by the authors. Licensee MDPI, Basel, Switzerland. This article is an open access article distributed under the terms and conditions of the Creative Commons Attribution (CC BY) license (http://creativecommons.org/licenses/by/4.0/).
Share and Cite
MDPI and ACS Style
Cravanzola, S.; Cesano, F.; Gaziano, F.; Scarano, D. Sulfur-Doped TiO2: Structure and Surface Properties. Catalysts 2017, 7, 214. https://doi.org/10.3390/catal7070214
AMA Style
Cravanzola S, Cesano F, Gaziano F, Scarano D. Sulfur-Doped TiO2: Structure and Surface Properties. Catalysts. 2017; 7(7):214. https://doi.org/10.3390/catal7070214
Chicago/Turabian StyleCravanzola, Sara, Federico Cesano, Fulvio Gaziano, and Domenica Scarano. 2017. "Sulfur-Doped TiO2: Structure and Surface Properties" Catalysts 7, no. 7: 214. https://doi.org/10.3390/catal7070214
Note that from the first issue of 2016, this journal uses article numbers instead of page numbers. See further details here.