Electroreduction of CO2 into Ethanol over an Active Catalyst: Copper Supported on Titania

Shanghai Key Laboratory of Green Chemistry and Chemical Processes, School of Chemistry and Molecular Engineering, East China Normal University, Shanghai 200062, China
*
Authors to whom correspondence should be addressed.
Catalysts 2017, 7(7), 220; https://doi.org/10.3390/catal7070220
Submission received: 15 June 2017
/
Revised: 15 July 2017
/
Accepted: 18 July 2017
/
Published: 20 July 2017
(This article belongs to the Special Issue Advances in Electrocatalysis)
Abstract
:A simple, inexpensive, and novel method was used to prepare electrocatalysts from Cu supported on titanium dioxide (Cu/TiO2). XRD, SEM, and TEM characterizations confirmed different loadings of Cu nanoparticles (NPs) on TiO2. Cyclic voltammetry tests indicated that Cu/TiO2 exhibited lower overpotential for CO2 reduction than that of Cu NPs. Moreover, 40 wt % Cu/TiO2 exhibited the highest faradaic efficiency for ethanol (FEethanol) of 27.4%, which is approximately 10-fold higher than that for Cu NPs (FEethanol = 2.7%). The 40 wt % Cu/TiO2 electrocatalyst exhibits a stable current density of 8.66 mA/cm2 over a 25 h stability test. The high efficiency towards CO2 electroreduction to ethanol may be attributed to the synergistic effect of Cu and TiO2 NPs. This work highlights the importance of compositional effect of NPs on their catalytic activities and provides a strategy for designing efficient catalysts for CO2 electroreduction in the future.

1. Introduction
Large-scale consumption of fossil fuel has increased CO2 concentration in the atmosphere. High atmospheric CO2 concentrations are associated with greenhouse effect and climate change, which have gained increased research attention [1,2]. Once captured, CO2 is a potentially useful feedstock if it can be converted into formate/formic acid, carbon monoxide, or more highly reduced hydrocarbon products. Electroreduction is a potential efficient method for CO2 utilization and recycling, which can be performed at moderate temperature and atmospheric pressure and exhibits high product selectivity compared with other reduction methods, such as chemical, photochemical, and thermochemical methods. Besides, electrical energy could be provided by other green and sustainable energy sources, including wind, solar, and wave [3].
Hori et al. [4] performed pioneering works on electrochemical CO2 reduction using transition metal electrocatalysts. In addition to metal and metallic oxide, alloys and other semiconductors have been studied as catalysts. Thus far, few studies have investigated the use of metal supported on metal oxides to form different composites, which have been reported to possess improved faradaic efficiencies (FEs) for CO2 reduction compared to both parent metal and metal oxide. Besides, support materials have been designed to support and stabilize small nanoparticles (NPs) with high current density (J) and FE. For instance, Yu and his team [5] report that copper nanoparticle interspersed MoS2 nanoflowers facilitate CO2 electroreduction to hydrocarbon, such as CH4 and C2H4 with high FE at low overpotentials. Sun et al. [6] demonstrated a new strategy of controlling synergistic effect between Cu and SnO2 in the core/shell Cu/SnO2 structure to achieve selective electrochemical reduction of CO2 to CO with FE reaching 93% at −0.7 V vs. reversible hydrogen electrode (RHE) in 0.5 M KHCO3.
Compared with the noble metals, such as Pd [7] and Au [8], Cu has been considered an ideal electrode material for CO2 reduction because of its low cost and good catalytic effect. According to a previous report [9,10], it is the only metal electrocatalyst possessing the ability to form a substantial amount of hydrocarbons, which are regarded as ideal products due to their high energy density. Strasser et al. [11] used Cu NPs with different thicknesses as catalysts in electroreduction of CO2 into CH4 and C2H4; the investigated activity-selectivity-size relations provide novel insights into the CO2 electroreduction reaction on nanoscale surfaces. Kuhl et al. [12] reported new insights into the electrochemical reduction of CO2 on a metallic copper surface and observed a total of 16 different CO2 reduction products, such as methanol, ethanol, formate, and methane.
Normally, titanium on its own has no significant catalytic activity towards CO2 electroreduction. However, TiO2 has shown some activity in both photocatalysis and electrocatalysis for CO2 reduction [13,14,15]. When thin TiO2 films or mixtures of TiO2 and other metal and metal oxides are used as an electrocatalyst to catalyze CO2 electroreduction, they show more excellent performance than TiO2 NPs. For example, in the preparation of a CO2 catalytic electrode, Monnier et al. [15] prepared TiO2, TiO2-Ru (or RuO2), and TiO2-Pt thin film electrodes by thermal deposition on titanium rods. Bandi [16] deposited metallic oxide mixtures (including RuO2, TiO2, MoO2, Co3O4, and Rh2O3) on titanium foil. Cueto and Hirata [17] prepared a TiO2-indium-tin oxide thin-film glass electrode via a fixed-potential bulk electrolysis process, in which 1-butyl-3-methylimidazolium tetrafluoroborate (BMImBF4, an ionic liquid) was used as both solvent and supporting electrolyte. In addition, TiO2 acts as a redox electron carrier that facilitates various reduction reactions, which include CO2 conversion [18,19]. The TiO2 surface assists in CO2 adsorption to stabilize the intermediate of CO2 electroreduction and reduces the overpotential [20,21]. In fuel cells, Pt-supported titanium dioxide exhibits improved electrocatalytic properties, such as increased Pt catalyst activity, stability, and durability [22]. To the best of our knowledge, however, no comprehensive research reports the synergistic effect of Cu and TiO2 on the stability of the composite electrocatalysts for CO2 reduction. Inspired by the initial results of Cu-based materials, we successfully synthesized TiO2 as catalyst support for Cu in electroreduction of CO2. Structural characterizations and electrochemical experiments were performed to compare different Cu loadings supported on TiO2. Cu nanocatalysts supported on TiO2 show high catalytic activity for CO2 electroreduction to ethanol.
2. Results and Discussion
2.1. Performance Comparison of Different Cu-Supported TiO2 Catalysts
Cu/TiO2 catalysts were characterized through powder X-ray diffraction (XRD) analysis. Figure 1 (curves b–h) shows diffraction peaks at 43.3°, 50.4° and 74.1°, which are attributed to Cu (111), (200) and (220) reflections, respectively. The rest of peaks can be ascribed to the TiO2, which were observed in Figure 1 (curves a–g), indicating that Cu and TiO2 formed a composite electrocatalyst. Moreover, the peaks of Cu became evident in the XRD patterns with increasing Cu proportion. The presence of Cu and TiO2 was confirmed by energy dispersive X-ray (EDX) analysis (Figure S1, Supplementary Materials (SM)); the results showed signals corresponding to copper, titanium, and oxygen. The values for actual Cu loading of the synthesized catalysts are determined through inductive coupled plasma (ICP) emission spectrometer (Table 1). The actual loading values are consistent with the predicted values.
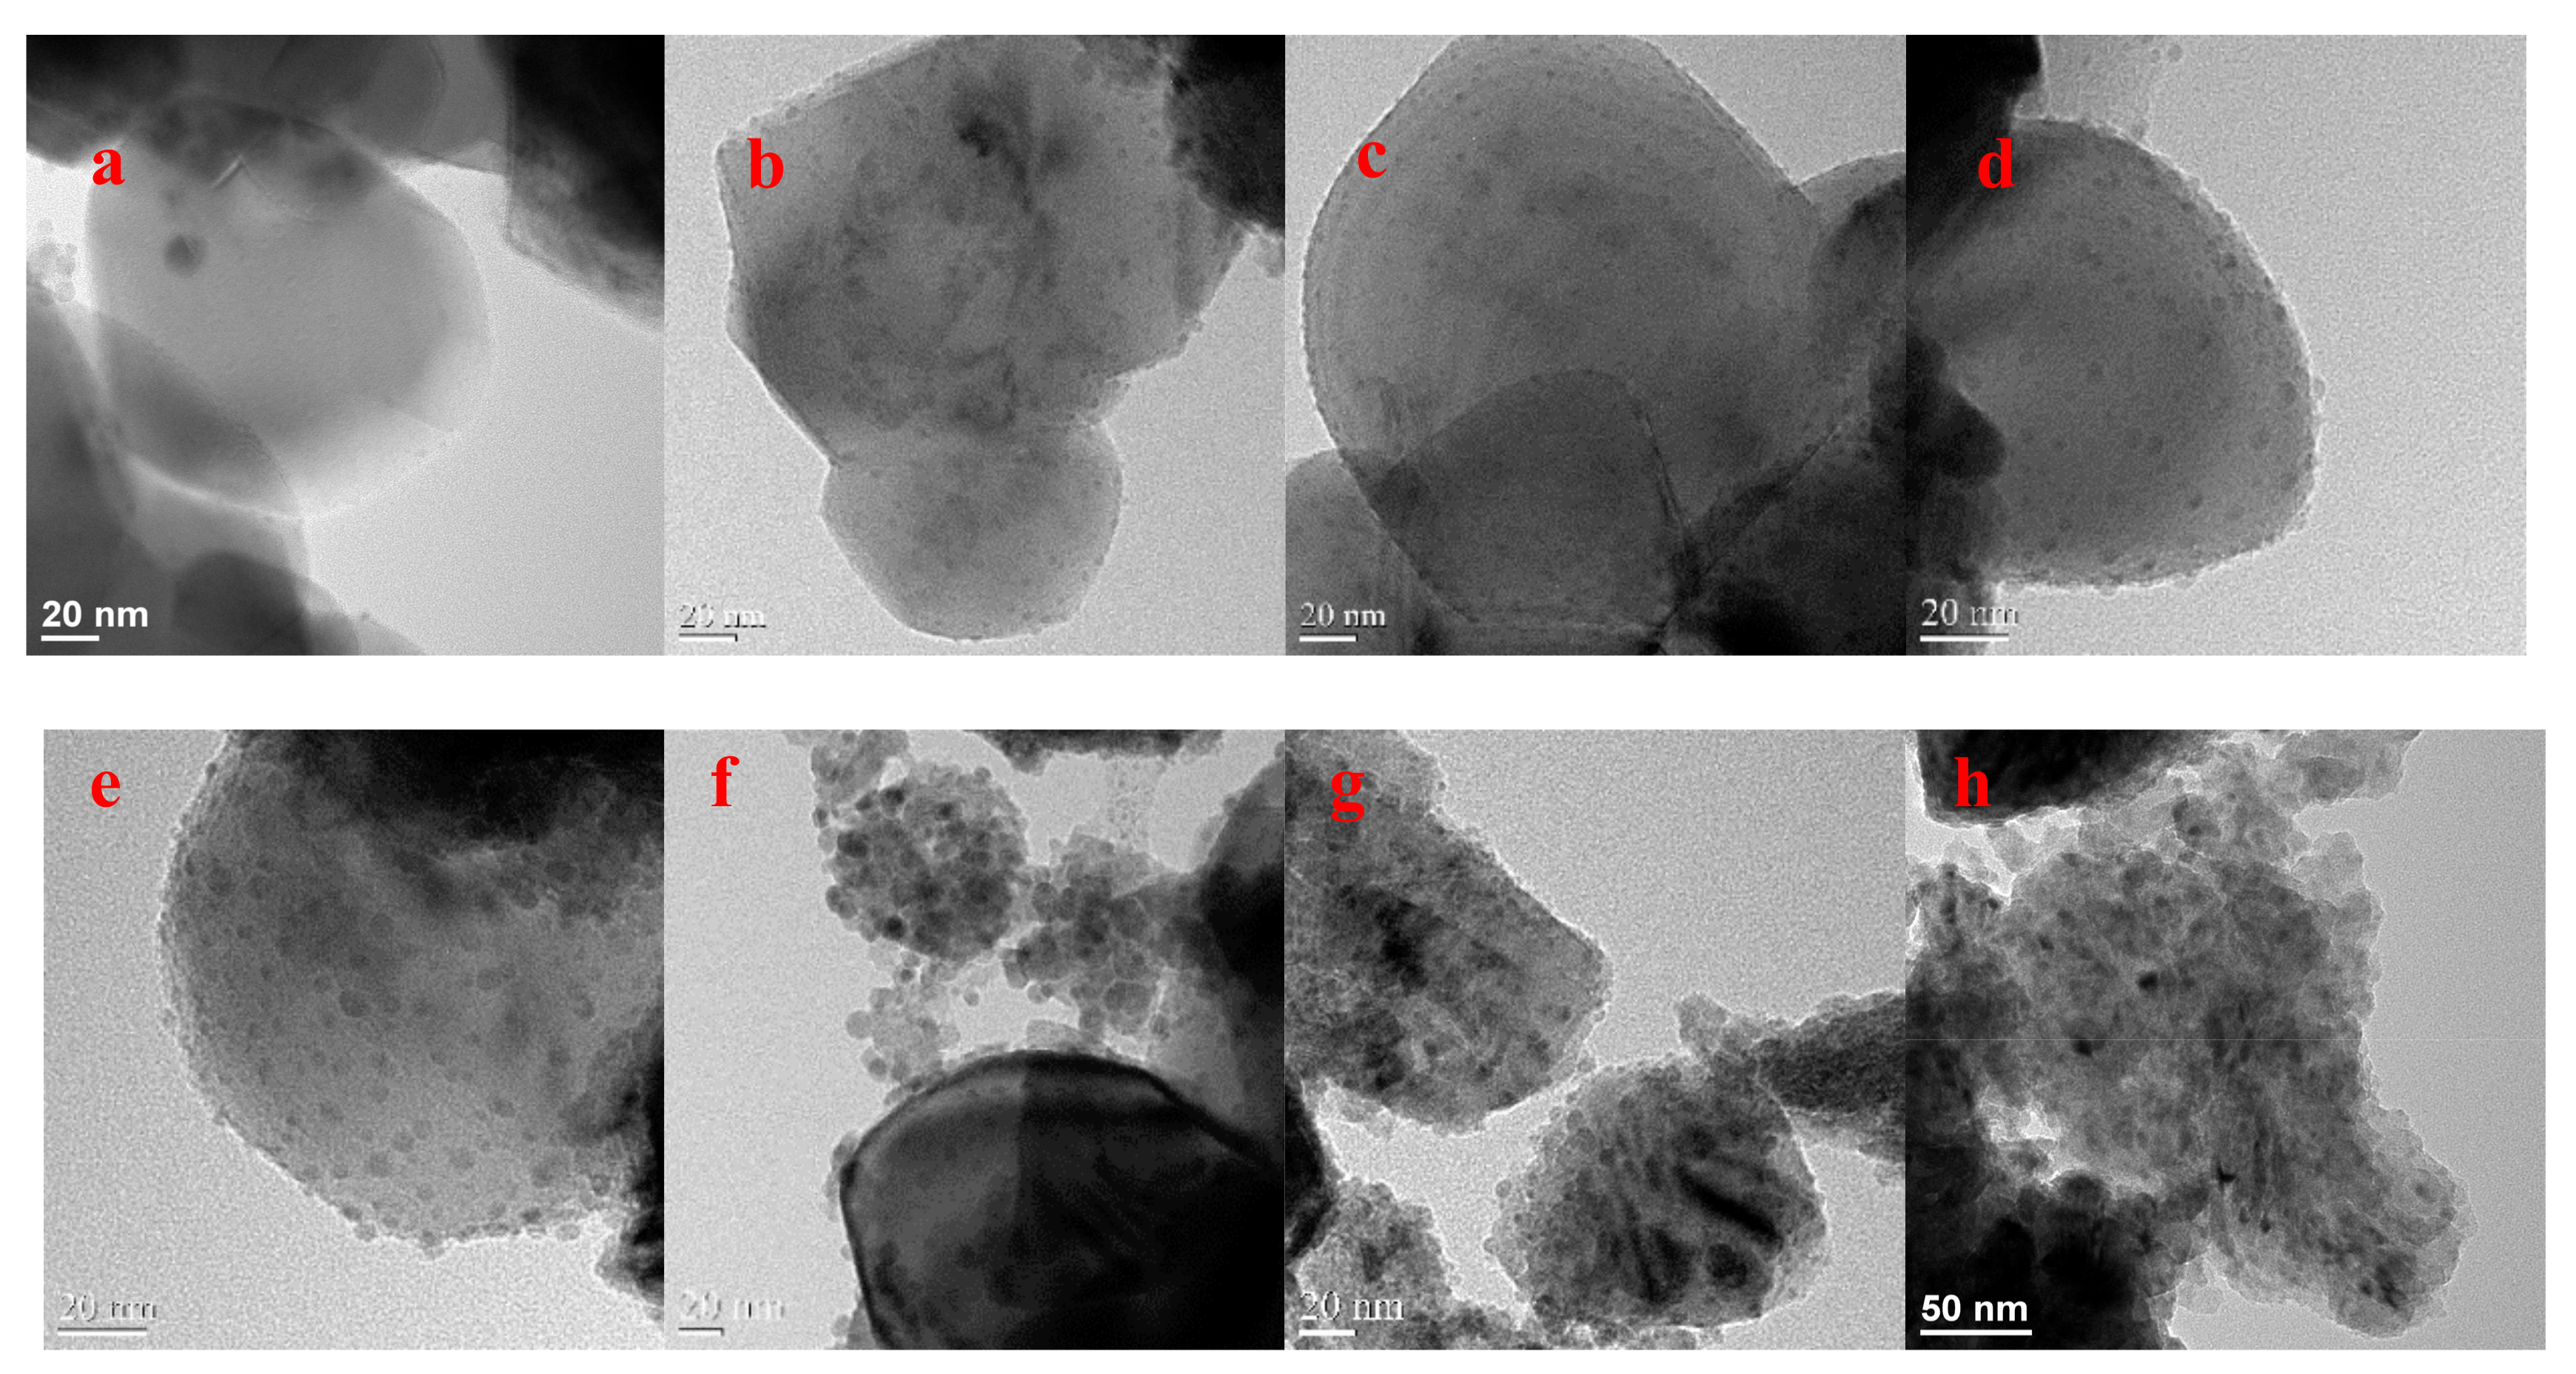
Scanning electron microscopy (SEM) and transmission electron microscopy (TEM) images were collected to observe morphological differences among Cu/TiO2 catalysts (Figure 2 and Figure S2 in SM). The results indicated how Cu NPs are progressively loaded on the TiO2 surface. The Cu/TiO2 catalysts possess a three-dimensioned (3D) irregular nanoblock structure, with an average size of about 300 nm, and are covered with tiny NPs. Cu NPs gradually spread all over the TiO2 surface, forming a massive and compact layer, with increasing Cu loadings. For few Cu loadings, TiO2 was clearly covered by the sporadic Cu particles. Unexpectedly, the TEM images of 60 wt % and 80 wt % Cu/TiO2 showed that Cu NPs are more prone to agglomerate than 40 wt % Cu/TiO2, which stem from the increased loading of Cu, leading to the decline of active sites for CO2 reduction. Predictably, the current density and FE on 60 wt % and 80 wt % Cu/TiO2 are lower than those observed on 40 wt % Cu/TiO2; this finding will be comprehensively described in the catalyst test section. Interestingly, without TiO2 as support material, Cu NPs exhibited a large diameter, which varied between 20 and 100 nm. Thus, TiO2 helps to create and stabilize small and well-dispersed Cu NPs, which allows more active sites-Cu NPs for CO2 reduction.
2.2. Catalyst Activity in a Standard Three-Electrode Cell
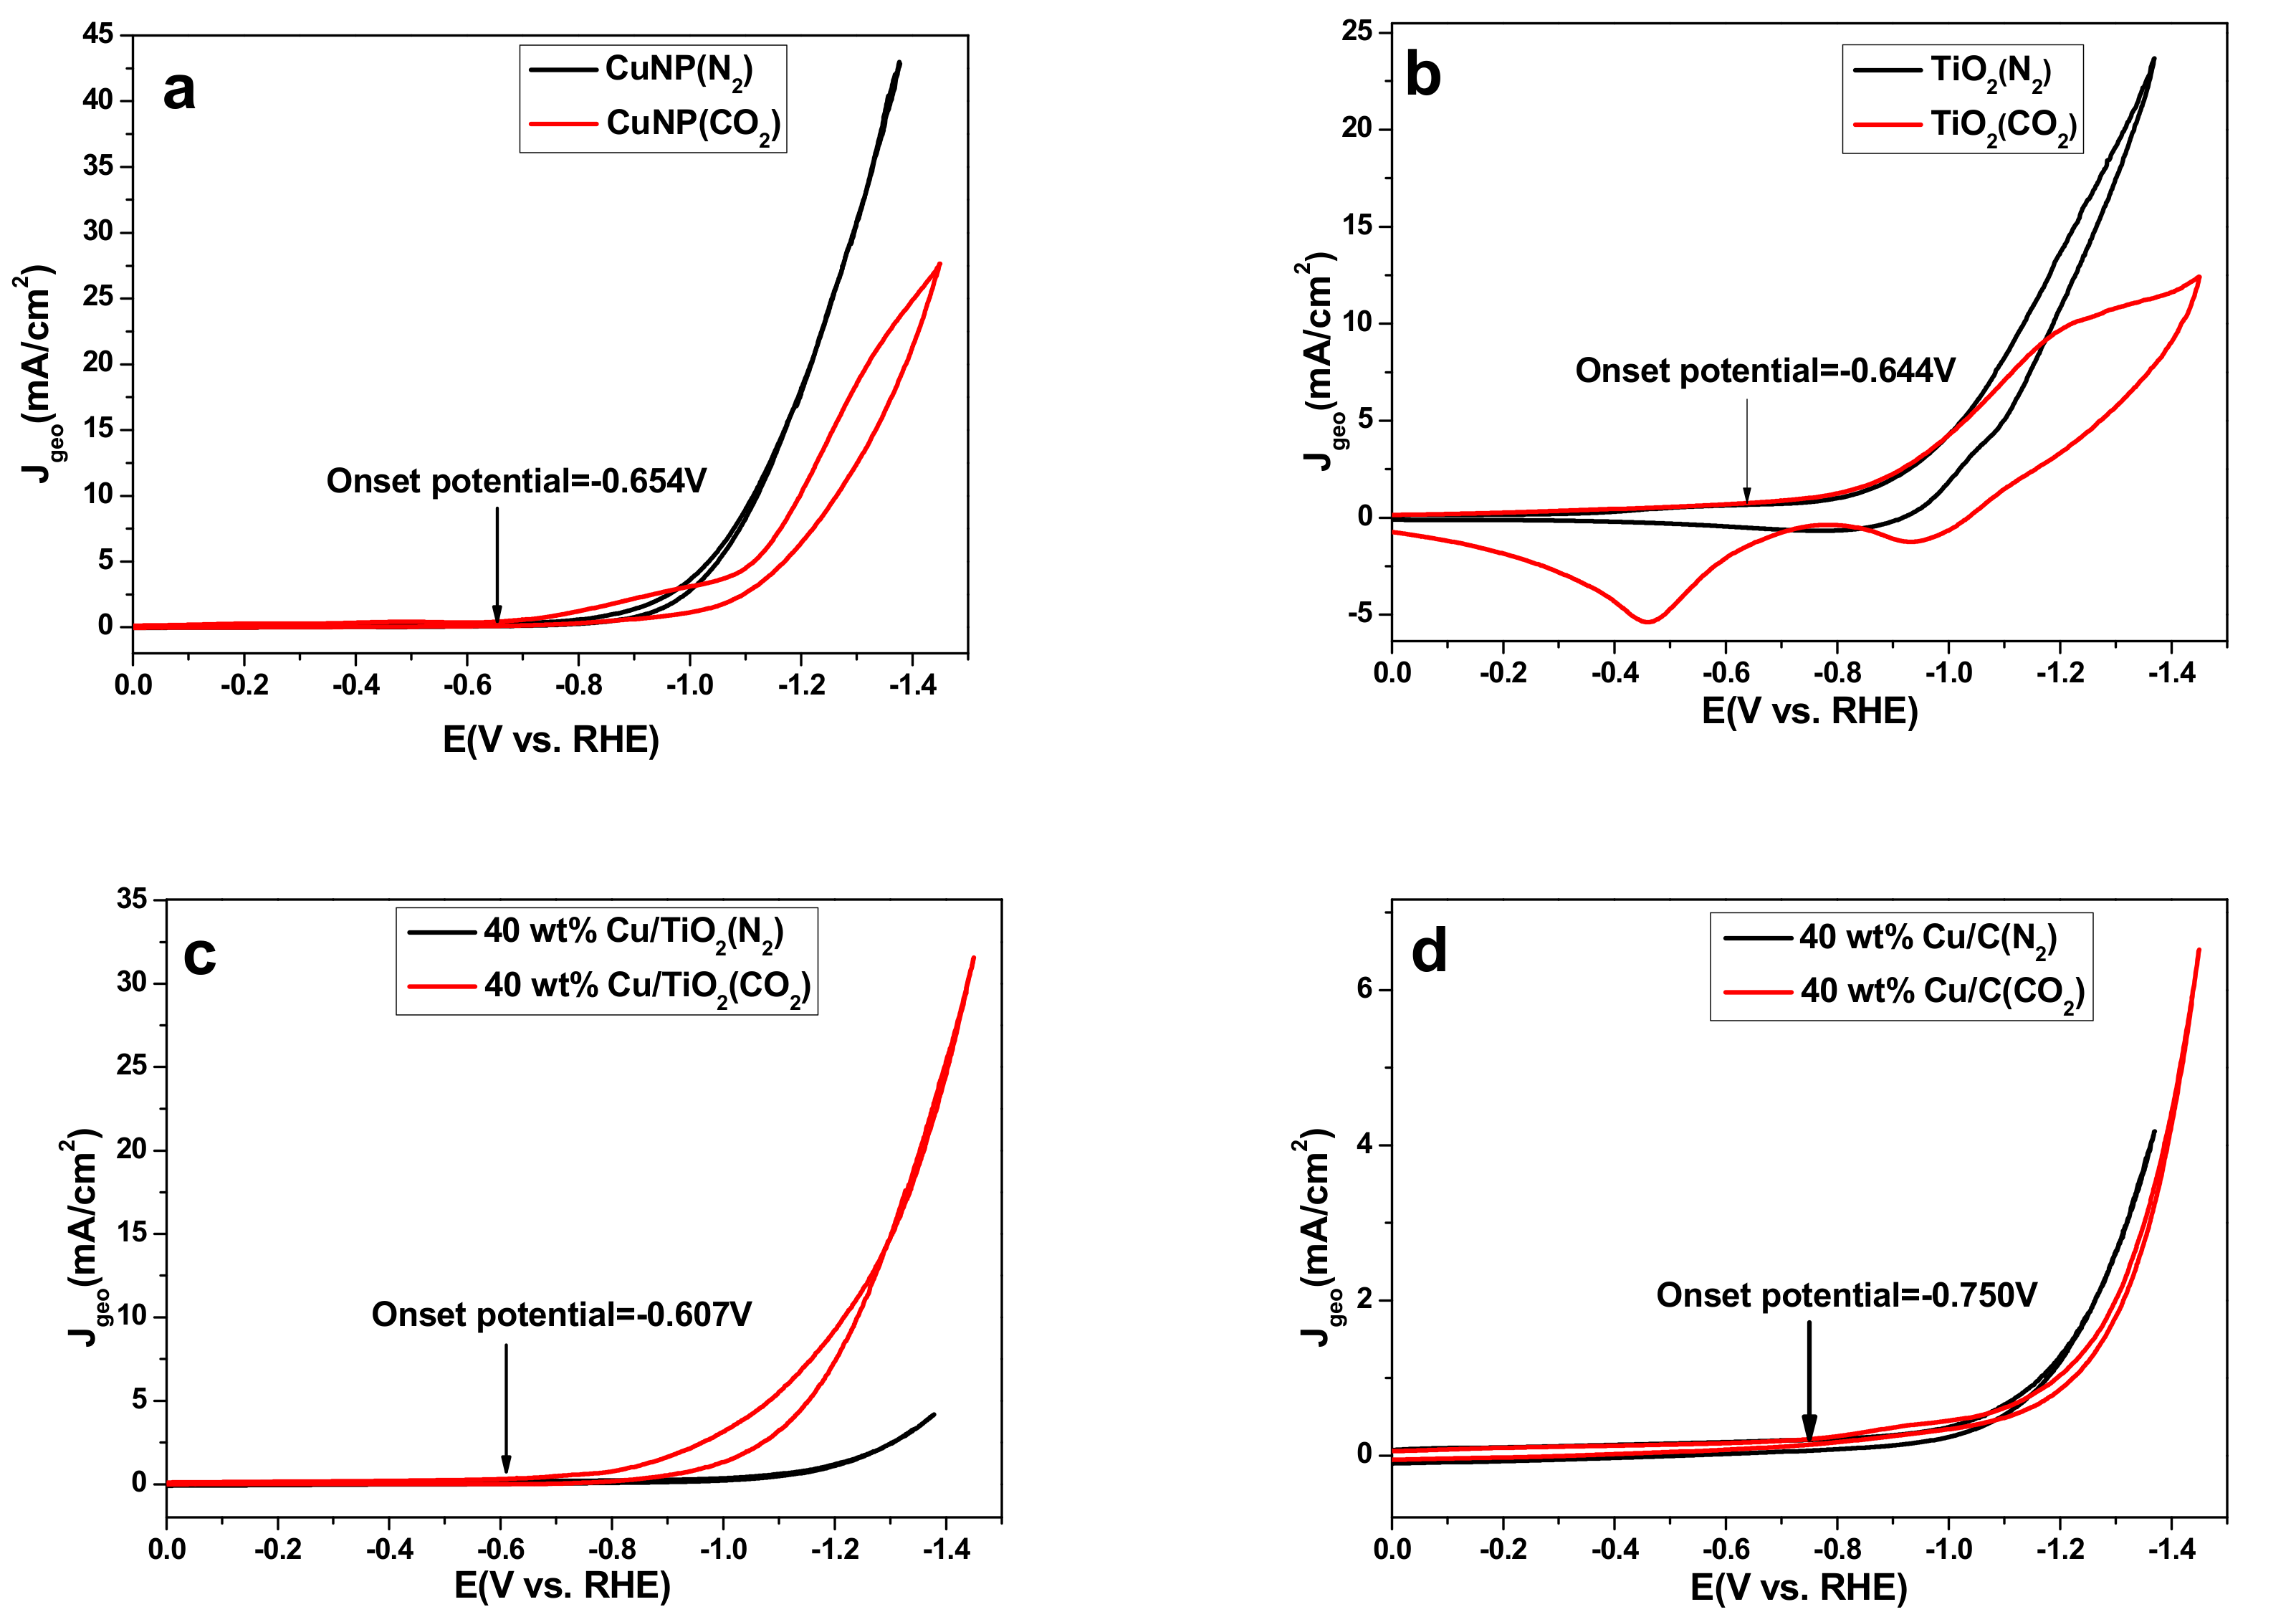
Figure 3 shows the cyclic voltammograms (CVs) obtained with pure Cu NPs, TiO2, 40 wt % Cu/TiO2 and 40 wt % Cu/C, which was successfully synthesized, characterized by XRD, SEM, and TEM (Figures S3–S5, SM), coated on glass carbon electrode (d = 2 mm). When the electrolyte was bubbled with CO2, reduction peaks associated with CO2 reduction were observed. Comparison of Figure 3a,c,d, 40 wt % Cu/TiO2 (−0.607 V vs. RHE) showed a 47 mV lower onset potential for CO2 reduction than that on Cu NPs (−0.654 V vs. RHE) and a 143 mV lower onset potential than 40 wt % Cu/C (−0.750 V vs. RHE), respectively. The improvement of 40 wt % Cu/TiO2 may be because of the adsorption and stabilization of CO2 on the TiO2 surface [23]. In order to better explain the phenomenon, TiO2 alone as catalyst exhibited low onset potential of −0.644 V vs. RHE for CO2 electroreduction (Figure 3b). The large overpotential of CO2 reduction could be due to the barrier of the initial electron in forming a CO2− intermediate, which exhibits poor stability on most metal surfaces [4]. The CV of the 40 wt % Cu/TiO2 catalyst was seen to have an earlier onset potential, which is in agreement with the better performance on the 40 wt % Cu/TiO2 catalyst surface than that on the Cu NPs and 40 wt % Cu/C catalysts surface. In addition, for the pure Cu NPs electrode, as shown in Figure 3a, much higher reduction current density Jgeo (based on geometric area of 0.0314 cm2) was observed for N2 saturated solution than that for CO2 saturated solution. It strongly indicates CO2 reduction reaction was inhibited on the surface of Cu NPs in the entire potential range. The Jgeo of 40 wt % Cu/C presents a slight increase under CO2 atmosphere compared with N2 atmosphere. However, in sharp contrast, for 40 wt % Cu/TiO2 sample, rapid increment of the Jgeo was observed under both conditions, in comparison with the Jgeo curve (black line) in N2 atmospheres, the CO2-saturated solution showed larger Jgeo in the entire potential range, which indicates 40 wt % Cu/TiO2 sample exhibited obvious catalytic activity towards CO2 reduction (Figure 3c). Besides, the maximum Jgeo in CO2 saturated solution of Cu NPs and 40 wt % Cu/C are 27.94 mA/cm2 and 6.7 mA/cm2 at −1.45 V vs. RHE, respectively, which are lower than the Jgeo of 40 wt % Cu/TiO2 (31.79 mA/cm2) at −1.45 V vs. RHE. This once again proves that 40 wt % Cu/TiO2 shows remarkable performance of CO2 electroreduction, which was reconfirmed by the electrolytic data in the following text.
2.3. The Electrocatalytic Activity of Various Cu/TiO2
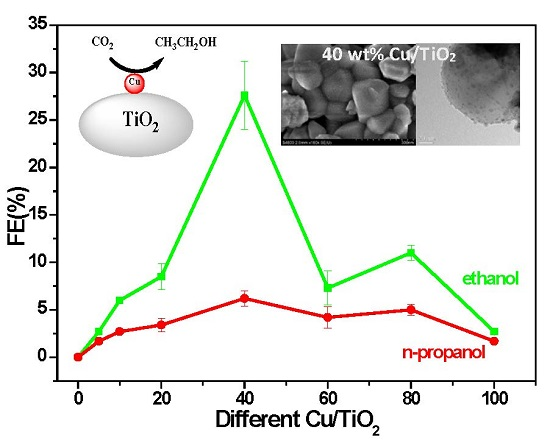
Electrolysis was performed in 0.2 M KI solution saturated with CO2 at a constant cathodic potential of −1.45 V vs. RHE to evaluate the catalytic activity of Cu/TiO2. The products were detected through GC analysis (Figure S6, SM). The results demonstrated that ethanol (with little propanol and trace methanol) is the main product, and we are only interested in liquid products. Figure 4 reveals a dramatic difference in the amount of Cu content in the overall CO2 electrocatalytic reduction activity of Cu/TiO2. In the case of bare TiO2 catalyst, neither ethanol nor n-propanol were detected after electroreduction of CO2. Comparatively, after loading of the Cu NPs, 40 wt % Cu/TiO2 exhibited the optimal performance in terms of total FE (33.6%) among all the prepared samples. The total FE decreased to about 10−16% for loadings of 20, 60, and 80 wt % and to below 10% for loading of 10 wt %; the efficiency significantly decreased for loadings of 5 wt % and pure Cu NPs. For the sake of explaining the phenomenon, the TEM images of various Cu/TiO2 were again compared and analyzed, and electrochemistry surface area (ECSA) test of various Cu/TiO2 were carried out. As the TEM images in Figure 2 and histograms in Figure S7 (SM) show, the TEM images of 60 wt % and higher content of Cu samples suggest that Cu particles are more prone to agglomerate than 40 wt % sample, resulting in smaller surface area for these samples, and then the active surface of samples for CO2 electroreduction decrease, which was consistent with the results of ECSA test for various Cu/TiO2 (Figure S8 and Table S1, SM). Moreover, as seen from Figure 4 and Table S1 (SM), along with the mass ratio of Cu NPs in the Cu/TiO2 samples increasing, the catalytic activity and ECSA revealed synchronous change. 40 wt % Cu/TiO2 possesses a largest ECSA of 3.32 cm2 in all various Cu/TiO2 catalysts. Besides, 60 wt % Cu/TiO2 displays lower catalytic activity than 80 wt %, due to the decrease of active surface, as confirmed by ECSA. It could be clearly seen that the catalytic activity of various Cu/TiO2 had a close connection to the corresponding ECSA. In fuel cell applications, Ag supported on titanium dioxide exhibited the same properties [23]. For comparison, potentiostatic electrolysis was conducted by applying a potential of −1.45 V vs. RHE on 40 wt % Cu/C in 0.2 M KI solution saturated with CO2, which only results in 8.4% FE for ethanol. As shown in Table S1 (SM), both ECSA and current density JECSA (based on ECSA) of 40 wt % Cu/C were smaller than those of 40 wt % Cu/TiO2, which indicates that high performance for CO2 electroreduction on Cu/TiO2 may be ascribed to the synergistic effect between Cu and TiO2. Furthermore, although 5 wt % Cu/TiO2 and Cu NPs have a similar ECSA (Table S1, SM), the JECSA of 5 wt % Cu/TiO2 was slightly larger than the one of Cu NPs. It was reconfirmed that the prepared composites with excellent activity for CO2 conversion are obtained by the synergetic effect of Cu NPs and TiO2.
2.4. Electrocatalytic Characterization
We also explored the performance of the catalyst amounts. The amounts of the catalyst loading—such as 0.5, 1, 2, 3, 4, and 5 mg·cm−2—for 40 wt % Cu/TiO2 were painted on a carbon paper to form a cathode. As shown in Table 2, the catalyst amount of 1 mg·cm−2 exhibited the optimal performance among all other amounts. Despite the increasing catalyst amount from 0.5 to 5 mg·cm−2, the activity did not increase. The accessible surface area is not proportional to the corresponding catalyst loading. This finding is important because the resulting activity is correlated with the actual active surface area. Thus, to evaluate this finding, we performed SEM for analyzing the catalytic layer thickness and morphology of the as-prepared electrodes. The SEM images (Figure S9, SM) indicate how the Cu/TiO2 NPs are progressively deposited on the carbon paper with increasing catalyst loading. Interestingly, for high loadings (3, 4, and 5 mg·cm−2), the Cu/TiO2 NPs completely cover the porous structure of the carbon paper, forming a massive and compact layer, which results in Cu/TiO2 NPs hardly contacting the catholyte and CO2. For low loadings (0.5 mg·cm−2), the carbon fibers were uncovered by the Cu/TiO2 NPs, and these fibers were deposited and formed clusters. Despite the clusters being relatively well accessible for the reactants, the amount of the electrocatalytic material is very low, thus the activities are also low. An intermediate situation was observed for medium loadings (1 and 2 mg·cm−2). In these electrodes, the carbon fibers were well covered with the Cu/TiO2 NPs, and a massive and compact layer was not formed. The limit for the massive and compact layer formation is approximately 1 mg·cm−2 metal loading. These observations are in accordance with the results shown in Table 2.
In order to evaluate the optimal potential, CO2 reduction measurements on 40 wt % Cu/TiO2 exhibiting its superior electrochemical characteristics was firstly carried out at the potential range from −1.05 to −2.05 V vs. RHE. Figure 5 shows the remarkable influence of cathodic potential on FE. As cathodic potential shifts from −2.05 V to −1.05 V vs. RHE, the total FE increased first, reached a maximum of 33.6% at −1.45 V vs. RHE, and decreased to 2.2% at −1.05 V vs. RHE. Similar results were found for the FE of ethanol, whereas it is almost insensitive to n-propanol. Presumably, the pathways for ethanol and propanol production are different, resulting in different FE tendencies. The total JECSA increased with decreasing potential. However, partial JECSA for ethanol is very different from the total JECSA and achieves the maximum at −1.45 V vs. RHE (Figure 5). This fact may be mainly caused by the competitive hydrogen evolution reaction, which becomes important for negative potentials that decrease the objective FEs.
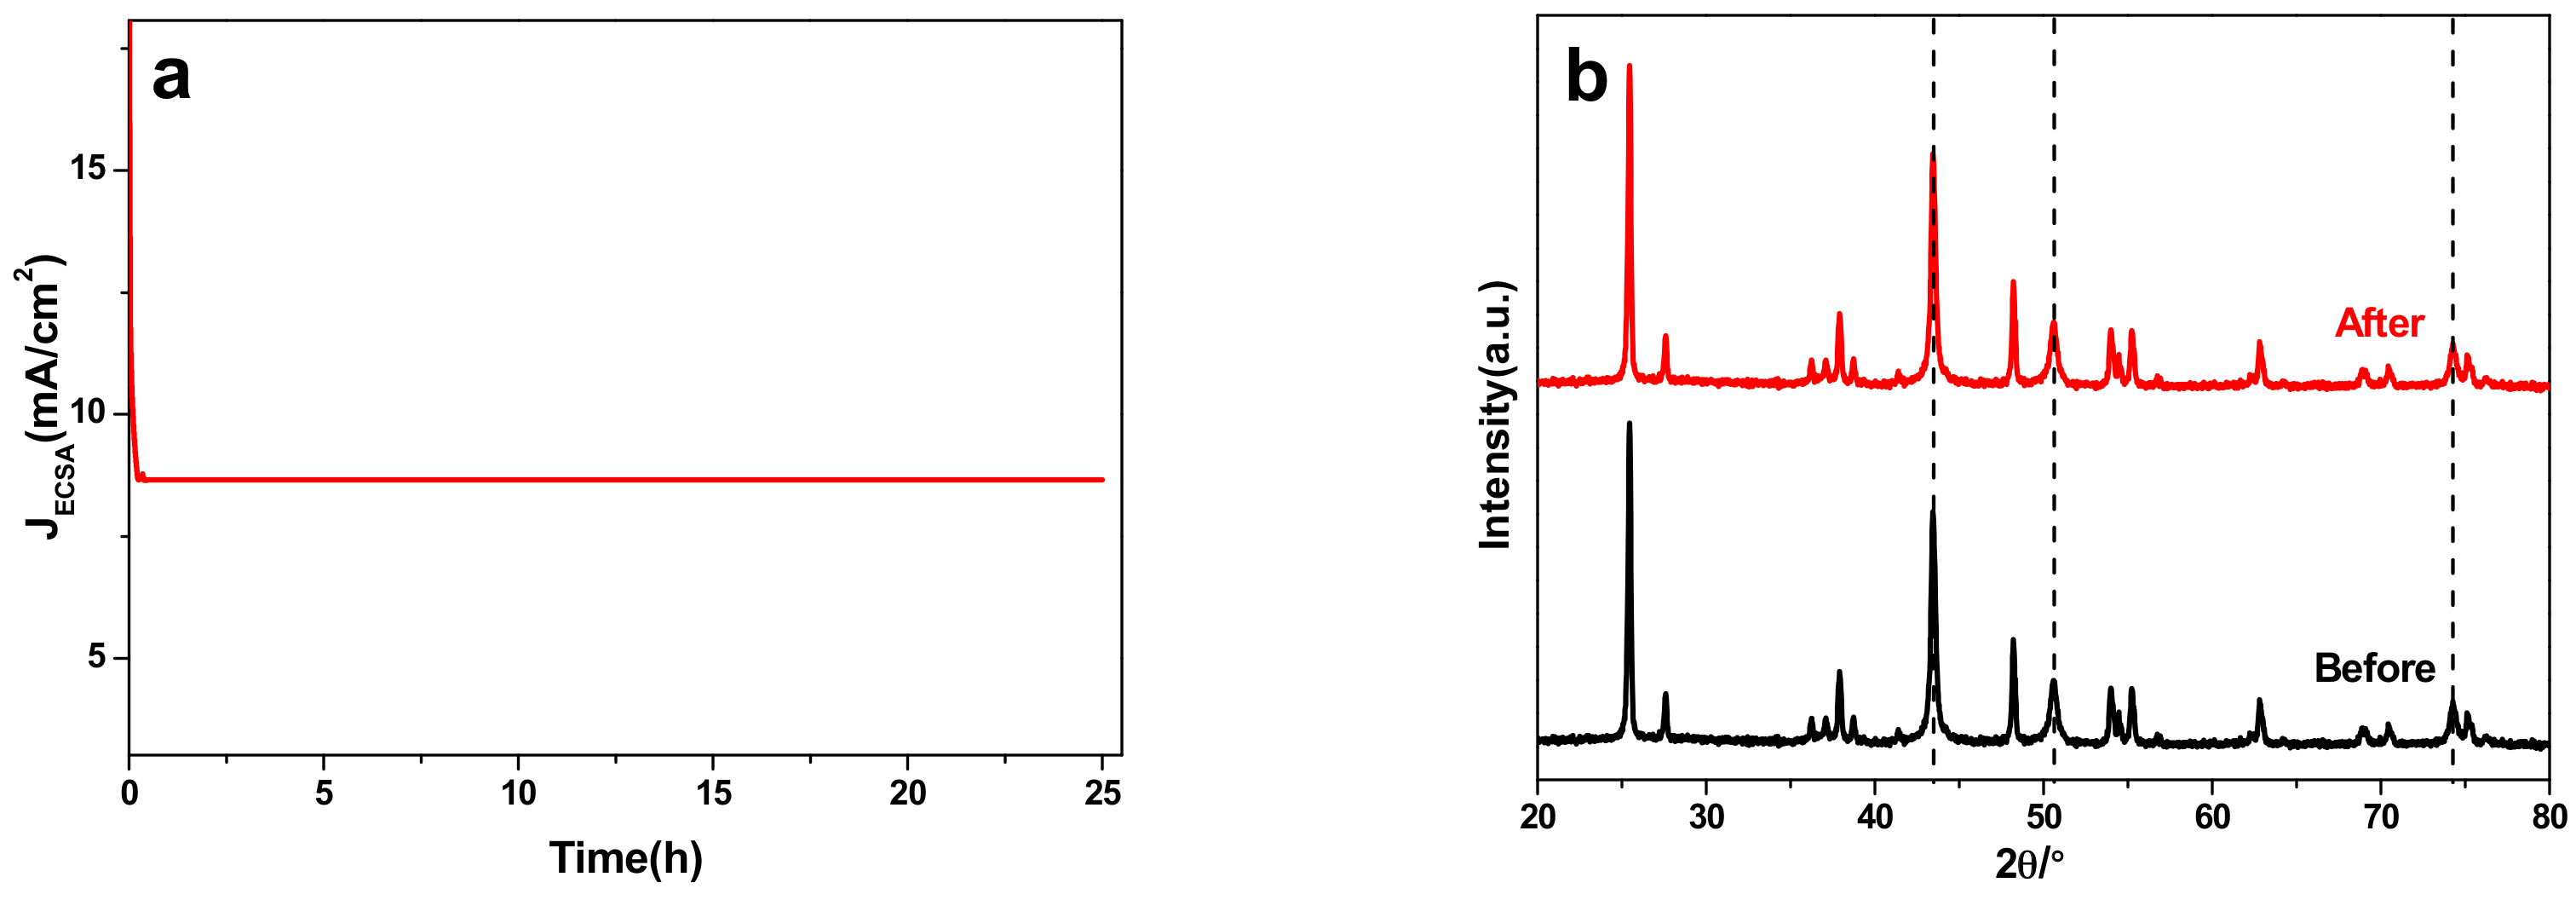
To evaluate the stability of 40 wt % Cu/TiO2 electrocatalysts, potentiostatic electrolysis measurements were carried out in continuous CO2 electrochemical reduction at the optimal potential over a long time test. Figure 6a displays the JECSA vs. time curve at the corresponding potentials for 25 h. It can be clearly seen that the JECSA is sharply decreased at the beginning of about 25 min, and then keeps steady at a constant value (8.66 mA/cm2), indicating its excellent stability as well. Figure 6b shows the comparison of XRD curves for 40 wt % Cu/TiO2 before and after 25 h reaction, of which the significant characteristic diffraction peaks for Cu NPs were represented by the dash lines. Similarly, there was not any obvious variation in the XRD curves for 40 wt % Cu/TiO2, which offers powerful proof of the excellent stability of 40 wt % Cu/TiO2. Furthermore, the comparison of SEM images of 40 wt % Cu/TiO2 before and after 25 h reaction is presented in Figure S10 (SM). The negligible difference presented in the Figure S10 (SM) demonstrates the superior stability of 40 wt % Cu/TiO2 samples in a prolonged electrochemical process.
3. Materials and Methods
3.1. Materials
Cu(NO3)2·3H2O, sodium citrate and hydrazine hydrate (AR grade), TiO2 (CP grade) were purchased from Sinopharm Chemical Reagent Co. (SCR, Shanghai, China) with 99% purity. Conductive carbon black (C, VXC72R) was purchased from Shanghai Hesen Electrical Co. (Shanghai, China) Nafion® 117 solution (5%) and Nafion® 117 membrane was obtained from Dupont (Wilmington, DE, USA).
3.2. Material Characterization and Product Measurement
Potentiostatic electrolysis and cyclic voltammetry were performed using a CHI 660 C electrochemical station (Shanghai Chenhua Instrument Co. Ltd., Shanghai, China). Crystal-phase XRD patterns of Cu/TiO2 catalysts were recorded using an Ultima IV X-ray powder diffractometer (Kurary, Tokyo, Japan) equipped with Cu Kα radiation (k = 1.5406 Å). The SEM image of the samples was obtained using a Hitachi S-4800 field-emission scanning electron microscope (Tokyo, Japan). The average particle size and different morphologies of the samples were analyzed using a high-resolution Hitachi JEM-2100F transmission electron microscope (Tokyo, Japan). The values for actual Cu loading of the synthesized catalysts were determined on an inductively coupled plasma atomic emission spectroscopy (IRIS Intrepid II XPS, Waltham, MA, USA). Liquid-phase products were analyzed by gas chromatography instrument equipped with a flame ionization detector (SHIMADZU, GC-2014C, Tokyo, Japan). Analysis of the product (Figure S3, SM) and calculation of FE (Equation (S1), SM) are detailed in SM.
3.3. Material Synthesis
Citrate-protecting method was used to obtain different Cu/TiO2 catalysts. For synthesis of 40 wt % Cu/TiO2, Cu(NO3)2·3H2O (0.761 g) was dissolved in the distilled water (60 mL). TiO2 (0.300 g) was added to the solution and stirred for 40 min. Sodium citrate (1.471 M, 20 mL) dropwise was then added to the solution and stirred. Cu2+ was reduced by dropwise addition of hydrazine hydrate (50%, 5 mL) with vigorous stirring at room temperature. After gently stirring the solution overnight, the mixture was centrifuged, washed with distilled water, and dried in a vacuum oven at 80 °C for 4 h. Samples with Cu loadings of 5, 10, 20, 60, and 80 wt % were obtained by changing the amount of TiO2, while pure Cu NPs was prepared without addition of TiO2. Moreover, the prepared of 40 wt % Cu/C was used the same method, just replacing TiO2 to C.
3.4. Electrode Preparation and Electrochemical Test
In electrochemical measurements, X wt % Cu/TiO2 NPs were painted on a porous carbon paper (Toray, TGP-H60, Tokyo, Japan) to form the working electrodes. Potentiostatic electrolysis was carried out in a gas diffusion electrode cell, which contains a piece of Nafion® 117 cation exchange membrane (H+ form) as a separator, platinum plate electrode as a counter electrode, and saturated calomel electrode (SCE) as a reference electrode. KI aqueous solution (0.2 M) was used as electrolyte and saturated with CO2 by bubbling for 20 min before the electrolytic experiment. CO2 was bubbled continuously during the experiment. The electrochemical behavior of the electrodes was tested in a three-electrode electrochemical cell, with a specific volume of catalytic ink coated on the glass carbon electrode (diameter = 2 mm) as the working electrode. A platinum plate electrode was employed as a counter electrode, and SCE was used as reference electrode. All these tests were performed at ambient temperature and pressure. All potentials were converted into the reversible hydrogen electrode (RHE) by the conversion
E(RHE) = E(SCE) + 0.059 × pH + 0.241.
4. Conclusions
The electroreduction of CO2 to ethanol under ambient conditions was investigated on Cu/TiO2 electrodes in a CO2-saturated KI aqueous solution. By using TiO2 as support, small and well-dispersed Cu NPs are loaded on the TiO2 surface simply, which is beneficial for CO2 electroreduction. Among various Cu/TiO2 catalysts, 40 wt % (the optimal mass ratio) shows the highest electrocatalytic activity with the total FE, which is approximately eight-fold higher than the unsupported Cu NPs. The 40 wt % Cu/TiO2 electrode shows the highest current density compared with other Cu/TiO2 electrodes under similar experimental conditions. The prepared 40 wt % Cu/TiO2 with excellent activity for CO2 conversion is obtained by the high surface area effect and synergistic effect of Cu NPs and TiO2. In addition, the 40 wt % Cu/TiO2 possessed outstanding stability during a 25 h electrochemical process. It is anticipated that the Cu/TiO2 composite electrocatalyst may provide new insights for transition metal and metal oxide particles applied in CO2 conversion to useful chemicals.
Supplementary Materials
The following are available online at www.mdpi.com/2073-4344/7/7/220/s1. Figure S1. The EDX spectrums of Cu/TiO2: (a) 5 wt % Cu/TiO2, (b) 10 wt % Cu/TiO2, (c) 20 wt % Cu/TiO2, (d) 40 wt % Cu/TiO2, (e) 60 wt % Cu/TiO2, and (f) 80 wt % Cu/TiO2. Figure S2. SEM images of (a) pure TiO2, (b) 5 wt % Cu/TiO2, (c) 10 wt % Cu/TiO2, (d) 20 wt % Cu/TiO2, (e) 40 wt % Cu/TiO2, (f) 60 wt % Cu/TiO2, (g) 80 wt % Cu/TiO2, and (h) pure Cu NPs. Figure S3. XRD pattern of pure C (black line) and 40 wt % Cu/C (red line). Figure S4. SEM images of pure C (a) and 40 wt % Cu/C (b). Figure S5. TEM images of 40 wt % Cu/C. Figure S6. Gas chromatogram of product solution after a certain time bulk electrolysis of 0.2 M KI solution saturated with CO2 at a constant cathodic potential. Figure S7. TEM histograms of the Cu particle size distribution from: (a) 5 wt % Cu/TiO2, (b) 10 wt % Cu/TiO2, (c) 20 wt % Cu/TiO2, (d) 40 wt % Cu/TiO2, (e) 60 wt % Cu/TiO2, and (f) 80 wt % Cu/TiO2. Figure S8. CVs in the capacitance current range (from 0.35 to 0.10 V vs. SCE) with (a) 5 wt % Cu/TiO2; (b) 10 wt % Cu/TiO2; (c) 20 wt % Cu/TiO2; (d) 40 wt % Cu/TiO2; (g) 60 wt % Cu/TiO2; (f) 80 wt % Cu/TiO2; (g) pure Cu NPs, and (h) 40 wt % Cu/C in N2-saturated 0.5 M H2SO4 solution. Figure S9. SEM images of the 40 wt % Cu/TiO2 electrodes containing: (a) 0.5, (b) 1, (c) 2, (d) 3, (e) 4, and (f) 5 mg/cm2. Figure S10. SEM images of 40 wt % Cu/TiO2 (a) before and (b) after 25 h CO2 electrochemical reduction. Table S1. The analysis of ECSA and JECSA for ethanol and n-propanol on various Cu/TiO2 and 40 wt % Cu/C catalysts.
Acknowledgments
Financial support from National Natural Science Foundation of China (21173085, 21373090, 21473060, 21673078) is gratefully acknowledged.
Author Contributions
Jing Yuan and Rong-Rong Gou conceived of and designed the experiments. Jing Yuan, Li Liu, and Sheng Zeng performed the experiments. Jing Yuan and Huan Wang analyzed the data. Jing Yuan, Huan Wang, and Jia-Xing Lu wrote the paper.
Conflicts of Interest
The authors declare no conflict of interest.
References
- Figueroa, J.D.; Fout, T.; Plasynski, S.; McIlvried, H.; Srivastava, R.D. Advances in CO2 capture technology—The U.S. Department of Energy’s Carbon Sequestration Program. Int. J. Greenh. Gas Control. 2008, 2, 9–20. [Google Scholar] [CrossRef]
- Shakun, J.D.; Clark, P.U.; He, F.; Marcott, S.A.; Mix, A.C.; Liu, Z.Y.; Bliesner, B.O.; Schmittner, A.; Bard, E. Global warming preceded by increasing carbon dioxide concentrations during the last deglaciation. Nature 2012, 484, 49–54. [Google Scholar] [CrossRef] [PubMed]
- Olah, G.A.; Prakash, G.K.S.; Goeppert, A. Anthropogenic Chemical Carbon Cycle for a Sustainable Future. J. Am. Chem. Soc. 2011, 133, 12881–12898. [Google Scholar] [CrossRef] [PubMed]
- Hori, Y. Electrochemical CO2 reduction on metal electrodes. In Modern Aspects of Electrochemistry, 3rd ed.; Vayenas, C., Ed.; Faculty of Engineering, Chiba University: Chiba, Japan, 2008; Volume 42, pp. 89–189. [Google Scholar]
- Shi, G.D.; Yu, L.; Ba, X.; Zhang, X.S.; Zhou, J.Q.; Yu, Y. Copper nanoparticle interspersed MoS2 nanoflowers with enhanced efficiency for CO2 electrochemical reduction to fuel. Dalton Trans. 2017. [Google Scholar] [CrossRef]
- Li, Q.; Fu, J.J.; Zhu, W.L.; Chen, Z.Z.; Shen, B.; Wu, L.H.; Xi, Z.; Wang, T.Y.; Lu, G.; Zhu, J.J.; et al. Tuning Sn-Catalysis for Electrochemical Reduction of CO2 to CO via the Core/Shell Cu/SnO2 Structure. J. Am. Chem. Soc. 2017, 139, 4290–4293. [Google Scholar] [CrossRef] [PubMed]
- Lee, C.H.; Kanan, M.W. Controlling H+ vs. CO2 Reduction Selectivity on Pb Electrodes. ACS Catal. 2015, 5, 465–469. [Google Scholar]
- Feng, X.F.; Jiang, K.L.; Fan, S.S.; Kanan, M.W. Grain-Boundary-Dependent CO2 Electroreduction Activity. J. Am. Chem. Soc. 2015, 137, 4606–4609. [Google Scholar] [CrossRef] [PubMed]
- Li, C.W.; Kanan, M.W. CO2 Reduction at Low Overpotential on Cu Electrodes Resulting from the Reduction of Thick Cu2O Films. J. Am. Chem. Soc. 2012, 134, 7231–7234. [Google Scholar] [CrossRef] [PubMed]
- Gattrell, M.; Gupta, N. A review of the aqueous electrochemical reduction of CO2 to hydrocarbons at copper. J. Electroanal. Chem. 2006, 594, 1–19. [Google Scholar] [CrossRef]
- Reske, R.; Mistry, H.; Behafarid, F.; Cuenya, B.R.; Strasser, P. Particle Size Effects in the Catalytic Electroreduction of CO2 on Cu Nanoparticles. J. Am. Chem. Soc. 2014, 136, 6978–6986. [Google Scholar] [CrossRef] [PubMed]
- Kuhl, K.P.; Cave, E.R.; Abramc, D.N.; Jaramillo, T.F. New insights into the electrochemical reduction of carbon dioxide on metallic copper surfaces. Energy Environ. Sci. 2012, 5, 7050–7059. [Google Scholar] [CrossRef]
- Mori, K.; Yamashita, H.; Anpo, M. Photocatalytic reduction of CO2 with H2O on various titanium oxide photocatalysts. RSC Adv. 2012, 2, 3165–3172. [Google Scholar] [CrossRef]
- Fujishima, A.; Zhang, X.T.; Tryk, D.A. TiO2 photocatalysis and related surface phenomena. Surf. Sci. Rep. 2008, 63, 515–582. [Google Scholar] [CrossRef]
- Koudelka, M.; Monnier, A.; Augustynski, J. Electrocatalysis of the Cathodic Reduction of Carbon Dioxide on Platinized Titanium Dioxide Film Electrodes. J. Electrochem. Soc. 1984, 131, 745–750. [Google Scholar] [CrossRef]
- Bandi, A. Electrochemical Reduction of Carbon Dioxide on Conductive Metallic Oxides. J. Electrochem. Soc. 1990, 137, 2157–2160. [Google Scholar] [CrossRef]
- Cueto, L.F.; Hirata, G.A.; Sanchez, E.M. Thin-film TiO2 electrode surface characterization upon CO2 reduction processes. J. Sol–Gel Sci. Technol. 2006, 37, 105–109. [Google Scholar] [CrossRef]
- Beck, F.; Gabriel, W. Heterogeneous Redox Catalysis on Ti/TiO2 Cathodes-Reduction of Nitrobenzene. Angew. Chem. Int. Ed. 1985, 24, 771–772. [Google Scholar] [CrossRef]
- Chu, D.; Qin, G.; Yuan, X.; Xu, M.; Zheng, P.; Lu, J. Fixation of CO2 by electrocatalytic reduction and electropolymerization in lonic liquid-H2O solution. ChemSusChem 2008, 1, 205–209. [Google Scholar] [CrossRef] [PubMed]
- Tanaka, K.; Miyahara, K.; Toyoshima, I. Adsorption of CO2 on TiO2 and Pt/TiO2 Studled by X-ray Photoelectron Spectroscopy and Auger Electron Spectroscopy. J. Phys. Chem. 1984, 88, 3504–3508. [Google Scholar] [CrossRef]
- Markovits, A.; Fahmi, A.; Minot, C. A theoretical study of CO2 adsorption on TiO2. J. Mol. Struct.-Theochem. 1996, 371, 219–235. [Google Scholar] [CrossRef]
- Huang, S.Y.; Ganesan, P.; Popov, B.N. Titania supported platinum catalyst with high electrocatalytic activity and stability for polymer electrolyte membrane fuel cell. Appl. Catal. B Environ. 2011, 102, 71–77. [Google Scholar] [CrossRef]
- Ma, S.C.; Lan, Y.C.; Perez, G.M.J.; Moniri, S.; Kenis, P.J.A. Silver Supported on Titania as an Active Catalyst for Electrochemical Carbon Dioxide Reduction. ChemSusChem 2014, 7, 866–874. [Google Scholar] [CrossRef] [PubMed]
Figure 1.
XRD patterns of X wt % Cu/TiO2: (a) pure TiO2; (b) 5 wt % Cu/TiO2; (c) 10 wt % Cu/TiO2; (d) 20 wt % Cu/TiO2; (e) 40 wt % Cu/TiO2; (f) 60 wt % Cu/TiO2; (g) 80 wt % Cu/TiO2 and (h) pure Cu NPs.
Figure 1.
XRD patterns of X wt % Cu/TiO2: (a) pure TiO2; (b) 5 wt % Cu/TiO2; (c) 10 wt % Cu/TiO2; (d) 20 wt % Cu/TiO2; (e) 40 wt % Cu/TiO2; (f) 60 wt % Cu/TiO2; (g) 80 wt % Cu/TiO2 and (h) pure Cu NPs.
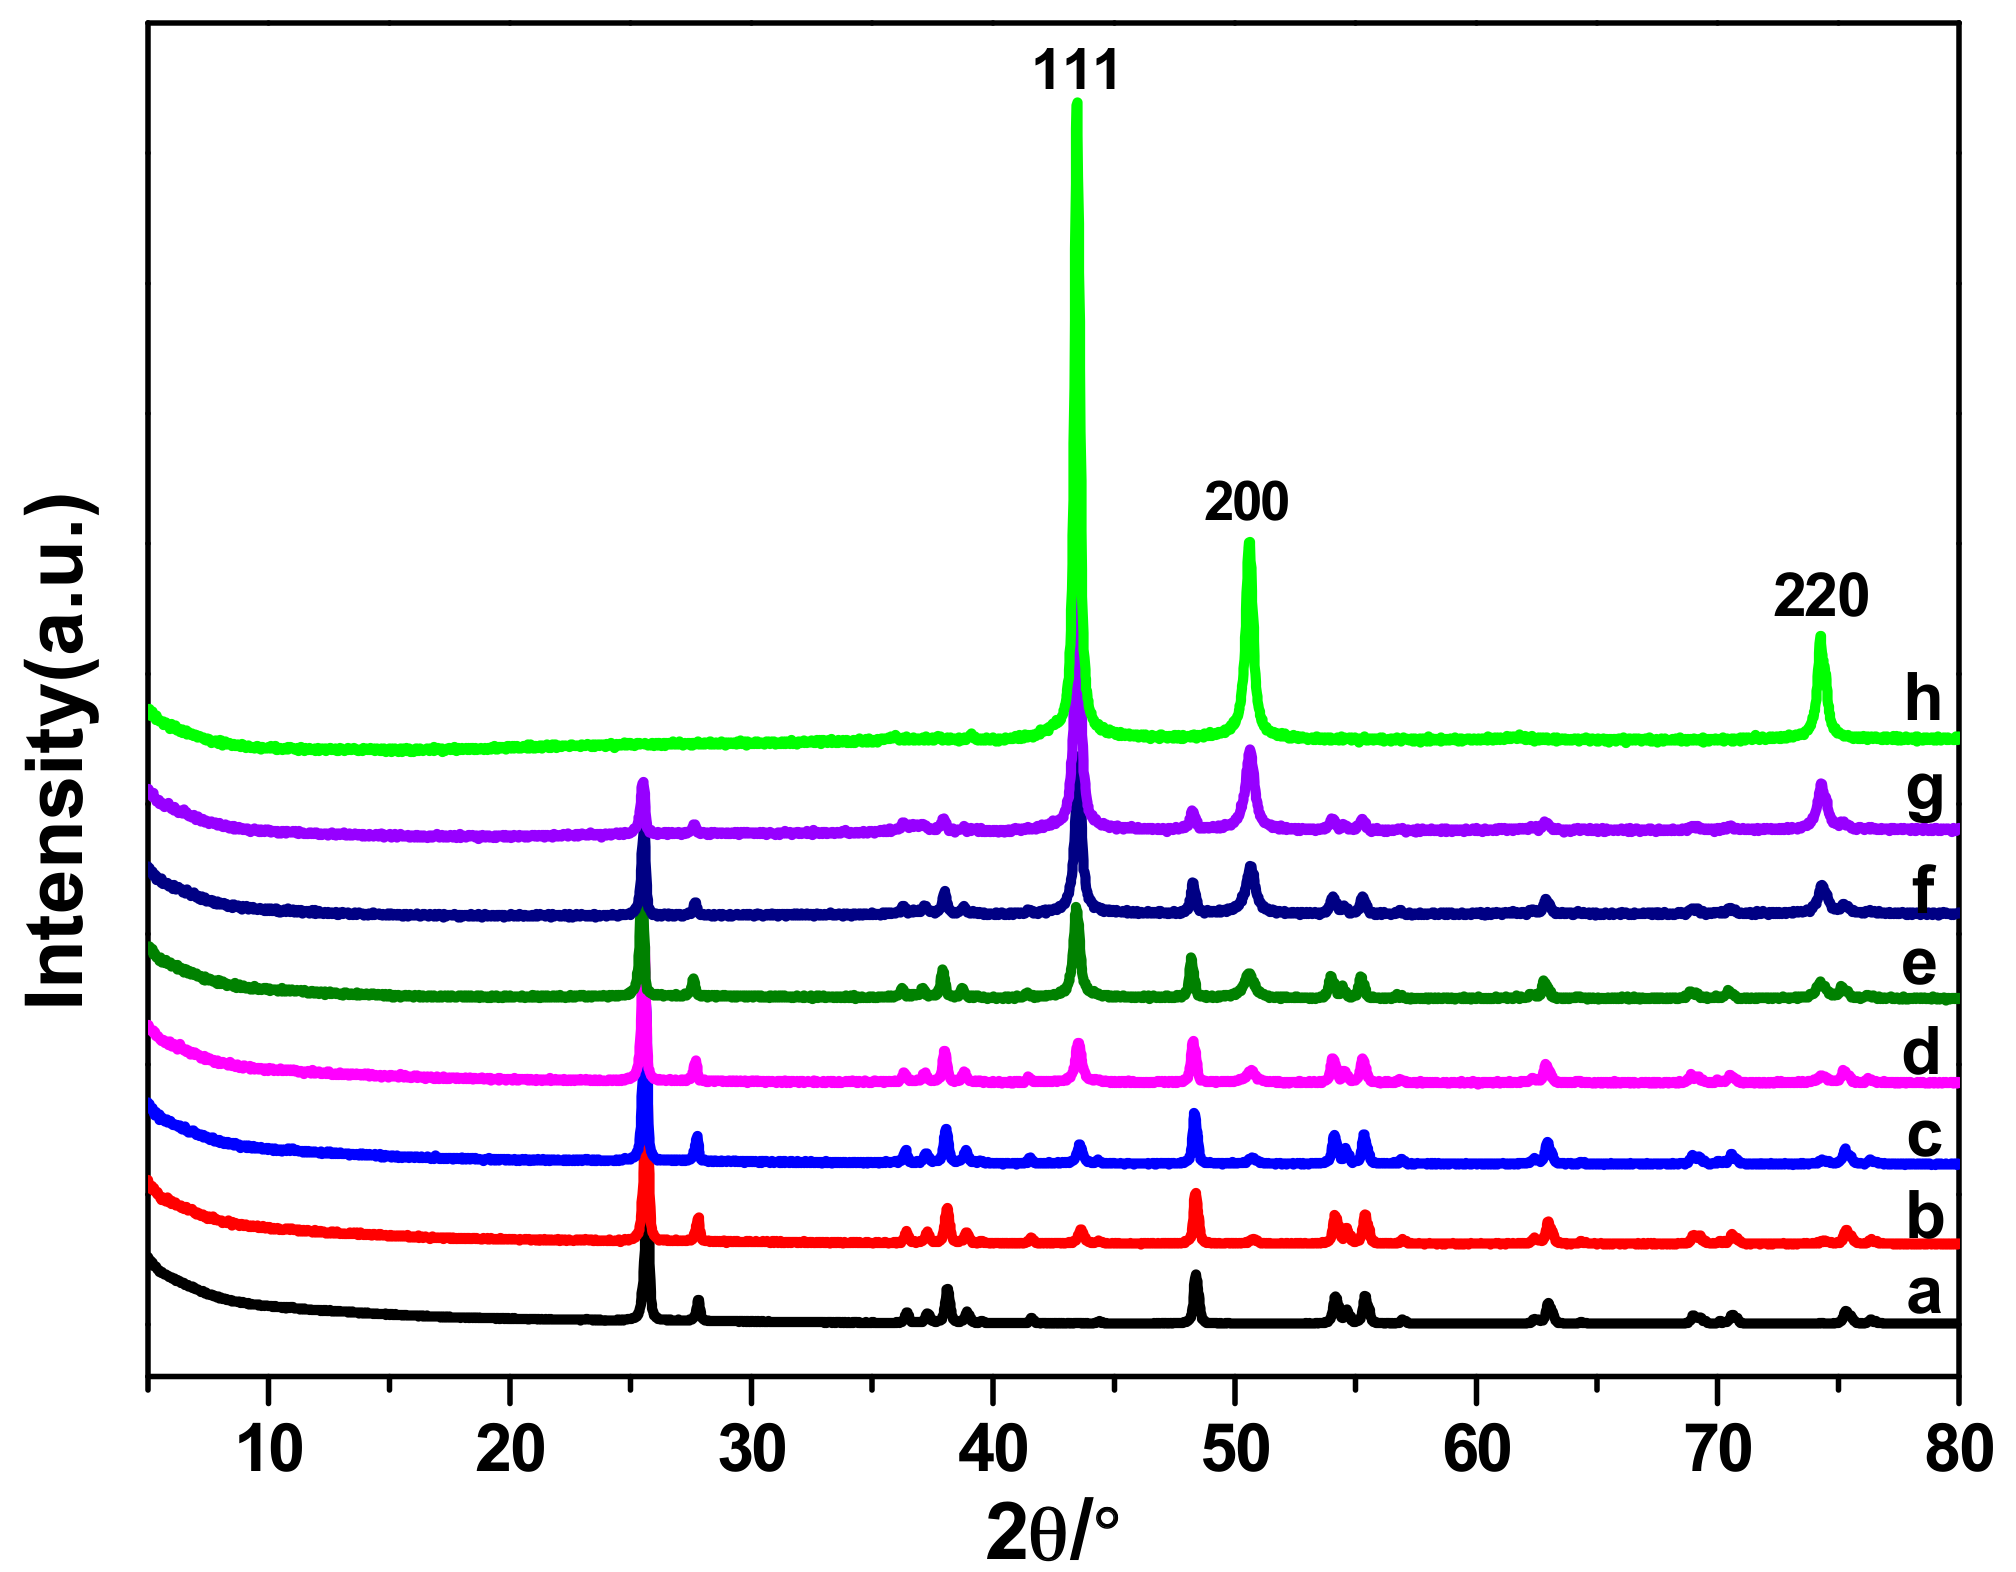
Figure 2.
TEM images of the synthesized catalysts: (a) pure TiO2, (b) 5 wt % Cu/TiO2, (c) 10 wt % Cu/TiO2, (d) 20 wt % Cu/TiO2, (e) 40 wt % Cu/TiO2, (f) 60 wt % Cu/TiO2, (g) 80 wt % Cu/TiO2, (h) pure Cu NPs with high magnification. Dark spheres or dots are Cu particles; the grey larger structures are the support materials.

Figure 3.
CVs of (a) pure Cu NPs, (b) TiO2, (c) 40 wt % Cu/TiO2 and (d) 40 wt % Cu/C catalyst after bubbling N2 (black) or CO2 (red). All experiments were carried out in 0.2 M KI solution and at a scan rate of 100 mV/s.
Figure 3.
CVs of (a) pure Cu NPs, (b) TiO2, (c) 40 wt % Cu/TiO2 and (d) 40 wt % Cu/C catalyst after bubbling N2 (black) or CO2 (red). All experiments were carried out in 0.2 M KI solution and at a scan rate of 100 mV/s.

Figure 4.
FEs and partial JECSA on different Cu/TiO2 catalyst at the constant potential (−1.45 V vs. RHE) in a CO2-saturated 0.2 M KI aqueous solution.
Figure 4.
FEs and partial JECSA on different Cu/TiO2 catalyst at the constant potential (−1.45 V vs. RHE) in a CO2-saturated 0.2 M KI aqueous solution.
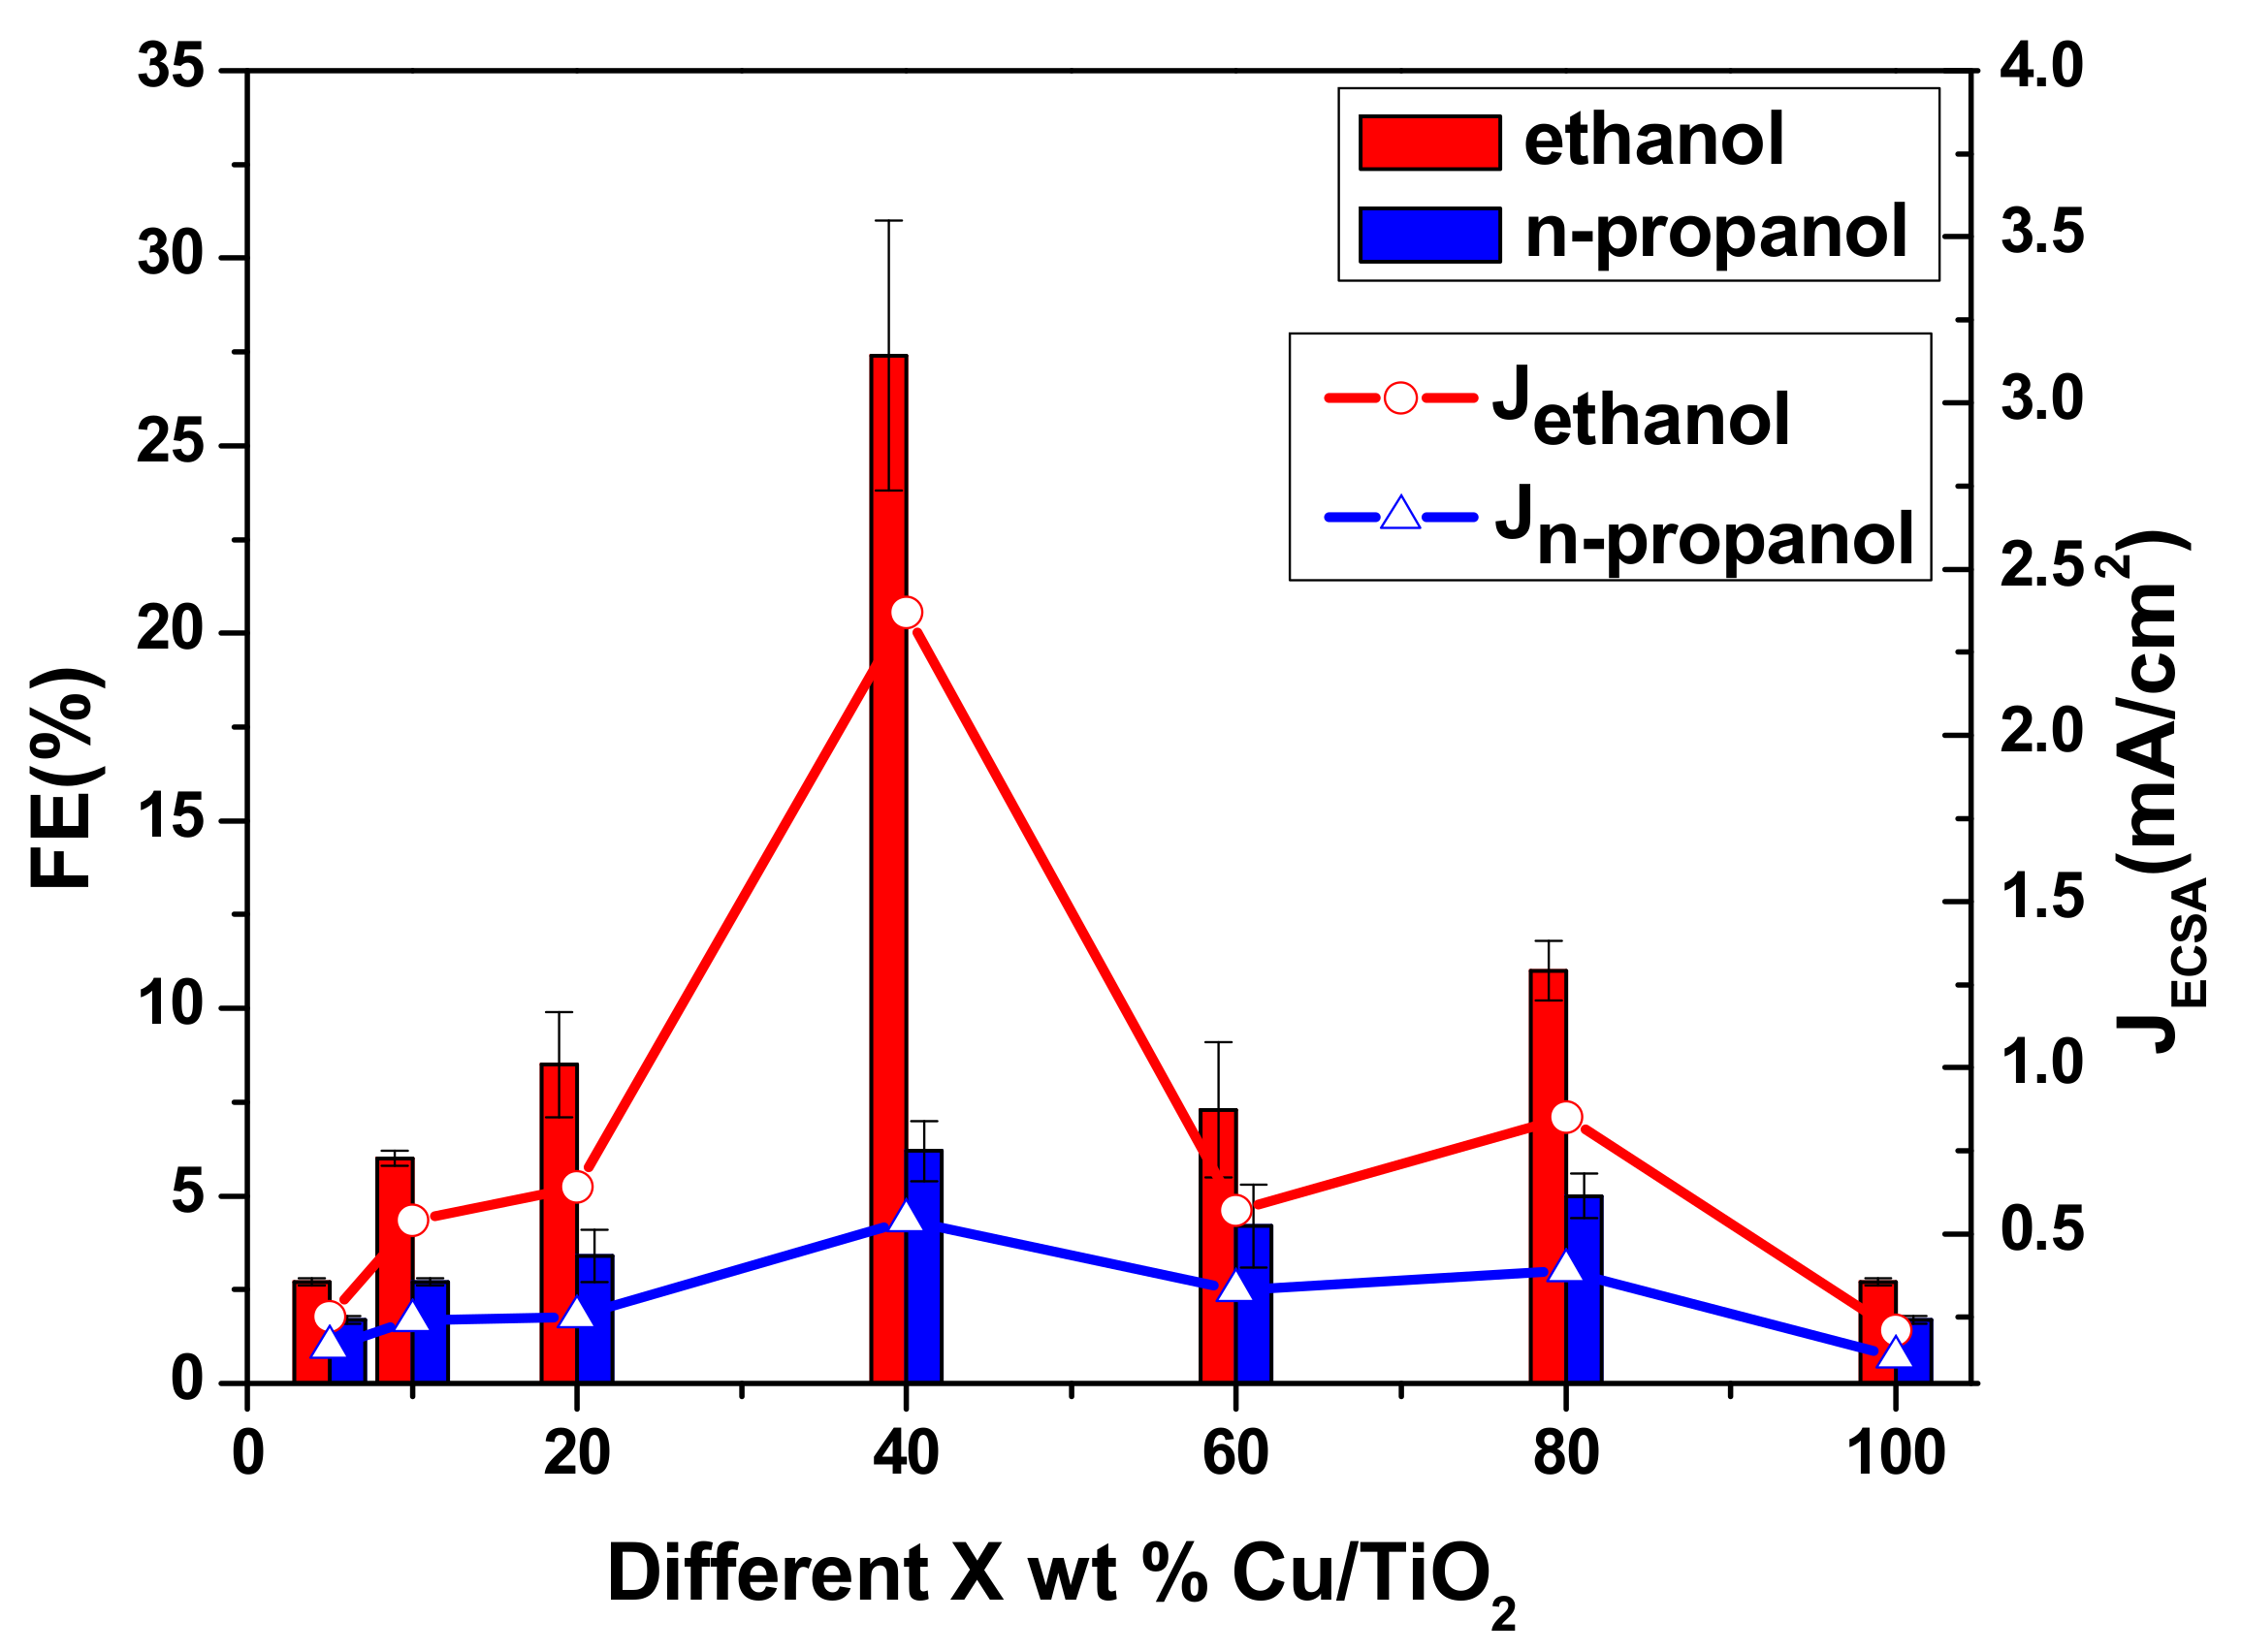
Figure 5.
JECSA and FE of CO2 reduction products on 40 wt % Cu/TiO2 catalyst at various potentials in the range of −1.05 V to −2.05 V vs. RHE in 0.2 M KI solutions.
Figure 5.
JECSA and FE of CO2 reduction products on 40 wt % Cu/TiO2 catalyst at various potentials in the range of −1.05 V to −2.05 V vs. RHE in 0.2 M KI solutions.
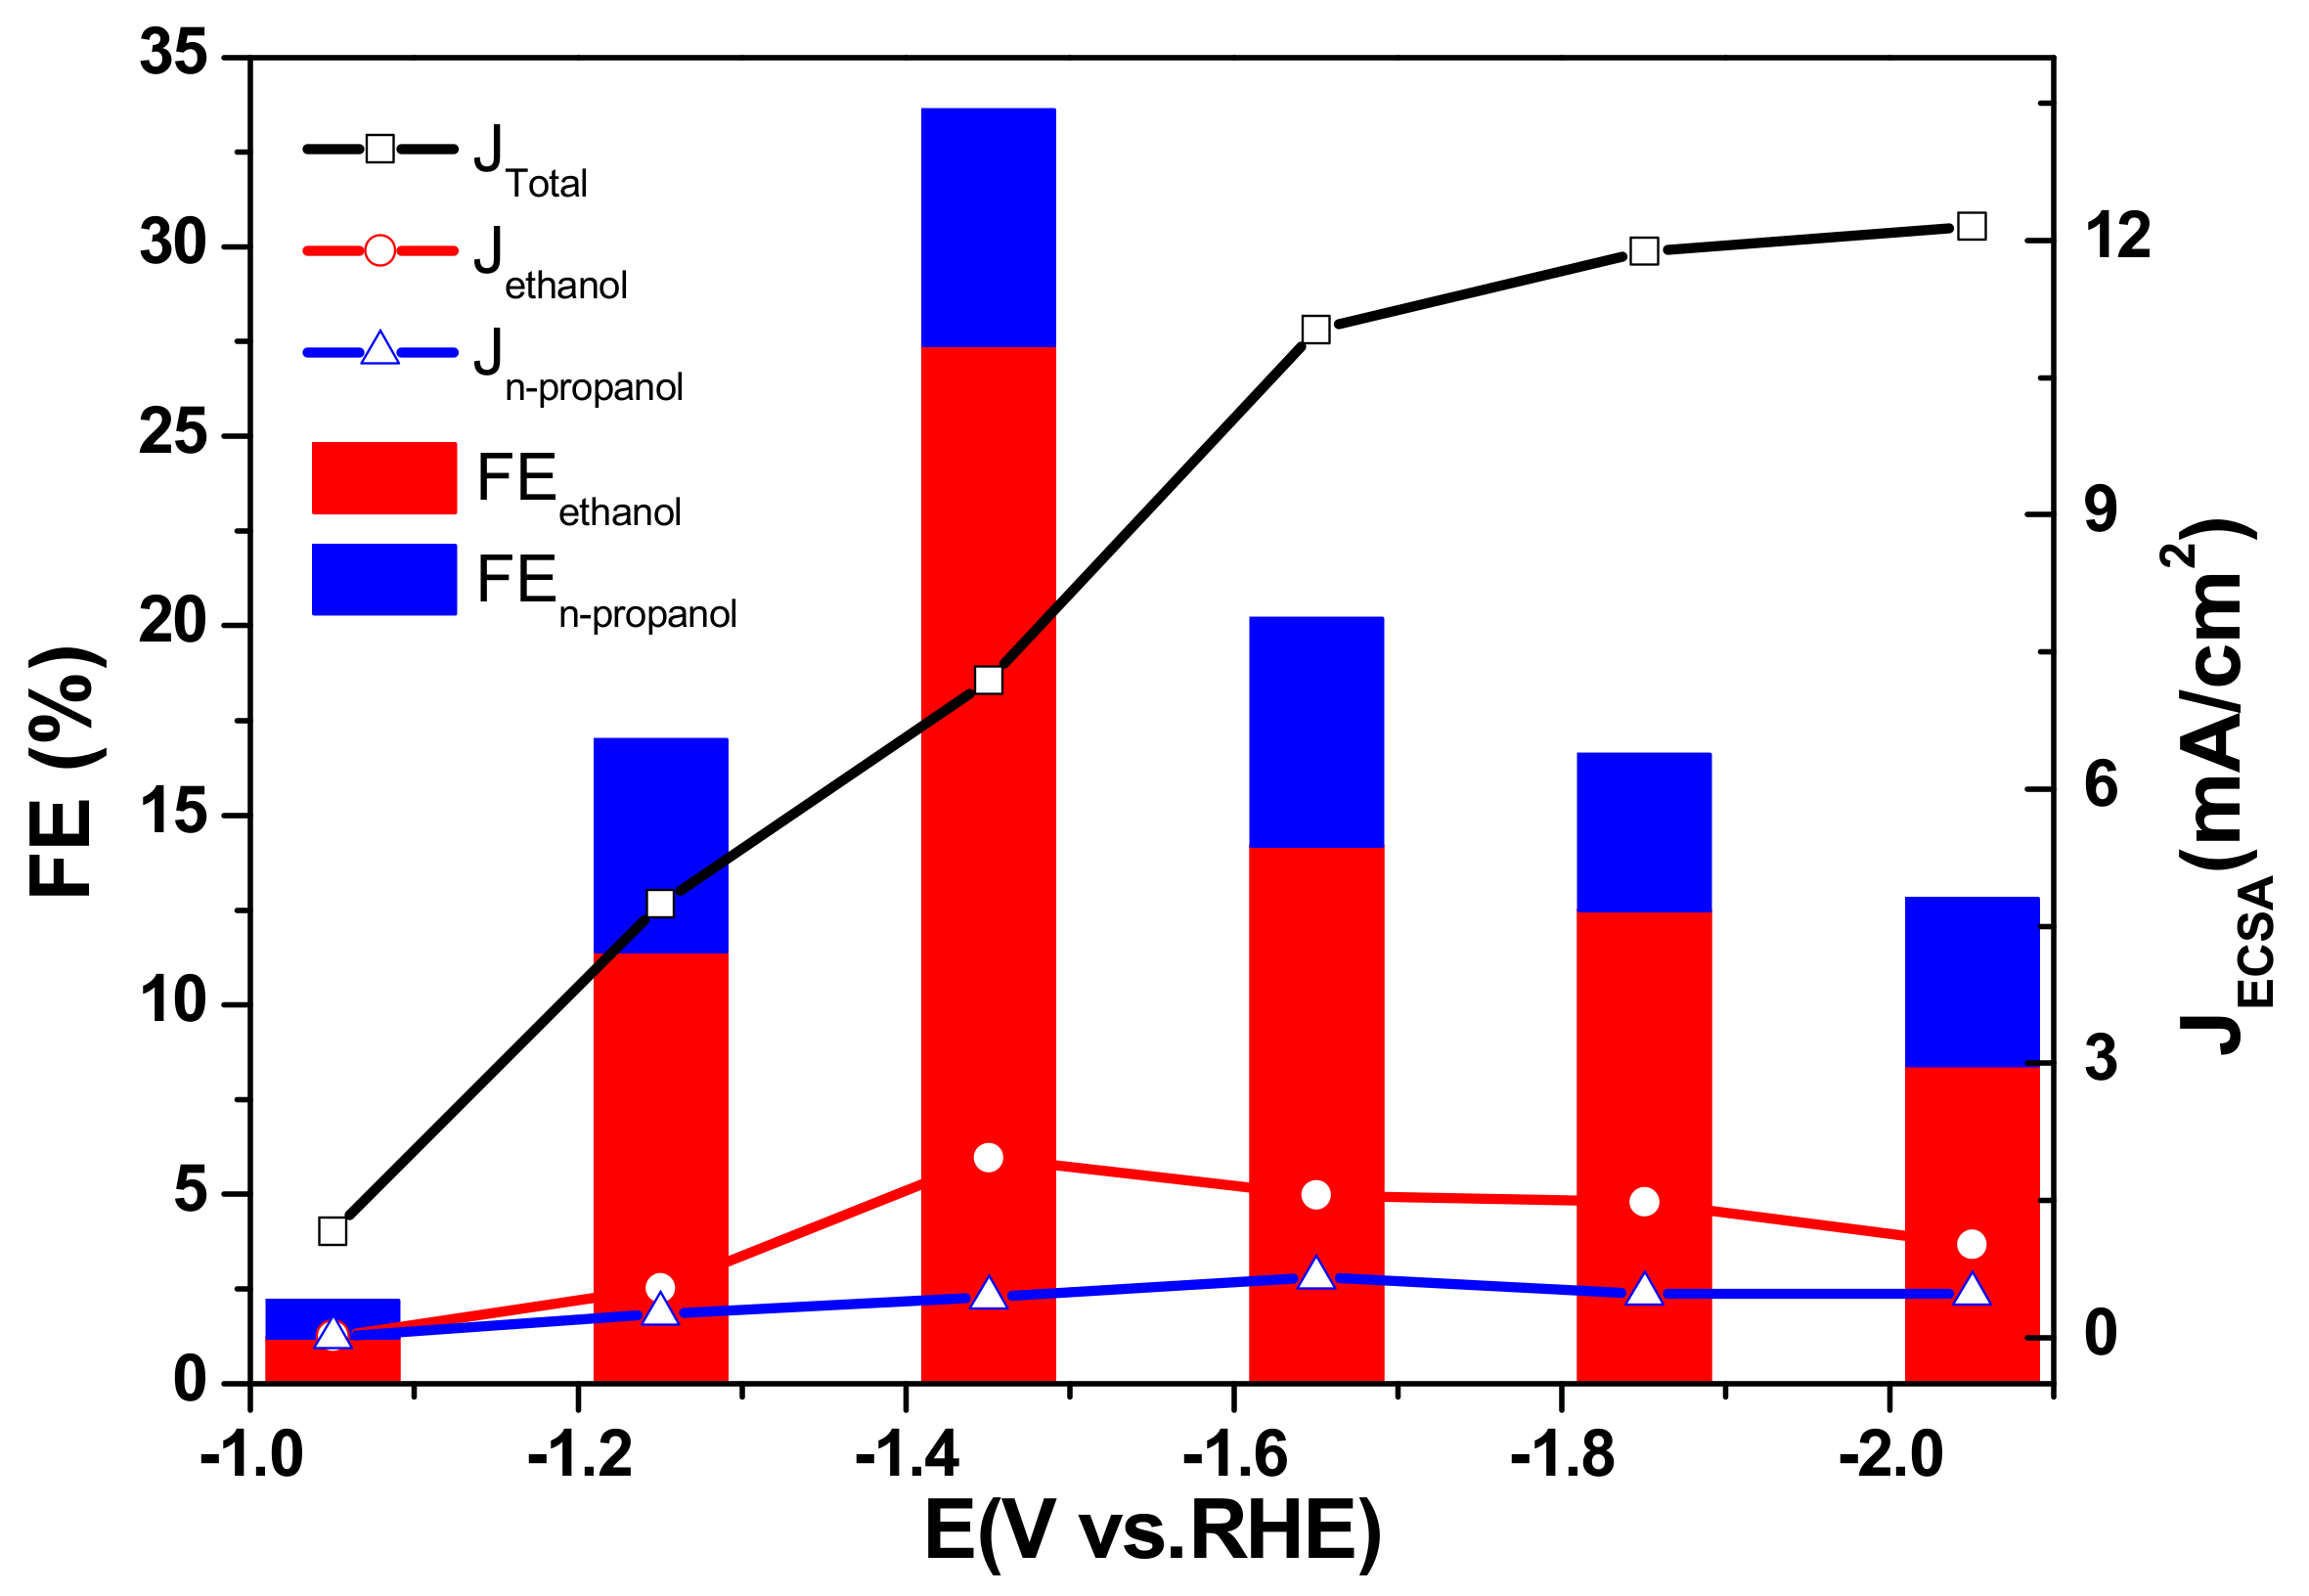
Figure 6.
(a) The stability test of 40 wt % Cu/TiO2 sample at the optimal potential −1.45 V vs. RHE. (b) XRD curves of 40 wt % Cu/TiO2 before and after 25 h CO2 electrochemical reduction.
Figure 6.
(a) The stability test of 40 wt % Cu/TiO2 sample at the optimal potential −1.45 V vs. RHE. (b) XRD curves of 40 wt % Cu/TiO2 before and after 25 h CO2 electrochemical reduction.

Table 1.
Cu composition of the synthesized catalysts a.
| Catalyst | Cu loading (wt %) | |
|---|---|---|
| Intended | Actual a | |
| 5 wt % Cu/TiO2 | 5 | 4.68 |
| 10 wt % Cu/TiO2 | 10 | 8.52 |
| 20 wt % Cu/TiO2 | 20 | 18.39 |
| 40 wt % Cu/TiO2 | 40 | 37.12 |
| 60 wt % Cu/TiO2 | 60 | 53.06 |
| 80 wt % Cu/TiO2 | 80 | 73.02 |
a Obtained by ICP.
Table 2.
FEs for ethanol and n-propanol with different amounts of 40 wt % Cu/TiO2 deposited over carbon paper at −1.45 V vs. RHE a
Table 2.
FEs for ethanol and n-propanol with different amounts of 40 wt % Cu/TiO2 deposited over carbon paper at −1.45 V vs. RHE a
| Cu/TiO2 Amount (mg/cm2) | FEethanol (%) b | FEn-propanol (%) b |
|---|---|---|
| 5 | 2.1 | 1.2 |
| 4 | 4.6 | 1.8 |
| 3 | 7.2 | 3.2 |
| 2 | 19.0 | 6.0 |
| 1 | 27.4 | 6.2 |
| 0.5 | 6.3 | 2.5 |
a Electrolysis condition: electrolyte = 0.2 M KI, E = −1.45 V vs. RHE. b Obtained by GC.
© 2017 by the authors. Licensee MDPI, Basel, Switzerland. This article is an open access article distributed under the terms and conditions of the Creative Commons Attribution (CC BY) license (http://creativecommons.org/licenses/by/4.0/).
Share and Cite
MDPI and ACS Style
Yuan, J.; Liu, L.; Guo, R.-R.; Zeng, S.; Wang, H.; Lu, J.-X. Electroreduction of CO2 into Ethanol over an Active Catalyst: Copper Supported on Titania. Catalysts 2017, 7, 220. https://doi.org/10.3390/catal7070220
AMA Style
Yuan J, Liu L, Guo R-R, Zeng S, Wang H, Lu J-X. Electroreduction of CO2 into Ethanol over an Active Catalyst: Copper Supported on Titania. Catalysts. 2017; 7(7):220. https://doi.org/10.3390/catal7070220
Chicago/Turabian StyleYuan, Jing, Li Liu, Rong-Rong Guo, Sheng Zeng, Huan Wang, and Jia-Xing Lu. 2017. "Electroreduction of CO2 into Ethanol over an Active Catalyst: Copper Supported on Titania" Catalysts 7, no. 7: 220. https://doi.org/10.3390/catal7070220
Note that from the first issue of 2016, this journal uses article numbers instead of page numbers. See further details here.