Article

Fast and Large-Scale Anodizing Synthesis of Pine-Cone TiO2 for Solar-Driven Photocatalysis

1
College of Environment, Sichuan Agricultural University, Chengdu 611130, China
2
Institute of Animal Genetics and Breeding, College of Animal Science and Technology, Sichuan Agricultural University, Chengdu 611130, China
3
Department of Chemistry, University of Missouri-Kansas City, Kansas City, MO 64110, USA
*
Authors to whom correspondence should be addressed.
Catalysts 2017, 7(8), 229; https://doi.org/10.3390/catal7080229
Submission received: 6 July 2017 / Revised: 24 July 2017 / Accepted: 27 July 2017 / Published: 1 August 2017
(This article belongs to the Special Issue Titanium Dioxide Photocatalysis)

Abstract

:
Anodization has been widely used to synthesize nanostructured TiO2 films with promising photocatalytic performance for solar hydrogen production and pollution removal. However, it usually takes a few hours to obtain the right nanostructures even on a small scale (e.g., 10 mm × 20 mm). In order to attract interest for industrial applications, fast and large-scale fabrication is highly desirable. Herein, we demonstrate a fast and large-scale (e.g., 300 mm × 360 mm) synthesis of pine-cone TiO2 nanostructures within two min. The formation mechanism of pine-cone TiO2 is proposed. The pine-cone TiO2 possesses a strong solar absorption, and exhibits high photocatalytic activities in photo-oxidizing organic pollutants in wastewater and producing hydrogen from water under natural sunlight. Thus, this study demonstrates a promising method for fabricating TiO2 films towards practical photocatalytic applications.

Graphical Abstract

1. Introduction

Nano-structured photoactive TiO2 materials are believed to have a great promise for many photocatalytic applications such as pollution degradation [1], watersplitting [2], and dye-sensitized solar cells [3]. Many methods have been created to fabricate TiO2, such as sol-gel [4,5], hydrothermal treatment [6,7], assisted-template method [8,9,10], laser ablation [11,12,13,14], and electrochemical anodic oxidation [15,16]. However, these methods have a common shortcoming that it needs a long reaction time to obtain the photocatalysts. For example, it usually takes several days for the sol-gel and hydrothermal methods to obtain TiO2 [17,18,19,20,21]. Konishi et al. synthesized monolithic TiO2 by sol-gel method from the starting solution containing titanium n-propoxide, HCl, formamide, and H2O, followed by aging for 24 h, drying for seven days, and heat-treatment for three hours in air [22]. Lu’s group prepared TiO2 nanosheets by a hydrothermal method with titanium butoxide and hydrofluoric acid solution mixed in a Telfon-lined autoclave at 200 °C for 24 h, and subsequent drying at 50 °C overnight [23]. Although it is faster to prepare TiO2 with the anodic oxidation method, it still takes a few hours [24,25,26,27]. For example, well-aligned TiO2 nanotube arrays were obtained after first anodizing for two hours in an electrolyte containing NH4F, ethylene glycol, and H2O at 60 V, and again anodizing for 20 min at 60 V, and finally annealing for three hours at 450 °C [28]. On the other hand, in real applications, TiO2 nanotube films obtained by the anodization method have many advantages, such as high photocatalytic activity, simple installation and easy recycling. However, so far, it is rarely reported on the large-scale production of anodized films, leaving their practical promise in industrial application unknown. For practical industrial applications, it is highly desirable to develop a fast and large-scale fabrication method.
In the present study, we demonstrate a fast and large-scale anodizing synthesis of TiO2 within two minutes. The synthesized TiO2 has a pine-cone-like structure (pine-cone TiO2: PCT). This structure is formed as a result of continuous deposition of TiO2-coated graphene layers and subsequent removal of graphene during the annealing process. It has a strong visible-light absorption and exhibits impressive photocatalytic performances for photocatalytic oxidation of organic pollutants in wastewater and photocatalytic generation of hydrogen from water under natural sunlight irradiation.

2. Results and Discussion
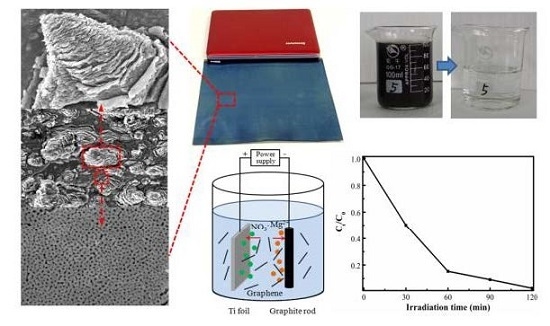
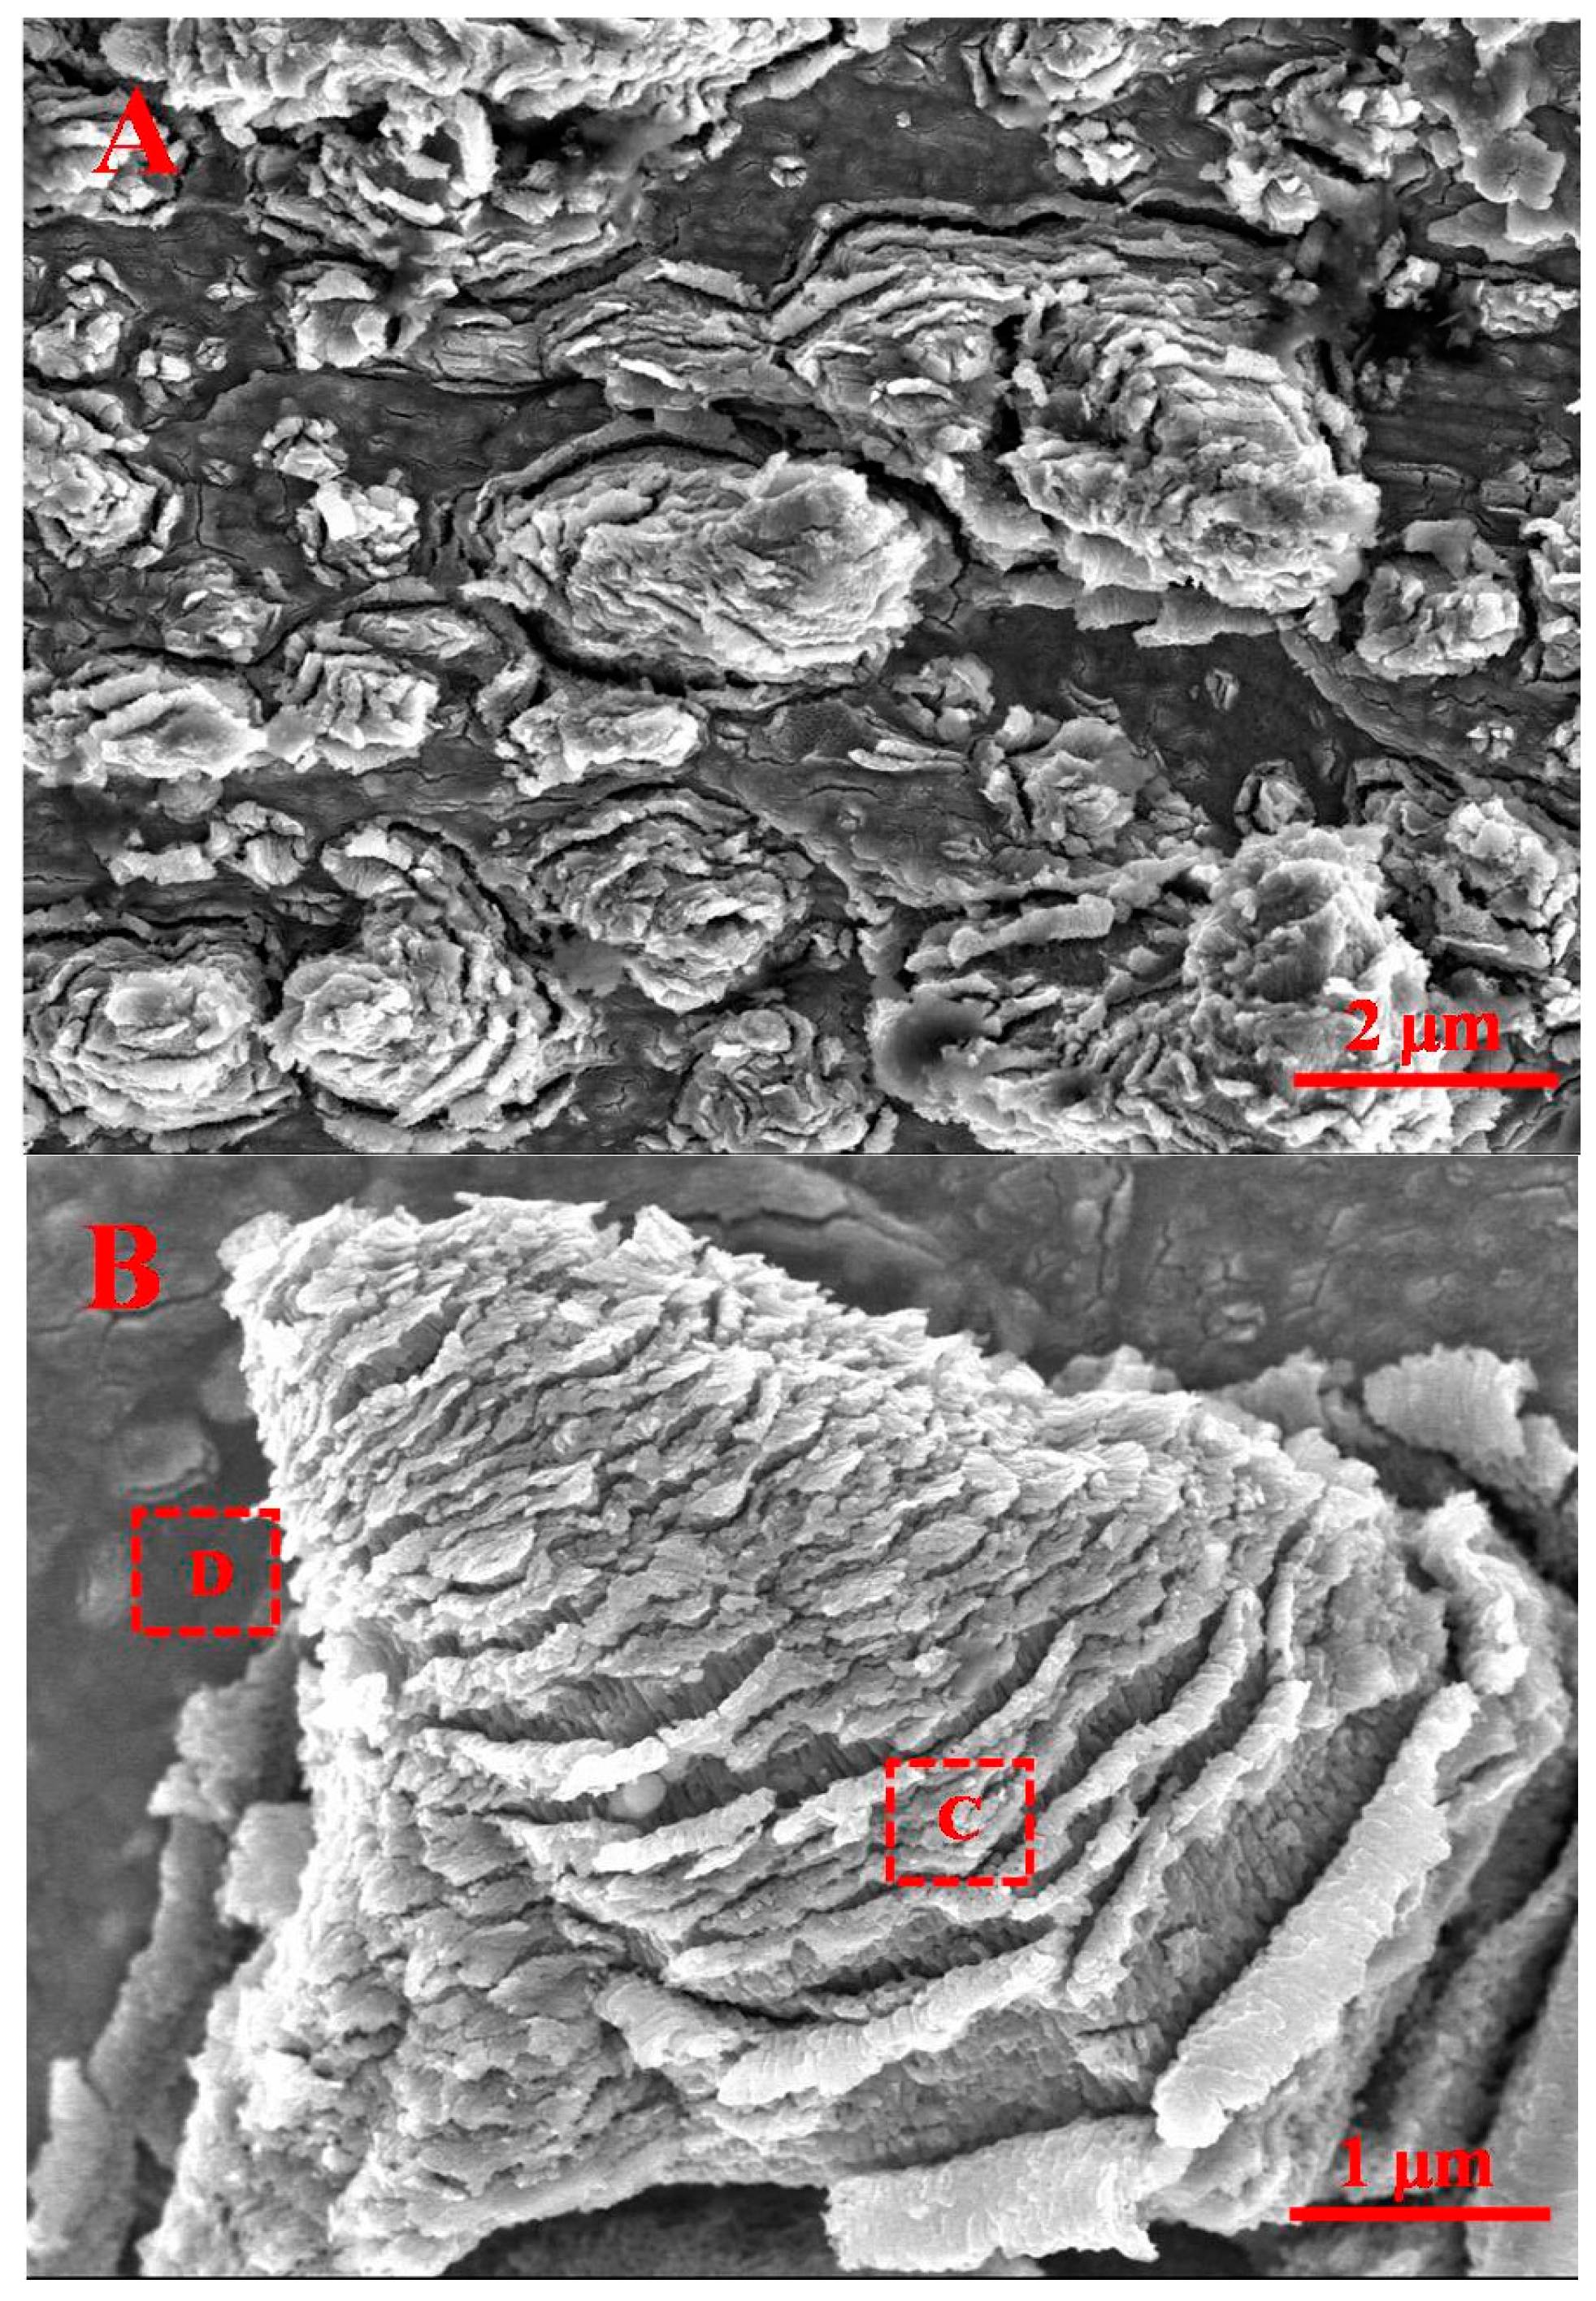
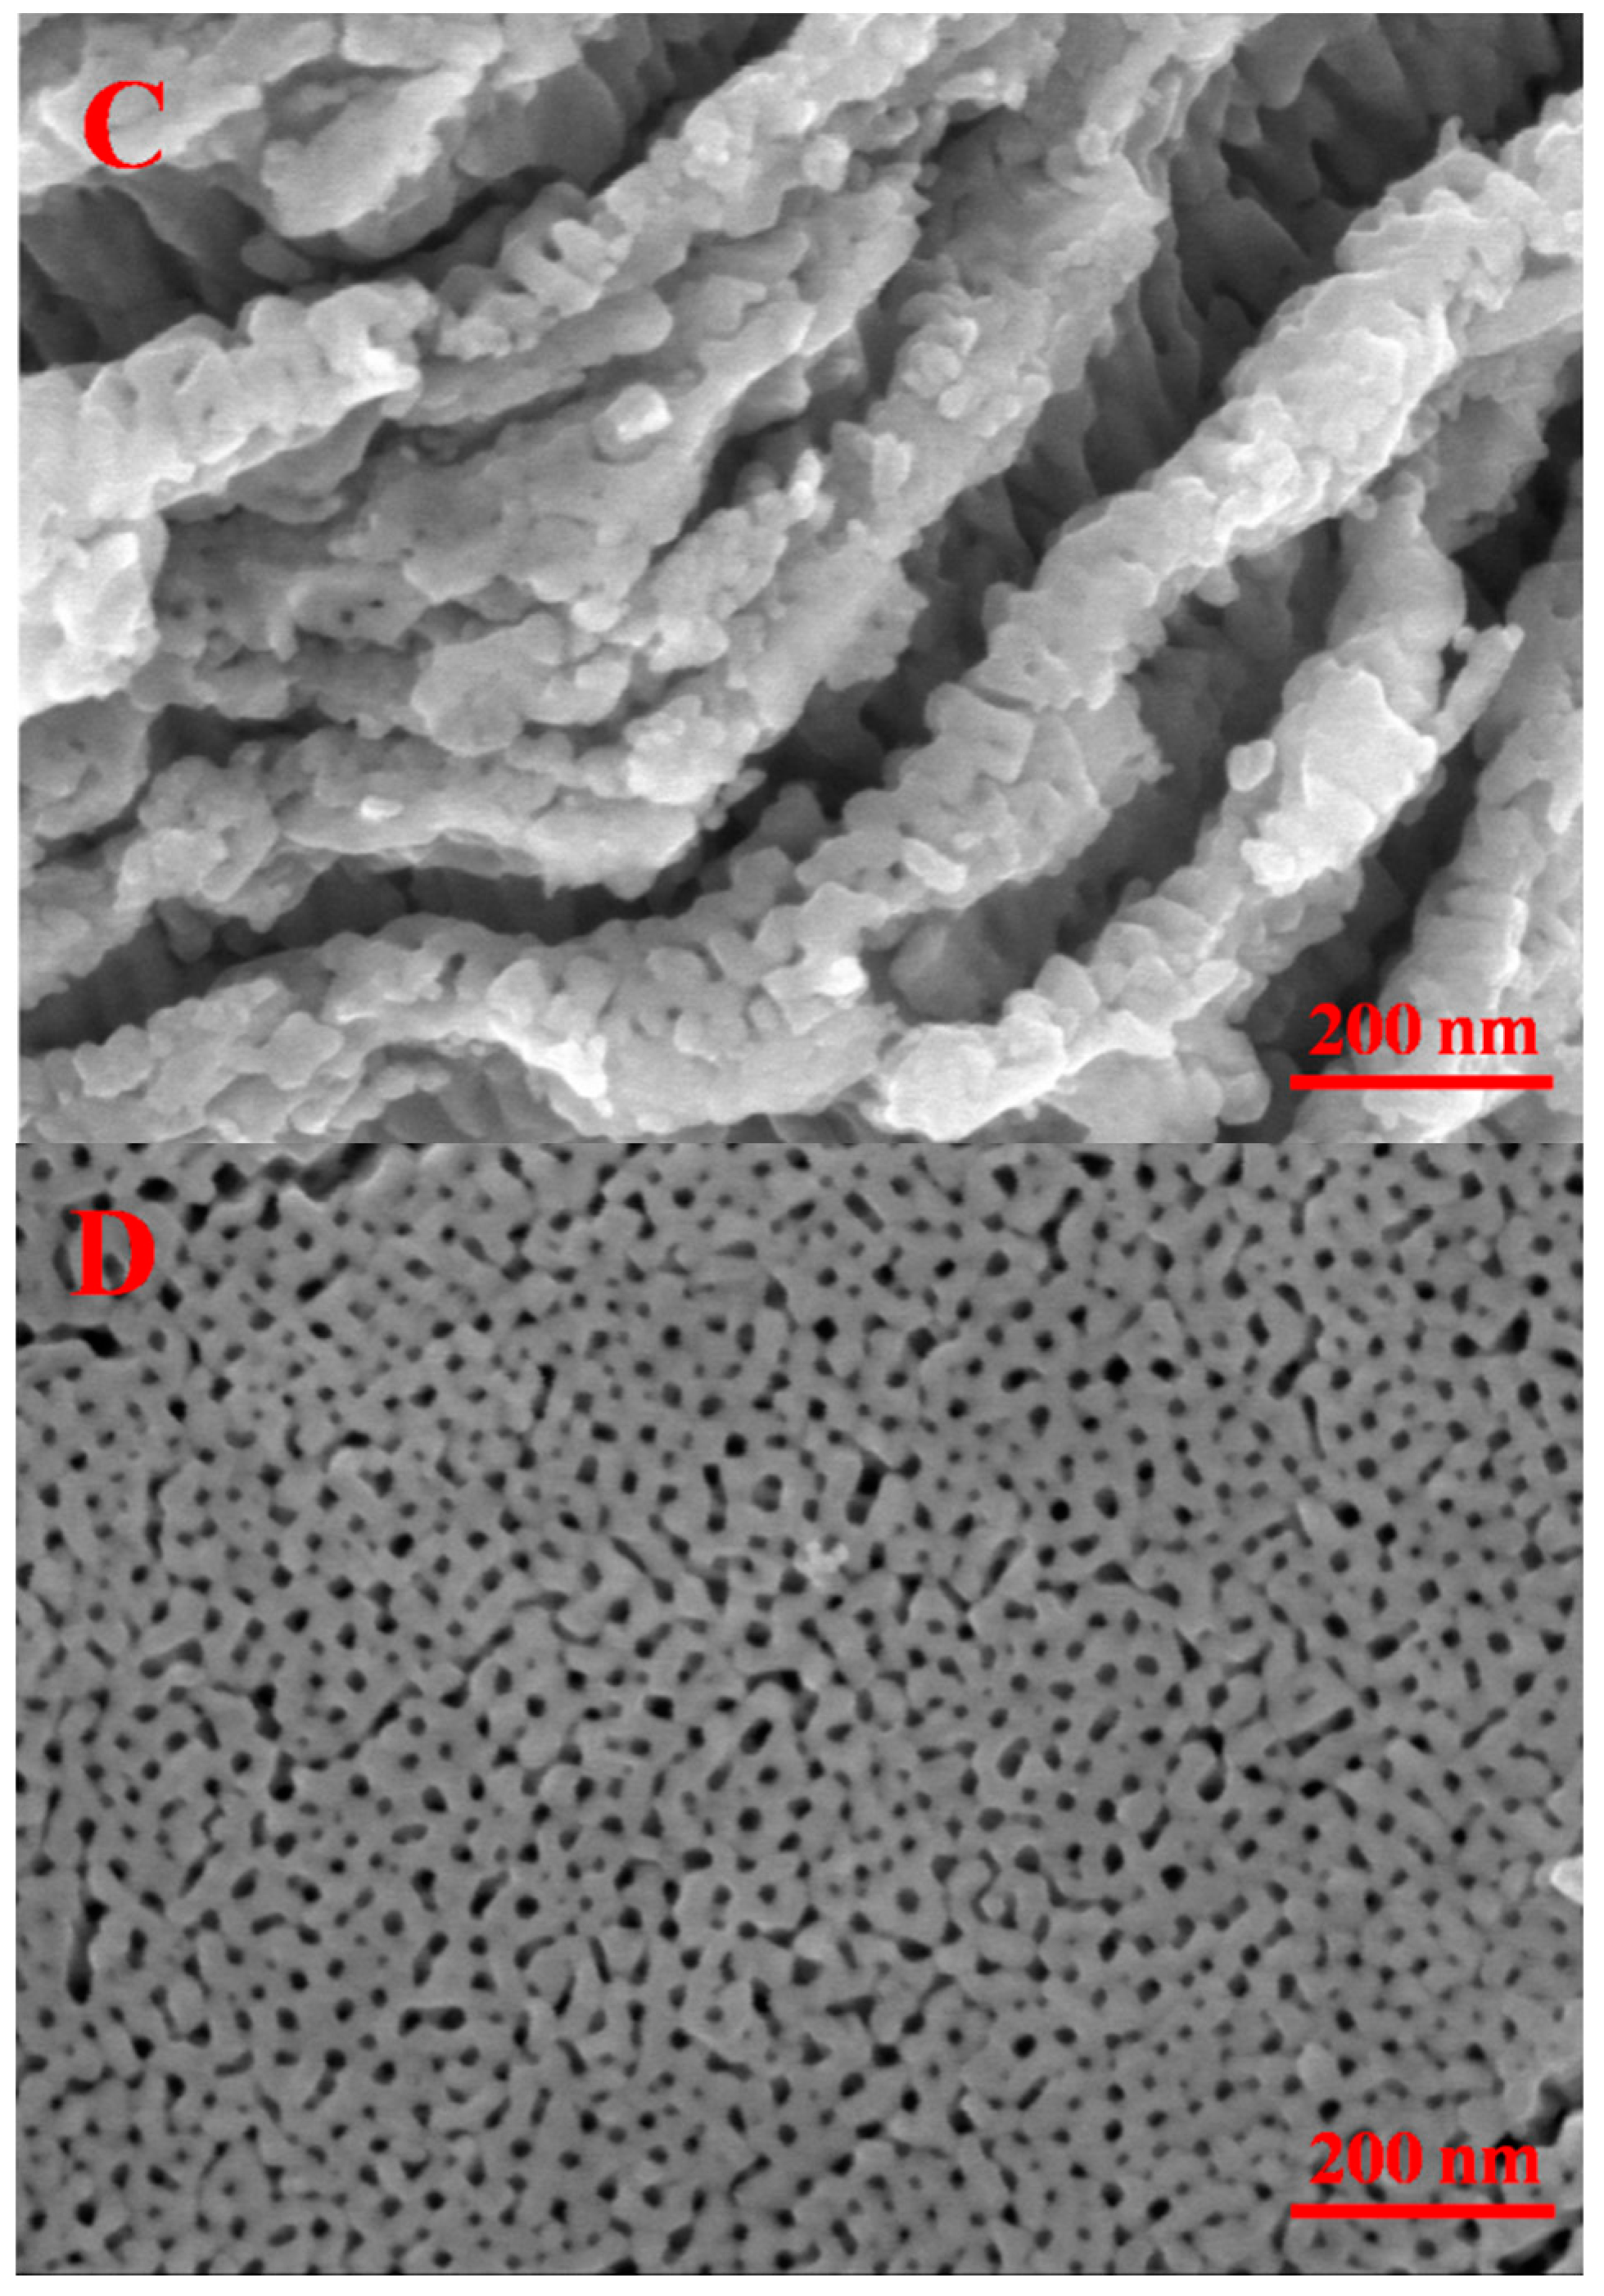
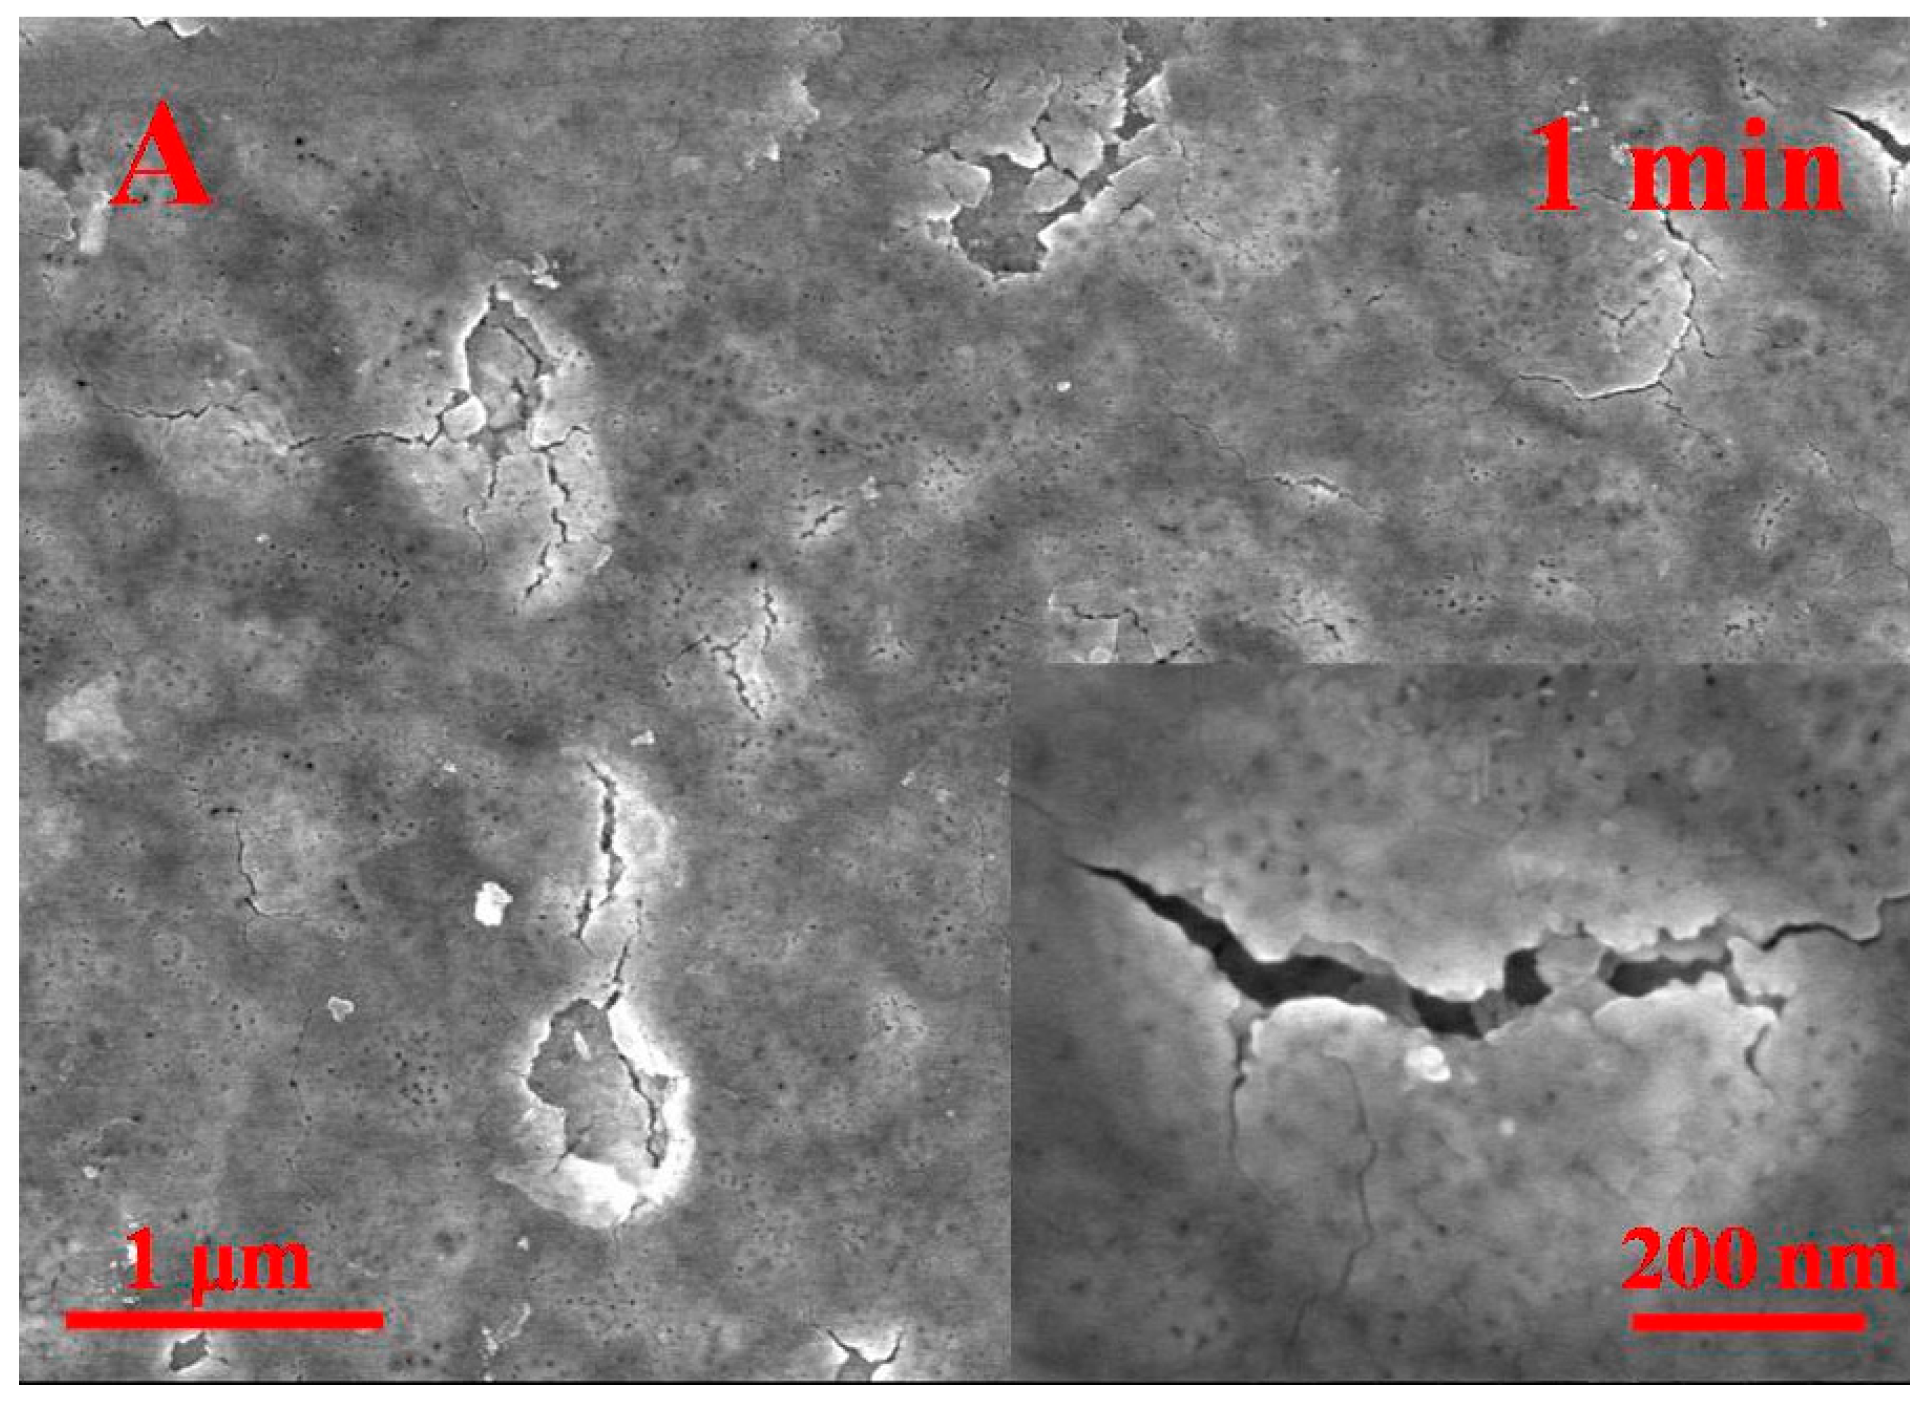
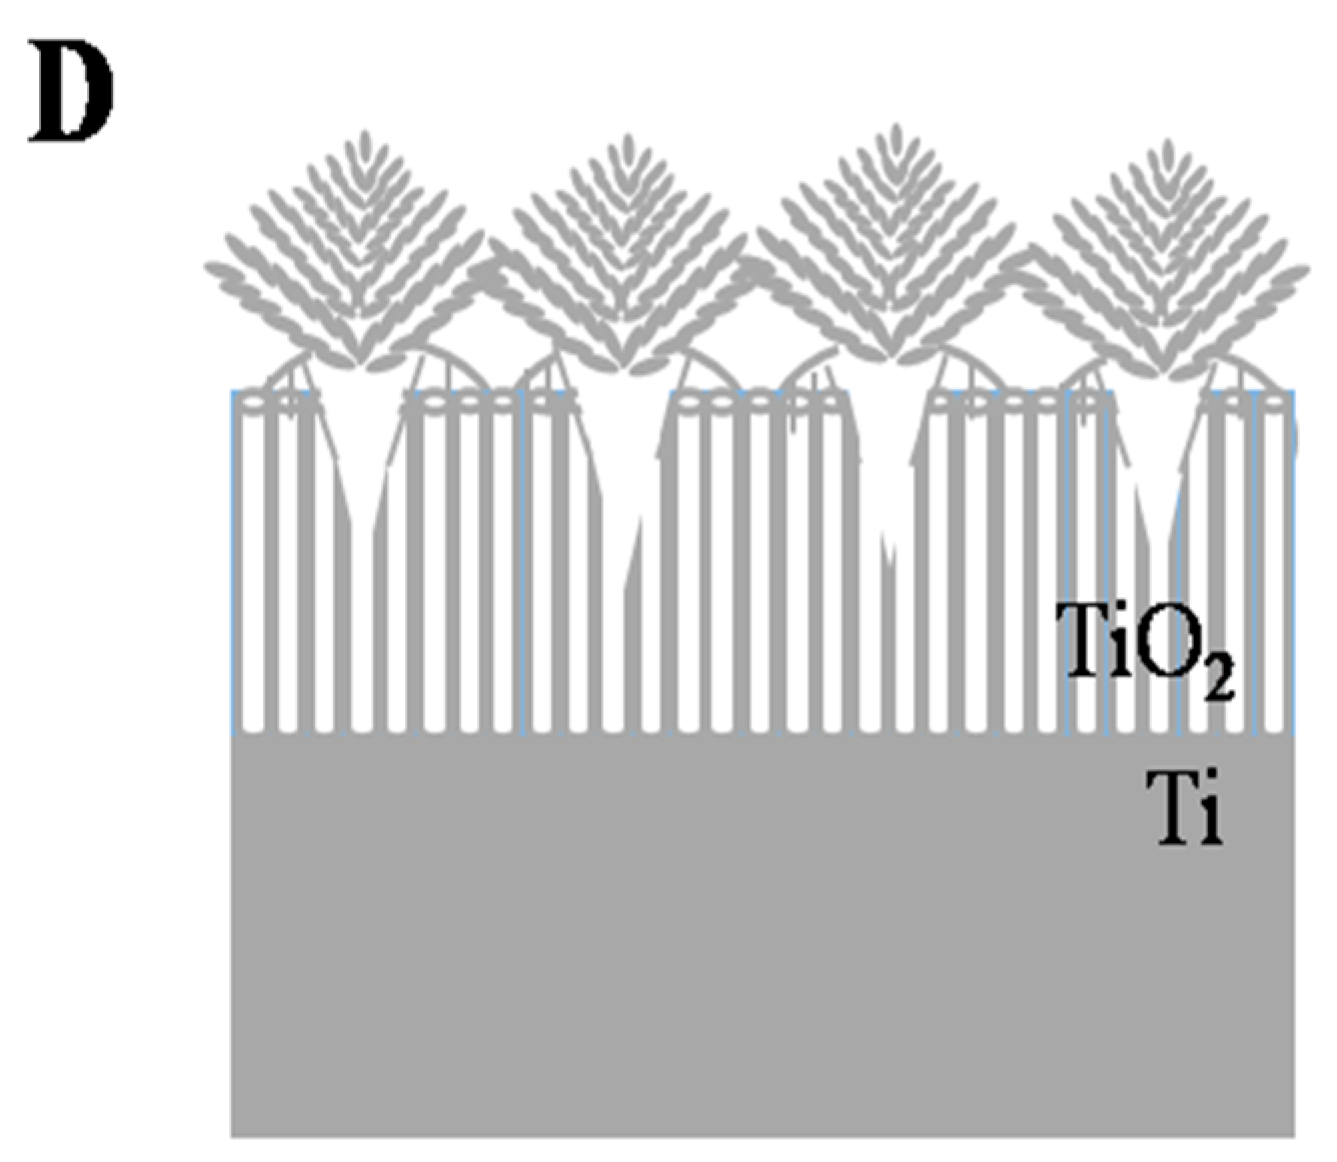
2.1. Morphology

The morphologies of the TiO2 films were investigated with scanning electron microscope (SEM). Figure 1A and Figure S1 showed that three-dimensional pine-cone-like nanoclusters were grown on the surface of the Ti substrate when the Ti foil was anodized with grapheme in the electrolyte. When the Ti foil was anodized without graphene in the electrolyte, only a rough oxide layer was formed on the Ti foil without the formation of any nanoclusters, as shown in Figure S2. These indicated that the graphene played a crucial role for the formation of the pine-cone nanostructure. The pine-cone nanocluster was made of many layered structures (Figure 1B and Figure S3); there were layers of pores between adjacent layers within the pine-cone structure, and each layer was comprised of small TiO2 nanoparticles (Figure 1C and Figure S4). In addition, the areas between the pine-cones were comprised of nanotubes structures (Figure 1D, Figures S5 and S6). These unique pine-core structures provided a large specific surface area of the film.

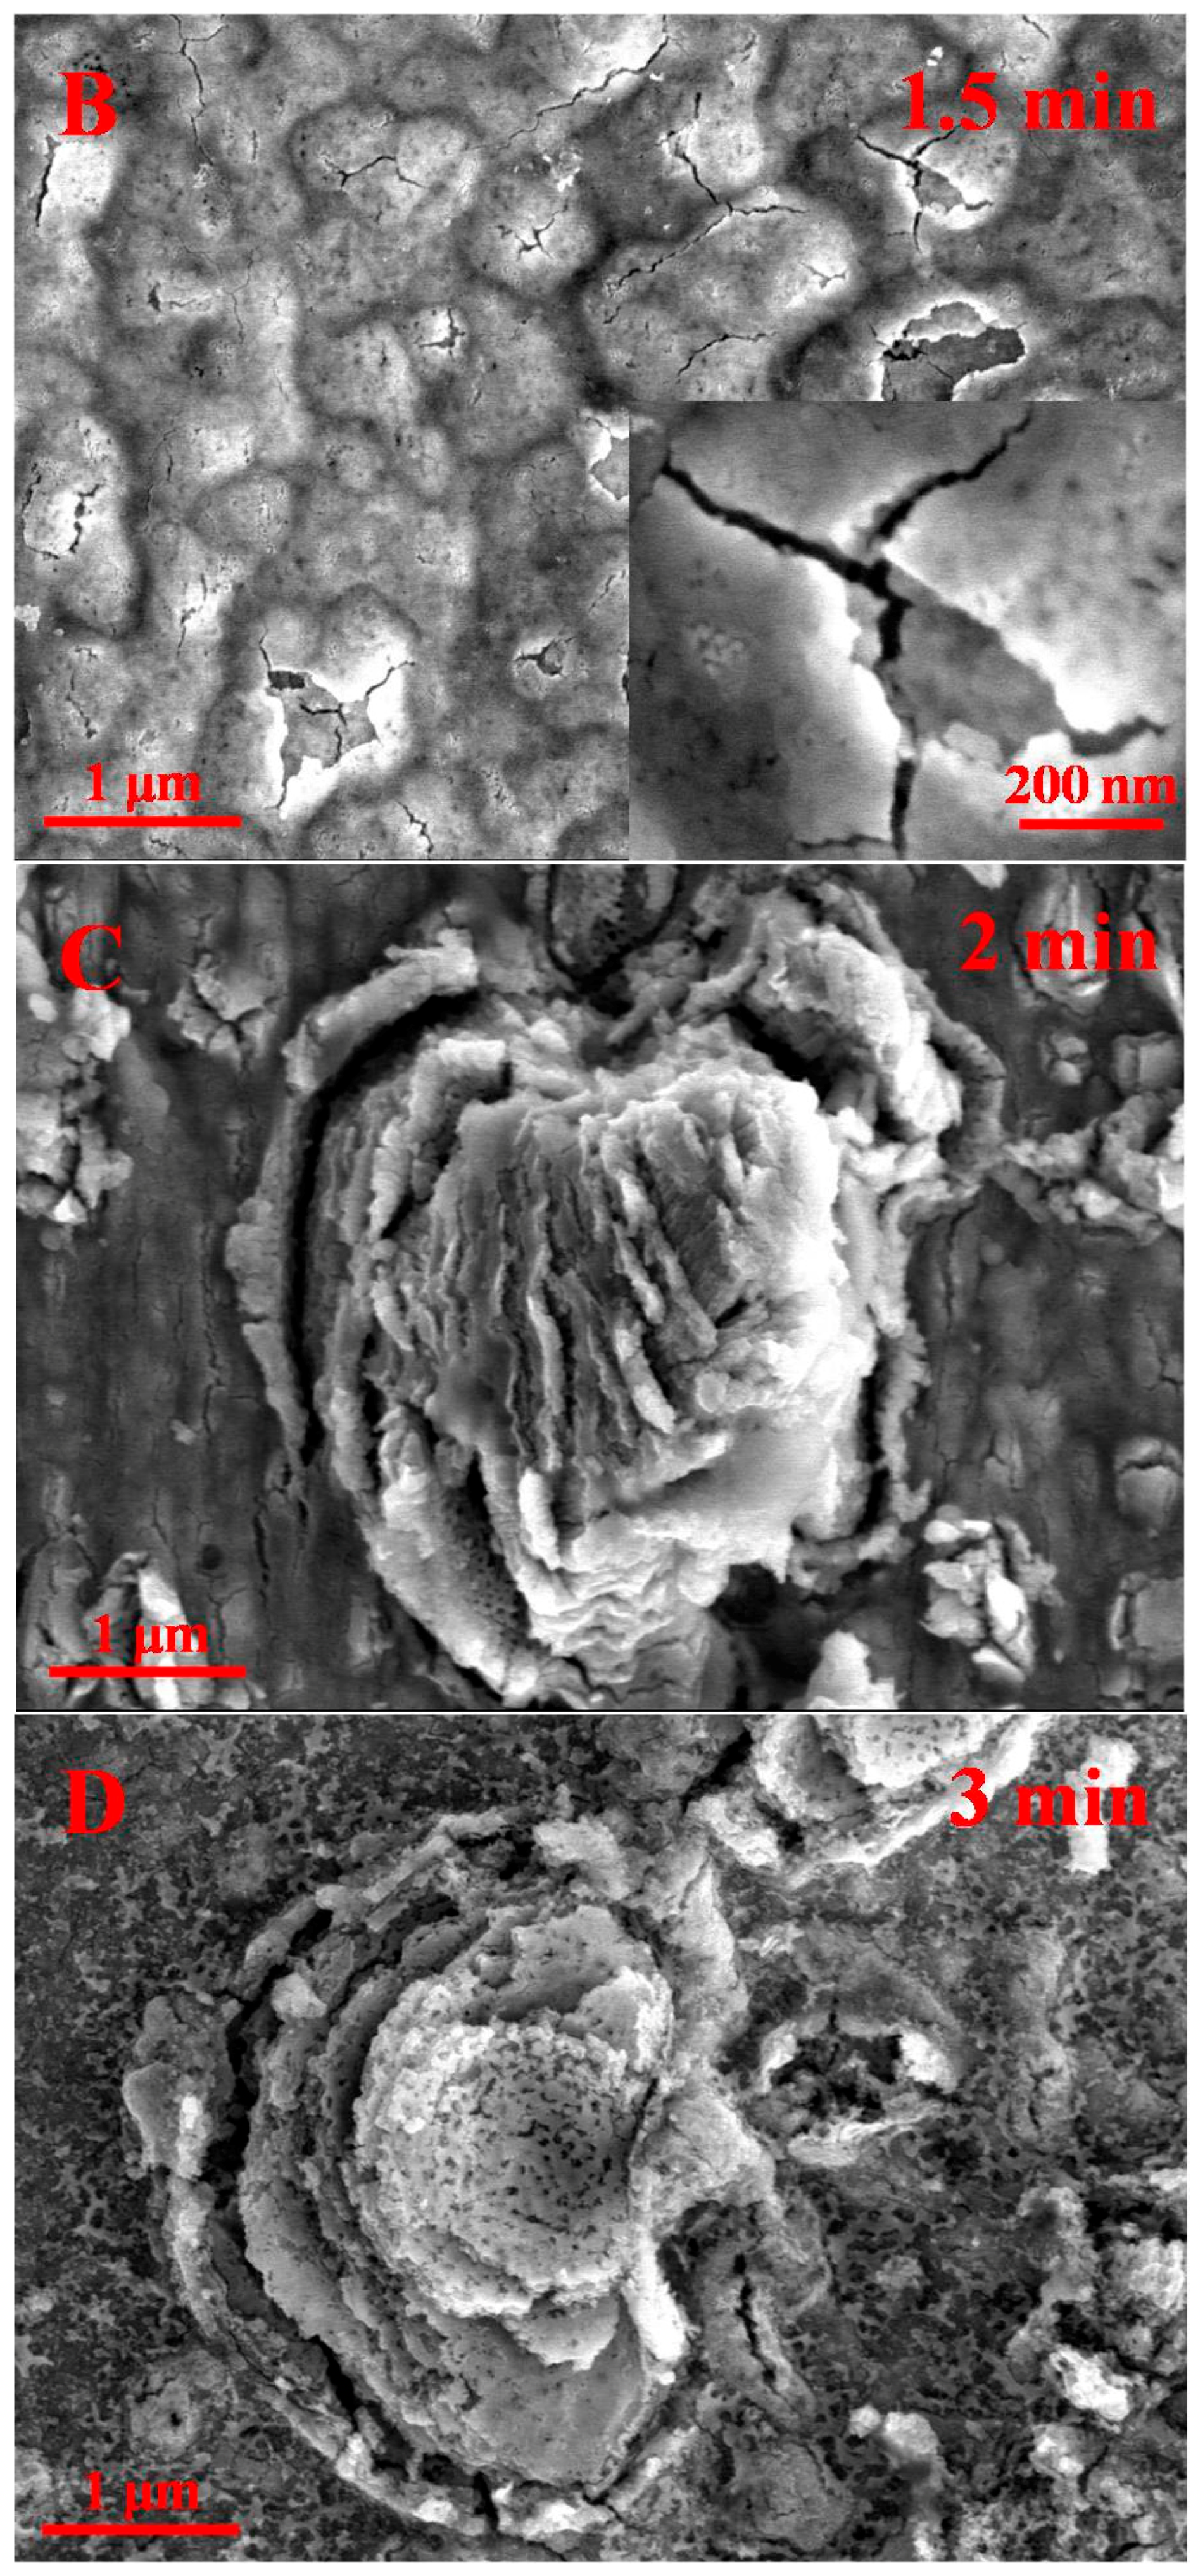
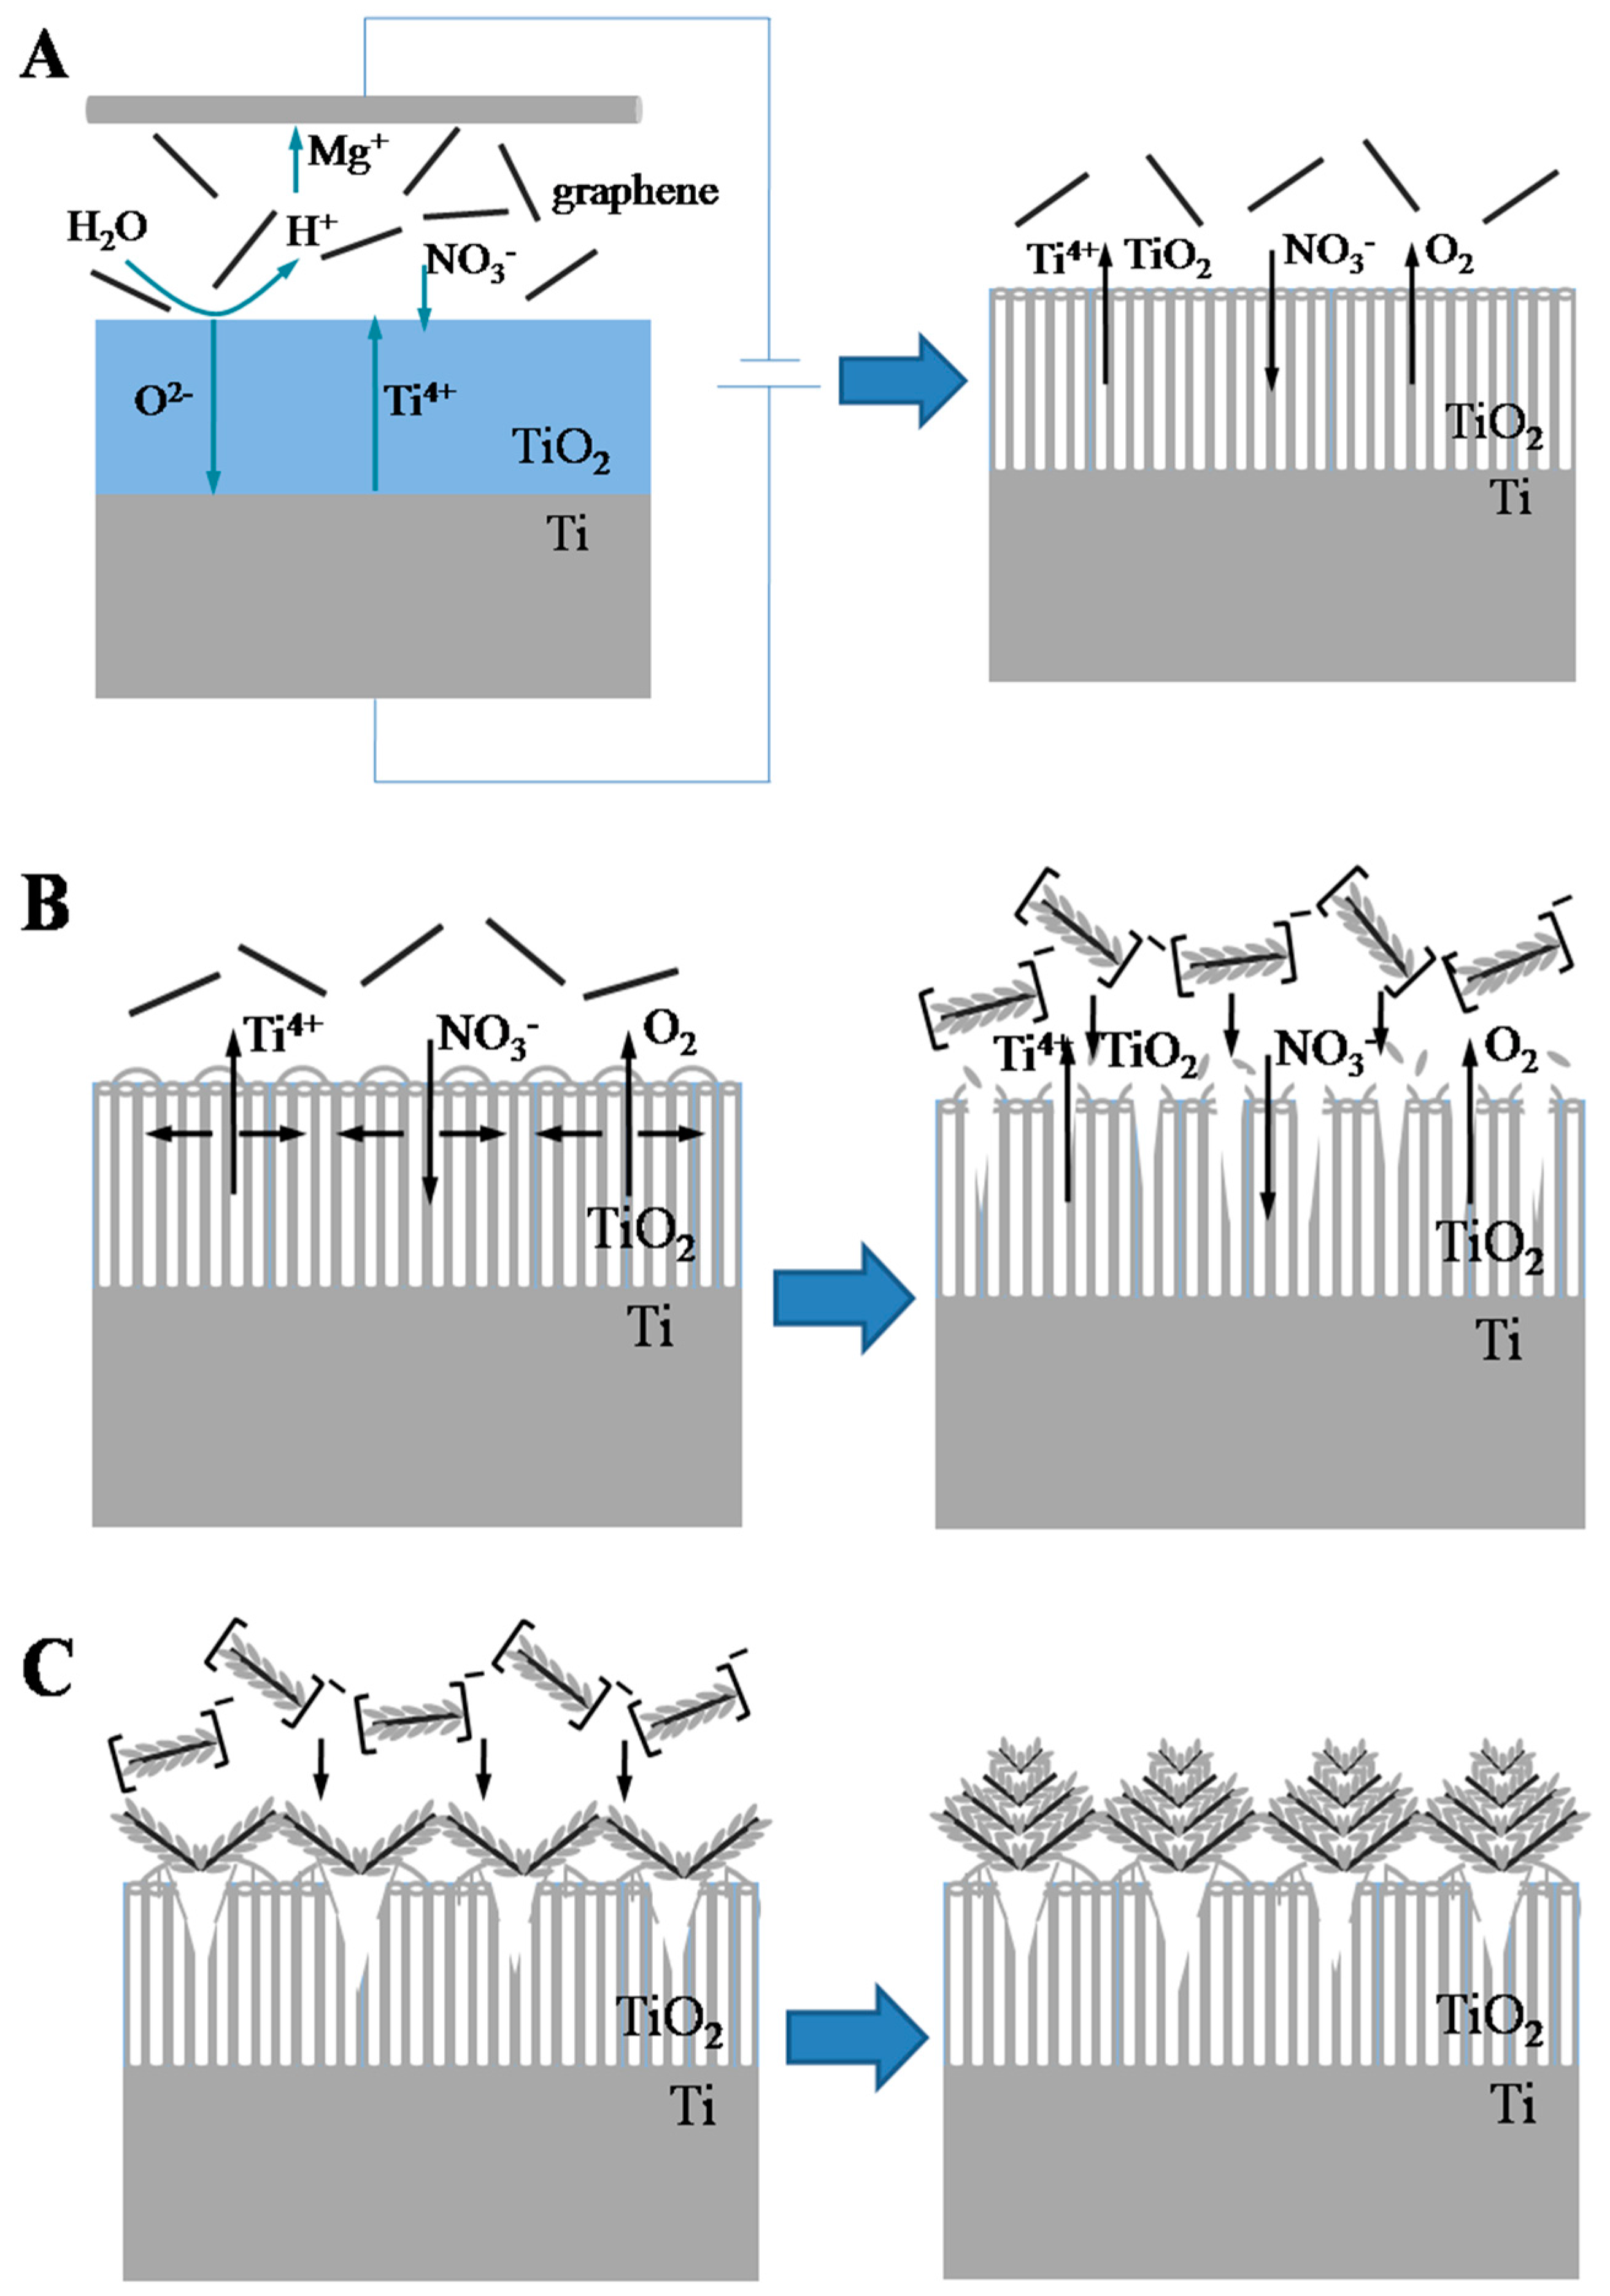
2.2. Proposed Formation Mechanism

To understand the formation process of these unique pine-cone structures, we examined the morphology changes of the films formed after various anodization periods. Figure 2 showed a series of TiO2 films obtained at different anodization times from 1 to 3 min which apparently displayed the evolution of the pine-cone structures. Figure 2A showed that, after being anodized for 1 min, an uneven oxide layer with many small holes was formed, along with many bumps which had some small cracks in the center. After being anodized for 1.5 min, the size of the small holes increased, along with the expansion of the bumps and the cracks in the center (Figure 2B). After 2 min anodization, pine-cone structures were formed in the center of the cracks (Figure 2C). Further anodization led to the partial dissolution or collapse of the pine-cone structure (Figure 2D).
Based on the observation above, a possible mechanism as shown in Figure 3 was proposed to explain the formation of the PCT film. As illustrated in Figure 3A, at the beginning, a compact oxide layer with small holes was formed. Mg2+ and NO3 ions in the solution moved to the cathode and anode under the electrical field, respectively. The NO3 ions reacted with the oxide layer and soluble species such as [TiO2−x(NO3)x]mn (m > n, 0 < x < 2) were formed, leading to the local dissolution/thinning of the oxide layer and forming many small pores rapidly. Meanwhile, as shown in Figure 3B, as NO3 and OH reacted with the oxide layer/Ti interface to form soluble [Ti(NO3)n]mn (m = 3, 4; n > 4) and Ti(OH)4 species [29] the pores continued to grow. However, the formation of oxide layers led to lattice expansion and generated stress at the metal/oxide interface. Accumulation of the stress led to the deformation of the film and formation of bumps and eventually cracks (Figure S7) [30]. Some of the TiO2 fragments were washed to the electrolyte by the O2 gas (Figure S8). In this experiment, the pH of the electrolyte was 6.8. As the point of zero charge (pHpzc) of TiO2 was approximately 6 to 6.5 [31,32,33], the surface of TiO2 was negatively charged in the electrolyte. In addition, it was found that most of the graphene sheets were quickly adsorbed on the cathode. So, the graphene sheets were likely positively charged on the surface. Therefore, the negatively charged TiO2 fragments could be easily adsorbed on the surface of the positively charged graphene sheets to form layered structures. As negatively charged TiO2 accumulated on the graphene sheets, this eventually turned the graphene-TiO2 complex negatively charged on the surface to prevent further accumulation of TiO2 on the surface. As shown in Figure 3C, the complex was attracted to the anode and reversed on charge on the surface under the electrical field. The cracks on the expansion parts were excellent landing positions where the electric field intensity was the strongest due to the shortest distance between the two electrodes. As this process proceeded, a layer-by-layer stacking structure was obtained. At the end, the graphene was removed in the annealing process at 723 K in the air, and the pine-cone was formed as shown in Figure 3D.

2.3. Crystal Phase and Surface Chemical Composition

Both XRD and Raman measurements suggested the PCT film annealed at 737 K had an anatase/rutile mixed phase. The grain sizes estimated with the Scherrer equation from the XRD pattern were around 18 and 20 nm for the anatase and rutile phases, respectively (Figure S9 and Table S1). The mixed crystal parameters obtained were consistent with their theoretical values [34]. The Raman peaks (Figure S10) at 147, 198, 396, 515, and 636 cm−1 were from the Eg(1), Eg(2), B1g, A1g or B1g, and Eg(3) modes of the anatase phase, respectively. The peak located at 448 cm−1 was due to the Eg mode of the rutile phase. XPS measurements (Figure S11) revealed that the PCT film was found to contain Ti, O, C, and N, while TNTs was comprised of only Ti, O, and C. The C element existing at the surface of films was derived from carbon contaminants or residual organic carbons [35]. The concentration of N calculated from the N 1s XPS spectrum of the PCT film was ~2.93 at %, which included interstitial N (Ti-O-N; 399.6 eV; 81.3%) [36], substitutional N (Ti-N; 397.1 eV; 8.7%) [37], and molecularly chemisorbed γ-N2 (401.3 eV; 10%) [38], as shown in Figure S12. N atoms were introduced by the anodizing technique, likely from the nitric irons attacking the oxide layer and some adsorbed complexes, such as [TiO2−x(NO3)x]mn (m > n, 0 < x < 2) and [Ti(NO3)n]mn (m = 3, 4; n > 4), during the formation of TiO2 [29,39]. These complex anions [Ti(NO3)n]mn were thermodynamically unstable and decomposed into thermodynamically stable TiO2 with N doping [29]. In addition, the NO species from the decomposition of the nitrate radical might be chemisorbed on the surface or incorporated into the defects of the resultant TiO2 [40]. The binding energies of the Ti 2p3/2 (458.4 eV) and lattice O2− (529.5 eV) states of the TNTs shifted 0.2 eV and 0.5 eV toward lower binding energies of 458.6 eV and 530.0 eV, as shown in Figures S13 and S14, respectively. These suggested the reduction of the valence state of titanium from Ti4+ to Ti3+ [41], and the presence of N species and oxygen vacancies (Vo) [42].

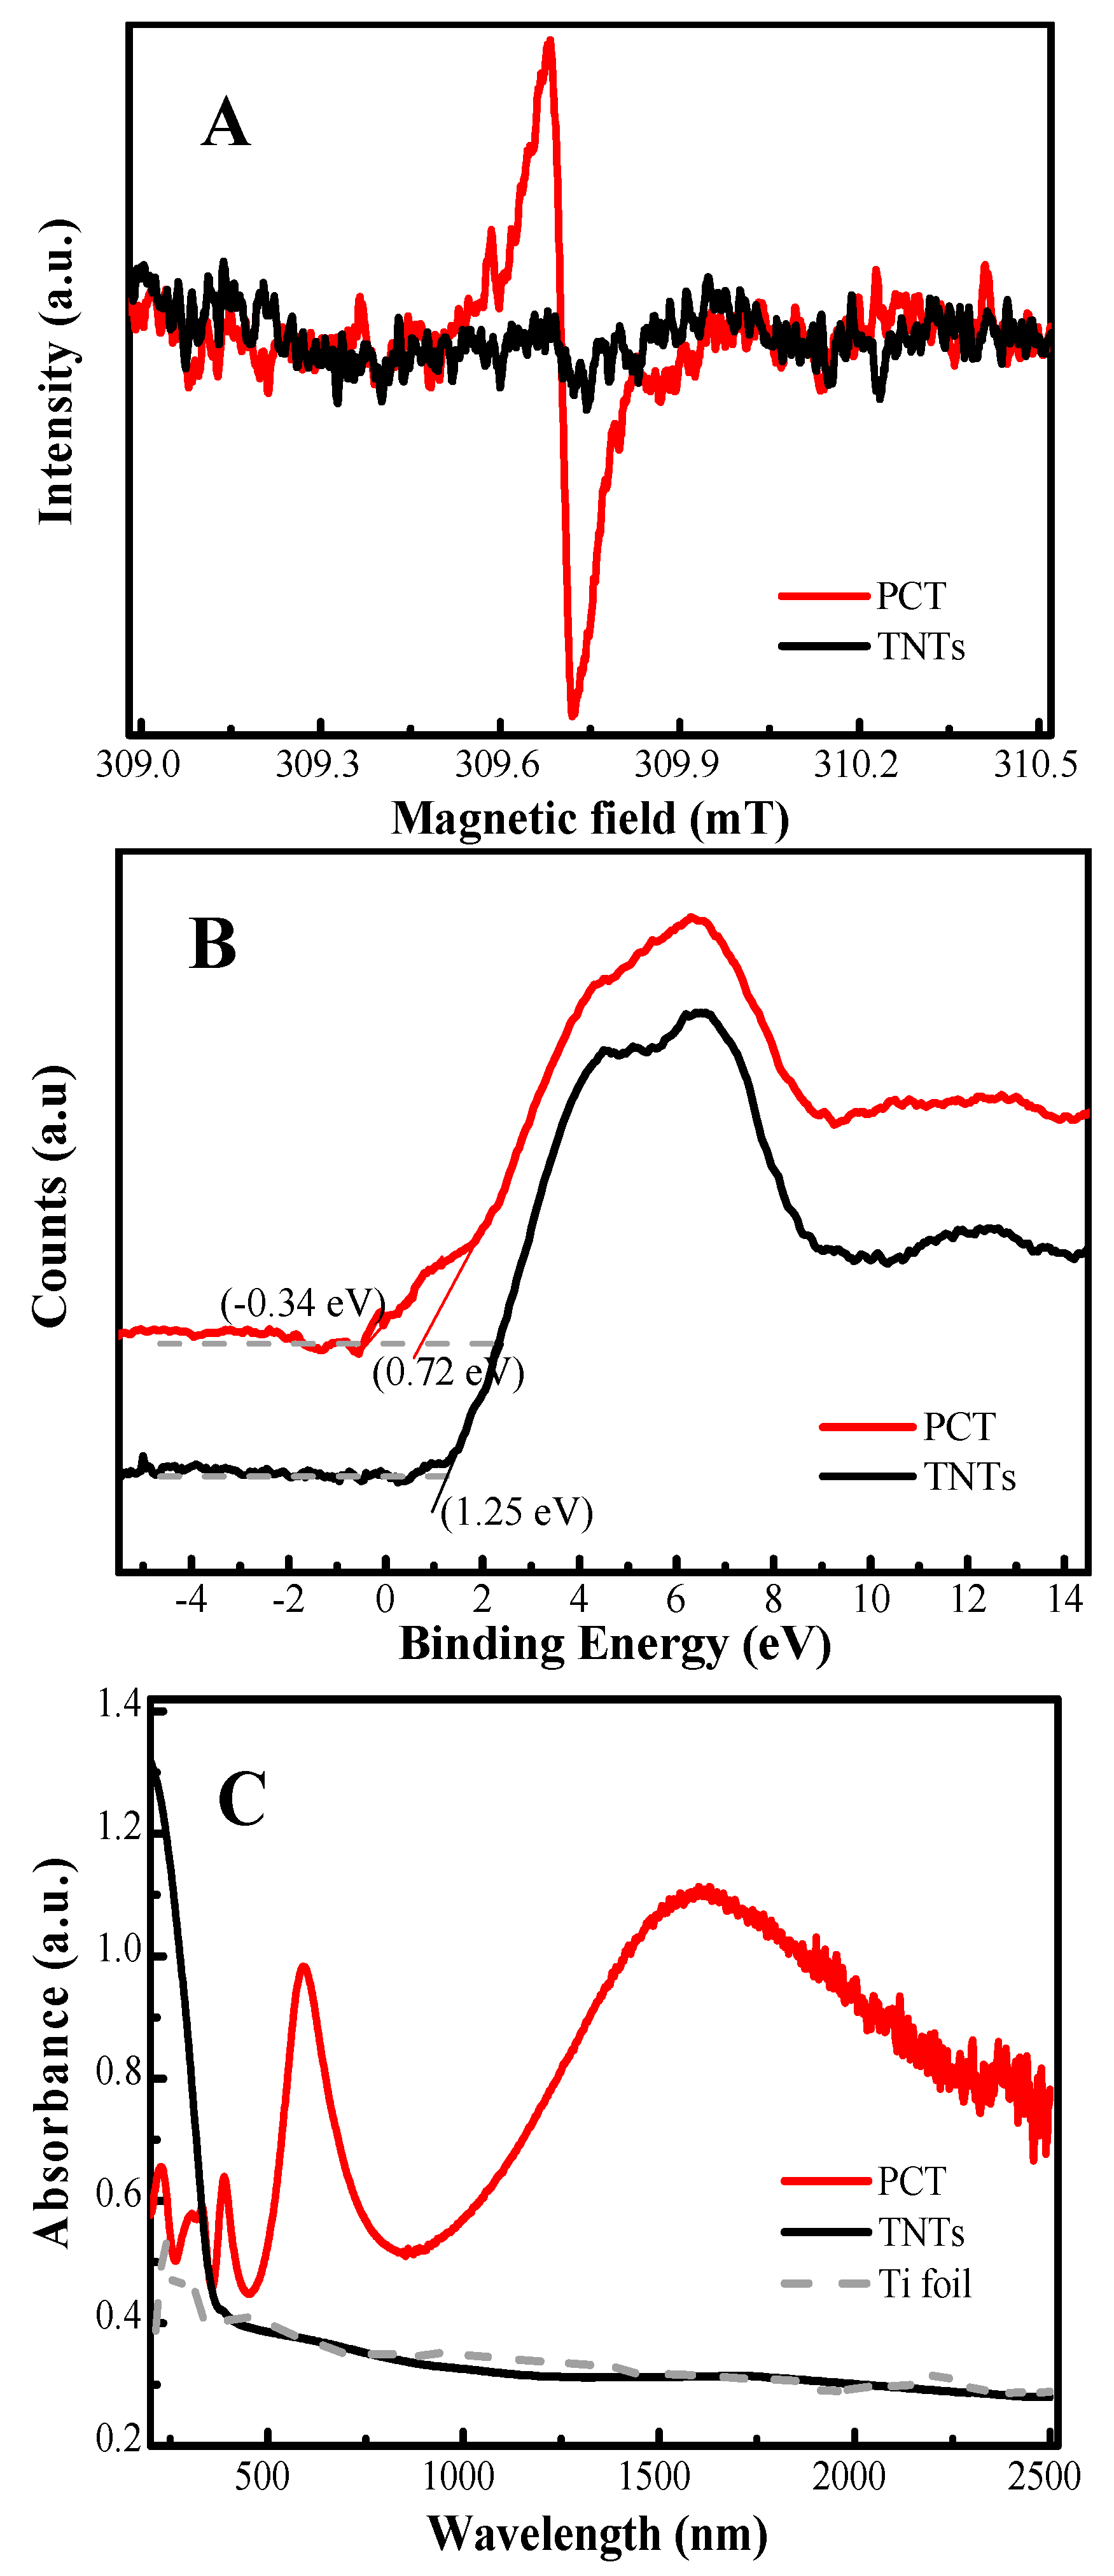
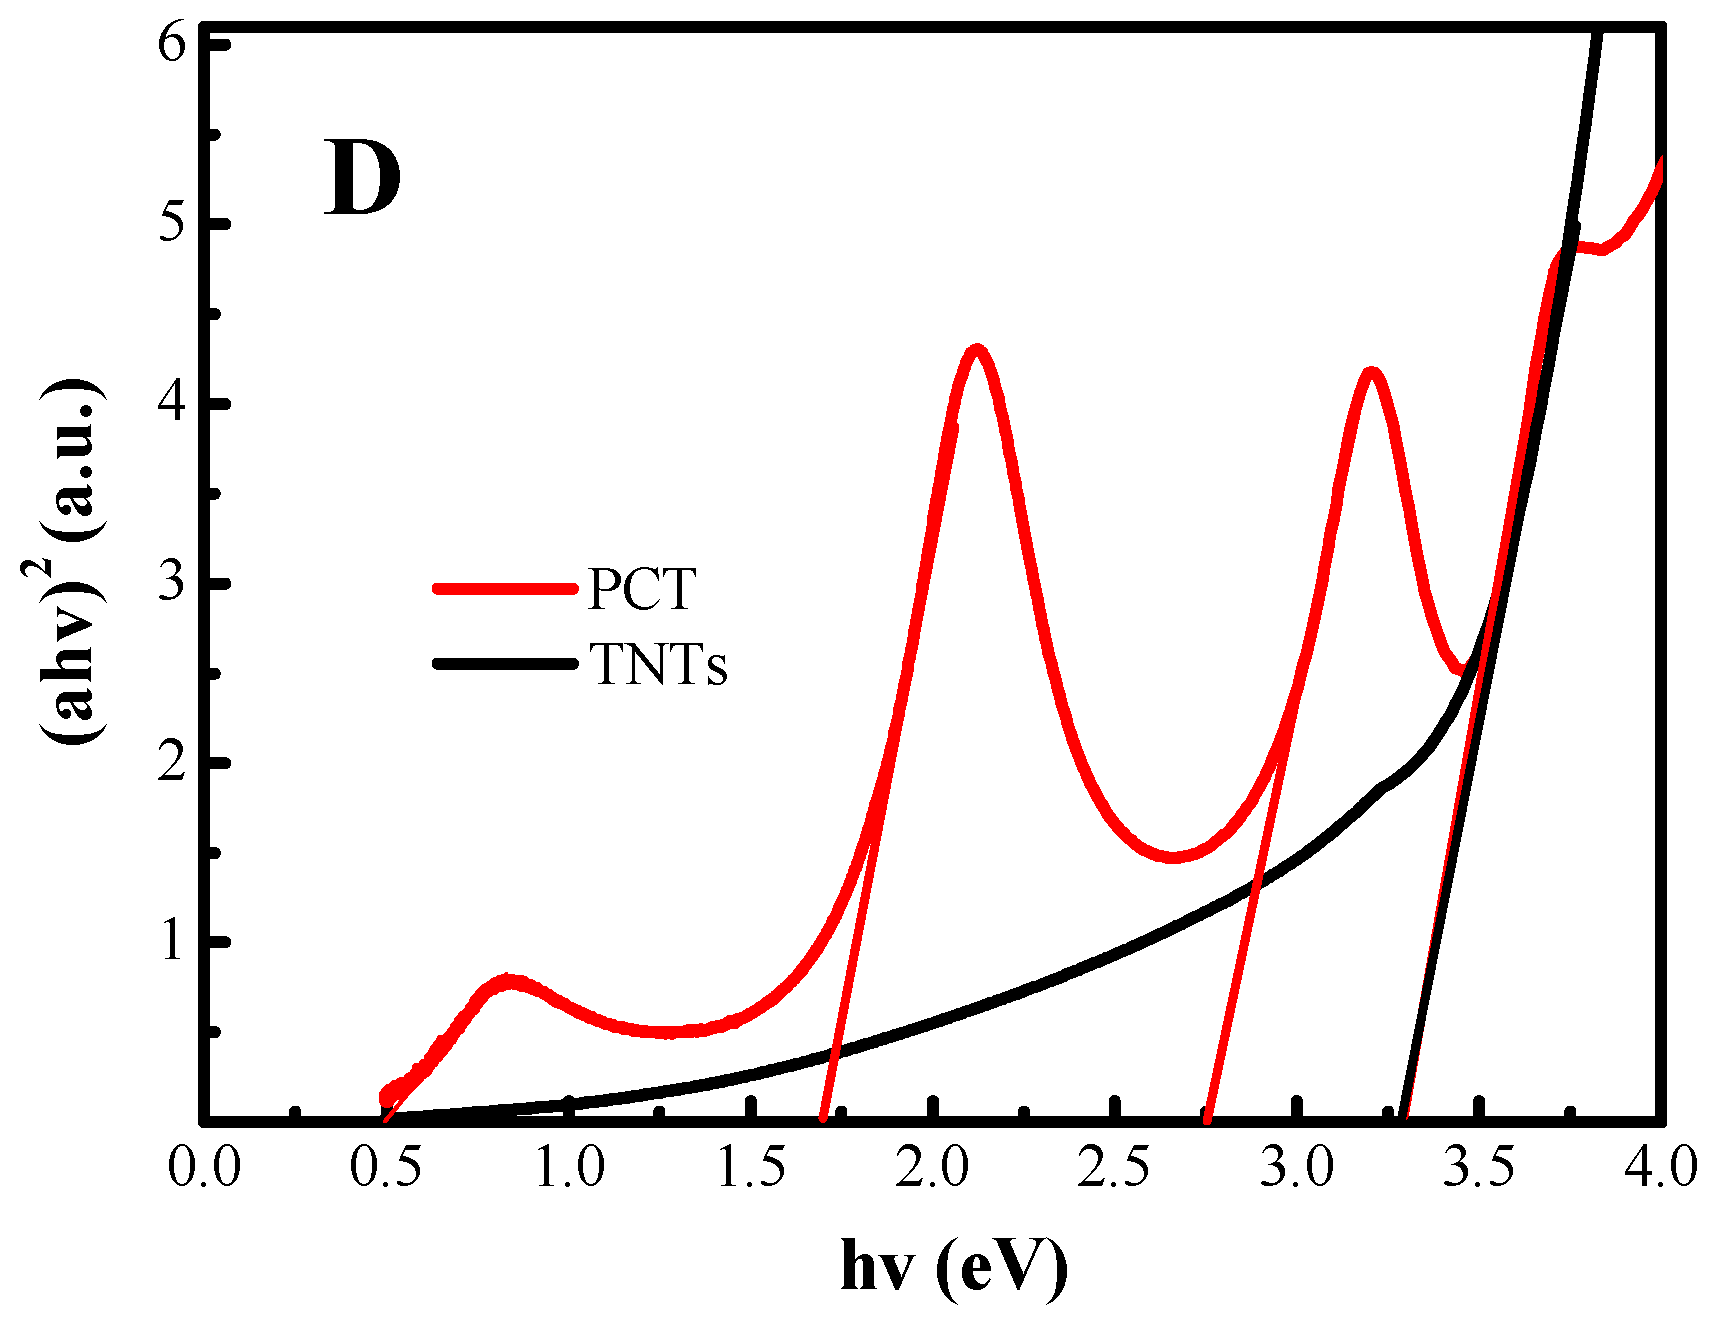
2.4. Lattice Defects and Optical Absorption

ESR results (Figure 4A) showed that the PCT film exhibited a strong signal at g = 2.004, while TNTs did not show observable signals. This signal was attributed to the electron traps associated with Vo [43,44], possibly associated with N doping, Ti3+ and/or disordered structures. N doping could lead to thermal instability and the formation of Vo [45,46]. The interface between the Ti substrate and the oxide layer could undergo the reaction Ti + TiO2→TiOx (x = 0–2) to form Vo [47]. Moreover, the fast cooling process employed was a key component for maintaining stable Vo defects and forming a disordered structure. As shown in Figure S15, the fast cooling sample possessed more Vo defects than a slow cooling sample. The metastable defective phase on the surface, such as Vo, can subsequently be oxidized when a sample annealed at high temperature is rapidly exposed to oxygen-rich air [48], but the Vo defects are maintained at a high concentration in the internal lattice.
Figure 4B showed that the valence band maximum (VBM) of the PCT film was located at 0.72 eV, and the band tail region was shifted toward the vacuum level, ending at approximately −0.34 eV, while TNTs displayed the typical valence band value of TiO2 with the VBM located at ~1.25 eV below the Fermi energy [49]. The substantial shift of the VBM (1.59 eV) for the PCT film was likely caused by the substitutional/interstitial N atoms and the disorder of the anatase/rutile interfaces [50].
The UV-vis-NIR absorption spectra in Figure 4C showed that both PCT film and TNTs had a substantial absorption from 200 to 400 nm due to electron excitation from VB to CB. The PCT film had absorption above 500 nm and the absorption edge remarkably extended to the infrared region (760–2500 nm). This enhanced visible-infrared absorption might be attributed to the N doping and/or Vo and/or the nanoporous pine-cone structure. Nanoporous-layer-covered on the TiO2 nanotube arrays were reported as photonic crystals with a substantial optical absorption even in the infrared region [51,52,53]. Some oscillations in absorbance might also be due to optical interference. The plots of (αhv)2 versus the energy of the absorbed light (hv) [37] shown in Figure 4D hinted that the PCT film might have several distinct electronic transitions, while the TNTs had one of 3.27 eV.

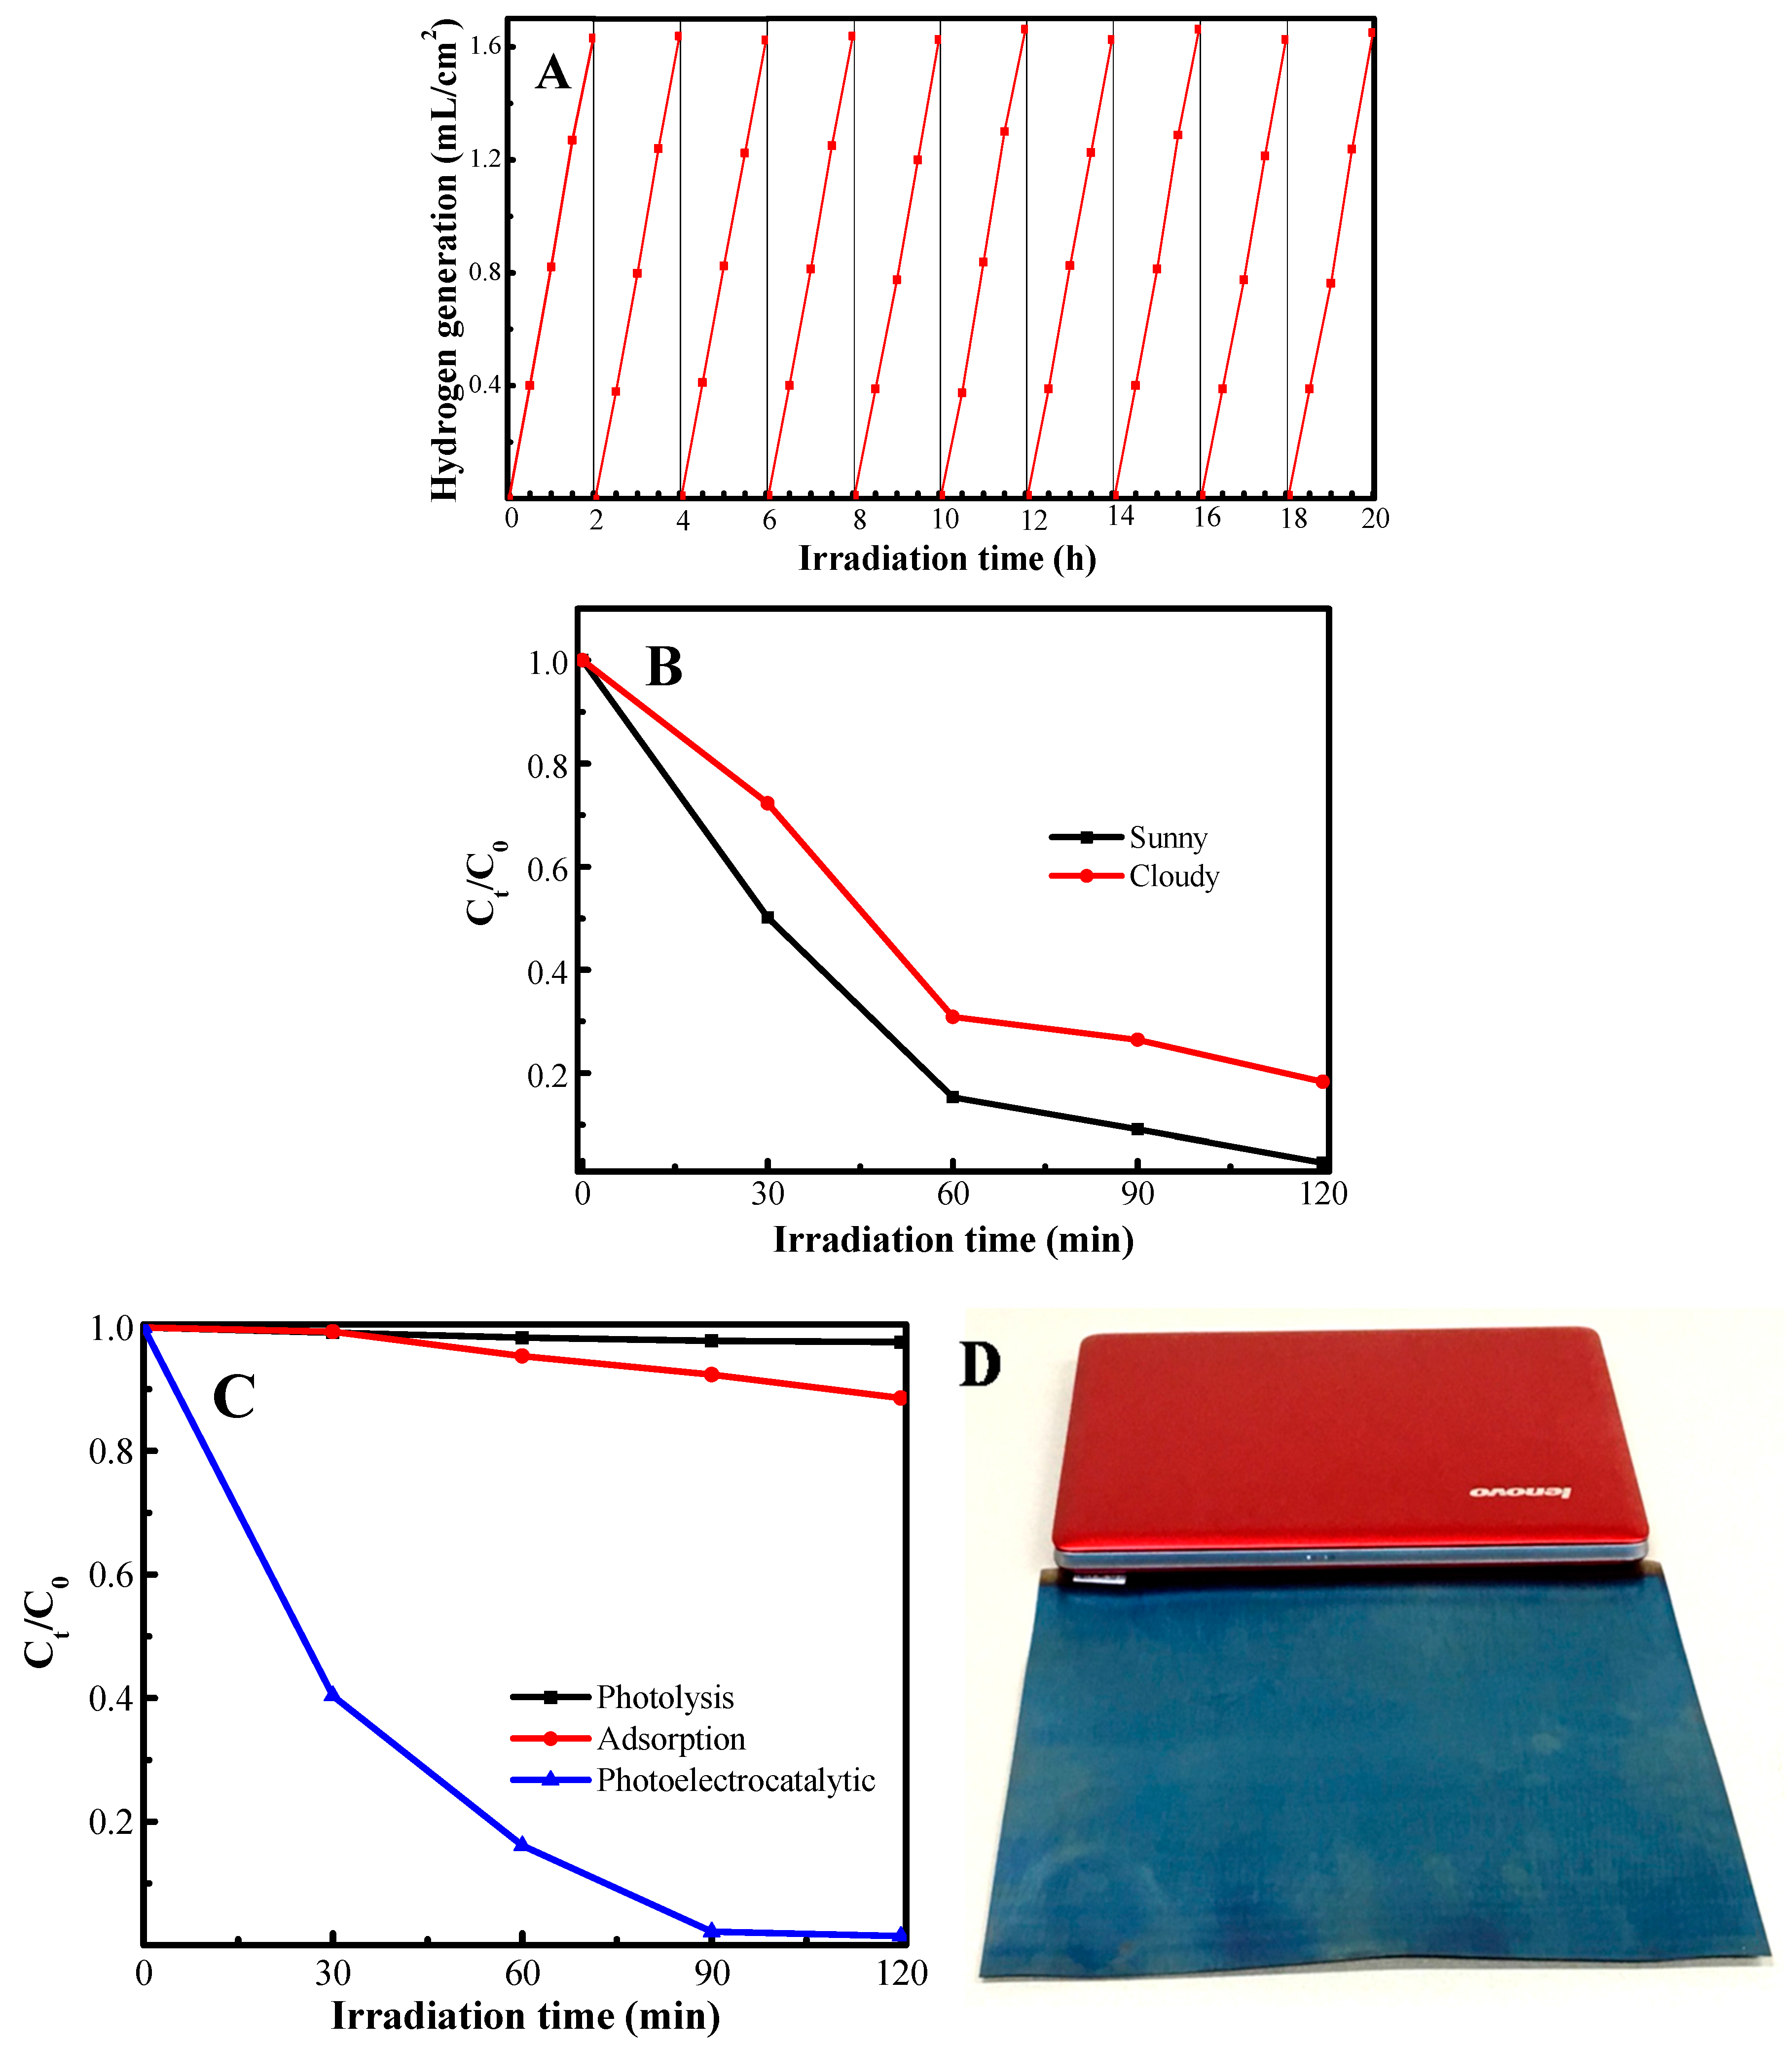
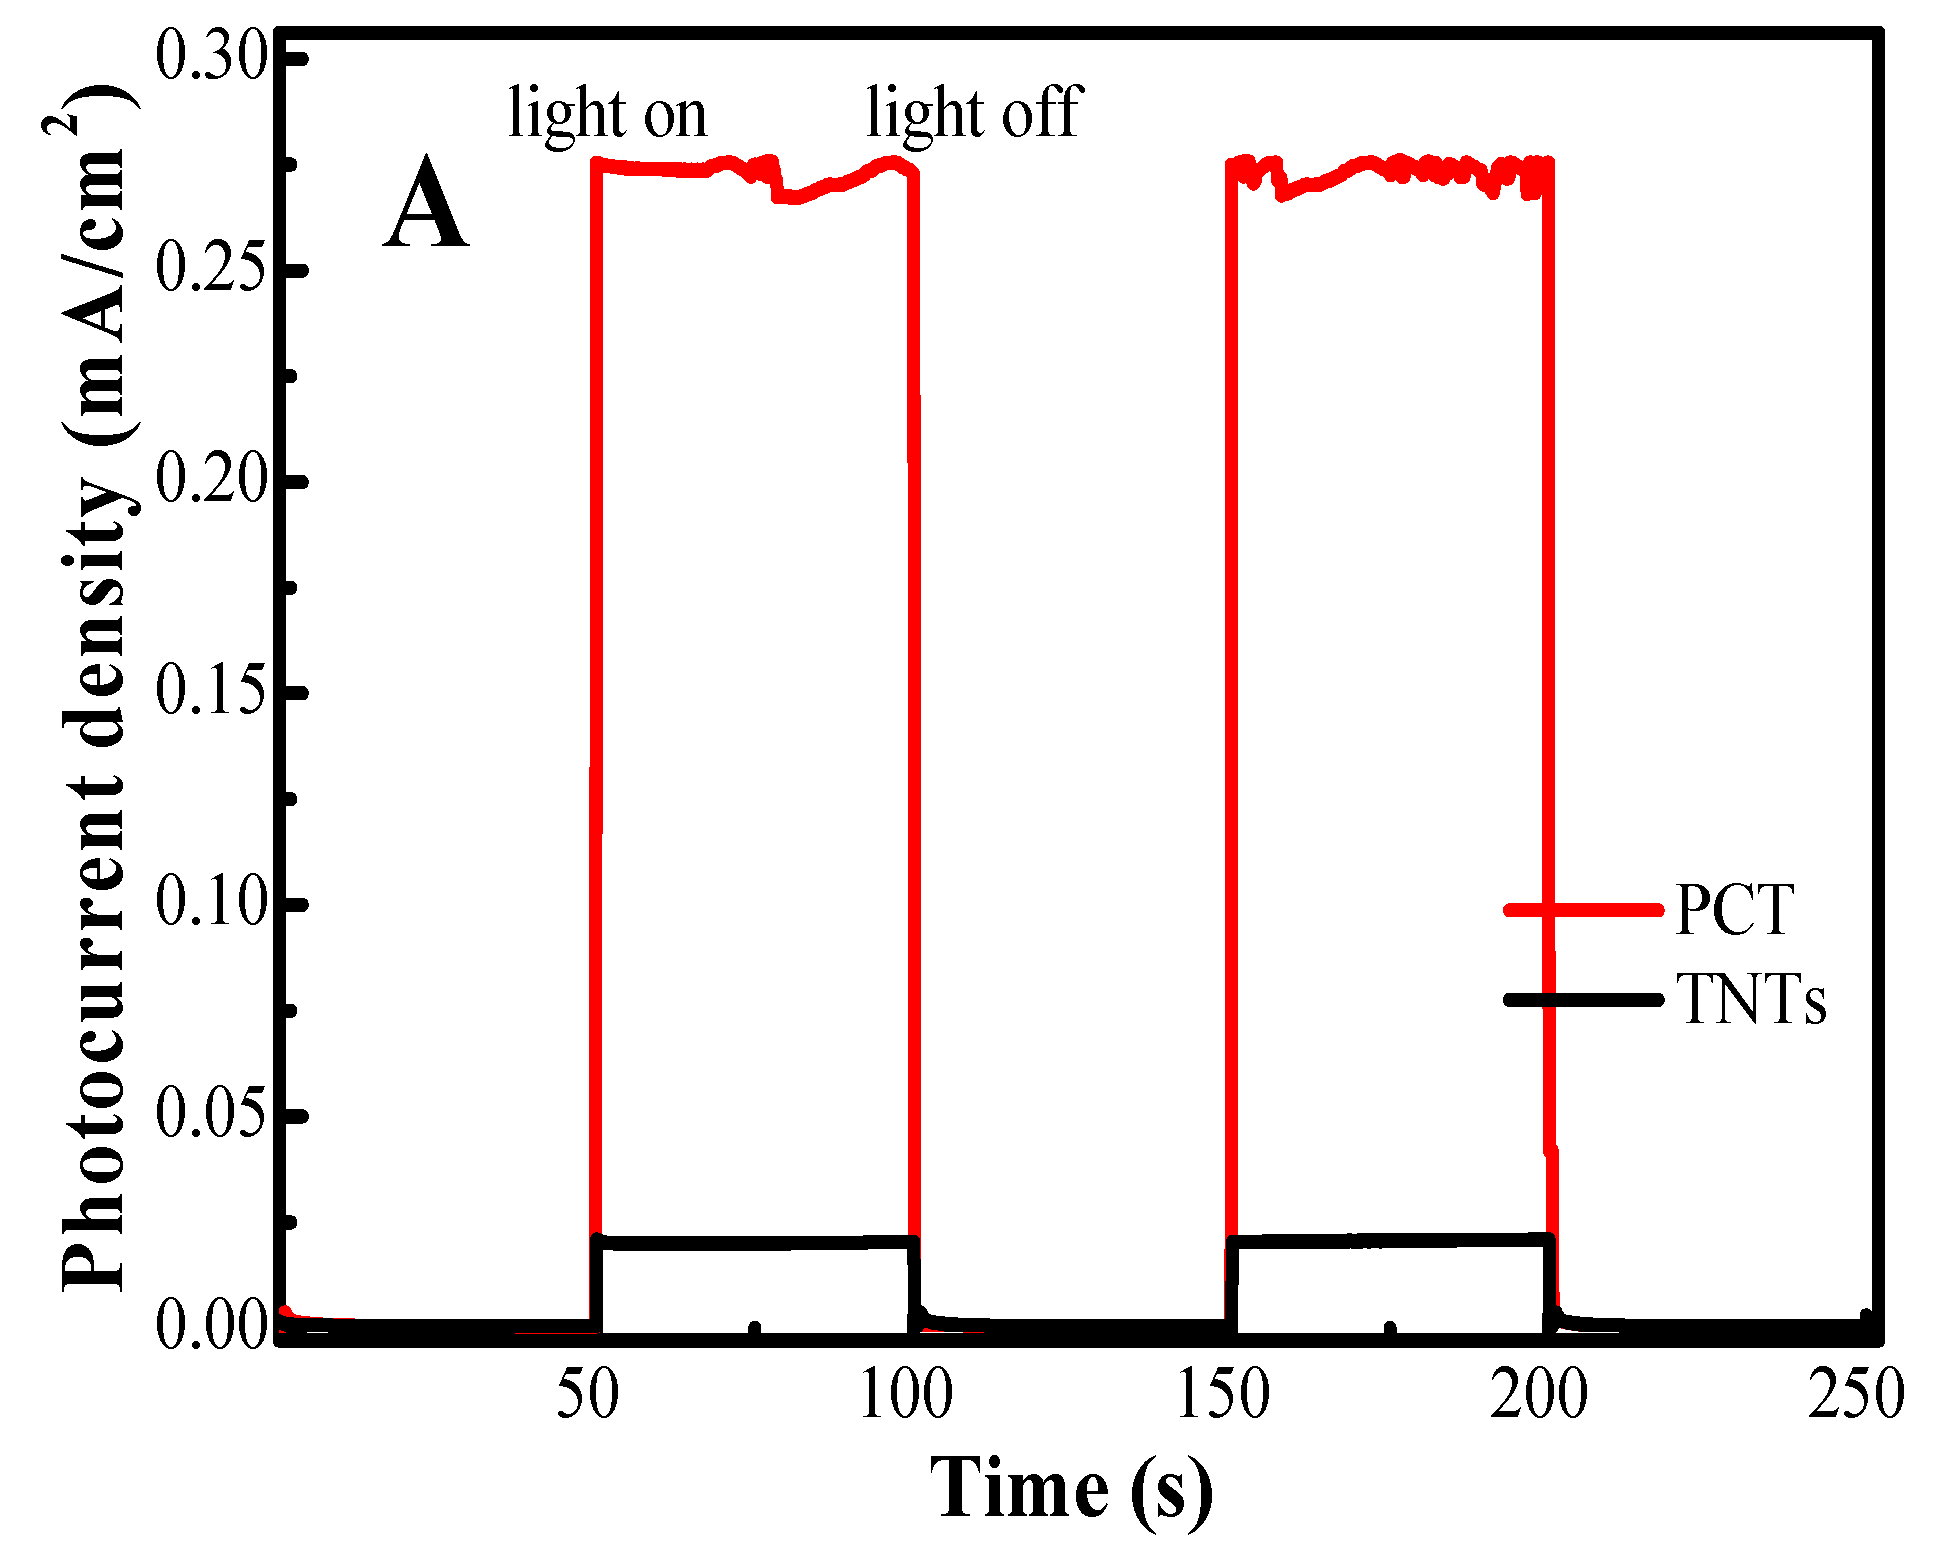
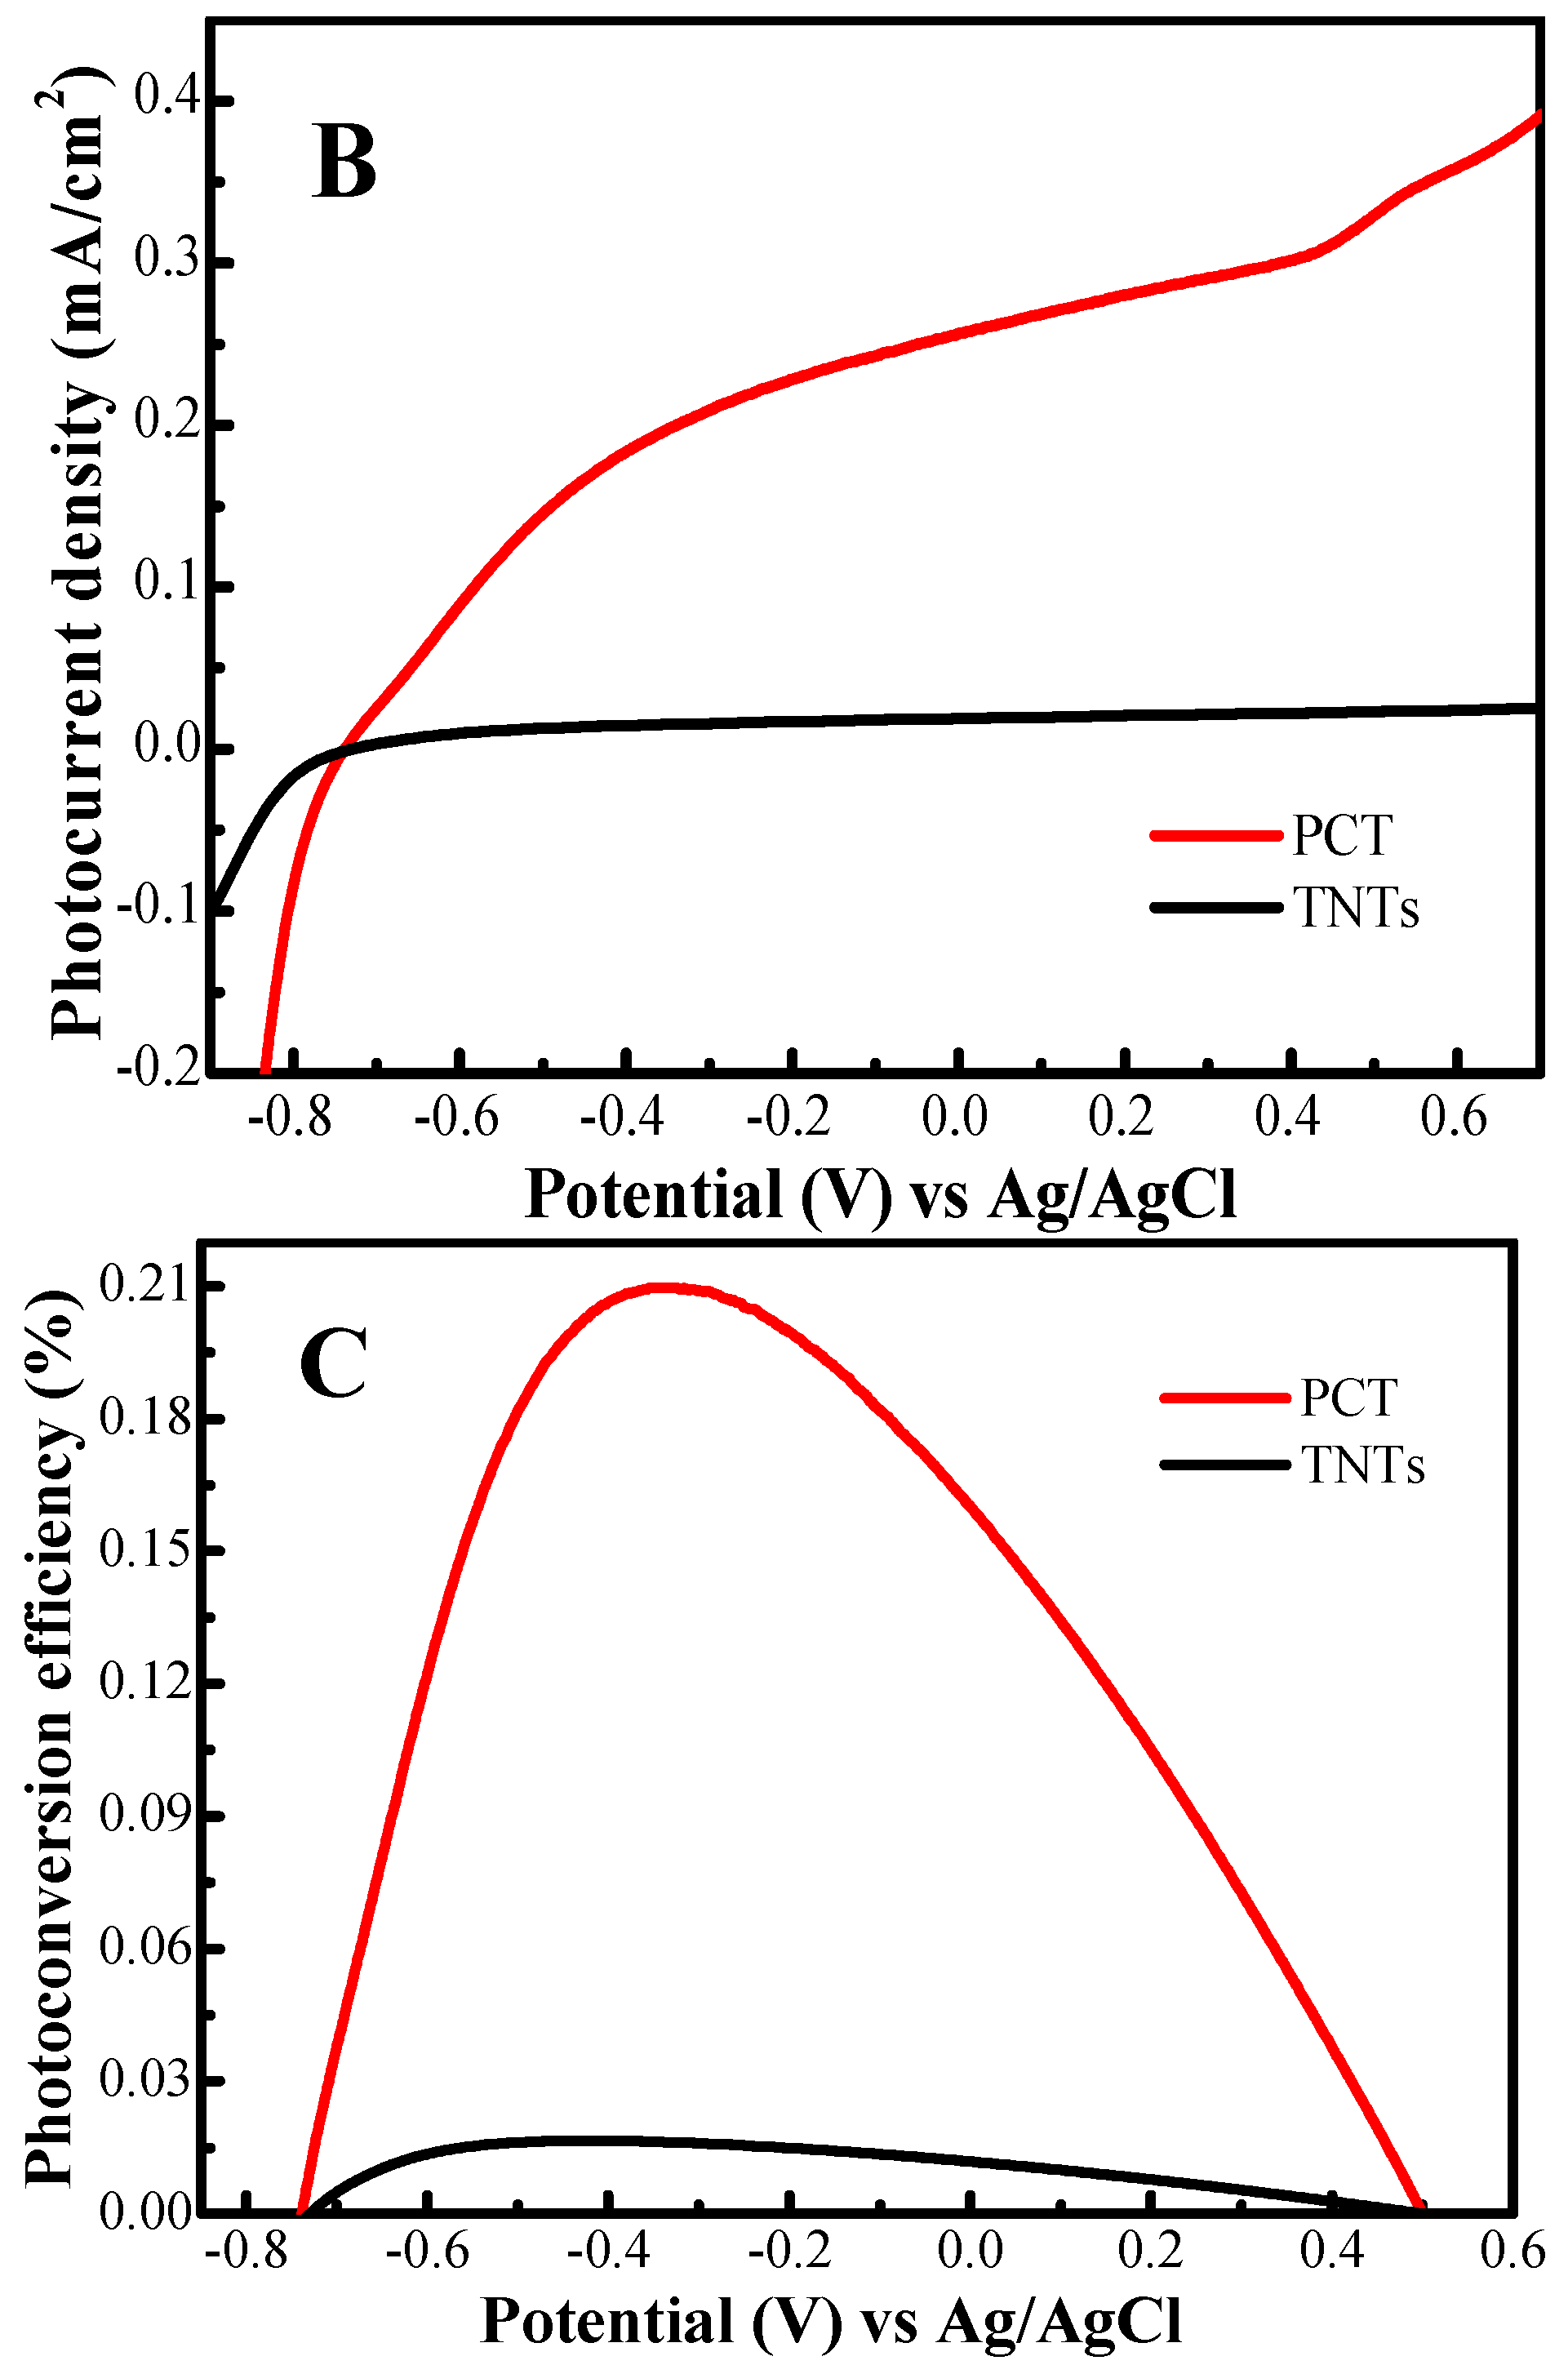
2.5. Photoelectrochemical Activity

The photoelectrochemical activity of the PCT film under natural sunlight was evaluated with its transient photocurrent response, linear sweeps voltammogram and calculated its photoconversion efficiency. As shown in Figure 5A, the PCT film had a strong photocurrent density of 0.28 mA cm−2, 14-fold of the TNTs (0.02 mA cm−2). Figure 5B displayed that the photocurrent density of the PCT film increased rapidly with increasing bias. Figure 5C showed that a maximum photoconversion efficiency of 0.21% was obtained at −0.34 V vs. Ag/AgCl (0.66 V vs. a reversible hydrogen electrode) for the PCT film, approximately 13 times higher than that of TNTs.

2.6. Photoelectrocatalytic Activity

The solar-driven photoelectrocatalytic activity of the PCT film (30 mm × 40 mm) was further evaluated with hydrogen generation and MO degradation under natural sunlight. As shown in Figure 6A, the PCT film exhibited stable activity during a 10-day testing period, and maintained a hydrogen yield of up to 0.8 mL h−1 cm−2. The PCT film also displayed a high photoactivity in MO degradation (Figure 6B). The MO (20 mg L−1, 40.0 mL) degradation rate was 97% and 82% after 2 h on a sunny and cloudy day, respectively (the illumination intensity of sunlight is summarized in Table S2). Measurements showed that the self-decomposition of MO under the light and the adsorption by the photocatalyst were negligible (Figure 6C). The PCT film maintained a stable degradation rate over 10 cycles (Figure S16). Thus, the PCT film is a durable, stable, and efficient photocatalyst.
The activity of a large-sized PCT film (300 mm × 360 mm, Figure 6D and Figure S17) was also evaluated with the decomposition of 2.0 L of MO (20 mg L−1) under three-types of light sources: UV-light, natural sunlight and fluorescent lamp. It had a good photocatalytic activity under UV light and sunlight (Table 1), with 94% and 85% of MO removed within 20 min and 2 h, respectively.

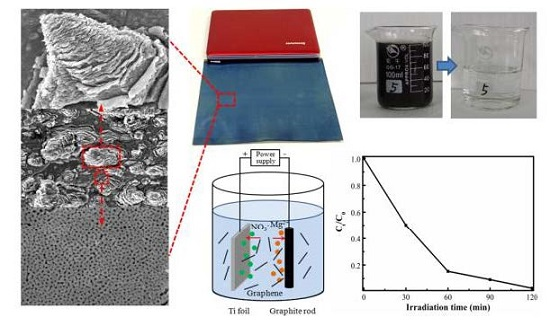
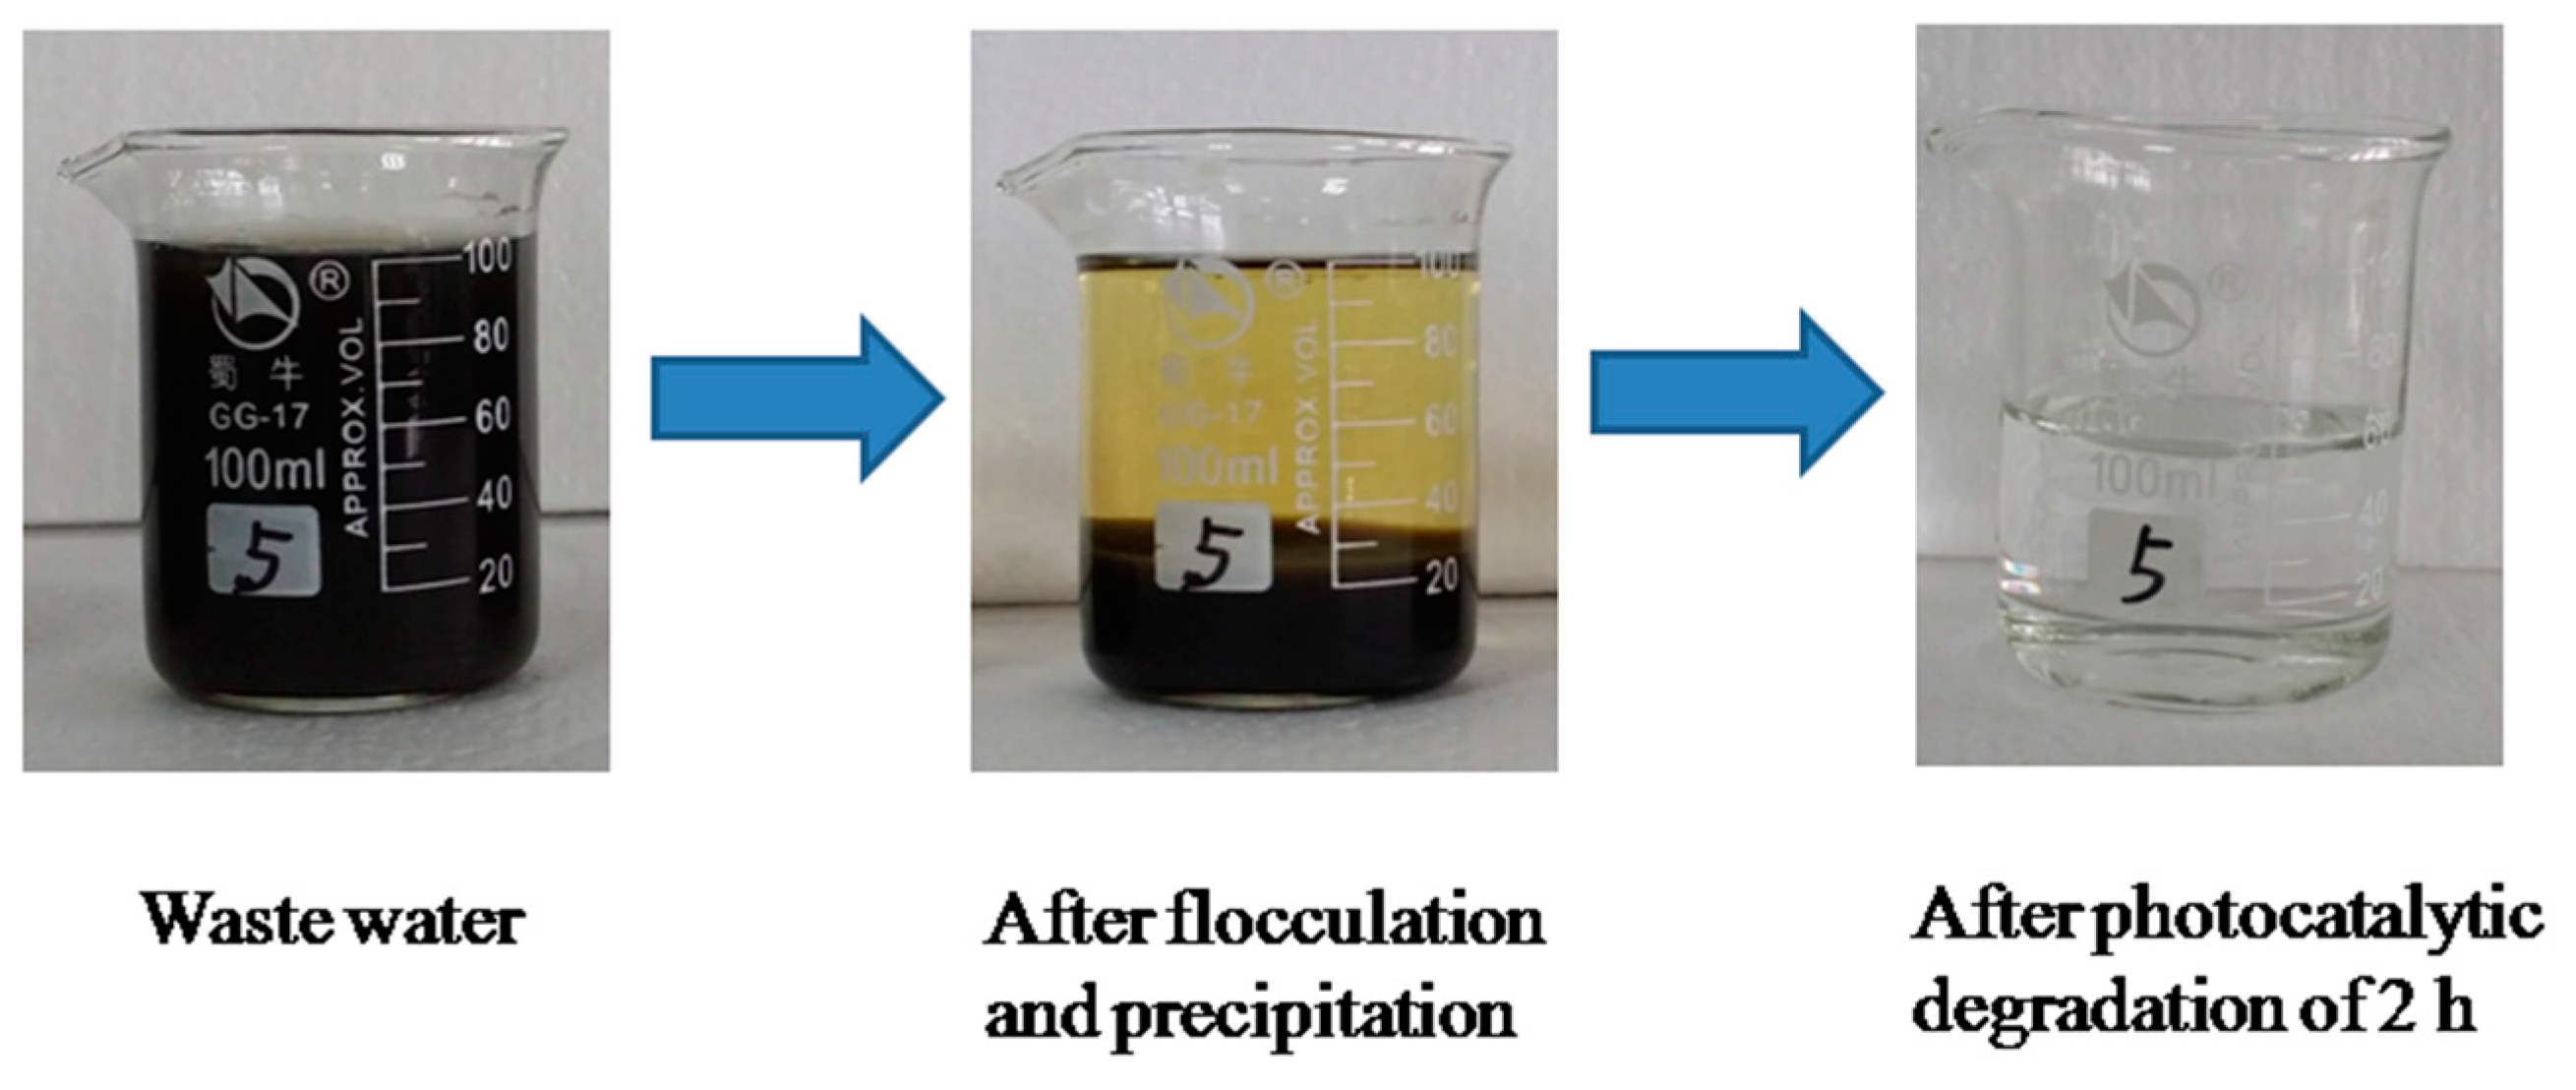
2.7. Photoelectrocatalytic Degradation of Wastewater

The practical performance of the PCT film (30 mm × 40 mm) was further tested with the printing and dyeing wastewater. Figure 7 showed the treatment process. After flocculation and precipitation, the upper wastewater (50.0 mL) was taken out for the photoelectrochemical degradation under UV light. The UV-visible absorbance spectra of waste water (Figure S18) showed that the peaks around 230 and 280 nm obviously decreased after 1 h irradiation, and completely disappeared after 2 h. The wastewater after the test almost had no color. The removal rates of COD and TOC reached 90% and 72.8%, respectively (Table 2). These results indicated that the PCT film had a good photocatalytic activity for purifying wastewater from printing and dyeing industries. According to the previous MO degradation tests, we can calculate that 2.5 L upper wastewater can be purified in 2 h with one large-scale PCT film (300 mm × 360 mm). That means, one 300 mm × 360 mm PCT film can purify 5 L of printing and dyeing wastewater within 2 h. Accordingly, around 556 L wastewater can be purified everyday with 1 m2 of our PCT film.

3. Experimental Section

3.1. Fast Anodization Synthesis of the TiO2 Nanostructured Film

Ti foils (purity 99.9%, 0.3 mm × 30 mm × 40 mm) are polished with abrasive papers, cleaned with acetone, anhydrous ethanol, and distilled water in an ultrasonic bath, each for 10 min. The foils are then washed in a solution of HF/HNO3/H2O (1:4:5 v/v/v) for 30 s, and rinsed with deionized water several times. A mixture of graphene (5.0 mg) (transmission electron microscopy (TEM) and high resolution transmission electron microscopy (HRTEM) images are shown in Figures S19 and S20) and magnesium nitrate solution (100.0 mg L−1, 50.0 mL) is sonicated for 30 min to form a uniform aqueous electrolyte. In the anodizing process, two Ti foils are used as the anode and cathode, and are subjected to a constant voltage of 60 V for 2 min at 298 K. The sample is then rinsed with distilled water, and calcinated at 723 K for 2 h in a muffle oven. This is followed by a fast cooling step, where the sample is immediately taken out from the muffle oven after calcination, and cooled to room temperature. For comparison, the film anodized without graphene in the electrolyte (100.0 mg L−1, 50.0 mL of Mg(NO3)2) is obtained in the same condition, and typical TiO2 nanotube arrays (TNTs) are prepared as well at 60 V in 0.6 wt % NH4F-10 vol % H2O-EG electrolyte for 2 h. In the anodizing process, a Ti foil and a graphite rod are used as the anode and the cathode, respectively.

3.2. Fast Anodization Synthesis of Large-Scale TiO2 Film

Large Ti foils (purity 99.9%, 0.3 mm × 300 mm × 360 mm) are cleaned the same way as the small Ti foils. They are first polished using abrasive papers, then cleaned with acetone, anhydrous ethanol, and distilled water in order. The pre-treatment, composition of the electrolyte, anodization conditions, and calcinations are the same as those applied to the small foils in Section 3.1.

3.3. Characterization

The micromorphologies are analyzed with a Hitachi S-4800 field-emission scanning electron microscopy (FE-SEM) instrument and Tecnai G2 F20 TEM instrument. The crystalline structures are obtained with glancing angle X’pert Pro X-ray diffraction (XRD) with Cu-Kα radiation (0.15418 nm). Ultraviolet-visible-near-infrared (UV-vis-NIR) absorption, Fourier Transform Infrared (FIIR) and Raman spectra are recorded on a Hitachi U-4100 UV-vis-NIR spectrometer, a Nicolet-5700 FTIR spectrophotometer and a LeiCA DMLM micro-spectrometer with excitation wavelength of 514.5 nm, respectively. The chemical states of samples are examined on a Perkin-Elmer X-ray photoelectron spectroscopy (XPS) instrument with an Mg K anode. The binding energy values are calibrated with C 1s = 284.4 eV. Surface defect is studied with a JES FA-200 electron spin resonance (ESR) spectrometer in air at 77 K.

3.4. Photoelectrochemical Performance

The photoelectrochemical measurements are conducted under sunlight in a three-electrode cell using a CHI 830C electrochemical workstation. A 1.0 M NaOH solution, the TiO2 film (1.0 cm2), Ag/AgCl and Pt foil, are used as the electrolyte, the working electrode, the reference and the counter electrode, respectively. The linear sweep voltammetry and photocurrent density are recorded. The efficiency of photoconversion is calculated as follows [54].
η ( % ) = [ ( t o t a l p o w e r o u t p u t e l e c t r i c a l p o w e r i n p u t ) ] / [ l i g h t p o w e r i n p u t ] × 100 % = j p [ ( E r e v 0 | E a p p | ) / I 0 ] × 100 %
here, jp refers to the photocurrent density (mA cm−2), E r e v 0 = 1.23 V the standard potential for H2 evolution, I0 the incident-light power density, and the applied potential Eapp = EmeansEaoc, where Emeans refers to the working electrode potential at jp, Eaoc the open circuit working electrode potential under equivalent conditions, and Eaoc is the voltage where the photocurrent becomes zero.

3.5. Photoelectrocatalytic Activity in Hydrogen Generation and Removal of Model Organic Pollutants

The photoelectrocatalytic activity is assessed with photocatalytic hydrogen generation and pollutants degradation under sunlight. Hydrogen generation is conducted in a quartz cell with a 1.0 M NaOH and 10% vol of methanol. The TiO2 film (30 mm × 40 mm) and Pt foil are used as the photoanode and the cathode, respectively. A bias potential of 1.0 V is applied to the two electrodes separated by a Nafion membrane. Prior to irradiation, this system is purged to remove the air completely with argon. The hydrogen gas produced at the Pt electrode is collected in an inverted burette.
Methylene blue (MB) discoloration test is one of the most popular methods for assessing photocatalytic activity of films and powders [55,56,57]. Here we use methyl orange (MO) as the model organic pollutant as an example. The MO degradation experiments are performed in 40.0 mL of MO solution (20.0 mg L−1, pH = 6.8) with 0.50 M NaCl as the supporting electrolyte. The TiO2 film (30 mm × 40 mm) and a cleanly Ti foil are used as the working electrode and the counter electrode, respectively. A bias potential of 2.0 V is applied. Cycling tests are conducted for 2.5 h at the same time of day (12:00 to 14:30) under direct sunlight for 10 days. 1.0 mL of MO solution is taken out every 30 min, and the absorption spectrum of the MO solution is measured with a UV-vis spectrophotometer. The concentration of MO is determined with the absorbance value at 464 nm. The efficiency of MO decolorization (D%) is calculated as follows:
D % = C 0 C t C 0 × 100 %
here, C0 and Ct are the initial absorbance and the absorbance after reaction time t of MO.

3.6. Removal of Organic Pollutants in Wastewater

The performance of the PCT film for practical pollution removal is assessed with the degradation of wastewater from printing and dyeing industries (Sichuan Mianyang Jialian Printing and Dyeing Company, Mianyang, China) under UV light. The wastewater is dark brown and its composition is very complex (pH = 13, Chemical oxygen demand (COD) is 2620 mg/L. Total organic carbon (TOC) is 1030 mg/L). Then, 100 mL wastewater is taken out to test, after pre-treatment of flocculation and precipitation, 50 mL upper solutions is then taken for the photoelectrocatalytic degradation. The large TiO2 film (30 mm × 40 mm) and a cleanly Ti foil are used as the working and counter electrodes, respectively. A bias potential of 2.0 V is applied to the two electrodes. 0.50 M NaCl is added as the supporting electrolyte. Then, 1 mL MO solution is taken out every 30 min to measure its absorption spectrum. After 2 h irradiation, its COD is measured by Potassium dichromate oxidation method, and its TOC is determined using a Shimadzu TOC analyzer. COD and TOC removal are calculated using the following equations, respectively.
C O D r e m o v a l ( % ) = ( C O D 0 C O D t ) / C O D 0 × 100
T O C r e m o v a l ( % ) = ( T O C 0 T O C t ) / T O C 0 × 100
where COD0 (mg L−1) and CODt (mg L−1) are the initial concentration of chemical oxygen demand and its remaining concentration of chemical oxygen demand after reaction, respectively. TOC0 (mg L−1) and TOCt (mg L−1) are the initial concentration of total organic carbon and its remaining concentration of total organic carbon after reaction, respectively.

4. Conclusions

In this study, we have demonstrated a fast anodizing method to synthesize large-scale (e.g., 300 mm × 360 mm) pine-cone nanostructured TiO2 film. The pine-cone TiO2 possesses a strong solar absorption, and exhibits high photocatalytic activities in photo-oxidizing organic pollutants in wastewater and producing hydrogen from water under natural sunlight. This work has showed a promising future for practical utilization of anodized TiO2 films in renewable energy and clean environment applications.

Supplementary Materials

The following are available online at www.mdpi.com/2073-4344/7/8/229/s1, Figure S1: FE-SEM image of overall PCT film, Figure S2: FE-SEM images of the TiO2 film anodized in the electrolyte of magnesium nitrate solution (100 mg L−1, 50 mL) at 60 V for 2 min, Figure S3: FE-SEM image of top view of the PCT film, Figure S4: FE-SEM image of layer structure of the PCT film, Figure S5: FE-SEM image of cracks on the oxide layer, Figure S6: FE-SEM image of the nanoporous oxide layer, Figure S7: FE-SEM image of small cracks in the Figure 1A, Figure S8: FE-SEM image of TiO2 fragment washed up by O2 gas, Figure S9: XRD patterns of the PCT films. Specific diffraction peaks for anatase (JCPDS#21−1272) and rutile (JCPDS#21−1276) are labeled according to A(hkl) and R(hkl), respectively, Figure S10: Raman scattering patterns of the PCT films, where the anatase and rutile vibration modes are labeled according to mode (a) and mode (r), respectively, Figure S11: Full XPS spectra of PCT film and TNTs, Figure S12: N 1s XPS spectrum of the PCT film, Figure S13: Ti 2p XPS spectra of the PCT film and TNTs, Figure S14: O 1s XPS spectra of the PCT film and TNTs, Figure S15: ESR spectra of PCT film with different cooling styles after calcination at 723 K for 2 h, Figure S16: Stability test of methyl orange degradation for ten cycles under natural sunlight (CMO = 20 mg L−1, VMO = 40 mL), Figure S17: Pictures for the large-scale PCT films prepared by different anodization conditions. A laptop was used as a reference, Figure S18: UV-Vis absorbance of the printing and dyeing wastewater during the photoelectrochemical degradation process. ☆ represents the absorbance of the waste water after flocculation and precipitation, Figure S19: TEM images of prepared graphene. The as-prepared graphene was almost completely transparent and had an average length and width of about 500 and 300 nm, Figure S20: HRTEM images of prepared graphene. The graphene was no more than 7 layers thick, Table S1: Lattice parameters and particle sizes of the PCT film, Table S2: Average illumination intensity of sunlight and outside temperature during the MO photodegradation.

Acknowledgments

This work was supported by Program for Changjiang Scholars and Innovative Research Team in University (IRT13083) from Ministry of Education of The People’s Republic of China. The authors thank the support from China Scholarship Council and the College of Arts and Science, University of Missouri-Kansas City, and University of Missouri Research Board.

Author Contributions

As for authors, Yan Liu and Yanzong Zhang conceived and designed the experiments; Yan Liu performed all experiments and finished the manuscript with assistance from Lilin Wang, Gang Yang, Fei Shen, Shihuai Deng, and Xiaohong Zhang. He Yan and Yaodong Hu helped revised the manuscript. Xiaobo Chen provided the analysis tools and helped analyzed the mechanism.

Conflicts of Interest

The authors declare no conflict of interest.

References

  1. Dong, J.; Han, J.; Liu, Y.; Nakajima, A.; Matsushita, S.; Wei, S.; Gao, W. Defective Black TiO2 Synthesized via Anodization for Visible-Light Photocatalysis. ACS Appl. Mater. Interfaces 2014, 6, 1385–1388. [Google Scholar] [CrossRef] [PubMed]
  2. Cui, H.; Zhao, W.; Yang, C.; Yin, H.; Lin, T.; Shan, Y.; Xie, Y.; Gu, H.; Huang, F. Black TiO2 nanotube arrays for high-efficiency photoelectrochemical water-splitting. J. Mater. Chem. A 2014, 2, 8612–8616. [Google Scholar] [CrossRef]
  3. Su, T.; Yang, Y.; Na, Y.; Fan, R.; Li, L.; Wei, L.; Yang, B.; Cao, W. An Insight into the Role of Oxygen Vacancy in Hydrogenated TiO2 Nanocrystals in the Performance of Dye-Sensitized Solar Cells. ACS Appl. Mater. Interfaces 2015, 7, 3754–3763. [Google Scholar] [CrossRef] [PubMed]
  4. Lee, J.; Hwang, S.H.; Yun, J.; Jang, J. Fabrication of SiO2/TiO2 Double-Shelled Hollow Nanospheres with Controllable Size via Sol-Gel Reaction and Sonication-Mediated Etching. ACS Appl. Mater. Interfaces 2014, 6, 15420–15426. [Google Scholar] [CrossRef] [PubMed]
  5. Sarkar, A.; Jeon, N.J.; Noh, J.H.; Seok, S.I. Well-Organized Mesoporous TiO2 Photoelectrodes by Block Copolymer-Induced Sol-Gel Assembly for Inorganic-Organic Hybrid Perovskite Solar Cells. J. Phys. Chem. C 2014, 118, 16688–16693. [Google Scholar] [CrossRef]
  6. Lee, J.S.; You, K.H.; Park, C.B. Highly photoactive, low bandgap TiO2 nanoparticles wrapped by graphene. Adv. Mater. 2012, 24, 1084–1088. [Google Scholar] [CrossRef] [PubMed]
  7. Perera, S.D.; Mariano, R.G.; Vu, K.; Nour, N.; Seitz, O.; Chabal, Y.; Balkus, K.J. Hydrothermal Synthesis of Graphene-TiO2 Nanotube Composites with Enhanced Photocatalytic Activity. ACS Catal. 2012, 2, 949–956. [Google Scholar] [CrossRef]
  8. Chen, M.; Shen, X.; Wu, Q.; Li, W.; Diao, G. Template-assisted synthesis of core-shell α-Fe2O3@TiO2 nanorods and their photocatalytic property. J. Mater. Sci. 2015, 50, 4083–4094. [Google Scholar] [CrossRef]
  9. Zhang, X.; Huang, Y.; Huang, X.; Huang, C.; Li, H. Synthesis and characterization of polypyrrole using TiO2 nanotube@poly(sodium styrene sulfonate) as dopant and template. Polym. Compos. 2016, 37, 462–467. [Google Scholar] [CrossRef]
  10. Dutta, S.; Patra, A.K.; De, S.; Bhaumik, A.; Saha, B. Self-Assembled TiO2 Nanospheres By Using a Biopolymer as a Template and Its Optoelectronic Application. ACS Appl. Mater. Interfaces 2012, 4, 1560–1564. [Google Scholar] [CrossRef] [PubMed]
  11. Zimbone, M.; Cacciato, G.; Boutinguiza, M.; Privitera, V.; Grimaldi, M.G. Laser irradiation in water for the novel, scalable synthesis of black TiOx photocatalyst for environmental remediation. Beilstein J. Nanotechnol. 2017, 8, 196–202. [Google Scholar] [CrossRef] [PubMed]
  12. Zimbone, M.; Cacciato, G.; Sanz, R.; Carles, R.; Gulino, A.; Privitera, V.; Grimaldi, M.G. Black TiOx photocatalyst obtained by laser irradiation in water. Catal. Commun. 2016, 84, 11–15. [Google Scholar] [CrossRef]
  13. Zimbone, M.; Cacciato, G.; Buccheri, M.A.; Sanz, R.; Piluso, N.; Reitano, R.; Via, F.L.; Grimaldi, M.G.; Privitera, V. Photocatalytical activity of amorphous hydrogenated TiO2 obtained by pulsed laser ablation in liquid. Mater. Sci. Semicond. Process. 2016, 42, 28–31. [Google Scholar] [CrossRef]
  14. Zimbone, M.; Buccheri, M.A.; Cacciato, G.; Sanz, R.; Rappazzo, G.; Boninelli, S.; Reitano, R.; Romano, L.; Privitera, V.; Grimaldi, M.G. Photocatalytical and antibacterial activity of TiO2 nanoparticles obtained by laser ablation in water. Appl. Catal. B Environ. 2015, 165, 487–494. [Google Scholar] [CrossRef]
  15. Du, Y.; Cai, H.; Wen, H.; Wu, Y.; Huang, L.; Ni, J.; Li, J.; Zhang, J. Novel Combination of Efficient Perovskite Solar Cells with Low Temperature Processed Compact TiO2 Layer via Anodic Oxidation. ACS Appl. Mater. Interfaces 2016, 8, 12836–12842. [Google Scholar] [CrossRef] [PubMed]
  16. Li, H.; Cheng, J.-W.; Shu, S.; Zhang, J.; Zheng, L.; Tsang, C.K.; Cheng, H.; Liang, F.; Lee, S.-T.; Li, Y.Y. Selective Removal of the Outer Shells of Anodic TiO2 Nanotubes. Small 2013, 9, 37–44. [Google Scholar] [CrossRef] [PubMed]
  17. Liu, G.; Sun, C.; Yang, H.G.; Smith, S.C.; Wang, L.; Lu, G.Q.; Cheng, H.-M. Nanosized anatase TiO2 single crystals for enhanced photocatalytic activity. Chem. Commun. 2010, 46, 755–757. [Google Scholar] [CrossRef] [PubMed]
  18. Jiao, W.; Wang, L.; Liu, G.; Lu, G.Q.; Cheng, H.-M. Hollow Anatase TiO2 Single Crystals and Mesocrystals with Dominant {101} Facets for Improved Photocatalysis Activity and Tuned Reaction Preference. ACS Catal. 2012, 2, 1854–1859. [Google Scholar] [CrossRef]
  19. Wu, X.; Lu, G.Q.; Wang, L. Shell-in-shell TiO2 hollow spheres synthesized by one-pot hydrothermal method for dye-sensitized solar cell application. Energy Environ. Sci. 2011, 4, 3565–3572. [Google Scholar] [CrossRef]
  20. Joo, J.B.; Dahl, M.; Li, N.; Zaera, F.; Yin, Y. Tailored synthesis of mesoporous TiO2 hollow nanostructures for catalytic applications. Energy Environ. Sci. 2013, 6, 2082–2092. [Google Scholar] [CrossRef]
  21. Joo, J.B.; Zhang, Q.; Dahl, M.; Lee, I.; Goebl, J.; Zaera, F.; Yin, Y. Control of the nanoscale crystallinity in mesoporous TiO2 shells for enhanced photocatalytic activity. Energy Environ. Sci. 2012, 5, 6321–6327. [Google Scholar] [CrossRef]
  22. Konishi, J.; Fujita, K.; Nakanishi, K.; Hirao, K. Monolithic TiO2 with Controlled Multiscale Porosity via a Template-Free Sol-Gel Process Accompanied by Phase Separation. Chem. Mater. 2006, 18, 6069–6074. [Google Scholar] [CrossRef]
  23. Wu, X.; Chen, Z.; Lu, G.Q.; Wang, L. Nanosized Anatase TiO2 Single Crystals with Tunable Exposed (001) Facets for Enhanced Energy Conversion Efficiency of Dye-Sensitized Solar Cells. Adv. Funct. Mater. 2011, 21, 4167–4172. [Google Scholar] [CrossRef]
  24. Sánchez-Tovar, R.; Lee, K.; García-Antón, J.; Schmuki, P. Formation of anodic TiO2 nanotube or nanosponge morphology determined by the electrolyte hydrodynamic conditions. Electrochem. Commun. 2013, 26, 1–4. [Google Scholar] [CrossRef]
  25. Yoo, J.E.; Lee, K.; Altomare, M.; Selli, E.; Schmuki, P. Self-Organized Arrays of Single-Metal Catalyst Particles in TiO2 Cavities: A Highly Efficient Photocatalytic System. Angew. Chem. Int. Ed. 2013, 52, 7514–7517. [Google Scholar] [CrossRef] [PubMed]
  26. Yoo, J.; Altomare, M.; Mokhtar, M.; Alshehri, A.; Al-Thabaiti, S.A.; Mazare, A.; Schmuki, P. Photocatalytic H2 Generation Using Dewetted Pt-Decorated TiO2 Nanotubes: Optimized Dewetting and Oxide Crystallization by a Multiple Annealing Process. J. Phys. Chem. C 2016, 120, 15884–15892. [Google Scholar] [CrossRef]
  27. Liang, F.; Luo, L.-B.; Tsang, C.-K.; Zheng, L.; Cheng, H.; Li, Y.Y. TiO2 nanotube-based field effect transistors and their application as humidity sensors. Mater. Res. Bull. 2012, 47, 54–58. [Google Scholar] [CrossRef]
  28. Zheng, L.; Han, S.; Liu, H.; Yu, P.; Fang, X. Hierarchical MoS2 Nanosheet@ TiO2 Nanotube Array Composites with Enhanced Photocatalytic and Photocurrent Performances. Small 2016, 12, 1527–1536. [Google Scholar] [CrossRef] [PubMed]
  29. Chu, S.; Inoue, S.; Wada, K.; Hishita, S.; Kurashima, K. A New Electrochemical Lithography Fabrication of Self-Organized Titania Nanostructures on Glass by Combined Anodization. J. Electrochem. Soc. 2005, 152, B116–B124. [Google Scholar] [CrossRef]
  30. Ghicov, A.; Schmuki, P. Self-ordering electrochemistry: A review on growth and functionality of TiO2 nanotubes and other self-aligned MOx structures. Chem. Commun. 2009, 2791–2808. [Google Scholar] [CrossRef] [PubMed]
  31. Giammar, D.E.; Maus, C.J.; Xie, L. Effects of particle size and crystalline phase on lead adsorption to titanium dioxide nanoparticles. Environ. Eng. Sci. 2007, 24, 85–95. [Google Scholar] [CrossRef]
  32. Keller, A.A.; Wang, H.; Zhou, D.; Lenihan, H.S.; Cherr, G.; Cardinale, B.J.; Miller, R.; Ji, Z. Stability and aggregation of metal oxide nanoparticles in natural aqueous matrices. Environ. Sci. Technol. 2010, 44, 1962–1967. [Google Scholar] [CrossRef] [PubMed]
  33. Shih, Y.-H.; Liu, W.-S.; Su, Y.-F. Aggregation of stabilized TiO2 nanoparticle suspensions in the presence of inorganic ions. Environ. Toxicol. Chem. 2012, 31, 1693–1698. [Google Scholar] [CrossRef] [PubMed]
  34. Deskins, N.A.; Kerisit, S.; Rosso, K.M.; Dupuis, M. Molecular Dynamics Characterization of Rutile-Anatase Interfaces. J. Phys. Chem. C 2007, 111, 9290–9298. [Google Scholar] [CrossRef]
  35. Liang, H.C.; Li, X.Z. Effects of structure of anodic TiO2 nanotube arrays on photocatalytic activity for the degradation of 2,3-dichlorophenol in aqueous solution. J. Hazard. Mater. 2009, 162, 1415–1422. [Google Scholar] [CrossRef] [PubMed]
  36. Hasegawa, G.; Sato, T.; Kanamori, K.; Nakano, K.; Yajima, T.; Kobayashi, Y.; Kageyama, H.; Abe, T.; Nakanishi, K. Hierarchically Porous Monoliths Based on N-Doped Reduced Titanium Oxides and Their Electric and Electrochemical Properties. Chem. Mater. 2013, 25, 3504–3512. [Google Scholar] [CrossRef]
  37. Wang, D.-H.; Jia, L.; Wu, X.-L.; Lu, L.-Q.; Xu, A.-W. One-step hydrothermal synthesis of N-doped TiO2/C nanocomposites with high visible light photocatalytic activity. Nanoscale 2012, 4, 576–584. [Google Scholar] [CrossRef] [PubMed]
  38. Asahi, R.; Morikawa, T.; Ohwaki, T.; Aoki, K.; Taga, Y. Visible-Light Photocatalysis in Nitrogen-Doped Titanium Oxides. Science 2001, 293, 269–271. [Google Scholar] [CrossRef] [PubMed]
  39. Liu, Y.; Mu, K.; Zhong, J.; Chen, K.; Zhang, Y.; Yang, G.; Wang, L.; Deng, S.; Shen, F.; Zhang, X. Design of a solar-driven TiO2 nanofilm on Ti foil by self-structure modifications. RSC Adv. 2015, 5, 41437–41444. [Google Scholar] [CrossRef]
  40. Hadjiivanov, K.; Knözinger, H. Species formed after NO adsorption and NO+ O2 co-adsorption on TiO2: An FTIR spectroscopic study. Phys. Chem. Chem. Phys. 2000, 2, 2803–2806. [Google Scholar] [CrossRef]
  41. Yang, J.; Bai, H.; Tan, X.; Lian, J. IR and XPS investigation of visible-light photocatalysis-Nitrogen-carbon-doped TiO2 film. Appl. Surf. Sci. 2006, 253, 1988–1994. [Google Scholar] [CrossRef]
  42. Wang, J.; Tafen, D.N.; Lewis, J.P.; Hong, Z.; Manivannan, A.; Zhi, M.; Li, M.; Wu, N. Origin of photocatalytic activity of nitrogen-doped TiO2 nanobelts. J. Am. Chem. Soc. 2009, 131, 12290–12297. [Google Scholar] [CrossRef] [PubMed]
  43. Long, M.; Qin, Y.; Chen, C.; Guo, X.; Tan, B.; Cai, W. Origin of Visible Light Photoactivity of Reduced Graphene Oxide/TiO2 by in Situ Hydrothermal Growth of Undergrown TiO2 with Graphene Oxide. J. Phys. Chem. C 2013, 117, 16734–16741. [Google Scholar] [CrossRef]
  44. Zhuang, J.; Weng, S.; Dai, W.; Liu, P.; Liu, Q. Effects of Interface Defects on Charge Transfer and Photoinduced Properties of TiO2 Bilayer Films. J. Phys. Chem. C 2012, 116, 25354–25361. [Google Scholar] [CrossRef]
  45. Batzill, M.; Morales, E.H.; Diebold, U. Influence of nitrogen doping on the defect formation and surface properties of TiO2 rutile and anatase. Phys. Rev. Lett. 2006, 96, 026103. [Google Scholar] [CrossRef] [PubMed]
  46. Di Valentin, C.; Pacchioni, G.; Selloni, A.; Livraghi, S.; Giamello, E. Characterization of paramagnetic species in N-doped TiO2 powders by EPR spectroscopy and DFT calculations. J. Phys. Chem. B 2005, 109, 11414–11419. [Google Scholar] [CrossRef] [PubMed]
  47. Fang, D.; Luo, Z.; Huang, K.; Lagoudas, D.C. Effect of heat treatment on morphology, crystalline structure and photocatalysis properties of TiO2 nanotubes on Ti substrate and freestanding membrane. Appl. Surf. Sci. 2011, 257, 6451–6461. [Google Scholar] [CrossRef]
  48. Naldoni, A.; Allieta, M.; Santangelo, S.; Marelli, M.; Fabbri, F.; Cappelli, S.; Bianchi, C.L.; Psaro, R.; Dal Santo, V. Effect of Nature and Location of Defects on Bandgap Narrowing in Black TiO2 Nanoparticles. J. Am. Chem. Soc. 2012, 134, 7600–7603. [Google Scholar] [CrossRef] [PubMed]
  49. Chen, X.; Liu, L.; Yu, P.Y.; Mao, S.S. Increasing Solar Absorption for Photocatalysis with Black Hydrogenated Titanium Dioxide Nanocrystals. Science 2011, 331, 746–750. [Google Scholar] [CrossRef] [PubMed]
  50. Xia, T.; Li, N.; Zhang, Y.; Kruger, M.B.; Murowchick, J.; Selloni, A.; Chen, X. Directional Heat Dissipation across the Interface in Anatase-Rutile Nanocomposites. ACS Appl. Mater. Interfaces 2013, 5, 9883–9890. [Google Scholar] [CrossRef] [PubMed]
  51. Zhang, Z.; Zhang, L.; Hedhili, M.N.; Zhang, H.; Wang, P. Plasmonic Gold Nanocrystals Coupled with Photonic Crystal Seamlessly on TiO2 Nanotube Photoelectrodes for Efficient Visible Light Photoelectrochemical Water Splitting. Nano Lett. 2013, 13, 14–20. [Google Scholar] [CrossRef] [PubMed]
  52. Zhang, Z.; Wang, P. Optimization of photoelectrochemical water splitting performance on hierarchical TiO2 nanotube arrays. Energy Environ. Sci. 2012, 5, 6506–6512. [Google Scholar] [CrossRef]
  53. Xiao, F.-X.; Hung, S.-F.; Miao, J.; Wang, H.-Y.; Yang, H.; Liu, B. Metal-Cluster-Decorated TiO2 Nanotube Arrays: A Composite Heterostructure toward Versatile Photocatalytic and Photoelectrochemical Applications. Small 2015, 11, 554–567. [Google Scholar] [CrossRef] [PubMed]
  54. Sun, Y.; Yan, K.; Wang, G.; Guo, W.; Ma, T. Effect of Annealing Temperature on the Hydrogen Production of TiO2 Nanotube Arrays in a Two-Compartment Photoelectrochemical Cell. J. Phys. Chem. C 2011, 115, 12844–12849. [Google Scholar] [CrossRef]
  55. Ryu, J.; Choi, W. Substrate-Specific Photocatalytic Activities of TiO2 and Multiactivity Test for Water Treatment Application. Environ. Sci. Technol. 2008, 42, 294–300. [Google Scholar] [CrossRef] [PubMed]
  56. Mills, A.; Mcfarlane, M. Current and possible future methods of assessing the activities of photocatalyst films. Catal. Today 2007, 129, 22–28. [Google Scholar] [CrossRef]
  57. Mills, A.; Hill, C.; Robertson, P.K.J. Overview of the current ISO tests for photocatalytic materials. J. Photochem. Photobiol. A Chem. 2012, 237, 7–23. [Google Scholar] [CrossRef]
Figure 1. (A) Field-emission scanning electron microscopy (FE-SEM) image of the pine-cone TiO2 (PCT) film anodized in the electrolyte of graphene (5.0 mg) and magnesium nitrate solution (100.0 mg L−1, 50.0 mL) at 60 V for 2 min, (B) enlarged scale of the PCT nanoclusters, (C) enlarged scale of the marked region in B. (D) enlarged scale of the marked region in B.
Catalysts 07 00229 g001aCatalysts 07 00229 g001b
Figure 2. Growth process of PCT film on Ti foil prepared at 60 V for different times. FE-SEM images of film anodized for (A) 1 min, (B) 1.5 min, (C) 2 min, (D) 3 min.
Catalysts 07 00229 g002aCatalysts 07 00229 g002b
Figure 3. Schematic illustration of the formation mechanism of the PCT film: (A) formation of the anodic oxide layer and pore growth; (B) formation of the cracks and TiO2-graphene layers; (C) deposition of the TiO2-graphene layers on the cracks; (D) removal of the graphene and formation of the pine-cone structure.
Catalysts 07 00229 g003aCatalysts 07 00229 g003b
Figure 4. (A) Electron spin resonance (ESR) spectra of the PCT film and typical TiO2 nanotube arrays (TNTs) in air at 77 K. (B) Valence band edge spectra of the PCT film and TNTs. (C) Ultraviolet-visible-near-infrared (UV-vis-NIR) absorption spectra of the PCT film and TNTs. (D) Bandgap evaluation from the plots of (αhv)2 vs. the energy (h) of the absorbed light.
Catalysts 07 00229 g004aCatalysts 07 00229 g004b
Figure 5. Photoelectrochemical activities of the PCT film and TNTs: (A) Transient photocurrent responses; (B) Linear sweep voltammograms in a potential range of −0.9 to 0.7 V vs. Ag/AgCl; (C) Calculated photoconversion efficiencies under natural sunlight.
Catalysts 07 00229 g005aCatalysts 07 00229 g005b
Figure 6. (A) Cycling measurements of hydrogen gas generation through photoelectrocatalytic water splitting with the PCT film under natural sunlight. Experiments were conducted over a 10-day period, with 20 h of overall irradiation time. (B) Comparison of the solar-driven photoelectrocatalytic activity of PCT film in sunny day and cloudy day. (C) Degradation rates of methyl orange (MO) solution with PCT film in three different processes. Photolysis means the MO degradation under light in the absence of PCT film, adsorption means the MO degradation in the darkness with PCT film, and photoelectrocatalytic is the MO degradation under light and bias with PCT film. (D) Picture of the large-size PCT film (300 mm × 360 mm) compared with the laptop.
Catalysts 07 00229 g006
Figure 7. A schematic diagram of the treatment process for printing and dyeing wastewater.
Catalysts 07 00229 g007
Table 1. Degradation of MO solution under three different light sources with a large-scale PCT film.
Light SourcesIrradiation Time (min)Degradation Rate (%)
UV2094
sunlight12085
fluorescent lamp18016
Table 2. Chemical oxygen demand (COD) and total organic carbon (TOC) removal rates after photoelectrocatalytic degradation.
Initial Concentration (mg L−1)Final Concentration (mg L−1)Removal Rate (%)
COD262025390
TOC103028072.8

