DBD Plasma Assisted CO2 Decomposition: Influence of Diluent Gases

Department of Chemistry, Indian Institute of Technology Hyderabad, Kandi 502285, Telangana, India
*
Author to whom correspondence should be addressed.
Catalysts 2017, 7(9), 244; https://doi.org/10.3390/catal7090244
Submission received: 25 June 2017
/
Revised: 29 July 2017
/
Accepted: 9 August 2017
/
Published: 23 August 2017
(This article belongs to the Special Issue C1 Chemistry—C1-Platform Chemicals as Cornerstone for a Sustainable Energy)
Abstract
:Carbon dioxide (CO2) partial reduction to carbon monoxide (CO) and oxygen has been conducted in a dielectric barrier discharge reactor (DBD) operating a packed bed configuration and the results are compared with that of no packing condition. The effect of diluent gas is studied to understand the influence on dielectric strength of the plasma gas on CO2 splitting, with the objective of obtaining the best CO selectivity and high energy efficiency. Typical results indicated that among N2, He and Ar gases, Ar showed the best decomposition efficiency. Glass beads packing has a strong influence on the performance, probably due to the enhanced field strength due to dielectric nature of the packed material. In a similar manner, Ar mole ratio in the gas mixture also played a significant role, where the maximum CO2 conversion of 19.5% was obtained with packed DBD at CO2:Ar ratio 1:2. The best CO yield (16.8%) was also obtained under the same conditions. The highest energy efficiency was found to be 0.945 mmol/kJ. The activated species formed inside the CO2 plasma were identified by optical emission spectroscopy.
1. Introduction
The continuous rise of carbon dioxide (CO2) in the atmosphere has a negative impact on the environment, as it significantly contributes to global warming. Short-term processes such as CO2 sequestration, carbon storage and capture cannot offer a permanent solution [1,2]. Efforts have been done to develop cost-effective and energy-efficient technologies to reduce CO2. In this context, CO2 conversion into value-added products like CO is of great importance, as CO is one of the major feedstocks for various chemical processes. Several technologies such as electrochemical, thermochemical and photochemical processes have been investigated for this reaction [3]. However, these processes are limited either due to high input cost or poor selectivity to CO. In this context, non-thermal plasma (NTP) activation of CO2 seems to be an interesting approach. NTP is characterized by the presence of high energetic electrons that are capable of promoting chemical reactions under ambient conditions. NTP has reported applications in water treatment [4,5], surface treatment [6], VOC removal [7] reforming reactions [8,9], etc. Among the various NTP configurations, dielectric barrier discharge (DBD) has attracted considerable attention due to the ability to produce high energetic electrons (1–10 eV), uniform distribution of microdischarges, capable of initiating the chemical reactions under ambient conditions, etc. [10,11,12,13,14,15,16].
Recently Mei et al. reported the conversion of CO2 in a NTP reactor, where the diameter and shape of the inner electrode and the type of outer electrode influenced the efficiency of the process [17]. The effect of the gas flow rate, discharge power, discharge length and photocatalytic effect towards CO2 conversion and energy efficiency also have been reported by Mei et al. [18,19]. Zeng et al. studied the effect of Ni/Al2O3 on CO2 hydrogenation with Ar as a diluent gas [20]. They reported almost 56.1% CO2 conversion in 60% Ar mixture. Ramakers et al. studied CO2 decomposition with diluent gases He and Ar. They showed that at up to 70% diluent gas mixture, He and Ar both have same effect but at higher gas percentage, Ar was more effective than He [21]. Wang et al. investigated N2 and Ar dilution on CO2 decomposition with 5A molecular sieve packing material and it was reported that N2 dilution shows better results than Ar, up to 50% diluent gas mixture [22]. Yap et al. reported almost 13.5% conversion at CO2/He is 1/1 [23]. In a similar manner, Debjyoti et al. reported that packing material also influences the conversion of CO2 [24]. As there is no systematic study to explain the influence of diluent gas and influence of packed bed configuration, this study was aimed at understanding the effect of diluent gases (N2, Ar, He) on CO2 decomposition in packed bed configuration. This study also involves understanding the influence of glass beads packing on CO2 conversion.
2. Results and Discussion
2.1. Discharge Characterization
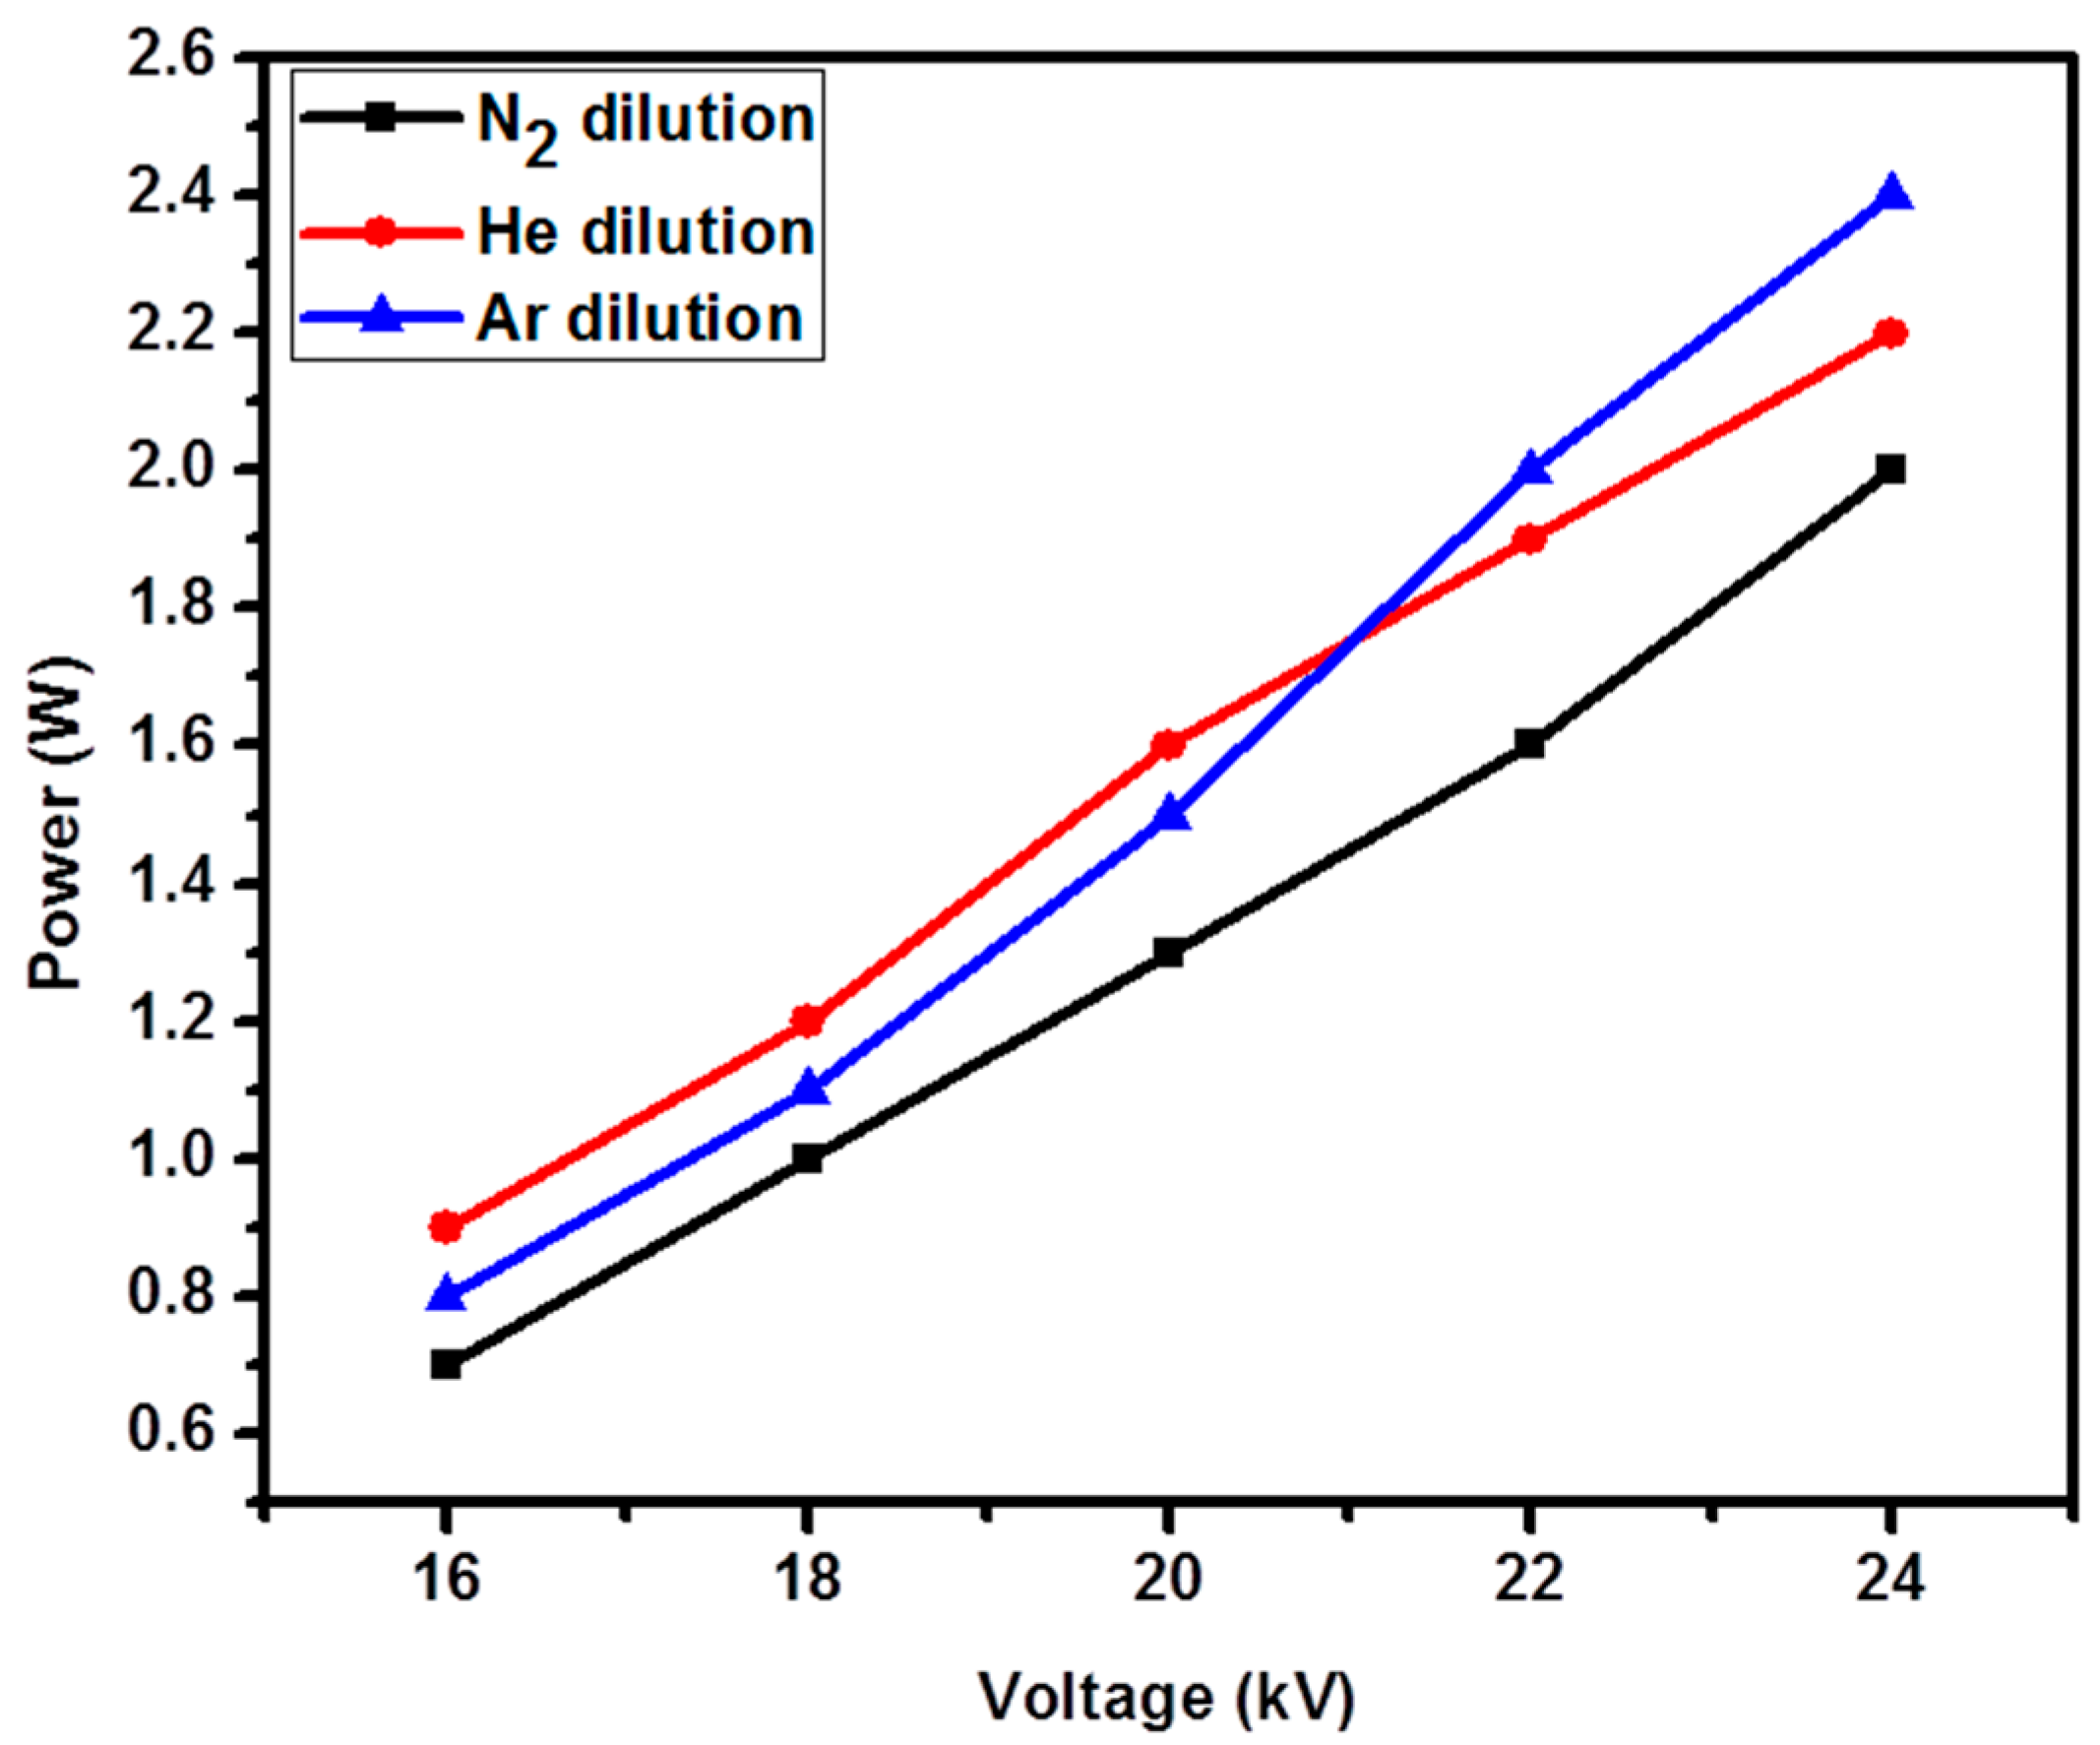
Figure 1 represents the power dissipated in the discharge on varying the applied voltage for various plasma gases. Figure 1 indicates that N2 dilution has the lowest discharge power at low voltages, while Ar dilution shows the highest power at high voltages. This difference is due to the higher dielectric strength of nitrogen than argon [25], because of which the breakdown voltage is higher for nitrogen than for argon gas.
Figure 2 represents Lissajous figures for diluent gases at 24 kV with glass beads-packed DBD system. The shape of figures changes with the changing of diluent gas, which is due to the change in dielectric strength of the gas mixture. The charge transferred per half cycle [26] is given in Table 1, which confirms that N2 needs higher voltage for the breakdown than He and Ar gases and the charge transferred per half cycle is less for N2 dilution. Ar dilution shows the highest charge transferred per half cycle, because of which the break down voltage of Ar+CO2 mixture is the lowest. As a result, at any fixed voltage, higher conversion of CO2 may be expected for Ar when compared to N2 and He gases.
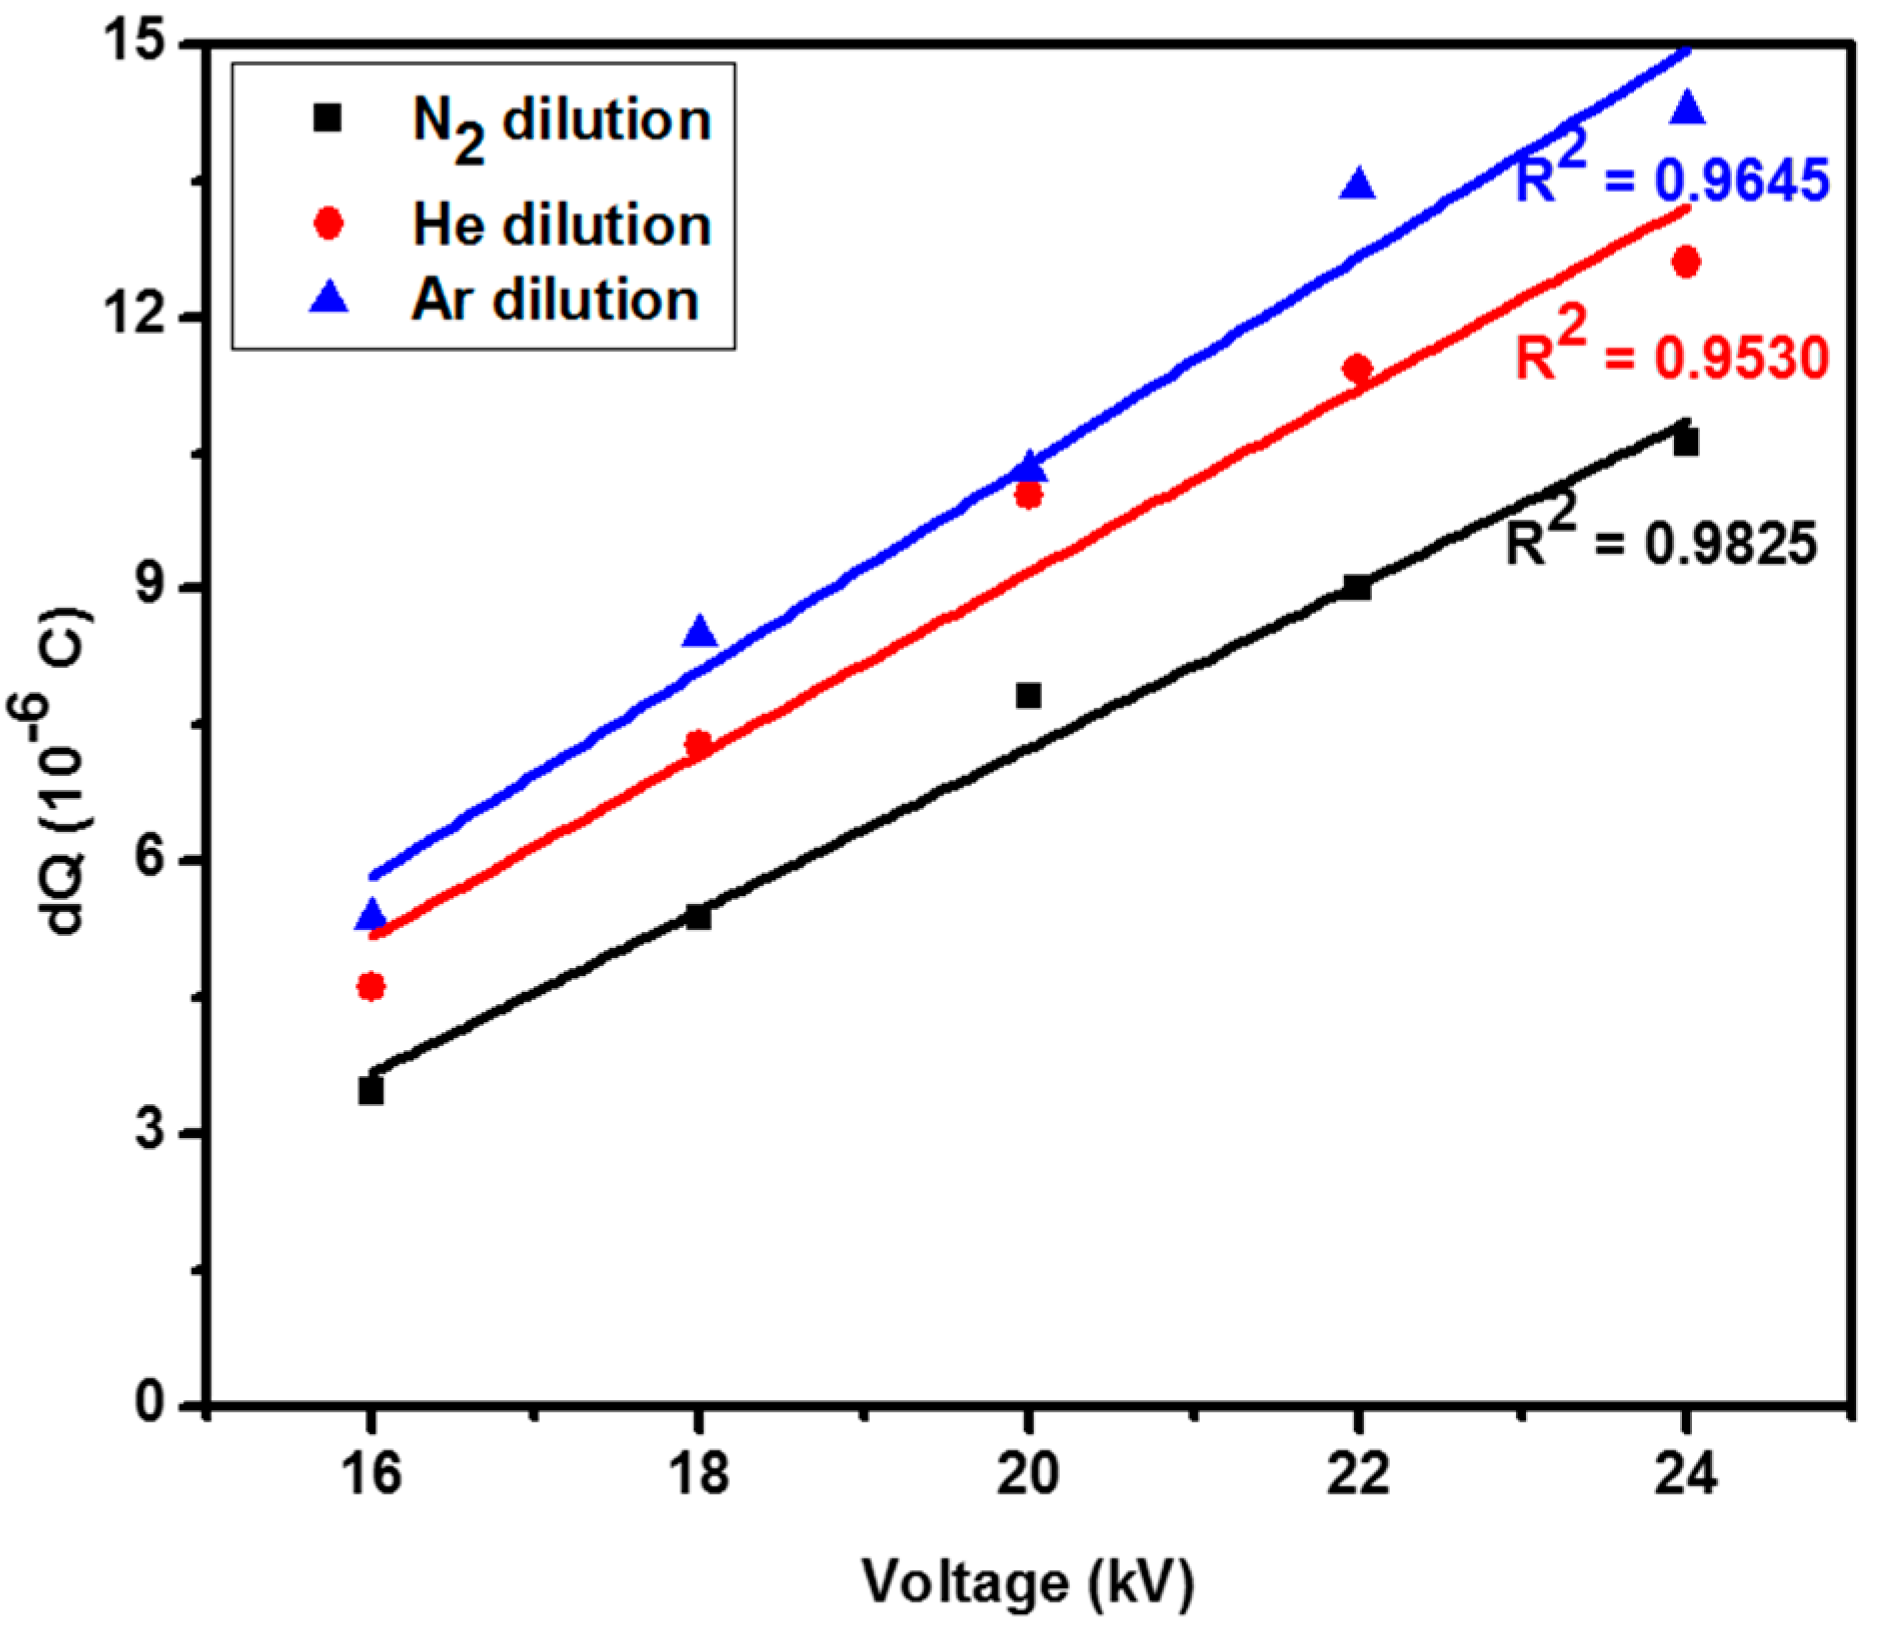
It is well known that the electric field strength varies with the dielectric packing and, because of that, high charge will be transferred to the microdischarges [27]. Figure 3 shows the charge transferred to the microdischarges per half cycle on increasing the voltage. The DBD system with Ar diluent gas showed the highest charge transferred at every applied voltage, where the charge increased from 3.46 μC to 10.61 μC, with increase from 16 kV to 24 kV, respectively for N2 dilution, whereas under the same conditions, He dilution resulted the charge transfer in an increase from 4.61 μC to 12.61 μC and for Ar dilution, it was highest at 5.37 μC to 14.28 μC.
2.2. Effect of CO2:Ar Mole Ratio on CO2 Decomposition
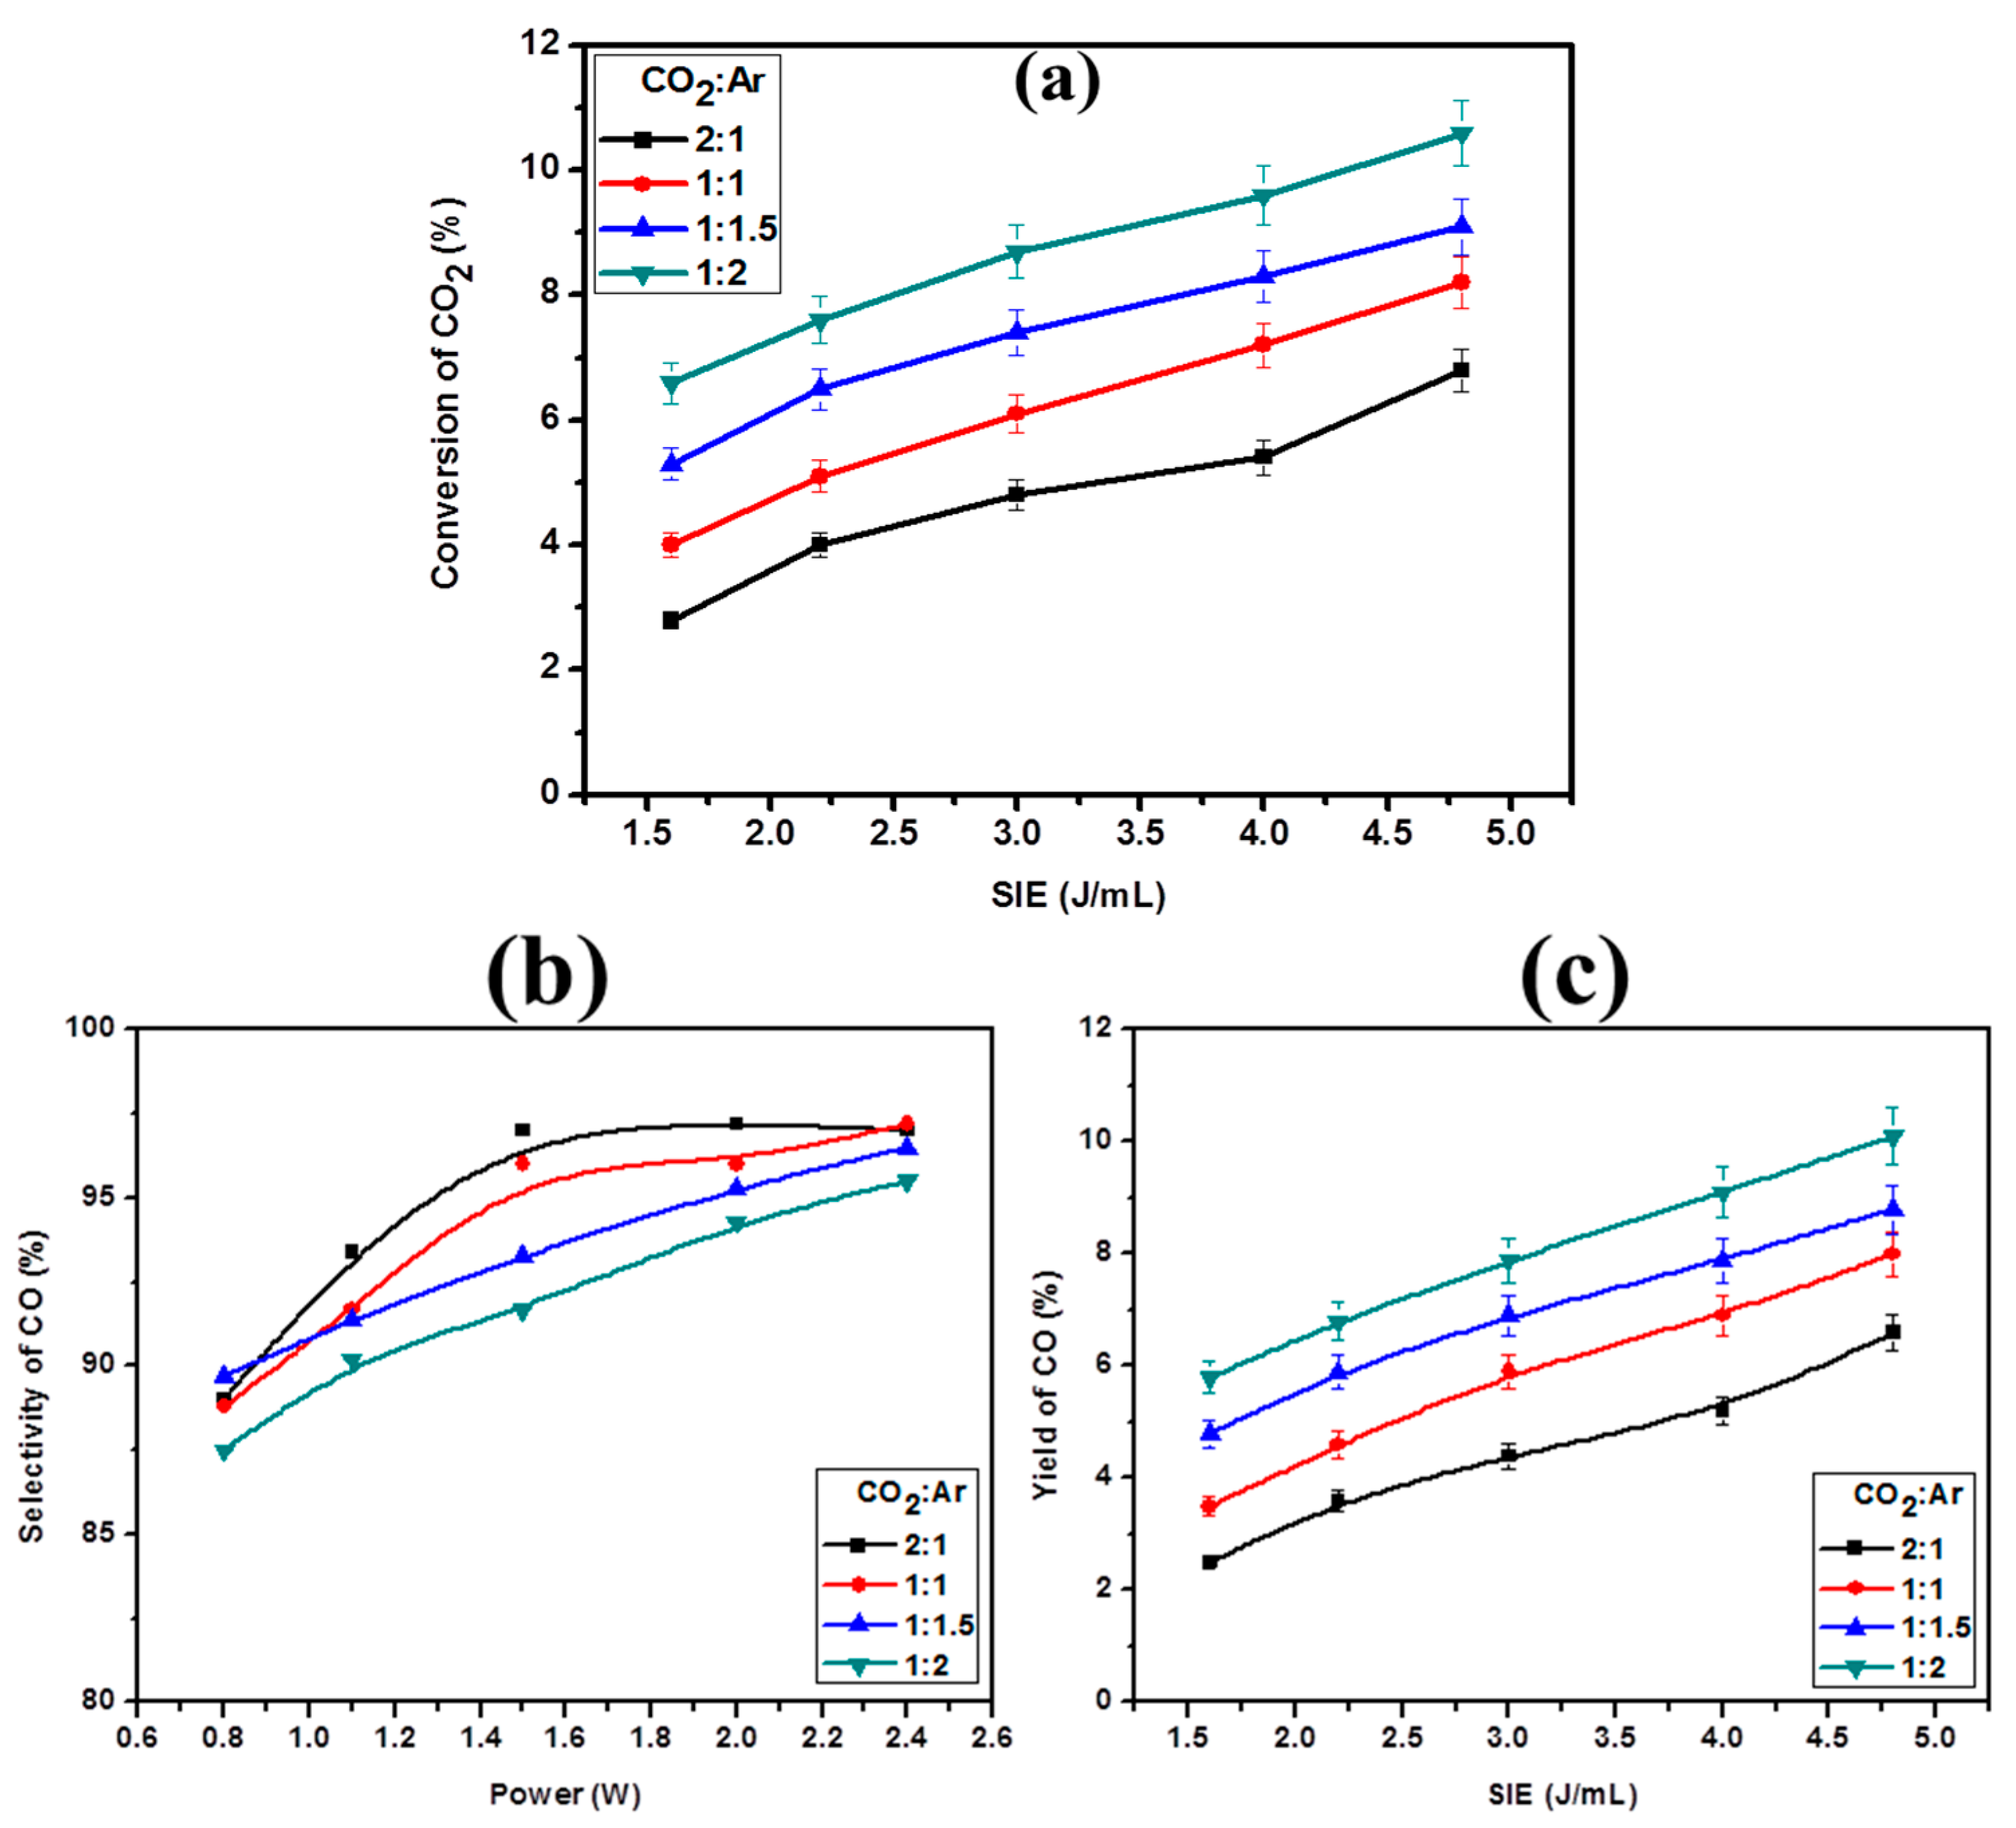
As the previous studies confirm that Ar dilution is beneficial over N2 and He dilution, further studies are carried out by varying the mole ratio of Ar and CO2 in the gas mixture. Figure 4a confirms the effect of Ar dilution on CO2 conversion for DBD reactor without packing. As seen in Figure 4a, the CO2 conversion increases with the increase of specific input energy (SIE) at any CO2:Ar ratio. The maximum CO2 conversion observed was 10.6% for CO2:Ar ratio 1:2 at the SIE 4.8 J/mL. CO2 conversion increases with the increasing Ar mole ratio, which is due to the decreasing dielectric strength of the gas mixture, due to which more energy is available in the discharge for CO2 molecules. In addition, due to the lower number of CO2 molecules than Ar atoms, the available electrons may excite CO2. The possible reactions that favor CO2 conversion are shown in Equations (1)–(3) [28].
The CO selectivity with respect to the discharge power is shown in Figure 4b, which confirms the increasing selectivity with increasing the discharge power and maximum selectivity achieved ~98% with CO2:Ar ratio 2:1, indicating ~100% carbon balance. The competing Boudouard reaction may take place at 1:2 argon ratio due to higher CO2 conversion. Figure 4c represents the product yield vs. SIE at different CO2:Ar mole ratio. The CO yield increases with the increase of Ar in the mixture and the maximum yield was ~10% at SIE 4.8 J/mL.
2.3. Effect of Glass Beads on CO2 Decomposition
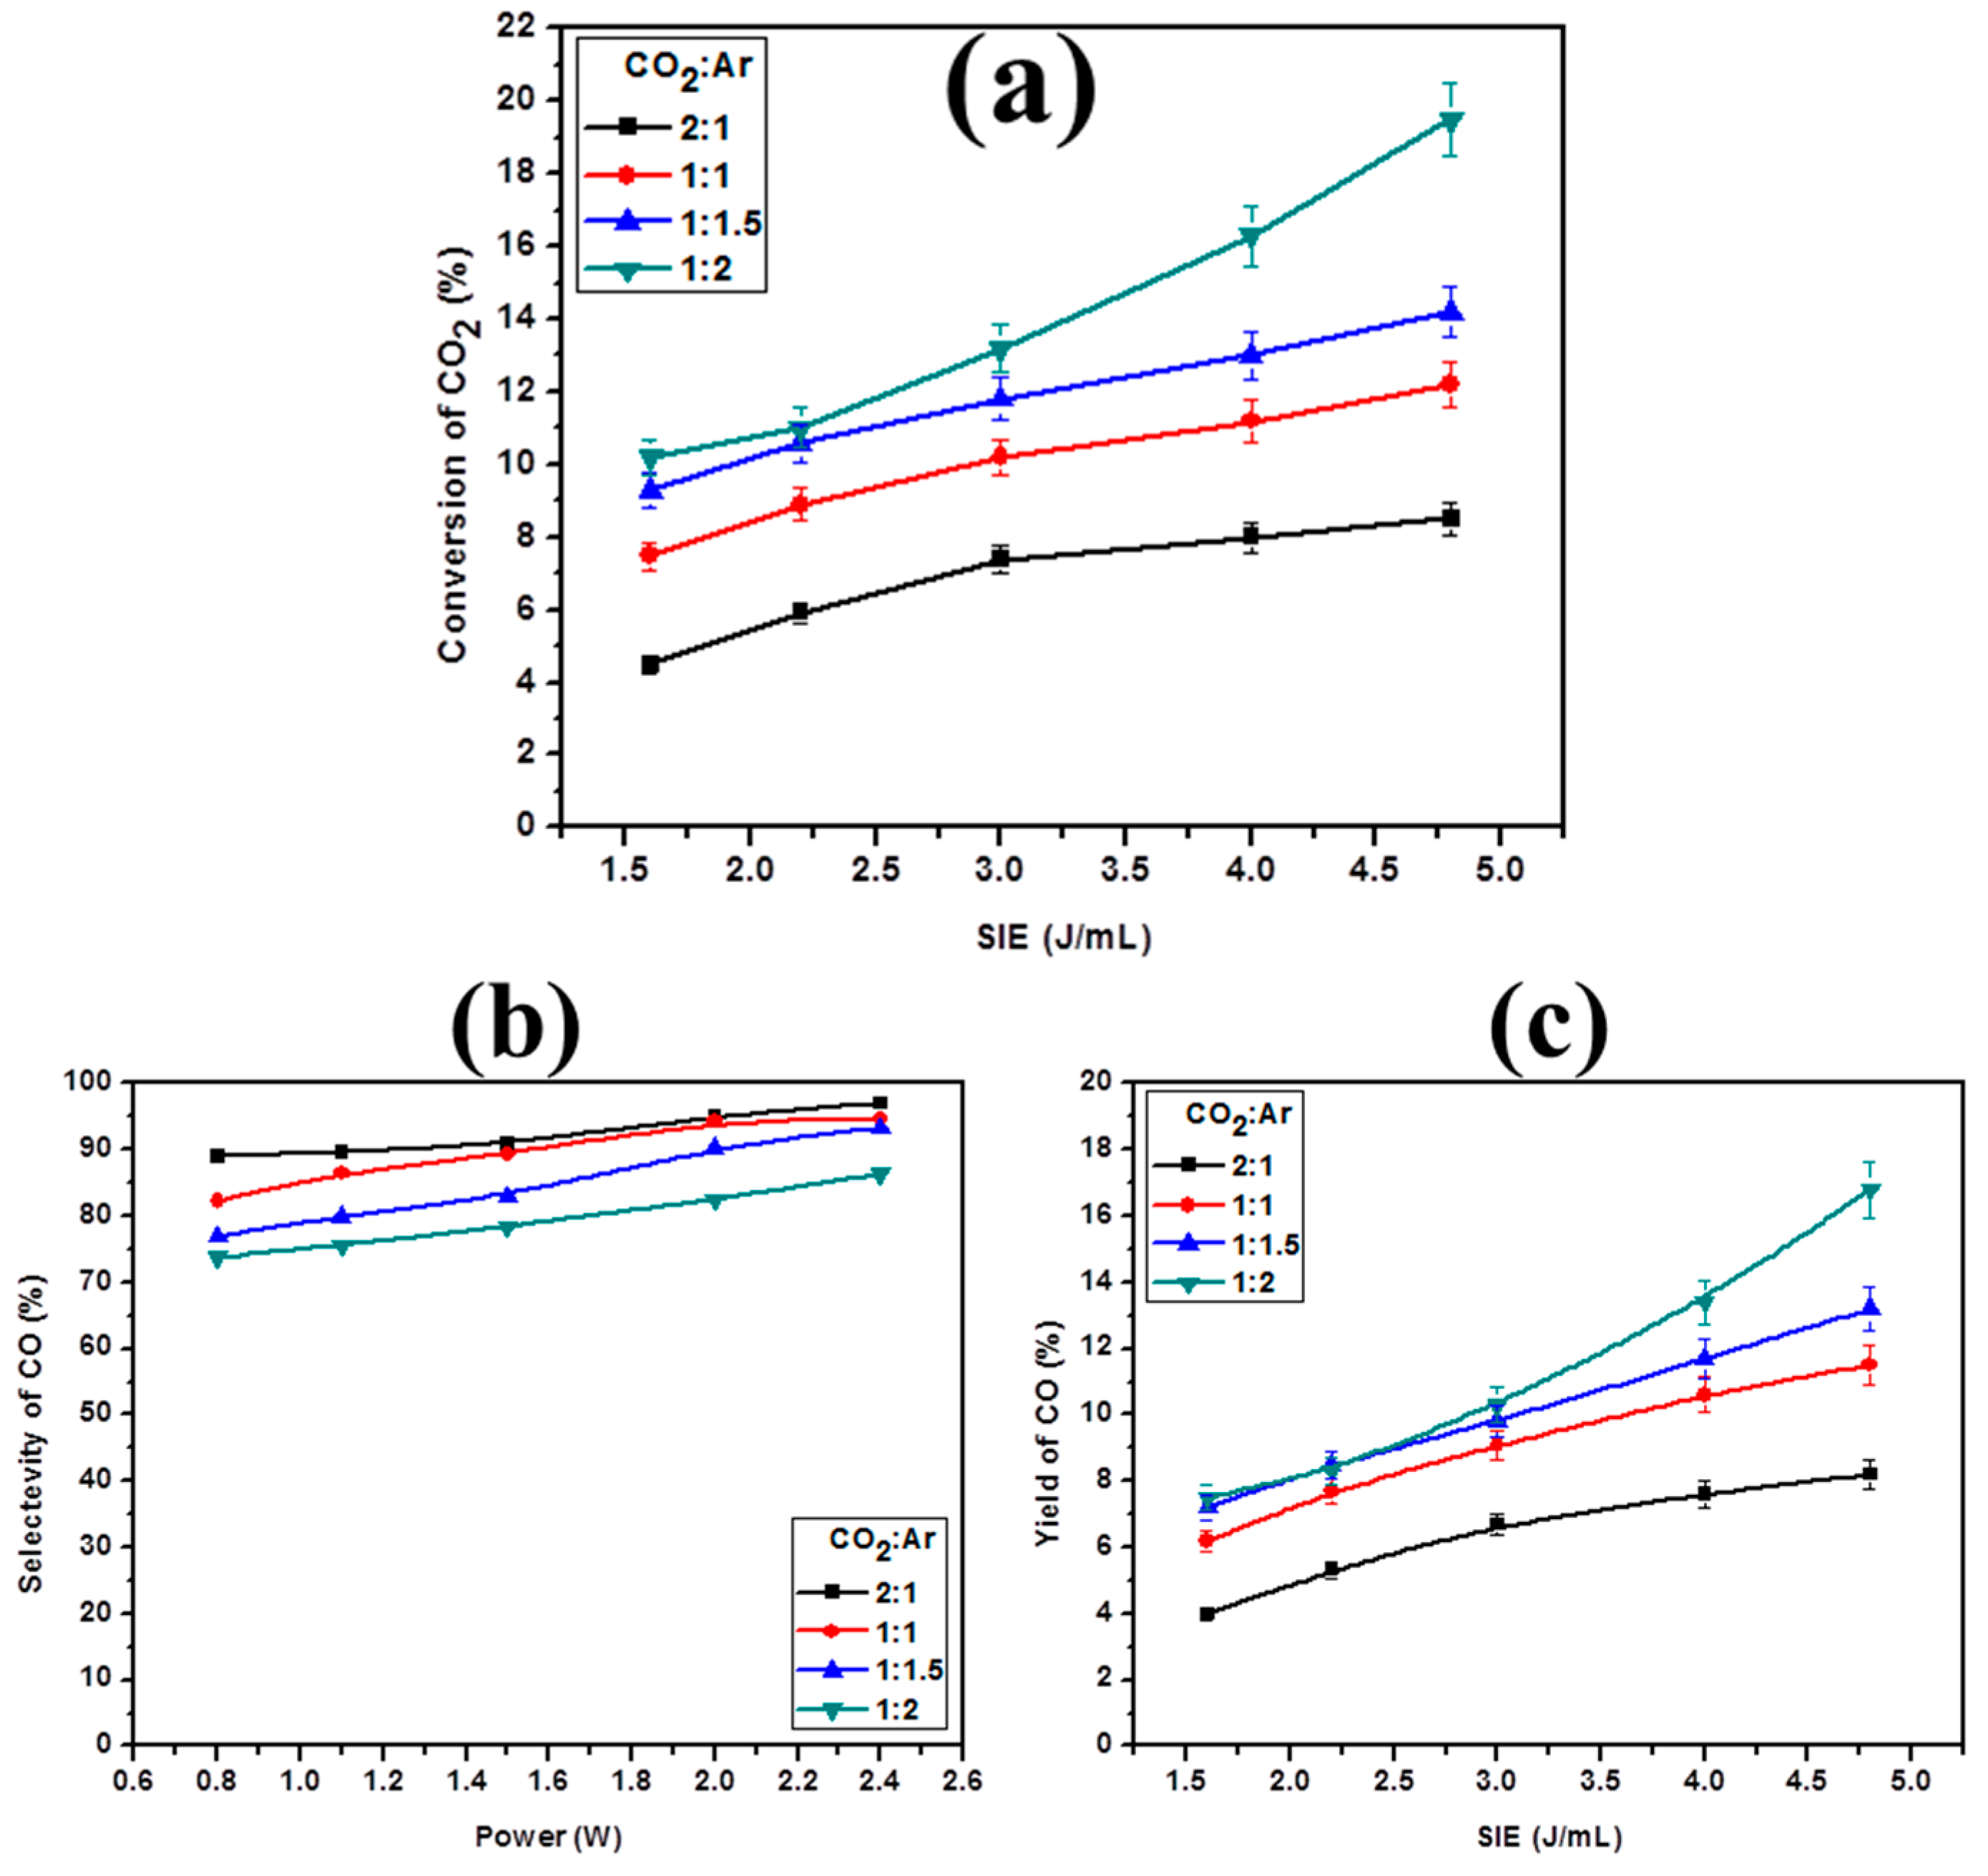
Figure 5a represents the CO2 conversion with the change of SIE for glass beads-packed DBD for CO2:Ar mole ratio varied from 2:1 to 1:2. Figure 5a confirms that CO2 conversion increases with the increasing SIE as well as Ar percentage. Due to the dielectric effect of glass beads, more energetic electrons will be formed in the discharge, due to which higher conversion is achieved. Generally dielectric material acts as a bridge between two electrodes and facilitates the transfer of charge between two electrodes. As seen from Figure 5b, discharge power has almost no influence on the selectivity to CO. The highest selectivity was observed at CO2:Ar ratio 2:1, which may be due to the low CO2 conversion to CO, which may not favor Boudouard reaction. This is also consistent with the lowest CO selectivity at CO2:Ar ratio 1:2. Figure 5c shows the CO yield with respect to SIE, which confirms that the glass beads-packed DBD show the best CO yield of 16.8% at CO2:Ar mole ratio 1:2.
2.4. Effect of Diluent Gases with Packed Bed DBD
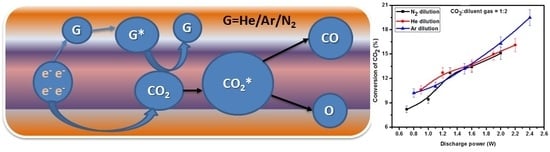
The effect of diluent gases has been shown in Figure 6. Figure 6a indicates that the CO2 conversion increases with the increasing discharge power for all diluent gases. The maximum conversion has been observed with Ar dilution, especially at higher discharge power. A similar observation was reported by Ramakers et al. [21]. During the present study, ~19.5% CO2 conversion was observed with Ar dilution. The diluent gas effect follows the order Ar > He > N2. One of the plausible reasons for this observation may be due to facile energy transfer from metastable species to CO2 molecules (Equations (4)–(9)).
The following electron impact dissociation may be responsible for the CO2 decomposition reaction.
Similarly for Ar dilution, the following reactions may be involved [28].
where, Arg, Ari and Arj represent the ground, excited or metastable state of Ar atom respectively.
Figure 6b represents the selectivity of CO with respect to SIE, which shows He dilution is better than other gases. There is almost zero carbon loss with He dilution. Although Ar and N2 showed 80–90% selectivity towards CO, He gave the best result. Figure 6c shows the CO yield with respect to discharge power, which increases with the increasing power. Helium dilution shows the highest CO yield (16.8%) at any power, which may be due to high thermal conductivity of He, which facilitates the transfer of energy to CO2 molecules.
2.5. Effect of Diluent Gases on the Reaction Rate
The rate constant of CO2 decomposition has been calculated through the following equation [24].
where, Cin and Cout represent CO2 input and CO2 output concentration respectively. K is decomposition rate constant and C is the intercept. Figure 7 shows the plot of ln(Cin/Cout) Vs SIE for various gases and the decomposition rate constants are 0.02802, 0.02408 and 0.03452, respectively for N2, He and Ar, which indicates that Ar dilution provides the best CO2 decomposition condition. The rate constant for He and N2 diluent system is almost the same.
2.6. Energy Efficiency
Figure 8 shows the energy efficiency with respect to discharge power for CO2 decomposition for the diluent gases with glass beads-packed reactor. The energy efficiency was calculated for the best conditions (CO2:diluent gas = 1:2). It was reported that the energy efficiency of DBD plasma is lesser than gliding arc and microwave plasma system [29]. The curve indicates decreasing energy efficiency with increasing discharge power, which is in agreement with earlier observations [24,27]. The maximum energy efficiency of 0.945 mmol/kJ was found at the applied power 0.8 W with Ar dilution and the order of energy efficiency is Ar > He > N2.
2.7. Optical Emission Spectra (OES)
Bogaerts et al. reported that vibrational excitation contributes to nearly 6% towards CO2 dissociation [30]. CO2 splitting may be initiated by the electron impact excitation from lowest vibrational level to highest vibrational level followed by vibrational-vibrational collision [29,30]. The optical emission during reaction with glass beads-packed condition was recorded to understand the excited species formed inside the plasma (Figure 9). Under all conditions, nearly the same peaks were observed. The activated species like CO, CO2+, and OH have been clearly identified and the peak assignment is shown in Figure 9. The CH and OH bands observed are due to the traces of moisture impurity present in CO2 cylinder. The peak observed around 483 nm is due to CO+ [24]. The significance peak for CO was found around 519.8 nm [31]. According to Kraus et al., the peak observed at 297 is due to the third positive system of CO [32]. The peak at 290 nm due to CO2+ [33] is missing in our study.
3. Experimental Set-Up
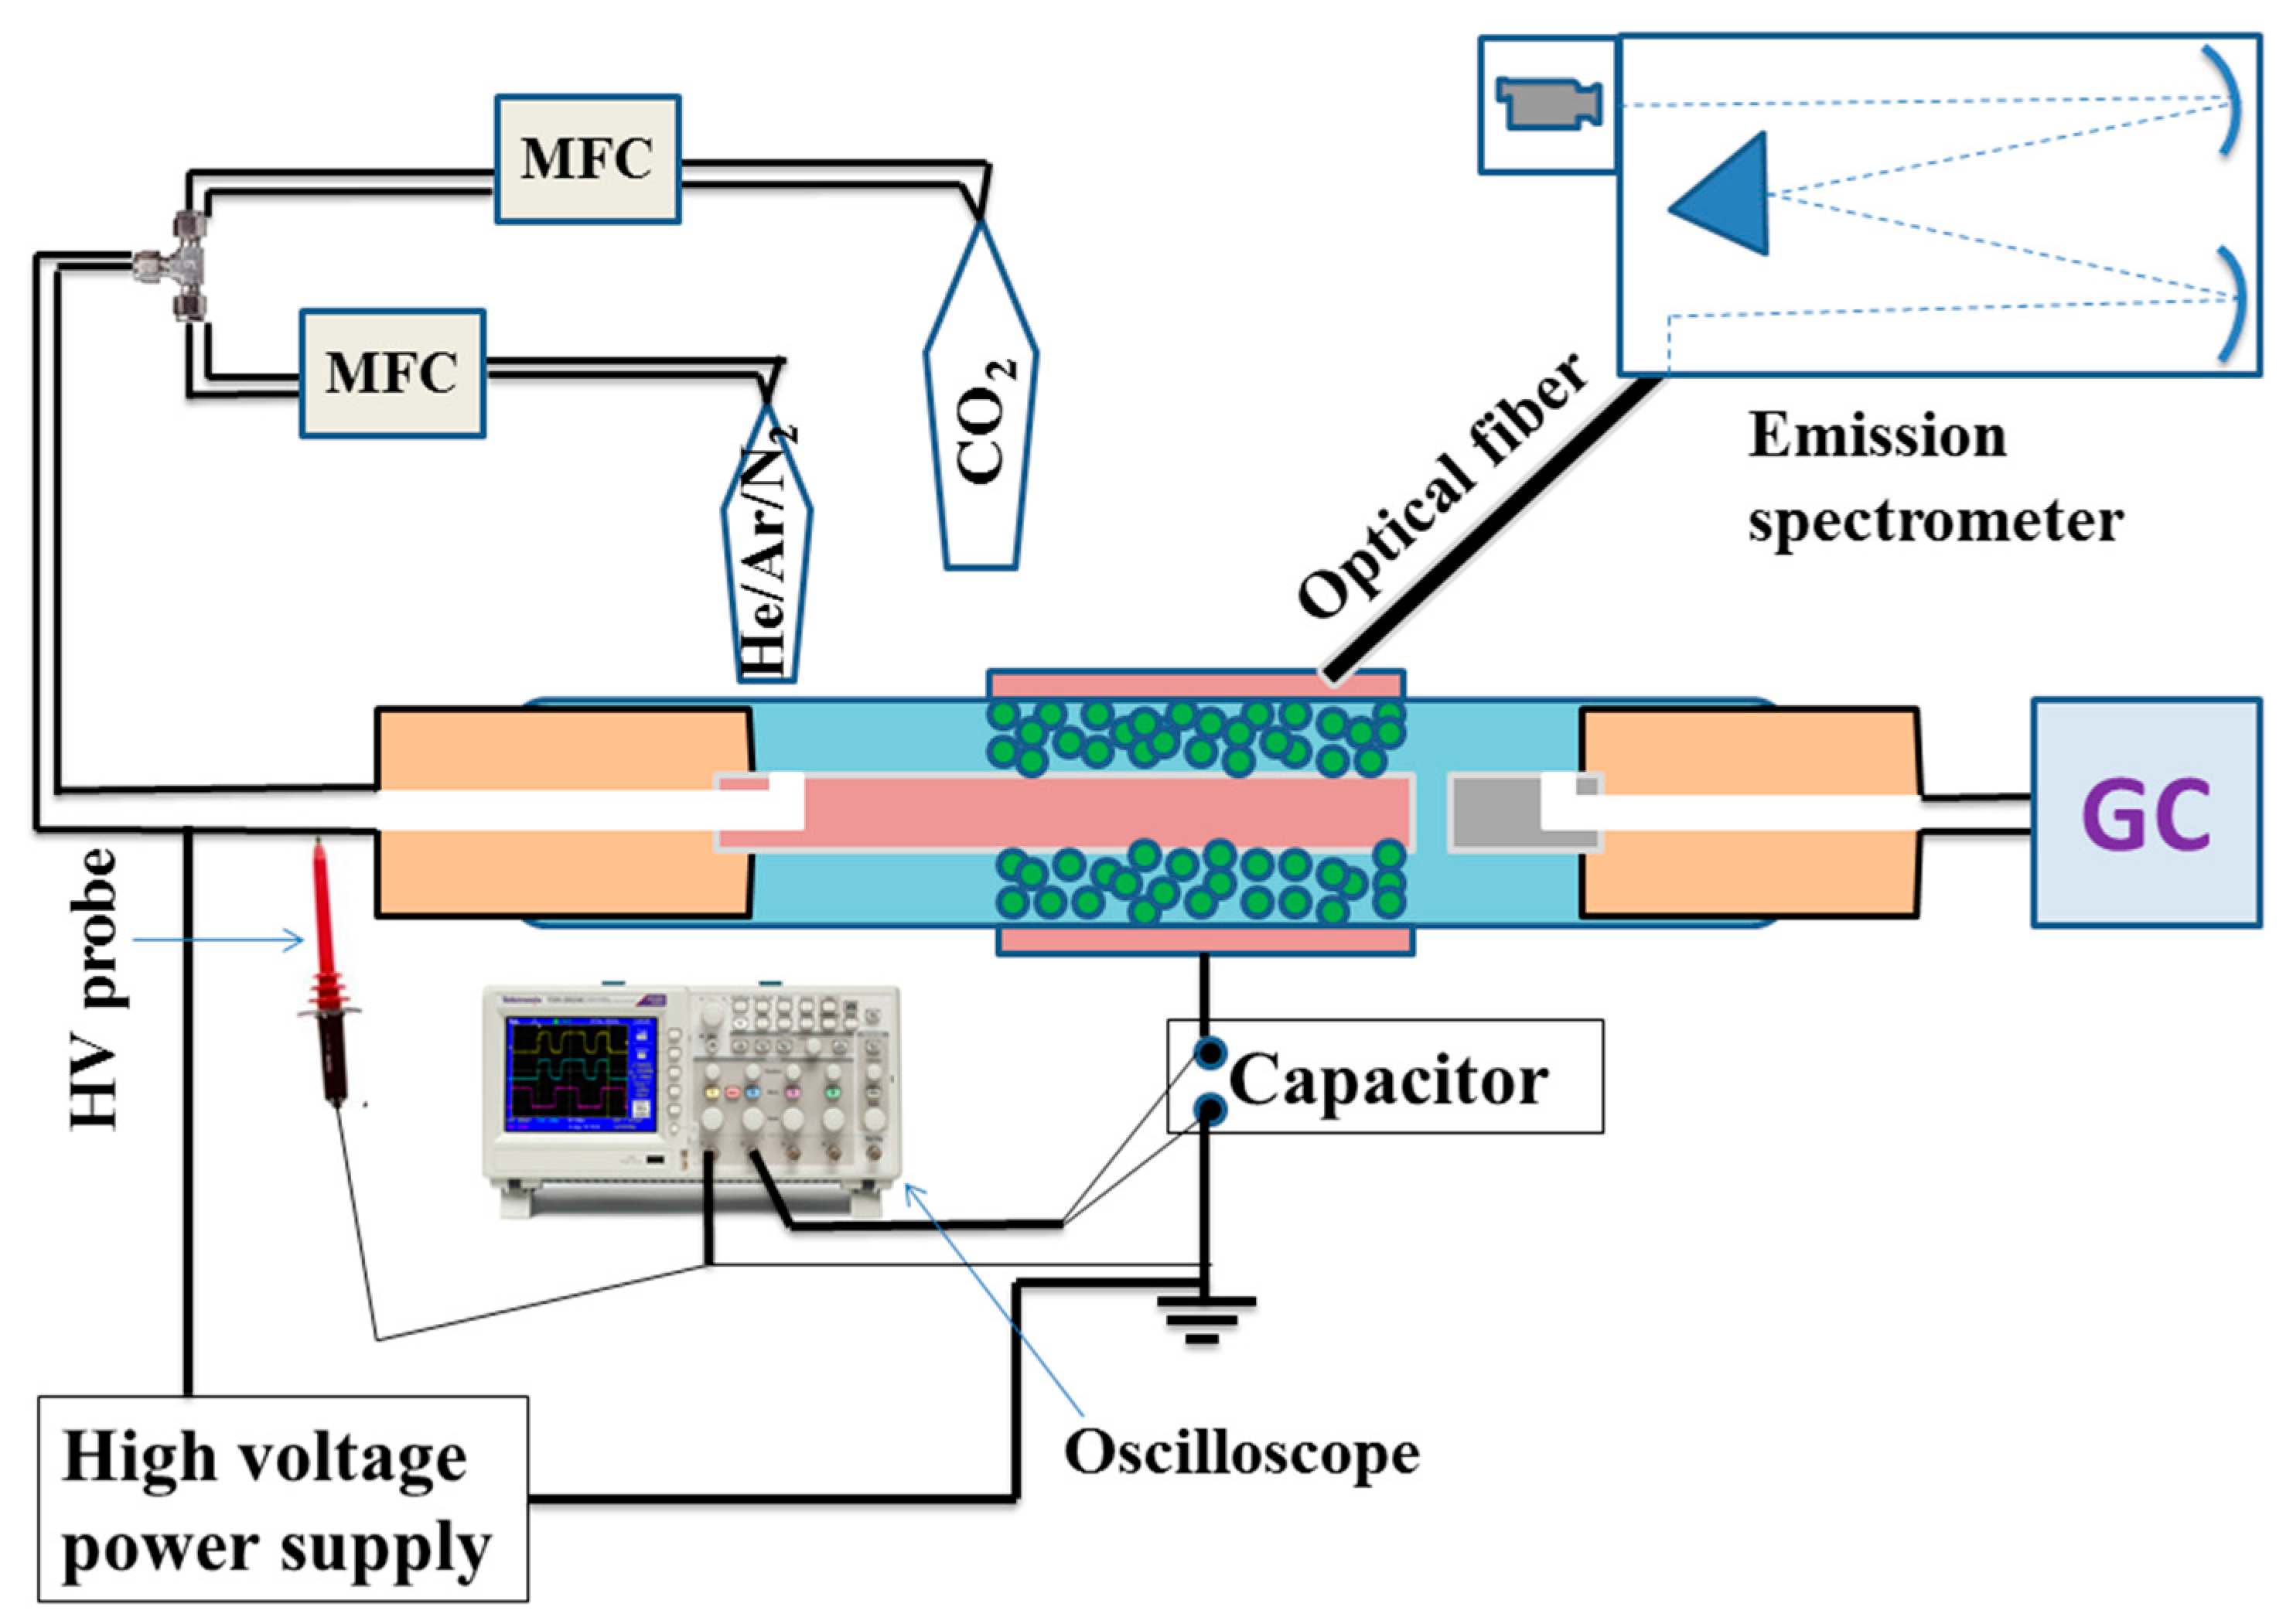
The schematic of the experimental setup used for the study is shown in Figure 10. Briefly, plasma was generated in a co-axial cylindrical quartz tube, which has ~23 and 20 mm outer and inner diameter, respectively. Similarly, a stainless steel mesh wrapped around the quartz and a stainless steel rod (10 mm diameter) placed at the center of the quartz tube acts as the outer electrode and inner electrode, respectively. The discharge gap was 5 mm and the resulting discharge volume was ~21.2 mL. The AC high voltage was applied to the stainless steel inner electrode, whereas the outer electrode was grounded via a capacitor (300 nF). A high-voltage probe connected to the inner electrode was used to record the applied high voltage (V). The flow rate of gas mixture was regulated by using mass flow controllers (MFCs) and the total flow rate was kept constant at 30 mL/min. The mixture of gases (CO2 with diluent gas, i.e., Argon, Helium or Nitrogen) was supplied to the plasma reactor and discharge plasma was generated by applying AC high voltage (16 kV to 24 kV, 50 Hz) between the electrodes. A digital oscilloscope (Tektronix TDS 2014B) was used to monitor the charge-voltage (Q-V) signals, which are plotted to obtain a Lissajous figure. The area of the Lissajous figure multiplied by frequency estimates the power dissipated in the discharge [24]. The progress of the reaction was monitored by using a Thermo Fischer Scientific-Trace 1030 gas chromatograph (GC) equipped with a Porapak Q column and TCD detector. The emission spectrum was recorded to understand the active species formed in the discharge. For this purpose, Princeton Instrument Action SpectraPro® SP-2300 emission spectrometer with three different gratings (1200 g mm−1 with 500 nm Blaze, 600 g mm−1 with 750 nm Blaze and 600 g mm−1 with 500 nm Blaze) was used [24].
The CO2 conversion, CO selectivity, CO yield, energy efficiency and specific energy input have been calculated through the following equations.
4. Conclusions
The present study highlights the diluent gas effect on CO2 decomposition in a DBD-packed bed reactor. The best diluent gas is Ar, which shows almost 19.5% CO2 decomposition towards CO with glass beads-packed DBD at discharge power 2.4 W. This study also presents the best diluent ratio for effective CO2 decomposition i.e., CO2:Ar = 1:2. The best conditions indicated near zero carbon loss. The experimental results are explained on the basis of dielectric behavior of gas mixture. CO2 conversion increased with the packing of glass beads due to its dielectric behavior.
Acknowledgments
Authors would like to thank MNRE, New Delhi, India for financial support (project No. CHY/2014-15/019/MNRE/CHS/0140). Debjyoti thanks UGC, India for providing SRF.
Author Contributions
Debjyoti Ray and Subrahmanyam Ch. conceived and designed the experiments; Debjyoti ray and Rajdeep saha performed the experiments; Debjyoti Ray and Subrahmanyam Ch. analyzed the data and wrote the paper.
Conflicts of Interest
The authors declare no conflict of interest.
References
- Zeng, Y.; Tu, X. Plasma-Catalytic CO2 Hydrogenation at Low Temperatures. IEEE Trans. Plasma Sci. 2016, 44, 405–411. [Google Scholar] [CrossRef]
- Mahammadunnisa, S.; Reddy, E.L.; Ray, D.; Subrahmanyam, C.; Whitehead, J.C. CO2 reduction to syngas and carbon nanofibres by plasma-assisted in situ decomposition of water. Int. J. Greenh. Gas Control 2013, 16, 361–363. [Google Scholar] [CrossRef] [Green Version]
- Snoeckx, R.; Heijkers, S.; Wesenbeeck, K.V.; Lenaerts, S.; Bogaerts, A. CO2 conversion in a dielectric barrier discharge plasma: N2 in the mix as helping hand or problematic impurity? Energy Environ. Sci. 2016, 9, 999–1011. [Google Scholar] [CrossRef]
- Chandana, L.; Subrahmanyam, C. Degradation and Mineralization of Aqueous Phenol by an Atmospheric Pressure Catalytic Plasma Reactor. J. Environ. Chem. Eng. 2016. [Google Scholar] [CrossRef]
- Chandana, L.; Lakshminarayana, B.; Subrahmanyam, C. Influence of hydrogen peroxide on the simultaneous removal of Cr(VI) and methylene blue from aqueous medium under atmospheric pressure plasma jet. J. Environ. Chem. Eng. 2015, 3, 2760–2767. [Google Scholar] [CrossRef]
- Baravian, G.; Chaleix, D.; Choquet, P.; Nauche, P.L.; Puech, V.; Rozoy, M. Oil removal from iron surfaces by atmospheric-pressure barrier discharges. Surf. Coat. Technol. 1999, 115, 66–69. [Google Scholar] [CrossRef]
- Subrahmanyam, C.; Renken, A.; Kiwi-Minsker, L. Catalytic abatement of volatile organic compounds assisted by non-thermal plasma, Part II. Optimized catalytic electrode and operating conditions. Appl. Catal. B Environ. 2006, 65, 157–162. [Google Scholar] [CrossRef]
- Ray, D.; Reddy, P.M.K.; Subrahmanyam, C. Glass Beads Packed DBD-Plasma Assisted Dry Reforming of Methane. Top. Catal. 2017. [Google Scholar] [CrossRef]
- Ray, D.; Reddy, P.M.K.; Subrahmanyam, C. Ni-Mn/γ-Al2O3 assisted plasma dry reforming of methane. Catal. Today 2017. [Google Scholar] [CrossRef]
- Horvath, G.; Skalný, J.D.; Mason, N.J. FTIR study of decomposition of carbon dioxide in dc corona discharges. J. Phys. D Appl. Phys. 2008, 41, 225207. [Google Scholar] [CrossRef]
- Mikoviny, T.; Kocan, M.; Matejcik, S.; Mason, N.J.; Skalny, J.D. Experimental study of negative corona discharge in pure carbon dioxide and its mixtures with oxygen. J. Phys. D Appl. Phys. 2004, 37, 64. [Google Scholar] [CrossRef]
- Wen, Y.; Jiang, X. Decomposition of CO2 using pulsed corona discharges combined with catalyst. Plasma Chem. Plasma Process. 2001, 21, 665–678. [Google Scholar] [CrossRef]
- Kozák, T.; Bogaerts, A. Splitting of CO2 by vibrational excitation in non-equilibrium plasmas: A reaction kinetics model. Plasma Sources Sci. Technol. 2014, 23, 045004. [Google Scholar] [CrossRef]
- Wang, Y.F.; Tsai, G.H.; Shih, M.; Hsieh, L.T.; Chang, W.C. Direct Conversion of Methane into Methanol and Formaldehyde in an RF Plasma Environment II: Effects of Experimental Parameters. Aerosol Air Qual. Res. 2005, 5, 211–224. [Google Scholar] [CrossRef]
- Indarto, A.; Yang, D.R.; Choi, J.W.; Lee, H.; Song, H.K. Gliding arc plasma processing of CO2 conversion. J. Hazard. Mater. 2007, 146, 309–315. [Google Scholar] [CrossRef] [PubMed]
- Nozaki, T.; Okazaki, K. Non-thermal plasma catalysis of methane: Principles, energy efficiency, and applications. Catal. Today 2013, 211, 29–38. [Google Scholar] [CrossRef]
- Mei, D.; Tu, X. Conversion of CO2 in a cylindrical dielectric barrier discharge reactor: Effects of plasma processing parameters and reactor design. J. CO2 Util. 2017, 19, 68–78. [Google Scholar] [CrossRef]
- Mei, D.; He, Y.L.; Liu, S.; Yan, J.; Tu, X. Optimization of CO2 Conversion in a Cylindrical Dielectric Barrier Discharge Reactor Using Design of Experiments. Plasma Process. Polym. 2016, 13, 544–556. [Google Scholar] [CrossRef]
- Mei, D.; Zhu, X.; Wu, C.; Ashford, B.; Williams, T.P.; Tu, X. Plasma-photocatalytic conversion of CO2 at low temperatures: Understanding the synergistic effect of plasma-catalysis. Appl. Catal. B Environ. 2016, 182, 525–532. [Google Scholar] [CrossRef]
- Zeng, Y.; Tu, X. Plasma-catalytic hydrogenation of CO2 for the cogeneration of CO and CH4 in a dielectric barrier discharge reactor: Effect of argon addition. J. Phys. D Appl. Phys. 2017, 50, 184004. [Google Scholar] [CrossRef]
- Ramakers, M.; Michielsen, I.; Aerts, R.; Meynen, V.; Bogaerts, A. Effect of Argon or Helium on the CO2 Conversion in a Dielectric Barrier Discharge. Plasma Process. Polym. 2015, 12, 755–763. [Google Scholar] [CrossRef]
- Wang, T.; Liu, H.; Xiong, X.; Feng, X. Conversion of carbon dioxide to carbon monoxide by pulse dielectric barrier discharge plasma. IOP Conf. Ser. Earth Environ. Sci. 2017, 52, 012100. [Google Scholar] [CrossRef]
- Yap, D.; Tatibouët, J.-M.; Batiot-Dupeyrat, C. Carbon dioxide dissociation to carbon monoxide by non-thermal plasma. J. CO2 Util. 2015, 12, 54–61. [Google Scholar] [CrossRef]
- Ray, D.; Subrahmanyam, C. CO2 decomposition in a packed DBD plasma reactor: Influence of packing materials. RSC Adv. 2016, 6, 39492–39499. [Google Scholar] [CrossRef]
- Dunn, F.A. The dielectric constants of argon, carbon dioxide, nitrogen, and oxygen determined at an audio frequency. Can. J. Phys. 1961, 12, 1480–1498. [Google Scholar] [CrossRef]
- Linga Reddy, E.; Biju, V.M.; Subrahmanyam, C. Production of hydrogen from hydrogen sulfide assisted by dielectric barrier discharge. Int. J. Hydrog. Energy 2012, 37, 2204–2209. [Google Scholar] [CrossRef]
- Mei, D.; Zhu, X.; He, Y.L.; Yan, D.J.; Tu, X. Plasma-assisted conversion of CO2 in a dielectric barrier discharge reactor: Understanding the effect of packing materials. Plasma Sources Sci. Technol. 2015, 24, 015011. [Google Scholar] [CrossRef]
- Garcia-Cosio, G.; Calixto-Rodriguez, M.; Martinez, H. Low-pressure plasma discharge of Ar/N2/CO2 ternary mixture. Topic number B6200954. In Proceedings of the 29th International Conference on Phenomena in Ionized Gases (ICPIG 2009), Cancun, Mexico, 12–17 July 2009. [Google Scholar]
- Ramakers, M.; Trenchev, G.; Heijkers, S.; Wang, W.; Bogaerts, A. Gliding Arc Plasmatron: Providing an Alternative Method for Carbon Dioxide Conversion. ChemSusChem 2017, 10, 2642–2652. [Google Scholar] [CrossRef] [PubMed]
- Bogaerts, A.; Berthelot, A.; Heijkers, S.; Kolev, S.; Snoeckx, R.; Sun, S.; Trenchev, G.; Laer, K.V.; Wang, W. CO2 conversion by plasma technology: Insights from modeling the plasma chemistry and plasma reactor design. Plasma Sources Sci. Technol. 2017, 26, 063001. [Google Scholar] [CrossRef]
- Kameshima, S.; Tamura, K.; Ishibashi, Y.; Nozaki, T. Pulsed dry methane reforming in plasma-enhanced catalytic reaction. Catal. Today 2015, 256, 67–75. [Google Scholar] [CrossRef]
- Kraus, M.; Egli, W.; Haffner, K.; Eliasson, B.; Kogelschatz, U.; Wokaun, A. Investigation of mechanistic aspects of the catalytic CO2 reforming of methane in a dielectric barrier discharge using optical emission spectroscopy and kinetic modeling. Phys. Chem. Chem. Phys. 2002, 4, 668–675. [Google Scholar] [CrossRef]
- Tu, X.; Whitehead, J.C. Plasma-catalytic dry reforming of methane in an atmospheric dielectric barrier discharge: Understanding the synergistic effect at low temperature. Appl. Catal. B Environ. 2012, 125, 439–448. [Google Scholar] [CrossRef]
Figure 1.
Discharge power with respect to voltage (Flow rate 30 mL/min, Plasma frequency 50 Hz).

Figure 2.
Lissajous figure for different diluent gases at constant applied voltage 24 kV (Flow rate 30 mL/min, CO2:diluent gas = 1:2, Glass beads packed, Plasma frequency 50 Hz).
Figure 2.
Lissajous figure for different diluent gases at constant applied voltage 24 kV (Flow rate 30 mL/min, CO2:diluent gas = 1:2, Glass beads packed, Plasma frequency 50 Hz).
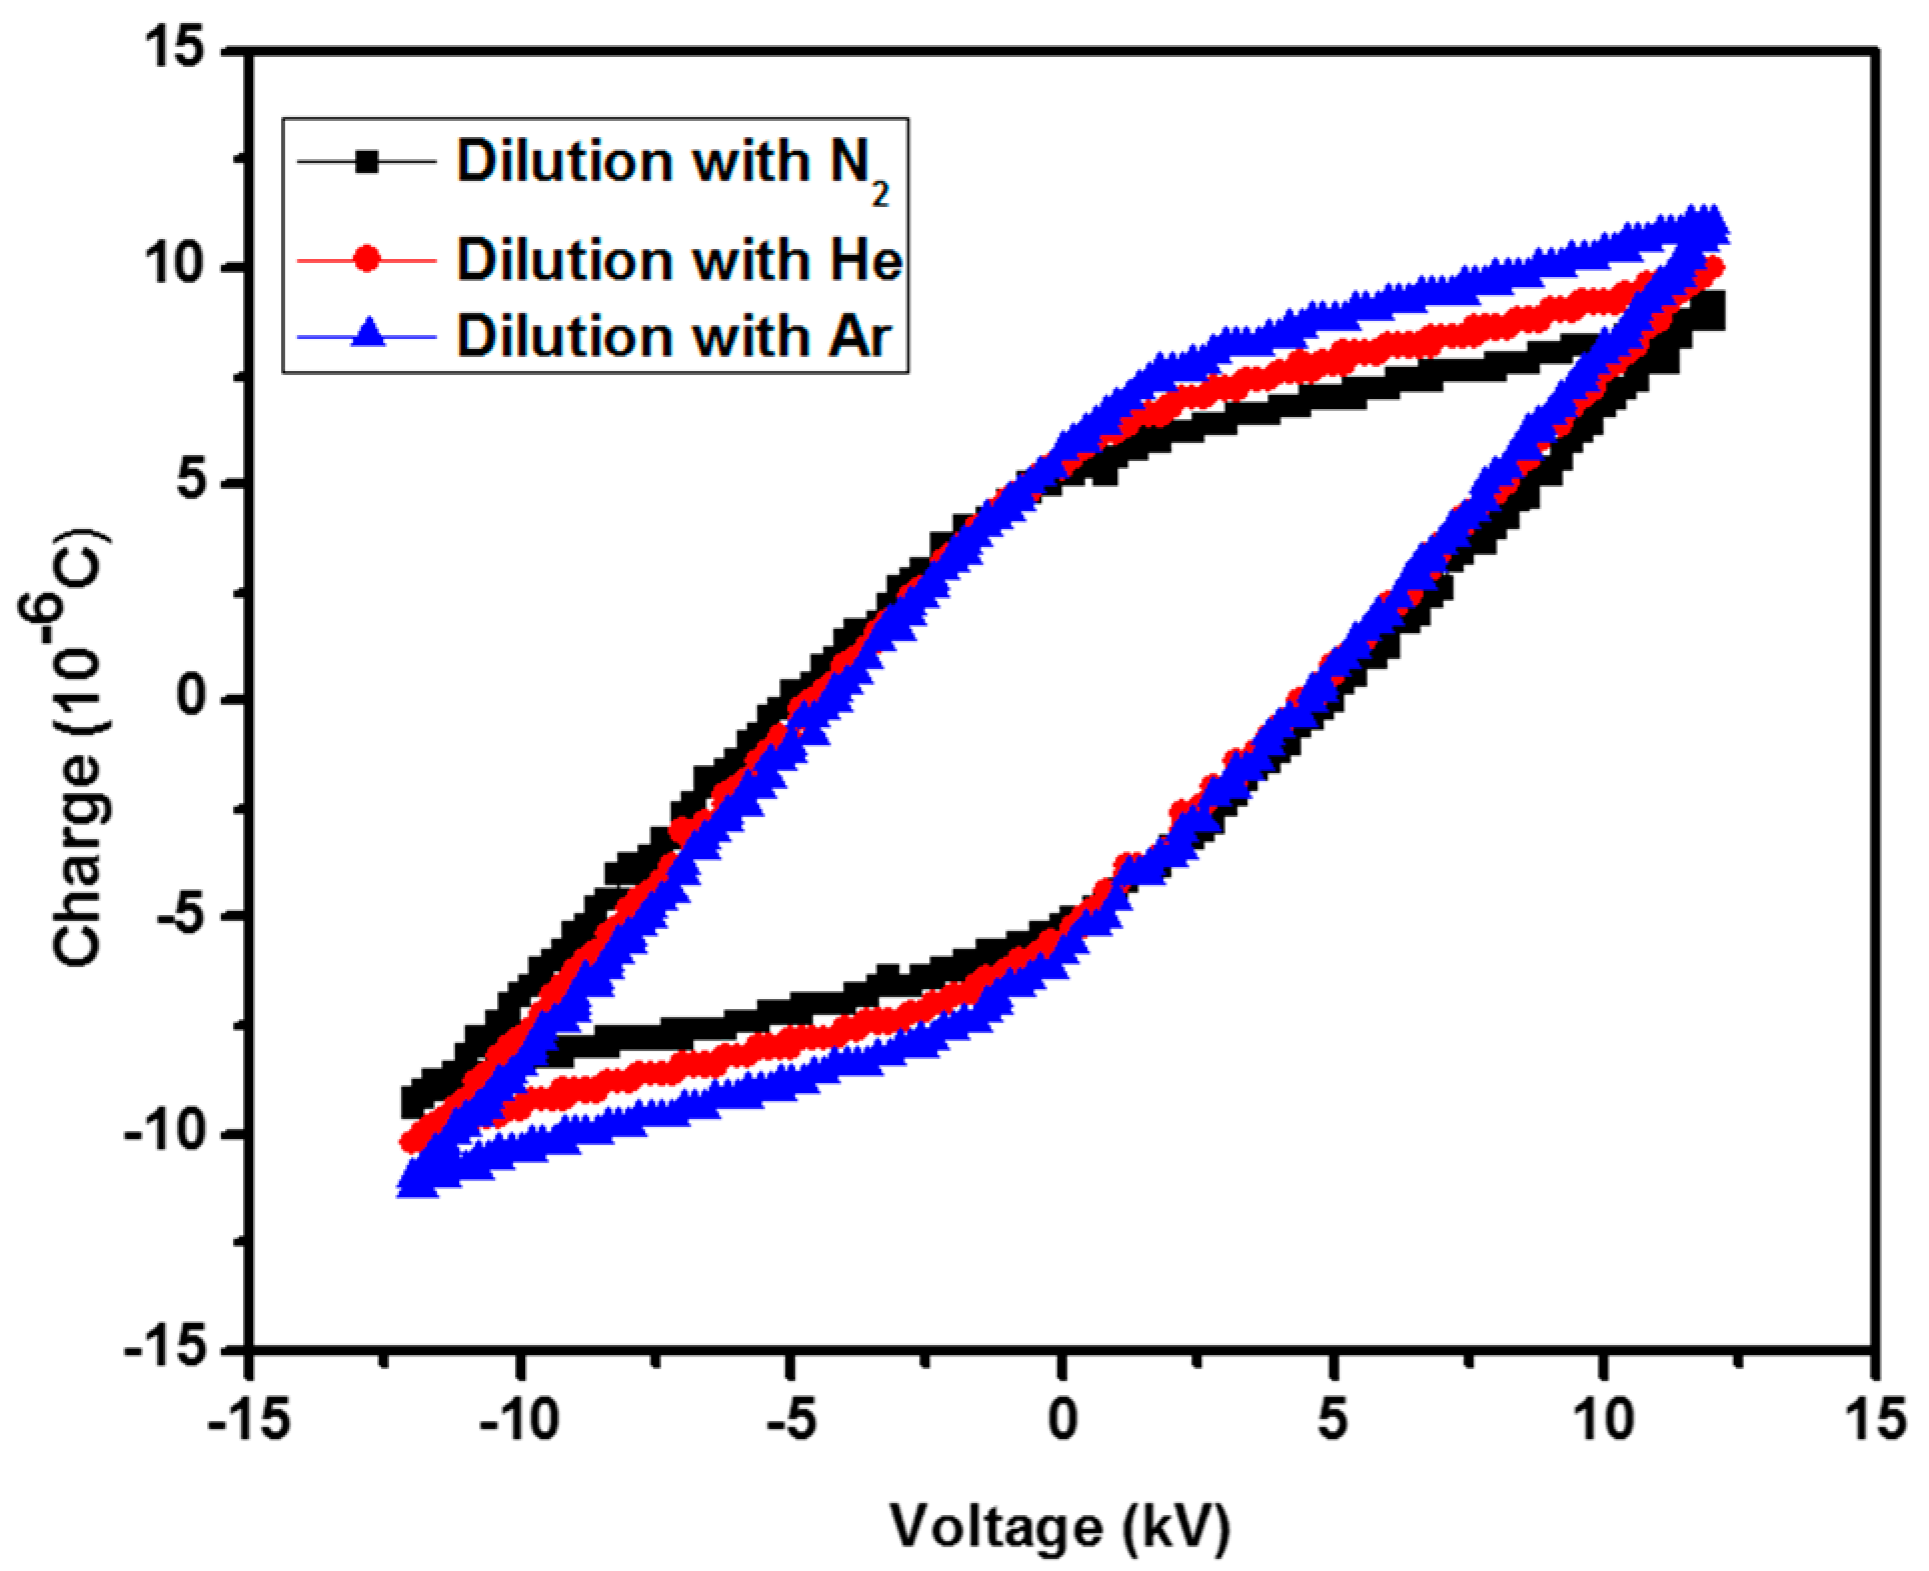
Figure 3.
Total charge transfer per half cycle as a function of applied voltage (Flow rate 30 mL/min, CO2:diluent gas = 1:2, Glass beads packed, Plasma frequency 50 Hz).
Figure 3.
Total charge transfer per half cycle as a function of applied voltage (Flow rate 30 mL/min, CO2:diluent gas = 1:2, Glass beads packed, Plasma frequency 50 Hz).

Figure 4.
(a) CO2 conversion with respect to SIE; (b) CO selectivity with respect to discharge power; (c) CO yield with respect to SIE. (Flow rate 30 mL/min, plasma frequency 50 Hz).
Figure 4.
(a) CO2 conversion with respect to SIE; (b) CO selectivity with respect to discharge power; (c) CO yield with respect to SIE. (Flow rate 30 mL/min, plasma frequency 50 Hz).

Figure 5.
(a) CO2 conversion with the change of SIE; (b) Selectivity of CO with respect to power; (c) Yield of CO with the variation of SIE. (Flow rate 30 mL/min, Glass beads packed, Plasma frequency 50 Hz).
Figure 5.
(a) CO2 conversion with the change of SIE; (b) Selectivity of CO with respect to power; (c) Yield of CO with the variation of SIE. (Flow rate 30 mL/min, Glass beads packed, Plasma frequency 50 Hz).

Figure 6.
(a) CO2 conversion with respect to discharge power; (b) CO selectivity with respect to SIE; (c) CO yield with respect to discharge power. (Flow rate 30 mL/min, CO2:diluent gas = 1:2, Glass beads packed, Plasma frequency 50 Hz).
Figure 6.
(a) CO2 conversion with respect to discharge power; (b) CO selectivity with respect to SIE; (c) CO yield with respect to discharge power. (Flow rate 30 mL/min, CO2:diluent gas = 1:2, Glass beads packed, Plasma frequency 50 Hz).

Figure 7.
ln(Cin/Cout) and SIE (linear fits) for different diluent gases. (Flow rate 30 mL/min, CO2:diluent gas = 1:2, Glass beads packed, Plasma frequency 50 Hz).
Figure 7.
ln(Cin/Cout) and SIE (linear fits) for different diluent gases. (Flow rate 30 mL/min, CO2:diluent gas = 1:2, Glass beads packed, Plasma frequency 50 Hz).
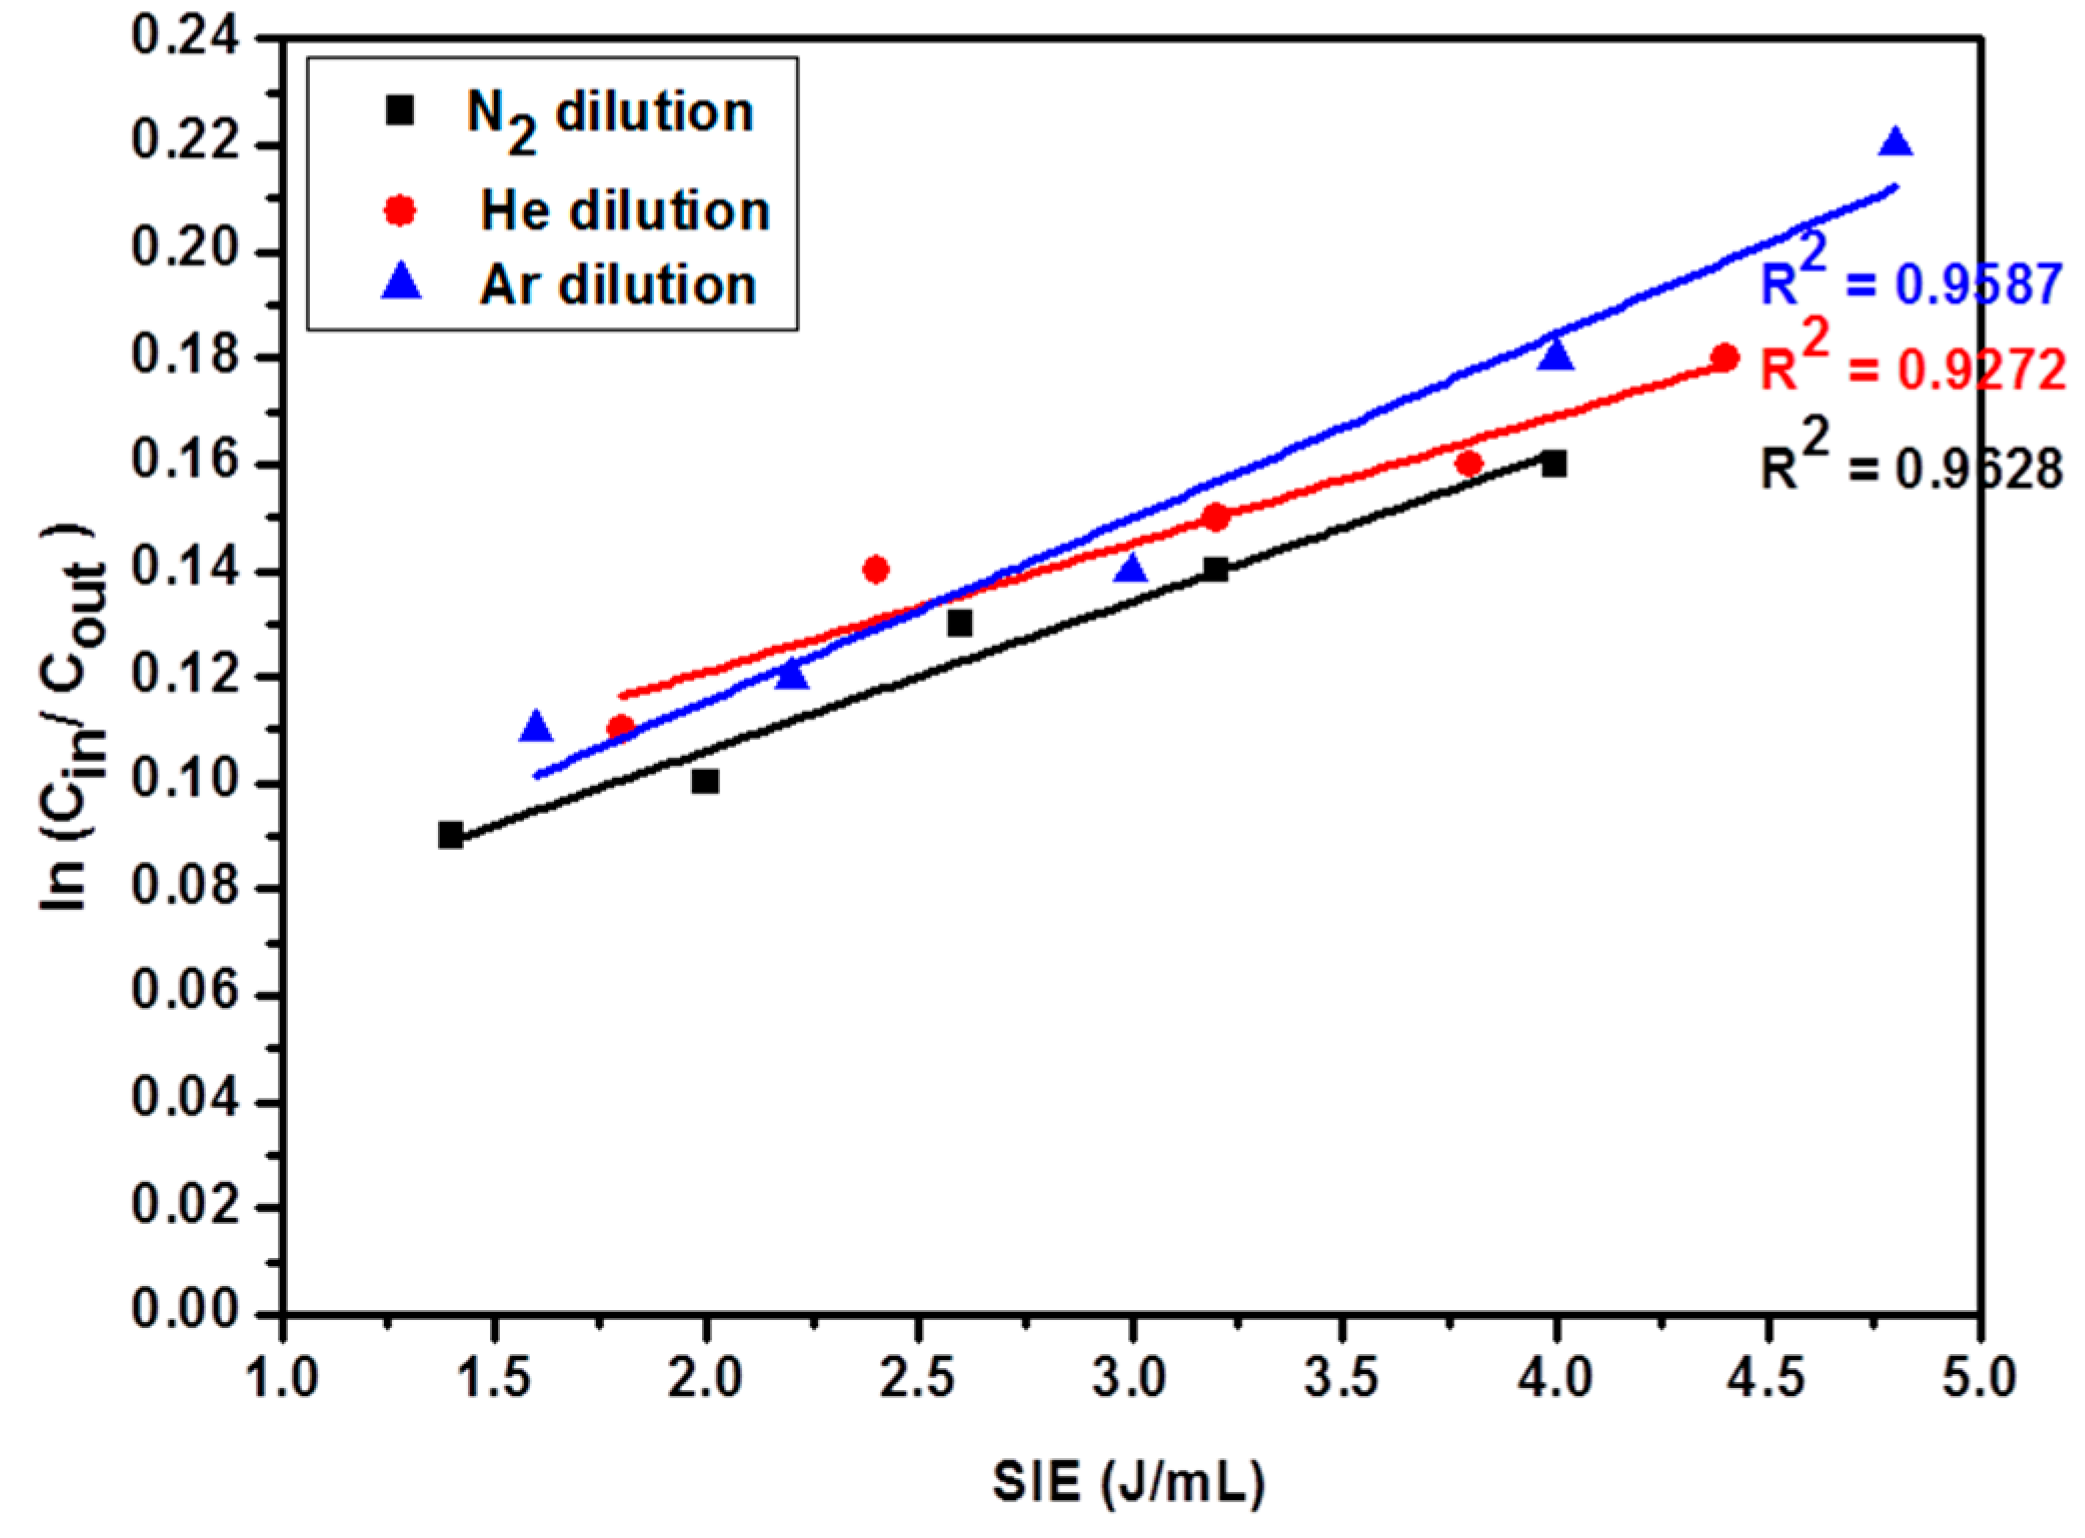
Figure 8.
Energy efficiency with the variation of power at different diluent gases. (Flow rate 30 mL/min, CO2:diluent gas = 1:2, Glass beads packed DBD, Plasma frequency 50 Hz).
Figure 8.
Energy efficiency with the variation of power at different diluent gases. (Flow rate 30 mL/min, CO2:diluent gas = 1:2, Glass beads packed DBD, Plasma frequency 50 Hz).
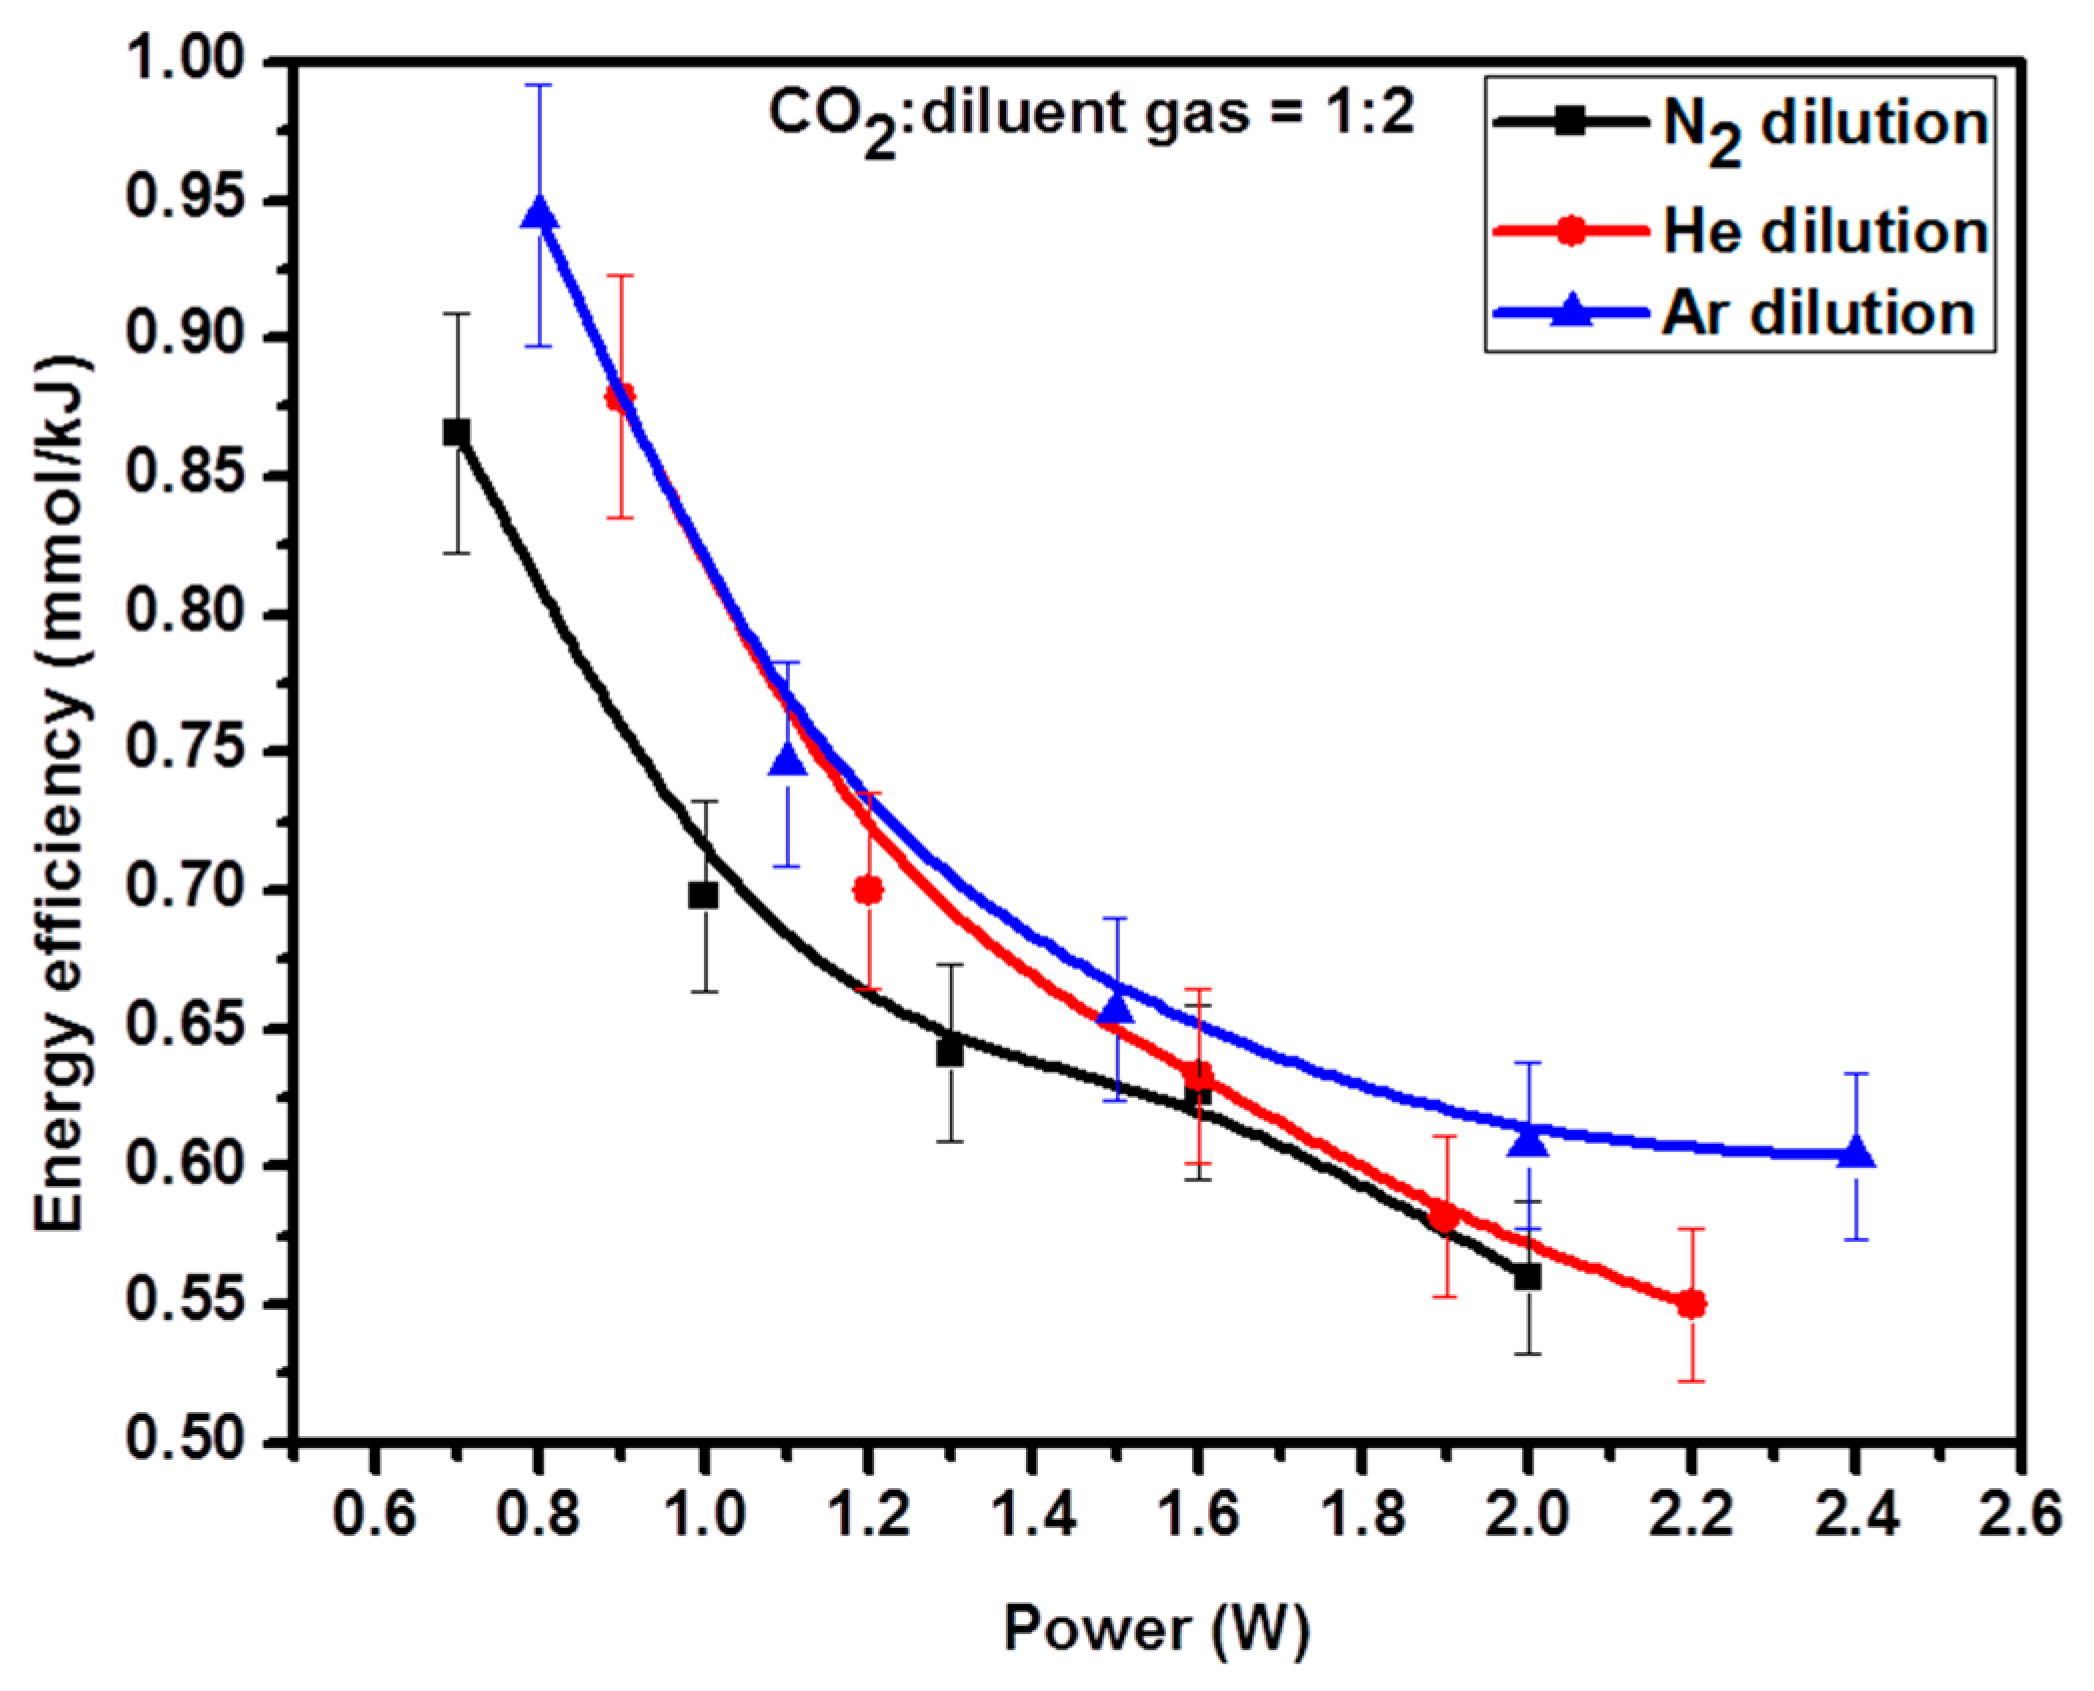
Figure 9.
Emission spectra of CO2 decomposition reaction (Flow rate 30 mL/min, Glass beads packed DBD, Applied voltage 22 kV, Plasma frequency 50 Hz, Grating: 600 glue at 500 nm).
Figure 9.
Emission spectra of CO2 decomposition reaction (Flow rate 30 mL/min, Glass beads packed DBD, Applied voltage 22 kV, Plasma frequency 50 Hz, Grating: 600 glue at 500 nm).

Figure 10.
Simplified diagram of experimental set up.


Table 1.
Discharge characteristics at different diluent gases.
| Diluent Gas | Applied Voltage (kV) | Discharge Power (W) | Charge Transfer per Half Cycle (μC) |
|---|---|---|---|
| N2 | 24 | 2.0 | 10.61 |
| He | 24 | 2.2 | 12.60 |
| Ar | 24 | 2.4 | 14.28 |
© 2017 by the authors. Licensee MDPI, Basel, Switzerland. This article is an open access article distributed under the terms and conditions of the Creative Commons Attribution (CC BY) license (http://creativecommons.org/licenses/by/4.0/).
Share and Cite
MDPI and ACS Style
Ray, D.; Saha, R.; Ch., S. DBD Plasma Assisted CO2 Decomposition: Influence of Diluent Gases. Catalysts 2017, 7, 244. https://doi.org/10.3390/catal7090244
AMA Style
Ray D, Saha R, Ch. S. DBD Plasma Assisted CO2 Decomposition: Influence of Diluent Gases. Catalysts. 2017; 7(9):244. https://doi.org/10.3390/catal7090244
Chicago/Turabian StyleRay, Debjyoti, Rajdeep Saha, and Subrahmanyam Ch. 2017. "DBD Plasma Assisted CO2 Decomposition: Influence of Diluent Gases" Catalysts 7, no. 9: 244. https://doi.org/10.3390/catal7090244
Note that from the first issue of 2016, this journal uses article numbers instead of page numbers. See further details here.