Vine Shoots and Grape Stalks as Carbon Sources for Hydrogen Evolution Reaction Electrocatalyst Supports


1
Center of Physics and Engineering of Advanced Materials (CeFEMA), Instituto Superior Técnico, Universidade de Lisboa, 1049-001 Lisbon, Portugal
2
Department of Environmental Engineering, Fırat University, 23279 Elazığ, Turkey
*
Author to whom correspondence should be addressed.
Catalysts 2018, 8(2), 50; https://doi.org/10.3390/catal8020050
Submission received: 29 November 2017
/
Revised: 12 January 2018
/
Accepted: 25 January 2018
/
Published: 27 January 2018
(This article belongs to the Special Issue Heterogeneous Catalysis & Hydrogen Storage)
Abstract
:Activated bio-based carbons produced from vine shoots (VSAC) and grape stalks (GSAC), which have larger surface area and total pore volume than most of the commercially available activated carbons, are used as supports for palladium nanoparticles (Pd NPs). The prepared materials are characterised by elemental analysis, N2-sorption, X-ray diffraction, scanning electron microscopy with energy dispersive X-ray spectroscopy, and transmission electron microscopy analysis and are then assessed as potential cathodes for the hydrogen evolution reaction (HER) in alkaline media. The electrocatalysts’ performance for HER is evaluated from cathodic polarisation curves at different temperatures and compared to that of Vulcan XC72-supported Pd NPs. Additional chronoamperometry studies helped to assess the electrocatalysts’ activity stability. The novel VSAC-supported Pd electrocatalyst exhibits good HER activity in terms of high current density at low overpotentials, leading to the best performance.
1. Introduction
Due to the problems arising from the consumption of fossil fuels [1], alternative energy carriers inevitably have to become a part of the energy industry in the near future. One of the most promising alternatives to fossil fuels is hydrogen, as it has a large combustion heat (287 kJ mol−1) and the only waste produced by its consumption is water [2]. For this reason, extensive research has been carried out by scientists all over the world in order to make the production and storage technology for hydrogen as efficient as possible [3]. Water electrolysis has been proven to be an exceptionally interesting method for hydrogen production, even more so when powered by renewable energy sources [4]. This is a quite simple method, where a difference in potential between two electrolyte-immersed electrodes is created by applying an external current to a circuit, resulting in the splitting of the water molecule into hydrogen (H2) and oxygen (O2).
When the electrolyte solution is alkaline (the case for this study), the electrolysis process can be summarised by Equations (1)–(3), where H2 is produced at the cathode and O2 is produced at the anode [5].
Anode: 2OH− → ½O2 + H2O + 2e−, E0 = 0.40 V vs. SHE.
Cathode: 2H2O + 2e− → H2 + 2OH−, E0 = −0.83 V vs. SHE.
Global: H2O → H2 + ½O2, E0 = 1.23 V.
Since the focus will be on the reactions at the cathode, where the hydrogen evolution reaction (HER) takes place, it is important to detail the various steps through which Equation (2) can occur. The HER in alkaline media is a multistep sequence described by Equations (4)–(6) [6].
Volmer step: M + H2O + e− → MHads + OH−.
Tafel step: 2MHads → 2M + H2.
Heyrovský step: MHads + H2O + e− → M + H2 + OH−.
The reaction always begins with the Volmer step (Equation (4)), where the water molecule is split into Hads and OH−, which is then followed by either the Tafel (Equation (5)) or the Heyrovský step (Equation (6)). These represent either a chemical or electrochemical (respectively) desorption of the H2 molecule. In order for all these steps to take place, the potential difference between the cathode and the anode has to be large enough to overcome the reversible cell potential, the electrode overpotentials, and the ohmic drop [7]. The latter originates from barriers such as electrodes and electrolyte phases, boundary layers, and electrical resistances at the circuit level [5]. To make the electrolysis cell as efficient as possible, it is imperative to use electrocatalysts that reduce the energy necessary for splitting the water molecule.
Activity towards the HER (achieved by proper control of the reaction mechanism and kinetics) and stability are essential requirements of these electrocatalysts [8]. In this context, platinum (Pt) is the most active and stable electrode material, but its limited supplies and exceptionally high cost pose restrictions for application in large-scale alkaline water electrolysers [9]. Transition metals, their alloys, and compounds, namely, carbides, sulphides, nitrides, phosphides, selenides, and oxides, have been studied as alternative electrocatalysts for HER [10,11]. Among these, molybdenum (Mo) and tungsten (W) carbides [12,13], sulphides [14,15], phosphides [16,17], and selenides [18] showed the most promising behaviour. Still, their HER performance in terms of activity and durability often does not reach that of noble metal-based electrocatalysts.
In contrast, palladium (Pd)-based electrocatalysts have shown great promise as an alternative to the Pt benchmark [19], as Pd possesses some of the qualities of Pt, such as the intermediate hydrogen binding energy and high exchange current density, while being cheaper [20,21]. Due to the higher catalytic activity shown by nanostructured metal electrocatalysts, when compared to the bulk metal electrocatalysts [22], there is a great interest in studying nanostructured forms of Pd, such as Pd nanoparticles (NPs).
These metal NPs can be anchored on a variety of supports to further increase their catalytic activity. The supports can improve the electrochemical surface area, as well as the distribution of the NPs, thus increasing the conductivity of the catalyst [20]. Recently, different forms of carbon-based materials have been studied for HER applications [23,24]. Bio-based carbon supports have been showing great promise in the area of electrochemical energy conversion devices, even surpassing the results obtained with the commonly used Vulcan XC72 carbon black [25,26]. Namely, commonly used commercial activated carbons have surface area in the range of 500–1500 m2 g−1, total pore volume higher than 0.2–0.6 cm3 g−1, and carbon content of 85–95%, and are generally expensive. Vine shoots and grape stalks are low-cost precursors and suitable materials for activated carbon production. The activated carbons produced from these biomaterials by chemical activation have larger surface area and total pore volume and higher carbon content than do most of the commercially available ones. In order to increase catalytic activity, these activated carbons were used as support materials.
In this work, monodispersed Pd NPs supported on three different carbon materials were used as the electrocatalysts. Two of the supports were novel, low-cost, activated biomass-derived carbons, namely, vine shoot activated carbon (VSAC) prepared from vine shoots [27] and grape stalk activated carbon (GSAC) prepared from grape stalks [28]. For comparison purposes, the third support material tested was Vulcan XC72, a benchmark carbon support widely used in industrial applications [26]. The activity towards the HER of the three electrocatalysts in alkaline media was studied by linear scan voltammetry (LSV) and chronoamperometry (CA).
2. Results and Discussion
2.1. Characterisation of Bio-Based Activated Carbon Supports
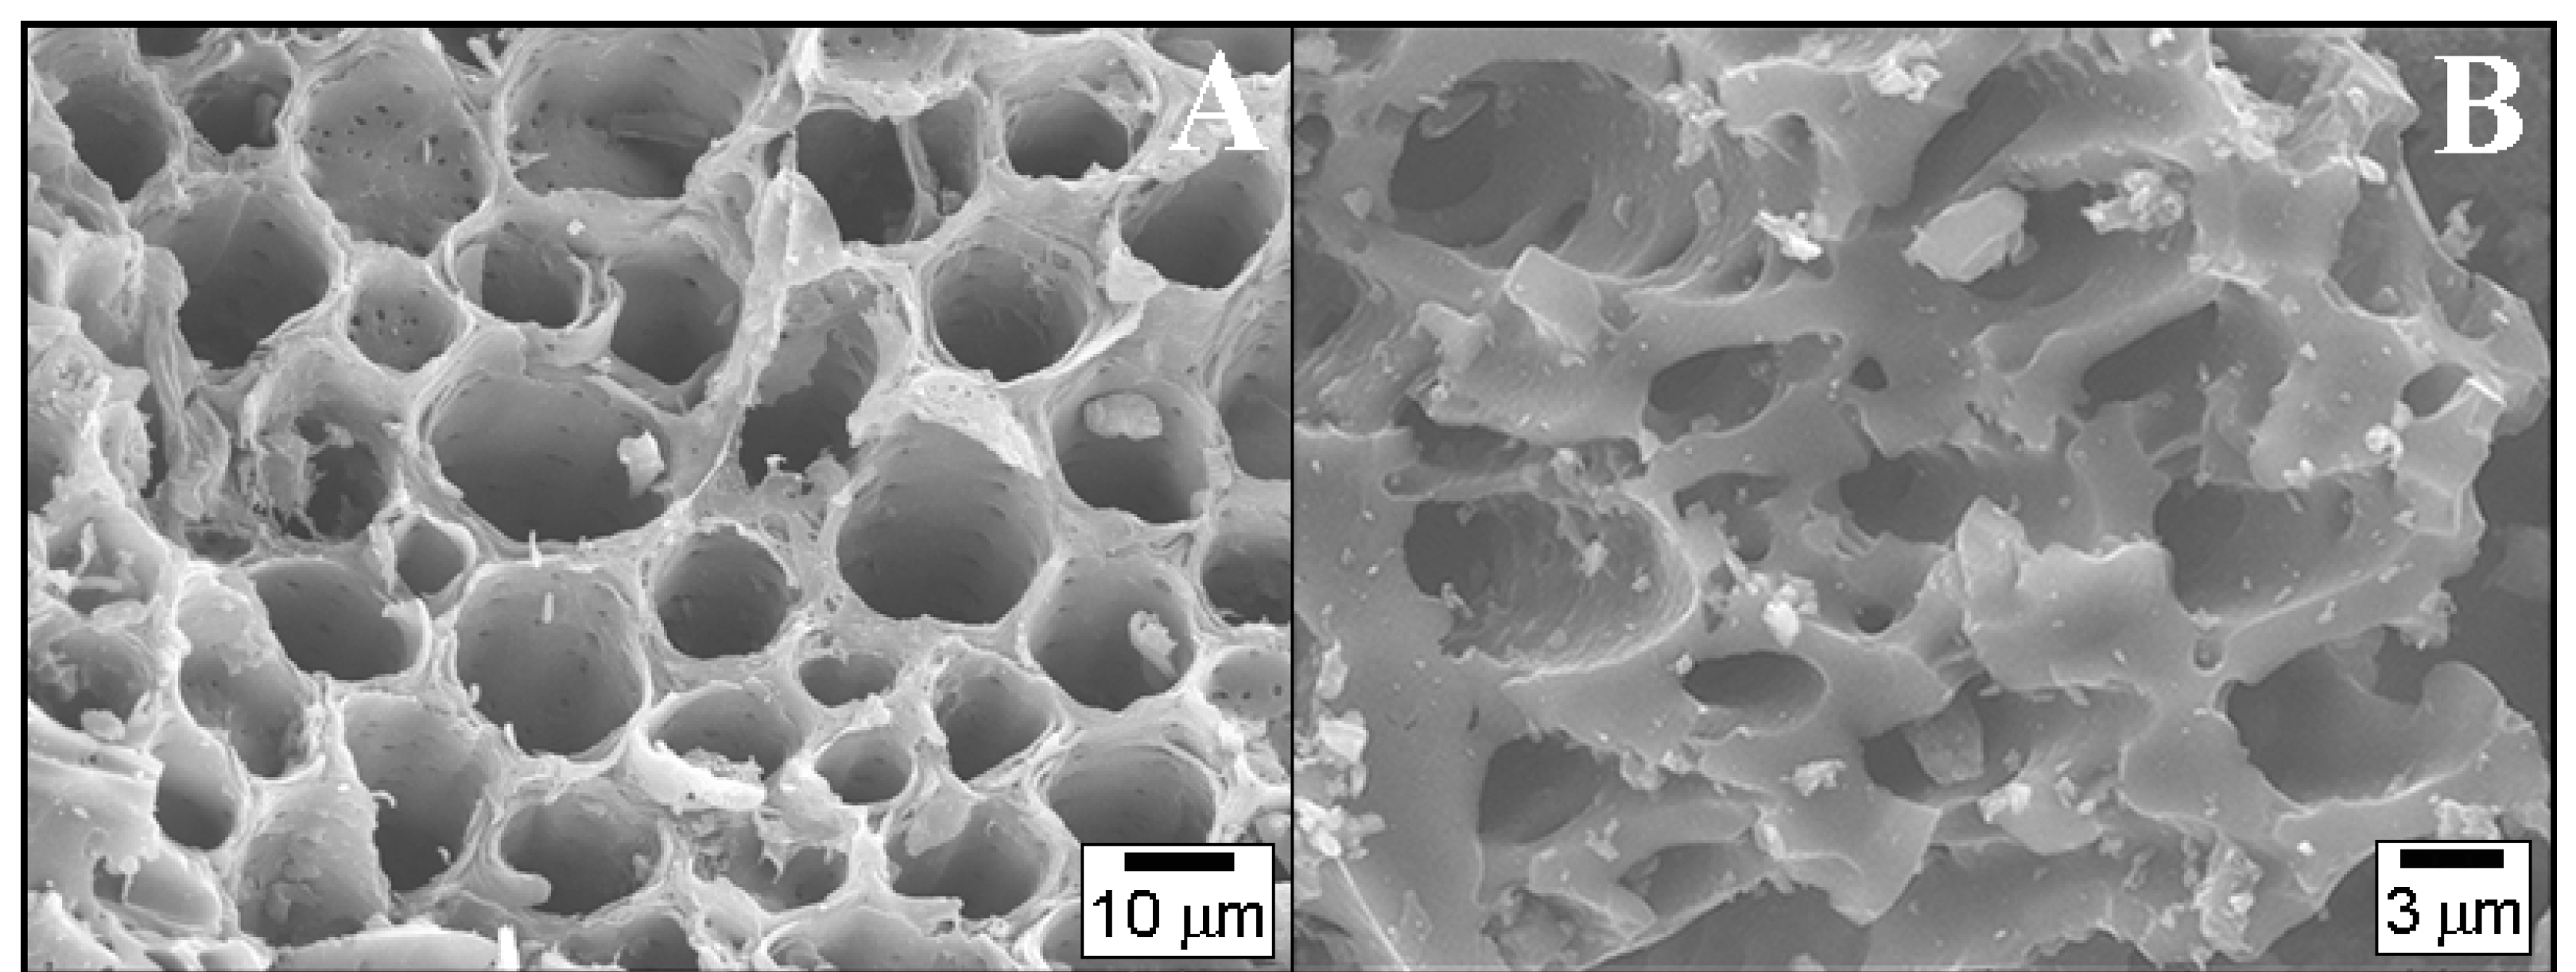
Bio-based activated carbons (VSAC and GSAC) used as support material were characterised by BET surface area, total pore volume, pore size, pHpzc (which indicates the pH value at which the sample’s net surface charge is zero [29]), surface functional group analysis by Boehm’s titration, and elemental and SEM analysis. The BET surface area, total pore volume, pore size, and pHpzc of the VSAC were found to be 1689 m2 g−1, 0.842 cm3 g−1, 1.941 nm, and 4.8, respectively, and the VSAC has mainly acidic functional groups (total 0.2516 meq g−1) on its surface. The external surface of the VSAC is highly porous with cracks, channels, cavities, and large holes (Figure 1A). The observed macropores can facilitate gas and electrolyte transportation. The elemental composition of VSAC was found to be 89.65% C, 0.71% H, 1.58% N, 0.06% S, and 8.00% O. Similarly, it has been determined that the BET surface area, total pore volume, pore size, and pHpzc of the GSAC were 1411 m2 g−1, 0.723 cm3 g−1, 2.049 nm, and 2.84, respectively, and the activated carbon has acidic surface functional groups and a highly porous surface with cracks, channels, and large holes (Figure 1B). It consists of 92.41% C, 0.28% H, 1.27% N, 0.17% S, and 5.87% O. Figure 1 clearly shows that VSAC has a more ordered morphology than GSAC, having larger macropores but containing a superior number of nanopores, which is reflected in the much higher BET surface area of the former.
2.2. Characterisation of the Activated Carbon-Supported Pd Nanoparticles
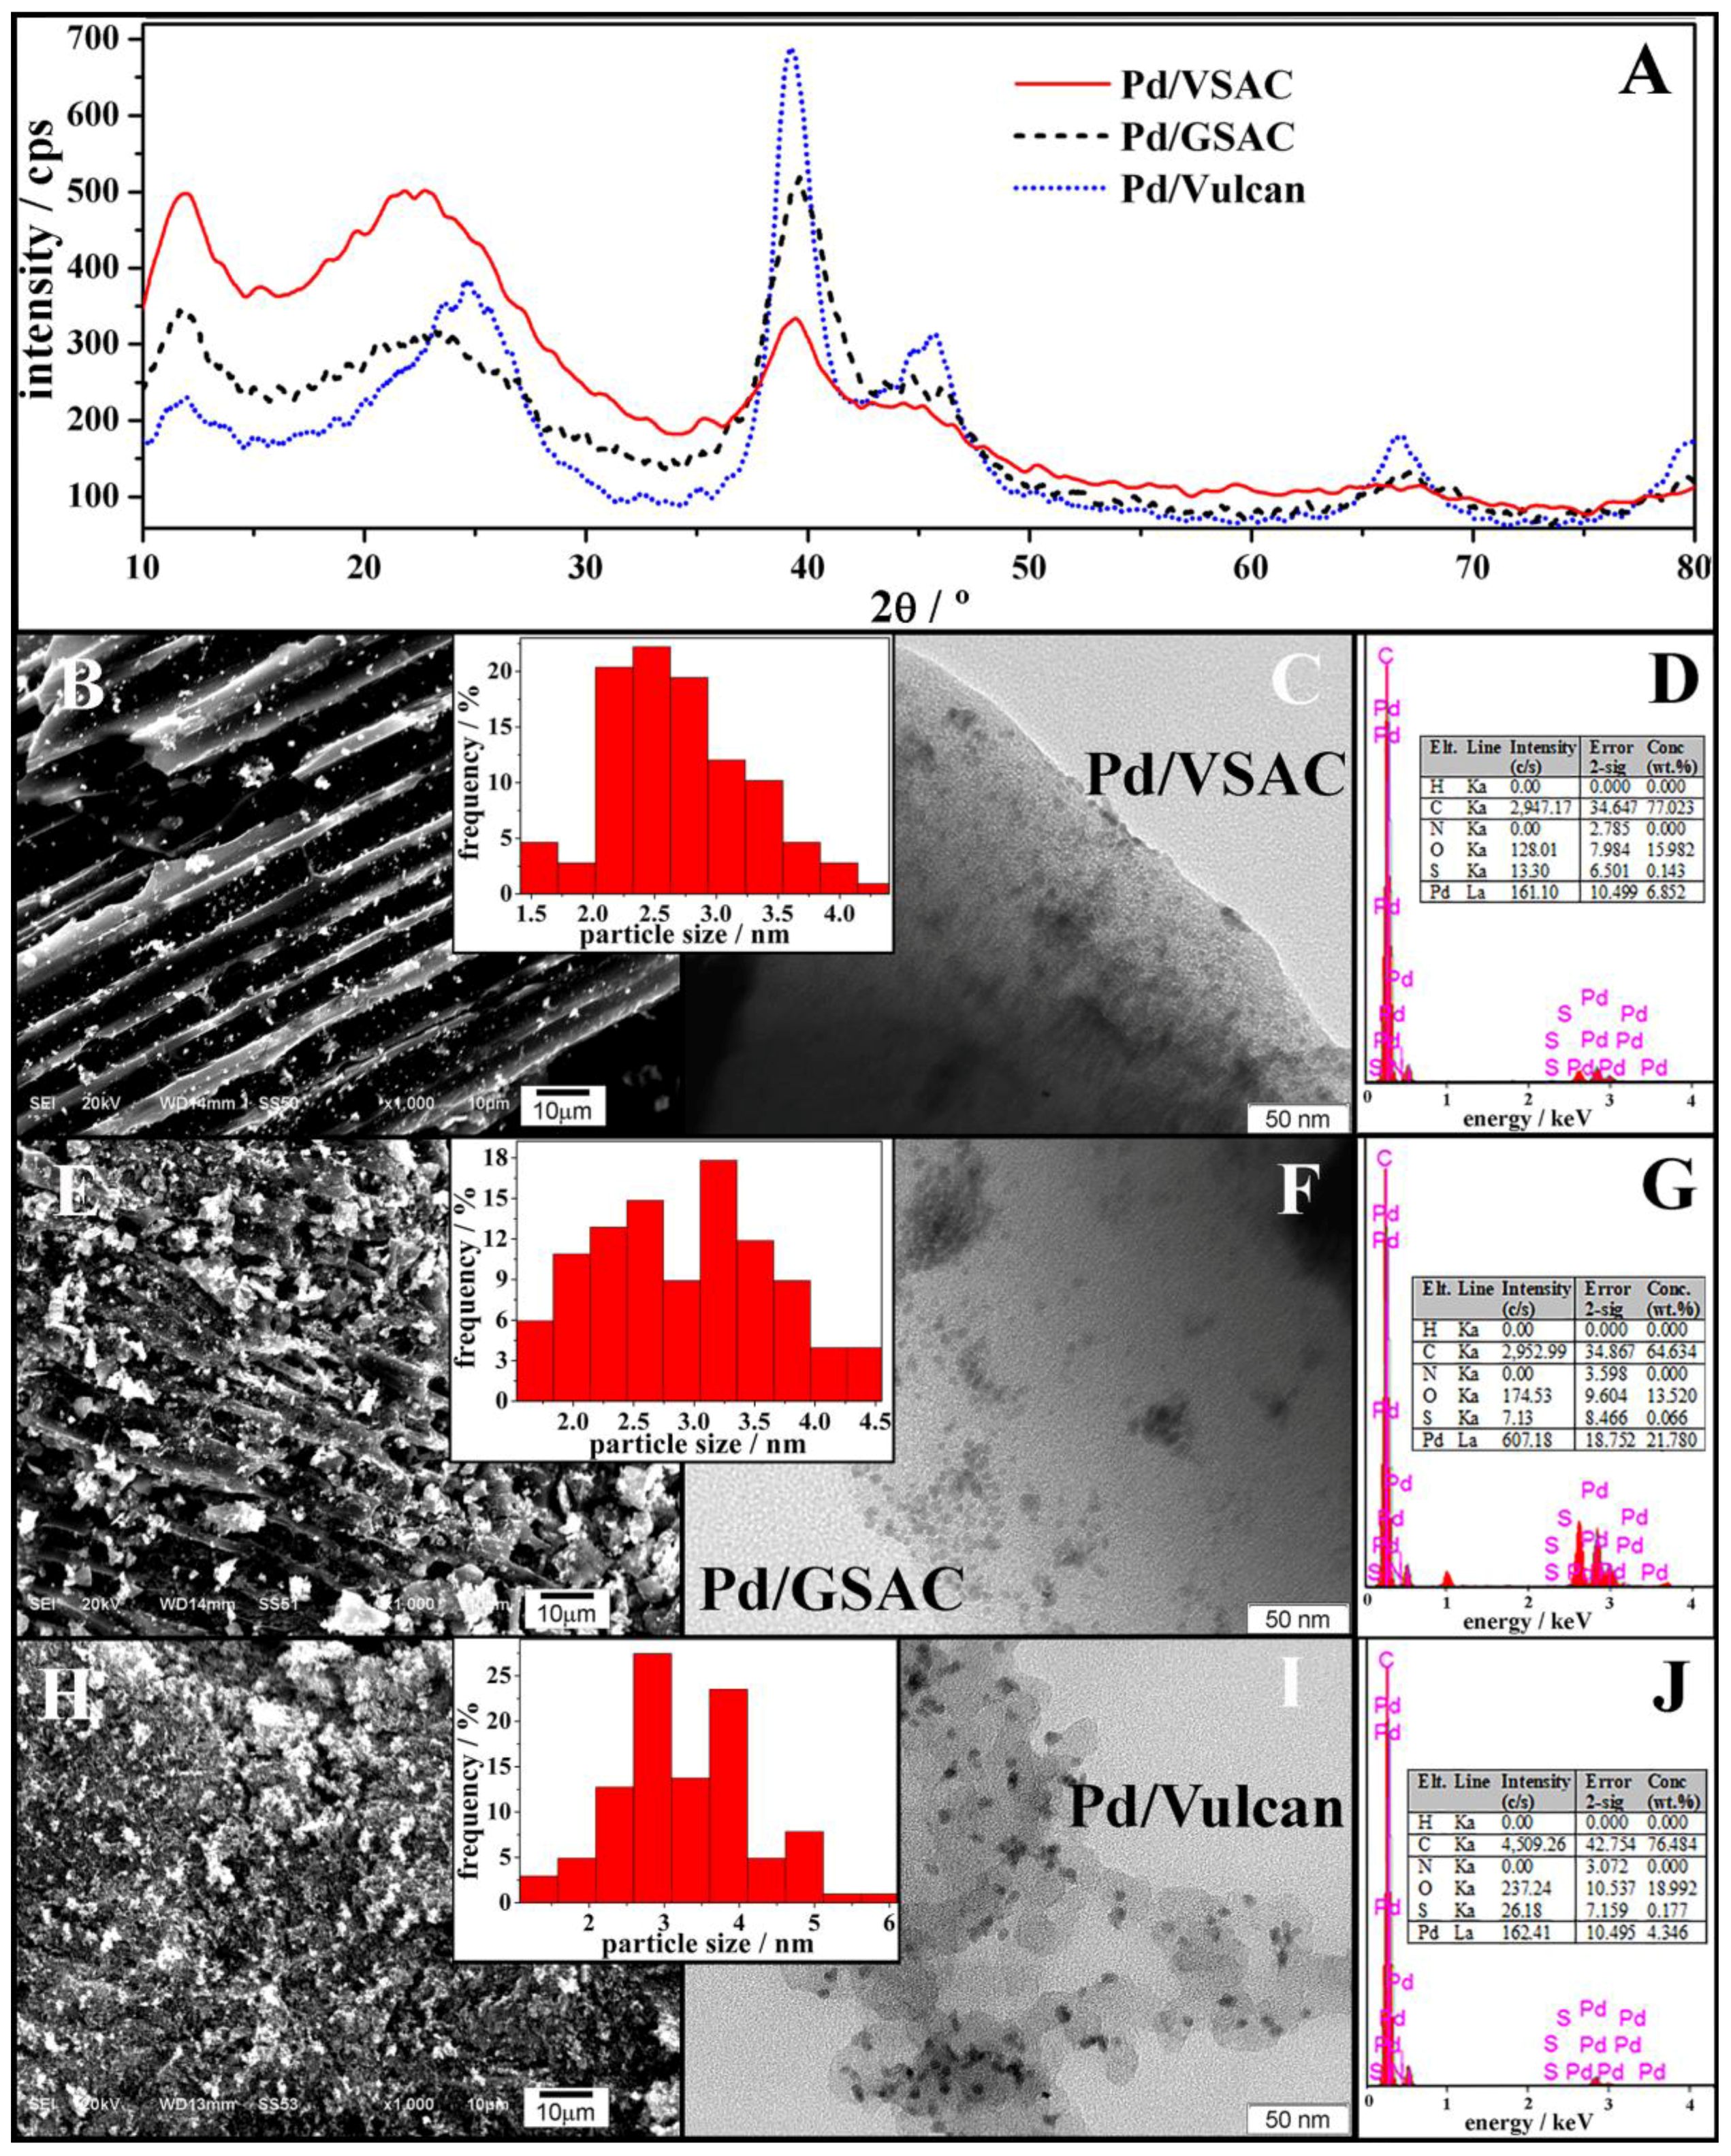
XRD analysis revealed the face-centred cubic (fcc) structure of crystalline Pd with its main characteristic maxima appearing at 2θ of ca. 40° (reflection of (111) plane), 46° (reflection of (200) plane), and 67° (reflection of (220) plane) (Figure 2A). A diffraction maximum characteristic for carbon supports appears as well, at 2θ of ca. 25°. The peak at ca. 2θ = 11° probably belongs to the gallic acid (C7H6O5H2O) originating from the activated carbon. The composition and morphology of the three electrocatalysts were further investigated by SEM-EDX and TEM (Figure 2). Pd/VSAC and Pd/Vulcan exhibit well-dispersed Pd NPs, with some degree of agglomeration in the case of Pd/GSAC. In fact, the TEM image of Pd/GSAC (Figure 2F) presents a high contrast between the areas of particle aggregation and those with higher dispersion, whereas the contrast in Pd/VSAC (Figure 2C) is much subtler, suggesting a considerably better dispersion of this catalyst. Particularly, the absence of aggregation in Pd/VSAC due to an excellent dispersion of Pd NP decoration (Figure 2B,C) on the bio-based substrate should favour the electrocatalyst surface area and catalytic activity. TEM micrographs were used to determine the Pd NP size distribution in the electrocatalysts. The obtained particle size distribution histograms (insets of Figure 2) reveal that the most abundant Pd NPs in case of Pd/VSAC, Pd/GSAC, and Pd/Vulcan electrocatalysts are those with diameters of ca. 2–3, 3, and 3–4 nm, respectively. Accordingly, the average Pd particle diameter was evaluated to be 2.7, 2.9, and 3.1 nm in Pd/VSAC, Pd/GSAC, and Pd/Vulcan, respectively. EDX analysis (Figure 2D,G,J) carried out during SEM confirmed the presence of Pd, C, and O (>1%) in the three electrocatalysts. The Pd content was determined to be 4.3% for Pd/Vulcan, 6.9% for Pd/VSAC, and 21.8% for Pd/GSAC.
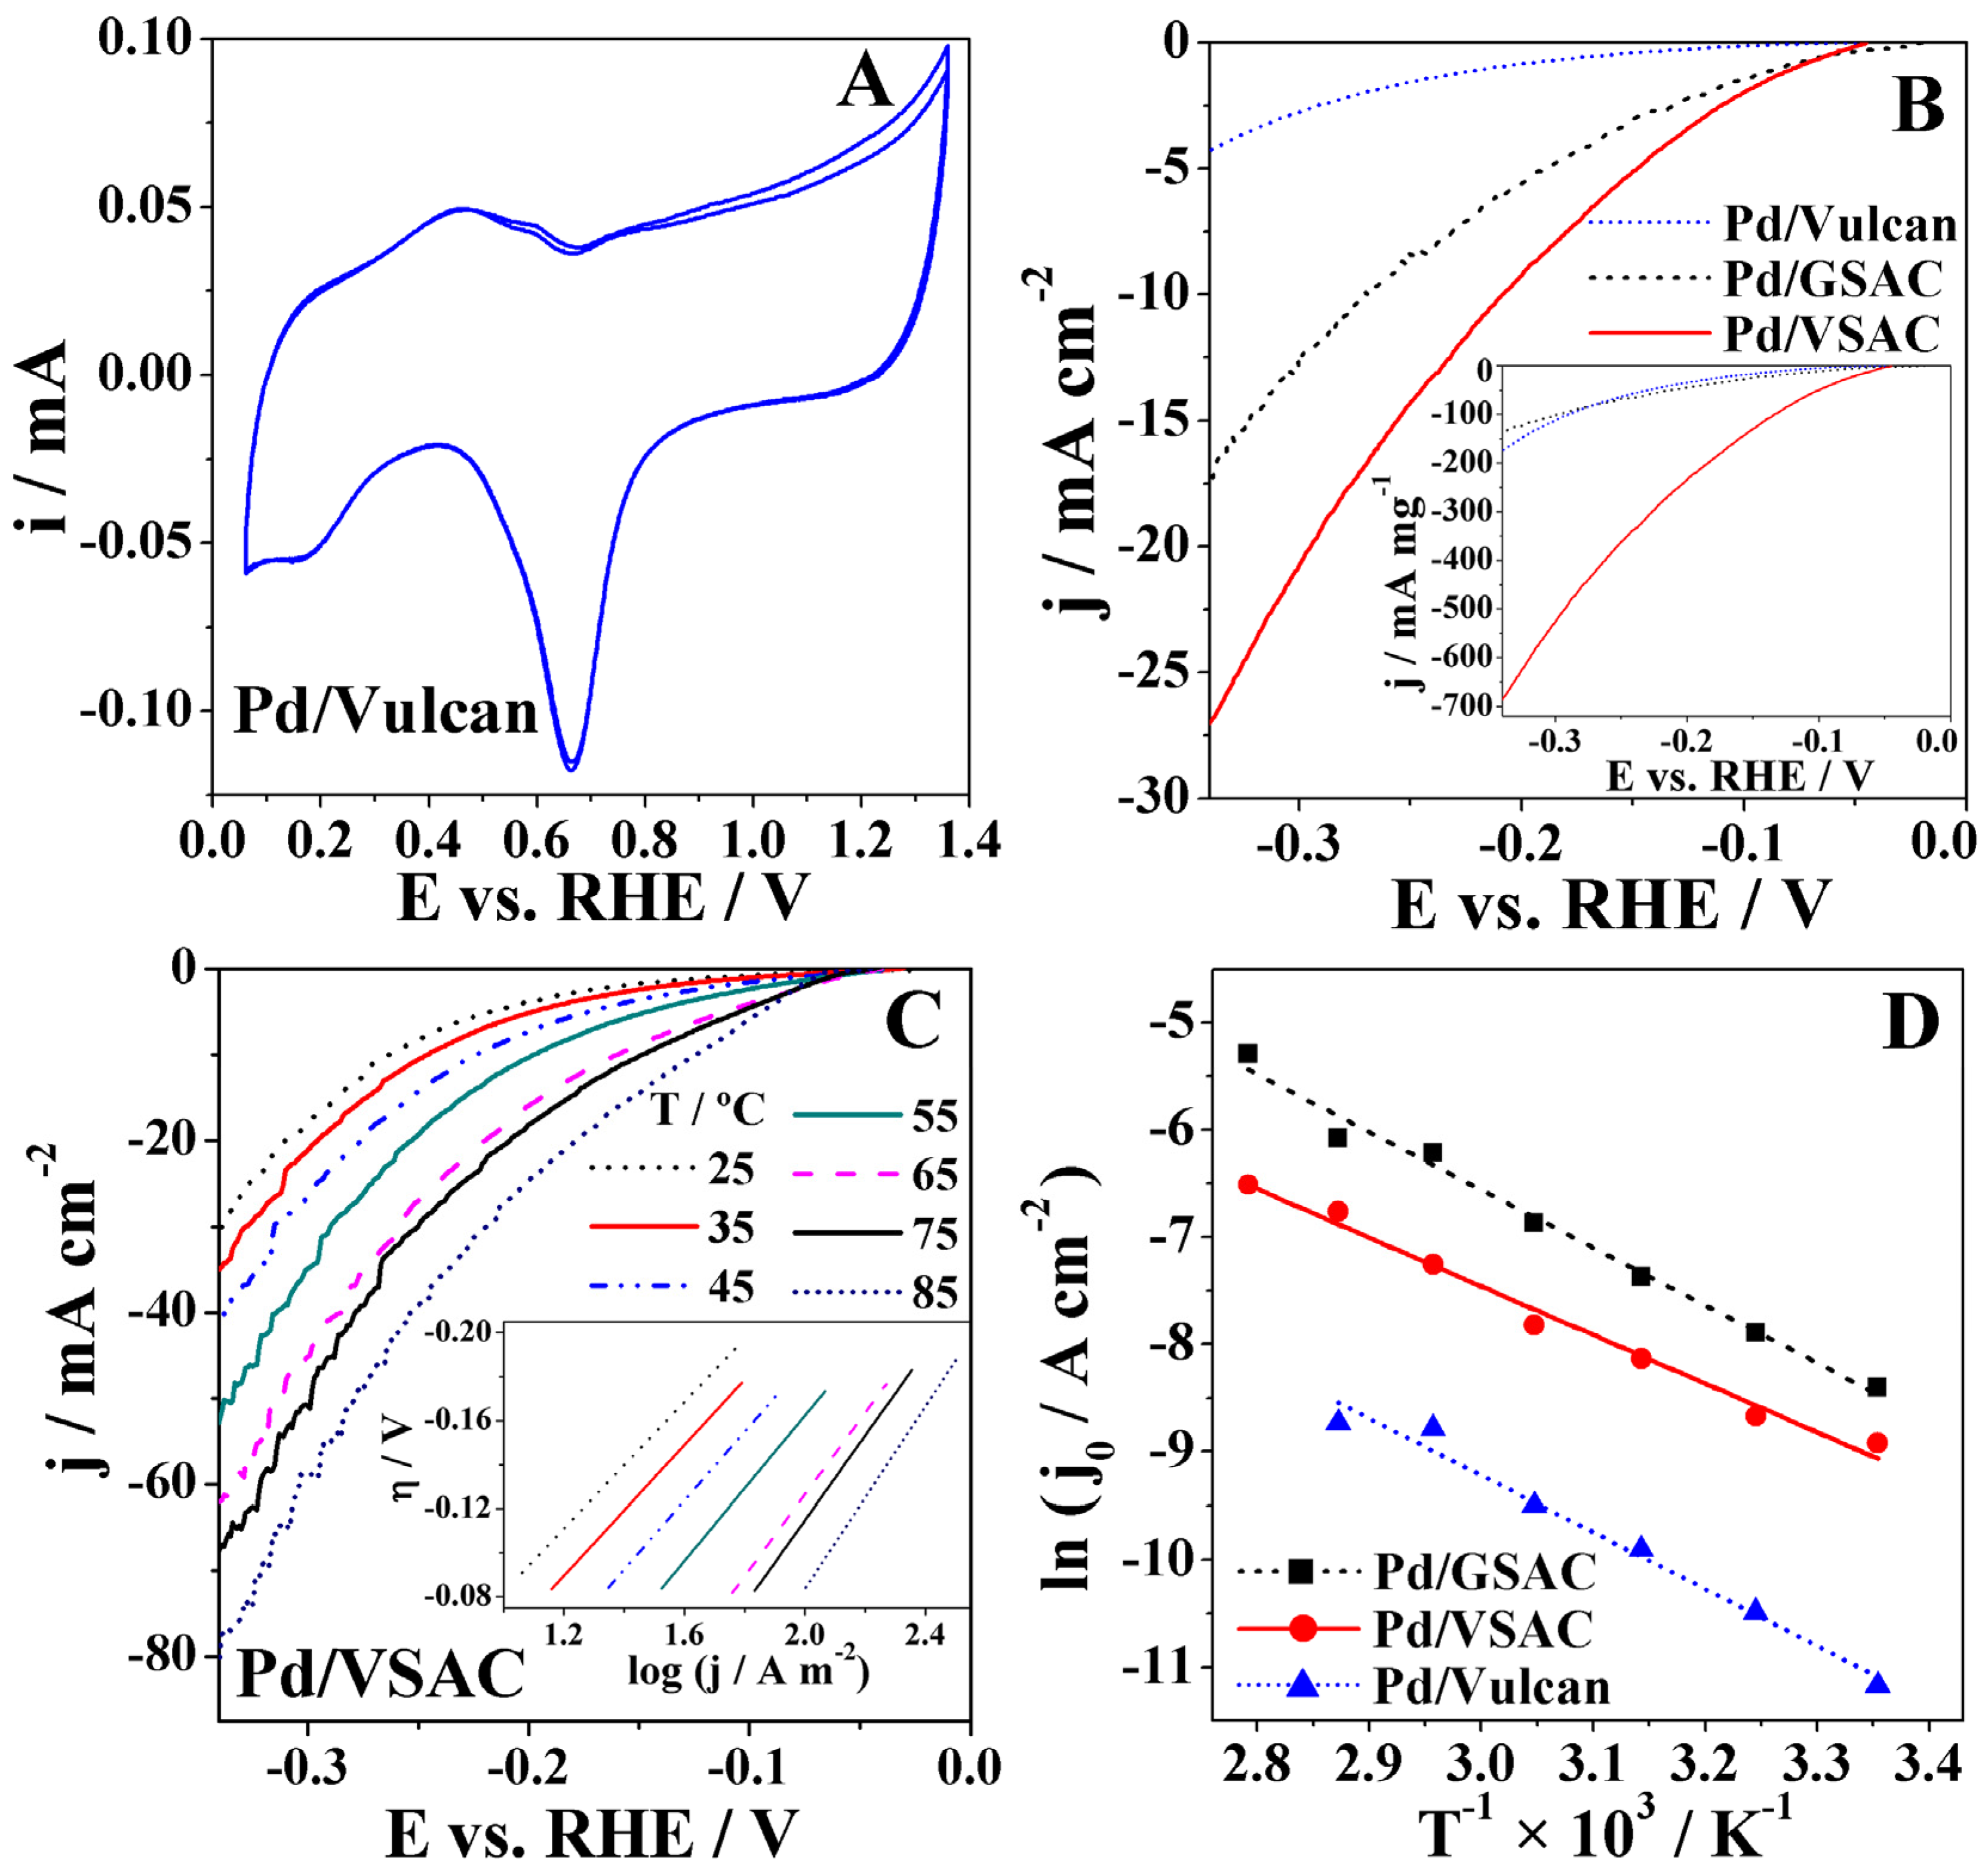
Electrochemical characterisation of the three studied electrocatalysts was performed by recording cyclic voltammetry (CV) studies in deaerated 8 M KOH at room temperature. CVs of all three materials exhibited characteristic peaks of Pd-based electrocatalysts (Figure 3A shows the CV of Pd/Vulcan as an illustrative example). Thus, an anodic peak corresponding to desorption of the stored hydrogen followed by a second anodic peak corresponding to the adsorption of OH– appear in the 0.06–0.65 V region with a subsequent increase of current corresponding to the formation of the PdO layer at potentials higher than 0.75 V. On the reverse scan, a cathodic peak originating from the reduction of PdO appears at ca. 0.65 V, followed by hydrogen adsorption at potentials lower than 0.3 V. Furthermore, the charge corresponding to the PdO reduction peak was used for the determination of the electrochemical surface area (ECSA) of Pd-based electrodes. By assuming a monolayer of PdO and a specific charge value of 420 μC cm−2 for the reduction of the PdO monolayer, the ECSA of the Pd electrodes were evaluated to increase in the order Pd/VSAC < Pd/Vulcan < Pd/GSAC.
2.3. HER Studies
Cathodic polarisation curves were run in 8 M KOH from the OCP until −0.34 V, at a scan rate of 1 mV s−1 at temperatures ranging from 25 to 85 °C (cf. Figure S1 of supporting information). It is known that Hads can be absorbed into the Pd lattice, resulting in the formation of a Pd hydride [30]. This absorption can influence the rate at which the reaction occurs since, if not mitigated, it can compete with the Tafel and Heyrovský steps. Considering this, it was necessary to assure that the electrode would be saturated with hydrogen at an equilibrium stage before the measurements took place, leaving no space for Hads to be absorbed into the Pd NPs during cathodic polarisation [30]. To prevent this detrimental effect and stabilise the OCP values of the three studied electrodes, a constant potential of −0.2 V was applied for 15 min before the measurements. The OCP values for Pd/GSAC, Pd/VSAC, and Pd/Vulcan were −0.03 V, −0.04 V, and −0.03 V, respectively.
A low scan rate (1 mV s−1) is necessary since the kinetic parameters, namely, exchange current densities j0 and Tafel slopes b, should ideally be determined under stationary conditions, assuming electron transfer control and validity of the j–η logarithmic approximation. The polarisation curves for the Pd/VSAC electrocatalyst show significantly higher current densities and mass-specific current densities, attaining values as high as 27 mA cm−2 and 685 mA mg−1, respectively, at 25 °C (Figure 3B). These current densities are higher than those reported for HER at reduced graphene oxide (rGO)-supported Pd alloys, namely rGO–Fe48Pd52 of ca. 5 mA cm−2 and rGO–Au48Pd52 of ca. 18 mA cm−2 at potential of −0.35 V in 8 M KOH at 25 °C [31]. In fact, despite the obvious better performance of the Pd/VSAC electrocatalyst demonstrated by the attained high current densities, its superiority is even more evident when considering the actual Pd mass loadings (inset of Figure 3B). The specific current densities are much higher than that obtained at PdX zeolite of ca. 20 mA mg−1 at a potential of −0.35 V in 8 M KOH at 25 °C [32].
The Pd/GSAC and Pd/VSAC electrocatalysts show the expected HER behaviour, with a significant increase in current densities accompanying the increase in temperature. The polarisation curve obtained for the Pd/Vulcan electrocatalyst did not show this behaviour, possibly due to hydrogen bubbling obstructing the electrode surface at higher temperatures [33].
For further study of HER kinetics at the three electrocatalysts, Tafel plots were constructed based on the data from the polarisation curves, using the classic Tafel relation (Equation (7)),
where R is the universal gas constant (8.314 J mol−1 K−1), T the temperature in Kelvin and F is Faraday’s constant (96485 C mol−1). The intercept value, a, is related with the exchange current density, which indicates the intrinsic rate of electron transfer. The Tafel slope is an indicator of the rate at which the current density increases with the increase of the overpotential. Furthermore, the charge transfer coefficient, α, may be determined from the slope. As an example, the inset of Figure 3C shows the Tafel plots obtained from the polarisation curves of Pd/VSAC at the seven different tested temperatures.
The HER data for Pd/VSAC and Pd/GSAC showed a good adjustment to the Tafel equation in the −0.08 to −0.20 V overpotential region, with R2 > 0.99. Table 2 shows the α, b, and j0 values evaluated for the three studied electrocatalysts, as well as the recorded values of current density at overpotential of 0.1 V, j0.1, and of overpotential at 10 mA cm−2, η10.
The Tafel slopes of the Pd/GSAC, Pd/VSAC, and Pd/Vulcan XC72 at 25 °C were found to be 0.163, 0.144, and 0.105 V dec−1, respectively. The obtained values suggest that the Volmer step is the rate-determining step (RDS) of the process. Tafel slope value deviations from the theoretical value of 0.120 V dec−1 for the Volmer step as the RDS [34] have been previously reported and explained by the mentioned absorption of hydrogen into the Pd bulk [2,35]. Additionally, it was observed that b values obtained at the three electrocatalysts increased with temperature, which is also reflected in a small decrease of α. In contrast, there was a significant increase of the j0 values, indicative of faster HER kinetics at higher temperatures. Pd/VSAC gave the highest HER j0 values (as high as 5.02 mA cm−2 at 85 °C). It is worth noting that j0 values obtained at Pd/VSAC (for instance, 0.22 mA cm−2 at 25 °C) are one order of magnitude higher than those obtained at Pd/Vulcan (0.01 mA cm−2 at 25 °C). Furthermore, the HER j0 values obtained with Pd grafted onto the novel VSAC support are higher than those reported for two Pd-modified carbon fibre electrodes, of 0.16 mA cm−2 and 0.02 mA cm−2, in alkaline 0.1 M NaOH electrolyte at room temperature [36,37]. The obtained values are also higher than that reported for Pd-ion exchanged X zeolite (0.04 mA cm−2) in 8 M KOH at 25 °C [32]. Chen et al. [38] also evaluated Pd-based catalysts supported on carbon nanofibre and reported a j0 of 1.53 mA cm−2, similar to those obtained herein. To allow a better comparison of the recorded cathodic polarisation data for the three tested electrocatalysts, Table 1 also includes the current densities at the overpotential of 0.1 V, j0.1, and the overpotential required to attain a current density of 10 mA cm−2, η10. Both bio-based-supported Pd electrocatalysts presented j0.1 values one order of magnitude higher than those obtained for Pd/Vulcan, with Pd/VSAC j0.1 values being about double those of Pd/GSAC. Pd/VSAC HER current densities reach the value of 10 mA cm−2 at a potential of −0.21 V at 25 °C, which is much lower than that at Pd/Vulcan (below −0.34 V), indicating significantly higher catalytic activity toward HER of the former electrocatalyst. The Pd/Vulcan electrocatalyst led to the lowest current densities, with maximum values between 4 and 5 mA cm−2 being attained at an overpotential of 0.3 V. Table 1 also shows the expected overpotential decrease with temperature increase to reach the current density of 10 mA cm−2.
The activation energies Ea of HER at these three electrocatalysts were also determined. For this purpose, the values of j0 were plotted as a function of the reciprocal value of temperature 1/T (Figure 3D). The Arrhenius equation (Equation (8)) was then used to examine the results:
where Ai represents the Arrhenius pre-exponential factor. The data show a good adjustment to the Arrhenius equation with R2 > 0.97. Thus, HER activation energy values of 38, 45, and 44 kJ mol−1 were determined for Pd/VSAC, Pd/GSAC and Pd/Vulcan, respectively. These values are comparable with the Ea value of 39 kJ mol−1 obtained for HER at the PdX zeolite [32] and comparable to/higher than the Ea value of 30 kJ mol−1 obtained for HER at pure Pd [39]. However, it should be pointed out that the use of novel activated bio-based carbon supports is extremely useful in reducing the electrocatalyst cost as a result of the significantly lower amount of Pd used.
Subsequently, chronoamperometry (CA) measurements were carried out at potentials of −0.14, −0.24, and −0.34 V at temperatures ranging from 25 to 85 °C (Figure 4). In agreement with the LSV results, the highest HER current densities were obtained at Pd/VSAC, independently of the applied potential and temperature.
As expected, improvement of the HER kinetics with an increase of overpotential and temperature is evident for all three electrocatalysts. The increase of current density with temperature was the most pronounced in the case of Pd/VSAC. As the temperature and the applied potential are increased, more noise could also be observed, even though the effective current remains quite stable; the observed noise is likely due to enhanced production of hydrogen on the electrode surface.
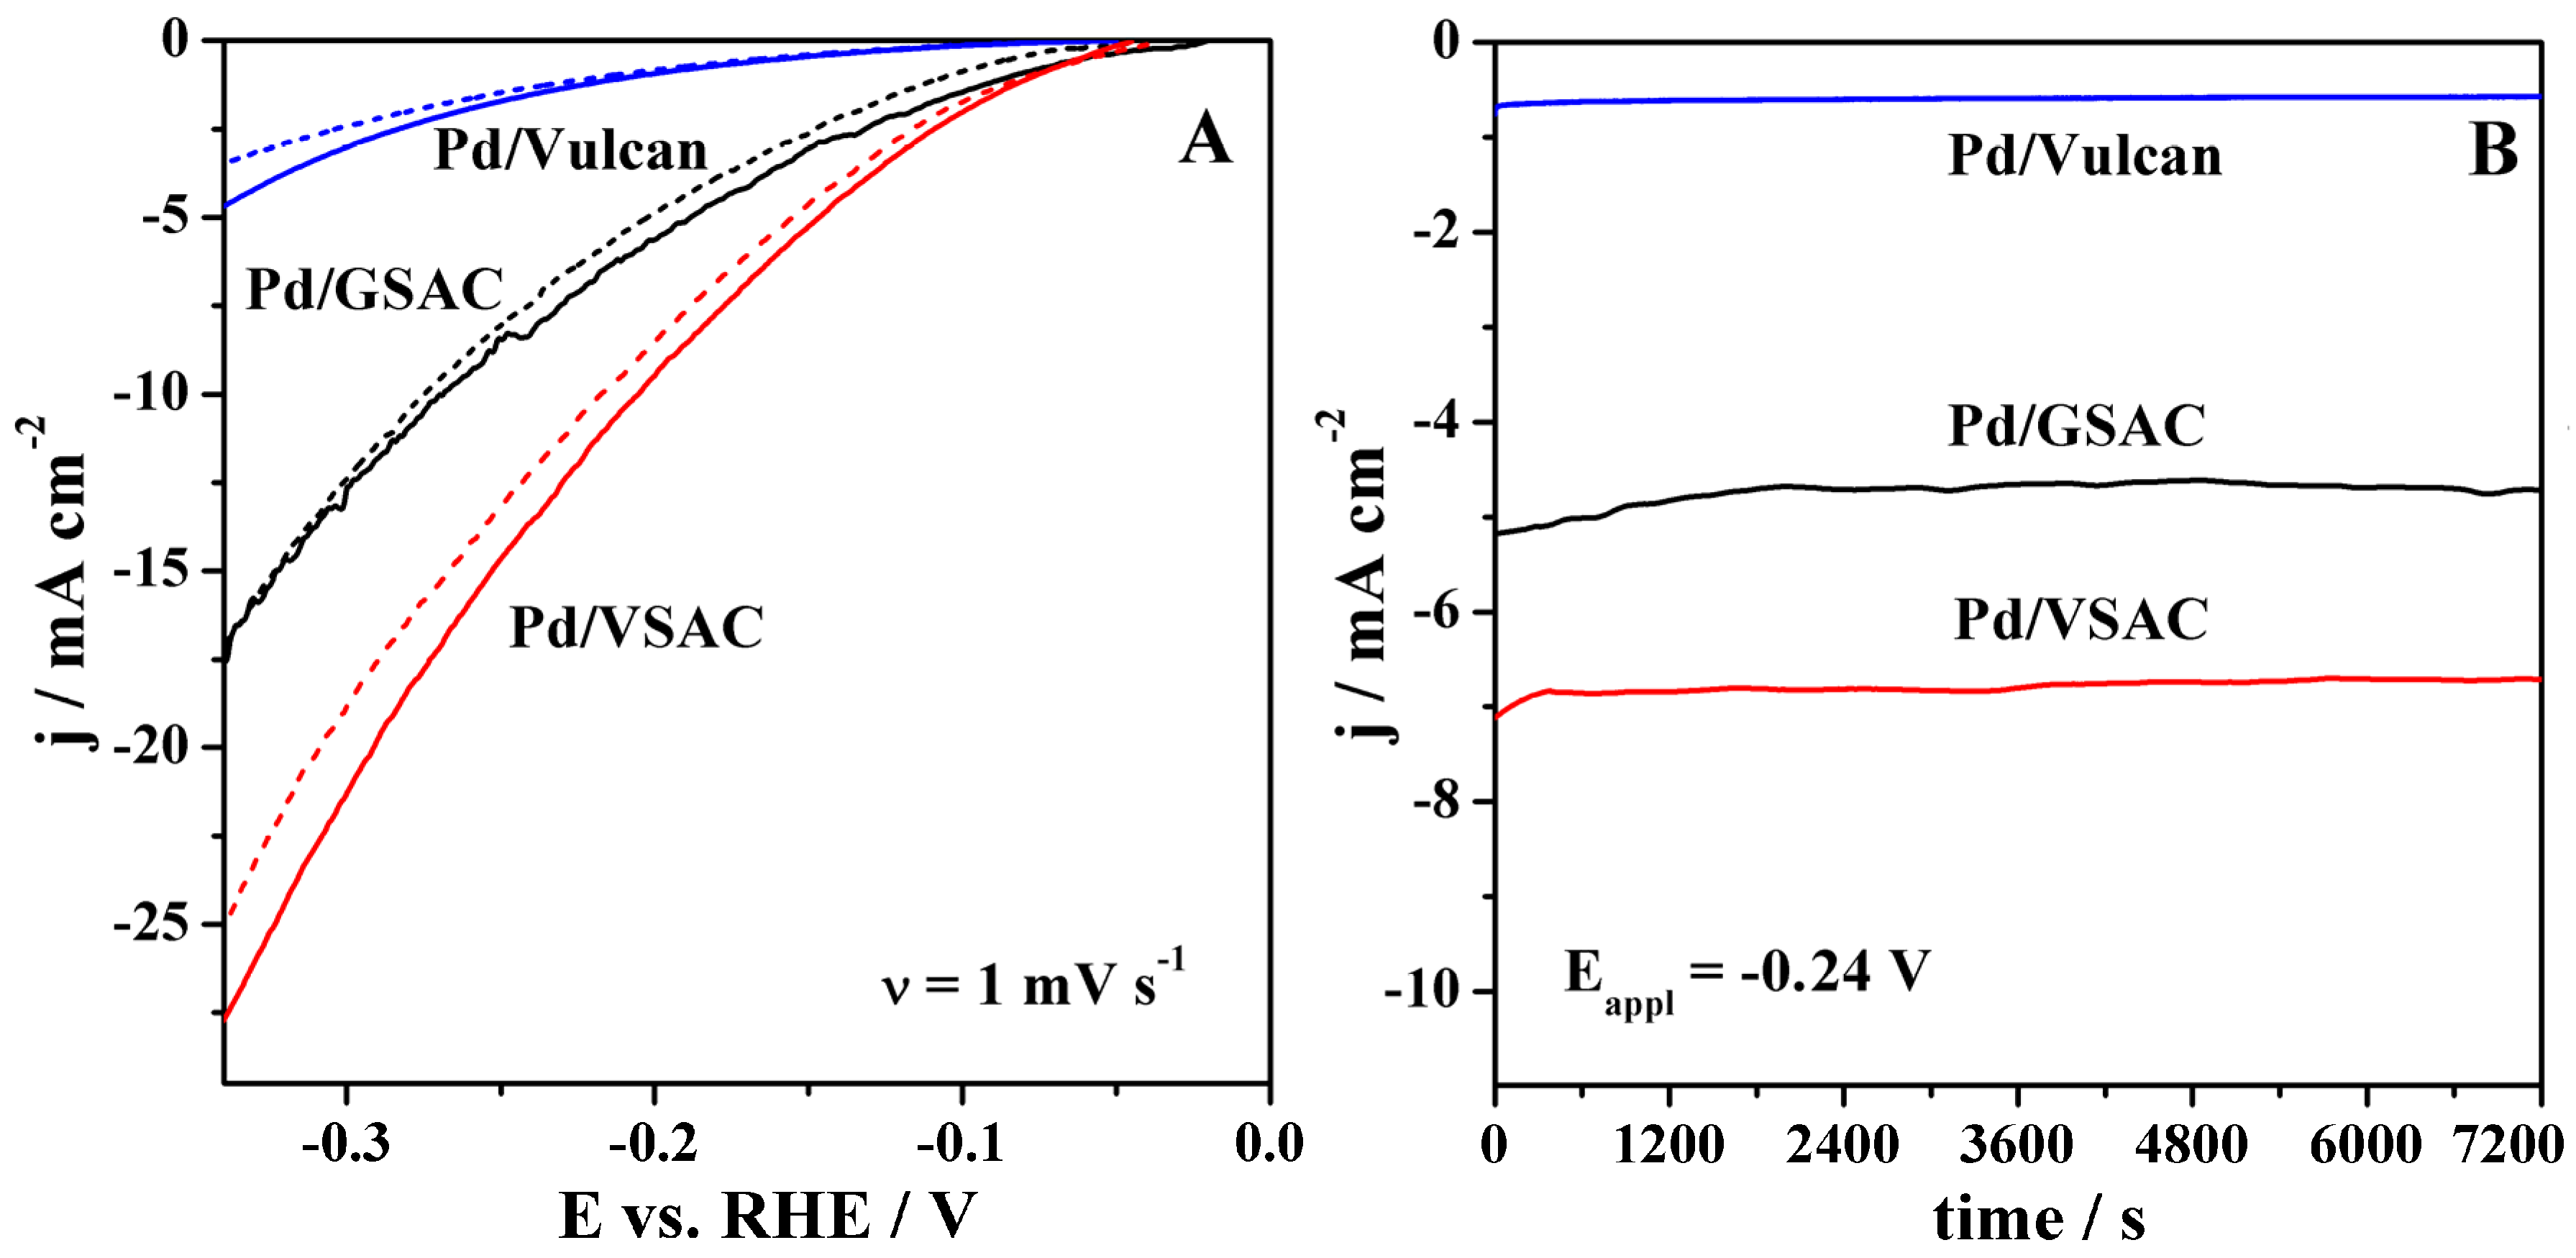
Besides a high activity for the HER, the stability of the electrodes operating under water electrolysers’ harsh conditions is one of the key parameters when choosing the electrode material. The stability of the herein-studied electrocatalysts’ activity was evaluated first by continuous cycling for 3000 cycles. Figure 5A shows the LSVs of the three materials recorded at 1 mV s−1 before and after this continuous cycling, revealing the electrocatalysts’ stable activity, with a slight decrease of current densities in the cases of Pd/VSAC and Pd/Vulcan. Furthermore, the stability of the electrode activity was evaluated by recording CA curves for 2 h (Figure 5B). Current densities remained constant during the whole period. Again, LSVs were recorded before and after CA study and showed unchanged current densities (not shown). Optical observations before and after the stability tests did not show any modifications nor characteristics of poor stability of the prepared electrodes.
The VSAC bio-based carbon tested herein has led to interesting results, which make it a promising candidate as a support for HER electrocatalysts.
3. Experimental
3.1. Preparation and Characterisation of Bio-Based Activated Carbon Supports
Activated bio-based carbons (VSAC and GSAC) were prepared following the procedure described in our previous papers [27,28]. Namely, the chemical activation synthesis method was used as this method normally leads to carbons of higher surface area than those obtained by the physical activation method. In the chemical activation method, raw material (dried vine shoots (VS) and grape stalks (GS), in this case) is impregnated with a suitable activation reagent (herein, ZnCl2 was used) and heated in an inert atmosphere. Thus, VS and GS were first impregnated with ZnCl2 (Merck, Darmstadt, Germany) in ZnCl2/VS and ZnCl2/GS weight ratios of 2 by shaking for 24 and 36 h, respectively. ZnCl2 acts as a dehydrating agent that influences pyrolytic decomposition and inhibits the formation of tar. These impregnated materials were dried at 105 °C for 24 h. They were subsequently activated by heating up to 700 °C at a rate of 20 °C min−1 in a reactor under CO2 flow and held at that temperature for 120 min. The activated bio-based carbon samples were washed with 3 M HCl (Merck, Darmstadt, Germany) to remove the Zn compounds and then with cold distilled water until the pH of the waste water was neutral. Finally, the samples were dried at 105 °C for 24 h.
The prepared samples were characterised by BET surface area, total pore volume, and pore size (Micromeritics ASAP 2020, Micromeritics Instrument Corporation, Norcross, GA, USA), quantitative surface functional group analysis by Boehm’s titration [40], elemental analysis (LECO CHNS 932 Elemental Analyser, LECO Corporation; Saint Joseph, MI, USA), point zero charge (pHpzc) [29], and scanning electron microscopy with energy dispersive X-ray (SEM-EDX, JEOL/JSM-6510 LV, JEOL Ltd., Tokyo, Japan) analysis for the surface morphology and composition.
The specific surface area, total pore volume, and pore size of the samples were determined using N2 adsorption/desorption isotherm data at 77 K. The samples were first degassed at 300 °C for 16 h and then analysed. The BET surface area values were calculated from the linear fit of the Brunauer–Emmett–Teller (BET) equation to the relative pressure (P/P0) range of 0.05–0.20. The total pore volume (VT) was derived from the amount of N2 adsorbed at relative pressure (P/P0) of 0.99. The pore size was calculated from the relation 4VT/BET surface area. All calculations for determining the BET surface area, total pore volume, and pore size were performed using ASAP 2020 software integrated to the surface identification device.
3.2. Preparation and Characterisation of Activated Carbon-Supported Pd Nanoparticles
Oleylamine (OAm)-mediated synthesis was used to prepare monodispersed Pd NPs following a protocol described in the literature [41]. In a four-neck glass reactor under nitrogen flow, 0.25 mmol of palladium acetylacetonate (Pd(acac)2, Sigma-Aldrich, 99%, St. Louis, MO, USA) was dissolved in 10 mL of OAm (Sigma-Aldrich, 70%), and then heated at 60 °C by using a thermocouple temperature-controlled system for 10 min. A quantity of 0.015 g of borane tert-butylamine complex (97%, 180211 Aldrich) dissolved in 3 mL of OAm was then added to the mixture, still at 60 °C, which acquired a dark brown colour, indicating the formation of the Pd NPs. This solution was then heated at 90 °C for 60 min and then cooled down to 40 °C. The cooled solution was divided in two centrifuged tubes with 40 mL of ethanol added to each of them and subjected to centrifugation at 8500 rpm for 12 min. After that, the NPs, which were stuck to the tube walls, were redispersed in hexane. The prepared activated bio-based carbon supports were then added to the hexane NP dispersion. In order to ensure that there was complete adherence of the NPs to the supports, the resulting dispersion was sonicated for 2 h. Once the hexane evaporated, surfactants were removed from the surface of the Pd NPs by adding acetic acid to the mixture and holding it at 70 °C for 10 h. Following cooling, ethanol was twice added to the dispersion which was then centrifuged. Finally, Pd NPs supported on the activated bio-based carbons were recovered by adding acetone and leaving it to evaporate. For comparison purposes, Pd was also anchored in commercial Vulcan XC72 (Cabot Corporation, Boston, MA, USA) following the same procedure.
The structure of the carbon-supported Pd electrocatalysts was examined by XRD using a Rigaku RadB Dmax X-ray diffractometer (Rigaku Corporation, Tokyo, Japan) with Cu Kα radiation within a 2–80° 2θ range with a 0.02° step at a rate of 6° min−1. Their morphology and composition were examined by SEM-EDX using a JEOL/JSM-6510 LV and by transmission electron microscopy (TEM) using a HITACHI H-8100 microscope (Hitachi, Ltd. Corporation, Tokyo, Japan).
3.3. Electrode Preparation
The catalytic inks were prepared by mixing 5 mg of the corresponding Pd–bio-based carbon powder electrocatalyst (Pd/GSAC or Pd/VSAC) in 125 μL of 2% polyvinylidene difluoride (PVDF, Alfa Aesar) solution in N-methyl-2-pyrrolidone (NMP, Sigma–Aldrich). A quantity of 1 µL of this solution was deposited onto the surface of a glassy carbon disc electrode of 0.07 cm2 surface area. The electrodes were then left overnight in the oven at a temperature of 80 °C in order to dry and promote the adhesion of the electrocatalytic ink to their surface.
3.4. Electrochemical Measurements
A conventional three-electrode setup with an ALS/DY 2325 bipotentiostat (BAS-Inc., Tokyo, Japan) was used for the electrochemical characterisation of the prepared electrodes. The Pd–bio-based carbon electrodes were used as the working electrodes, the counter electrode was a Pt coil (BAS Inc., Tokyo, Japan), and the reference electrode was a saturated calomel electrode (SCE, Hannah Instruments, HI 5412, Winslet, RI, USA). In order to convert the measured potential values to the reversible hydrogen electrode (RHE) scale, a standard procedure [42] was carried out, where the potential value (−1.16 V vs. SCE) at which the Pt electrode crosses zero current was found by linear scan voltammetry at 10 mV s−1. This measured value was used in the formula ERHE = ESCE + 1.16 V. Thus, all potential values in the paper are given relative to RHE. The 8 M KOH (AnalaR NORMAPUR, 87 wt %) electrolyte solution was prepared with Millipore water. This concentration corresponds to ca. 34 wt %, which is identical to the KOH concentration commonly used in industrial alkaline electrolysers.
Electrochemical characterisation of the electrocatalysts was performed by recording cyclic voltammograms in N2-saturated electrolyte solution in the −0.06 to 1.36 V potential range at a scan rate of 50 mV s−1.
The evaluation of HER kinetics at the electrodes was done by linear scan voltammetry measurements in 8 M KOH solution, starting from the open circuit potential (OCP) up to −0.34 V, at a scan rate of 1 mV s−1. Chronoamperometry measurements were carried out at three applied potentials (−0.14 V, −0.24 V, and −0.34 V). Measurements were carried out at temperatures ranging from 25 to 85 °C, at 10 °C intervals. Temperature was controlled by water circulation with an Ultraterm 6000383 P-Selecta bath (J.P. SELECTA S.A., Barcelona, Spain). Stability of the electrodes was evaluated by continuous cycling for 3000 cycles in the range from the OCP up to −0.34 V at scan rate of 100 mV s−1 and by recording chronoamperometry curves at potential of −0.24 V for 2 h.
4. Conclusions
Two novel activated bio-based carbon-supported Pd NP electrocatalysts and a Vulcan XC72-supported Pd NP electrocatalyst were studied for their applicability for HER in typical alkaline water electrolysis conditions. Of the three supports studied, VSAC-supported electrocatalysts showed promising results in terms of high current densities at low overpotentials. The HER Tafel slopes of the Pd/GSAC, Pd/VSAC, and Pd/Vulcan XC72 at 25 °C were evaluated to be 0.163, 0.144, and 0.105 V dec−1, respectively. The respective exchange current densities were 0.13, 0.22, and 0.01 mA cm−2 at 25 °C, while being as high as 1.48, 5.02, and 0.11 mA cm−2 at 85 °C. The activation energies were also determined and found to be 45, 38, and 44 kJ mol−1 for the Pd/GSAC, Pd/VSAC, and Pd/Vulcan XC72, respectively. These results show a clear advantage of the VSAC-supported electrocatalyst toward the HER when compared with the other two catalysts. Promising features of the studied material pointed out within this work suggest that Pd NPs supported on VSAC as a novel bio-based carbon support may be a potential alternative as electrodes for the production of H2 by alkaline water electrolysis.
Supplementary Materials
The following are available online at https://www.mdpi.com/2073-4344/8/2/50/s1, Figure S1: Polarisation curves recorded at scan rate of 1 mV s#x2212;1 in 8 M KOH solution at different temperatures (25–85 ℃) and corresponding Tafel plots for Pd/GSAC (A,B), Pd/VSAC (C,D) and Pd/Vulcan (E,F).
Acknowledgments
The authors would like to thank Fundação para a Ciência e a Tecnologia (FCT, Portugal) for postdoctoral research grant no. SFRH/BPD/77768/2011 (B. Šljukić) and for contract no. IF/01084/2014/CP1214/CT0003 under IF2014 Programme (D.M.F. Santos).
Author Contributions
M. Erdem and C.A.C. Sequeira conceived and designed the experiments; J.A.S.B. Cardoso performed the experiments; B. Šljukić analysed the data; D.M.F. Santos wrote the paper.
Conflicts of Interest
The authors declare no conflict of interest.
References
- Höök, M.; Tang, X. Depletion of fossil fuels and anthropogenic climate change—A review. Energy Policy 2003, 52, 797–809. [Google Scholar] [CrossRef]
- Safavi, A.; Kazemi, S.H.; Kazemi, H. Electrocatalytic behaviors of silver–palladium nanoalloys modified carbon ionic liquid electrode towards hydrogen evolution reaction. Fuel 2014, 118, 156–162. [Google Scholar] [CrossRef]
- Dixon, R.K. Advancing towards a hydrogen energy economy: Status, opportunities and barriers. Mitig. Adapt. Strateg. Glob. Chang. 2007, 12, 325–341. [Google Scholar] [CrossRef]
- Marini, S.; Salvi, P.; Nelli, P.; Pesenti, R.; Villa, M.; Berrettoni, M.; Zangari, G.; Kiros, Y. Advanced alkaline water electrolysis. Electrochim. Acta 2012, 82, 384–391. [Google Scholar] [CrossRef]
- Santos, D.M.F.; Sequeira, C.A.C.; Figueiredo, J.L. Hydrogen production by alkaline water electrolysis. Quim. Nova 2013, 36, 1176–1193. [Google Scholar] [CrossRef]
- Safizadeh, F.; Ghali, E.; Houlachi, G. Electrocatalysis developments for hydrogen evolution reaction in alkaline solutions—A review. Int. J. Hydrogen Energy 2015, 40, 256–274. [Google Scholar] [CrossRef]
- Sawyer, D.T.; Sobkowiak, A.; Roberts, J.L. Electrochemistry for Chemists, 2nd ed.; John Wiley & Sons: New York, NY, USA, 1995. [Google Scholar]
- Zinola, C.F.; Martins, M.E.; Tejera, E.P.; Neves, N.P., Jr. Electrocatalysis: Fundamentals and Applications. Int. J. Electrochem. 2012, 2012, 874687. [Google Scholar] [CrossRef]
- Santos, D.M.F.; Šljukić, B.; Sequeira, C.A.C.; Macciò, D.; Saccone, A.; Figueiredo, J.L. Electrocatalytic approach for the efficiency increase of electrolytic hydrogen production: Proof-of-concept using Pt-Dy. Energy 2013, 50, 486–492. [Google Scholar] [CrossRef]
- Yang, L.; Liu, P.; Li, J.; Xiang, B. Two-dimensional material molybdenum disulfides as electrocatalysts for hydrogen evolution. Catalysts 2017, 7, 285. [Google Scholar] [CrossRef]
- Eftekhari, A. Electrocatalysts for hydrogen evolution reaction. Int. J. Hydrogen Energy 2017, 42, 11053–11077. [Google Scholar] [CrossRef]
- Šljukić, B.; Santos, D.M.F.; Vujković, M.; Amaral, L.; Rocha, R.P.; Sequeira, C.A.C.; Figueiredo, J.L. Molybdenum Carbide Nanoparticles on Carbon Nanotubes and Carbon Xerogel: Low-Cost Cathodes for Hydrogen Production by Alkaline Water Electrolysis. ChemSusChem 2016, 9, 1200–1208. [Google Scholar] [CrossRef] [PubMed]
- Wang, J.; Chen, W.; Wang, X.; Wang, E. N-doped graphene supported WxC composite material as an efficient non-noble metal electrocatalyst for hydrogen evolution reaction. Electrochim. Acta 2017, 251, 660–671. [Google Scholar] [CrossRef]
- Li, C.; Bo, X.; Li, M.; Guo, L. Facile electrodeposition fabrication of molybdenum-tungsten sulfide on carbon cloth for electrocatalytic hydrogen evolution. Int. J. Hydrogen Energy 2017, 42, 15479–15488. [Google Scholar] [CrossRef]
- Gupta, U.; Rao, C.N.R. Hydrogen generation by water splitting using MoS2 and other transition metal dichalcogenides. Nano Energy 2017, 41, 49–65. [Google Scholar] [CrossRef]
- Su, J.; Zhou, J.; Wang, L.; Liu, C.; Chen, Y. Synthesis and application of transition metal phosphides as electrocatalyst for water splitting. Sci. Bull. 2017, 62, 633–644. [Google Scholar] [CrossRef]
- Pi, M.; Wu, T.; Guo, W.; Wang, X.; Chen, S. Phase-controlled synthesis of polymorphic tungsten diphosphide with hybridization of monoclinic and orthorhombic phases as a novel electrocatalyst for efficient hydrogen evolution. J. Power Sources 2017, 349, 138–143. [Google Scholar] [CrossRef]
- Wang, C.; Zhang, P.; Lei, J.; Dong, W.; Wang, J. Integrated 3D MoSe2@Ni0.85Se nanowire network with synergistic cooperation as highly efficient electrocatalysts for hydrogen evolution reaction in alkaline medium. Electrochim. Acta 2017, 246, 712–719. [Google Scholar] [CrossRef]
- Zeng, M.; Li, Y. Recent advances in heterogeneous electrocatalysts for hydrogen evolution reaction. J. Mater. Chem. 2015, 3, 14942–14962. [Google Scholar] [CrossRef]
- Bhowmik, T.; Kundu, M.K.; Barman, S. Palladium nanoparticle-graphitic carbon nitride porous synergistic catalyst for hydrogen evolution/oxidation reactions over a broad range of pH correlation of its catalytic activity with measured hydrogen binding energy. ACS Catal. 2016, 6, 1929–1941. [Google Scholar] [CrossRef]
- Limpattayanate, S.; Hunson, M. Electrocatalytic activity of Pt-Pd electrocatalysts for the oxygen reaction in proton exchange membrane fuel cells: Effect of supports. Renew. Energy 2014, 63, 205–211. [Google Scholar] [CrossRef]
- Banadaki, A.D.; Amir, K. Recent advances in facile synthesis of bimetallic nanostructures: An overview. J. Nanomater. 2014, 2014, 985948. [Google Scholar]
- Tong, S.-S.; Wang, X.-J.; Li, Q.-C.; Han, X.-J. Progress on electrocatalysts of hydrogen evolution reaction based on carbon fiber materials. Chin. J. Anal. Chem. 2016, 44, 1447–1457. [Google Scholar] [CrossRef]
- Zhou, W.; Jia, J.; Lu, J.; Yang, L.; Hou, D.; Li, G.; Chen, S. Recent developments of carbon-based electrocatalysts for hydrogen evolution reaction. Nano Energy 2016, 28, 29–43. [Google Scholar] [CrossRef]
- Martins, M.; Šljukić, B.; Sequeira, C.A.C.; Metin, Ö.; Erdem, M.; Şener, T.; Santos, D.M.F. Biobased carbon-supported palladium electrocatalysts for borohydride fuel cells. Int. J. Hydrogen Energy 2016, 41, 10914–10922. [Google Scholar] [CrossRef]
- Sanders, I.J.; Peeten, T.L. Carbon Black: Production, Properties and Uses; Nova Science Publisher Inc.: New York, NY, USA, 2011. [Google Scholar]
- Erdem, M.; Orhan, R.; Şahin, M.; Aydın, E. Preparation and characterization of a novel activated carbon from vine shoots by ZnCl2. Water Air Soil Pollut. 2016, 227, 1–14. [Google Scholar] [CrossRef]
- Ozdemir, I.; Sahin, M.; Orhan, R.; Erdem, M. Preparation and characterization of activated carbon from grape stalk by zinc chloride activation. Fuel Process. Technol. 2014, 125, 4588–4589. [Google Scholar] [CrossRef]
- Mall, I.; Srivastava, V.; Kumar, G.; Mishra, I. Characterization and utilization of mesoporous fertilizer plant waste carbon for adsorptive removal of dyes from aqueous solution. Colloid Surf. A 2006, 278, 175–187. [Google Scholar] [CrossRef]
- Green, T.; Britz, D. Kinetics of the deuterium and hydrogen evolution reactions at palladium in alkaline solution. J. Electroanal. Chem. 1996, 412, 59–66. [Google Scholar] [CrossRef]
- Cardoso, J.A.S.B.; Amaral, L.; Metin, O.; Cardoso, D.S.P.; Sevim, M.; Sener, T.; Sequeira, C.A.C.; Santos, D.M.F. Reduced graphene oxide assembled Pd-based nanoalloys for hydrogen evolution reaction. Int. J. Hydrogen Energy 2017, 42, 3916–3925. [Google Scholar] [CrossRef]
- Vasić, M.; Čebela, M.; Pašti, I.; Amaral, L.; Hercigonja, R.; Santos, D.M.F.; Šljukić, B. Efficient hydrogen evolution electrocatalysis in alkaline medium using Pd-modified zeolite X. Electrochim. Acta 2018, 259, 882–892. [Google Scholar] [CrossRef]
- Sequeira, C.A.C.; Santos, D.M.F.; Šljukić, B.; Amaral, L. Physics of electrolytic gas evolution. Braz. J. Phys. 2013, 43, 199–208. [Google Scholar] [CrossRef]
- Santos, D.M.F.; Amaral, L.; Šljukić, B.; Macciò, D.; Saccone, A.; Sequeira, C.A.C. Electrocatalytic activity of nickel-cerium alloys for hydrogen evolution in alkaline electrolysis. J. Electrochem. Soc. 2014, 161, F386–F390. [Google Scholar] [CrossRef]
- Pluntke, Y.; Kibler, L.A. Hydrogen evolution electrocatalysts on AgPd(111) alloys. Electrocatalysis 2011, 2, 192–199. [Google Scholar] [CrossRef]
- Pierozynski, B.; Mikolajczyk, T.; Turemko, M.; Czerwosz, E.; Kozlowski, M. Hydrogen evolution reaction at Pd-modified carbon fibre in 0.1 M NaOH. Int. J. Hydrogen Energy 2015, 40, 1795–1799. [Google Scholar] [CrossRef]
- Pierozynski, B. Hydrogen evolution reaction at Pd-modified carbon fibre and nickel-coated carbon fibre materials. Int. J. Hydrogen Energy 2013, 38, 7733–7740. [Google Scholar] [CrossRef]
- Chen, J.; Chen, J.; Yu, D.; Zhang, M.; Zhu, H.; Du, M. Carbon nanofiber-supported PdNi alloy nanoparticles as highly bifunctional catalysts for hydrogen and oxygen evolution reactions. Electrochim. Acta 2017, 246, 17–26. [Google Scholar] [CrossRef]
- Durst, J.; Simon, C.; Hasché, F.; Gasteiger, H.A. Hydrogen oxidation and evolution reaction kinetics on carbon supported Pt, Ir, Rh, and Pd electrocatalysts in acidic media. J. Electrochem. Soc. 2015, 162, F190–F203. [Google Scholar] [CrossRef]
- Boehm, H.P. Surface oxides on carbon and their analysis: A critical assessment. Carbon 2002, 40, 145–149. [Google Scholar] [CrossRef]
- Mazumder, V.; Sun, S. Oleylamine-mediated synthesis of Pd nanoparticles for catalytic formic acid oxidation. J. Am. Chem. Soc. 2009, 131, 4588–4589. [Google Scholar] [CrossRef] [PubMed]
- Sanetuntikul, J.; Hang, T.; Shanmugam, S. Hollow nitrogen-doped carbon spheres as efficient and durable electrocatalysts for oxygen reduction. Chem. Commun. 2014, 50, 9473–9476. [Google Scholar] [CrossRef] [PubMed]
Figure 1.
SEM images of (A) vine shoot activated carbon (VSAC) and (B) grape stalk activated carbon (GSAC) support materials [27,28].

Figure 2.
(A) XRD along with SEM and TEM images and EDX data of (B,C,D) Pd/VSAC, (E,F,G) Pd/GSAC, and (H,I,J) Pd/Vulcan. Particle size distribution histograms are shown as insets.
Figure 2.
(A) XRD along with SEM and TEM images and EDX data of (B,C,D) Pd/VSAC, (E,F,G) Pd/GSAC, and (H,I,J) Pd/Vulcan. Particle size distribution histograms are shown as insets.

Figure 3.
(A) Cyclic voltammetry curve of Pd/Vulcan in deaerated electrolyte solution; (B) Polarisation curves of Pd/GSAC, Pd/VSAC, and Pd/Vulcan at scan rate of 1 mV s−1 with corresponding mass-specific current densities shown as inset; (C) Polarisation curves of Pd/VSAC at different temperatures and the corresponding Tafel plots as inset; (D) Arrhenius plots for the three tested hydrogen evolution reaction (HER) electrocatalysts. All experiments done in 8 M KOH at room temperature, unless otherwise noted.

Figure 4.
Chronoamperometry measurements in 8 M KOH of the three electrocatalysts at −0.14 V and temperature of (A) 25 °C and (B) 85 °C; of (C) Pd/VSAC at potentials of −0.14, −0.24, and −0.34 V and temperature of 25 °C; and of (D) Pd/GSAC at −0.14 V and temperatures ranging from 25 to 85 °C.
Figure 4.
Chronoamperometry measurements in 8 M KOH of the three electrocatalysts at −0.14 V and temperature of (A) 25 °C and (B) 85 °C; of (C) Pd/VSAC at potentials of −0.14, −0.24, and −0.34 V and temperature of 25 °C; and of (D) Pd/GSAC at −0.14 V and temperatures ranging from 25 to 85 °C.
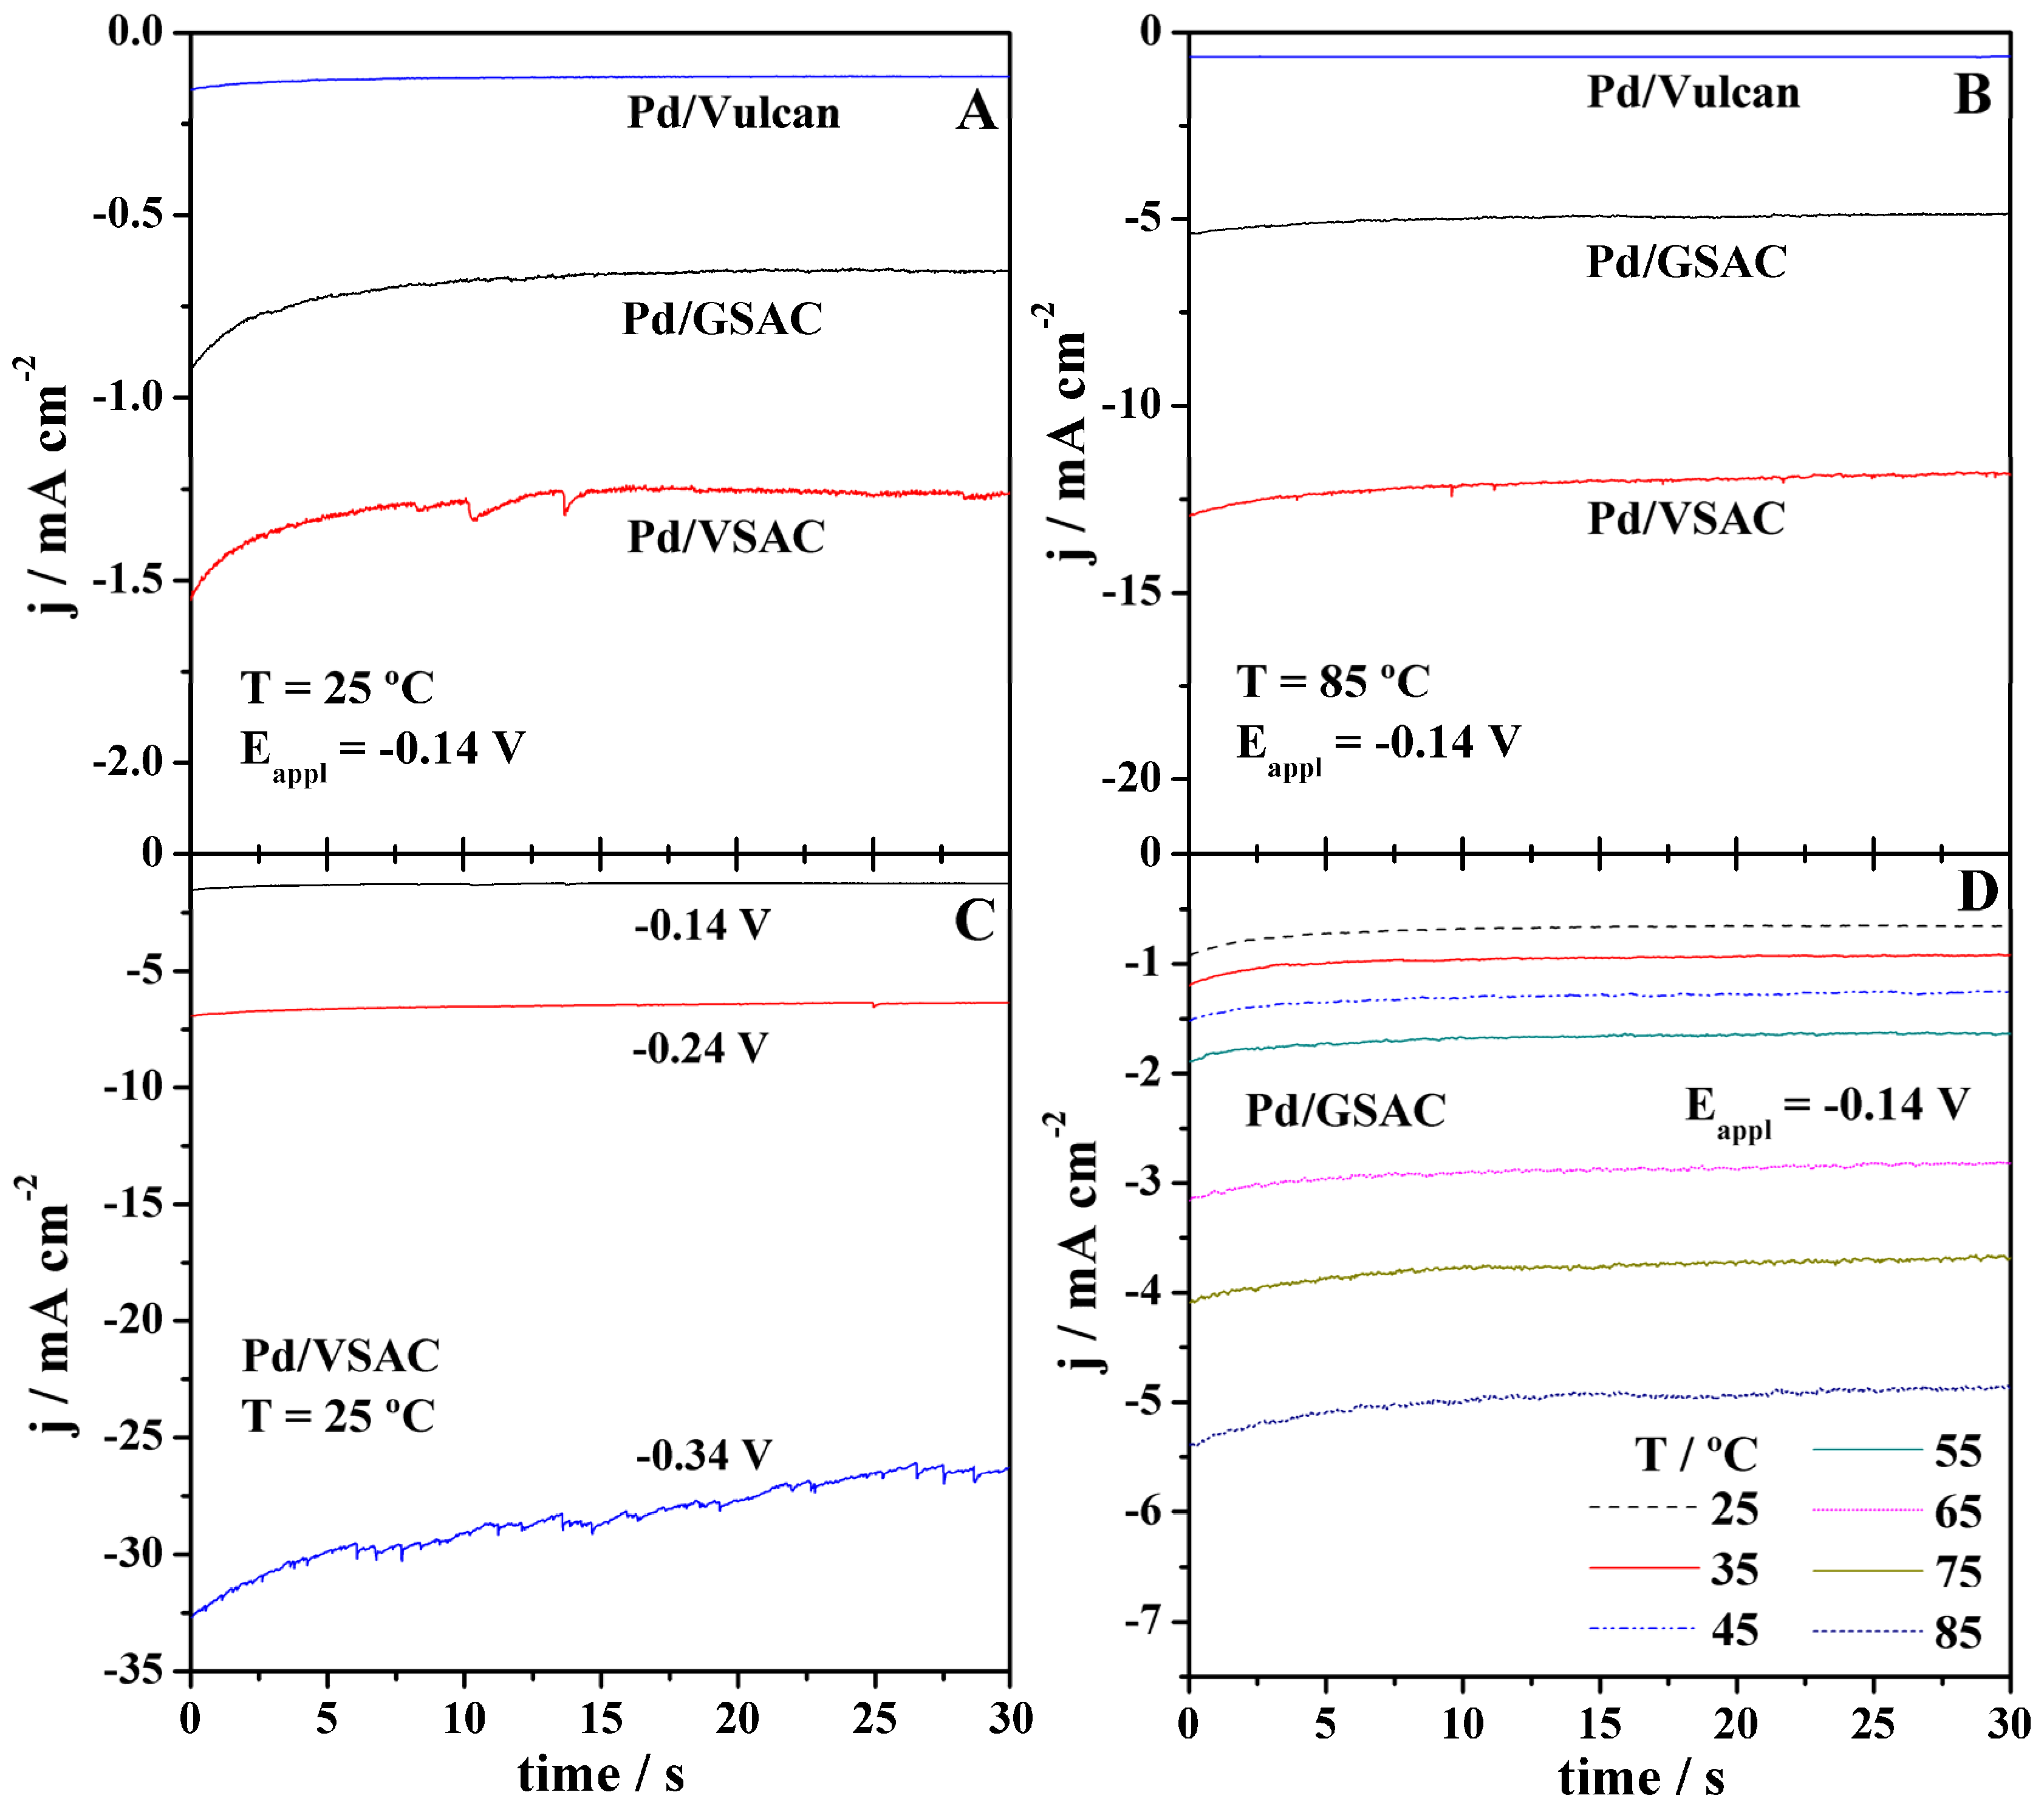
Figure 5.
Stability behaviour of the electrocatalysts in 8 M KOH at room temperature evaluated by (A) cathodic polarisation curves run at 1 mV s−1 before (full lines) and after (dashed lines) 3000 consecutive cycles at 100 mV s−1 and (B) 2 h stability tests at potential of −0.24 V.
Figure 5.
Stability behaviour of the electrocatalysts in 8 M KOH at room temperature evaluated by (A) cathodic polarisation curves run at 1 mV s−1 before (full lines) and after (dashed lines) 3000 consecutive cycles at 100 mV s−1 and (B) 2 h stability tests at potential of −0.24 V.


Table 1.
Textural characteristics of the three carbon supports.
| Support Material | BET Surface Area/m2 g−1 | Total Pore Volume/cm3 g−1 | Pore Size/nm |
|---|---|---|---|
| VSAC | 1689 | 0.84 | 1.9 |
| GSAC | 1411 | 0.72 | 2.1 |
| Vulcan | 224 | 0.47 | 11 |
Table 2.
HER kinetic parameters calculated for the three tested electrocatalysts.
| Electrode | T/°C | α | b/V dec−1 | j0/mA cm−2 | j0.1 */mA cm−2 | η10 **/V |
|---|---|---|---|---|---|---|
| Pd/GSAC | 25 | 0.36 | 0.163 | 0.13 | 0.76 | 0.299 |
| 35 | 0.36 | 0.168 | 0.17 | 0.96 | 0.281 | |
| 45 | 0.35 | 0.178 | 0.29 | 1.27 | 0.269 | |
| 55 | 0.34 | 0.190 | 0.40 | 1.70 | 0.256 | |
| 65 | 0.31 | 0.213 | 0.71 | 2.83 | 0.222 | |
| 75 | 0.30 | 0.230 | 1.16 | 3.54 | 0.203 | |
| 85 | 0.34 | 0.208 | 1.48 | 4.64 | 0.171 | |
| Pd/VSAC | 25 | 0.41 | 0.144 | 0.22 | 1.43 | 0.224 |
| 35 | 0.41 | 0.148 | 0.37 | 2.02 | 0.207 | |
| 45 | 0.40 | 0.156 | 0.63 | 3.04 | 0.185 | |
| 55 | 0.39 | 0.165 | 1.04 | 4.50 | 0.158 | |
| 65 | 0.36 | 0.185 | 1.99 | 7.69 | 0.111 | |
| 75 | 0.36 | 0.192 | 2.29 | 8.90 | 0.109 | |
| 85 | 0.34 | 0.207 | 5.02 | 12.6 | 0.085 | |
| Pd/Vulcan | 25 | 0.56 | 0.105 | 0.01 | 0.10 | >0.3 |
| 35 | 0.44 | 0.137 | 0.03 | 0.18 | >0.3 | |
| 45 | 0.39 | 0.162 | 0.05 | 0.28 | >0.3 | |
| 55 | 0.37 | 0.175 | 0.07 | 0.39 | >0.3 | |
| 65 | 0.38 | 0.189 | 0.11 | 0.62 | >0.3 | |
| 75 | 0.35 | 0.194 | 0.15 | 0.69 | >0.3 | |
| 85 | 0.34 | 0.202 | 0.16 | 0.55 | >0.3 |
* j0.1 and ** η10 stand for the current density at overpotential of 0.1 V and for the overpotential at 10 mA cm−2, respectively.
© 2018 by the authors. Licensee MDPI, Basel, Switzerland. This article is an open access article distributed under the terms and conditions of the Creative Commons Attribution (CC BY) license (http://creativecommons.org/licenses/by/4.0/).
Share and Cite
MDPI and ACS Style
Cardoso, J.A.S.B.; Šljukić, B.; Erdem, M.; Sequeira, C.A.C.; Santos, D.M.F. Vine Shoots and Grape Stalks as Carbon Sources for Hydrogen Evolution Reaction Electrocatalyst Supports. Catalysts 2018, 8, 50. https://doi.org/10.3390/catal8020050
AMA Style
Cardoso JASB, Šljukić B, Erdem M, Sequeira CAC, Santos DMF. Vine Shoots and Grape Stalks as Carbon Sources for Hydrogen Evolution Reaction Electrocatalyst Supports. Catalysts. 2018; 8(2):50. https://doi.org/10.3390/catal8020050
Chicago/Turabian StyleCardoso, J.A.S.B., B. Šljukić, M. Erdem, C.A.C. Sequeira, and D.M.F. Santos. 2018. "Vine Shoots and Grape Stalks as Carbon Sources for Hydrogen Evolution Reaction Electrocatalyst Supports" Catalysts 8, no. 2: 50. https://doi.org/10.3390/catal8020050
Note that from the first issue of 2016, this journal uses article numbers instead of page numbers. See further details here.