Article

In Situ UV-Visible Assessment of Iron-Based High-Temperature Water-Gas Shift Catalysts Promoted with Lanthana: An Extent of Reduction Study

1
Department of Chemical Engineering, Ira A. Fulton School of Engineering and Technology, Brigham Young University, 350 CB, Provo, UT 84602, USA
2
Brookhaven National Laboratory, NSLS-II Building 743, Upton, NY 11973, USA
3
Department of Chemistry and Biochemistry, College of Physical and Mathematical Sciences, Brigham Young University, C209 BNSN, Provo, UT 84602, USA
*
Author to whom correspondence should be addressed.
Current address: Phillips 66, US Highway 60 & State Highway 123, Bartlesville, OK 74003, USA.
Current address: Micron Technology, 8000 S. Federal Way, P.O. Box 6, Boise, ID 83707, USA.
Catalysts 2018, 8(2), 63; https://doi.org/10.3390/catal8020063
Submission received: 22 December 2017 / Revised: 26 January 2018 / Accepted: 29 January 2018 / Published: 4 February 2018

Abstract

:
The extent of reduction of unsupported iron-based high-temperature water-gas shift catalysts with small (<5 wt %) lanthana contents was studied using UV-visible spectroscopy. Temperature- programmed reduction measurements showed that lanthana content higher than 0.5 wt % increased the extent of reduction to metallic Fe, while 0.5 wt % of lanthana facilitated the reduction to Fe3O4. In situ measurements on the iron oxide catalysts using mass and UV-visible spectroscopies permitted the quantification of the extent of reduction under temperature-programmed reduction and high-temperature water-gas shift conditions. The oxidation states were successfully calibrated against normalized absorbance spectra of visible light using the Kubelka-Munk theory. The normalized absorbance relative to the fully oxidized Fe2O3 increased as the extent of reduction increased. XANES suggested that the average bulk iron oxidation state during the water-gas shift reaction was Fe+2.57 for the catalyst with no lanthana and Fe+2.54 for the catalysts with 1 wt % lanthana. However, the UV-vis spectra suggest that the surface oxidation state of iron would be Fe+2.31 for the catalyst with 1 wt % lanthana if the oxidation state of iron in the catalyst with 0 wt % lanthana were Fe+2.57. The findings of this paper emphasize the importance of surface sensitive UV-visible spectroscopy for determining the extent of catalyst reduction during operation. The paper highlights the potential to use bench-scale UV-visible spectroscopy to study the surface chemistry of catalysts instead of less-available synchrotron X-ray radiation facilities.

1. Introduction

The water-gas shift (WGS) reaction is a critical industrial process for hydrogen production and for controlling carbon monoxide to hydrogen ratio in multiple chemical processes [1,2]. The reaction can be written as:
CO + H 2 O ( g )     CO 2 + H 2    Δ H ° 298 K = 41   kJ / mol
The exothemicity and reversibility of the WGS reaction lead it to be performed in 2 steps in industrial reactors: (1) high-temperature (HT) at ~400 °C and (2) low-temperature (LT) at ~220 °C, in order to minimize the CO concentration in the effluent gas stream. Industrial high-temperature (HT) WGS catalysts are typically 92 wt % Fe3O4/8 wt % Cr2O3 that serve as active and stable catalysts at reaction temperatures close to 400 °C [2]. Numerous research studies have been conducted on enhancing the stability and activity of these catalysts through the addition of promoters (such as Cu, Ce, Hg, Ag and Rh) that can stabilize the iron-chromium structure and provide additional active sites for the chemical reaction [3,4,5,6,7,8,9,10,11,12,13]. A previous study has shown that the addition of lanthana to Fe/Cr/Cu high-temperature (HT) water-gas shift (WGS) catalysts changes their temperature-programmed reduction profiles, generally causing more consumption of the reducing agent [10]. Previous studies also showed that lanthana increases the thermal stability and rate activity of perovskite-like unsupported chromium-free iron-based catalysts for the water-gas shift reaction and Co-based catalysts for the Fischer-Tropsch synthesis reaction [11,12,13]. Determining the oxidation states of metals on the surface of such catalysts is crucial for understanding the activity and stability patterns observed with variable promoters.
Operando spectroscopic techniques for surface analysis are critical characterization methods in the field of heterogeneous catalysis due to their sensitivity to changes in the surface chemistry of catalysts under operating conditions [14,15]. Applying UV-visible spectroscopy to characterize and quantify the extent of iron reduction (or the amount of active Fe3O4 phase) will help explain the activity pattern of the catalysts reported previously [10]. Previous UV-visible studies on vanadium-oxide catalysts for oxidative dehydrogenation of propane were performed and a calibration curve was formulated for extent of reduction as a function of normalized absorbance [16,17]. Weckhuysen and co-workers studied the dehydrogenation of isobutane over supported chromium oxide catalysts and were able to quantify surface reduced centers (Cr3+/Cr2+) using in situ UV-visible spectroscopy and relate them to the dehydrogenation activity [14]. Absorption bands in the UV region were observed due to ligand-to-metal charge transfer (LMCT) in which the metal cations were reduced by electron transfer from oxygen (O2−) species. Therefore, despite iron-based WGS catalysts appearing dark and unchanged in color to the unaided eye, absorbance of light over the visible (380–750 nm) and UV (<380 nm) regions are still responsive to electronic changes in oxidation states, or electronic occupation of d-orbitals, of surface Fe domains.
UV-visible diffuse reflectance spectroscopy is one technique that can be used to determine the extent of reduction of fully-oxidized catalysts by exposing them to a broad spectrum of UV and visible wavelengths [14,16,17,18,19,20,21,22]. While XANES/EXAFS studies require high-energy X-rays from synchrotron sources, UV-visible spectroscopy is easily performed in the lab at much lower cost. Operando UV-visible spectroscopy can provide new insight on surface electronic configurations that has potential as a new method to determine the extent of reduction of a fully oxidized catalyst, which affects the absorbance of light by the catalyst surface [14,15,16,17,18]. From previous work examining the edge and pre-edge absorption regions in UV-visible spectra, the pre-edge region is extremely sensitive to changes in oxidation state, while the edge region is not [16,17,19,23]. Determining the extent of reduction from near-edge features of the XANES spectra of these same catalysts was rendered unsuccessful due to overlapping features of the cationic spectra [16,17]. Therefore, the absorbance of UV-visible diffusely reflected light over the pre-edge region is used in this work to characterize the surface oxidation states of Fe. In addition, this technique can be used for other catalysts that undergo an oxidation-reduction cycle. The physical theory behind this phenomenon is that different oxidation states of the same metal have different band gaps and thus absorb light of different quantized energies [24,25,26,27,28]. The band gap for some iron oxide minerals falls in the range 2.0–2.5 eV (2.2 eV for hematite and 2.3 eV for wüstite), while that for magnetite is only 0.1 eV. (Conductive metals, including Fe, have no band bap because the Fermi level lies within the conduction band) [28,29,30]. The O(2p) ➔ Fe3+(3d) charge transfer requires 4.2–4.7 eV of energy [31].
Diffuse reflectance UV-visible data are frequently analyzed using a normalized absorbance, which is referred to as the Kubelka-Munk function, f ( R ) , as shown in Equation (2) [32,33],
f ( R ) = ( 1 R ) 2 2 R = K S
where R is the infinite reflectance (assuming the sample is infinitely thick) relative to a reference perfect reflector (powdered magnesium oxide or Teflon®), K is proportional to the absorbance coefficient ( k ) and S is proportional to the scattering coefficient ( s ). For this study, the reference was chosen as the fully oxidized catalyst to permit sensitive detection of changes in the oxidation state of the catalyst relative to this fully oxidized reference. The Kubelka-Munk function is based on scattering and absorption theory and is obtained by performing a shell balance on the flux of light moving in the downward direction ( I ) and in the upward direction ( J ) through differential distance dx and solving the resulting coupled differential equations shown below [34,35,36]:
dI dx = ( k + s ) I + sJ
dJ dx = ( k + s ) J sI
Kubelka-Munk theory assumes a continuous infinite medium and does not account for changes in particle size. A study by Christy et al. has modified the Kubelka-Munk equation to account for the inverse relationship with the size of particles [32]. Particle size distribution affects both scattering and absorbance terms [37,38].
Qualitatively, Kubelka-Munk values increase with increasing absorbance, which corresponds to a higher extent of reduction. F ( R ) can be correlated to the number of reduced centers by measuring the amount of oxygen required to return the catalyst to its fully oxidized state after it has been reduced.
Another powerful spectroscopic technique is X-ray absorption near edge structure (XANES) from which extent of metal reduction can be quantified by exposing the sample to highly energetic X-ray photons that are absorbed by core electrons, causing photoelectrons to be emitted at characteristic energies. The multiple scattering of the excited electrons specifies the spatial configuration of the atoms using extended X-ray absorption fine structure (EXAFS) analysis. Any changes in the distribution of charge around an atom of a given element produce shifts to the absorption edge regions caused by variations in the binding energies of the electrons [23,39]. Such methods, however, deemed to be complex and expensive to run when compared to bench-scale spectroscopic techniques.
In this paper, we show how ultraviolet-visible (UV-visible) spectroscopy can be used to augment and potentially replace XANES to evaluate oxidation states of heterogeneous catalysts. This technique is applied to characterizing the extent of reduction of HT WGS Fe/Cr/Cu catalysts with varying lanthana contents and is compared with XANES analysis of the same catalysts. This paper presents temperature-programmed reduction (TPR) profiles of iron WGS catalysts with varying amounts of lanthana and correlates them to in situ UV-visible absorbance measurements. The Kubelka-Munk function was used to calibrate the UV-visible response to extent of reduction (or oxidation state of iron) determined by the TPR profiles. The resultant calibration curves were applied to scans performed on operating WGS catalysts to determine the effect of lanthana on the extent of reduction of these catalysts. The conclusive results are compared with data acquired from XANES.

2. Results and Discussion

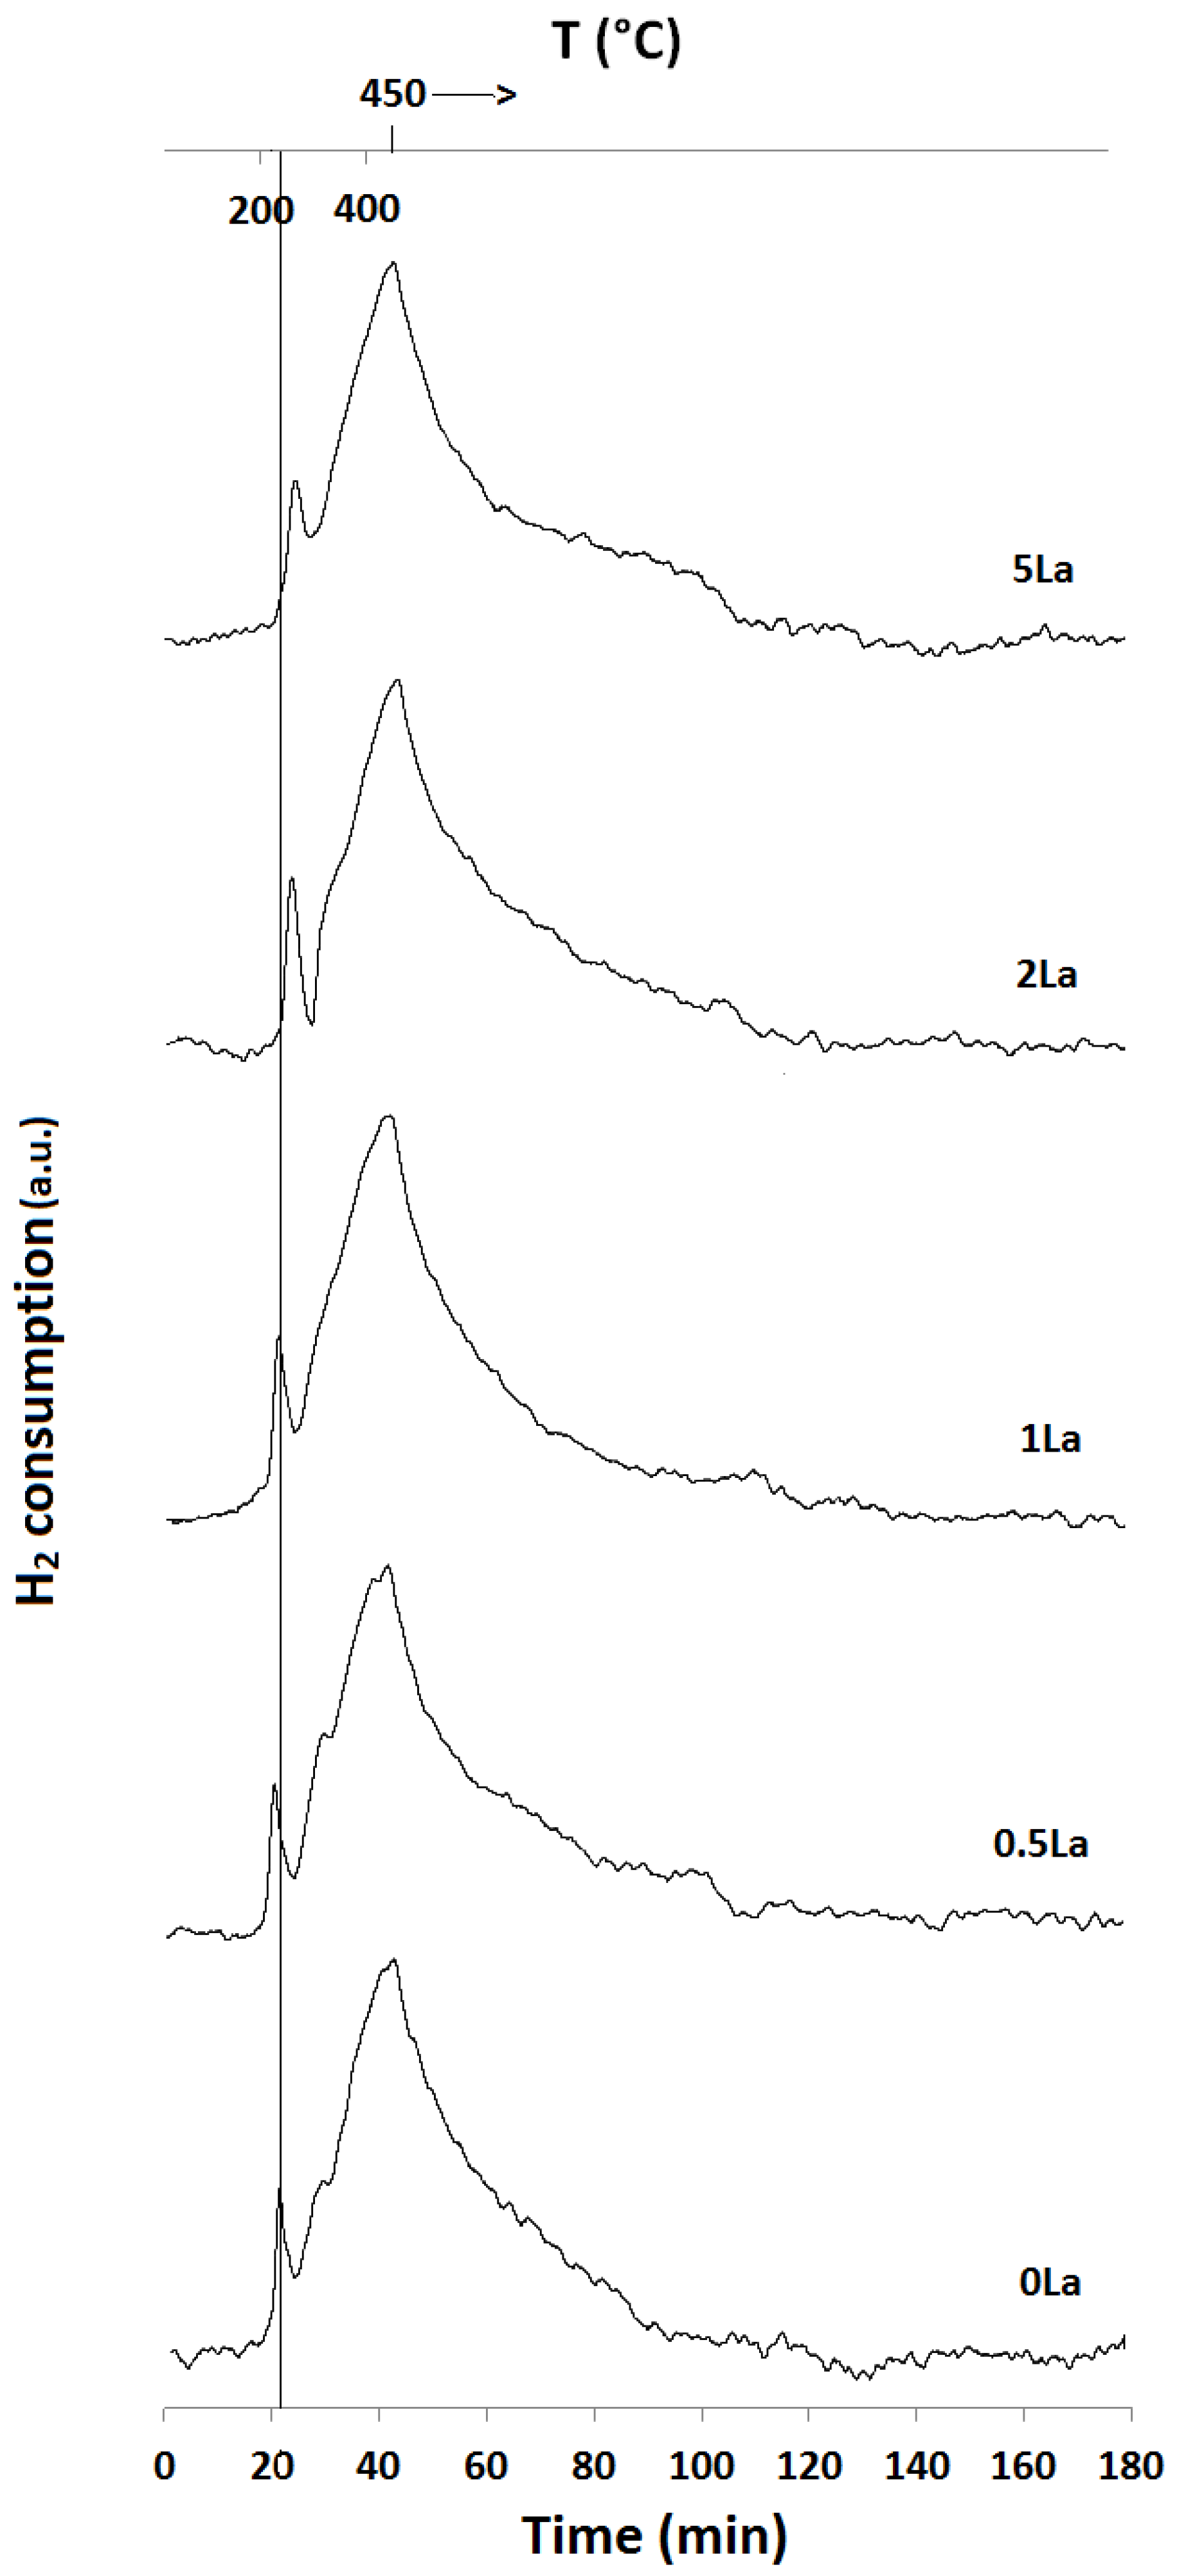
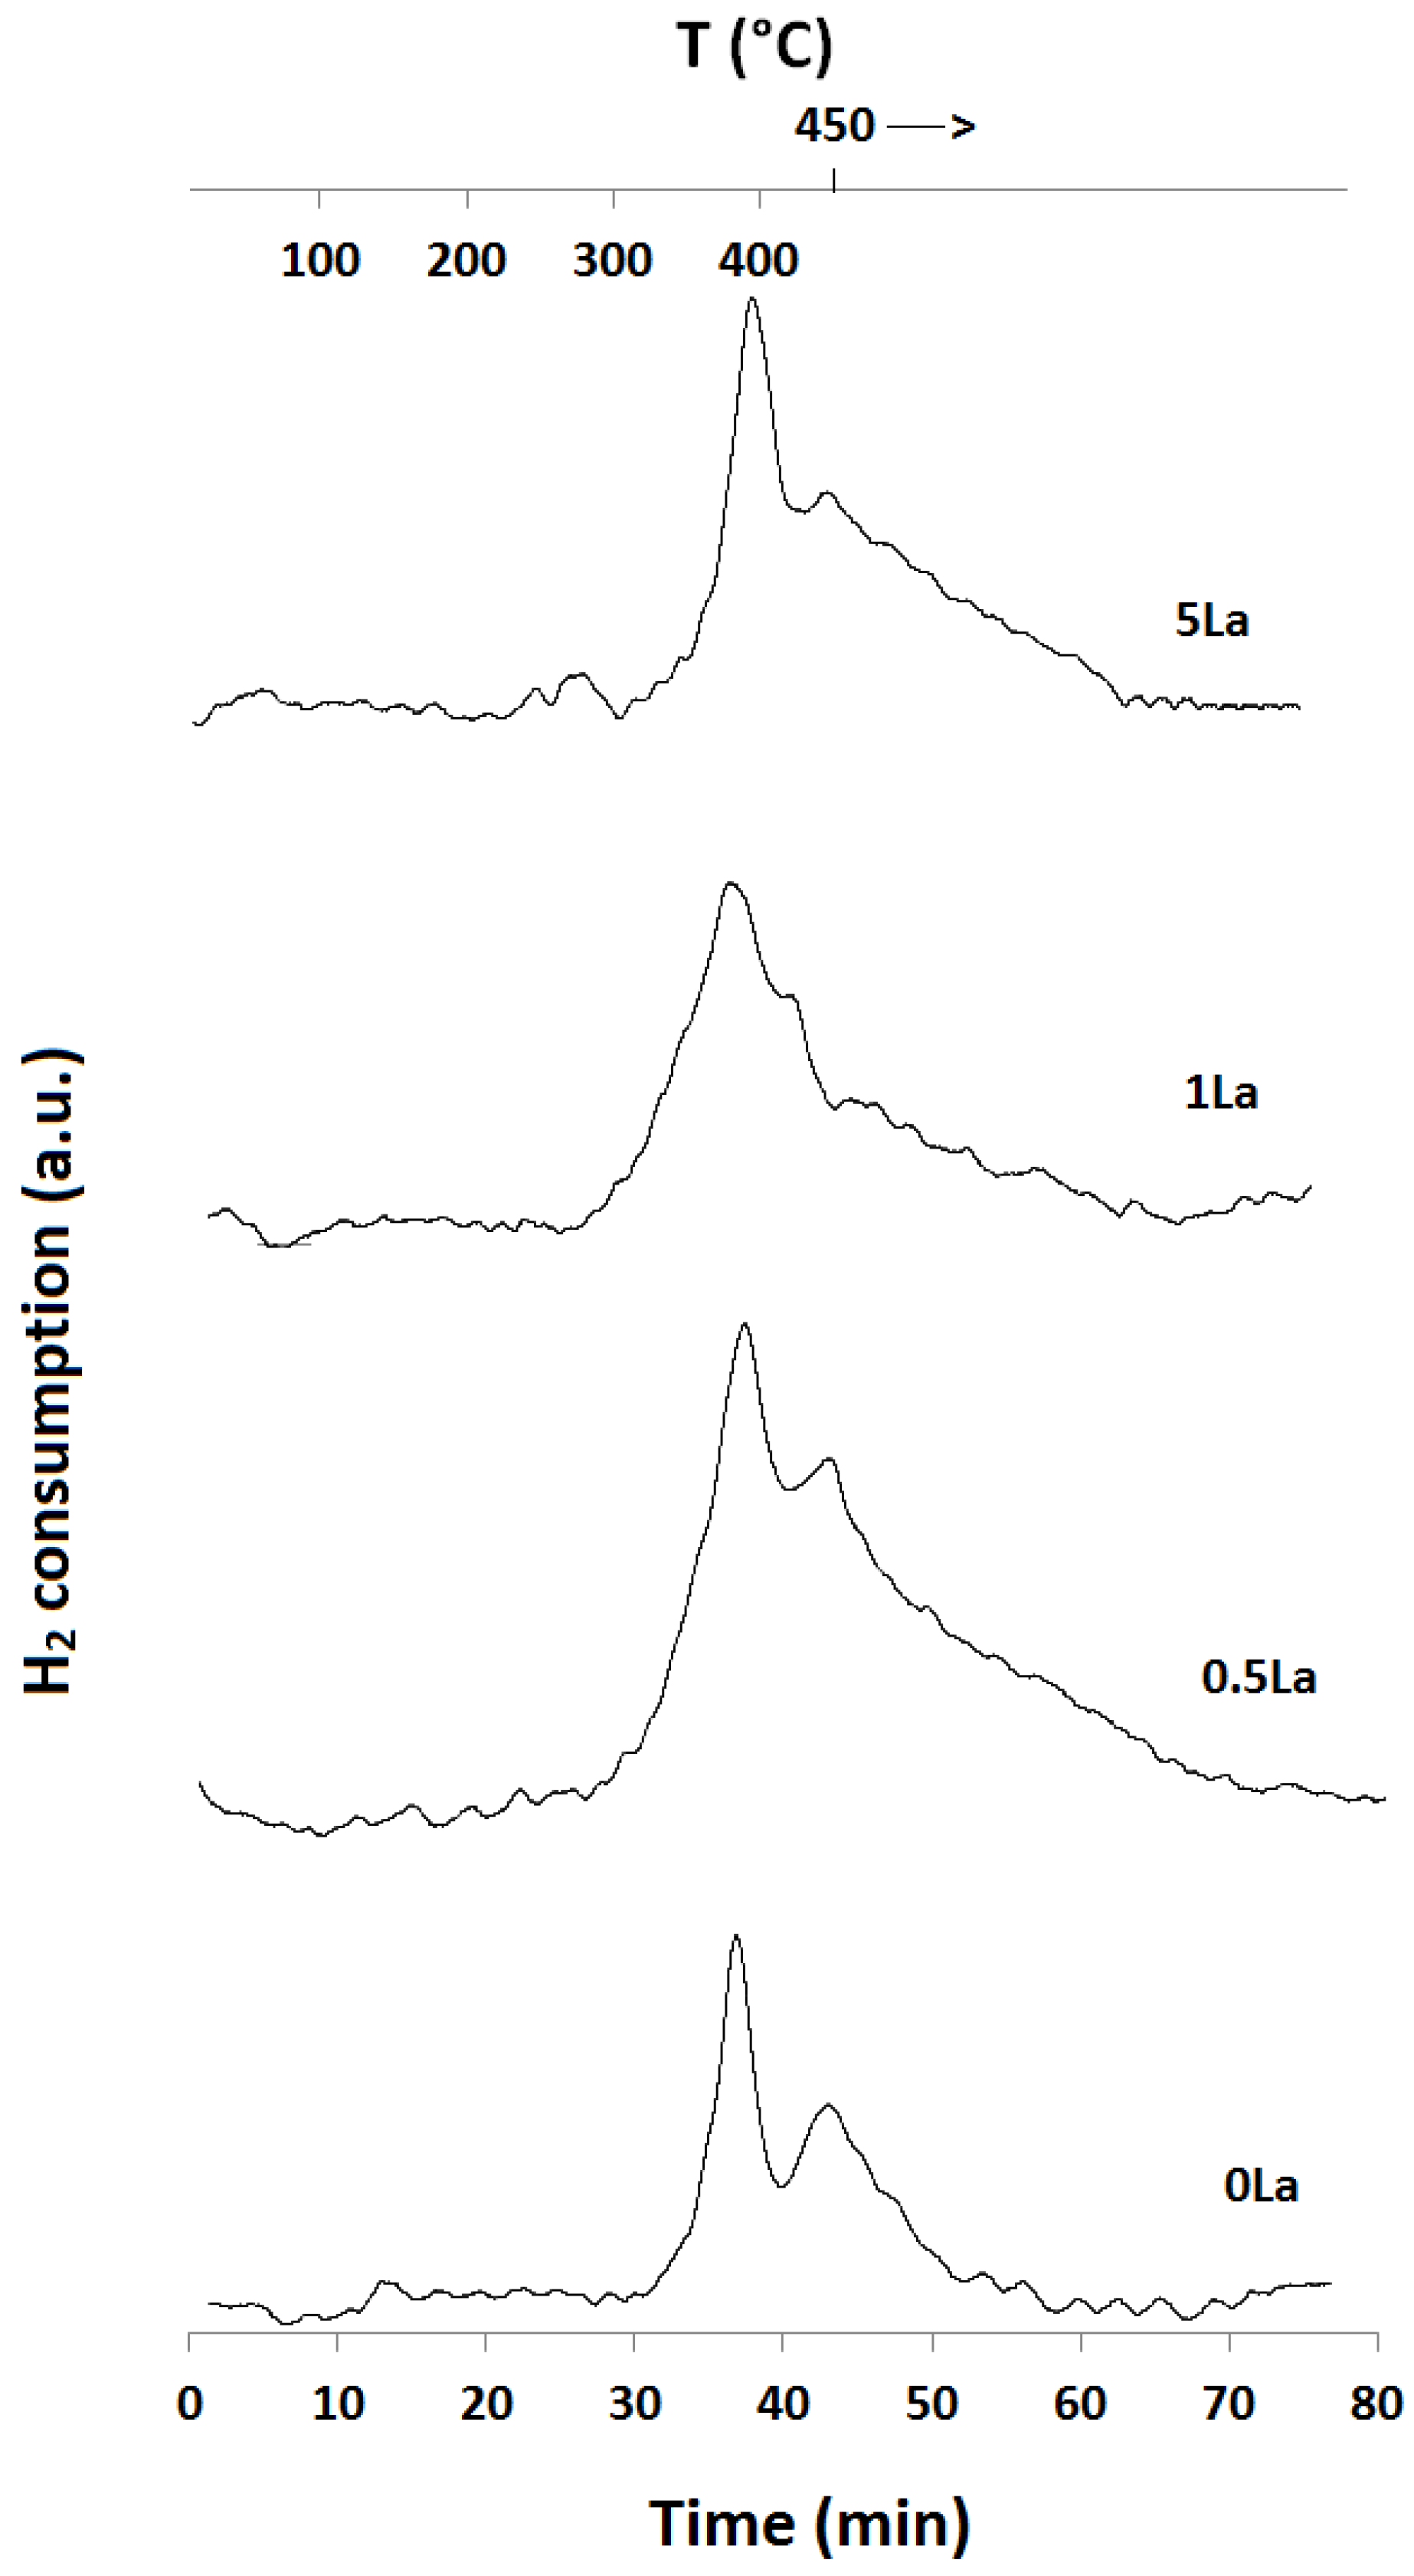
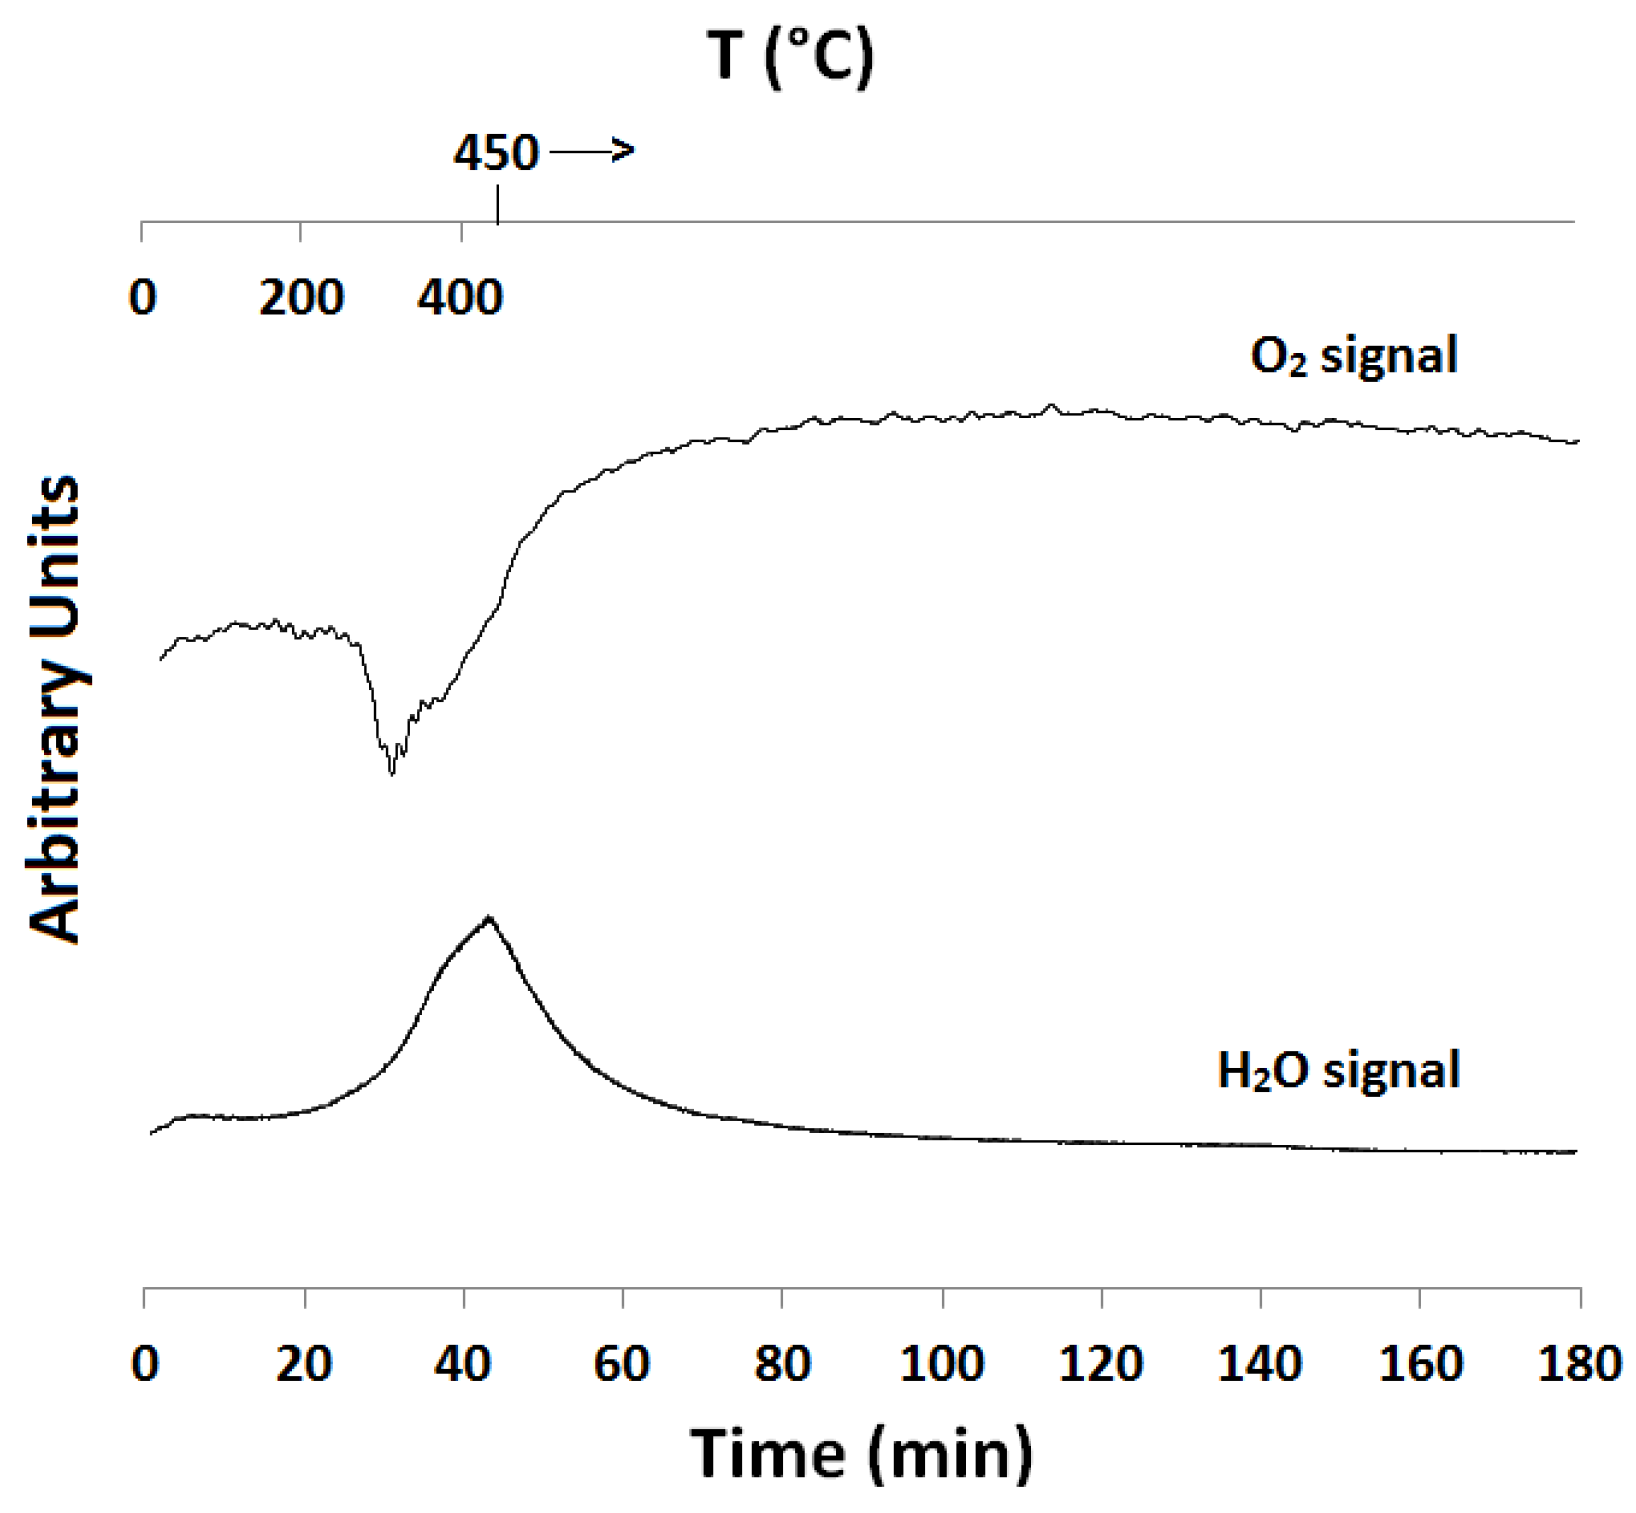
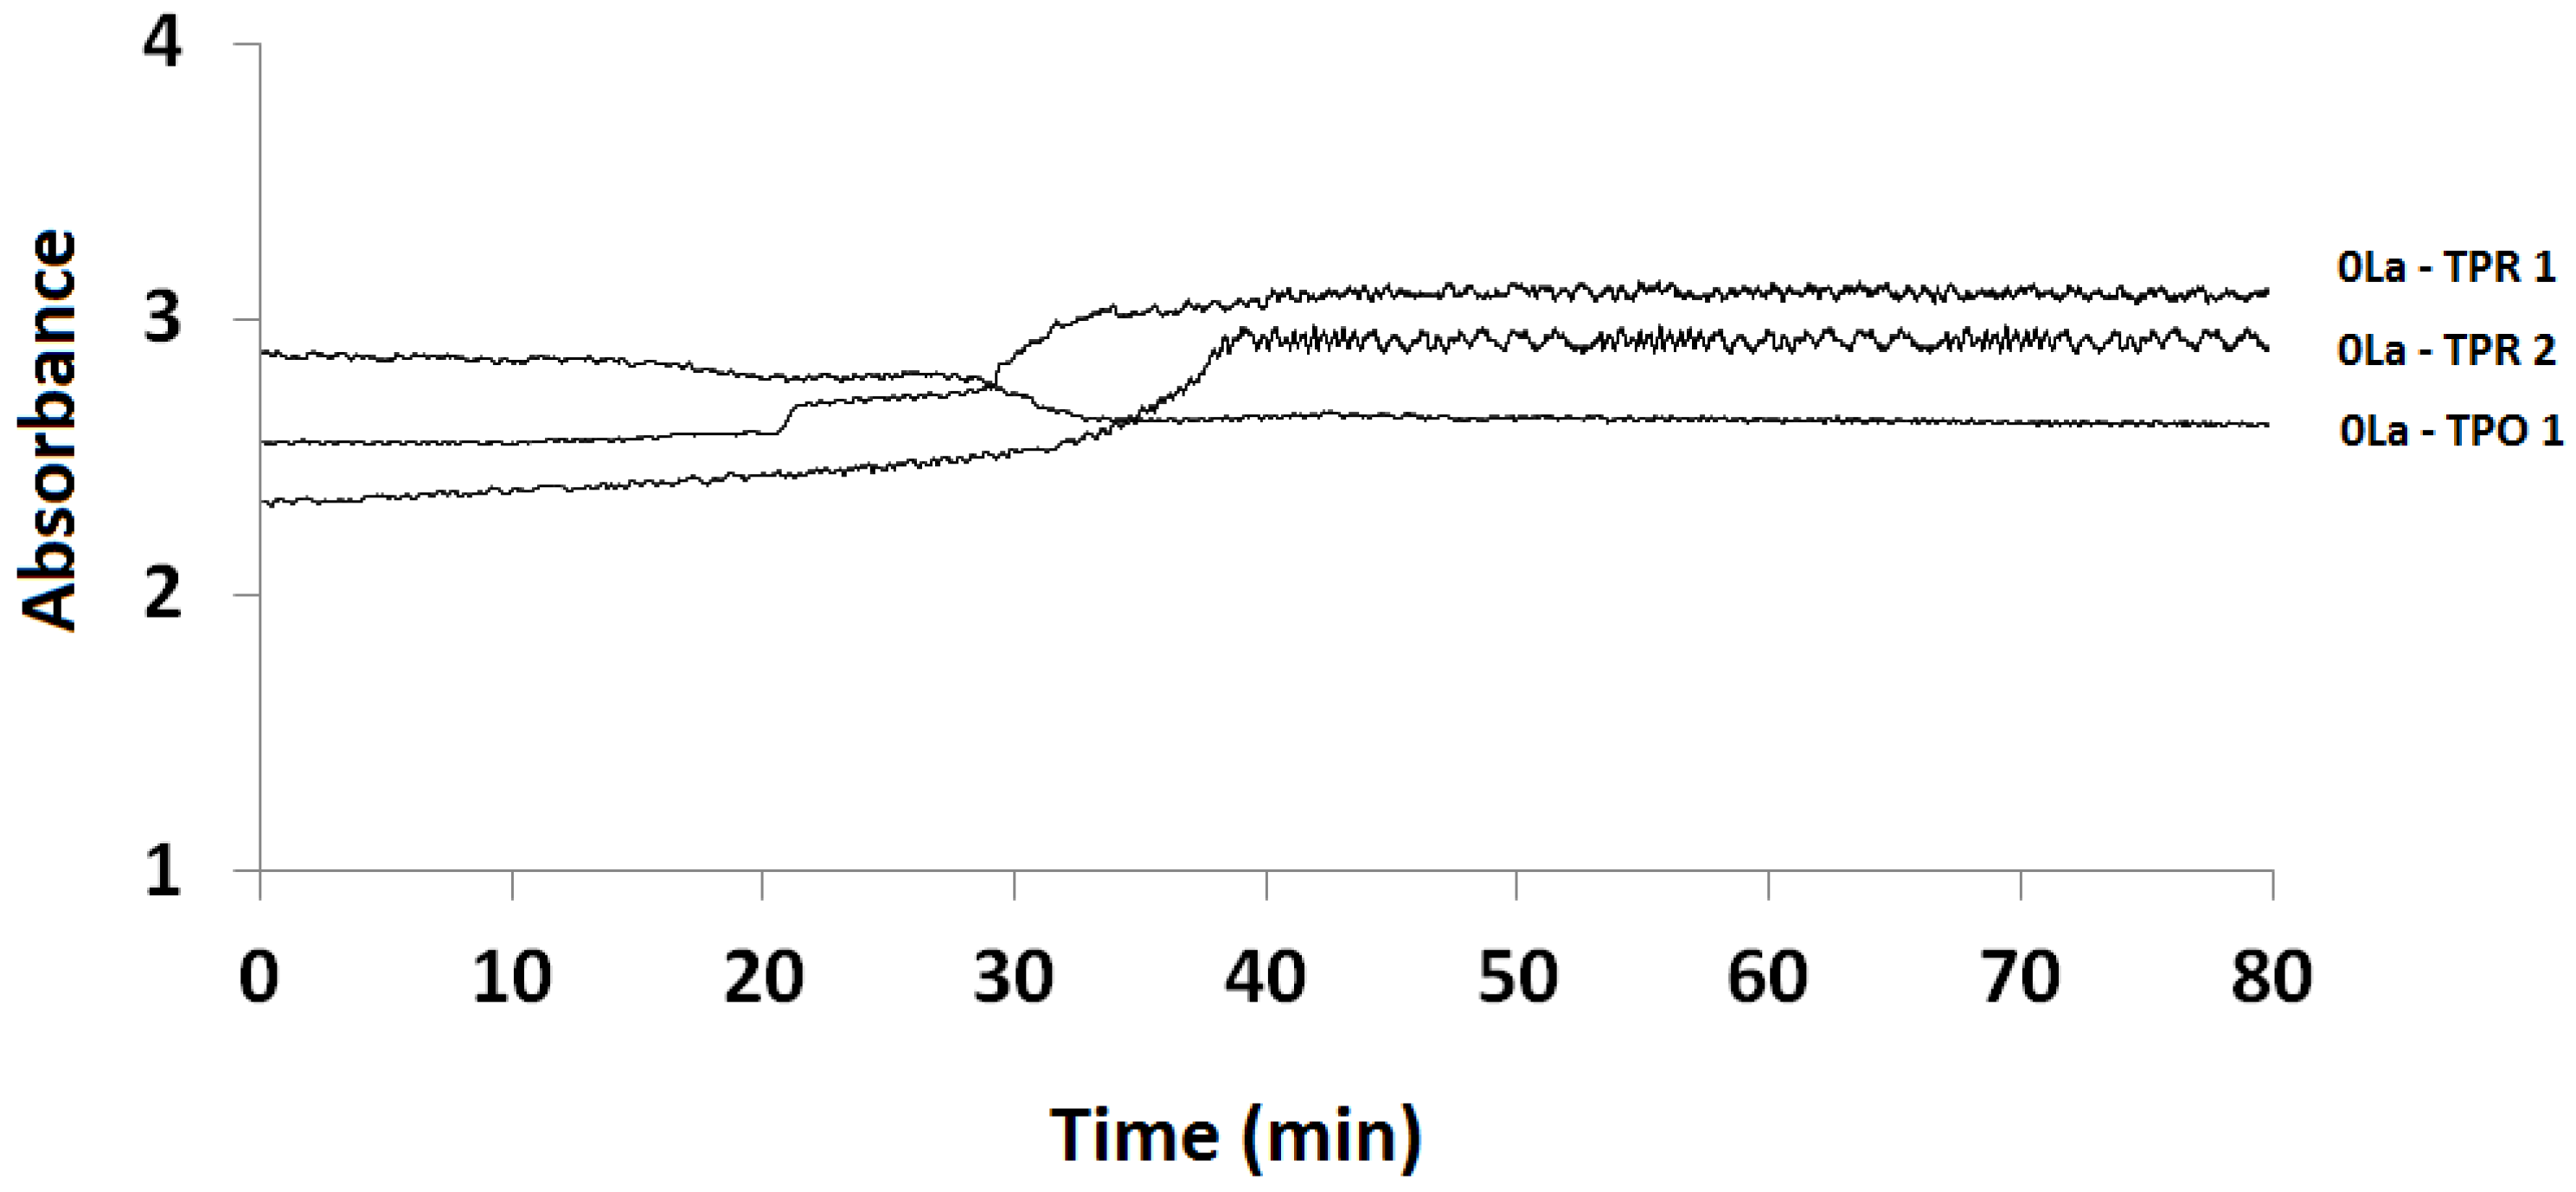
2.1. Temperature-Programmed Reduction and Oxidation (TPR and TPO)

The full TPR profiles as functions of time for the five iron oxide WGS catalysts with varying quantities of La (0 to 5 wt %) are shown in Figure 1. Two peaks were observed during the reduction of the catalysts with H2, in which the first peak corresponds to the reduction of Fe2O3 to Fe3O4, CuO to Cu and possibly Cr6+ to Cr3+, while the second peak is attributed to the reduction of Fe3O4 to FeO and metallic Fe [40,41,42]. The second peak is much larger than the first peak because it requires 8 times more H2 to reduce Fe3O4 to Fe than to reduce Fe2O3 to Fe3O4. The temperature was not increased beyond 450 °C during the TPR experiments to fully characterize the second peak due to limitations on the heater used. The reduction temperature for the second peak typically extends to 650–700 °C for Fe/Cr/Cu catalysts [3]. Consistent with our previous study, the 0.5La catalyst was the easiest to reduce of the catalysts containing La, as determined by the maximum of the first reduction peak occurring at the lowest temperature (approximately 219 °C) [10].
The maxima of the second peaks occur at almost the same times (temperature) for all the catalysts due to stopping the heating at 450 °C. Table 1 shows the extent of reduction (EOR) for each of the catalysts. EOR is defined as the fraction of iron that has been reduced from Fe2O3 to either Fe3O4 (in the second column of Table 1) or to metallic iron (in the third and fourth columns of Table 1) as quantified by the integrated hydrogen consumption from the TPR peaks. The listed values have been corrected by subtracting the small amount of hydrogen expected to be consumed by the other reducible catalyst components, CuO to Cu and Cr6+ to Cr3+, which are reported to reduce near the temperature range of the first peak [40,41,42]. Hydrogen consumption increases with La content for the first reduction phase and is approximately the same for the second reduction phase (within the ±5% error for this experiment).
However, even considering the uncertainty, 2La and 5La appear to consume more hydrogen than 0.5La. This is explained in terms of the stabilized iron-chromium spinel that is formed in the 0.5La catalyst after it is reduced to the active magnetite form [10]. Therefore, the 0.5La catalyst has a higher extent of reduction to magnetite than the 0La catalyst but a lower extent of reduction to Fe than the 1La, 2La and 5La catalysts. Furthermore, the 2La and 5La catalysts start consuming hydrogen with the second peak later (i.e., at higher temperatures) possibly due to lanthana covering iron domains making them less accessible. The 2La and 5La catalysts consume more hydrogen than the 0.5La catalyst, possibly due to a disrupted spinel structure and loss of strong interaction between Fe and other elements (such as Cr), which make the catalysts more reducible in terms of hydrogen consumption [10].
Following an intervening full oxidation, the overall extents of reduction during TPR 2 show a different trend. The maximum hydrogen consumption is now observed for the 0.5La catalyst, while 0La consumes the least amount and 1La and 5La consume less than 0.5La. The TPR 2 profiles, plotted in Figure 2, show that the peaks appear at higher temperatures (>300 °C for the first peak and >400 °C for the second peak), with the second much smaller than the first peak as the heating does not go beyond 450 °C, suggesting that the catalysts have been stabilized after the first TPR/TPO cycle. The 0.5La and 1La catalysts start consuming H2 at 30–40 °C lower temperatures (3–4 min earlier) than the other catalysts. However, the 0.5La catalyst ends up consuming more hydrogen than the other samples by the time the temperature reaches 450 °C (at approximately 43 min). This ease and extent of reducibility is correlated to the overall WGS reaction rates previously reported for these catalysts [10].
The results of TPR 2 are significant because the 0.5La catalyst is a better catalyst candidate for re-use, as it has been deactivated the least. In fact, the extent of reduction for the 0.5La catalyst calculated from TPR 2 is 8% lower than that calculated from TPR 1, while those of the other catalysts are approximately 35–50% lower. The decreased reducibility of the catalyst comes as result of possible sintering and deactivation of the catalyst after TPR 1 treatment at 450 °C for 3 h. Qualitatively, these results agree very well with what has been reported previously on the stability of the catalysts, where the WGS reaction rate decreased by 11% for the 0.5La catalyst after 120 h under reaction conditions and 20–25% for the other catalysts [10]. The promoting effect of lanthana in lowering the reduction temperature observed with the first and second peaks in TPR 1 is attributed to a stabilized spinel that starts forming at lower temperatures in the 0.5La catalyst and continues to consume H2 until the hematite is reduced to magnetite. Further addition of lanthana appears to disrupt the spinel once formed and possibly cover the surface, making the Fe domains less accessible to H2, thus requiring higher temperatures for the catalysts to be reduced [10].
Extent of reduction was also checked with TPO profiles. Figure 3 shows the oxygen consumption and water formation for the initial oxidation and TPO 1 profiles for the 0La catalyst obtained by mass spectra (MS) (similar plots were obtained for the other catalysts). Previous XRD analysis showed that the iron phase in the fresh calcined catalysts is ferrihydrite [10]. Therefore, water is produced during the oxidation of iron to hematite and ferrihydrite. Oxygen is consumed during TPO 1 to form hematite after the catalysts have been reduced during TPR 1. The amount of oxygen consumed during TPO 1 for the 0La catalyst is 80% of the hypothetical value for full oxidation of metallic Fe to Fe2O3, which is in good agreement with the extent of reduction calculated from TPR 1 (82%).

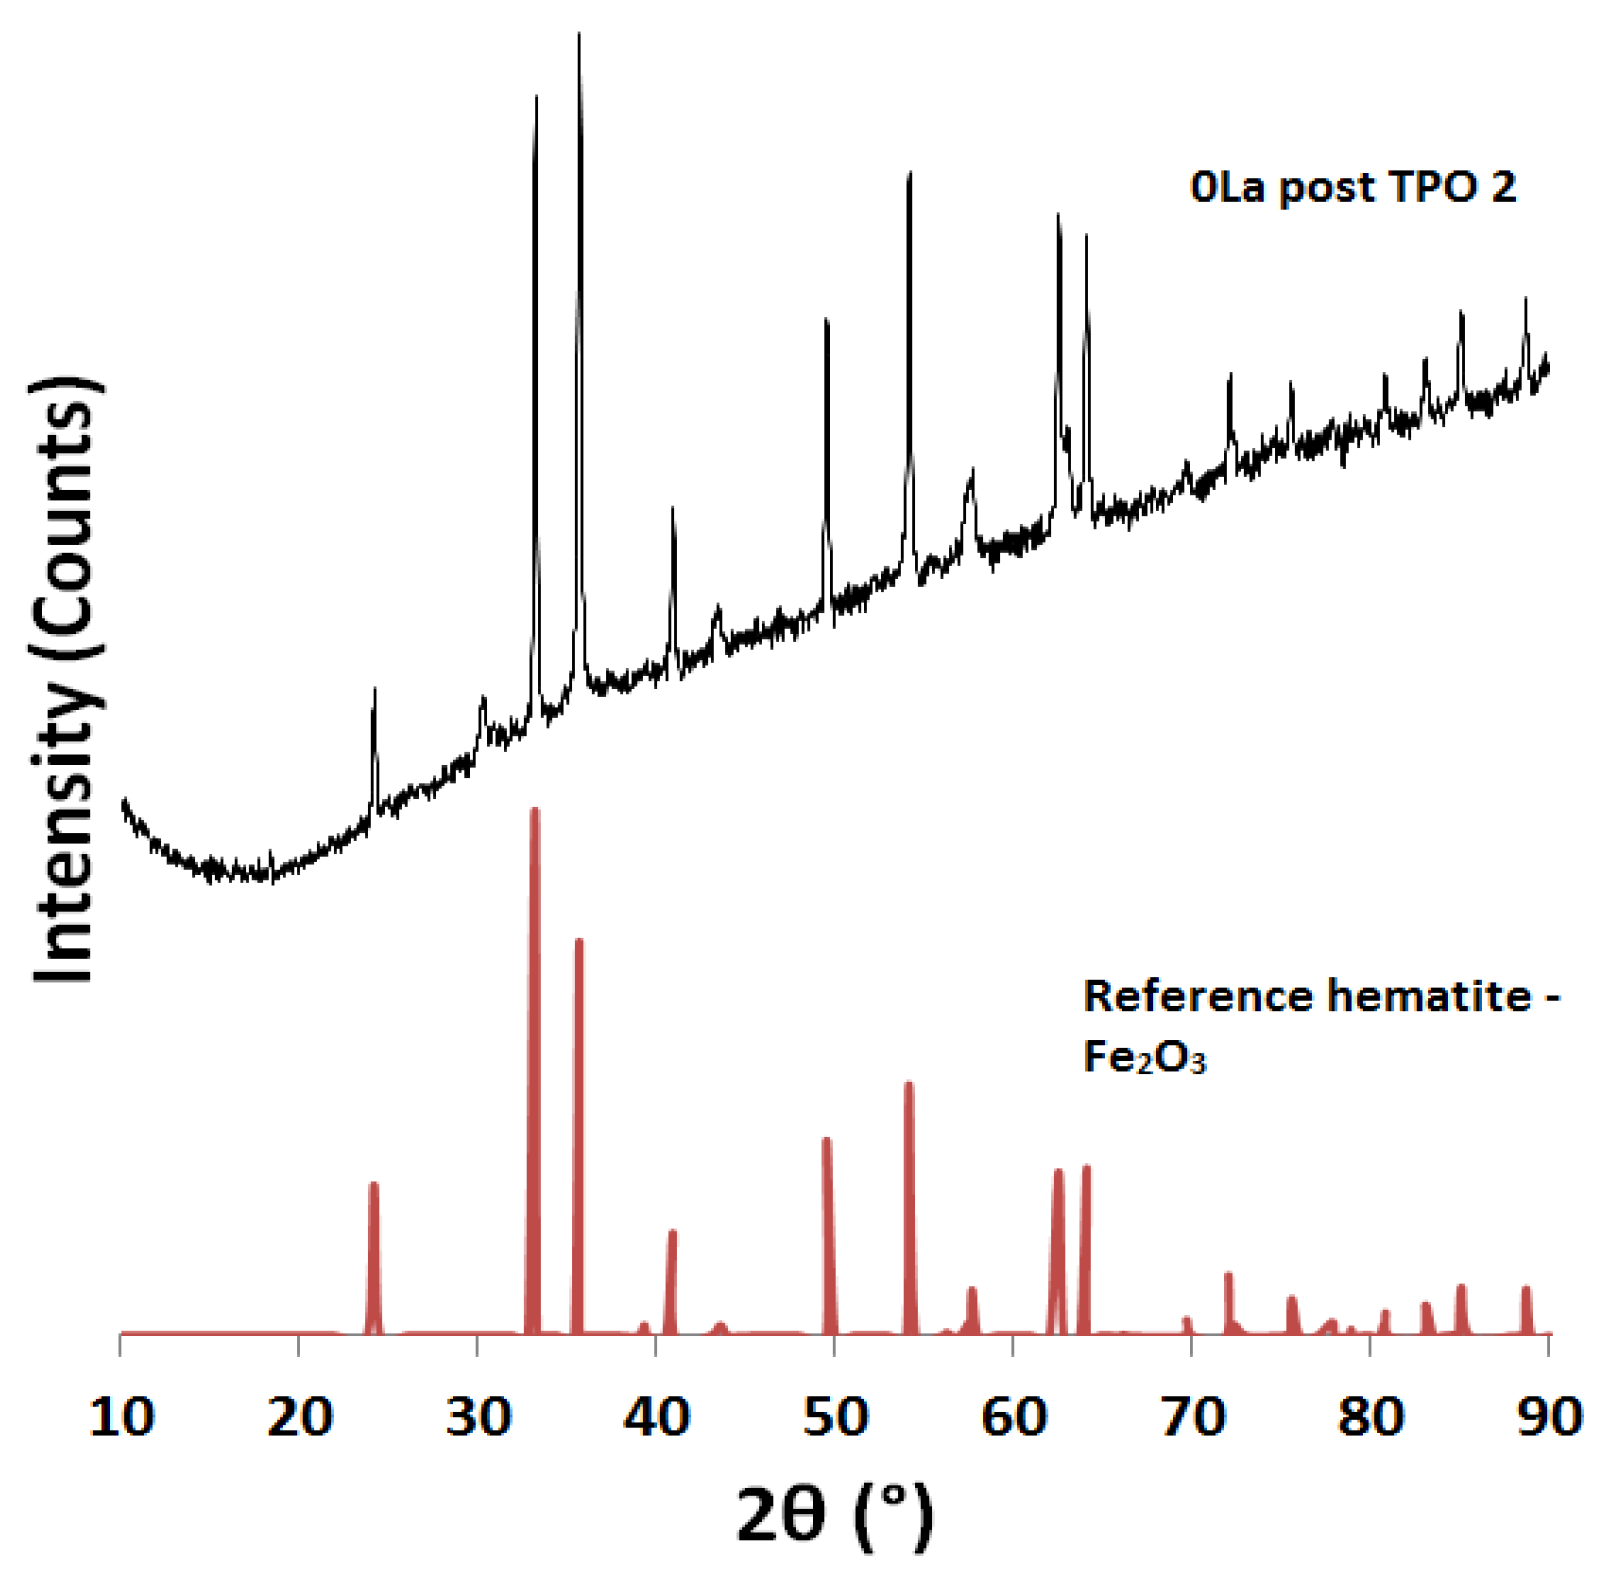
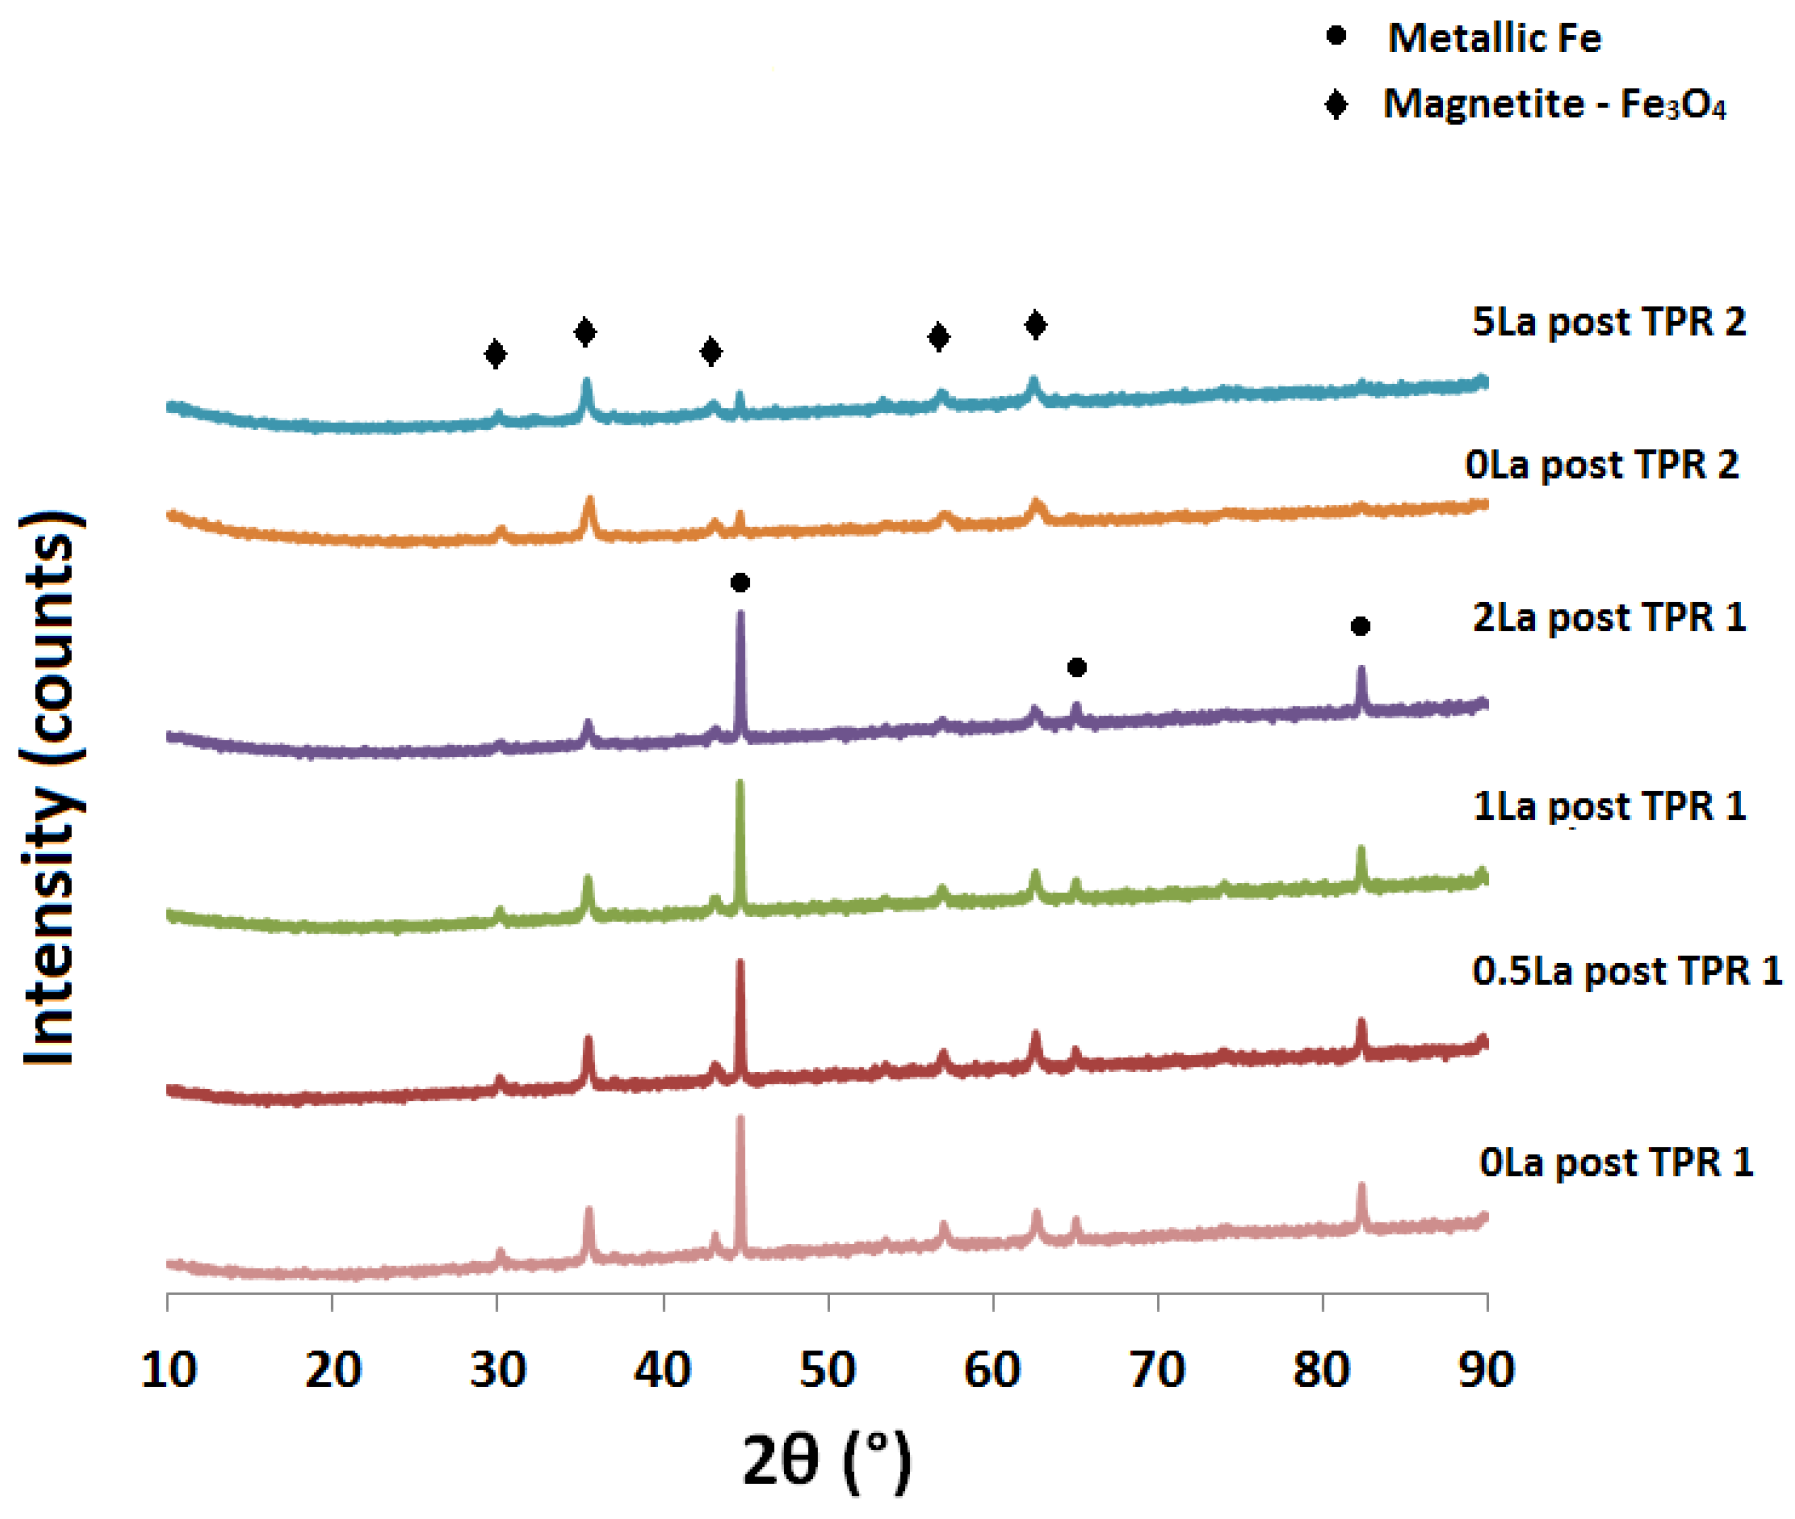
2.2. Powder X-ray Diffraction (XRD) Analysis

XRD spectra were collected for a specific set of samples post reduction/oxidation treatment, as shown in Figure 4 and Figure 5. The spectra in Figure 4 qualitatively show that the major iron phases in the catalysts post TPR 1 and TPR 2 are a mixture of metallic Fe and magnetite, based on comparison with the International Centre for Diffraction Data (ICDD) database. However, the peak at 44.7°, which is representative of metallic Fe, is much less intense and essentially negligible for the samples post TPR 2, when compared to the other samples post TPR 1. These results are in good agreement with the TPR trends discussed in the previous section, where the extent of reduction for TPR 2 is 50% lower than that for TPR 1 for the 0La and 5La samples. No peaks for FeO were detected in the XRD patterns. Fe3O4 and Fe are more thermodynamically stable than FeO at 400–450 °C for these shift catalysts [43]. The peaks for the samples post TPR 2 are not intense compared to the peaks observed with samples post TPR 1, indicating a lower content of Fe and hence a lower extent of reduction. There are slight shifts to the left in the peaks at 57° and 62.5° for the 1La and 2La catalysts post TPR 1 and a clear left shift in the peaks at 35.5°, 57° and 62.5° for the 5La catalyst post TPR 2, indicating larger lattice parameters and therefore larger unit cells for Fe3O4. This suggests incorporation of the larger La3+ ions. This trend is similar to that observed with the samples post WGS reaction [10].
Figure 5 compares the XRD spectrum for the 0La catalyst post TPO 2 with the reference hematite spectrum from the ICDD database. Clearly, the major iron oxide phase in the bulk of the catalyst is hematite, thus iron is in the +3 oxidation state after full oxidation of the catalyst. However, a small peak at 30.2° indicates that Fe3O4 is still present in the bulk but its intensity is negligible compared to the peaks of hematite.

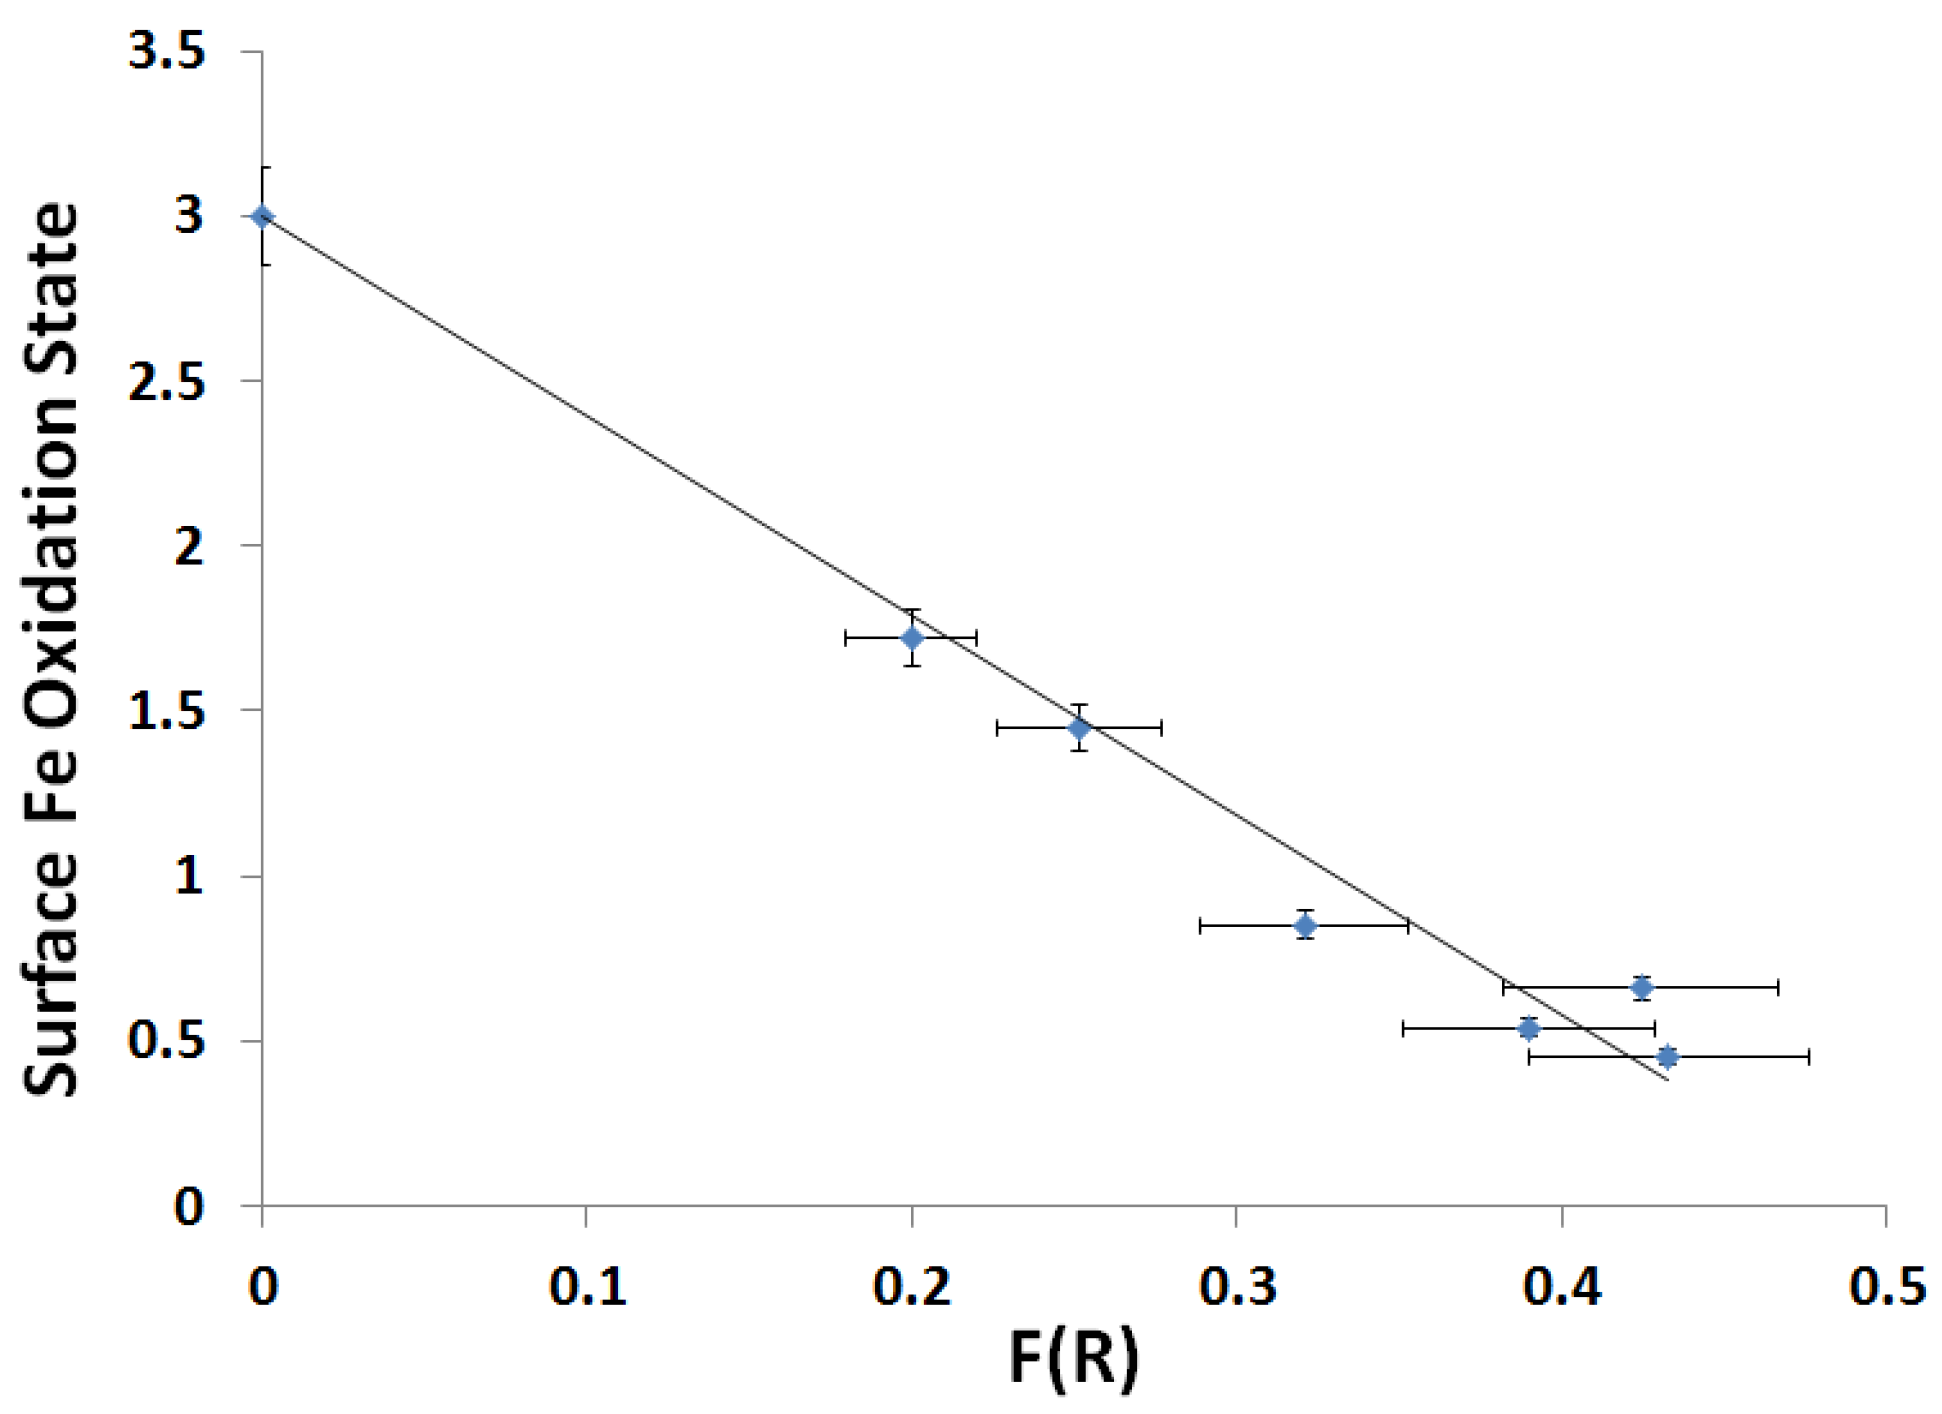
2.3. In Situ UV-Visible Spectroscopy

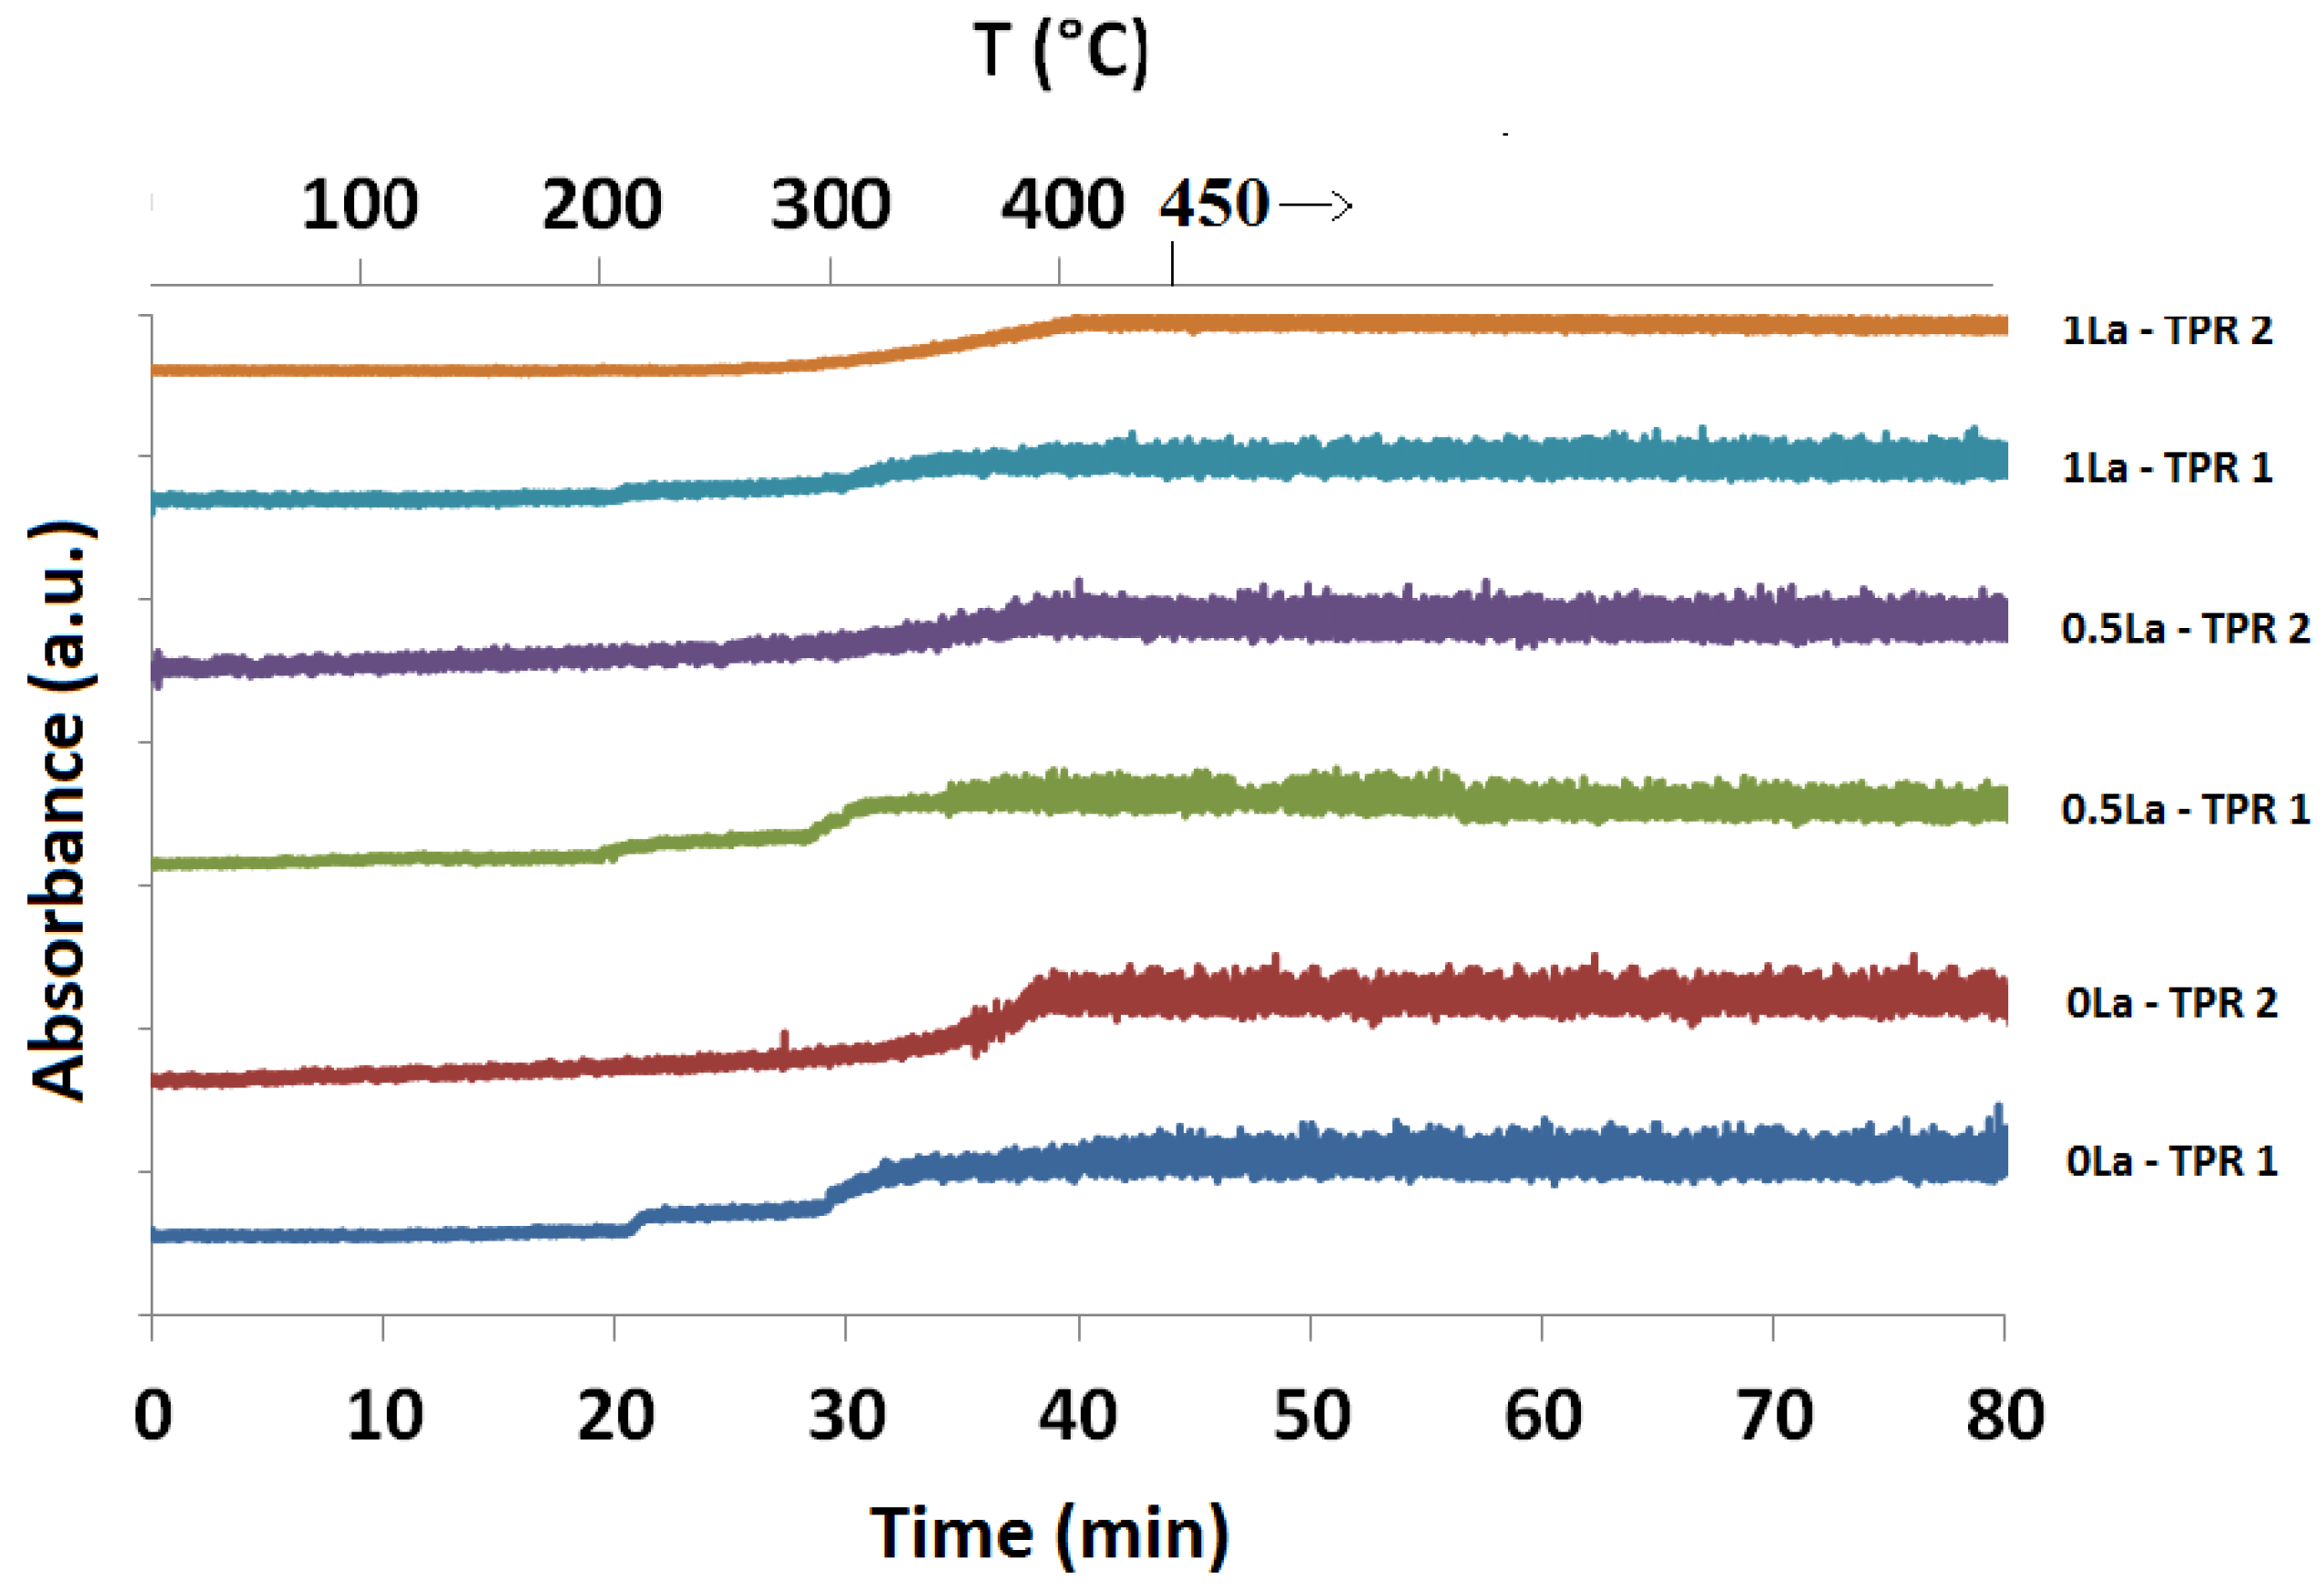
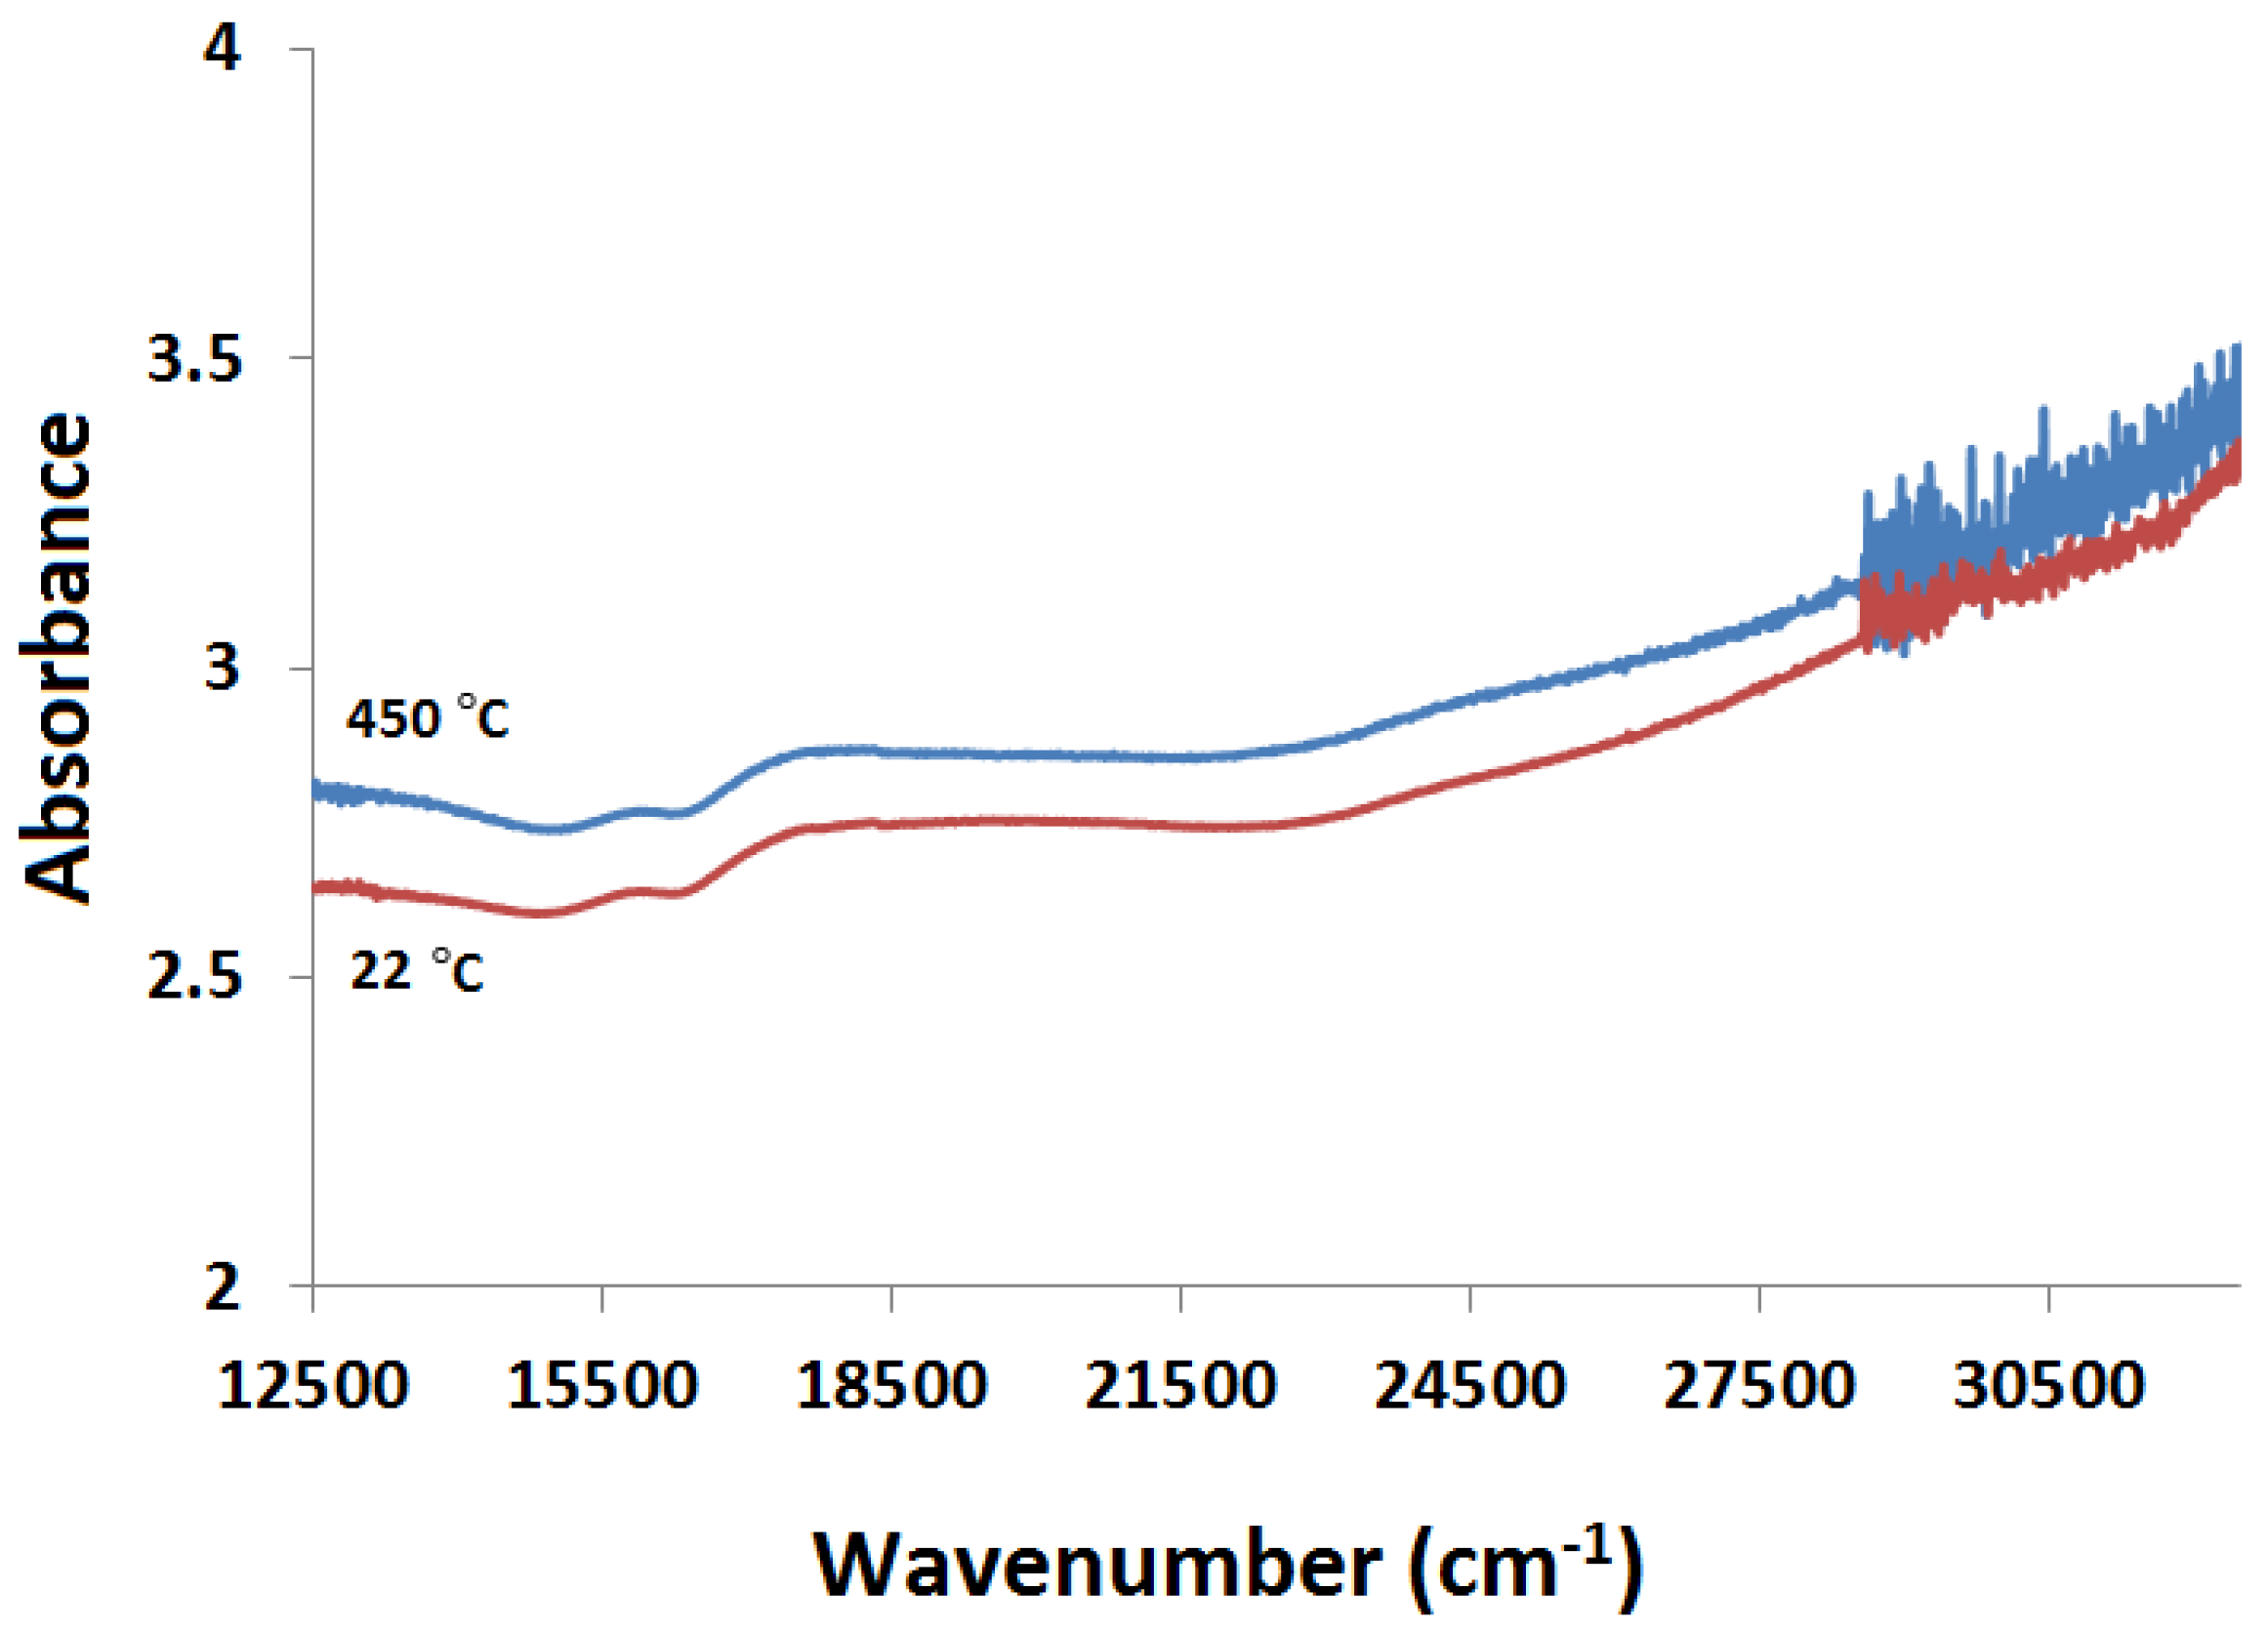
2.3.1. Absorption vs. Time Spectra

The diffuse reflectance light absorption signals from the UV-visible spectrophotometer and mass spectrometer change simultaneously at the same temperature during the first reduction process. Figure 6 shows the absorption signal response at 12,500 cm−1 as a function of time for the 0La, 0.5La and 1La catalysts from the beginning of the reduction processes (TPR 1 and TPR 2) at room temperature to the maximum temperature of 450 °C, which was reached at about 43 min. For TPR 1, the jump in the UV-vis absorption occurs in 2 steps, for which the first step starts at around 21 min (about 230 °C), while step 2 starts at around 28 min (about 300 °C). The timings of steps 1 and 2 match with the times at which the H2 signal from the mass spectrometer starts to show hydrogen consumption for the first and second reduction phases, respectively. On the other hand, only a long 1-step jump is observed at around 32 min (about 340 °C) for the 0La catalyst and around 28 min (about 300 °C) for the 0.5La and 1La catalysts during TPR 2, which corresponds to the large hydrogen consumption peaks shown by the mass spectrometer shown in Figure 2. The second peaks are smaller and some are overlapped by the first larger peak (as is the case for the 1La catalyst). The absorbance is clearly insensitive to the second peaks due their overlapping nature. Compared to TPR 1, the absorbance signal for TPR 2 increases over a broader range of time, unlike that for TPR 1, which is sharper. The increase in the absorbance signal at 12,500 cm−1 is apparently due to the combined effect of reduction of Fe2O3 to Fe3O4 and metallic Fe, both of which species have smaller or no band gaps and more oxygen vacancies than hematite.
Figure 7 shows the UV-visible absorbance as a function of time for the 0La catalyst post TPR 1, TPO and TPR 2 on the same graph. The absorbance signal increases during the TPR experiments, while it decreases as the catalyst is oxidized during TPO. The asymptotic absorbance attained during TPR 2 is lower than that reached during TPR 1, indicating a lower extent of reduction. However, the absorbance signal starts with a lower value for TPR 2 compared to that for TPR 1. A possible explanation for this behavior is sintering of the particles due to thermal effects of the initial TPR and TPO. Furthermore, the absorbance at which TPO 1 ends is not the same as the signal at which TPR 2 starts (see Figure 7) due to temperature effects which are depicted in Figure 8. The same effect is observed for the signals at the end of TPR 1 and beginning of TPO 1. The effect of temperature is discussed in more detail in the following section.

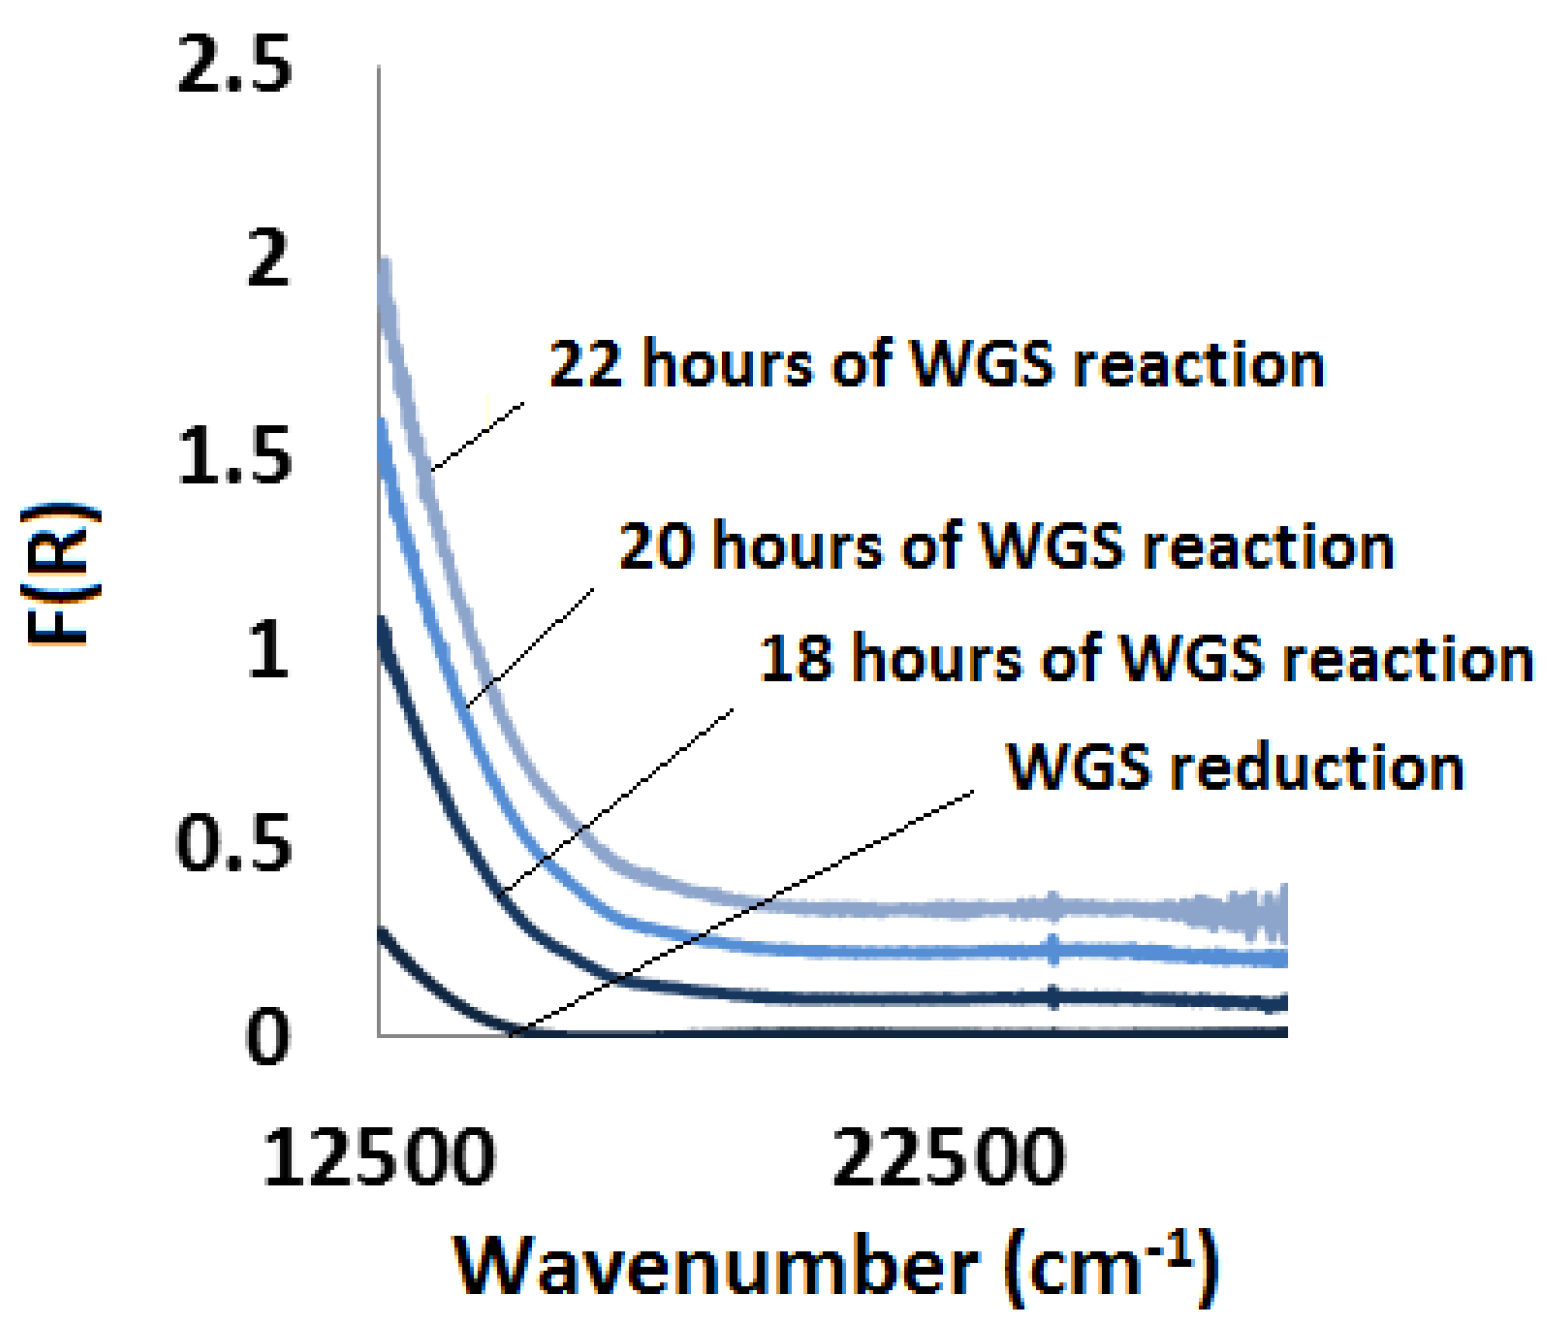
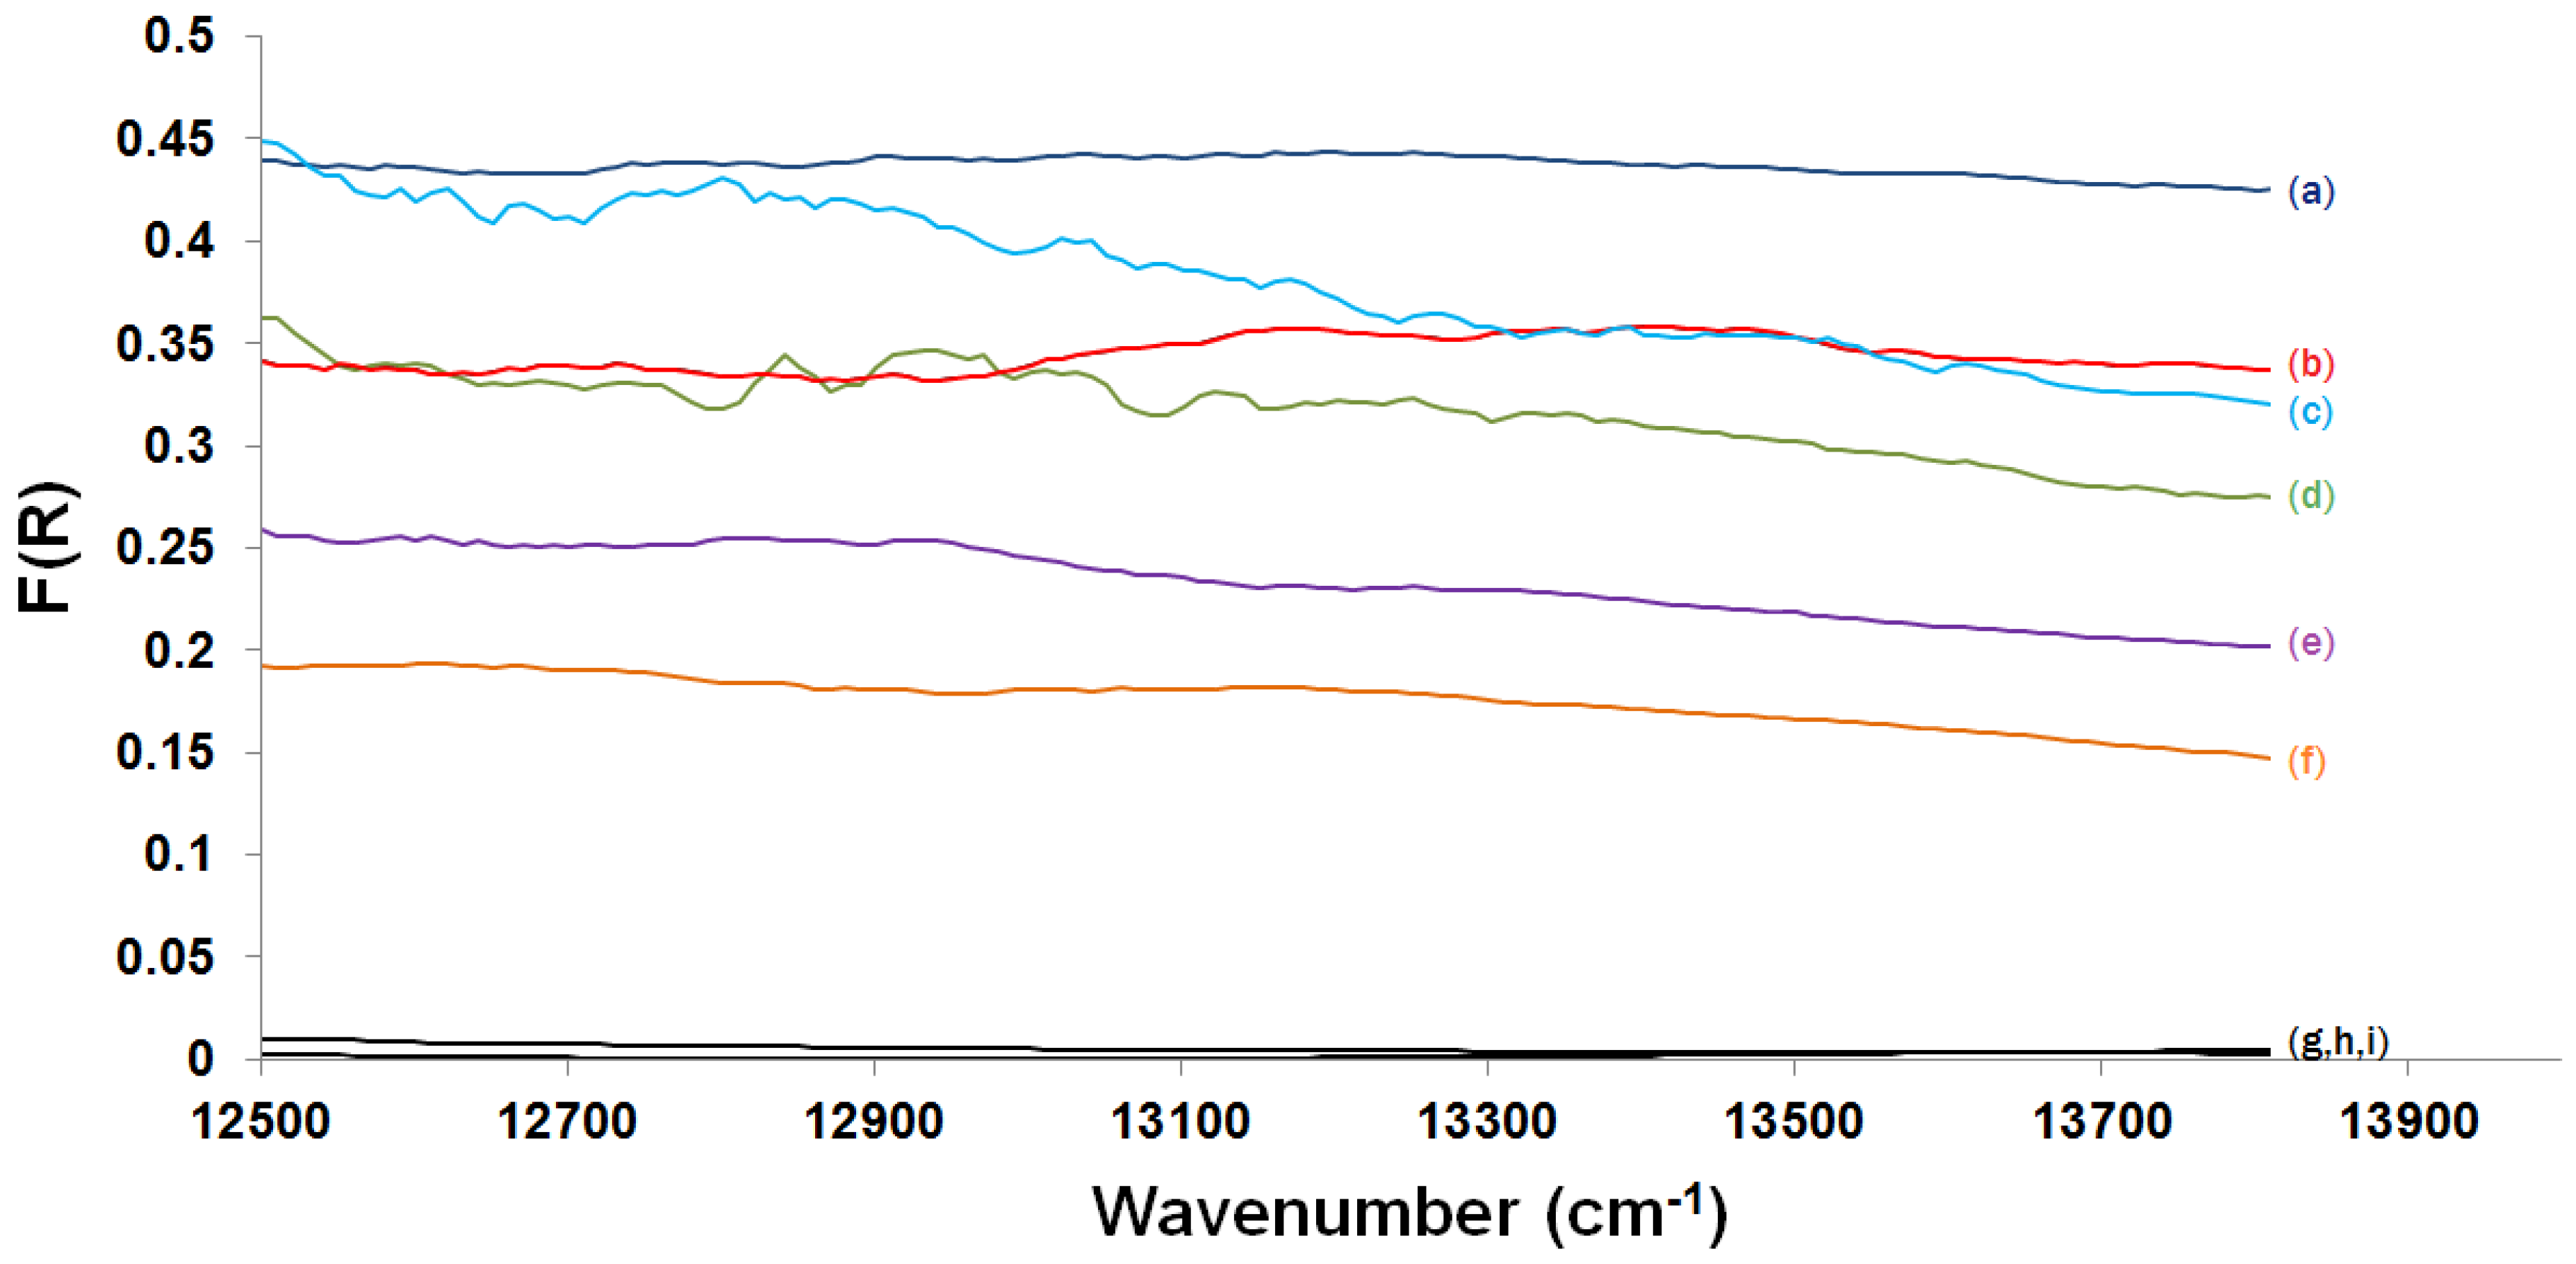
2.3.2. Kubelka-Munk Scans and Calibration

The UV-visible spectroscopic analysis discussed in this section and the sections that follow has been performed primarily on the 0La, 0.5La and 1La catalysts because they produced the highest WGS activities and showed significant chemical and physical and chemical changes among them in previous results [10].
The previous results show that light absorbance at 12,500 cm−1 is affected by the extent of reduction of the WGS catalysts. Scans across the UV-visible spectrum (modified Kubelka-Munk (K-M) function values vs. wavenumber) are plotted in Figure 9 for the 0La, 0.5La and 1La catalysts. The reference for the modified K-M scan is a fully oxidized sample of each catalyst. The values of the normalized absorbance are the same as the K-M values when the catalysts are scanned under normalized absorbance scans, suggesting that the scattering term has minimal effect on the K-M function during the TPR and TPO experiments. The values of the Kubelka-Munk function (F(R)) are higher for the more reduced catalysts and nearly zero for the fully oxidized ones.
These spectra are interpreted as follows. Figure 8 shows the temperature dependence of the spectra, with a lower absorbance signal at room temperature than that at 450 °C. Higher temperatures increase the molecular vibration and rotation movements and therefore increase the absorbance [44]. In order to avoid temperature effects on the absorbance signal, all K-M and baseline scans were acquired at room temperature for analysis. Furthermore, according to Figure 8, there is an absorption band centered around 17,500 cm−1 for the oxidized catalyst. This band around 17,500 cm−1, or 2.2 eV, is due to the band gap in Fe2O3 [30,45,46,47]) Since the K-M function is proportional to absorbance, the K-M value for each catalyst post TPR 1 is higher than those post TPR 2, which correlates to the differences in the extents of reduction from Fe2O3 to metallic Fe, as shown in Figure 9 and which is in agreement with the TPR results presented in Section 3.1. Furthermore, the 0La catalyst post TPR 2 has the lowest K-M value of the reduced catalysts, which corresponds to the least extent of reduction. The K-M values for the reduced 0.5La catalyst fall in between, while the K-M value post TPO for the 0La catalyst is essentially zero, especially near 12,500 cm−1, confirming that the catalyst returned to the fully oxidized state that was used as the reference in the K-M function. Absorbance is highest, which produces the largest K-M value for each specific spectrum, at 12,500 cm−1 (1.5 eV), because the reduced catalysts (primarily Fe or Fe3O4) absorb more light at this energy relative to the reference of the fully oxidized catalyst (primarily hematite).
A linearly regressed calibration line was generated (Figure 10) to correlate K-M function (independent variable) and Fe oxidation state acquired from quantification of MS H2 consumption peaks (dependent variable) on the surfaces of each of the three catalysts.
The slope and intercept of the calibration line with 95% confidence intervals are given in Table 2, along with the coefficient of determination (r2) value to evaluate the quality of the data fit. The intercept is 3.0, which corresponds to the oxidation state of hematite (the fully oxidized phase of the samples, with a corresponding K-M value of zero due to the fully oxidized catalyst reference). The results show that the UV-visible technique is sensitive to and can be directly calibrated with extent of catalyst reduction.

2.3.3. Water-Gas Shift Reaction: In Situ and Ex Situ Analysis

In-situ analysis on the 1La catalyst under varying times of HT WGS shift reaction is shown in Figure 11, with the scans performed at the reaction temperature of 400 °C. The K-M values are much higher (80% more) than those post TPR 1, even after accounting for the temperature effect on the absorbance signal (as seen in Figure 8). The K-M values increase significantly with time as the WGS reaction proceeds. Prior kinetic results with these and similar catalysts indicate that they do not approach a steady state activity for about 100 h [10,48]. This change during the initial 24 h is likely associated with sintering, which has been linked to decreasing catalytic rate during this initial time.
Ex situ analysis, presented in Figure 12, was performed at room temperature on the 0La and 1La catalysts after 10 days under high-temperature WGS reaction and show similar results: the normalized absorbance values are higher than those for TPR 1 and TPR 2 of either catalyst.
Although carbon deposition on the catalyst surface is a potential explanation for the increased absorbance signal as a function of the WGS reaction time, this possibility has been discounted. No CO or CO2 signals were detected during a TPO of the used catalysts in flowing air and no iron carbide phase was observed in the XRD and EDS results. Therefore, catalyst carbiding or formation of surface carbon species (e.g., graphite or coke) does not appear to occur.
The apparent explanation is that there are morphological changes to the catalysts once steam is introduced in the feed. This was manifested by physical change to the catalysts, which expands and fractures when exposed to water during WGS conditions. SEM analysis, shown in Figure 13, demonstrates the change in the particle size distribution after WGS treatment, suggesting that introduction of water physically alters the shapes of the particles of the catalysts. In contrast, the particle size distribution after the TPR treatments remains almost the same (figures not shown). Since the K-M function is an absorbance to scattering ratio, morphological changes likely change the ratio of the absorbed and scattered (or diffusely reflected) light off the surface of the catalyst, which accounts for the increase in the K-M values.
Although the direct correlation between reduced centers and absorbance was not possible due to the morphological changes to the catalyst, the use of UV-visible spectroscopy to quantify extent of reduction should be applicable to more physically stable catalysts. These studies will be presented in future papers.
However, in order to use of the calibration curve in Figure 10 and to apply it to quantify the reduced centers of the catalysts post WGS treatment, the ratio of normalized absorbance (which is the ratio of the K-M values excluding the scattering term) for both catalysts after WGS reaction has been compared with the slope of the calibration curve. This ratio of absorbance between two catalysts is an attempt to cancel out the disturbance to the signal caused by the smaller particle size distribution. This analysis presumes that the same morphological changes occur for all of the catalysts during the WGS reaction, which appears to be the case based on analysis of the SEM images. Taking the ratio of the normalized absorbances yields,
( 3 y 1 ) ( 3 y 0 ) = x 1 x 0
where y 0 and y 1 are the oxidation states of Fe in the 0La and 1La catalysts, respectively and x 0 and x 1 are the K-M values for the 0La and 1La catalysts (which are equal to normalized absorbance values for which these calibration lines were derived), respectively. The ratio of the normalized absorbance at 12,500 cm−1, x 1 x 0 , post WGS treatment gives a value of 1.6 ± 0.16. Figure 14 correlates the ratio on the left-hand side of Equation (5) to different ratios of normalized absorbance within the 95% confidence of the fitted slope for both catalysts.
Although these results do not give full quantification for the oxidation state of Fe on the surface during the WGS reaction, they correlate the oxidation state of Fe on the surface of the 1La catalyst to that on the surface of the 0La catalyst.
These findings are consistent with the activity pattern observed previously [10]. The 0.5La catalyst had highest WGS activity, which in this study also displayed higher extent of reduction from Fe2O3 to Fe3O4 than the 0La catalyst and the lower extent of reduction from Fe2O3 to Fe than the 1La, 2La and 5La catalysts, presumably because its spinel structure was better maintained and stabilized [10]. This suggests that addition of 0.5 wt % of lanthana maximizes the content of the active magnetite phase under reaction conditions.

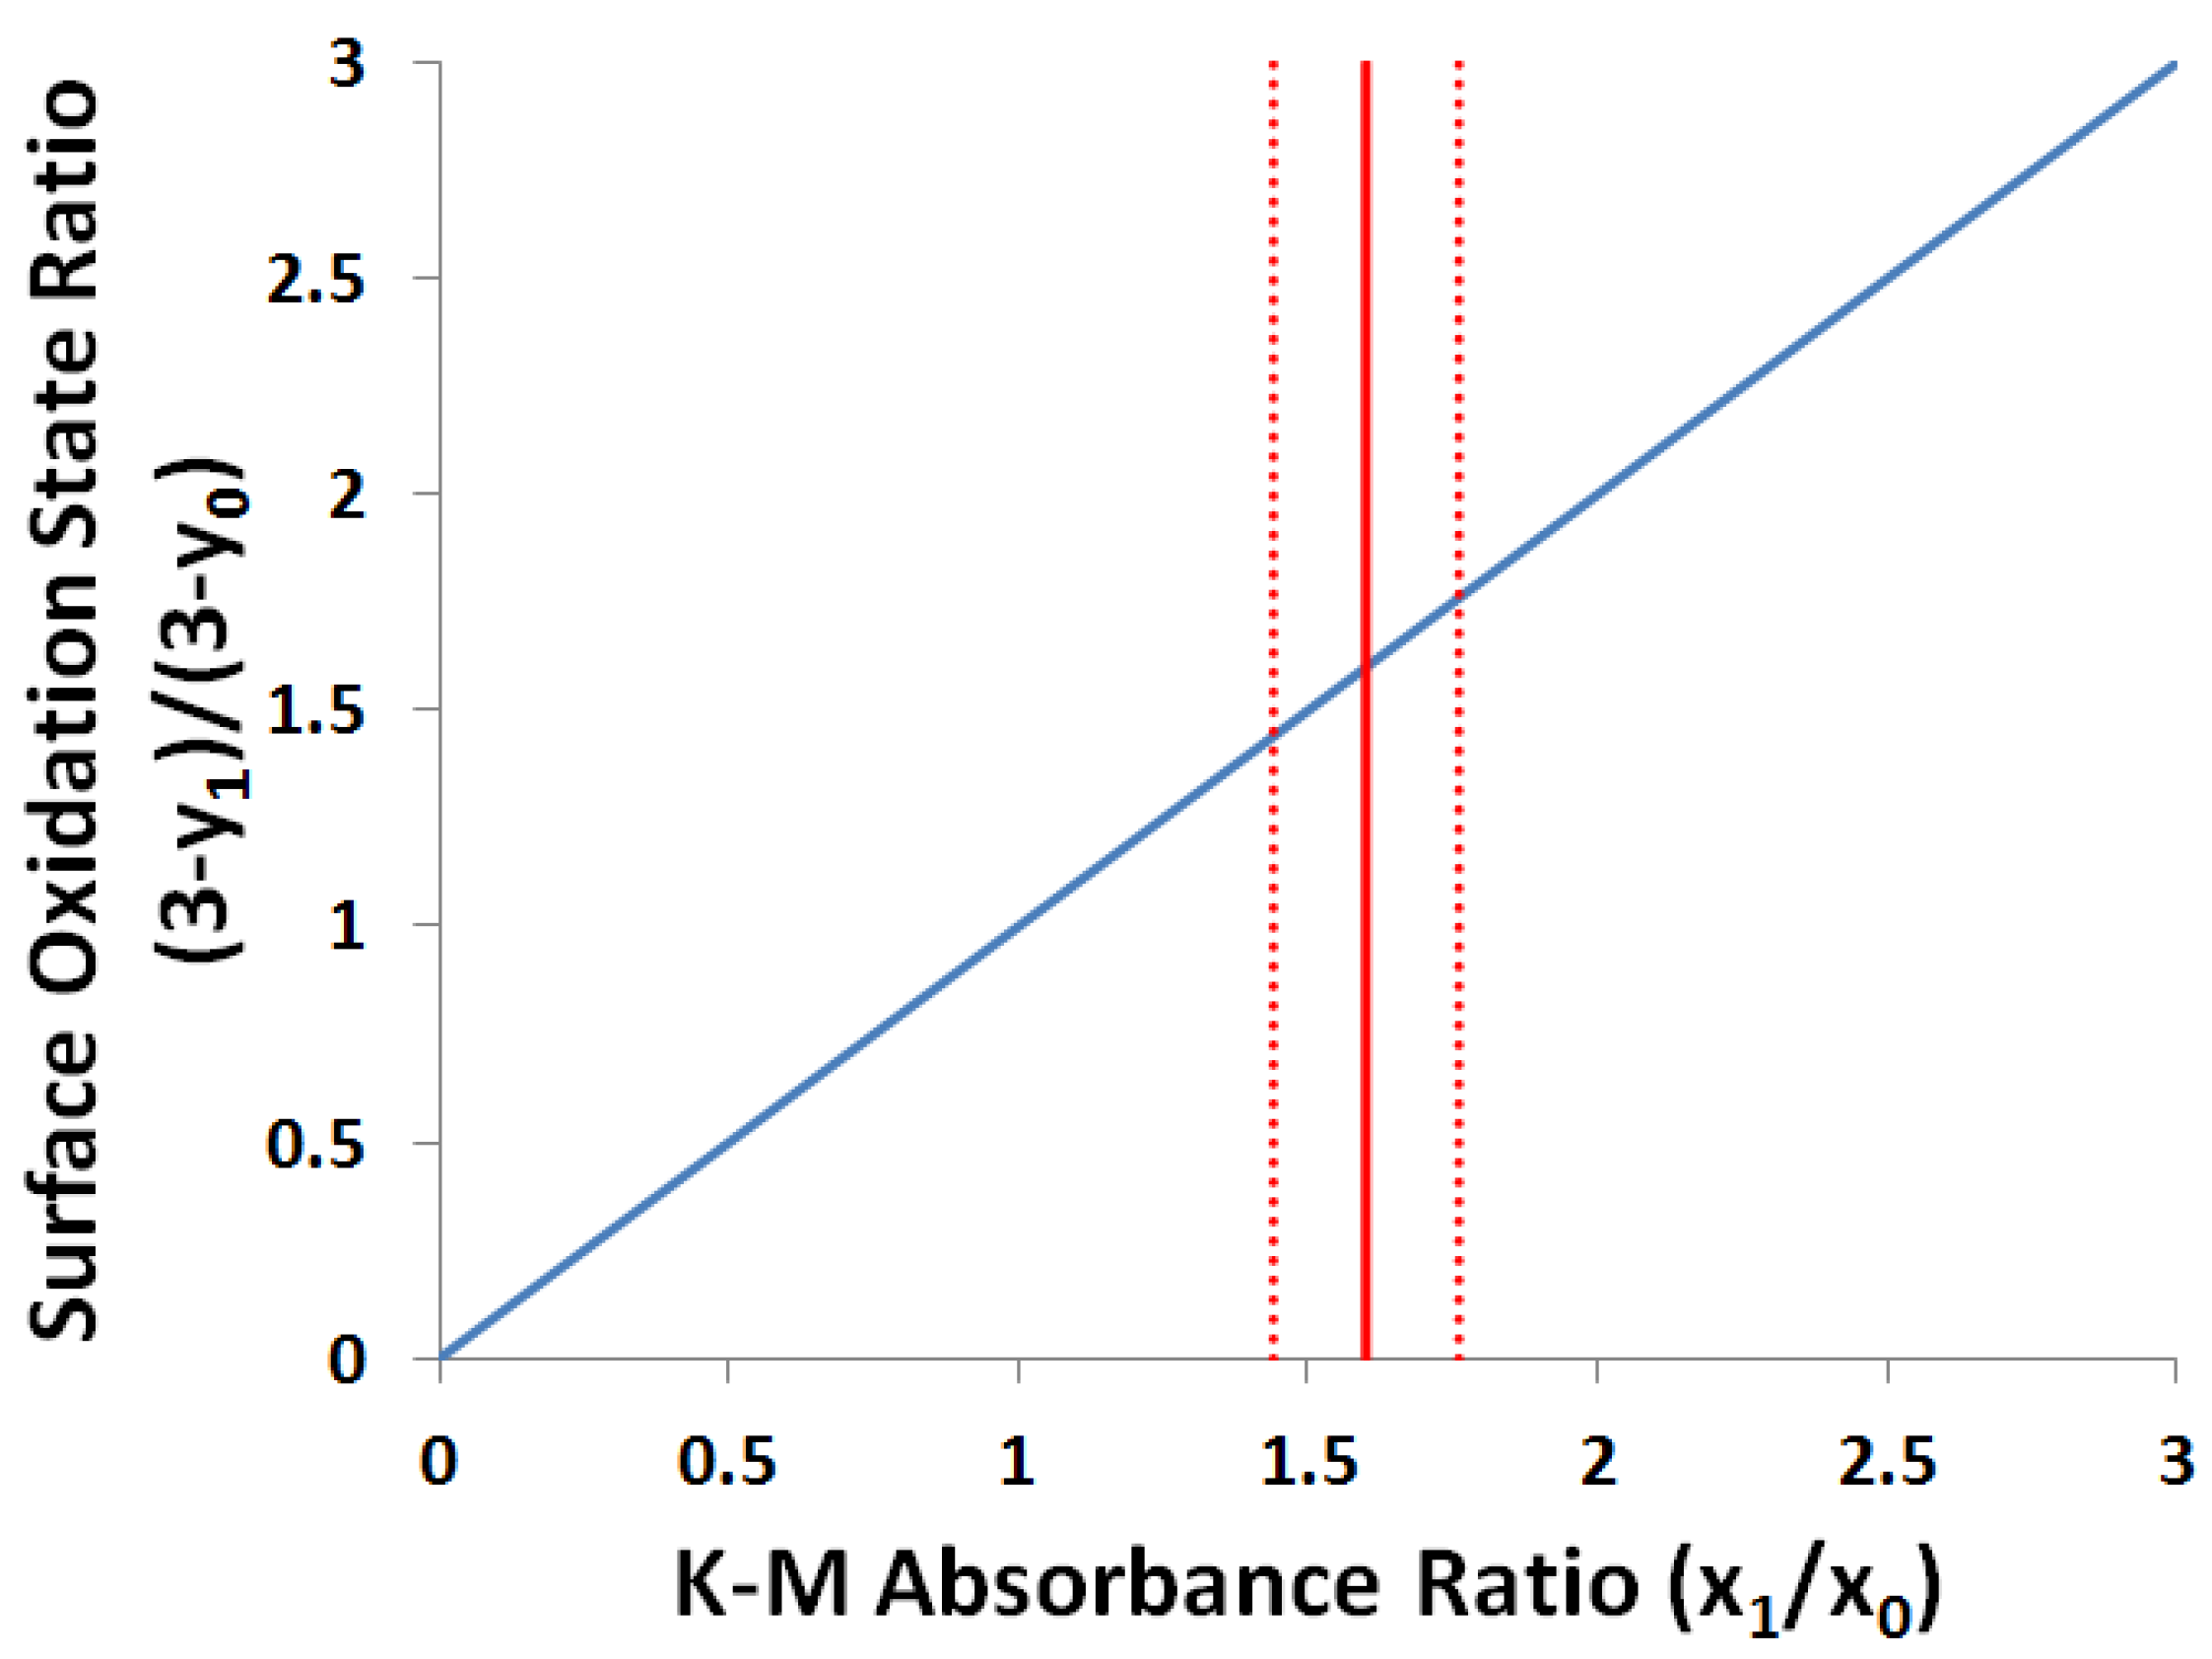
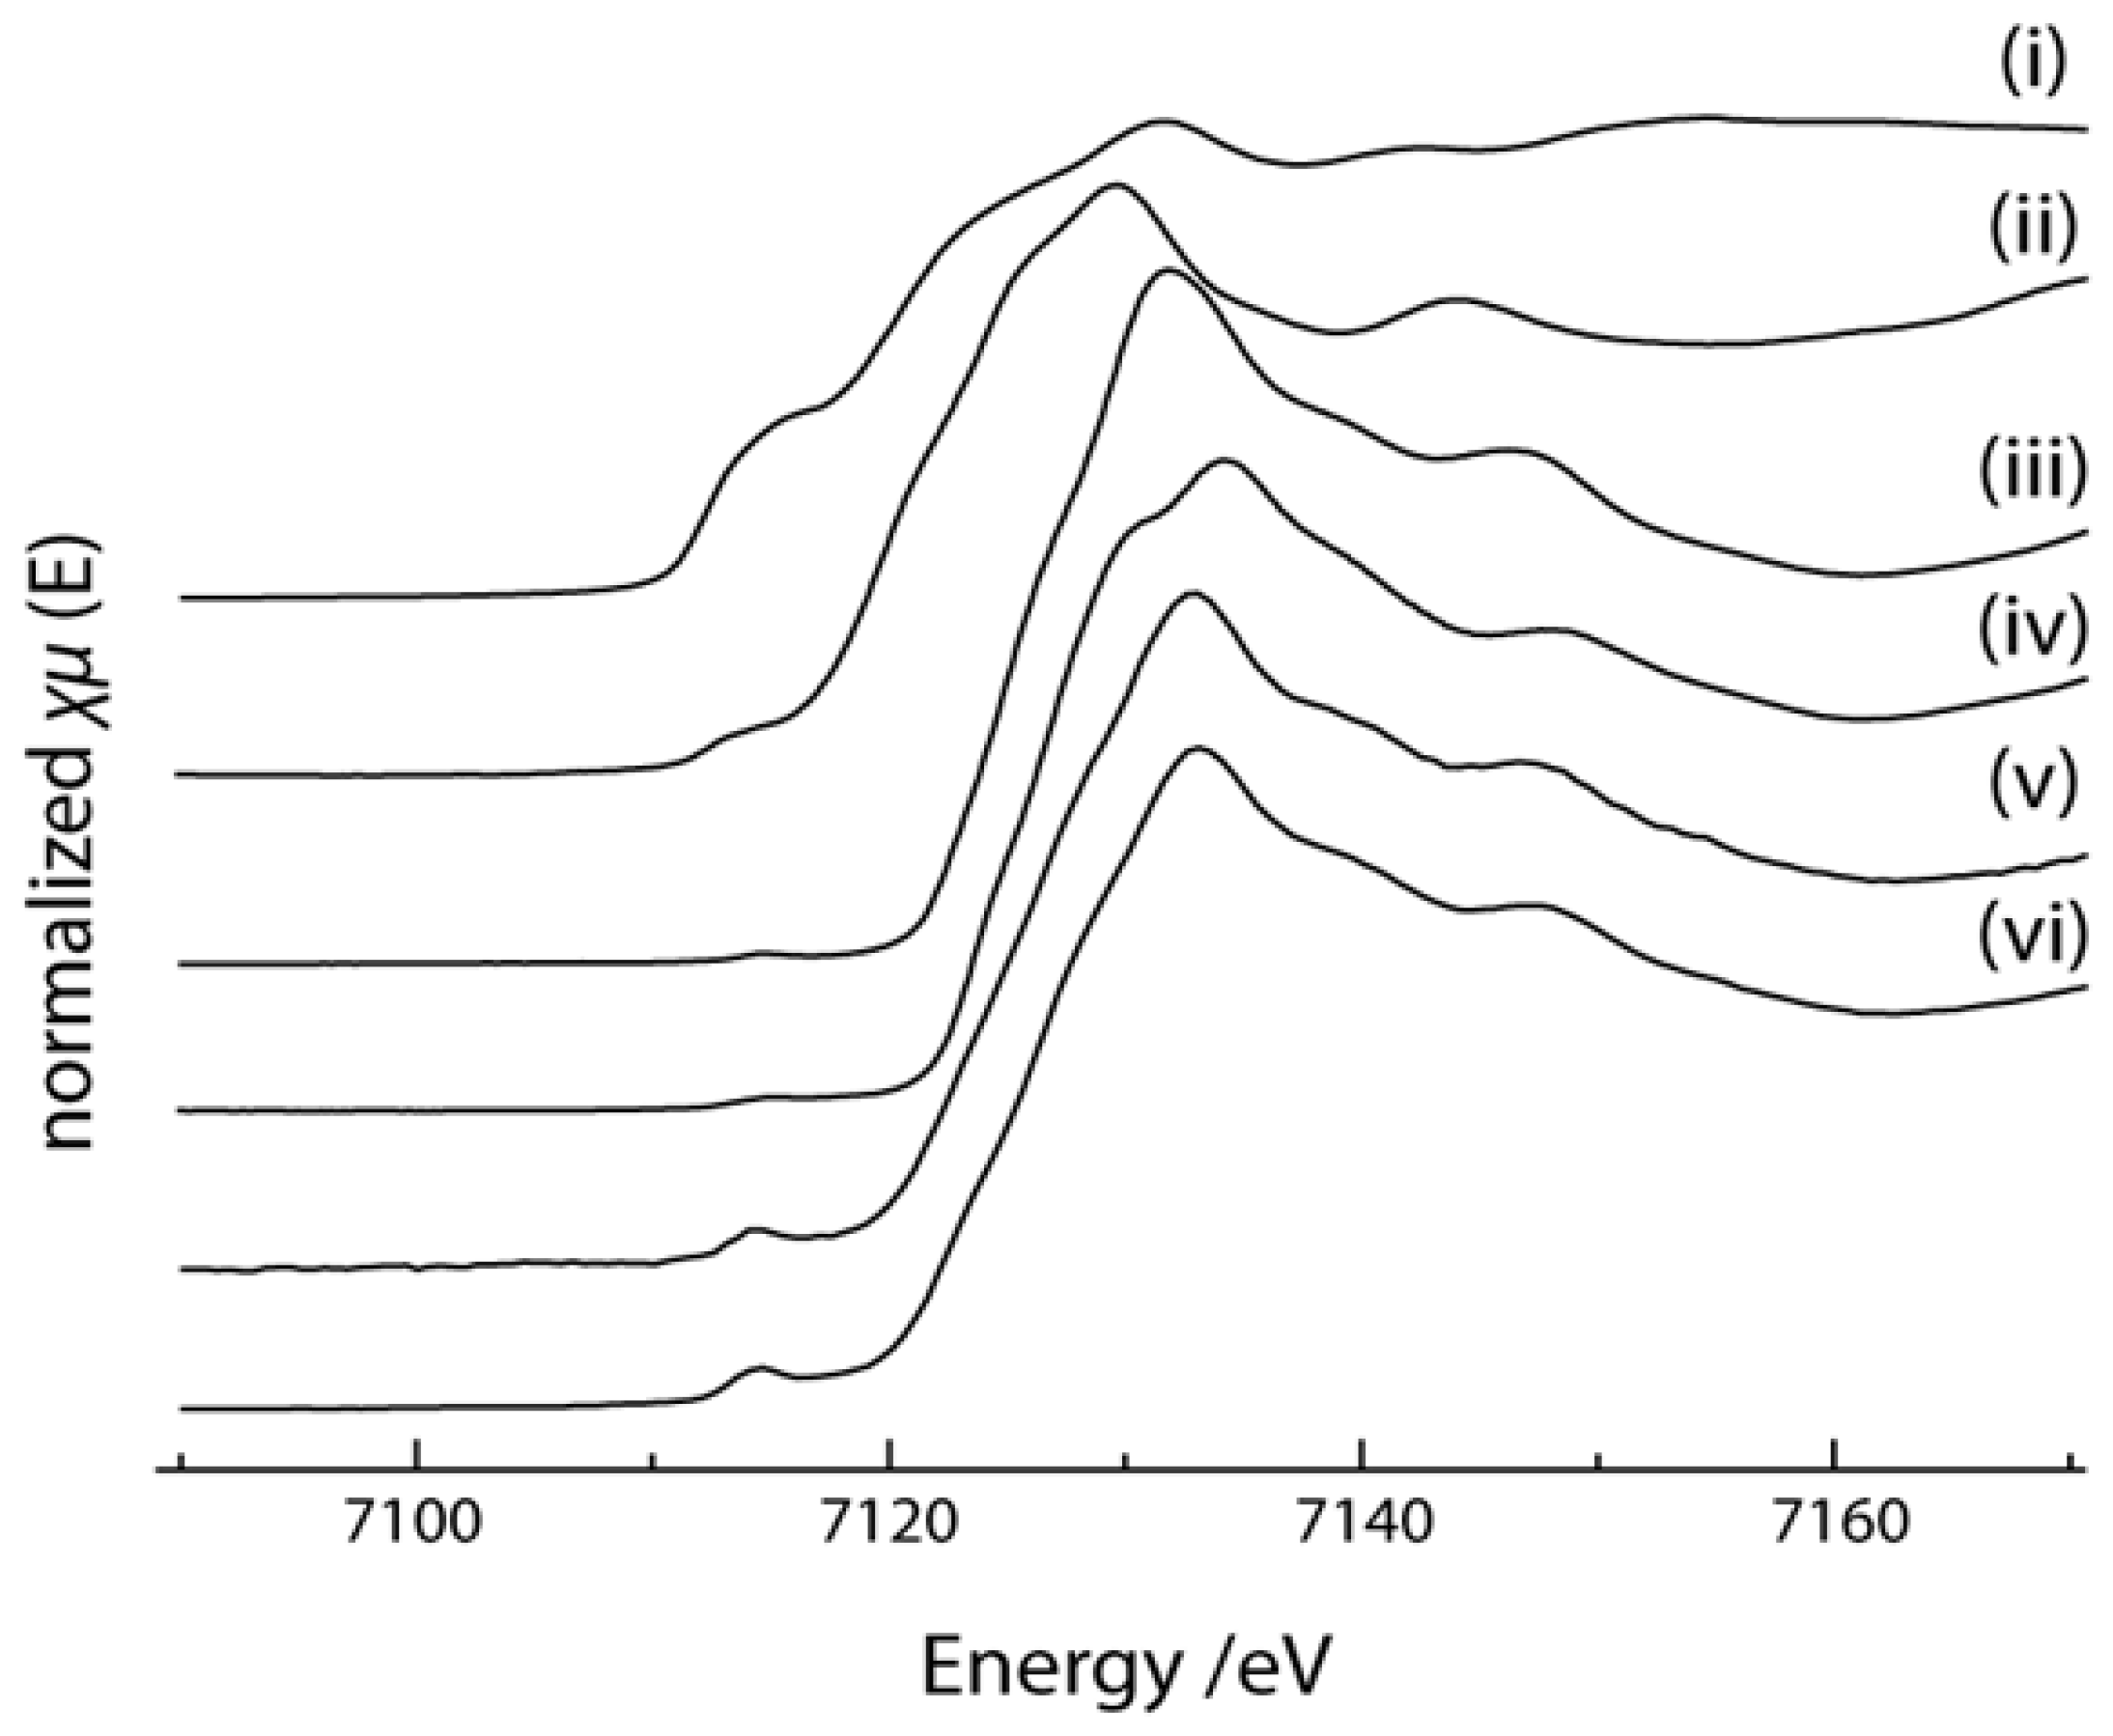
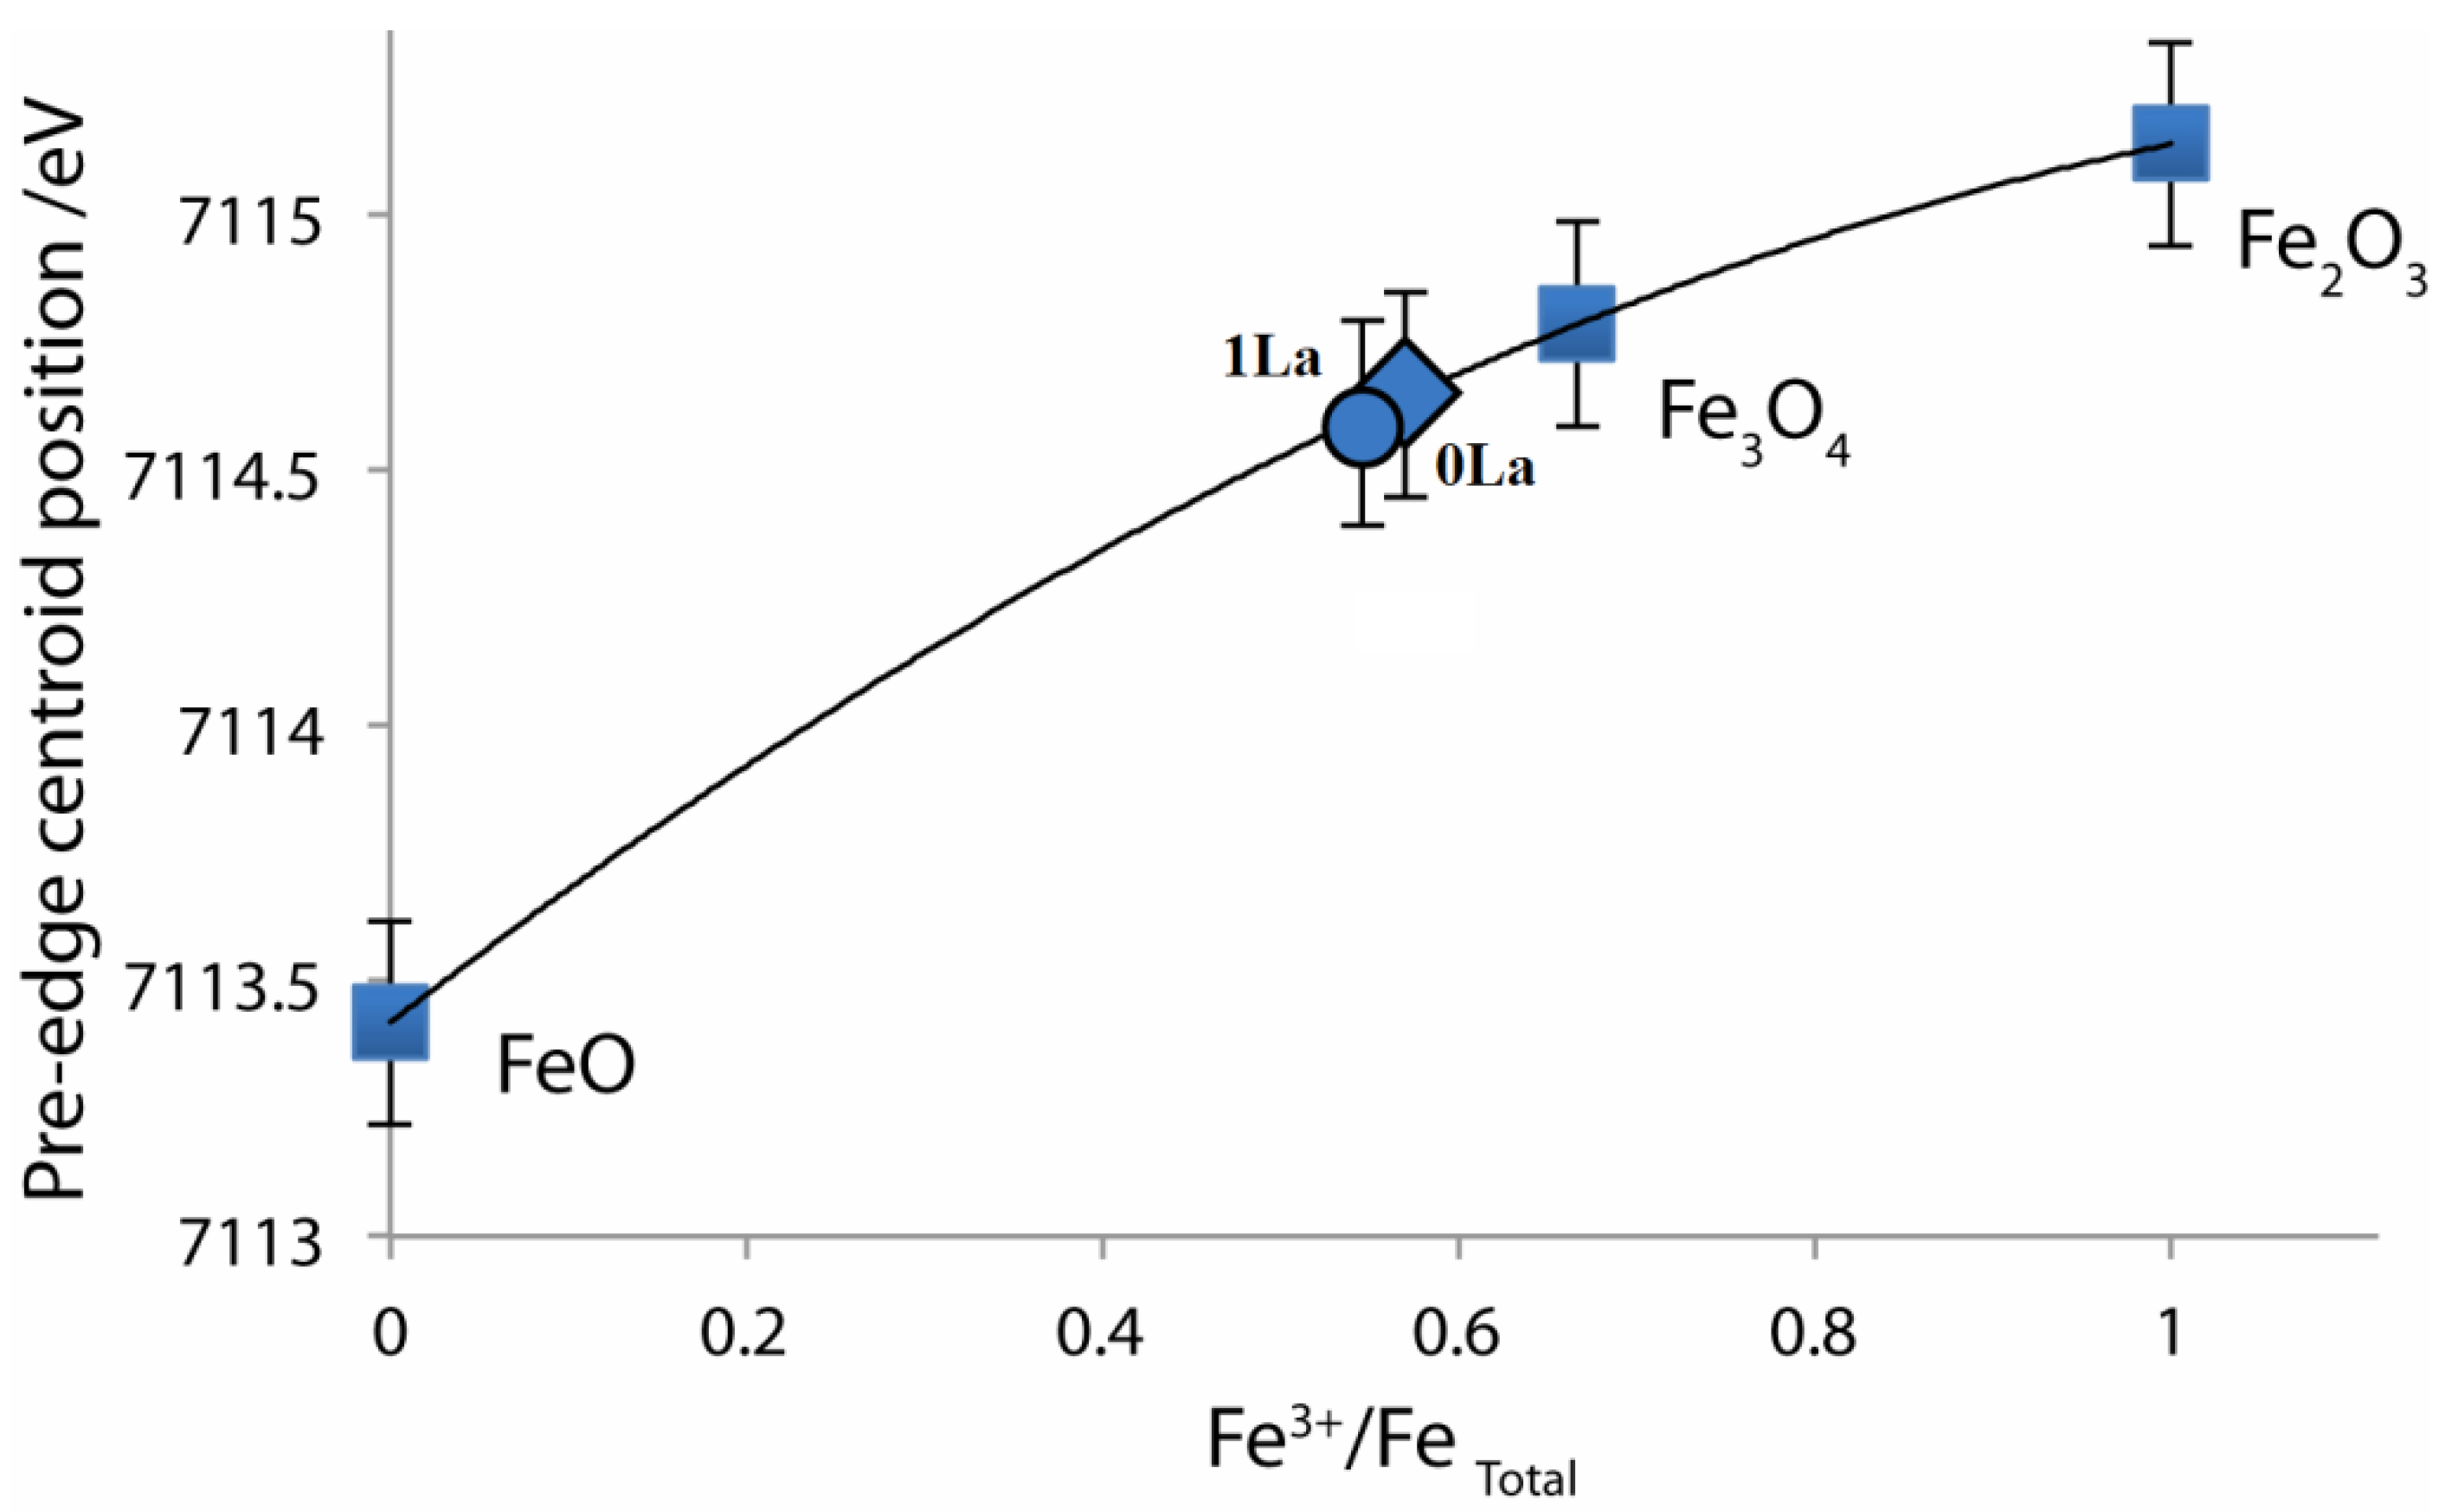
2.4. X-ray Absorption Near Edge Structure (XANES) Spectra Compared to UV-Visible Results

The XANES spectra of the 0La and 1La samples after WGS reaction, along with those of reference compounds, iron (II, III) oxides and metallic iron, are shown in the Figure 15.
Inspection of the spectral features, in particular, the position of the pre-edge feature and the position of the main edge suggest that oxidation state of iron in the samples is close to that of magnetite (+2.66), which is consistent with previous reports on iron oxide catalysts during the WSG reaction [49]. An attempt to fit the XANES spectra of the samples as linear combination of reference spectra was unsuccessful, which is not uncommon for non-stoichiometric iron oxides. Hence, to establish the oxidation state of iron in the samples, the approach of Wilke has been applied [50]. In this method, the position of the pre-edge features is determined for the reference compounds and plotted as a function of a formal oxidation state (or oxidation state measured independently, e.g., by Mössbauer spectroscopy, as demonstrated by Wilke et al. [50]) and fitting is used to obtain the chemical state for the unknown material. Figure 16 shows the position of the pre-edge peaks for all materials plotted as a function of Fe3+/Fe total. This ratio is zero when the all iron is Fe2+ and 1 when the all iron is Fe3+. Any number between zero and 1 is a combination of the +2 and +3 oxidation states. From the interpolation of this data, the Fe oxidation in the used 0La sample is +2.57, while that in 1La is +2.54.
If the correlation in Equation (5) is used to calculate the oxidation state of 1La from that of the 0La, then the predicted value for the oxidation state of Fe in 1La is +2.31 ± 0.07 for an oxidation state of +2.57 for the 0La. Results obtained from the XANES spectra show the used 1La sample is slightly more reduced than the used 0La sample, which is consistent with the UV-visible analysis. However, the UV-visible results suggest a greater difference between the oxidation states of Fe near the surface, which is not unexpected, considering that XANES detects bulk properties, while UV-visible spectroscopy is more sensitive to the surface conditions. Cations near the surface tend to be more reduced (lower oxidation state) than those in the bulk of partially reduced metal oxide catalysts [51]. Given the UV-visible absorbance data, the penetration depth of light with a wavelength of 800 nm is estimated to be close to 200 µm. Therefore, although the XANES analysis indicates that the bulk oxidation state of Fe is nearly the same in both samples, they are likely slightly different near the surface, as suggested by the UV-visible results. As shown in the previous section, if the oxidation state of Fe near the surface is +2.57 for the 0La sample, then the results from the UV-visible spectra calibration suggest an oxidation state between +2.24 and +2.38 for the 1La sample with an average of +2.31. We hypothesize that UV-visible spectroscopy is a more precise technique to use for characterizing extent of reduction of cations near the surface, as they are more relevant to describe surface kinetics and catalysis.

3. Materials and Methods

3.1. Temperature-Programmed Reduction and Oxidation (TPR and TPO)

The catalysts, prepared by co-precipitation as reported elsewhere [10] contain varying amounts of lanthana at the expense of iron(III) oxide. The five catalysts have (88 − x) wt % Fe2O3, 8 wt % Cr2O3, 4 wt % CuO and x wt % lanthana, where x = 0, 0.5, 1, 2 and 5 and are designated as 0La, 0.5La, 1La, 2La and 5La, respectively. Initially, 40 mg of catalyst were fully oxidized in flowing air (Zero Air, Airgas, Radnor, PA, USA) at 30 sccm for 60 to 90 min at 450 °C and then cooled to room temperature. The flow rate of air was controlled by a calibrated 100 sccm rotameter (OMEGA Engineering, Norwalk, CT, USA). TPR’s were performed in 10 mol % H2/Ar (5 sccm of H2 (99.95%, Airgas, Radnor, PA, USA) and 45 sccm of Ar (99.997%, Airgas, Radnor, PA, USA)) for 3 h and a temperature ramp of 10 °C/min from room temperature to 450 °C. The flow rates of H2 and Ar were controlled using calibrated mass flow controllers (Porter Instruments 201, Parker Hannifin Corp., Hatfield, PA, USA). Hydrogen consumption was quantified via concomitant mass spectrometry (MKS Cirrus 100, MKS Instruments, Andover, MA, USA). Following the first TPR (TPR 1), the samples were reoxidized (TPO 1) in flowing air at 30 sccm for three hours at a temperature ramp of 10 °C/min from room temperature to 450 °C. A similar procedure was followed by a second TPR (TPR 2) to check the cyclic reducibility of the catalysts. All experiments were performed at atmospheric pressure. Hydrogen consumption was quantified by integrating the areas under the peaks from the mass spectrometer data relative to a calibrated baseline. Reactions (6) and (7) were used to quantify the iron reduction due to hydrogen consumption, corrected by subtracting the calculated amount of hydrogen required to reduce the Cu and Cr6+ components of the catalysts according to Reactions (8) and (9):
3 Fe 2 O 3 ( s ) + H 2 ( g )   2 Fe 3 O 4 ( s ) + H 2 O ( g )
Fe 2 O 3 ( s ) + 3 H 2 ( g ) 2 Fe ( s ) + 3 H 2 O ( g )
CuO ( s ) + H 2 ( g ) Cu ( s ) + H 2 O ( g )
2 CrO 3 ( s ) + 3 H 2 ( g ) Cr 2 O 3 ( s ) + 3 H 2 O ( g )

3.2. In Situ UV-Visible Experiments

A diffuse reflectance UV-visible spectrophotometer (Varian Cary 4000, Agilent Technologies, Santa Clara, CA, USA) with a high-temperature reaction chamber (Praying Mantis™ model HVC-VUV-4, Harrick Scientific Products Inc., Pleasantville, NY, USA) was used. A 40-mg sample of catalyst, sieved to 100–250 μm agglomerate pellet size, was placed in a cup holder and supported on a quartz frit with 100 μm porosity to allow for uniform flow. The intensity of light collected from the sample surface was normalized relative to that of a fully oxidized surface of the same sample at room temperature in the Kubelka-Munk function. The absorbance vs. time data were obtained at 12,500 cm−1 (800 nm), which was where the most sensitive signal changes were observed during prior scans across the light spectrum from 12,500 cm−1 to 50,000 cm−1 (200 nm). Subsequent scans collected Kubelka-Munk absorbance vs. light energy over the 12,500 to 50,000 cm−1 (800 nm to 200 nm with 2 nm per second steps) spectrum after the temperature cooled to room temperature. Kubelka-Munk values were calibrated against quantified extents of reduction obtained during simultaneous TPR measurements, as described in the previous section. Statistical analysis was performed on the parameters of the calibration using non-linear fitting tools available in R programming language (R Development Core Team, v. 2.13.0) with 1000 points to acquire and plot the 95% confidence regions.

3.3. High-Temperature Water-Gas Shift Reaction

UV-visible scans were collected for reduced samples under high-temperature water-gas shift conditions at 400 °C and atmospheric pressure after different reaction times. The CO/Ar reactant mixture (CO (99.995%, Airgas) at 2.1 sccm and Ar at 25 sccm) was saturated with distilled water prior to entering the UV-visible reaction chamber. The partial pressure of water was assumed to be 3.2 kPa, which is the water saturation pressure at room temperature.

3.4. Powder X-ray Diffraction (XRD)

Powder X-Ray Diffraction (XRD) analysis (X’Pert Pro PANalaytical with X-Celerator detector, Malvern Panalytical B.V., Eindhoven, The Netherlands) was performed on used catalyst samples to determine the major phase of iron oxide in the catalysts post TPR or TPO. The instrument was operated at 45 kV and 40 mA, using Cu Kα1 radiation and a graphite monochromator. The results were obtained over the 2θ range of 10°–90° with 1° divergence and receiving slits and 400 s per step.

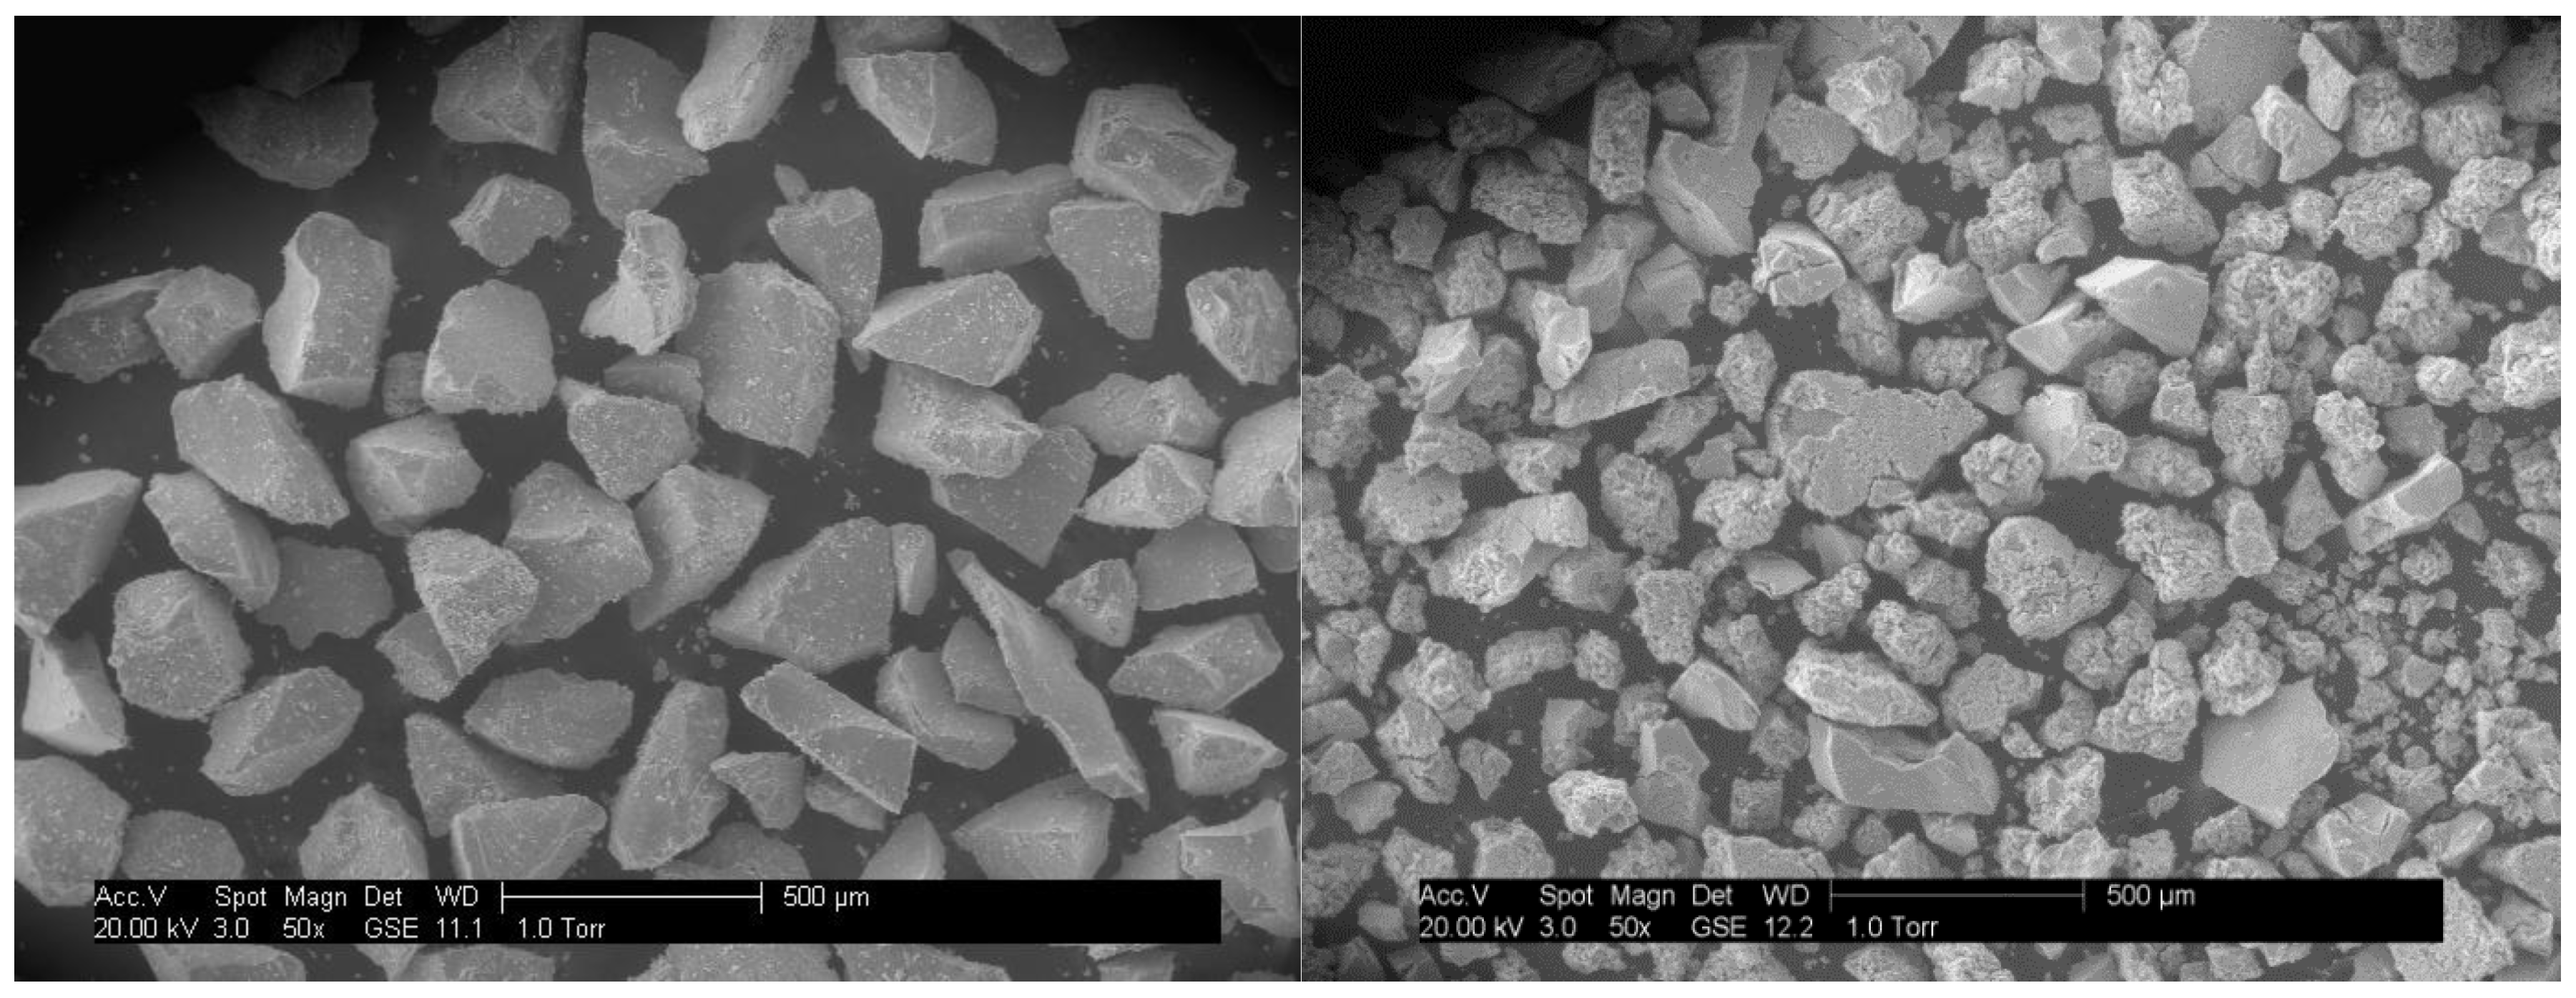
3.5. Energy Dispersive X-ray Spectroscopy (EDS) and Scanning Electron Microscopy (SEM)

An environmental scanning electron microscope (Philips, XL30, Thermo Fischer Scientific FEI, Hillsboro, OR, USA) was used to determine the elemental compositions in the catalysts and to evaluate the distribution of the components across the catalyst surface. The scans were taken at 20 keV and in low-vacuum mode, which did not require coating the non-conductive catalysts with sputtered gold or palladium. Each scan took 50 s. Scanning electron micrographs (SEM) of the fresh and used catalysts were also taken using the same microscope at 50× and 400× magnifications with a 20 keV beam voltage.

3.6. X-ray Absorption Near Edge Structure (XANES)

X-ray absorption spectroscopy (XAS) experiments were performed on the X18A beamline at the NSLS at Brookhaven National Laboratory (Upton, NY, USA). Beamline X18A is a bending magnet line, which uses a Si {1 1 1} channel-cut monochromator and a rhodium-coated toroidal focusing mirror to provide a ~1.0 mm (horizontal) and ~0.5 mm (vertical) spot size with a flux of ~2.5 × 10¹¹ photons/s at 10 keV. After alignment using the spectra obtained from the Fe foil in the reference ion chamber, three consecutive scans were averaged and recorded simultaneously with those of the sample. Samples and reference compounds were diluted with boron nitride to achieve an edge jump of ~1 and encapsulated between two Kapton foil sheets.

4. Conclusions

A thorough study on the extent of reduction of iron-based high-temperature water-gas shift catalysts using different characterization techniques has been presented in this paper. Temperature-programmed reduction studies using mass spectrometry showed that 0.5 wt % addition of lanthana as a promoter to iron-chromium-copper oxide water-gas shift catalysts enhances the reducibility of the catalysts in terms of both total hydrogen consumption and reduction temperature. However, further additions of lanthana cause the catalysts to reduce at higher temperatures and to consume more hydrogen (i.e., over-reduce), possibly due to disruption of the catalytically active Fe3O4 spinel structures by incorporation of the larger La3+. A second temperature-programmed reduction was performed on each catalyst after they were fully reoxidized to examine the re-reducibility of the catalysts. The catalyst with the 0.5 wt % lanthana appeared to be the most reducible with only an 8% decrease in extent of reduction, as opposed to a 35–45% decrease in total hydrogen consumption from the first reduction experiment for the other catalysts. Analysis via UV-visible spectrometry showed that the absorbance of light at 800 nm is very sensitive during the reduction processes of these catalysts due to alterations in the band gaps of the different iron oxide phases and could be calibrated to extent of reduction as determined during concomitant TPR. Ex situ analysis on the used catalysts also showed similar trends with the Kubelka-Munk values. The ratio of normalized absorbance correlated to the ratio of Fe oxidation states acquired from the calibration curve for the used catalysts with 0 wt % and 1 wt % lanthana. This showed that the extent of reduction for the 1 wt % catalyst was 1.1 times lower than for the 0 wt % catalyst, suggesting that the catalyst with more lanthana reduced to a larger extent during water-gas shift treatment than the one with no lanthana, resulting in lower content of the active Fe3O4 phase due to over-reduction. XANES spectra showed nearly equal extents of reduction (+2.54 for 1La and +2.57 for 0La), suggesting that UV-visible spectroscopy is a highly sensitive tool to analyze extent of reduction of cations near the surface.

Acknowledgments

The authors gratefully acknowledge funding from the Wyoming Clean Coal initiative and Brigham Young University. Use of the X18A beamline at the National Synchrotron Light Source, Brookhaven National Laboratory, was supported by the U.S. Department of Energy, Office of Science, Office of Basic Energy Sciences, under Contract No. DE-AC02-98CH10886.

Author Contributions

B.B. Hallac and J.C. Brown conceived and designed the experiments; B.B. Hallac, J.C. Brown, and E. Stavitski performed the experiments; B.B. Hallac, J.C. Brown, and E. Stavitski analyzed the data; B.B. Hallac wrote the paper, with R.G. Harrison providing editorial and senior authorship, and M.D. Argyle providing editorial, senior, and corresponding authorship.

Conflicts of Interest

The authors declare no conflict of interest.

References

  1. Twigg, M.V. Catalyst Handbook, 2nd ed.; Wolfe: London, UK, 1989. [Google Scholar]
  2. Bartholomew, C.H.; Farrauto, R.J. Fundamentals of Industrial Catalytic Processes, 2nd ed.; Wiley-InterScience: New York, NY, USA, 2005. [Google Scholar]
  3. Rhodes, C.; Hutchings, G.J. Studies of the Role of the Copper Promoter in the Iron-Chromia High Temperature Water Gas Shift Catalyst. Phys. Chem. Chem. Phys. 2003, 5, 2719–2723. [Google Scholar] [CrossRef]
  4. Rhodes, C.; Williams, B.P.; King, F.; Hutchings, G.J. Promotion of Fe3O4/Cr2O3 High Temperature Water Gas Shift Catalyst. Catal. Commun. 2002, 3, 381–384. [Google Scholar] [CrossRef]
  5. Edwards, M.A.; Whittle, D.M.; Rhodes, C.; Ward, A.M.; Rohan, D.; Shannon, M.D.; Hutchings, G.J.; Kiely, C.J. Microstructural Studies of the Copper Promoted Iron Oxide/Chromia Water-Gas Shift Catalyst. Phys. Chem. Chem. Phys. 2002, 4, 3902–3908. [Google Scholar] [CrossRef]
  6. Lei, Y.; Cant, N.W.; Trimm, D.L. Activity Patterns for the Water Gas Shift Reaction over Supported Precious Metal Catalysts. Catal. Lett. 2005, 103, 133–136. [Google Scholar] [CrossRef]
  7. Andreev, A.; Idakiev, V.; Mihajlova, D.; Shopov, D. Iron-based Catalysts for the Water-Gas Shift Reaction Promoted by First-Row Transition Metal Oxides. Appl. Catal. 1986, 22, 385–387. [Google Scholar] [CrossRef]
  8. Júnior, I.; Lima, M.; Jean-Marc, M.; Aouine, M.; Do Carmo, M.R. The Role of Vanadium on the Properties of Iron Based Catalysts for the Water Gas Shift Reaction. Appl. Catal. A Gen. 2005, 283, 91–98. [Google Scholar] [CrossRef]
  9. Hu, Y.; Jin, H.; Liu, J.; Hao, D. Reactive Behaviors of Iron-Based Shift Catalyst Promoted by Ceria. Chem. Eng. J. 2000, 78, 147–152. [Google Scholar] [CrossRef]
  10. Hallac, B.B.; Brown, J.C.; Baxter, L.L.; Argyle, M.D. A Kinetic Study on the Structural and Functional Roles of Lanthana in Iron-Based High-Temperature Water-Gas Shift Catalysts. Int. J. Hydrogen Energy 2014, 39, 7306–7317. [Google Scholar] [CrossRef]
  11. Sun, Y.; Hla, S.S.; Duffy, G.J.; Cousins, A.J.; French, D.; Morpeth, L.D.; Edwards, J.H.; Roberts, D.G. Effect of Ce on the Structural Features and Catalytic Properties of La(0.9−X)CeXFeO3 Perovskite-Like Catalysts for the High Temperature Water-Gas Shift Reaction. Int. J. Hydrogen Energy 2011, 36, 79–86. [Google Scholar] [CrossRef]
  12. Hla, S.S.; Sun, Y.; Duffy, G.J.; Morpeth, L.D.; Ilyuschechkin, A.; Cousins, A.; Edwards, J.H. Kinetics of the Water-Gas Shift Reaction Over a La0.7Ce0.2FeO3 Perovskite-Like Catalyst Using Simulated Coal-Derived Syngas at High Temperature. Int. J. Hydrogen Energy 2011, 36, 518–527. [Google Scholar] [CrossRef]
  13. Wang, T.; Ding, Y.; Lü, Y.; Zhu, H.; Lin, L. Influence of Lanthanum on the Performance of Ze-Co/Activated Carbon Catalysts in Fischer-Tropsch Synthesis. J. Nat. Gas Chem. 2008, 17, 153–158. [Google Scholar] [CrossRef]
  14. Weckhuysen, B.M.; Verberckmoes, A.A.; Debaere, J.; Ooms, K.; Langhans, I.; Schoonheydt, R.A. In Situ UV-Vis Diffuse Reflectance Spectroscopy—On Line Activity Measurements of Supported Chromium Oxide Catalysts: Relating Isobutane Dehydrogenation Activity With Cr-Speciation Via Experimental Design. J. Mol. Catal. A Chem. 2000, 151, 115–131. [Google Scholar] [CrossRef]
  15. Wachs, I.E. Recent Conceptual Advances in the Catalysis Science of Mixed Metal Oxide Catalytic Materials. Catal. Today 2005, 100, 79–94. [Google Scholar] [CrossRef]
  16. Argyle, M.D.; Chen, K.; Resini, C.; Krebs, C.; Bell, A.T.; Iglesia, E. In Situ UV-vis Assessment of Extent of Reduction During Oxidation Reactions on Oxide Catalysts. Chem. Commun. 2003, 2082–2083. [Google Scholar] [CrossRef]
  17. Argyle, M.D.; Chen, K.; Iglesia, E.; Bell, A.T. In Situ UV-vis Spectroscopic Measurements of Kinetic Parameters and Active Sites for Catalytic Oxidation of Alkanes on Vanadium Oxides. J. Phys. Chem. B 2005, 109, 2414–2420. [Google Scholar] [CrossRef] [PubMed]
  18. Ovsister, O.; Maymol, C.; Angelika, B.; Evgenii, K.V. Dynamics of Redox Behavior of Nano-Sized VOx Species Over Ti–Si-MCM-41 from Time-Resolved in Situ UV/Vis Analysis. J. Catal. 2009, 265, 8–18. [Google Scholar]
  19. Gao, X.; Jehng, J.M.; Wachs, I.E. In Situ UV-Vis-NIR Diffuse Reflectance and Raman Spectroscopic Studies of Propane Oxidation over ZrO2-Supported Vanadium Oxide Catalysts. J. Catal. 2002, 209, 43–50. [Google Scholar] [CrossRef]
  20. Sayah, E.; La Fontaine, C.; Briois, V.; Brouri, D.; Massiani, P. Silver Species Reduction upon Exposure of Ag/Al2O3 Catalyst to Gaseous Ethanol: An In Situ Quick-XANES Study. Catal. Today 2012, 189, 55–59. [Google Scholar] [CrossRef]
  21. Singh, P.; Das, A.K.; Sarkar, B.; Niemeyer, M.; Roncaroli, F.; Olabe, J.A.; Fiedler, J.; Zalis, S.; Kaim, W. Redox Properties of Ruthenium Nitrosyl Porphyrin Complexes with Different Axial Ligation: Structural, Spectroelectrochemical (IR, UV-Visible, and EPR), and Theoretical Studies. Inorg. Chem. 2008, 47, 7106–7113. [Google Scholar] [CrossRef] [PubMed]
  22. Daughtry, K.D.; Xiao, Y.; Stoner-Ma, D.; Cho, E.; Orville, A.M.; Liu, P.; Allen, K.N. Quaternary Ammonium Oxidative Demethylation: X-ray Crystallographic, Resonance Raman, and UV-Visible Spectroscopic Analysis of a Rieske-Type Demethylase. J. Am. Chem. Soc. 2012, 134, 2823–2834. [Google Scholar] [CrossRef] [PubMed]
  23. Gunter, K.K.; Miller, L.M.; Aschner, M.; Eliseey, R.; Depuis, D.; Gavin, C.E.; Gunter, T.E. XANES Spectroscopy: A Promising Tool for Toxicology: A Tutorial. Neurotoxicology 2002, 23, 127–146. [Google Scholar] [CrossRef]
  24. Atkins, P.; Shriver, D. Inorganic Chemistry; Oxford University Press: New York, NY, USA, 2006. [Google Scholar]
  25. Rao, C.N.R. Ultra-Violet and Visible Spectroscopy: Chemical Applications; Butterworth-Heinemann: London, UK, 1974. [Google Scholar]
  26. Clark, B.J.; Frost, T.; Russell, M.A. UV Spectroscopy: Techniques, Instrumentation, Data Handling; Chapman & Hall: London, UK, 1993. [Google Scholar]
  27. Tossell, J.A.; Vaughan, D.; Johnson, K.H. The Electronic Structure of Rutile, Wustite and Hematite from Molecular Orbital Calculations. Am. Mineral. 1974, 59, 319–334. [Google Scholar]
  28. Cornell, R.M.; Schwertmann, U. The Iron Oxides: Structure, Properties, Reactions, Occurrences and Uses, 2nd ed.; Wiley-VCH: New York, NY, USA, 2003. [Google Scholar]
  29. Zhang, Z.; Boxall, C.; Kelsall, G.H. Photoelectropheresis of Colloidal Iron Oxides. Part 2.—Magnetite (Fe3O4). J. Chem. Soc. Faraday Trans. 1996, 92, 791–802. [Google Scholar]
  30. Sherman, D.M. Electronic Structures of Iron(III) and Manganese(IV) (Hydr)oxide Minerals: Thermodynamics of Photochemical Reductive Dissolution in Aquatic Environments. Geochim. Cosmochim. Acta 2005, 69, 3249–3255. [Google Scholar] [CrossRef]
  31. Sherman, D.M. Electronic Stuctures of Fe3+ Coordination Sites in Iron Oxides: Applications to Spectra, Bonding, and Magnetism. Phys. Chem. Miner. 1985, 12, 161–175. [Google Scholar] [CrossRef]
  32. Christy, A.A.; Kvalheim, O.M.; Velapoldi, R.A. Quantitative Analysis in Diffuse Reflectance Spectrometry: A Modified Kubelka-Munk Equation. Vib. Spectrosc. 1995, 9, 19–27. [Google Scholar] [CrossRef]
  33. Džimbeg-Malčić, V.; Barbarić-Mikočević, Ž.; Itrić, K. Kubelka-Munk Theory in Describing Optical Properties of Paper (I). Tech. Gazette 2011, 18, 117–124. [Google Scholar]
  34. Kubelka, P.; Munk, F. Ein Beitrag zur Optik der Farbanstriche (A Contribution to the Optics of Paint). Z. Tech. Phys. 1931, 12, 593–601. [Google Scholar]
  35. Schuster, A. Radiation Through a Foggy Atmosphere. Astrophys. J. 1905, 21, 1–22. [Google Scholar] [CrossRef]
  36. Wyszecki, G.; Stiles, W.S. Color Science, 2nd ed.; John Wiley & Sons: New York, NY, USA, 2000. [Google Scholar]
  37. Doak, J.; Gupta, R.K.; Manivannan, K.; Ghosh, K.; Kahol, P.K. Effect of Particle Size Distributions on Absorbance Spectra of Gold Nanoparticles. Physica E 2010, 42, 1605–1609. [Google Scholar] [CrossRef]
  38. Van de Hulst, H.C. Light Scattering by Small Particles; John Wiley & Sons: New York, NY, USA, 1957. [Google Scholar]
  39. Koningsberger, D.C.; Prins, R. X-ray Absorption: Principles Applications Techniques of EXAFS SEXAFS and XANES, Chemical Analysis; John Wiley & Sons: New York, NY, USA, 1988. [Google Scholar]
  40. Puig-Molina, A.; Cano, F.M.; Janssens, T.V.W. The Cu Promoter in an Iron-Chromium-Oxide Based Water-Gas Shift Catalyst under Industrial Conditions Studied by In-Situ XAFS. J. Phys. Chem. C 2010, 114, 15410–15416. [Google Scholar] [CrossRef]
  41. Gonzalez, J.C.; Gronzalez, M.G.; Laborde, M.A.; Moreno, N. Effect of Temperature and Reduction on the Activity of High Temperature Water Gas Shift Catalysts. Appl. Catal. 1986, 20, 3–13. [Google Scholar] [CrossRef]
  42. Kundakovic, L.; Flytzani-Stephanopoulos, M. Reduction Characteristics of Copper Oxide in Cerium and Zirconium Oxide Systems. Appl. Catal. A 1998, 171, 13–29. [Google Scholar] [CrossRef]
  43. Greenwood, N.N.; Earnshaw, A. Chemistry of the Elements; Butterworth-Heinemann: London, UK, 1997. [Google Scholar]
  44. Li, X.; Wang, Y.; Xu, P.; Zhang, Q.; Nie, K.; Hu, X.; Kong, B.; Li, L.; Chen, J. Effects of Temperature and Wavelength Choice on In-Situ Dissolution Test of Cimetidine Tablets. J. Pharm. Anal. 2013, 3, 71–74. [Google Scholar] [CrossRef]
  45. Zhu, Y.; Sun, D.; Huang, Q.; Jin, X.; Liu, H. UV-vis Spectra of Perovskite Iron-Doped Ba0.72Sr0.28TiO3. Mater. Lett. 2008, 62, 407–409. [Google Scholar] [CrossRef]
  46. Kim, J.Y.; Magesh, G.; Youn, D.H.; Jang, J.; Kubota, J.; Domen, K.; Lee, J.S. Single-Crystalline, Wormlike Hematite Photoanodes for Efficient Solar Water Splitting. Sci. Rep. 2013, 3, 2681. [Google Scholar] [CrossRef] [PubMed] [Green Version]
  47. Sherman, D.M.; Waite, T.D. Electronic Spectra of Fe3+ Oxides and Oxide Hydroxides in the Near-IR to Near-UV. Am. Mineral. 1985, 70, 1262–1269. [Google Scholar]
  48. Popa, T.; Xu, G.; Barton, T.F.; Argyle, M.D. High Temperature Water Gas Shift Catalysts with Alumina. Appl. Catal. A Gen. 2010, 379, 15–23. [Google Scholar] [CrossRef]
  49. Patlolla, A.; Carino, E.V.; Ehrlich, S.N.; Stavitski, E.; Frenkel, A.I. Application of Operando XAS, XRD, and Raman Spectroscopy for Phase Speciation in Water Gas Shift Reaction Catalysts. ACS Catal. 2012, 2, 2216–2223. [Google Scholar] [CrossRef]
  50. Wilke, M.; Hahn, O.; Woodland, A.B.; Rickers, K. The Oxidation State of Iron Determined by Fe K-Edge XANES—Application to Iron Gall Ink in Historical Manuscripts. J. Anal. At. Spectrom. 2009, 24, 1364–1372. [Google Scholar] [CrossRef]
  51. Labinger, J.A.; Ott, K.C. Is There a Difference Between Surface and Bulk Oxidation Levels in Partially Reduced Metal Oxide Catalysts? Evidence from Methane Oxidative Coupling Kinetics. Catal. Lett. 1990, 4, 245–250. [Google Scholar] [CrossRef]
Figure 1. First temperature-programmed reduction profiles of all the catalysts (TPR 1, 10 mol % H2/Ar, total flow = 50 sccm, ramp rate = 10 °C/min). 0.5La catalyst starts reducing at the lowest temperature.
Catalysts 08 00063 g001
Figure 2. Second temperature-programmed reduction profiles of most of the catalysts (TPR 2, 10 mol % H2/Ar, total flow = 50 sccm, ramp rate = 10 °C/min). 0.5La catalyst has the highest hydrogen consumption.
Catalysts 08 00063 g002
Figure 3. H2O release during initial oxidation of the 0La catalyst and O2 consumption during the temperature-programmed oxidation following TPR 1. Oxygen is consumed as metallic Fe and other reduced forms of iron oxides oxidize to Fe2O3.
Catalysts 08 00063 g003
Figure 4. XRD of catalysts after temperature-programmed reduction treatments (TPR 1 and TPR 2). Metallic Fe is the major form of iron in samples after TPR 1. The peaks for metallic Fe are less intense for samples after TPR 2.
Catalysts 08 00063 g004
Figure 5. XRD of 0La catalyst after the final temperature-programmed oxidation. The catalyst is oxidized with Fe2O3 as the major bulk phase of iron.
Catalysts 08 00063 g005
Figure 6. UV-vis absorbance vs. time for the 0La, 0.5La and 1La catalysts during TPR 1 and TPR 2. The absorbance signal increases simultaneously with the increase of the hydrogen consumption signal from the mass spectrometer.
Catalysts 08 00063 g006
Figure 7. Kinetic spectra (absorbance vs. time) for the 0La catalyst during TPR 1, TPO 1 and TPR 2 combined on the same coordinates.
Catalysts 08 00063 g007
Figure 8. Absorbance scans of a fully oxidized 1La sample obtained at 22 °C and 450 °C. Higher temperatures cause the absorbance signal to increase.
Catalysts 08 00063 g008
Figure 9. Kubelka-Munk scans for: (a) 0.5La catalyst post TPR 1; (b) 0La catalyst post TPR 1; (c) 1La catalyst post TPR 1; (d) 0.5La catalyst post TPR 2; (e) 1La catalyst post TPR 2; (f) 0La catalyst post TPR 2; (g) 0La catalyst post TPO 1; (h) 0.5La catalyst post TPO 1; (i) 1La catalyst post TPO 1.
Catalysts 08 00063 g009
Figure 10. Calibration curve of surface Fe oxidation state as a function of Kubelka-Munk values with 10% error bars at 12,500 cm−1 and using TPR 1 and TPR 2 K-M values for the 0La, 0.5La and 1La catalysts.
Catalysts 08 00063 g010
Figure 11. In situ Kubelka-Munk spectra for the 1La catalyst under WGS reaction. The Kubelka-Munk values are higher than the values obtained during TPR experiments.
Catalysts 08 00063 g011
Figure 12. Ex situ analysis after 240 h of WGS reaction. The spectra shown are normalized absorbance for (a) used 0La catalyst; (b) used 1La catalyst.
Catalysts 08 00063 g012
Figure 13. SEM images of calcined fresh (left) and used (right) 0La catalyst. The images show a change in particle size distribution after the catalyst was exposed to reaction conditions.
Catalysts 08 00063 g013
Figure 14. The ratio of surface Fe oxidation states in 1La to the oxidation state in 0La as a function of the ratio of the normalized absorbance. The figure shows the 95% upper and lower bounds of the regression.
Catalysts 08 00063 g014
Figure 15. XANES region of the XAS spectra for (i) metal Fe foil; (ii) ferrous oxide, FeO; (iii) magnetite, Fe3O4; (iv) hematite, Fe2O3; (v) 0La sample after WGS reaction; (vi) 1La sample after WGS reaction. The pre-edge energies for both samples are close to the energy of magnetite.
Catalysts 08 00063 g015
Figure 16. Interpolation of Fe oxidation state in 0La and 1La samples as a combination of Fe3+ and Fe2+, which is predicted to be around +2.57.
Catalysts 08 00063 g016
Table 1. Extent of reduction of catalysts for TPR 1 and TPR 2 (10 mol % H2/Ar, total flow = 50 sccm).
Catalyst IDTPR 1 (First Peak) % EOR to Fe3O4 aTPR 1 (Both Peaks) % EOR to Fe aTPR 2 % EOR to Fe
0La428242
0.5La537872
1La678553
2La7989N/A
5La828957
a EOR is Extent of Reduction.
Table 2. Slope, intercept and coefficient of determination for the oxidation states vs. K-M calibration curve.
SlopeInterceptr2
−6.05 ± 0.393.00 ± 0.130.977

