Article

Catalytic Conversion of Model Tars over Carbon-Supported Ni and Fe

1
Department of Wood Engineering, Chemical Engineering School, University of Bio-Bio, Concepcion 4030000, Chile
2
Group of Nanomaterials and Catalysts for Sustainable Processes (NanoCatpPS), Wood Engineering Department, University of Bio-Bio, Concepcion 4030000, Chile
3
Department of Chemical Engineering, University of Concepcion, Concepcion 4030000, Chile
4
Unit of Technological Development, University of Concepcion, Concepcion 4030000, Chile
5
Fraunhofer UMSICHT, Institute for Environmental, Safety and Energy Technology, 46047 Oberhausen, Germany
*
Authors to whom correspondence should be addressed.
Catalysts 2018, 8(3), 119; https://doi.org/10.3390/catal8030119
Submission received: 9 February 2018 / Revised: 5 March 2018 / Accepted: 15 March 2018 / Published: 17 March 2018

Abstract

:
Tar removal from gasification gases is a determinant step to guarantee the operational feasibility of gasification-to-chemicals/energy systems. This study aimed to develop novel carbon-supported catalysts for the elimination of tarry aromatics (toluene, naphthalene and benzene) from gasification gases. Effects of reaction temperature (700 < T < 900 °C) and catalyst nature (Fe0 and Ni0) on the activity were assessed by considering thermo-catalytic conversion and steam reforming, under a simulated gasification gas. The catalysts (Ni and Fe) and support (AC) were characterized by X-ray diffraction (XRD), N2 physisorption, thermogravimetric analysis (TGA), transmission electron microscopy (TEM) and compositional analyses. Both catalysts and support, presented a mesoporous-like texture with a considerable high surface area (690 < SBET < 743 m2/g). Furthermore, dispersion of the metal nanoparticles (active phase) was uniform as confirmed by TEM images. Results from activity tests suggest that Ni/AC has higher effectivity for converting tars than Fe/AC, as confirmed by the low apparent activation energies (34 < Eapp < 98 kJ/mol) for naphthalene and benzene conversion between 700 and 900 °C. The conversion was 100% above 850 °C; nevertheless; below 750 °C, a sharp reduction in benzene conversion was observed, which was attributed to reversible carbon deposition.

1. Introduction

Biomass is one of the most promising sources to fulfill energy and chemical demands of society due to its abundance, energy content, renewability, CO2 neutrality and the possibility of conversion to high-value-added products [1,2]. These features have drawn significant attention for the creation of a bio-based economy, which implies the enhancement of biomass use to the same branches as fossil resources. One of the traditional and most discussed application for biomass is its use as feedstock in the so-called gasification-to-energy/chemicals systems. Through these processes, the original biomass is converted into a producer gas, which can further be used as a platform for producing chemicals or as fuel in conventional energy generation cycles. However, depending on the reactor design, biomass composition and operation conditions, this gas can also contain impurities such as NH3, H2S, HCl, particulate matter, alkali metals and tars [1,3,4]. Tar is a generic term used to group all the heavy organic compounds present in the producer gas (e.g., naphthalene and heterocyclic aromatic hydrocarbons). These organic mixtures condense in pipes, filters, or heat exchangers installed downstream the gasifier, leading to the mechanical breakdown of the entire system. Hence, independently of the final application, the gaseous impurities (especially tars) present in biomass-derived gasification gases, must be removed to allow stable operation of the downstream systems [5,6]. The removal of this so-called “contaminants” from producer gas can be done through physical and chemical post-treatments. Among several, the hot-gas catalytic systems are considered a promising method for treating gasification gases because of the fast reaction rate, reliability and ability to increase the concentration of useable gases (CO, H2) [7,8,9,10]. Therefore, the design of catalysts is crucial in the development of this technology; an affordable catalyst must be active for converting tars, resistant to deactivation, easily regenerated, inert to the reaction environment and inexpensive [3,7,8].
Until now, a wide variety of materials have been tested as catalysts for tar removal, the most being: calcined rocks and dolomites [7,8,9], iron-based [8,10,11], Ni-based [11,12,13,14], bimetallic industrial catalysts [15,16] and carbons or chars as catalysts or support [17,18]. The main limitations of inorganic-supported catalysts for tar elimination are the deposition of coke and soot on the surface [8], catalyst sintering and poisoning and their relatively high cost [3,19].
Nickel is the most widespread group VIII metal used as catalyst for the steam reforming of hydrocarbons to syngas and hydrogen production in oil refineries. Commercial Ni steam reforming catalysts are designed for use in fixed bed applications and are sensible to coke formation which leads to a rapid deactivation [3,8,13]. Most of the commercial Ni catalysts are supported by relatively expensive materials (e.g., Al2O3, MgO, dolomite, olivine and activated charcoal) [14,20] and needs of complex regeneration systems and large quantities of energy and time in their preparation. These catalysts have been tested in the conversion of ethanol, ethylene and tars and it is accepted that the most active phase for hydrocarbon conversion is metallic nickel (Ni0) [11], which is also known for its ability to activate the H2 and CO2 molecules [21,22]. Simell et al. [23] found that Ni/Al2O3 completely decomposed the tars produced in a fluidized bed pilot scale gasifier running on different biomass sources at 900 °C. Sutton et al. [24] compared several Ni-supported catalysts, prepared either by wet-impregnation or co-precipitation, for tar reduction from peat pyrolysis; best results were obtained for the alumina and ZrO2 and TiO2-supported catalysts at 800 °C. The increase of activity was attributed to the capacity of the support to provide high metal dispersion and to their resistance to coke deposition. Moreover, other authors have investigated the use of bimetallic Ni-Mo catalysts and they removed 100% of tars at moderate temperatures [22]. Courson et al. [12] found that the metal-support interactions play an essential role in the catalytic activity of Ni-olivine mixtures providing for the catalyst against sintering. Wang et al. [13] used a Ni catalyst to reduce both ammonia and tars and they found good activity in the elimination of NH3.
On the other hand, metallic iron (Fe0) is considered highly active for breaking C-C bonds; due to this, iron-containing materials are periodically used in the conversion of aromatic hydrocarbons such as benzene and toluene (two of the major components in biomass tar) into simpler molecules [25]. In this sense, Chianese et al. [15] reported on the performance of an industrial Fe/Cr catalyst in the high temperature water gas shift (HT-WGSR), using dual fixed bed reactors fed with a tar-rich synthesis gas derived from biomass. The Fe/Cr catalyst showed a good performance for the HT-WGSR, while it was active for adsorption of H2S. Furthermore, authors state that, after 800 h of operation the catalyst remained stable without evidences of deactivation due to tar deposition. Moreover, iron oxides possess various physicochemical properties, for example, Fe2O3 (oxidation), Fe3O4 (magnetism), possibly enhancing the catalytic activity or decreasing the coke deposition during tar decomposition. Iron catalysts integrated to biomass gasification units have been studied and showed a significant reduction of tar (up to 100%), although its stability was much lower than observed for dolomites [26]. Recently Uddin et al. [27] reported on the catalytic gasification of volatiles and tars in a two-stage gasifier at a constant temperature, primarily 600 °C, using iron oxides as catalyst in a second stage. The catalyst possessed activity and converted more than 90% of the volatile matter; after being used, the material was recovered as Fe2O3. Meanwhile, unsupported iron catalysts have also attracted the attention of researchers. Thus, for example, Nemanova et al. [28] reported the successful use of five Fe-based catalysts and the effect of iron granules on biomass tar decomposition.
Recent interest in using carbon-supported metals or carbon-metallic nanoparticle mixtures for tar removal has emerged [29]. The attractiveness for carbons is based on their intrinsic and tailorable properties such as unique electronic properties, thermal stability and high mechanical strength [21,22]. Accordingly, chars from coal and biomass have been reported to be inexpensive catalysts with fair performance in tar removal [18]. Pioneering work of Abu El-Rub et al. [17] compared the activity of biochar to other catalysts that are commonly used for tar decomposition (calcined dolomite, olivine and nickel supported on SiO2 and Al2O3). In this study, phenol (8–13 g/Nm3) and naphthalene (40 or 90 g/Nm3) were used as model tars and the tests were carried out at 700 °C and 900 °C in the presence of common gasification gases (CO2, H2O and N2). At 900 °C all the catalysts showed high activity and phenol was converted entirely. In a similar study, Wang et al. [13] investigated char and char-supported nickel catalysts for secondary syngas cleanup and conditioning; latter were prepared by mechanically mixing NiO and char particles in various ratios and achieved 97% tar removal. In a more recent study, Hu et al. [30] demonstrated that char-supported Ni was effective for removing polycyclic aromatics, O-containing and heterocyclic compounds.
A critical issue in using carbon supports is the control of its textural properties, such as the surface area and pore size distribution. The former is desirable to be in the range of mesopores (2 to 50 nm) to allow maximum access of tar molecules (i.e., toluene 0.68 nm) to the internal surface of pores and to promote their interaction with both the carbon surface sites and the metals [31]. Significant drawback for using carbon-supported catalysts is the fact that, under the gasification atmosphere, the support can be burnt or gasified leading to metal sintering and thereof to the irreversible deactivation of the catalyst. On the other hand, Hu et al. [30] demonstrated that, the consumption of support (through carbon gasification and Boudouard’s reactions) could lead to the carbothermal reduction of the metallic phases. In a recent paper, Arteaga et al. [32] demonstrated that ammonia-based salts could be used as doping element to increase the thermal resistance of carbon materials developed from cellulose.
Therefore, the main objective of this study is the synthesis of new carbon-supported catalysts for tar conversion. The analyses are developed by considering catalysts effectiveness for converting major tar constituents (toluene, benzene, naphthalene) and including experiments for thermo-catalytic decomposition and steam reforming. The thermal resistance of the support will be controlled by impregnation of the carbon precursor with ammonia-based salts which are well-known flame retardants. Properties of support and catalysts are analyzed by XRD, BET, TEM and compositional analyses.

2. Results

2.1. Catalyst Characterization

2.1.1. Compositional and Textural Properties

The elemental composition of the catalyst support (C: 90%, N: 3.9%, H: 2.1%, O: 4%, S: Bellow Detection Limit (BDL) -on dry-ash free basis) exhibited a prevalence of elemental carbon, which is typical of biomass-derived activated carbons [33]. Furthermore, this analysis confirmed the absence of SOx groups in the material, which demonstrates that (NH4)2SO4 decomposes (below 450 °C). Thus there are no sulfur species that could interfere with its catalytic behavior. The Ni and Fe metal loadings, measured by inductively coupled plasma optical emission spectrometry (ICP-OES), were in good agreement with that estimated by theoretical mass balance (see Table 1), which corroborated the effectiveness of the impregnation procedure.
The support (AC) is mesoporous according to the IUPAC classification method. Even when the mean pore sizes of support, Ni/AC and Fe/AC are relatively small (<6.0 nm), they are at least one order of magnitude higher than the kinetic diameter (σ) of the most common tars [34]. Variations in the textural properties (Vp, Dp and SBET) of the support and catalysts were small, which suggests that the impregnation with the active phase followed by the metal reduction resulted in small cluster sizes and a good distribution of the Me0 over the support surface.

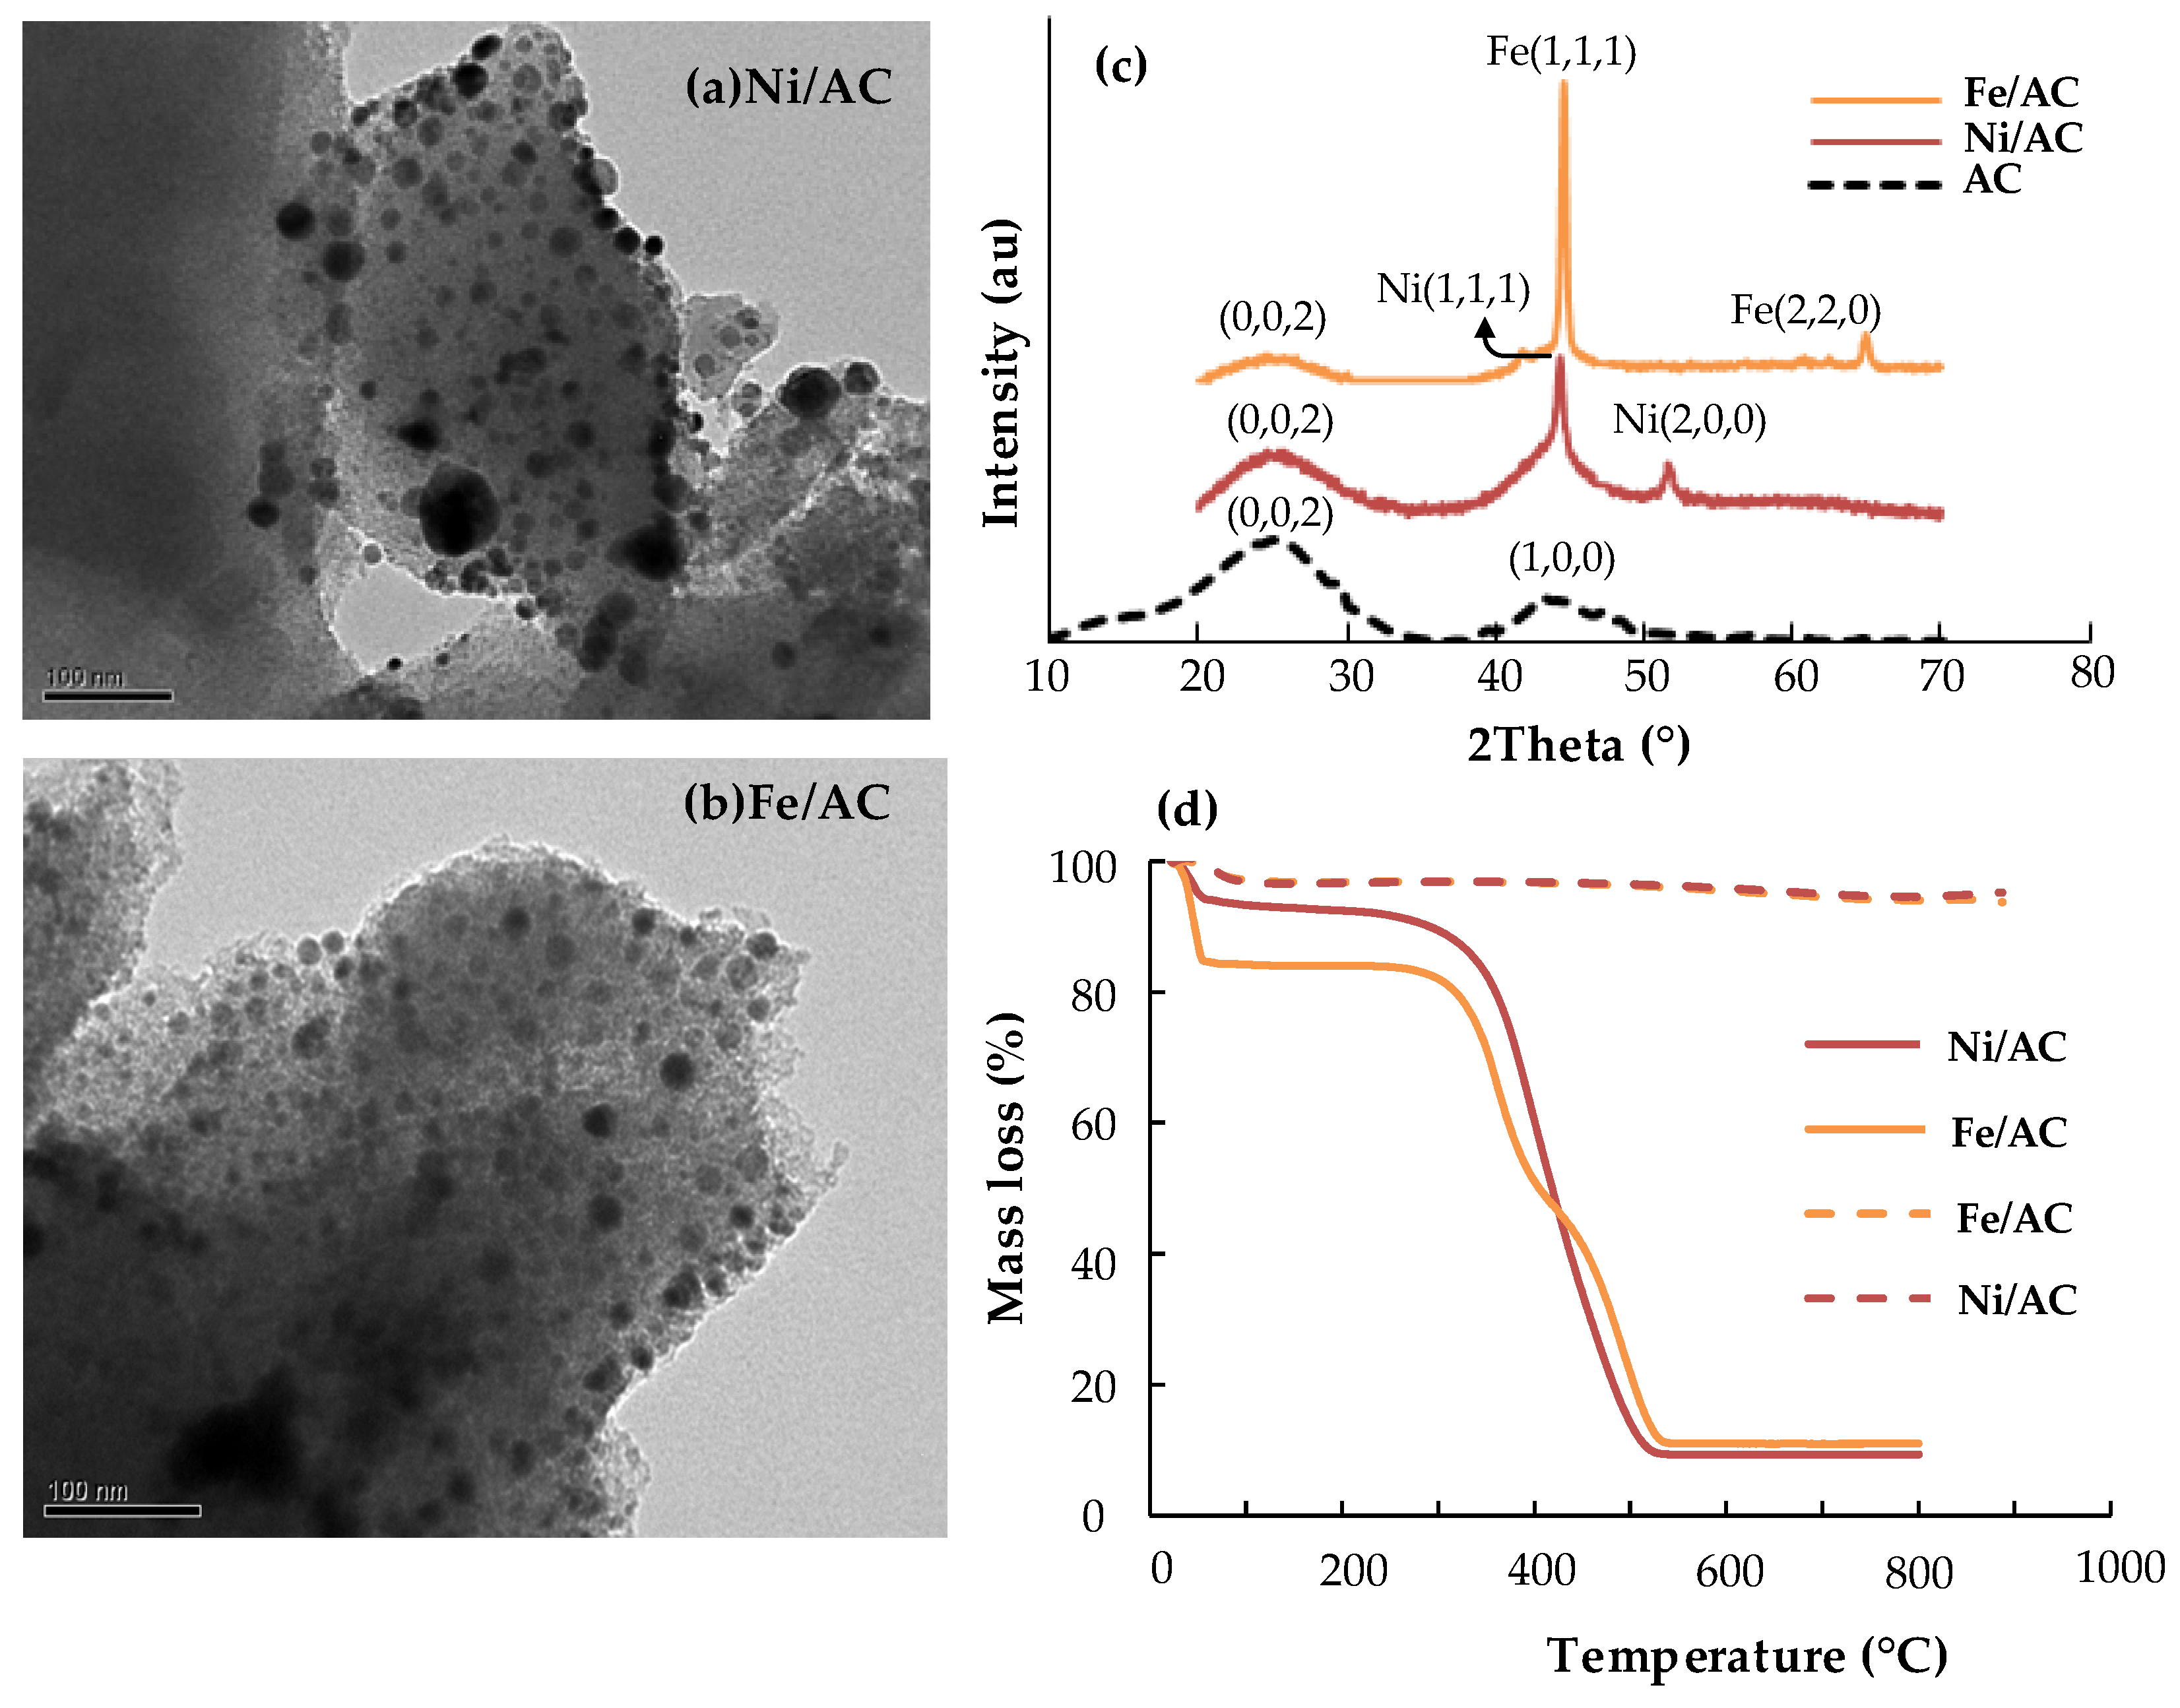
2.1.2. Crystal Phases, Cluster Sizes and Thermal Resistance

The XRD pattern of the support presented two broad and wide peaks centered at 23° and 44°, respectively. These reflections are usually attributed to (002) and (100/101) reflections which are common for graphitic-type lattices in turbostratic carbons [35]. The interlayer spacing (Lc) and microcrystallite lateral dimension (La) of the turbostratic (fully disordered) activated carbon was calculated from Equations (5) and (6) (See Section 4.2.2). The values confirmed that the AC used as support has a disordered structure as suggested by Girgis et al. [35] and Short and Walker [36]. In the case of Ni/AC and Fe/AC the carbon (002) reflections are still visible but (100/101) are overlaid by the more intense (111) metallic planes. Particularly, Ni/AC showed two intense peaks at 44.5° and 51.5°, which are commonly associated to the reflections of (111) and (200) planes in a face-centered cubic structure Ni0. These Ni0 particles represent the active sites for H2 activation and further conversion of tars through hydrodealkylation and hydrocracking reactions. These reactions commonly lead to the ring-opening and saturation of tars with the subsequent formation of light aliphatic hydrocarbons and CH4, which is highly desirable during gasification gas catalytic upgrading. In the case of Fe/AC, the XRD shows two sharp peaks at 44.6° and 65.5°, attributable to (111) and (220) planes for Fe0. A weak reflection is also visible at 40.5°, which could be associated to Fe2O3 (magnetite) formed after reduction or due to some fractions of the promotor salt that remained in the support. The presence of some oxides of iron catalysts does not imply a major hindrance for the catalytic process as Fe3+/2+ provide sites for hydrogenation of unsaturated C-C bonds.
Metal cluster sizes calculated from Scherrer’s equation (Equation (7)) for Ni/AC and Fe/AC were similar, namely 9.7 and 8.8 nm, respectively. These values were confirmed by analyzing the TEM images (Figure 1a,b) and counting about 200 nanoparticles. TEM images showed highly dispersed metal nanoparticles which are in line with the mild reduction conditions. Average particle sizes (Dp) estimated from the analysis of TEM images were 9.3 and 9.7 nm, which corroborated the XRD estimations. Values of Dp obtained from TEM were used for calculating the surface metal dispersion (Equation (4)) and the number of surface metal sites available for reaction. Accordingly, the dispersion of Ni/AC was 11% and 13% for Fe/AC, both values in the same order as that previously reported for carbon-supported catalysts, prepared under similar conditions [37,38].
The use of carbon supports for high-temperature reactions such as catalytic tar reforming and decomposition always implies the risk of catalyst deactivation by support decomposition with further metal sintering. Therefore, thermal stabilities of both catalysts were studied by a thermogravimetric analysis (TGA) under an oxidizing atmosphere (air) and a reductive atmosphere. Results of the TGA are presented in Figure 1d, where weight loss as a function of temperature suggests stability of the material below 400 °C. After that, the catalyst decomposes to about 5% of its initial weight, which represents the metal loading. Thus, one can assume that the carbon support was burned under air above 400 °C. Considering that the catalyst will be used for tar conversion in a gasification gas atmosphere, -particularly reductive-, one can assume that the thermal stability of the support is reasonably good. Accordingly, the same TGA experiment was performed by using a sample gas mixture (Linde, Concepción, Chile) with a composition that simulates a gasification gas (18% v/v H2, 20% v/v CO, 12% v/v CO2, 6% v/v CH4, balance N2). Results from this assay demonstrated that the catalysts are resistant to high temperature under this gas (see dashed lines in Figure 1); thus, assuming that any loss in the activity will be due to other phenomena (sintering, coke deposition, etc.) than thermal decomposition. Nevertheless, the thermal stability of the material will be checked during activity tests, to discard deactivation due to support consumption.

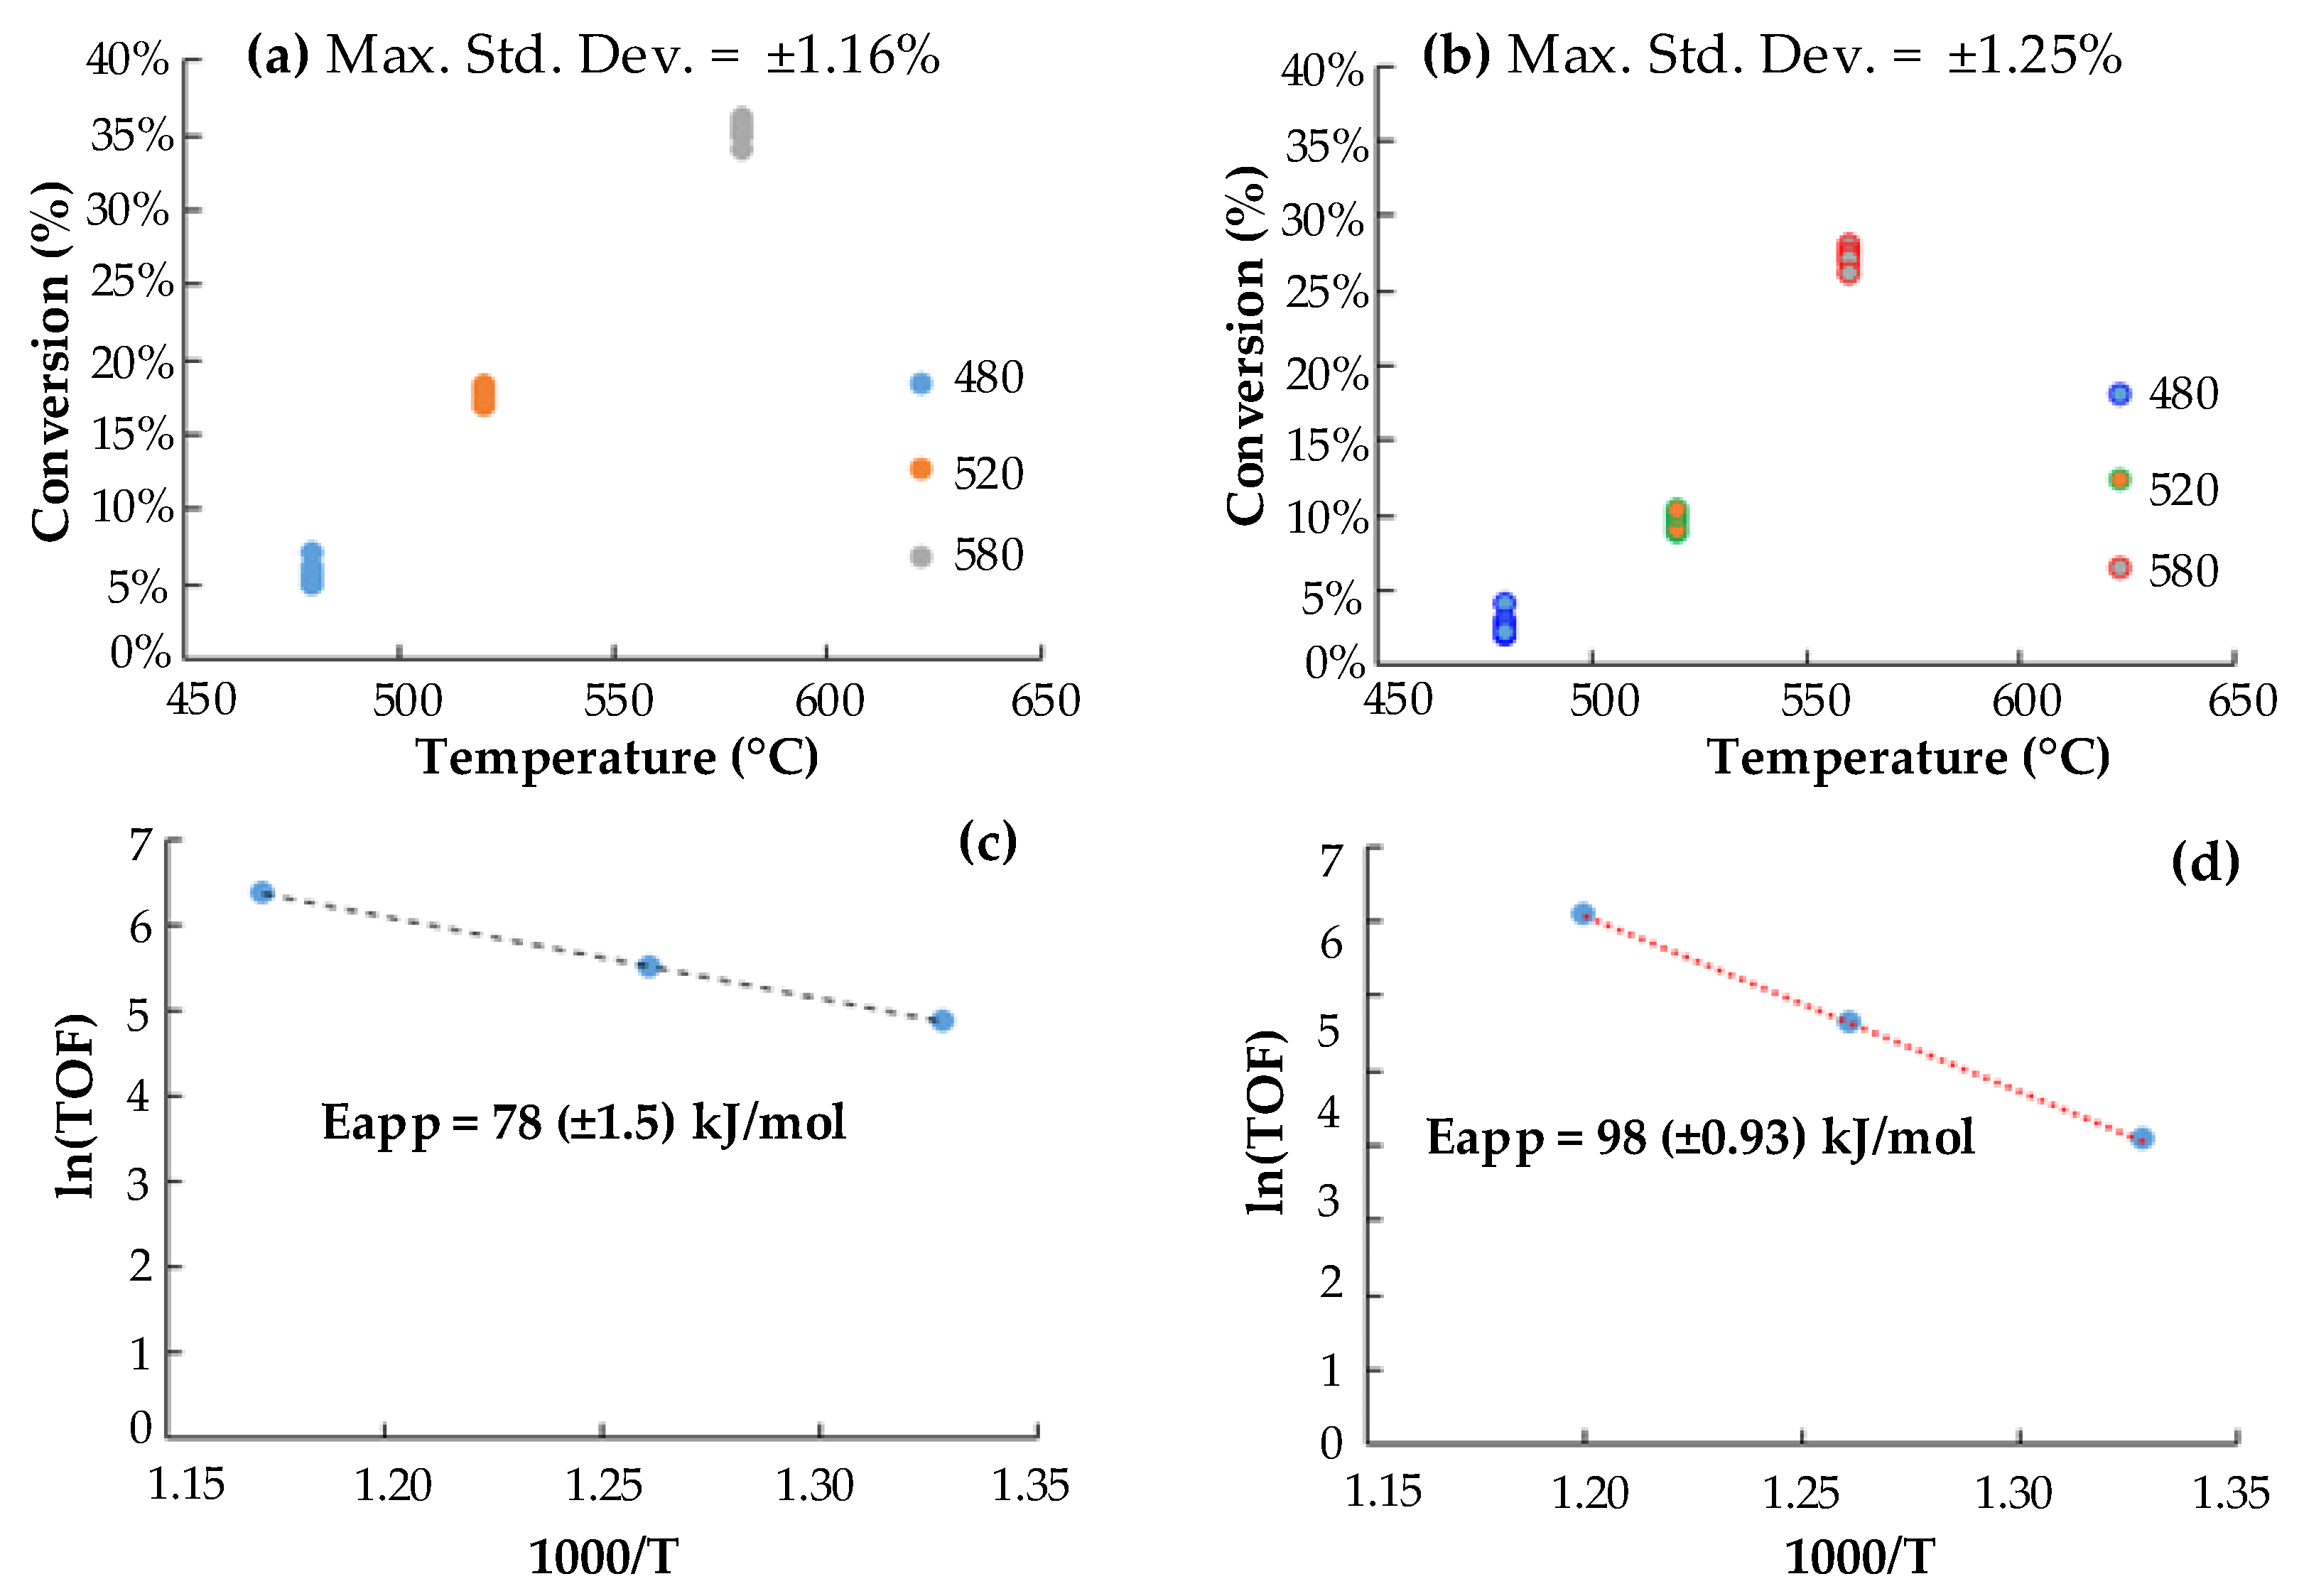
2.2. Preliminary Activity Tests. Tar (Toluene) Conversion at Lab-Scale

The kinetic analysis was performed considering a quasi-first order approach, typically applied to tar decomposition systems [39] and reaction rates are reported as turn over frequency [40]. Measurements were done at steady state conditions, which was verified by the stability in the fed composition (s = ±10 ppm for toluene) and the conversion reached at each temperature (s = ±2%). Experiments were performed in triplicate and the corresponding standard deviations are reported in Figure 2, along with the values of the apparent activation energies.
The conversion reached with Ni/AC was always about 5–7% higher than that obtained with Fe/AC catalyst at all the explored temperatures, which allows inferring a higher activity of Ni/AC catalyst for toluene catalytic decomposition. In fact, a lower apparent activation energy resulted for Ni/AC (78 kJ/mol) than for Fe/AC (98 kJ/mol). The calculated Eapp represent a global process, thus they include the energies of a sequence of conversion steps taking place during toluene decomposition (e.g., adsorption, propagation, hydrodealkylation to benzene and benzene cracking to soot and gas). It is supposed that the rates of these steps are influenced by the nature of the support (AC), the metal clusters (Ni0 and Fe0) and the support-metal interactions.
The role of the AC as catalyst or support for the toluene decomposition have been recently reported by Korus et al. [41]; they demonstrated that the AC serve as source of radicals (H*, CH3*) which contribute to the reaction propagation. Furthermore, they suggest that the adsorptive capacity of the AC is of major importance for the toluene elimination, which is in line to that previously reported by Bhandari et al. [42]. Therefore, a study of toluene adsorption on both the catalysts and support was performed in the same experimental rig, following the procedure described by Park et al. [43], in which the parameters were regressed by using the Levenspiel’s deactivation model [44]. The adsorption heats for toluene on Ni/AC (∆Had = −70 kJ/mol) and Fe/AC (∆Had = −85 kJ/mol) resulted significantly higher than for support (∆Had = −22 kJ/mol). That values evidence that Ni0 and Fe0 sites enhance the adsorption capacity of catalysts and are consistent with a strong interaction between the aromatic ring with metal sites via π bonding (especially for Fe0), as was demonstrated by Murcin et al. [39]. Assuming that the contribution of support in both Ni/AC and Fe/AC (same metallic loading 5% w/w and similar dispersion) is the same and, knowing that Ni0 sites favor the activation of H+, favoring in this way the hydrodealkylation of aromatics such as toluene [45]; further investigations at Bench-scale are carried out using Ni/AC.
Besides the experimental evidences above mentioned, it is worth noticing that the Eapp, for tar conversion have been reported in several papers for a wide range of catalysts and there is a consensus that these values depend on the nature of the active phase as well as on the tar model. For example, Abu El-Rub [17] used a single reaction step approach to calculate the Eapp for naphthalene steam reforming over char-supported Ni and found lower values (60 kJ/mol) than those reported here (78 kJ/mol). Nevertheless, Corella et al. [39] demonstrated that there is a significant divergence in the Eapp values reported in the literature for model tars (e.g., toluene, naphthalene and benzene), even for similar catalysts. According to the theoretical predictions of Juntgen and van Heek [46], these divergences are due to the overlapping of consecutive independent reaction steps in a single first-order model. In a more realistic approach, the kinetic analysis should be done by including various reaction steps and when possible, several tar model compounds. Therefore, the Eapp values determined here at differential reactor conditions were further corroborated at bench-scale following the improved method used by Corella et al. [39] (See section below). In the case of Fe/AC, the activation energy suggests a lower activity for tar decomposition. Thus, the analysis at bench-scale focused on Ni/AC.
The effectivity of the Ni/AC for removing tars from gasification gases is studied between 700 and 900 °C, by simulating a gas with a composition typical of fluidized bed gasifiers (25.9% v/v H2, 33.7% v/v H2O, 7.0% v/v CH4, 16% v/v CO, 14% v/v CO2, 2100 mg/m3 C10H8 and 5200 mg/m3 C6H6, Ar as balance). The molecular steam-to-carbon ratio in the feed was maintained at 0.88.

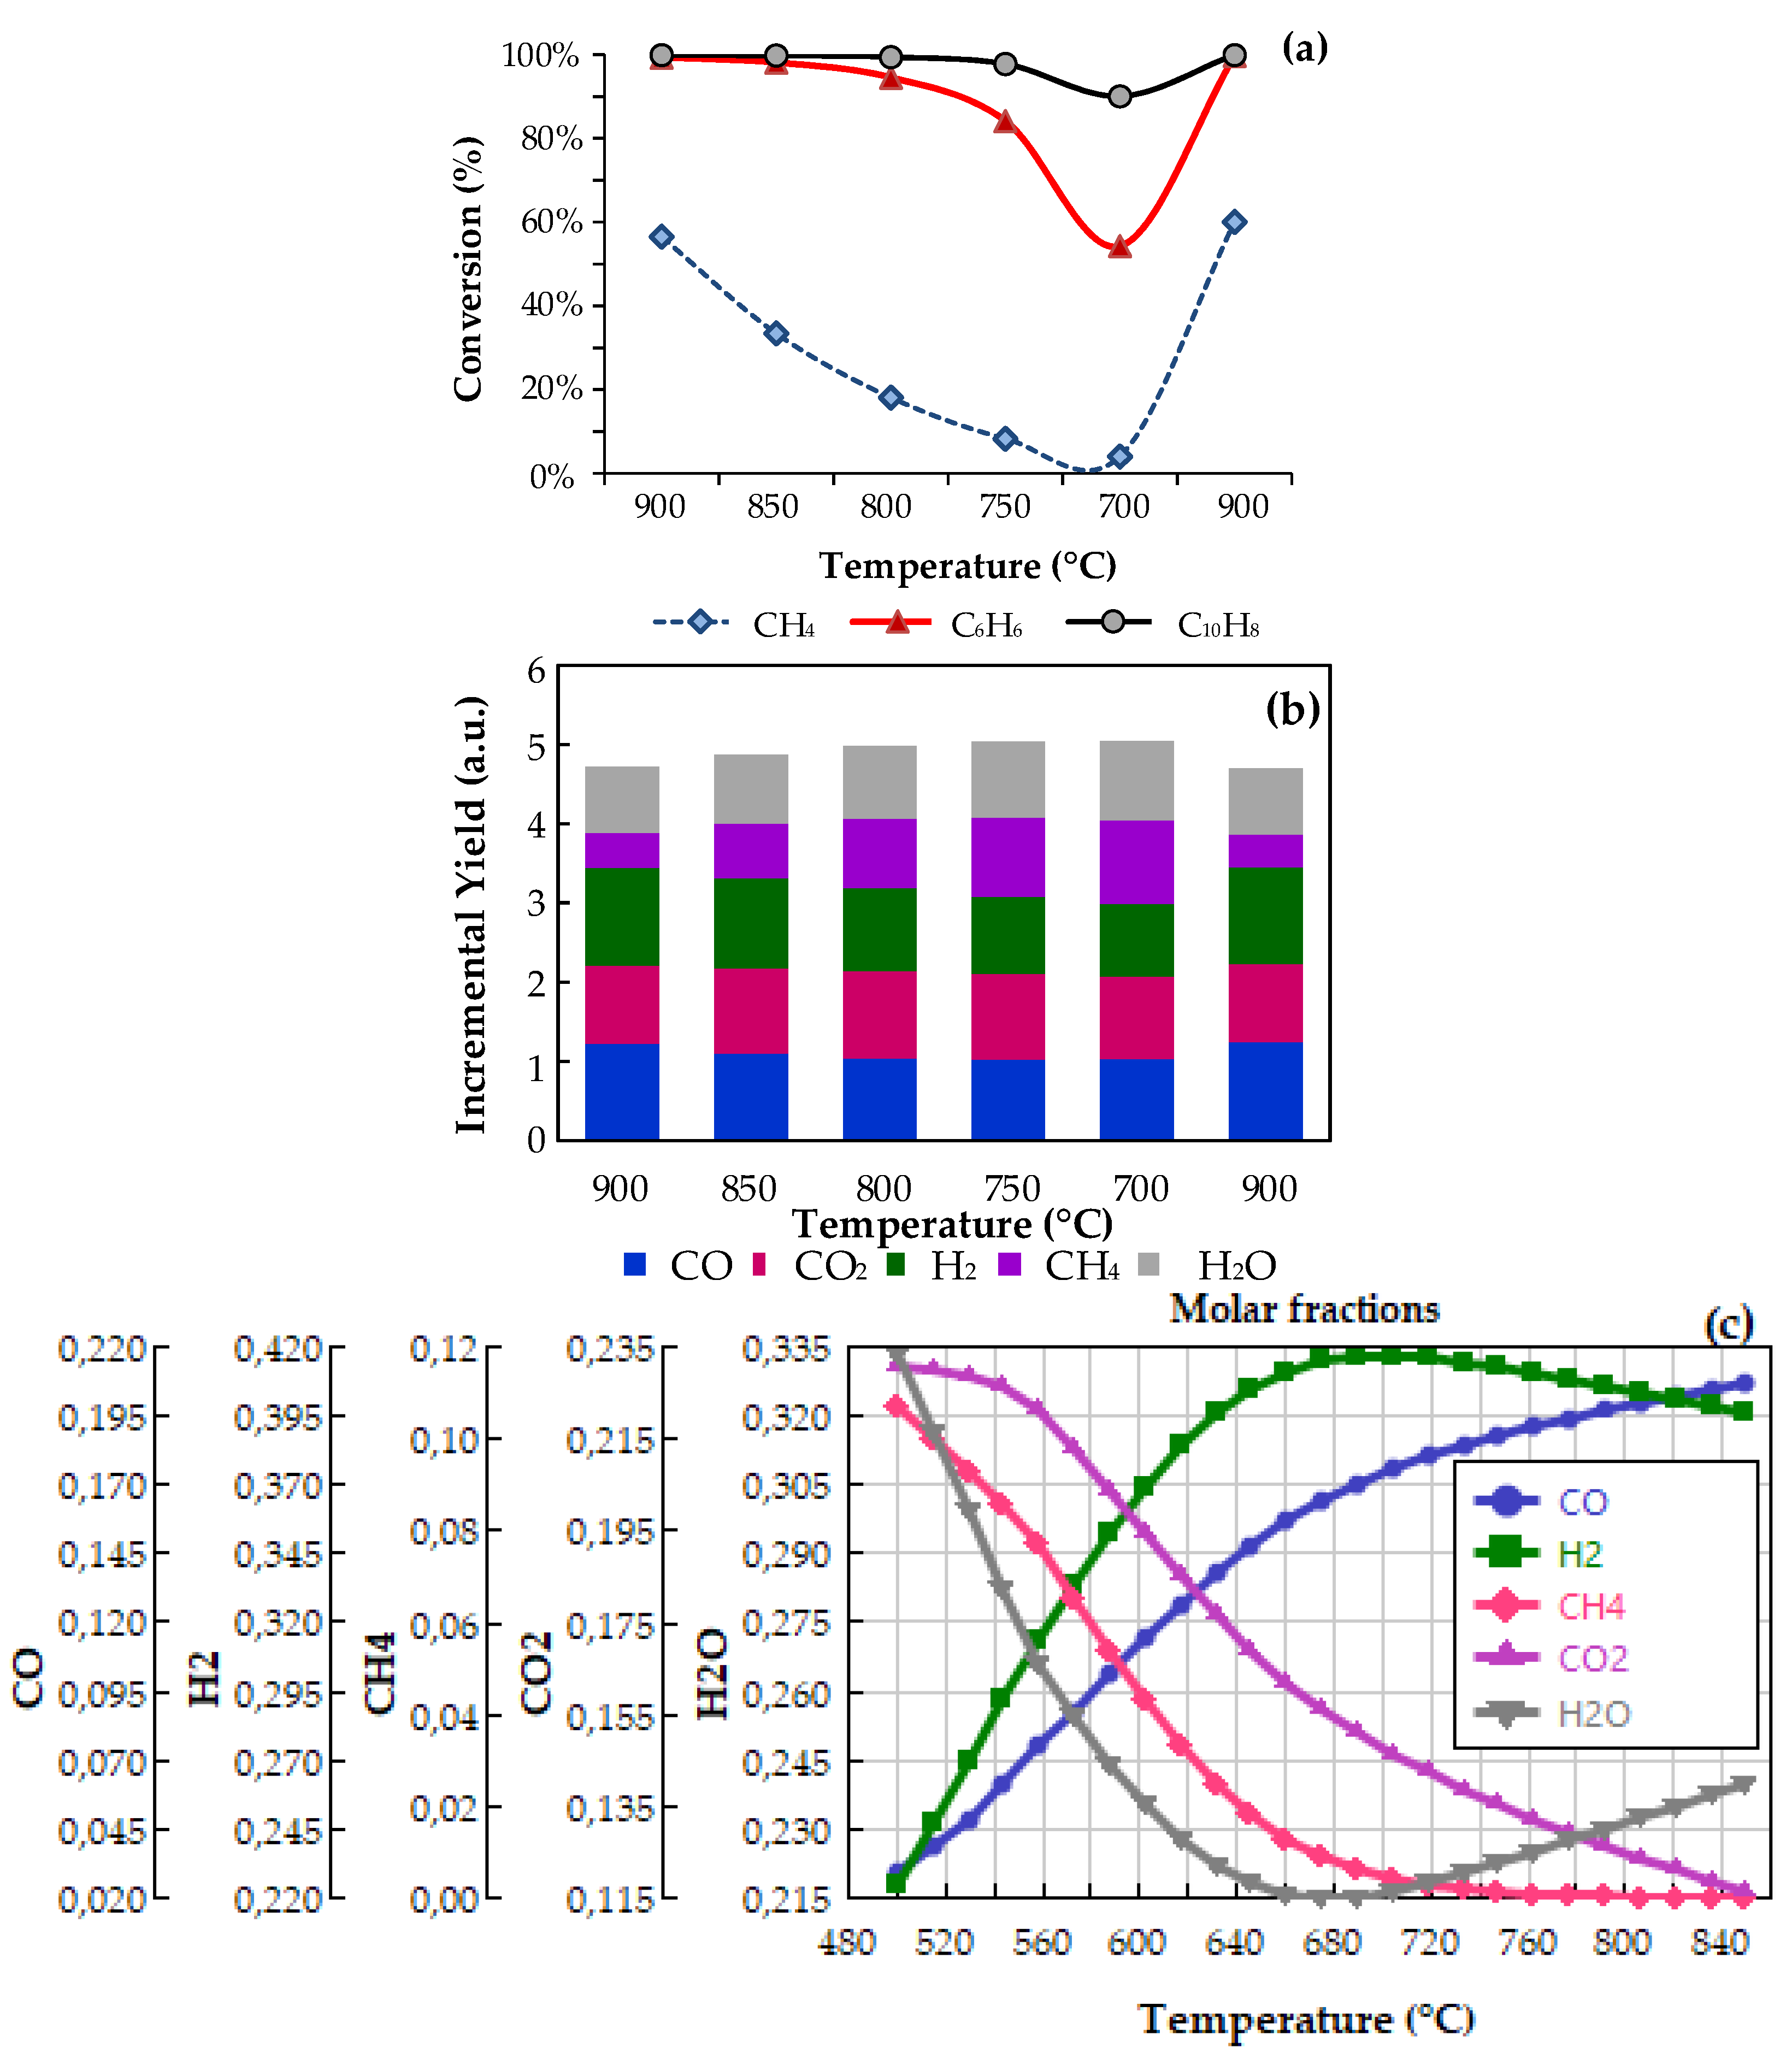
2.3. Bench-Scale Activity Tests

Bench-scale activity tests were developed in a system equipped with mass flow controllers and connected in line with a quadrupole mass spectrometer detector (MS), to register the composition changes during the reaction. The study was performed for about 20 h varying the system temperature according to the program presented in Figure 3. Prior to activity measurements, the catalyst must be in-situ reduced about 5 h (ca. 320 min) under a H2/He 10% v/v gas mixture by following the same temperature program that was used for catalyst synthesis. After that, the activity experiments were carried out isothermally at steady state condition for a cycle from 700 to 900 °C. Gas composition was continuously monitored and reaction was studied during 2 h at each temperature. The establishment of the steady state condition for temperature was checked by analyzing the variation of gas composition. Details on the experimental procedures and apparatus can be consulted in Section 4.3.2.
The effect of temperature on tar (benzene and naphthalene) conversion is presented in Figure 4a. From this figure, a remarkable catalytic activity can be identified, particularly above 750 °C, where conversions varied between 90% and 100%, for both C6H6 and C10H8. An interesting fact is that below 750 °C there is a sharp decrease in the conversion of benzene, reaching a minimum at 700 °C (XC6H6 = 58%). This behavior could be associated with the strong interaction of Ni-Benzene rings (at lower temperatures) with further decomposition of the C6H6 to CO, H2 and even to coke promoters (i.e., carbides) [47]. These results are in line with recently reported ones by Park et al. [48], who demonstrated that the most suitable temperatures for C6H6 conversion over Ni-based catalysts are above 700 °C. The methane conversion was also monitored during the process and as can be corroborated it falls from 58% to 0% as the temperature was reduced from 900 to 700 °C. It is well-known that the methane reforming is favored at higher temperatures but considering that CH4 can also be formed from methanation reaction (reverse RIV), its conversion profile could include the effect of competing reactions. Therefore, the formation of gases during the process was monitored and reported as the incremental yield, defined as the ratio between gas molar flow rates at the reactor outlet and inlet, respectively (Figure 4b). Most important variations were found for those gases produced from tar reforming, for which yield increments were in the following order: H2 > CO > CO2, all varying between 1.0 and 1.25 molout/molin. When the temperature varied between 700 and 900 °C, H2 and CO yields increased from 0.92 to 1.25 and 1.02 to 1.22, respectively. In the same interval CO2, CH4 and H2O decreased, which allows supposing that the formation of permanent gases during tar steam reforming are attributed to the combination of reforming reactions (steam and dry) with some carbon-consuming reactions (RI to RVI):
  • RI: Benzene steam reforming: C6H6 + 6 H2O → 6 CO + 9 H2
  • RII: Naphthalene steam reforming: C10H8 + 10 H2O → 10 CO + 14 H2
  • RIII: Methane steam reforming: CH4 + H2O → CO + 3 H2
  • RIV: Methane dry reforming: CH4 + CO2 → 2 CO + 2 H2
  • RV: Boudouard: C + CO2 → 2 CO
  • RVI: Water gas: C + H2O → CO + H2
At the explored conditions, the equilibrium of Boudouard’s (RV) and water gas reactions (RVI) are particularly important, as they can occur in parallel with steam and dry reforming (RI to RIV). Thus, the change in temperature could contribute to a shift in the equilibrium of RV and RVI, affecting the stability of catalysts by removing (direct) or forming surface carbon (reversible). Accordingly, the effect of temperature on the equilibrium concentrations of H2, CO, CO2, C6H6 and C10H8, was assessed by using a RGibbs model, implemented in Aspen One 10.0 software (Aspen Tech, Bedford, MA, USA, 2017). The Ideal property estimation method and same feed conditions from the experiments were used for estimations; results are presented in Figure 4c. The equilibrium conversions for both C6H6 and C10H8 were 100% in the whole interval of temperatures, which was attributed to the high molecular steam-to-carbon ratio in the feed (0.88 S/C). Moreover, equilibrium predictions show a minimum for water concentration at 680 °C, which coincides with a maximum for hydrogen, above this temperature, the concentration of both compounds change the behavior. This can be attributed to the reverse water gas shift reaction (CO2 + H2 → CO + H2O); nonetheless, this was not corroborated during experiments. In general, these findings are in line with the incremental yields obtained from experimental determinations but they do not explain the sharp reduction in the conversion below 750 °C. A hypothesis for that is that there is some site blocking due to carbon formation during the catalytic process. The last statement agrees with the well-known equilibrium of RV, for which the CO formation are favored above 700 °C, while below that temperature, equilibrium is turned to the production of CO2 and coke.
Despite the reduction in the catalytic activity at lower temperatures, results validated the stability of catalysts which presented a negligible variation of conversion (±2%) when comparing the initial and final cycle points (900 °C). The decrease of tar conversion in the intermediate temperature interval (700–800 °C) could be due to reversible formation of carbidic carbon species from benzene decomposition and to the Boudouard’s reaction, as was previously demonstrated by Park et al. [48].

3. Discussion

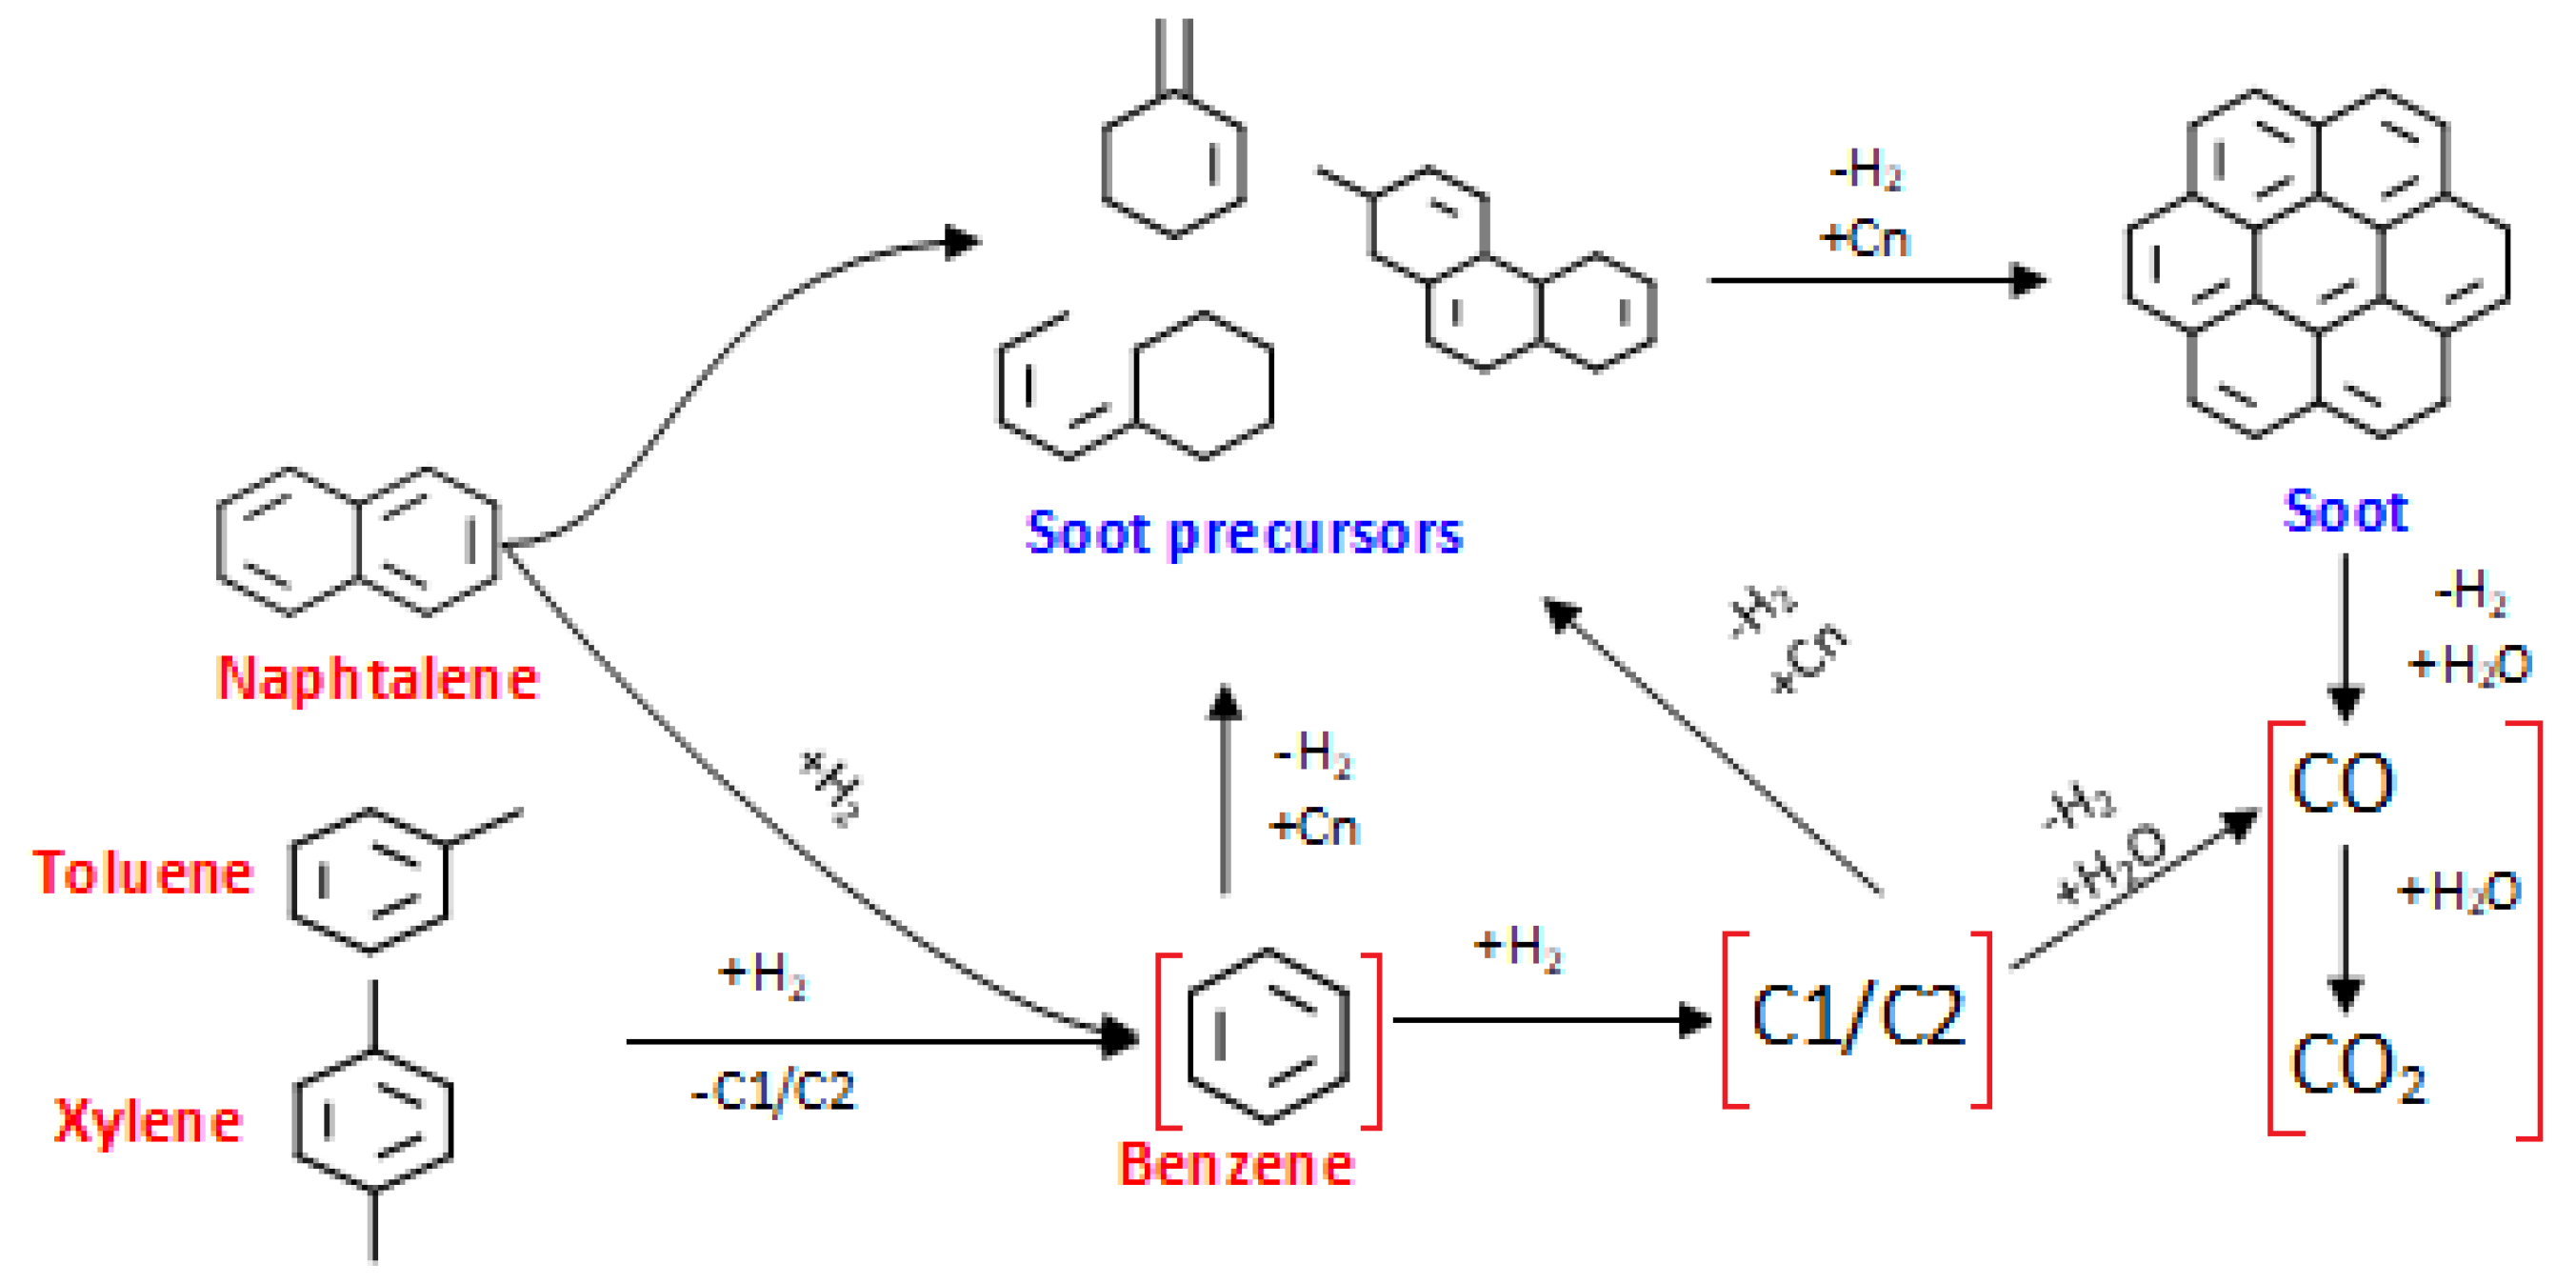
3.1. Competing Reaction Schemes: Soot Formation versus Cracking and Reforming

Despite the interest in studying catalytic tar conversion of various model compounds (e.g., naphthalene, benzene and toluene), the elucidation of reaction mechanisms and specific kinetic expressions describing this process remains a challenge. One of the general approximations to the reaction pathway for tar conversion was reported by Jess [49] and it involves several intermediate stages prior to the reforming/hydrocracking to simpler species (see Figure 5):
This mechanism suggests that benzene can be formed from more complex tars and converted thereof into simpler hydrocarbons and/or polymerized to soot precursors. In the final conversion steps, the hydrocarbons produced from aromatic structures (i.e., CH4 from demethylation, CxHy from cracking and hydrodealkylation, etc.) can be converted by steam and dry reforming, contributing to the syngas composition in the form of simpler molecules such as COx and H2. The red-bracketed reaction pathway in Figure 5 is overall endothermic, thus it is favored at higher temperatures. Inspecting the results summarized in the Section 2.3, it could be inferred that there was not catalytic deactivation during the experimental cycle (conversion of tars at the end and beginning of the cycle were the same, 100% at 900 °C). Therefore, the reaction pathway leading to the soot formation, was discarded at temperatures higher than 800 °C. Furthermore, the yields to permanent gases, especially those formed from reforming (H2 and CO), increased with the temperature. This increment in light gases yields, suggests that the naphthalene and toluene conversion routes were verified -most probably- through the red-bracketed pathway represented in Figure 5. According to the results obtained for Ni/AC, the soot formation can be avoided at high steam-to-carbon feed ratios and temperatures above 800 °C.

3.2. Kinetic Implications

Kinetic measurements for toluene were presented in the previous sections; however, the effectivity of the catalytic removal of tars under real gasification gas could differ from these conditions. In this sense, Abu El-Rub et al. [17] recommend analyzing the kinetics using more complex aromatics such as naphthalene and benzene along with H2O, COx, H2 and CH4. Accordingly, the generalized approach proposed by Corella et al. [39], Abu El-Rub et al. [17] and Li & Suzuki et al. [50] was applied to the data gathered during activity tests at bench- scale activity tests for determining a kinetic expression for C10H18 and C6H6 conversion over Ni/AC.
This method assumes that the above-described conversion routes proceed by a simultaneous mechanism for which individual steps can be described by a pseudo-first order kinetic equation (Equation (1)). Therefore, tar conversion can be explained by a common expression for which the apparent kinetic constant for tar disappearance represents a sum of individual reaction steps (Equation (2)):
r tar = kC tar + k y H 2 O C tar + k y H 2 C tar + k y CO 2        = C tar ( k + k y H 2 O + k y H 2 + k y CO 2 ) = k app C tar
where;
k app = ( k + k y H 2 O + k y H 2 + ) = k O exp ( E app RT )
Here the −rtar is the reaction rate for tars conversion, k, k′, k″, k‴ refers to the individual kinetic constants for tar decomposition, steam reforming, hydrocracking and dry reforming, respectively. Ctar is tar concentration, Eaap is the apparent activation energy kJ/mol, R is the universal gas constant (8.31 J/(mol·K)) and T is the temperature (K). Subscripts H2O, CO2 and H2 refer to steam reforming, dry reforming and hydrocracking, respectively.
This method has the advantage that it can be used for comparing kinetic data obtained by different groups working on catalytic tar conversion. When the process is carried out isothermally and the flow within the reactor can be assumed as a plug flow, kapp can be retrieved from the following expression:
k app = [ ln ( 1 Xi ) ] τ = GHSV [ ln ( 1 Xi ) ]
Here, Xi is the fractional conversion of the ith tar (i = naphthalene, benzene), τ is the space time, GHSV is the gas hourly space velocity.
The apparent activation energies for benzene and naphthalene conversion obtained from this approach were 57 and 32 kJ/mol, respectively. These results are in line with that reported by Abu El-Rub et al. [17], who found that kapp for naphthalene conversion over biomass-derived chars was 61 kJ/mol. The value calculated here for the same reaction is lower (ca. 50%), which could be due to the presence of the active Ni0 sites. Furthermore, reactivity order -based on Eapp-, was naphthalene >> benzene, which confirms results presented by Jess [49]. Nevertheless, there is a problem ruled out from this analysis and it is the possible interaction of reaction pathways and species formed from benzene and naphthalene and also to the adsorption heats of these tars, which are certainly different.

3.3. Auto-Reduction and Catalysts Activity

The stability exhibited by the Ni/AC catalyst suggests that the support was not consumed during the process. The conversion of AC would probably lead to the sintering of the active phase with subsequent irreversible deactivation, which was not observed during the catalytic cycle (Xbegin = Xend). Therefore, the decrease in the tars (C6H6 and C10H8) conversion from high to lower temperatures was associated -besides typical Arrhenius behavior- with reversible coke deposition. This fact is indirectly confirmed by the equilibrium predictions of Boudouard’s and steam reforming reactions and it is in line with the findings of Artetxe et al. [51]. They demonstrated that, when tars reforming is performed at T > 800 °C with high steam-to-carbon ratios, coke deposition due to aromatics conversion is negligible.
Another issue that could take place during catalytic tar elimination is the oxidation of the active phase due to the presence of oxidizing species in the reaction media. Nevertheless, the metallic clusters (Ni+1/+2) can be auto-reduced via H2 or by continuous carbothermal reduction:
  • nH2 + MemOn → mMe + nH2O: Hydrogen reduction
  • nC + MemOn → mMe + nCO: Carbothermal reduction
According to Robinson et al. [45] Nin+ is carbothermally reduced on carbon surfaces at temperatures above 500 °C, while hydrogen reduction could take place at similar conditions. In a recent study, Hu et al. [30] demonstrated that NiO can undergo carbothermal reduction when char is used as support in the catalytic cracking of biomass-derived tars. They suggest that the cokes/soot deposited at lower temperatures (about 650 °C) is further converted at higher temperatures, favoring this way the reaction of nickel oxide with carbon deposits (C + NiO → Ni + CO). Considering that the support consumption has been ruled out from the experimental data (no variations in the catalyst weight during the reaction cycle), the carbothermal reduction here is associated to the carbon deposited as coke/soot.

3.4. Future Work on Gas Cleaning

The analysis of catalytic activity/stability using real gasification gases is one of the milestones of this study. Most of the investigations in this area are more focused on the mechanistic understanding of the catalytic processes and there is a lack of evidence that justifies and demonstrates the effectiveness of the material for the real application. Therefore, results obtained here provide an excellent approach to the behavior of the Ni/AC for upgrading biomass-derived gases but they must be corroborated with real gas mixtures produced during gasification. In order to complete the study, a lab-scale downdraft gasifier was designed and installed. The reactor operates continuously and it is connected to a catalytic test rig. The system has an average capacity of 3 L/min of syngas and is equipped with a syngas analyzer (ETG MCA 100 Syn, Montiglio, Italy). Optimization of steady-state conditions as well as tar sampling is being carried out.

4. Materials and Methods

4.1. Support and Catalysts Preparation

The catalyst was synthesized by loading Ni and Fe on biomass-derived activated carbon (AC). The AC was prepared by pyrolysis and consecutive activation under CO2, according to the following procedure. The AC precursor (pinewood) was dried (105 °C, 24 h), ground to 1 mm particle sizes and impregnated with an ammonia salt ((NH4)2SO4 99.5% purity, Merck KGaA, Darmstadt, Germany) at 10% wt/wt, according to a procedure reported elsewhere [32]. After that, the biomass was thermally treated in a Lindberg Blue furnace (model STF55433C-1, Thermo Fisher, Waltham, MA, USA) at 800 °C (10 °C/min) under a constant N2 flow (99.95% N2, Linde, Santiago, Chile) [52,53]. When the sample reached the pre-set temperature, gas flow switched to CO2 (99.99% CO2, Linde, Santiago, Chile) and the temperature was kept constant during activation time (approx. 5 h). The material obtained was referenced as activated carbon (AC). Impregnation with ammonia salt was done to improve the thermal resistance of the AC [54,55].
The 5 wt % Ni/AC and 5 wt % Fe/AC catalysts were prepared via incipient wetness of nickel nitrate ((Ni(NO3)2·6H2O, >99% purity, Merck, Kenilworth, NJ, USA) and iron nitrate ((Fe(NO3)3·9H2O, >99% purity, Merck) on AC, respectively. After impregnation, the samples were dried at 105 °C for 4 h and ground again before reduction. Ni/AC was reduced for 4 h at 550 °C (2 °C/min heating rate) under 40 mL/min H2 [56,57,58], while Fe/AC was reduced to 4 h at 500 °C (2 °C/min heating rate) under 40 mL/min H2 [59,60]. The effective metal loading was measured by inductively coupled plasma optical emission spectrometry (ICP-OES) using a PerkinElmer Optima 7000 DV ICP-OES series instrument (Perkin Elmer, Santiago, Chile).

4.2. Materials Characterization

4.2.1. Textural Properties Measurement

The Brunauer-Emmett-Teller (SBET) specific surface area, total pore volume and Barret-Joyner-Halenda (BJH) pore size distribution were calculated using N2-adsorption data. N2-adsorption isotherms were recorded at 77 K in a Micromeritics Gemini VII 2390t device (Micromeritics, Norcross, GA, USA). Typically, 0.2–0.5 g samples were adequately degassed at high vacuum under a continuous flux of pure N2 for 24 h before the adsorption tests, as recommended by De Lange et al. [61].

4.2.2. X-Ray Diffraction

The XRD patterns of the AC, Ni/AC and Fe/AC were recorded in a Bruker AXS model D4 Endeavor diffractometer using monochromatic CuKα radiation (λ = 0.15418 nm). The signal was generated at 40 kV and 20 mA. The intensities were measured in the range 5° < 2θ < 70° with a step size of 0.02° and a scan rate of 1 s/step. The patterns were used to identify the phases and to calculate the metal crystal sizes through the Scherrer’s equation (Equation (4)). In the case of support, the well-known Debye-Scherrer correlations where used to calculate crystallite dimensions (Equations (5) and (6)).
D pi = K × λ β × cos ( θ )
L c = 0.9 λ β 002 × cos ( θ 002 )
L a = 1.94 λ β 100 / 101 × cos ( θ 100 / 101 )
where L is the crystallite dimension (c—height a—diameter, nm), K is a constant near to unity; λ is the wavelength in nm; β is the full width at half maximum intensity (FWHM) in rad; θ is the scattering angle.

4.2.3. Transmission Electron Microscopy (TEM)

Transmission electron microscopy (TEM) images of Ni/AC and Fe/AC were taken to observe the morphology of supported nanoparticles using a JEOL JEM 1200 EXII microscope (Jeol, Peabody, MA, USA) at 120 kV and to estimate the cluster size distribution and the mean cluster size of catalysts. A carbon-coated copper grid was used as a substrate and the catalyst was dispersed in ethanol and put on the grid. Images were processed with ImageJ software (1.50i, National Institute of Health, Bethesda, MD, USA, 2016).
Results from TEM where analyzed regarding XRD measurements, to estimate the average metal cluster sizes and the corresponding dispersion, according to the following equation:
D i = ( 6 × ( v m / a m ) D pi )
Here, Di is the dispersion of the ith catalyst, vm is the volume occupied by an atom in bulk metal (Ni = 10.95 Å3, Fe = 11.8 Å3), am is the area occupied by a surface atom (Ni = 6.51 Å2, Fe = 6.09 Å2) and Dpi is the average particle size of the ith catalyst.

4.2.4. Thermogravimetric Performance (TGA)

The AC, Ni/AC and Fe/AC were characterized by thermogravimetric analysis (TGA), to estimate their thermal behavior under air atmosphere. The weight loss was recorded as a function of temperature in a thermobalance (model STA 409 PC, Netzsch, Mogappair, India) from 20 to 700 °C. About 25 mg of sample was placed in an alumina crucible and heated at 10 °C/min under air flow (70 mL/min). The buoyancy effect was corrected by using a blank baseline curve, which was subtracted from each experiment.

4.3. Installation of Kinetic Assays

4.3.1. Experimental Setups: Toluene Decomposition

The reactions were investigated regarding reaction conditions, tar (toluene, naphthalene and benzene) conversion and yield to gaseous species. Experiments were conducted in two rigs, equipped for toluene thermo-catalytic decomposition and tar steam reforming. Details on the experimental setups are given below.
The laboratory facility for catalytic tests is shown in Figure 6. This system includes a feeding module composed by a one-channel syringe pump (NE-1000BS, Fermelo, Ringoes, NJ, USA), to feed toluene into a vaporization chamber where it is mixed with a carrier gas stream (He, 99.9% Air Liquide, Concepción, Chile). All lines and the vaporization chamber were wrapped with heating tapes (Omega Eng, CN142-R1-R2-DC3, Stamford, CT, USA) and the gas temperature was kept at 180 °C by varying the current flow to the tapes through a temperature controller (Omega Eng, CRFC-312/240-C-A, Stamford, CT, USA). All gas flows to the system are controlled by digital mass flow controllers (Aalborg series GFC, WReichman, Santiago, Chile). The reaction module included stainless steel (316L SS) fixed bed reactor (250 mm Length, 18 mm ID), placed in a high temperature tubular electric furnace (Omega Eng, CRFC-312/240-C-A, Stamford, CT, USA).
Typically, 0.5 g of catalyst were placed in the reactor and the void space before and after the bed was filled with quartz wool; the estimated bed height was 25–30 mm. The transport limitations were avoided by using the same procedure as reported in Fernandez et al. [62]. The reaction temperature was controlled by two K-type thermocouples placed at the bottom and above the bed. The gas product stream was kept warm before it was fed into a gas analyzer. Gases were continuously sampled in an Agilent Series 7890 chromatograph (Agilent, Santa Clara,, CA, USA), equipped with a six-way pneumatic valve, two detectors (FID and TCD) and a capillary column (HP-5 de 30 m × 320 μm × 0.25 μm) for toluene. Before each test, the whole system was warmed up under a constant flow of pure nitrogen (99.9% Air Liquide, Concepción, Chile) and once the temperatures were constant, the N2 was changed to the carrier gas (He, 99.999% Air Liquide, Concepción, Chile). After that, the catalyst was reduced under the same conditions described above. Toluene decomposition was studied between 400 and 600 °C at a constant space velocity (1420 h−1). Pure toluene was injected into a constant He flow (211 mL/min) to keep its concentration at 0.007 atm/atm.

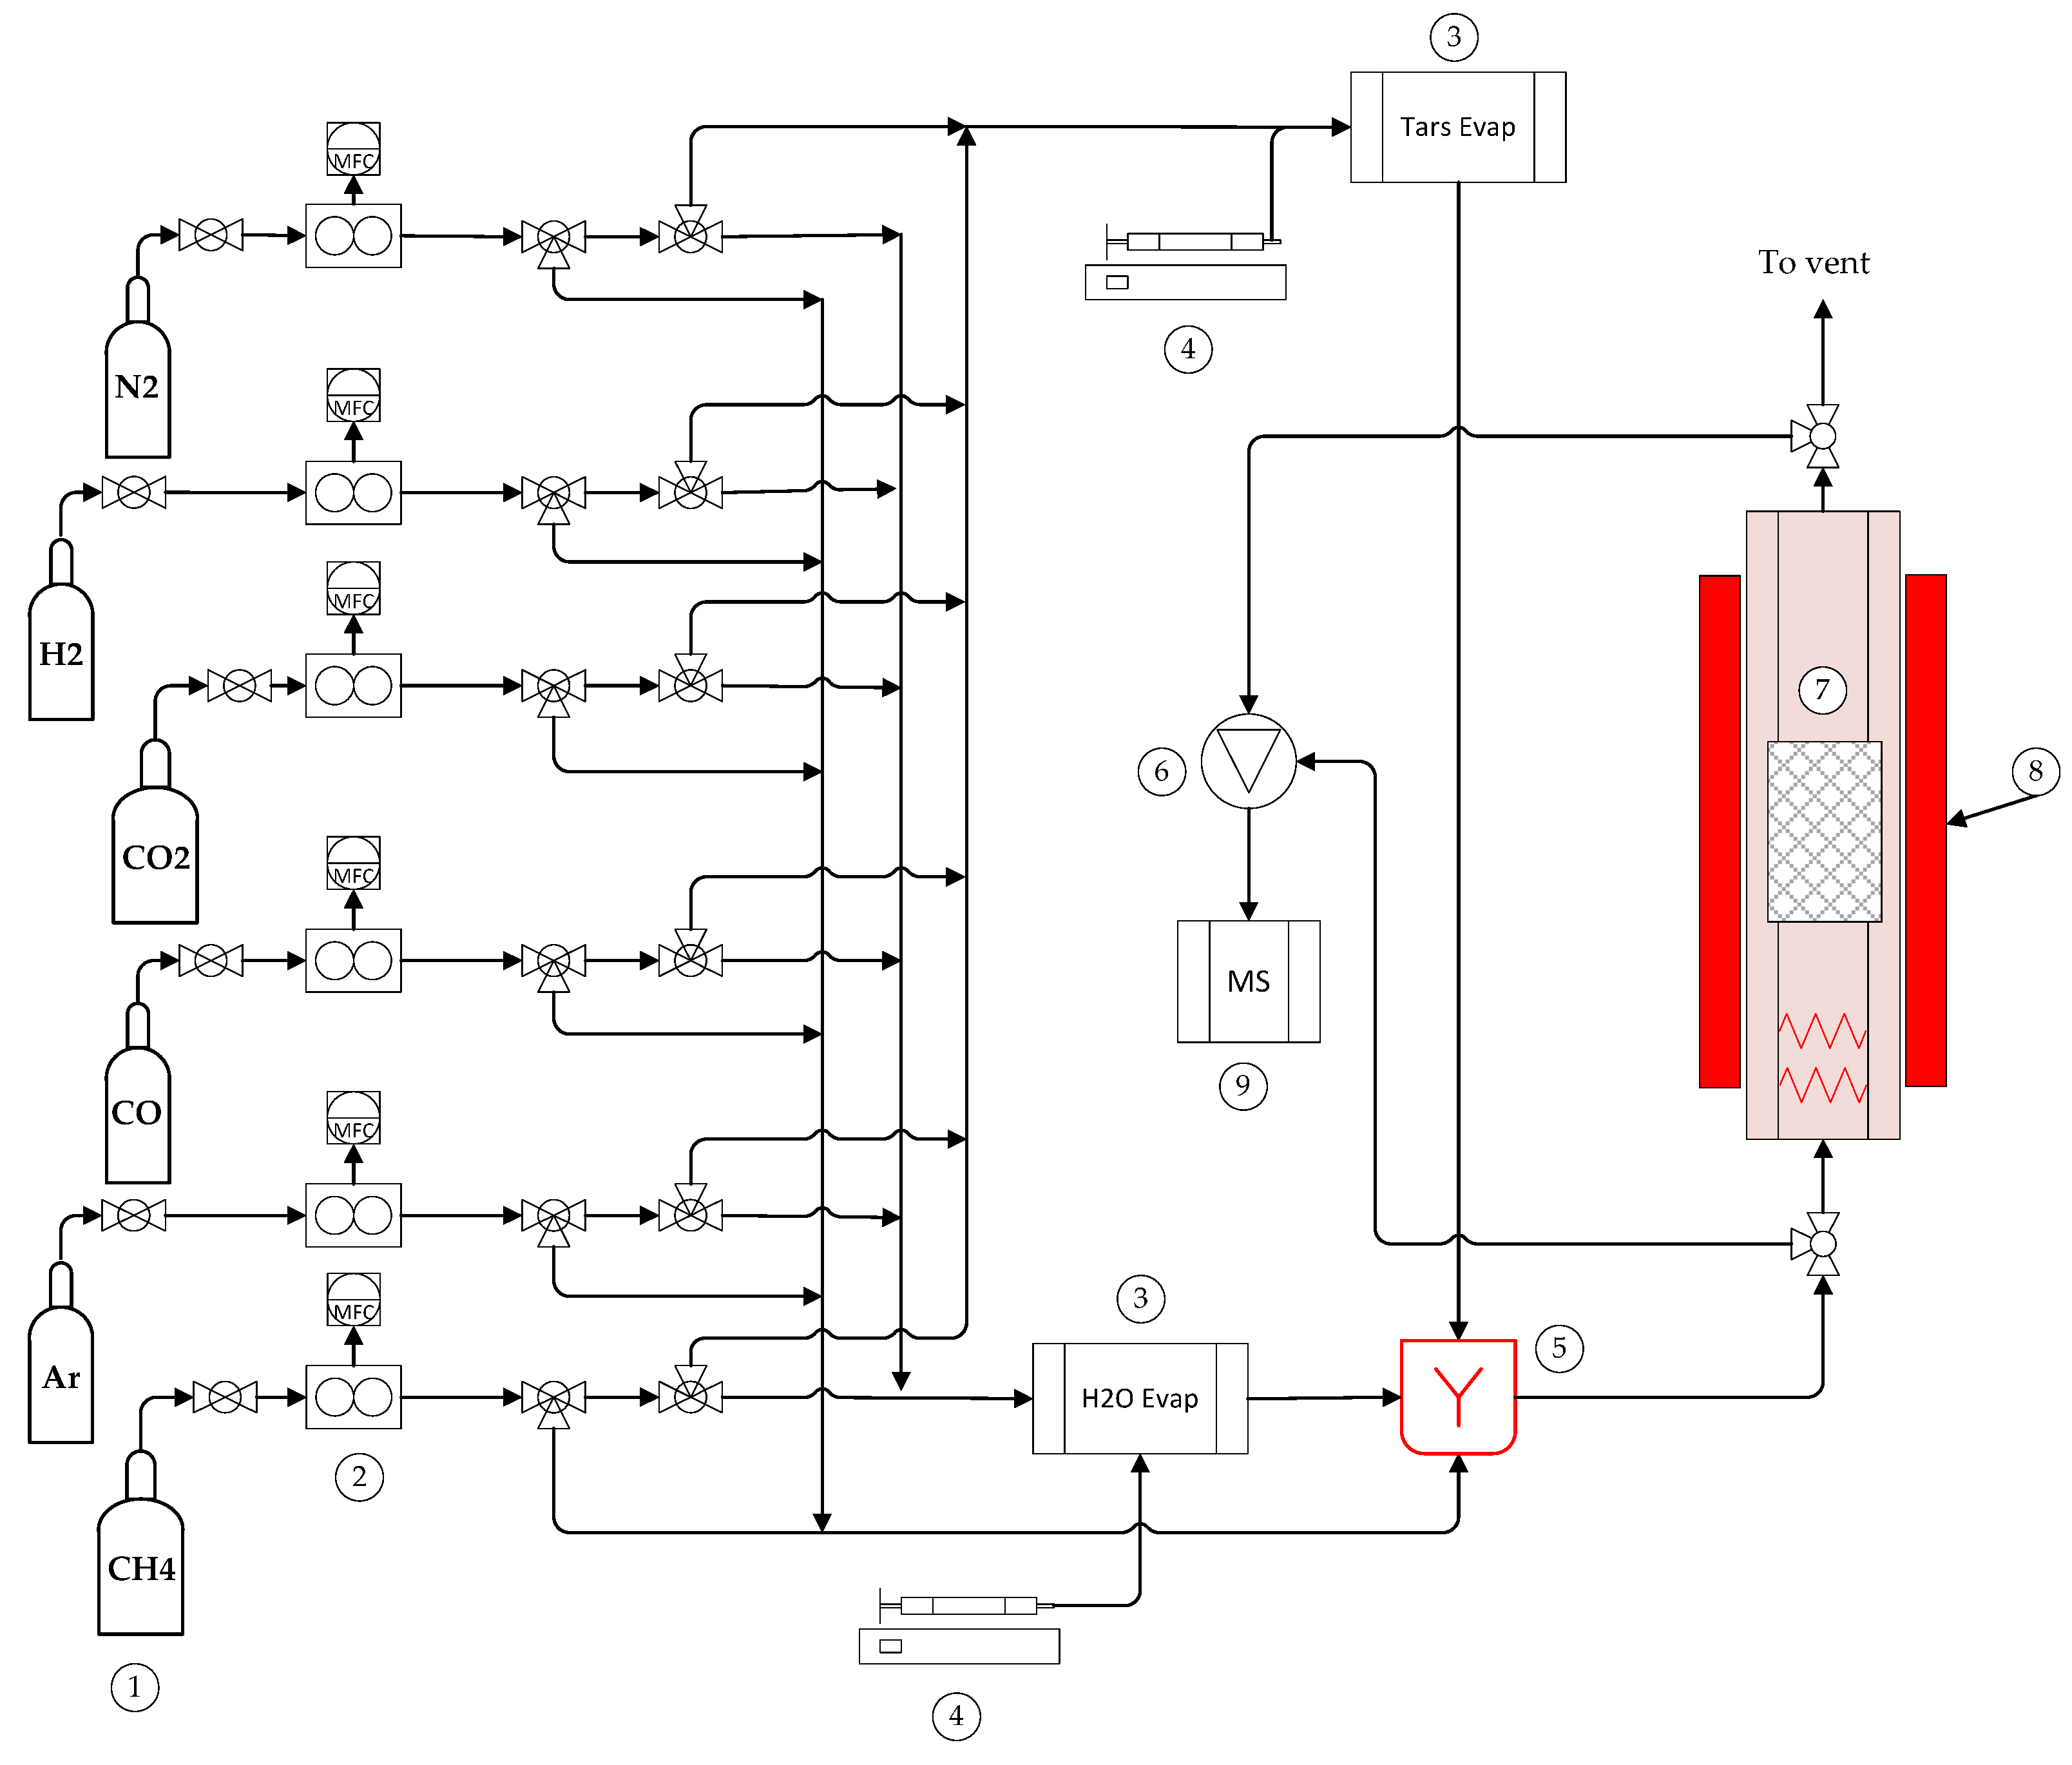
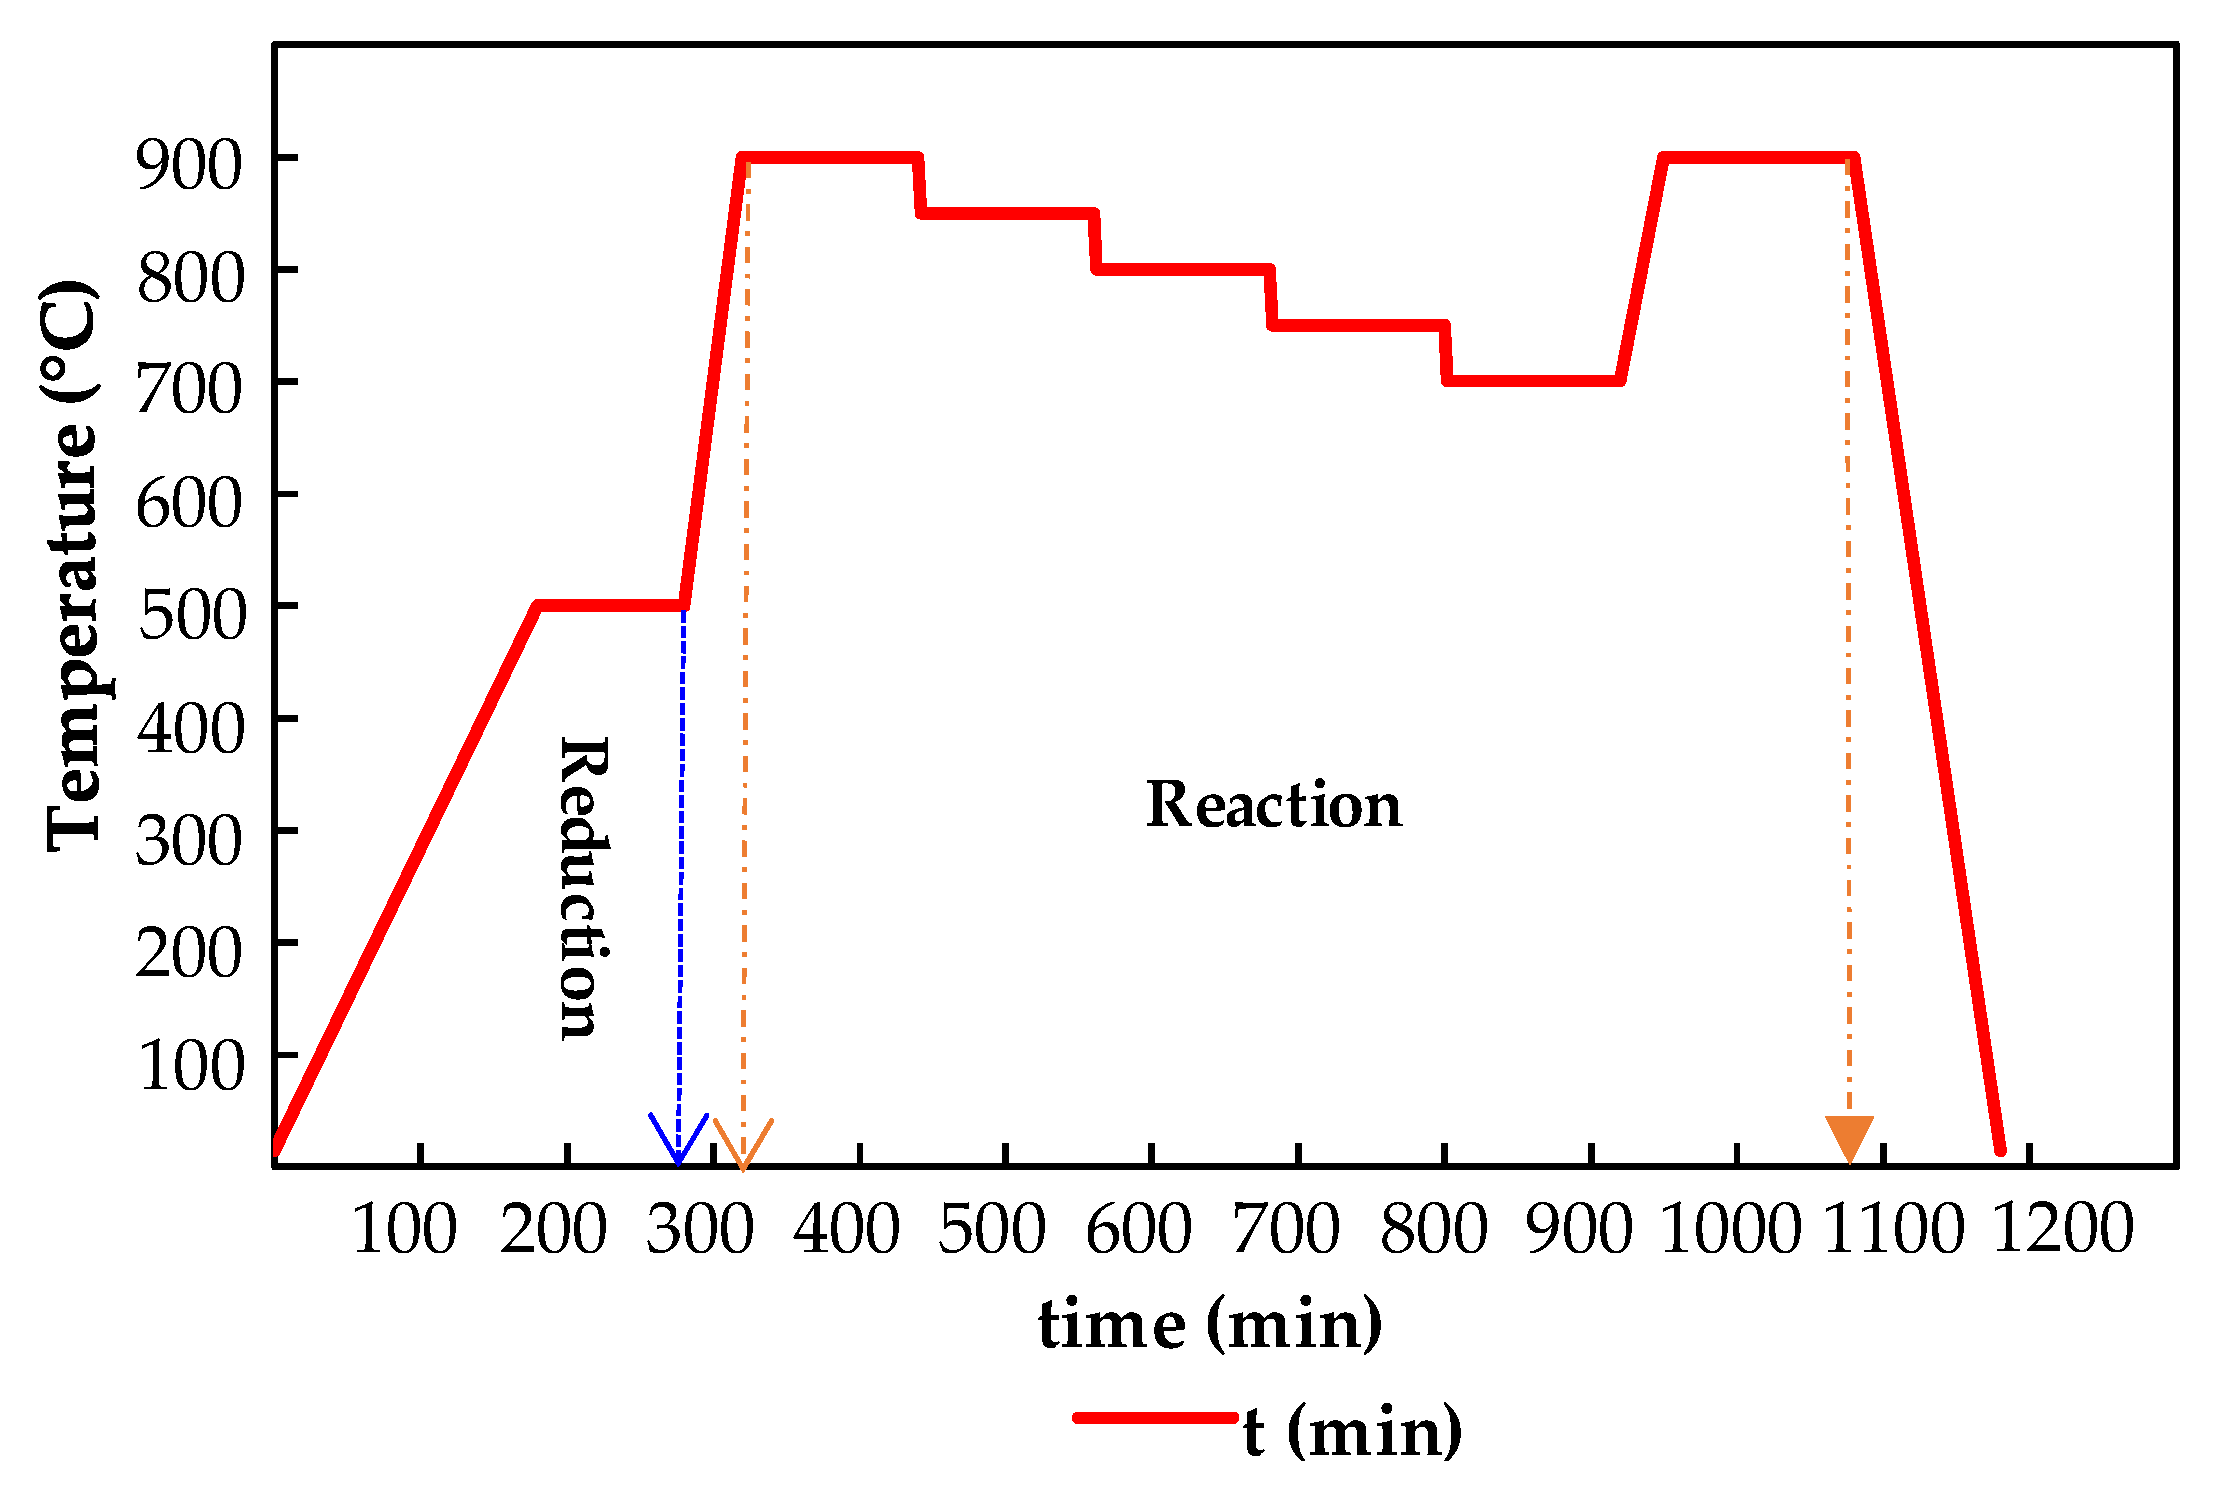
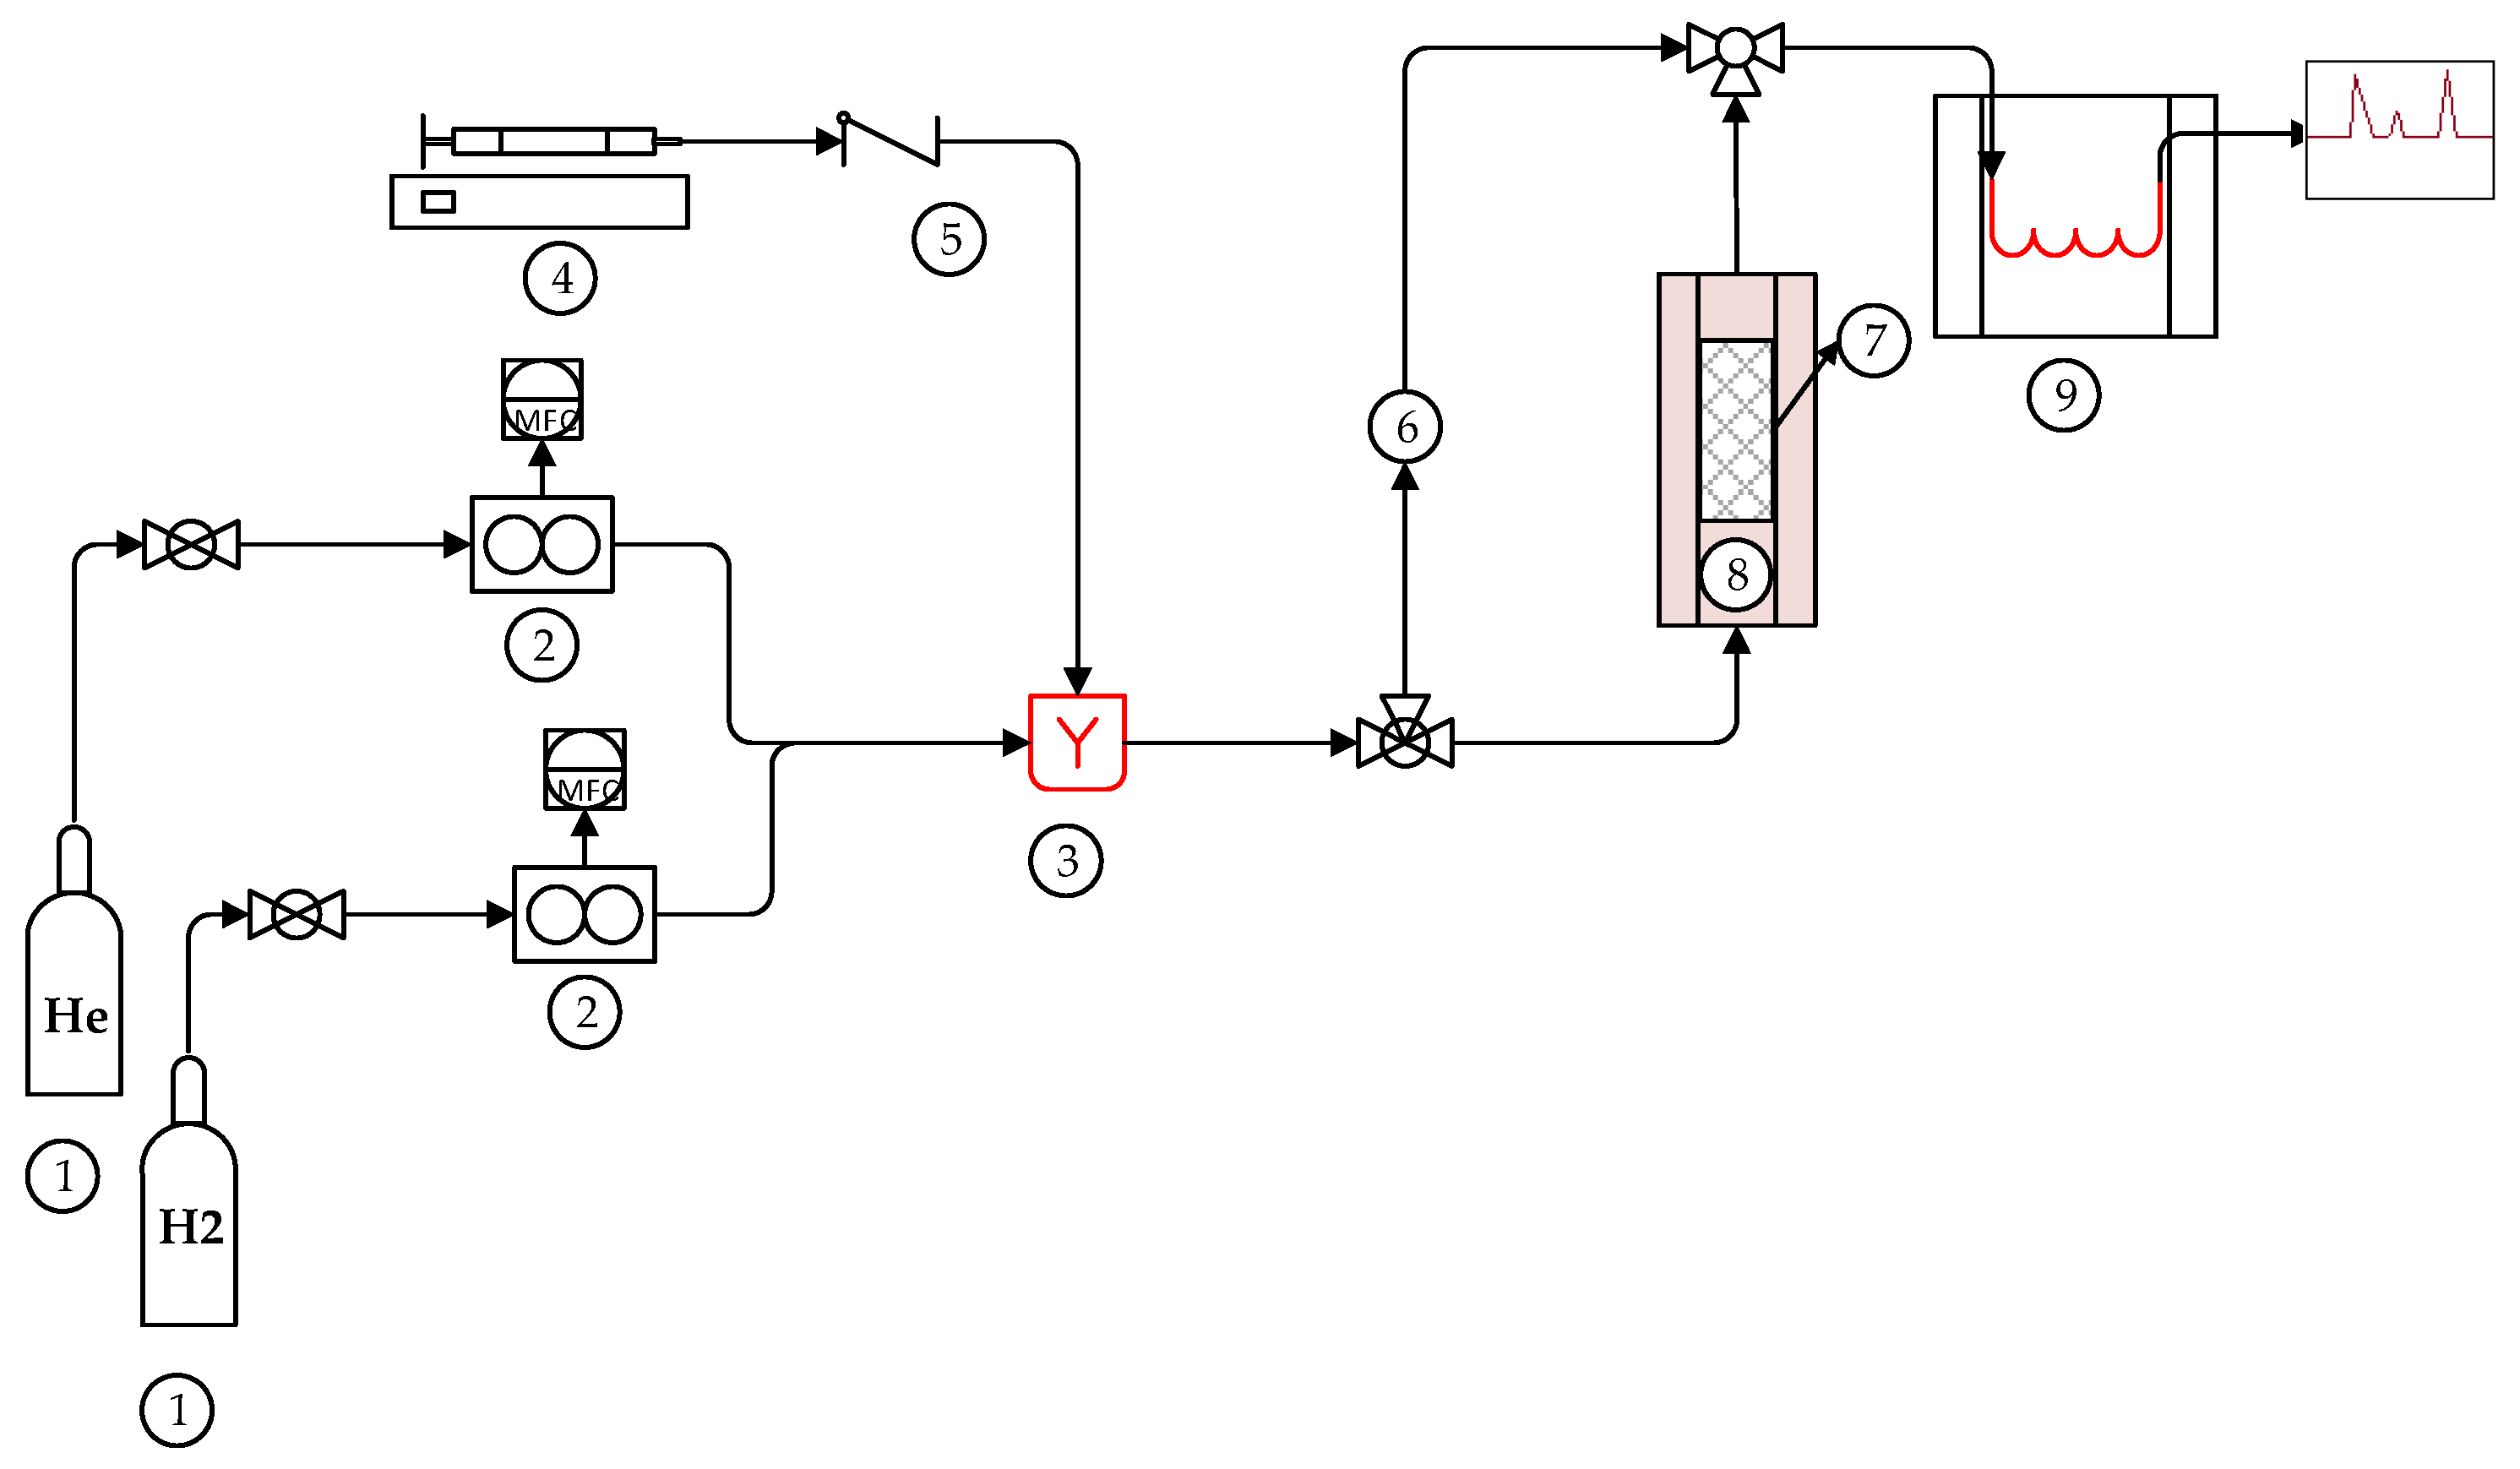
4.3.2. Reforming Catalytic Test Rig

The reforming test rig is installed at UMSICHT facilities in Oberhausen, Germany. This system is designed for testing variable shaped catalysts at temperatures up to 1000 °C (Figure 7). The facility is divided into four sections, namely: (i) gas feeding, (ii) liquid feeding-evaporation, (iii) the reactor and (iv) the gas analyzer.
The reaction mixture was prepared with six species stored in gas containers (CO, CO2, H2, CH4 purity >99.5% and Ar, N2, >99.999%, Linde Gas, Munich, Germany) and fed into the lines by digital mass flow controllers (M + W Instruments GmbH, Allershausen, Germany). Thereafter gas lines were divided and one passed by the organic liquid evaporator and the second was fed into the water evaporator. The water evaporator was custom-made and supplied by Integrated Lab Solutions GmbH (Berlin, Germany). Distilled water was dosed by a High-Performance Liquid Chromatography (HPLC) pump (Smartline Pump 100, Knauer GmbH, Berlin, Germany) into a 1/16″ stainless steel (1.4401) pipe which was inserted into a 3/4″ pipe filled with quartz wool. The evaporator was heated to 130 °C to ensure complete evaporation of water. The organic liquid was dosed with a dual syringe pump (MDSP3f, MMT GmbH, Siegen, Germany) connected to the evaporator system via a 1/16″ polytetrafluoroethylene (PTFE) tube. The temperature in the organic evaporator was kept at 180 °C. The streams leaving the evaporators are mixed in a chamber, in order to homogenize the composition of the reaction mixture prior to the reaction.
The syngas mixture was fed via a heated PTFE tube to a combined gas heater-reactor system, which was placed inside a three-zone vertical split-tube furnace with a maximum operating temperature of 1000 °C (Horst GmbH, Lorsch, Germany). The reactor is made from quartz glass tube (500 mm length) with an inner diameter of 18 mm. To ensure a homogenous temperature and a good mixing of the gas components, the bottom half (about 200 mm) of the quartz glass tube was filled with SiC bulk material. The catalyst (4 g) was inserted and removed from the reactor with a small steel basket making a total of 60 mm height of active bed. The temperature was varied along each run from 500 to 900 °C. The gas flow to the reactor was 2 L/min (11320 h−1 at Standard Temperature and Pressure space velocity) with the following composition (25.9% v/v H2, 33.7% v/v H2O, 7.0% v/v CH4, 16% v/v CO, 14% v/v CO2, 2100 mg/m3 C10H8, 5200 mg/m3 C6H6). The quasi-continuous gas analysis was done using an online quadrupole mass spectrometer (MS) with electron ionization (GAM 200, InProcess Instruments GmbH, Bremen, Germany). Gas composition was measured before and after reaction by switching the position of a multiport valve (Valco Instruments Co. Inc., Houston, TX, USA).

5. Conclusions

Carbon-supported nickel and iron catalysts with high surface area and well-dispersed metal clusters, were prepared. The activity and stability for Ni/AC catalysts was higher than for Fe/AC, deriving from the effectiveness of Ni0 for hydrocracking and steam reforming reactions. Both materials achieved complete conversion of tars (namely naphthalene, toluene and benzene) above 850 °C. Operation at and below 700 °C, leads to a sharp reduction in benzene conversion, presumably due to carbon deposition on the surface.

Acknowledgments

This work has been financially supported by the Chilean projects FONDECYT 11150148, BMBF150029 and FONDEF ID15i10132. Part of the work has been performed within the project “Comparative study on catalytic tar and ammonia removal from wood based synthesis gas,” which is funded by the German Federal Ministry of Education and Research through its funding agency PTJ under the grant number 031B0176 by decision of the German Bundestag and Proyecto Basal”, Centro Científico Tecnológico de Excelencia–Unidad de Desarrollo Tecnológico–UDT, Grant: PFB-27.

Author Contributions

Luis E. Arteaga-Pérez planned the research and wrote the paper; Aaron M. Delgado performed the experiments and kinetic analyses; Mauricio Flores supervised the experimental work; Tim Schulzke and Christian Hamel supported the steam reforming experiments and the report of the activity data; Kimberley Matschuk contributed to the installation and operation of the steam reforming test rig; Romel Jiménez contributes to the design of the research and in the writing of the paper; Patricia Olivera designed the chromatographic methods and contributed to the installation and operation of the catalytic test rig.

Conflicts of Interest

The authors declare no conflict of interest. The founding sponsors had no role in the design of the study; in the collection, analyses, or interpretation of data; in the writing of the manuscript and in the decision to publish the results.

References

  1. Basu, P. Biomass Gasification, Pyrolysis and Torrefaction. Practical design and Theory, 2nd ed.; Elsevier Ltd.: New York, NY, USA, 2013; ISBN 9780123964885. [Google Scholar]
  2. Brown, R.C. Thermochemical Processing of Biomass; John Wiley & Sons, Ltd.: Chichester, UK, 2011; ISBN 9781119990840. [Google Scholar]
  3. Asadullah, M. Biomass gasification gas cleaning for downstream applications: A comparative critical review. Renew. Sustain. Energy Rev. 2014, 40, 118–132. [Google Scholar] [CrossRef]
  4. Zwart, R.W.R. Gas cleaning downstream biomass gasification Status Report 2009. ECN SenterNovem 2009. Available online: https://www.ecn.nl/publications/E/2009/ECN-E-08-078 (accessed on 20 November 2017).
  5. Asadullah, M. Barriers of commercial power generation using biomass gasification gas: A review. Renew. Sustain. Energy Rev. 2014, 29, 201–215. [Google Scholar] [CrossRef]
  6. Brandin, J.; Tunér, M.; Odenbrand, I.; Lund, V. Swedish Energy Agency Report Small Scale Gasification: Gas Engine CHP for Biofuels; Linnaeus University: Växjö, Sweden, 2011. [Google Scholar]
  7. Shen, Y.; Yoshikawa, K. Recent progresses in catalytic tar elimination during biomass gasification or pyrolysis—A review. Renew. Sustain. Energy Rev. 2013, 21, 371–392. [Google Scholar] [CrossRef]
  8. Richardson, Y.; Blin, J.; Julbe, A. A short overview on purification and conditioning of syngas produced by biomass gasification: Catalytic strategies, process intensification and new concepts. Prog. Energy Combust. Sci. 2012, 38, 765–781. [Google Scholar] [CrossRef]
  9. Xu, C.; Donald, J.; Byambajav, E.; Ohtsuka, Y. Recent advances in catalysts for hot-gas removal of tar and NH3 from biomass gasification. Fuel 2010, 89, 1784–1795. [Google Scholar] [CrossRef]
  10. Min, Z.; Zhang, S.; Yimsiri, P.; Wang, Y.; Asadullah, M.; Li, C.Z. Catalytic reforming of tar during gasification. Part IV. Changes in the structure of char in the char-supported iron catalyst during reforming. Fuel 2013, 106, 858–863. [Google Scholar] [CrossRef]
  11. Shen, Y.; Zhao, P.; Shao, Q.; Ma, D.; Takahashi, F.; Yoshikawa, K. In-situ catalytic conversion of tar using rice husk char-supported nickel-iron catalysts for biomass pyrolysis/gasification. Appl. Catal. B Environ. 2014, 152–153, 140–151. [Google Scholar] [CrossRef]
  12. Courson, C.; Udron, L.; Swierczy, D.; Petit, C.; Kiennemann, A. Hydrogen production from biomass gasification on nickel catalysts: Tests for dry reforming of methane. Catal. Today 2002, 76, 75–86. [Google Scholar] [CrossRef]
  13. Wang, D.; Yuan, W.; Ji, W. Char and char-supported nickel catalysts for secondary syngas cleanup and conditioning. Appl. Energy 2011, 88, 1656–1663. [Google Scholar] [CrossRef]
  14. Nassos, S.; Elm Svensson, E.; Boutonnet, M.; Järås, S.G. The influence of Ni load and support material on catalysts for the selective catalytic oxidation of ammonia in gasified biomass. Appl. Catal. B Environ. 2007, 74, 92–102. [Google Scholar] [CrossRef]
  15. Chianese, S.; Loipersböck, J.; Malits, M.; Rauch, R.; Hofbauer, H.; Molino, A.; Musmarra, D. Hydrogen from the high temperature water gas shift reaction with an industrial Fe/Cr catalyst using biomass gasification tar rich synthesis gas. Fuel Process. Technol. 2015, 132, 39–48. [Google Scholar] [CrossRef]
  16. Chianese, S.; Fail, S.; Binder, M.; Rauch, R.; Hofbauer, H.; Molino, A.; Blasi, A.; Musmarra, D. Experimental investigations of hydrogen production from CO catalytic conversion of tar rich syngas by biomass gasification. Catal. Today 2016, 277, 182–191. [Google Scholar] [CrossRef]
  17. Abu El-Rub, Z.; Bramer, E.A.; Brem, G. Experimental comparison of biomass chars with other catalysts for tar reduction. Fuel 2008, 87, 2243–2252. [Google Scholar] [CrossRef]
  18. Wang, F.J.; Zhang, S.; Chen, Z.D.; Liu, C.; Wang, Y.G. Tar reforming using char as catalyst during pyrolysis and gasification of Shengli brown coal. J. Anal. Appl. Pyrolysis 2014, 105, 269–275. [Google Scholar] [CrossRef]
  19. Asadullah, M.; Miyazawa, T.; Ito, S.; Kunimori, K.; Koyama, S.; Tomishige, K. A comparison of Rh/CeO2/SiO2 catalysts with steam reforming catalysts, dolomite and inert materials as bed materials in low throughput fluidized bed gasification systems. Biomass Bioenergy 2004, 26, 269–279. [Google Scholar] [CrossRef]
  20. Chan, F.L.; Tanksale, A. Review of recent developments in Ni-based catalysts for biomass gasification. Renew. Sustain. Energy Rev. 2014, 38, 428–438. [Google Scholar] [CrossRef]
  21. Han, J.; Kim, H. The reduction and control technology of tar during biomass gasification/pyrolysis: An overview. Renew. Sustain. Energy Rev. 2008, 12, 397–416. [Google Scholar] [CrossRef]
  22. Dou, B.; Gao, J.; Sha, X.; Baek, S.W. Catalytic cracking of tar component from high-temperature fuel gas. Appl. Therm. Eng. 2003, 23, 2229–2239. [Google Scholar] [CrossRef]
  23. Simell, P.; Kurkela, E.; Stahlberg, P.; Hepola, J. Catalytic hot gas cleaning of gasification gas. Catal. Today 1996, 27, 55–62. [Google Scholar] [CrossRef]
  24. Sutton, D.; Kelleher, B.; Doyle, A.; Ross, J.R. Investigation of nickel supported catalysts for the upgrading of brown peat derived gasification products. Bioresour. Technol. 2001, 80, 111–116. [Google Scholar] [CrossRef]
  25. Virginie, M.; Courson, C.; Niznansky, D.; Chaoui, N.; Kiennemann, A. Characterization and reactivity in toluene reforming of a Fe/olivine catalyst designed for gas cleanup in biomass gasification. Appl. Catal. B Environ. 2010, 101, 90–100. [Google Scholar] [CrossRef]
  26. Tamhankar, S.S.; Tsuchiya, K.; Riggs, J.B. Catalytic cracking of benzene on iron oxide-silica: Activity and reaction mechanism. Appl. Catal. B Environ. 1985, 16, 103–108. [Google Scholar] [CrossRef]
  27. Azhar Uddin, M.; Tsuda, H.; Wu, S.; Sasaoka, E. Catalytic decomposition of biomass tars with iron oxide catalysts. Fuel 2008, 87, 451–459. [Google Scholar] [CrossRef]
  28. Nemanova, V.; Nordgreen, T.; Engvall, K.; Sjöström, K. Biomass gasification in an atmospheric fluidised bed: Tar reduction with experimental iron-based granules from Höganäs AB, Sweden. Catal. Today 2011, 176, 253–257. [Google Scholar] [CrossRef]
  29. Serp, P.; Corrias, M.; Kalck, P. Carbon nanotubes and nanofibers in catalysis. Appl. Catal. A Gen. 2003, 253, 337–358. [Google Scholar] [CrossRef]
  30. Hu, M.; Laghari, M.; Cui, B.; Xiao, B.; Zhang, B.; Guo, D. Catalytic cracking of biomass tar over char supported nickel catalyst. Energy 2018, 145, 228–237. [Google Scholar] [CrossRef]
  31. Dumesic, J.A.; Huber, G.W.; Boudart, M. Handbook of Heterogeneous Catalysis; Vancouver Coastal Health: Vancouver, BC, Canada, 1997. [Google Scholar]
  32. Arteaga-Pérez, L.E.; Gòmez-Capiro, O.; Delgado, A.; Alejandro, S.; Jímenez, R. Elucidating the role of ammonia-based salts on the preparation of cellulose-derived carbon aerogels. Chem. Eng. Sci. 2017, 161, 80–91. [Google Scholar] [CrossRef]
  33. Marsh, H.; Rodriguez-Reinoso, F. Activated Carbon, 1st ed.; Elsevier: Amsterdam, The Netherlands, 2006; ISBN 0080444636. [Google Scholar]
  34. Jae, J.; Tompsett, G.A.; Foster, A.J.; Hammond, K.D.; Auerbach, S.M.; Lobo, R.F.; Huber, G.W. Investigation into the shape selectivity of zeolite catalysts for biomass conversion. J. Catal. 2011, 279, 257–268. [Google Scholar] [CrossRef]
  35. Girgis, B.S.; Temerk, Y.M.; Gadelrab, M.M.; Abdullah, I.D. X-ray diffraction patterns of activated carbons prepared under various conditions. Carbon Lett. 2007, 8, 95–100. [Google Scholar] [CrossRef]
  36. Short, M.; Walker, P. Measurement of interlayer spacings and crystal sizes in turbostratic carbons. Carbon 1963, 1, 3–9. [Google Scholar] [CrossRef]
  37. Kustov, A.L.; Frey, A.M.; Larsen, K.E.; Johannessen, T.; Nørskov, J.K.; Christensen, C.H. CO methanation over supported bimetallic Ni-Fe catalysts: From computational studies towards catalyst optimization. Appl. Catal. A Gen. 2007, 320, 98–104. [Google Scholar] [CrossRef]
  38. Matos, J.; Laine, J. Ethylene conversion on activated carbon-supported NiMo catalysts: Effect of the support. Appl. Catal. A Gen. 2003, 241, 25–38. [Google Scholar] [CrossRef]
  39. Corella, J.; Toledo, J.M.; Aznar, M.P. Improving the modelling of the kinetics of the catalytic tar elimination in biomass gasification. Ind. Eng. Chem. Res. 2002, 313–332. [Google Scholar] [CrossRef]
  40. Vannice, A. Kinetics of Catalytic Reactions, 1st ed.; Springer: New York, NY, USA, 2005. [Google Scholar]
  41. Korus, A.; Samson, A.; Szlęk, A.; Katelbach-Woźniak, A.; Sładek, S. Pyrolytic toluene conversion to benzene and coke over activated carbon in a fixed-bed reactor. Fuel 2017, 207, 283–292. [Google Scholar] [CrossRef]
  42. Bhandari, P.N.; Kumar, A.; Bellmer, D.D.; Huhnke, R.L. Synthesis and evaluation of biochar-derived catalysts for removal of toluene (model tar) from biomass-generated producer gas. Renew. Energy 2014, 66, 346–353. [Google Scholar] [CrossRef]
  43. Park, S.W.; Choi, B.S.; Lee, J.W. Breakthrough data analysis of adsorption of toluene vapor in a fixed-bed of granular. Sep. Sci. Technol. 2007, 42, 2221–2233. [Google Scholar] [CrossRef]
  44. Levenspiel, O. Experimental search deactivating for a simple porous rate equation particles to describe catalyst. J. Catal. 1972, 25, 265–272. [Google Scholar] [CrossRef]
  45. Robinson, A.M.; Hensley, J.E.; Will Medlin, J. Bifunctional catalysts for upgrading of biomass-derived oxygenates: A review. ACS Catal. 2016, 6, 5026–5043. [Google Scholar] [CrossRef]
  46. Juntgen, H.; van Heek, K.H. (Translated by Belov and Assoc., Denver, CO, APTIC-TR-0776). Fortschr. Chem. Forsch. 1970, 13, 601. [Google Scholar]
  47. Gao, N.; Wang, X.; Li, A.; Wu, C.; Yin, Z. Hydrogen production from catalytic steam reforming of benzene as tar model compound of biomass gasi fi cation. Fuel Process. Technol. 2016, 148, 380–387. [Google Scholar]
  48. Park, H.J.; Park, S.H.; Sohn, J.M.; Park, J.; Jeon, J.K.; Kim, S.S.; Park, Y.K. Steam reforming of biomass gasification tar using benzene as a model compound over various Ni supported metal oxide catalysts. Bioresour. Technol. 2010, 101, S101–S103. [Google Scholar] [CrossRef] [PubMed]
  49. Jess, A. Mechanisms and kinetics of thermal reactions of aromatic hydrocarbons from pyrolysis of solid fuels. Fuel 1996, 75, 1441–1448. [Google Scholar] [CrossRef]
  50. Li, C.; Suzuki, K. Tar property, analysis, reforming mechanism and model for biomass gasification—An overview. Renew. Sustain. Energy Rev. 2009, 13, 594–604. [Google Scholar] [CrossRef]
  51. Artetxe, M.; Alvarez, J.; Nahil, M.A.; Olazar, M.; Williams, P.T. Steam reforming of different biomass tar model compounds over Ni/Al2O3 catalysts. Energy Convers. Manag. 2017, 136, 119–126. [Google Scholar] [CrossRef]
  52. Wang, L.; Schütz, C.; Salazar-Alvarez, G.; Titirici, M.-M. Carbon aerogels from bacterial nanocellulose as anodes for lithium ion batteries. RSC Adv. 2014, 4, 17549. [Google Scholar] [CrossRef]
  53. Meng, Y.; Young, T.M.; Liu, P.; Contescu, C.I.; Huang, B.; Wang, S. Ultralight carbon aerogel from nanocellulose as a highly selective oil absorption material. Cellulose 2014, 22, 435–447. [Google Scholar] [CrossRef]
  54. Karacan, I.; Soy, T. Enhancement of oxidative stabilization of viscose rayon fibers impregnated with ammonium sulfate prior to carbonization and activation steps. J. Appl. Polym. Sci. 2013, 128, 1239–1249. [Google Scholar] [CrossRef]
  55. Charles, G.W.; Susott, R.A. Effects of Ammonium Phosphate and Sulfate on the Pyrolysis and Combustion of Cellulose. 1971. Available online: http://agris.fao.org/agris-search/search.do?recordID=US201300717137 (accessed on 5 October 2016).
  56. Grams, J.; Niewiadomski, M.; Ruppert, A.M.; Kwapiński, W. Influence of Ni catalyst support on the product distribution of cellulose fast pyrolysis vapors upgrading. J. Anal. Appl. Pyrolysis 2015, 113, 557–563. [Google Scholar] [CrossRef]
  57. Li, D.; Tamura, M.; Nakagawa, Y.; Tomishige, K. Metal catalysts for steam reforming of tar derived from the gasification of lignocellulosic biomass. Bioresour. Technol. 2015, 178, 53–64. [Google Scholar] [CrossRef] [PubMed]
  58. Li, H.; Yu, D.; Hu, Y.; Sun, P.; Xia, J.; Huang, H. Effect of preparation method on the structure and catalytic property of activated carbon supported nickel oxide catalysts. Carbon 2010, 48, 4547–4555. [Google Scholar] [CrossRef]
  59. Ohtsuka, Y.; Xu, C.; Kong, D.; Tsubouchi, N. Decomposition of ammonia with iron and calcium catalysts supported on coal chars. Fuel 2004, 83, 685–692. [Google Scholar] [CrossRef]
  60. Hoekstra, J.; Beale, A.M.; Soulimani, F.; Versluijs-helder, M.; Van De Kleut, D.; Koelewijn, J.M.; Geus, J.W.; Jenneskens, L.W. The effect of iron catalyzed graphitization on the textural properties of carbonized cellulose: Magnetically separable graphitic carbon bodies for catalysis and remediation. Carbon 2016, 107, 248–260. [Google Scholar] [CrossRef]
  61. De Lange, M.F.; Vlugt, T.J.H.; Gascon, J.; Kapteijn, F. Adsorptive characterization of porous solids: Error analysis guides the way. Microporous Mesoporous Mater. 2014, 200, 199–215. [Google Scholar] [CrossRef]
  62. Fernández, C.; Miranda, N.; García, X.; Eloy, P.; Ruiz, P.; Gordon, A.; Jiménez, R. Insights into dynamic surface processes occurring in Rh supported on Zr-grafted γ-Al2O3 during dry reforming of methane. Appl. Catal. B Environ. 2014, 156, 202–212. [Google Scholar] [CrossRef]
Figure 1. Transmission Electron Microscopy (TEM) images of (a) Ni/AC, (b) Fe/AC, (c) X-Ray Diffraction (XRD) of support and catalysts and (d) Thermal resistance: solid Lines: (Air = 50 mL/min, 10 °C/min), dashed Lines (18% H2/20% CO/12% CO2/6% CH4 = 50 mL/min, 10 °C/min).
Catalysts 08 00119 g001
Figure 2. Effect of temperature on toluene conversion (a) Ni/AC, (b) Fe/AC and Arrhenius Plots for (c) Ni/AC and (d) Fe/AC.
Catalysts 08 00119 g002
Figure 3. Temperature program for reaction tests at bench-scale.
Catalysts 08 00119 g003
Figure 4. Kinetic assays for naphthalene and benzene conversion over Ni/AC. (a) Effect of temperature, (b) Effect of temperature on the incremental yields, (c) Equilibrium constants for the possible reaction scheme (tar conversion (not shown), was 100%,).
Catalysts 08 00119 g004
Figure 5. Reaction mechanisms for tar decomposition.
Catalysts 08 00119 g005
Figure 6. Catalytic rig for toluene decomposition. 1—Gas containers, 2—flow controllers, 3—Evaporator, 4—Syringe pump, 5—Check valve, 6—Reactor bypass, 7—Reactor, 8—Furnace, 9—Gas chromatograph.
Catalysts 08 00119 g006
Figure 7. Catalytic rig for tar steam reforming. 1—Gas containers, 2—Flow controllers, 3—Water and tar evaporators, 4—Syringe pumps, 5—Mixer, 6—Multiport valve, 7—Reactor, 8-Furnace, 9—Mass spectrometer.
Catalysts 08 00119 g007
Table 1. Textural data on support and catalysts.
CatalystPore Volume Vp (cm3/g)Avg. Pore Diameter Dp (nm)Surface Area SBET (m2/g)Metal Loading (% wt/wt)Crystallite Dimensions (Å)
Ni/AC0.285.8–5.76845.1-
Fe/AC0.304.3–4.26785.3-
AC0.374.0–6.0743-La = 28; Lc = 12

