Improved CO-PROX Performance of CuO/CeO2 Catalysts by Using Nanometric Ceria as Support


1
Dipartimento di Ingegneria Chimica, dei Materiali e della Produzione Industriale, University of Naples Federico II, P.le Tecchio 80, 80125 Naples, Italy
2
Institute of Researches on Combustion-CNR, P.le Tecchio 80, 80125 Naples, Italy
*
Author to whom correspondence should be addressed.
Catalysts 2018, 8(5), 209; https://doi.org/10.3390/catal8050209
Submission received: 24 April 2018
/
Revised: 11 May 2018
/
Accepted: 11 May 2018
/
Published: 15 May 2018
(This article belongs to the Special Issue Catalysts for Hydrogen Purification for Fuel Cell Applications)
Abstract
:Despite of the huge number of papers about the catalytic preferential oxidation of CO (CO-PROX) for the purification of H2 streams, there is still a need for more effective catalysts in order to reduce the large required catalyst volume of CO-PROX unity. In this work, large surface area nanometric ceria was used as support for CuO/CeO2 catalysts with CuO load up to 10 wt % easily dispersed by wet impregnation. Catalysts were characterized by ICP-MS, XRD, SEM/EDS, N2 physisorption, H2 temperature programmed reduction (TPR), and CO2 temperature programmed desorption (TPD) and tested under different reaction conditions (including under feed containing inhibiting species such as CO2 and H2O). Catalytic tests revealed that our samples show high activity and selectivity even under stringent reaction conditions; moreover, they result among the most active catalysts when compared to those reported in the scientific literature. The high activity can be related to the enhanced amount of highly dispersed copper sites in strong interaction with ceria related to the nature of the nanometric support, as evidenced by the characterization techniques. Despite the high concentration of active copper sites, catalytic performance is limited by CO2 desorption from ceria in the neighborhood of copper sites, which prevents a further improvement. This suggests that new catalyst formulations should also provide a lower affinity towards CO2.
1. Introduction
The catalytic preferential oxidation of CO (CO-PROX) has been proposed as an effective technique to purify hydrogen streams for Proton-Exchange Membrane (PEM) fuel cells reducing CO concentration from 0.5–1 vol % to 10–100 ppm [1,2,3]. A proper catalyst should operate at quite low temperatures in order to reduce CO concentration to this level, limiting as much as possible the competitive H2 oxidation activated at slightly higher temperatures [3,4,5,6,7,8,9,10,11,12,13,14,15,16,17,18,19,20,21,22].
Catalysts proposed for CO-PROX process include noble metal-based systems, mostly Pt but also Au-supported on metal oxides [23,24,25,26,27,28,29,30,31].
CuO/CeO2 catalysts represent a cheaper and more selective alternative to noble metals and have been widely investigated in the last decades [3,5,32,33,34], focusing on methods to further improve performance based on doping [6,8,10,18,22,35,36,37,38,39,40,41,42] or unconventional preparation methods [4,11,12,18,43,44,45,46,47].
The reason for the good performance of CuO/CeO2 catalysts was assigned to the strong interactions between copper and ceria resulting in an enhanced reducibility of both oxides [48,49,50]. In particular, copper reducibility depends on its dispersion on CeO2, highly dispersed copper showing the best CO oxidation activity and selectivity [51]. Indeed, copper oxides clusters, not interacting with ceria, are recognized as active centers for the (undesired) H2 oxidation [21,52].
Generally, a lower copper content provides a good dispersion of CuO particles for catalysts prepared by impregnation [48,52], thus providing highly active copper but at the expense of the total number of sites. Other techniques, such as coprecipitation, sol–gel, and combustion synthesis [9,10,11,12,13,14,15,18,44,53] are also used to favor copper dispersion and interaction with ceria.
In a previous work, it was found that 4 wt % CuO roughly corresponded to the monolayer coverage on a commercial ceria with a surface area equal to 56 m2/g [52]. For CeO2 with the same surface area, Maciel et al. [48] found a similar result, detecting XRD reflections of CuO clusters only for catalyst with a copper load exceeding 5 wt %. The activity towards CO oxidation increased up to 4 wt % CuO, whilst a further increase of the copper load did not provide a significant increase of CO conversion. Moreover, the kinetic constant measured at 100 °C per copper amount slightly decreased up to 4 wt % and it dropped for 8 wt %, suggesting that badly dispersed copper is not active towards CO oxidation. As a consequence, the best intrinsic activity is associated with the catalyst with the highest copper dispersion [52].
More recently, 4 wt % CuO dispersed on nanometric CeO2 from colloidal solution (surface area equal to 120 m2/g) was used to washcoat a ceramic honeycomb monolith [54,55] with good results related not only to the increased heat and mass transfer, associated with the use of a structured catalyst with a proper substrate, but also with the high dispersion of copper on a ceria support with a much larger surface area compared to that used in [52]. The copper load, equal to that used for conventional CeO2 with a half surface area, is likely under the monolayer coverage when nanometric ceria is used as support. Consequently, nanometric CeO2 could theoretically accommodate more dispersed copper, thus enhancing the intrinsic catalyst activity of the system.
In the present work, on the basis of these results, nanometric ceria performances at increasing copper amounts dispersed on nanometric ceria were tested in the CO-PROX reaction in order to reduce the PROX reactor volume using a more effective catalyst. In fact, reduction of catalytic reactor volume, together with a suitable control of the heat generated by the reaction, is one of the main objectives for CO-PROX, especially for automotive applications [56]. Consequently, this work represents a preliminary and fundamental study to select a highly performing active phase to be supported on a structured substrate. Samples with 4, 8 and 10 wt % CuO nominal content were prepared in order to obtain catalysts with a copper load lower than, equal to, or exceeding the theoretical monolayer coverage, respectively, on the basis of CeO2 surface area (120 m2/g) [48,52]. The catalysts are labelled xCuCe where x represents the nominal CuO load.
2. Results
2.1. Catalysts Characterization
2.1.1. ICP-MS, XRD, SEM/EDS, and BET
Results of ICP-MS analysis (not reported) revealed that the copper content corresponds to the theoretical one within the experimental error.
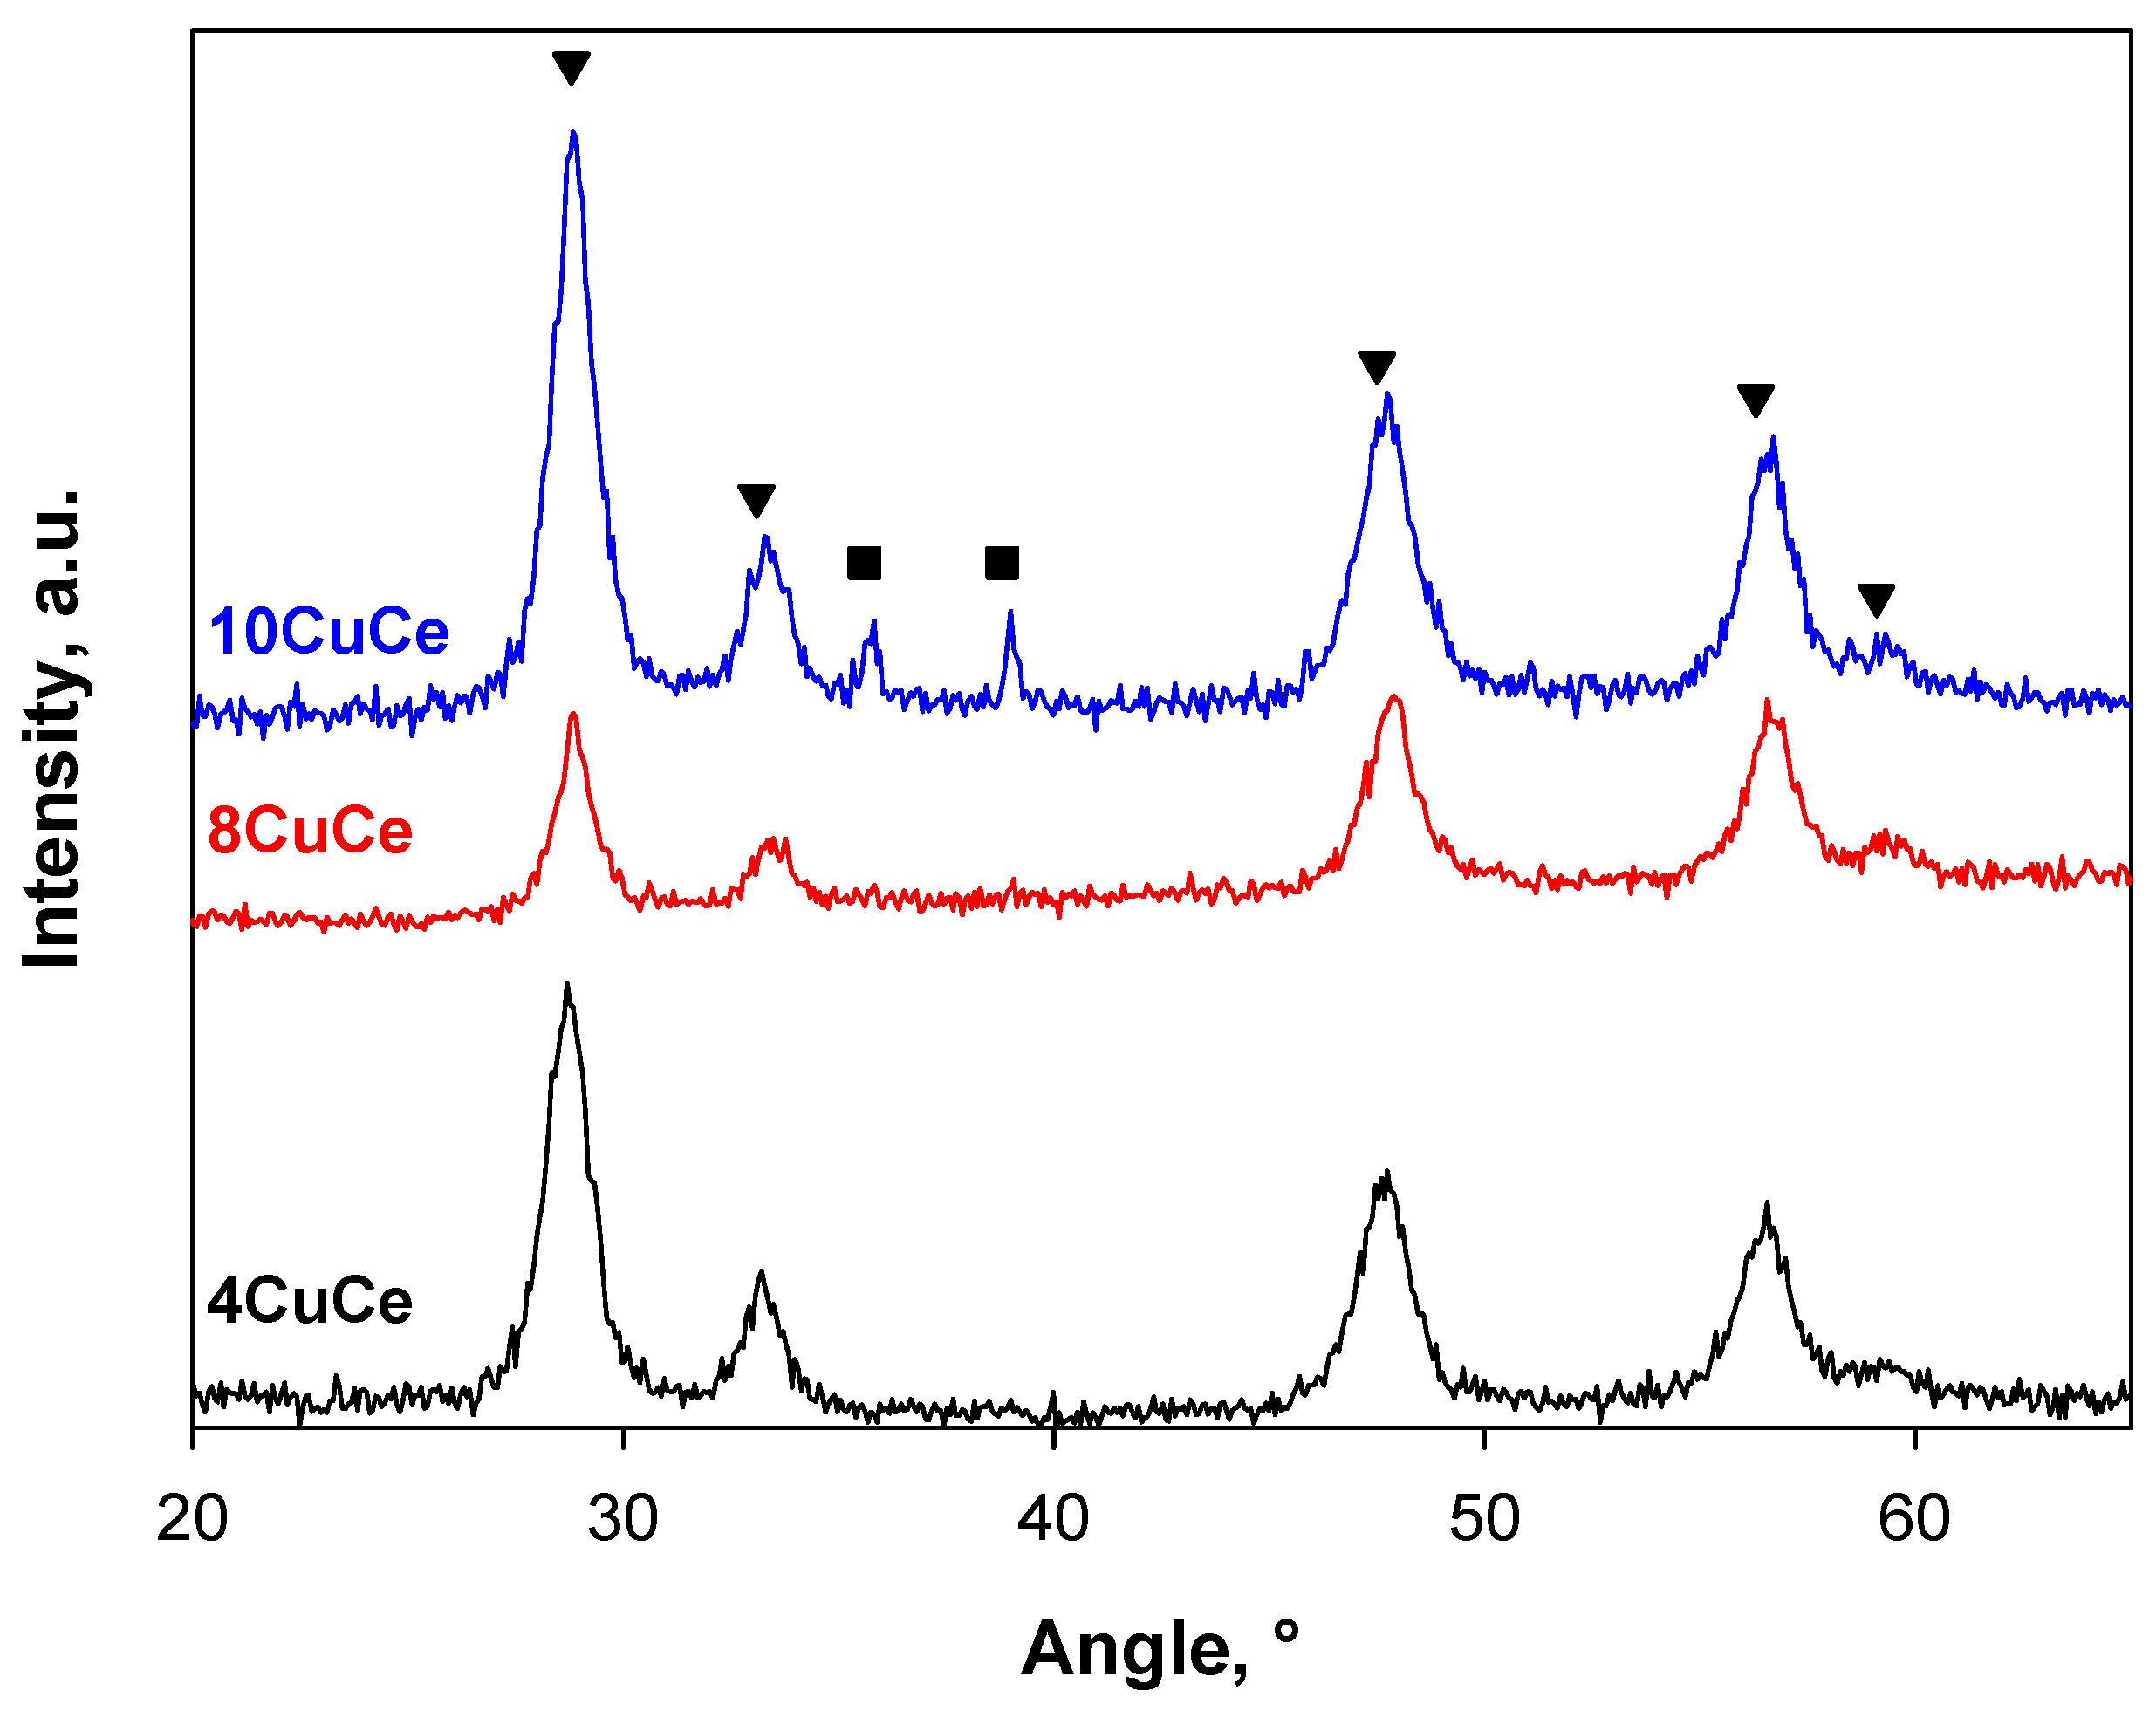
Figure 1 shows the XRD patterns of the catalysts at different CuO content. All patterns show the typical reflections of fluorite structure (28.8°, 33.1°, 47.5°, 56.3°, 59.1°; JCPDS 43-1002 [57]). No CuO reflections are detected on 4CuCe and 8CuCe, while typical peaks of monoclinic CuO (tenorite: 35.6° and 38.8°; JCPDS 45-0937 [58]) are observed on 10CuCe.
Figure 2 shows SEM images at 3000× magnification and the corresponding EDS analysis of all samples. A good copper dispersion can be detected for 4CuCe and 8CuCe samples, not showing detectable copper oxide aggregates. The surface copper composition of these samples is 3.7% and 8.8% (wt.), respectively, slightly higher than the corresponding nominal values (Table 1). On the contrary, 10CuCe appears more heterogeneous; as a matter of fact, the presence of bulk-like copper oxide is evident in the EDS map and well agrees with XRD results. In this sample, the estimated surface copper amount is 6.1 wt %, much lower than the nominal content (8 wt %; see Table 1), and it could be linked to the lower homogeneity in the copper distribution.
In Table 1, the BET surface areas of the freshly calcined catalysts are reported. The SSA of the support is about 120 m2/g [54]. As expected, all the samples show SSA lower than the bare support, approaching a plateau level starting from the sample with the supposed monolayer coverage (8%). Analysis of the pore size distribution (not shown), estimated according to the BJH model based on desorption branch of the isotherm, suggested that the reduction of surface area is mainly assignable to blocking of larger pores of the original support, having a PSD extending from about 10 to 60 Å. Indeed, pores in the region 25–60 Å disappear for xCuCe catalysts, with a consequent reduction of total pore volume from 0.077 cm3 g−1 for CeO2 support to 0.044 cm3 g−1 for 10CuCe. The small contribution of new pores centered at 10–15 Å evaluated for xCuCe catalysts does not balance the loss of mesopores of CeO2.
2.1.2. H2 Temperature Programmed Reduction (TPR)
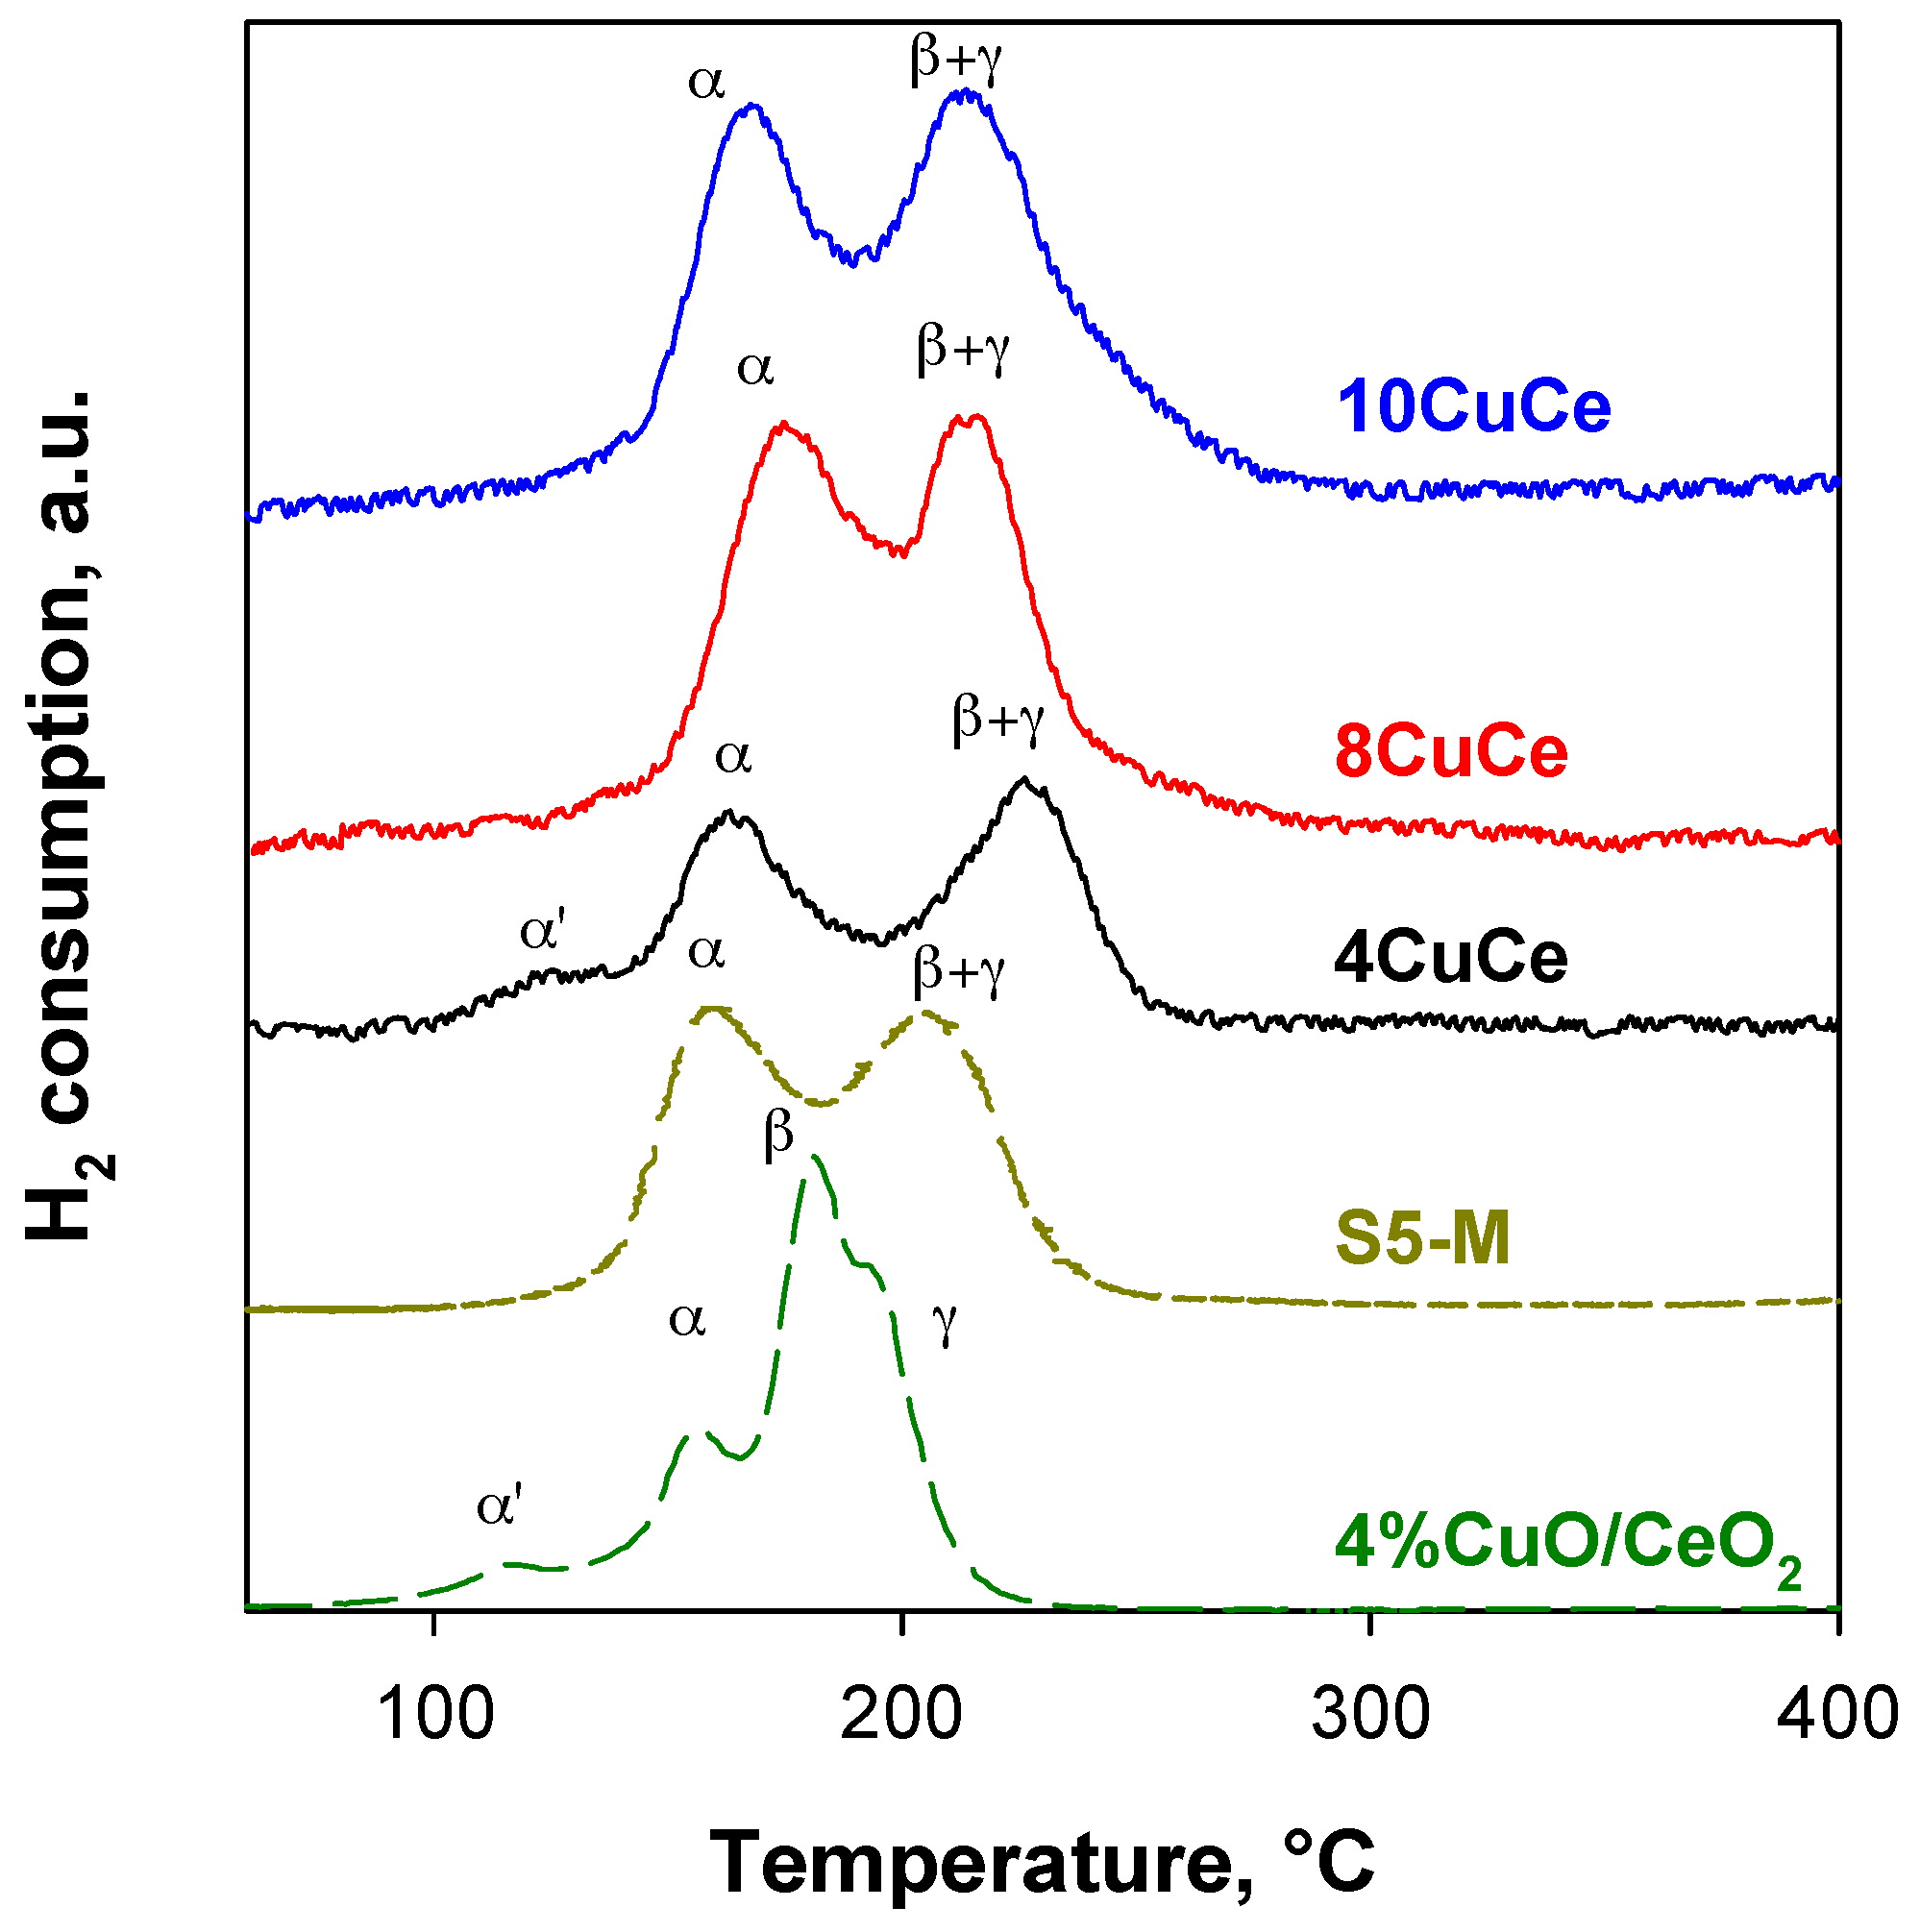
H2-TPR profiles of xCuCe samples are shown in Figure 3 in terms of hydrogen uptake as a function of temperature. The reduction profiles of xCuCe samples refers to the third cycle of the redox treatment because the TPR profiles on copper/ceria catalysts are reproducible only after the first one, as also reported by Zimmer et al. [59] and by Caputo et al. [52] and attributed to copper redistribution during the reduction process, stabilizing copper in lower energy sites. In the same figure, the TPR profile of 4%CuO/CeO2 [52] (catalyst with the same copper load on the commercial ceria from Grace with 56 m2/g SSA) and of S5-M [54] (ceramic monolith washcoated with copper/ceria slurry with the same nanometric ceria and the same copper content of 4CuCe) are shown for comparison. In Table 2, the H2 uptake evaluated from the integration of TPR curves is reported.
As reported in the literature, ceria reduction starts at temperatures higher than 350 °C [52,59,60]; however, a small copper amount supported on ceria significantly modifies the TPR pattern, showing two to four reduction peaks at temperatures much lower than those obtained on pure ceria [9,19,22,43,52,61,62].
From a quantitative point of view, the total H2 uptake increases with Cu load, as expected on the basis of the increasing nominal copper content and exceeds that estimated on the basis of reduction of copper from Cu2+ to Cu0 due to the enhanced reducibility of cerium when strongly interacting with copper confirmed by the H2/Cu ratio > 1 [52]. Nevertheless, this ratio is not so high as expected by a supposed greater copper dispersion, with a H2/Cu ratio as high as 3.7 having been found for the catalyst with the lowest copper load and best dispersion [52]. Likewise, also for the same ceria support, this ratio was estimated to be 2.2 for S5-M [54]. On the other hand, it must be highlighted that within the xCuCe series, the H2/Cu ratio decreases with increasing copper load, which is in agreement with a more extended copper–cerium interaction when the copper load is lower than the monolayer coverage [52].
In contrast with the quantitative analysis, all xCuCe catalysts show two main reduction peaks, in agreement with the curve of S5-M where the same colloidal ceria was used for the washcoat [54] (Figure 3). Only 4CuCe shows an additional very small peak at low temperature. However, TPR profiles of xCuCe appear simpler and slightly shifted towards higher temperatures with respect to that of the sample prepared with commercial Grace ceria (4% CuO/CeO2 in Figure 3 [52]), basically resembling that of 0.5% CuO/CeO2 reported in [52], showing only two peaks at higher temperature.
TPR curves were deconvoluted using Origin 2015 Software (OriginPro 2015): the first peak (α peak) related to the reduction of copper species strongly interacting with ceria, the second one (β peak) related to large CuO clusters formed on the ceria surface, and the third one (γ peak) related to surface ceria reduction promoted by copper [54]. α’ peak can be assigned to isolated Cu2+ species strongly interacting with ceria [63]. These species can be expected on 4CuCe due to the coverage level being lower than the monolayer. The species responsible for α and β peaks were related to CO and H2 oxidation sites, respectively [21]. Nevertheless, we have previously demonstrated that the β and γ peaks merge on CuO supported over nanometric ceria due to the shift of the β peak to higher temperatures [54]. Therefore, in Table 2 a unique β + γ contribution is reported. In addition, only for the 4CuCe sample, the area of α’ signal is evaluated. The sum (α’ + α) increases from 4 to 8 wt % CuO load, then approaches a quite stable value. The same trend is observed for (β + γ), although a more significant increase is estimated from 8 to 10 wt % copper oxide load, in agreement with the larger fraction of copper oxide aggregates observed by SEM and XRD for 10CuCe.
2.1.3. CO2 Temperature Programmed Desorption (TPD)
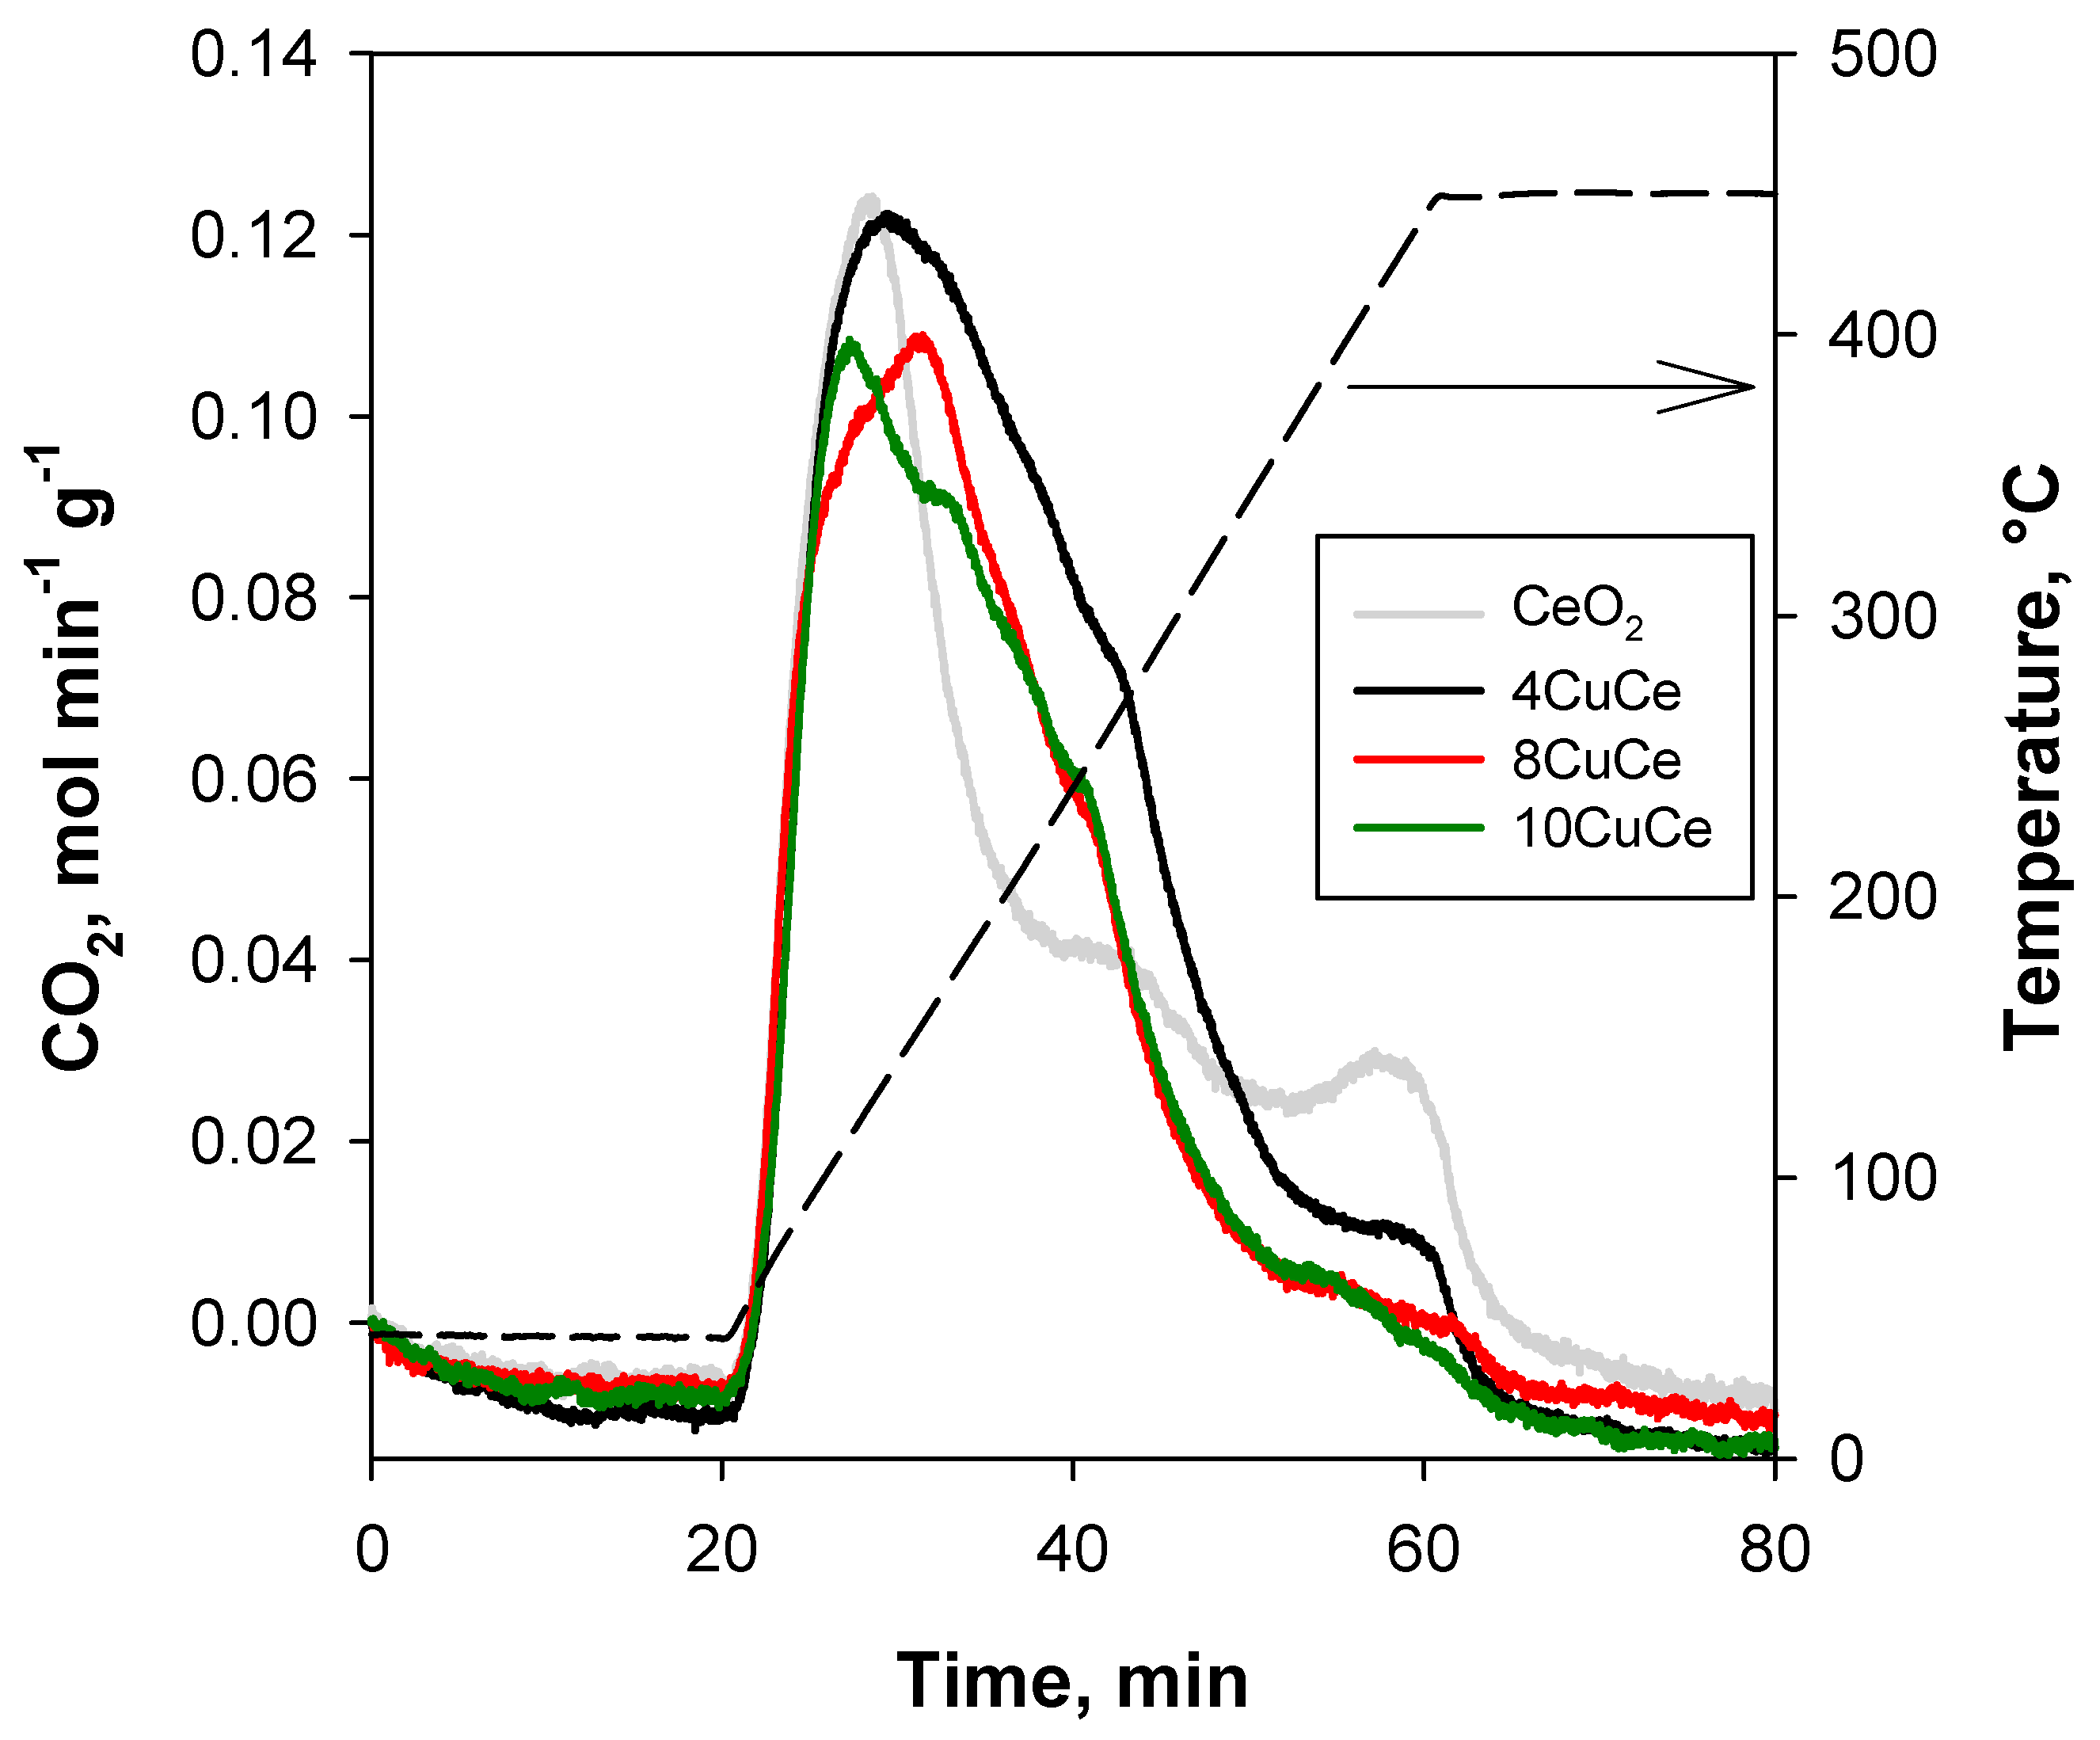
In Figure 4, CO2-TPD profiles are shown, and in Table 2, the amount of CO2 desorbed evaluated from the curve integration is reported.
All samples show a tailed peak with a maximum at 110–140 °C, which is in agreement with our previous results on copper-based catalysts supported on conventional ceria [21]. Nevertheless, for those catalysts, TPD profiles followed much more that of the corresponding support, whereas TPD profiles of xCuCe catalysts reported in the present paper appear quite different, and for this reason, a deconvolution of curves was not attempted. Indeed, the peak at about 450 °C is reduced due to the increasing addition of copper, whilst a significant additional contribution between 130 and 320 °C is detectable in the profiles of xCuCe catalysts, especially for 4CuCe. This suggests that the addition of copper inhibits the support adsorption centers desorbing CO2 at high temperatures, but it increases the amount of adsorption centers desorbing CO2 at intermediate temperatures.
Although different at T < 165 °C, the TPD profiles of xCuCe catalysts show the same shape at higher temperatures, those of 8CuCe and 10CuCe just shifted to lower CO2 concentrations, likely due to a smaller overall contribution of the support, suggesting that the nature of the new sites is about the same.
Otherwise, the TPD profiles of 8CuCe and 10CuCe are not overlapped at low temperatures, showing different shapes. The same occurs for 4CuCe, although the curve of this sample is always shifted at higher CO2 concentrations.
Sites desorbing CO2 at low temperatures are considered to be responsible for CO oxidation and identified as Cu2+-O2−-Ce4+ [21]. Therefore, the different profile at low temperatures can suggest a different site distribution as also evidenced by TPR analysis.
Finally, from the quantitative point of view (Table 2), the trend is the same observed for the catalysts supported on conventional ceria, namely, the catalyst with the highest copper dispersion provides the greatest amount of desorbed CO2. In other words, the maximum amount of CO2 adsorption sites (both from ceria and from dispersed copper) is achieved by the catalyst with the lowest Cu load related to the best compromise between the number of the (still) free CeO2 sites and that of new Cu sites.
2.2. Activity Tests
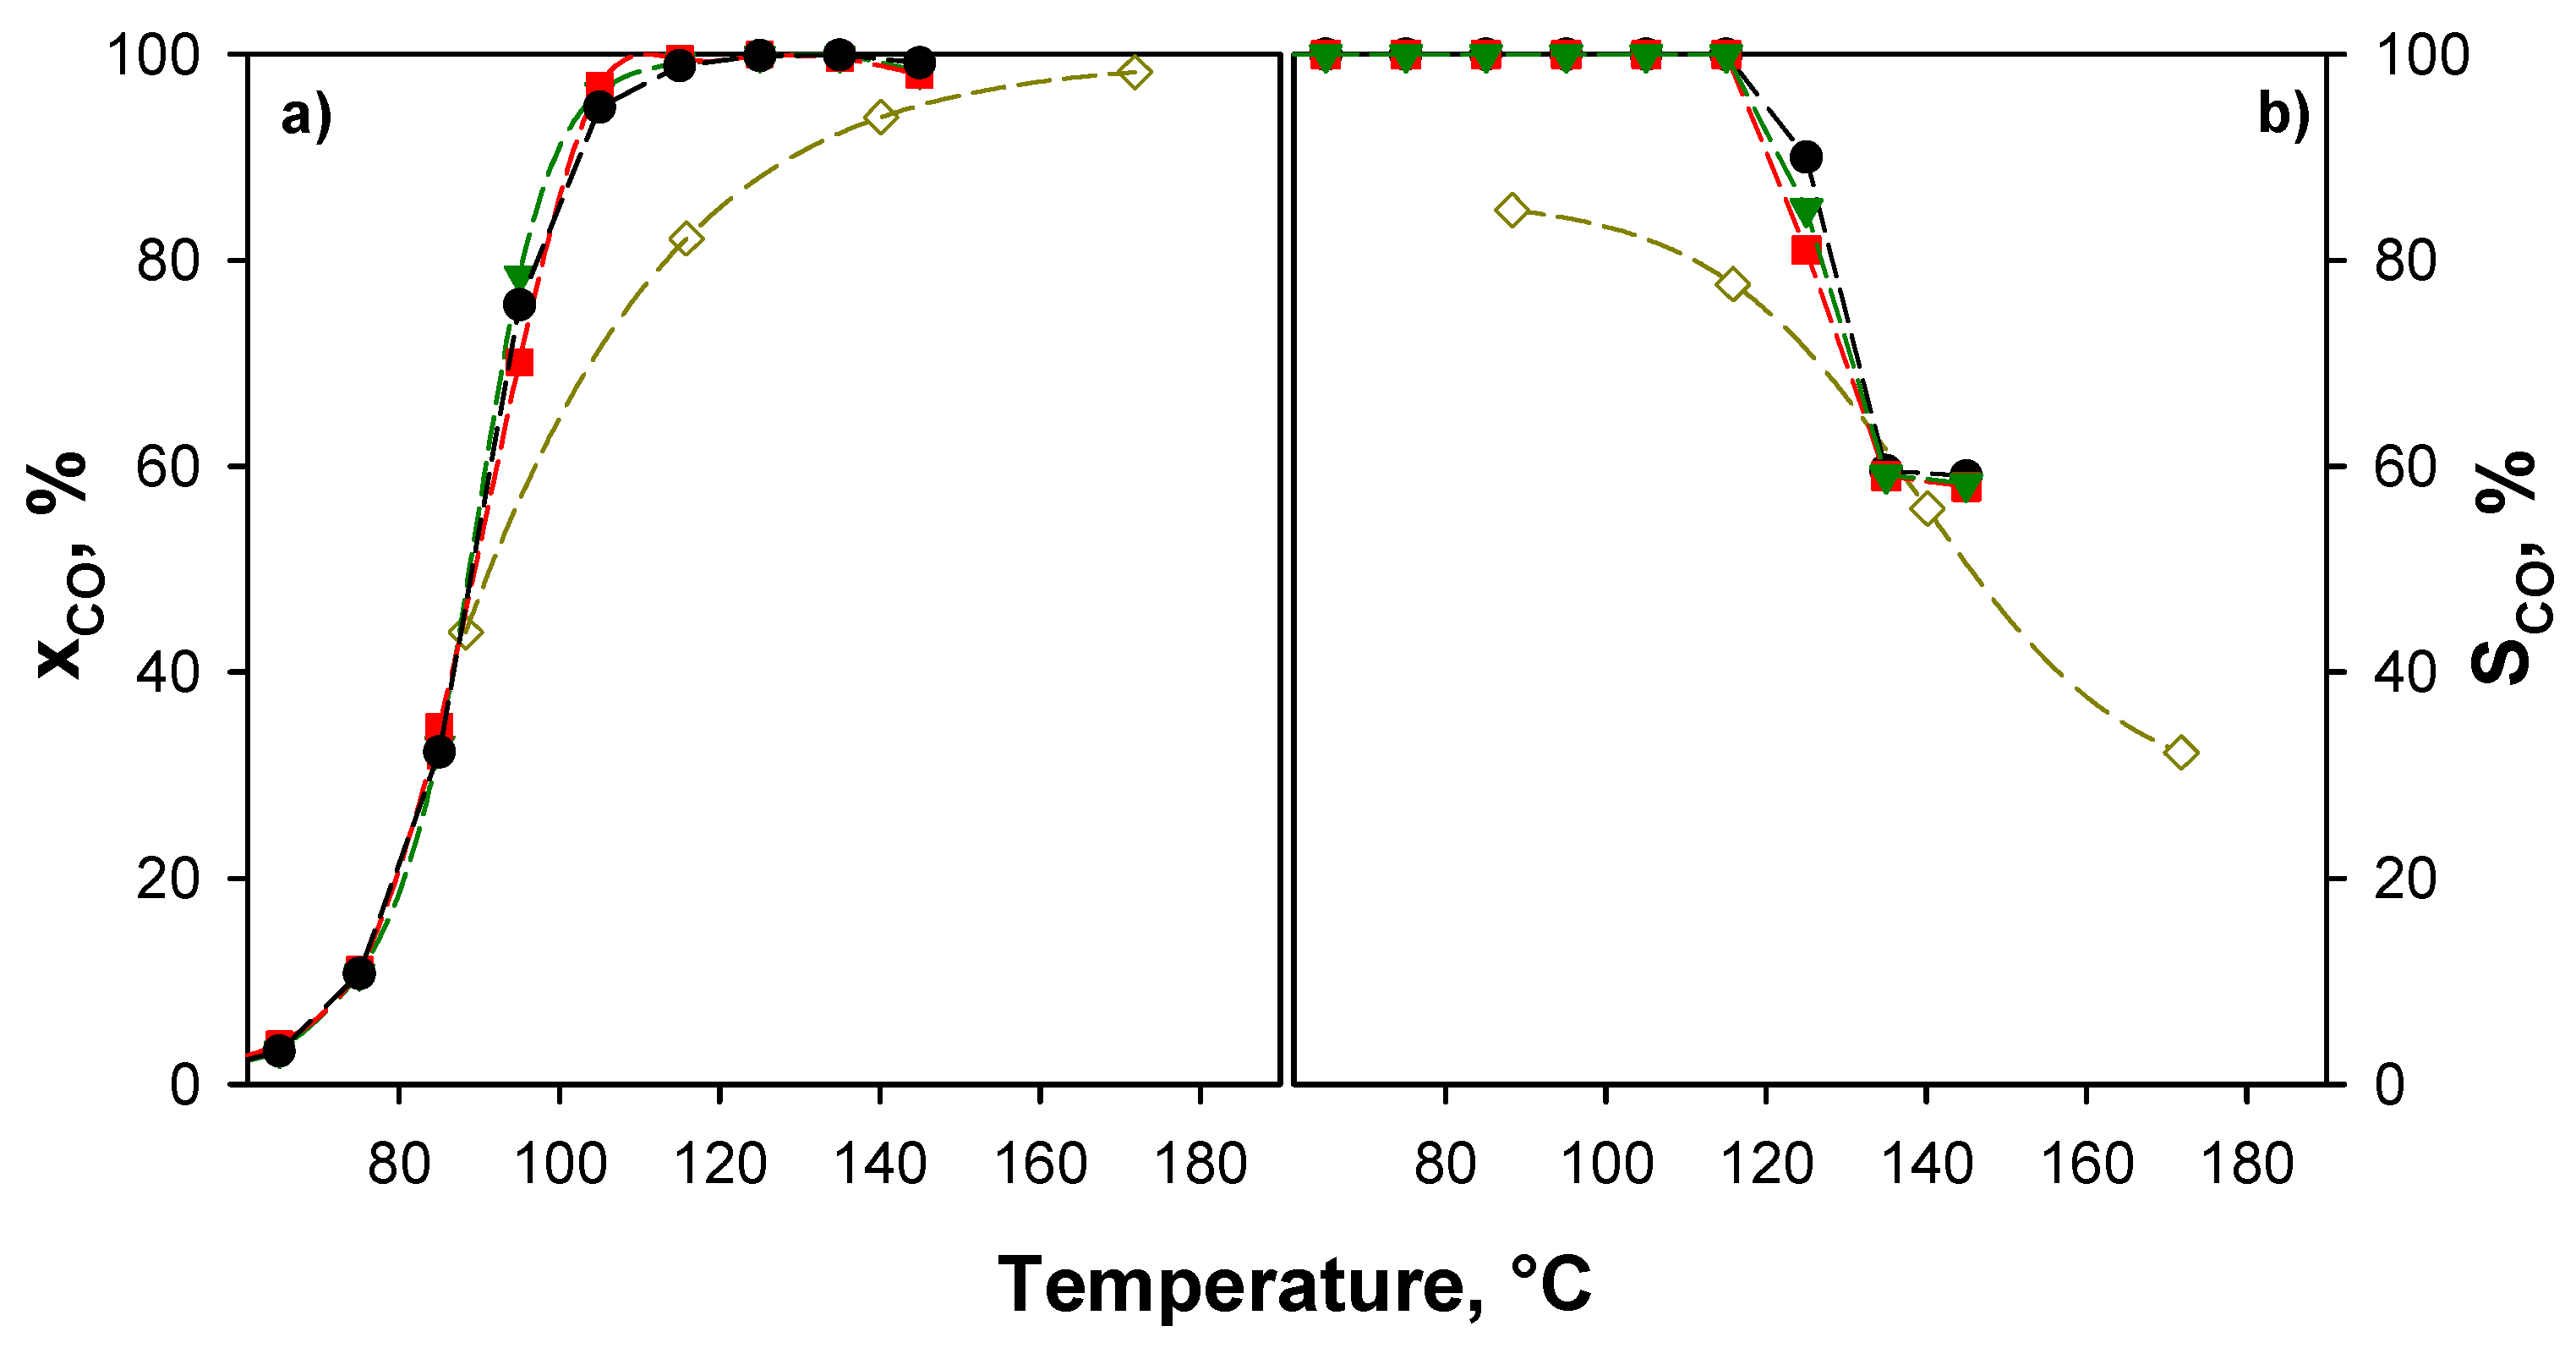
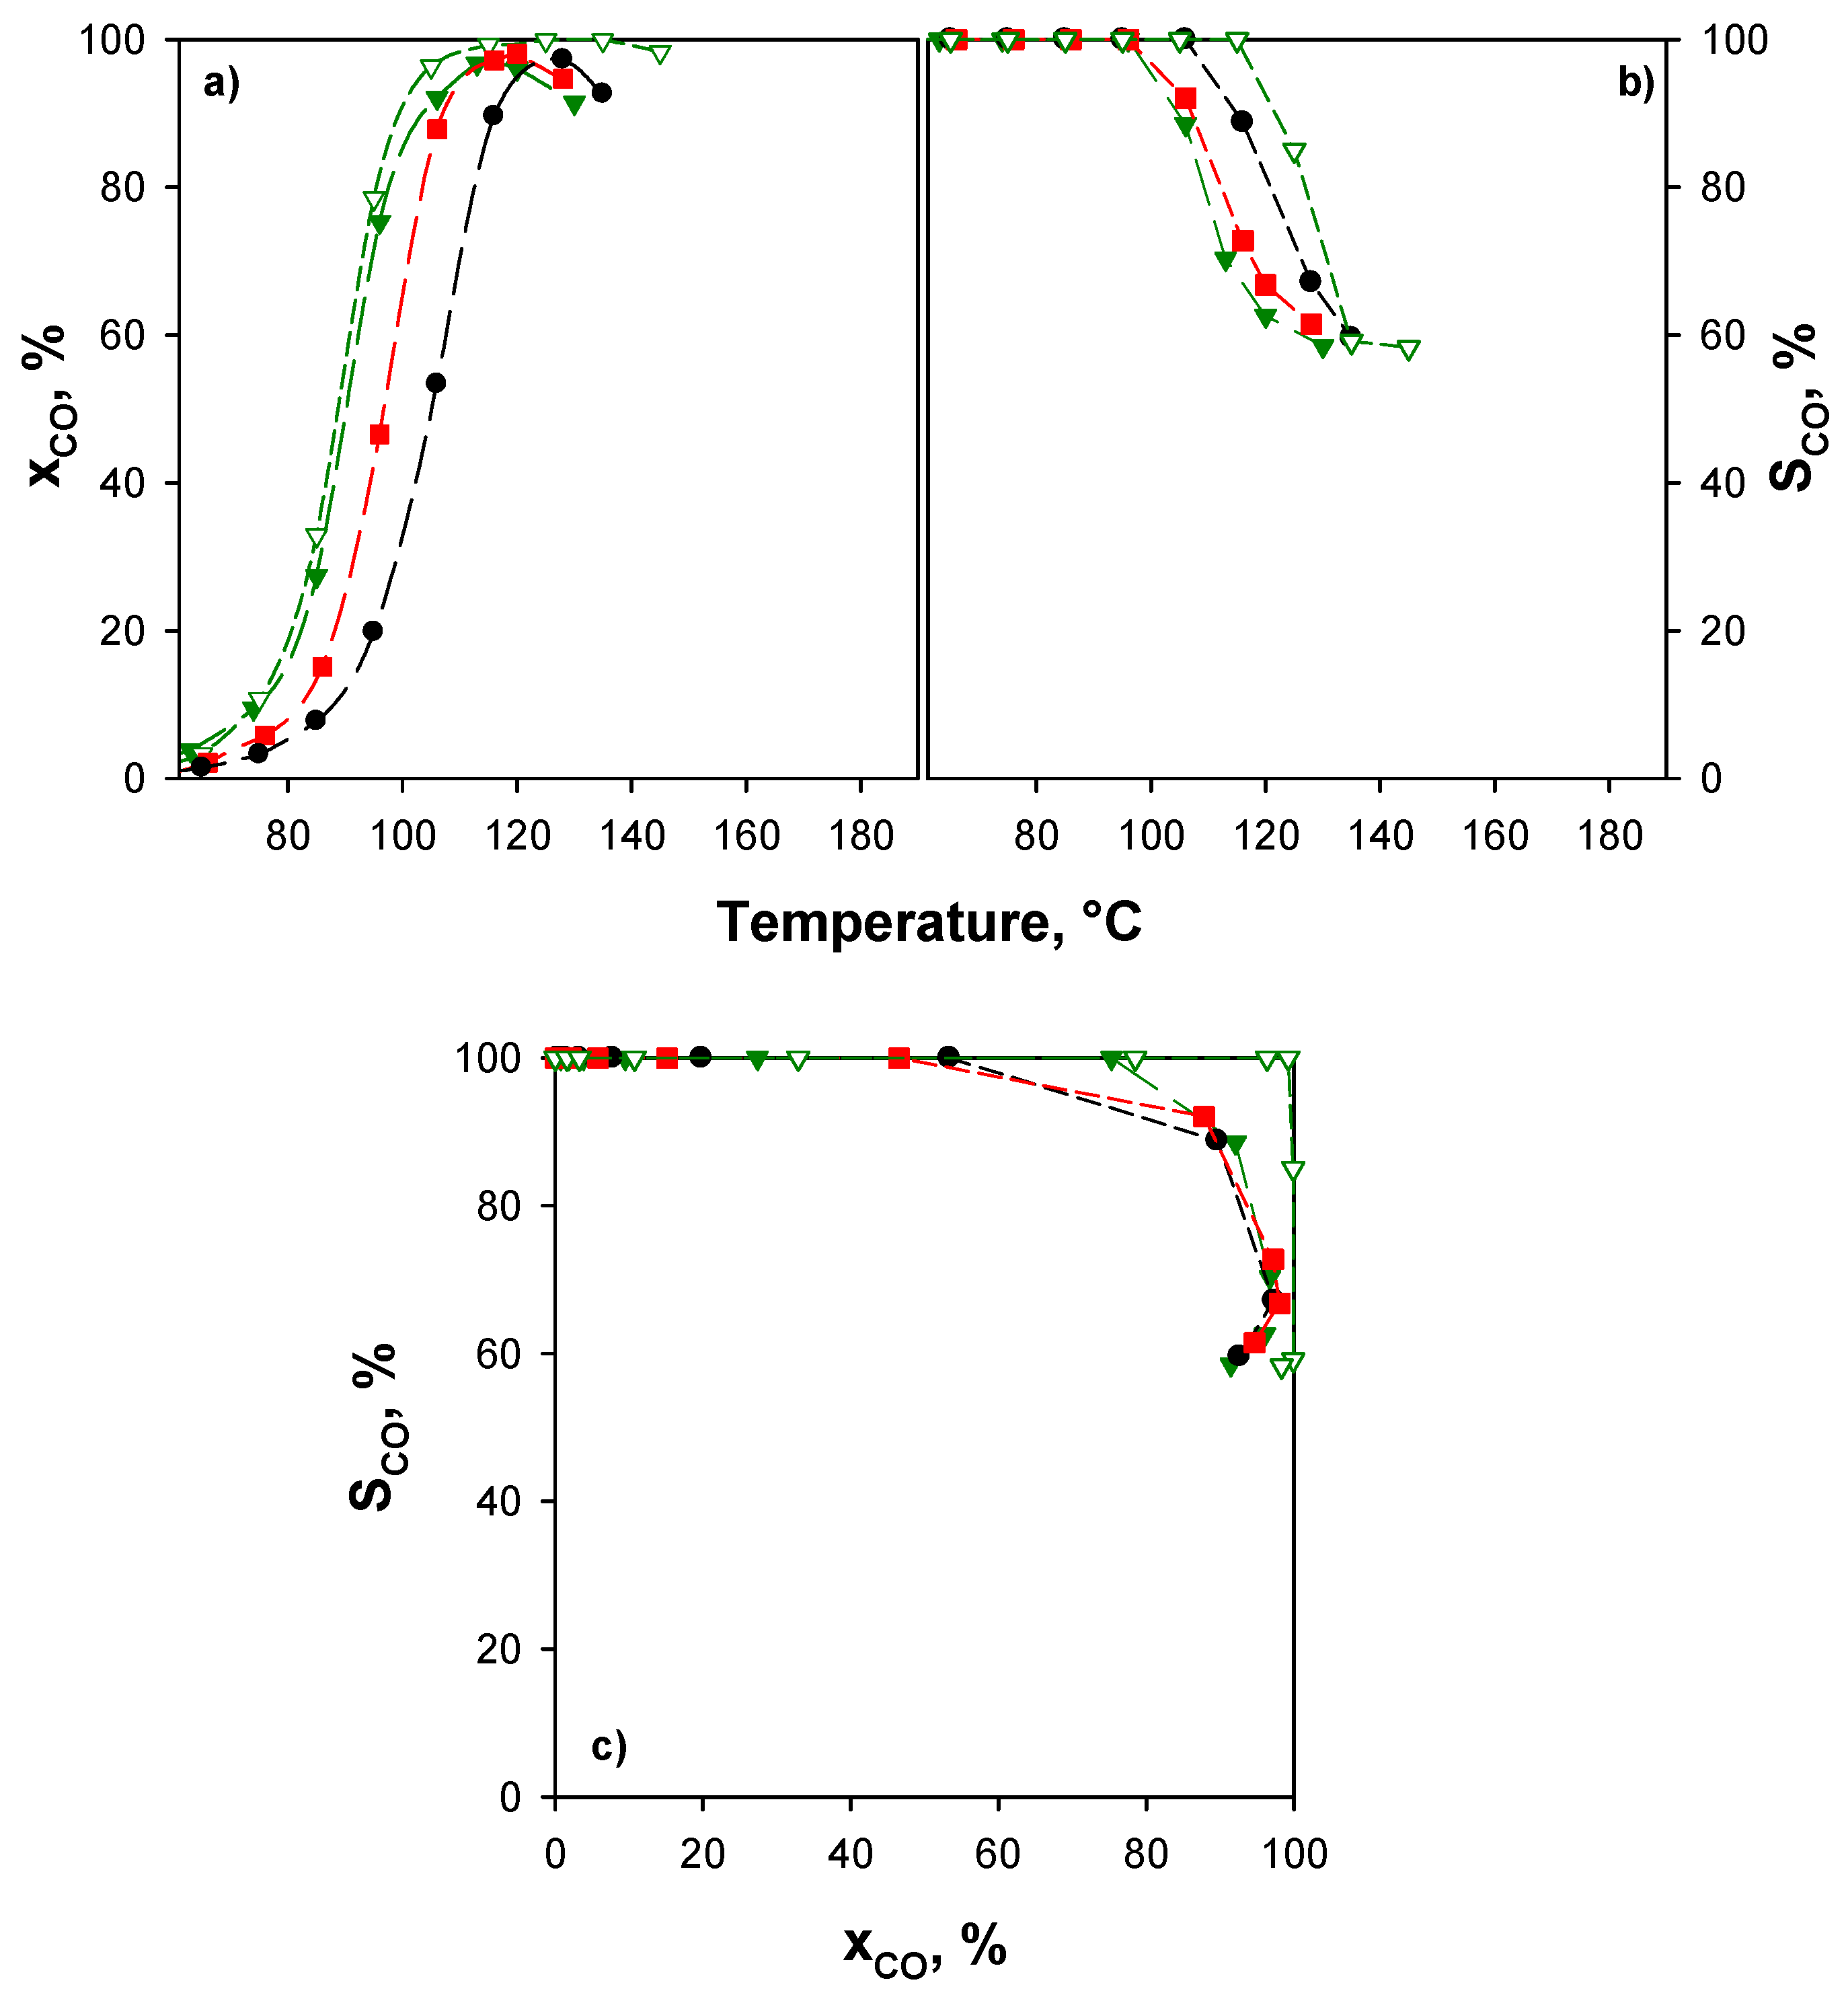
Activity tests (Figure 5) were performed under the same reaction conditions used in our previous works [15,17,21,54,64] in order to compare catalysts, i.e., in the absence of CO2 and H2O and at contact time, defined as catalyst weight divided by total flow rate (W/F), equal to 0.054 g·s·cm−3. As for TPR analysis, performance of 4% CuO/CeO2 catalyst reported in [15] has been also reported as a reference.
All xCuCe catalysts exhibit CO conversion higher than that of 4% CuO/CeO2 at T > 90 °C and 100% CO selectivity up to 110 °C, thus highlighting the much better performance of catalysts supported on ceria with a double surface area. Surprisingly, catalytic performance both in terms of CO conversion (Figure 5a) and selectivity to CO2 (Figure 5b) appears to be independent of the copper content. This behavior will be discussed in the Section 3.
Due to the wide range of operative conditions reported in the literature, a full comparison of the present results with previous works is not trivial. However, some indications can be drawn. Table 3 compares the catalytic activity of some highly performing copper/ceria catalysts reported in the scientific literature and those reported in this work in terms of temperature at which CO conversion higher than 99% (T99) is attained. Table 3 also shows the values of contact times (τ’) defined as number of active sites (CuO) per CO molecules fed per second.
On the basis of these comparisons, our catalysts rank among the best catalysts. It should be underlined that our catalysts overcome or are comparable to other samples prepared with nano-shaped supports, such as nanosheets [65], nanorods [66], and nanocubes [67].
However, the question about the independence of the activity of the copper content is still open. While mass transfer limitations can be invoked at high conversion, an intrinsic kinetic regime is more probable at low CO conversion. Anyhow, the controlling regime was verified (see Section 2.3, Appendix A) and no mass transfer limitations are found at temperatures below 110 °C.
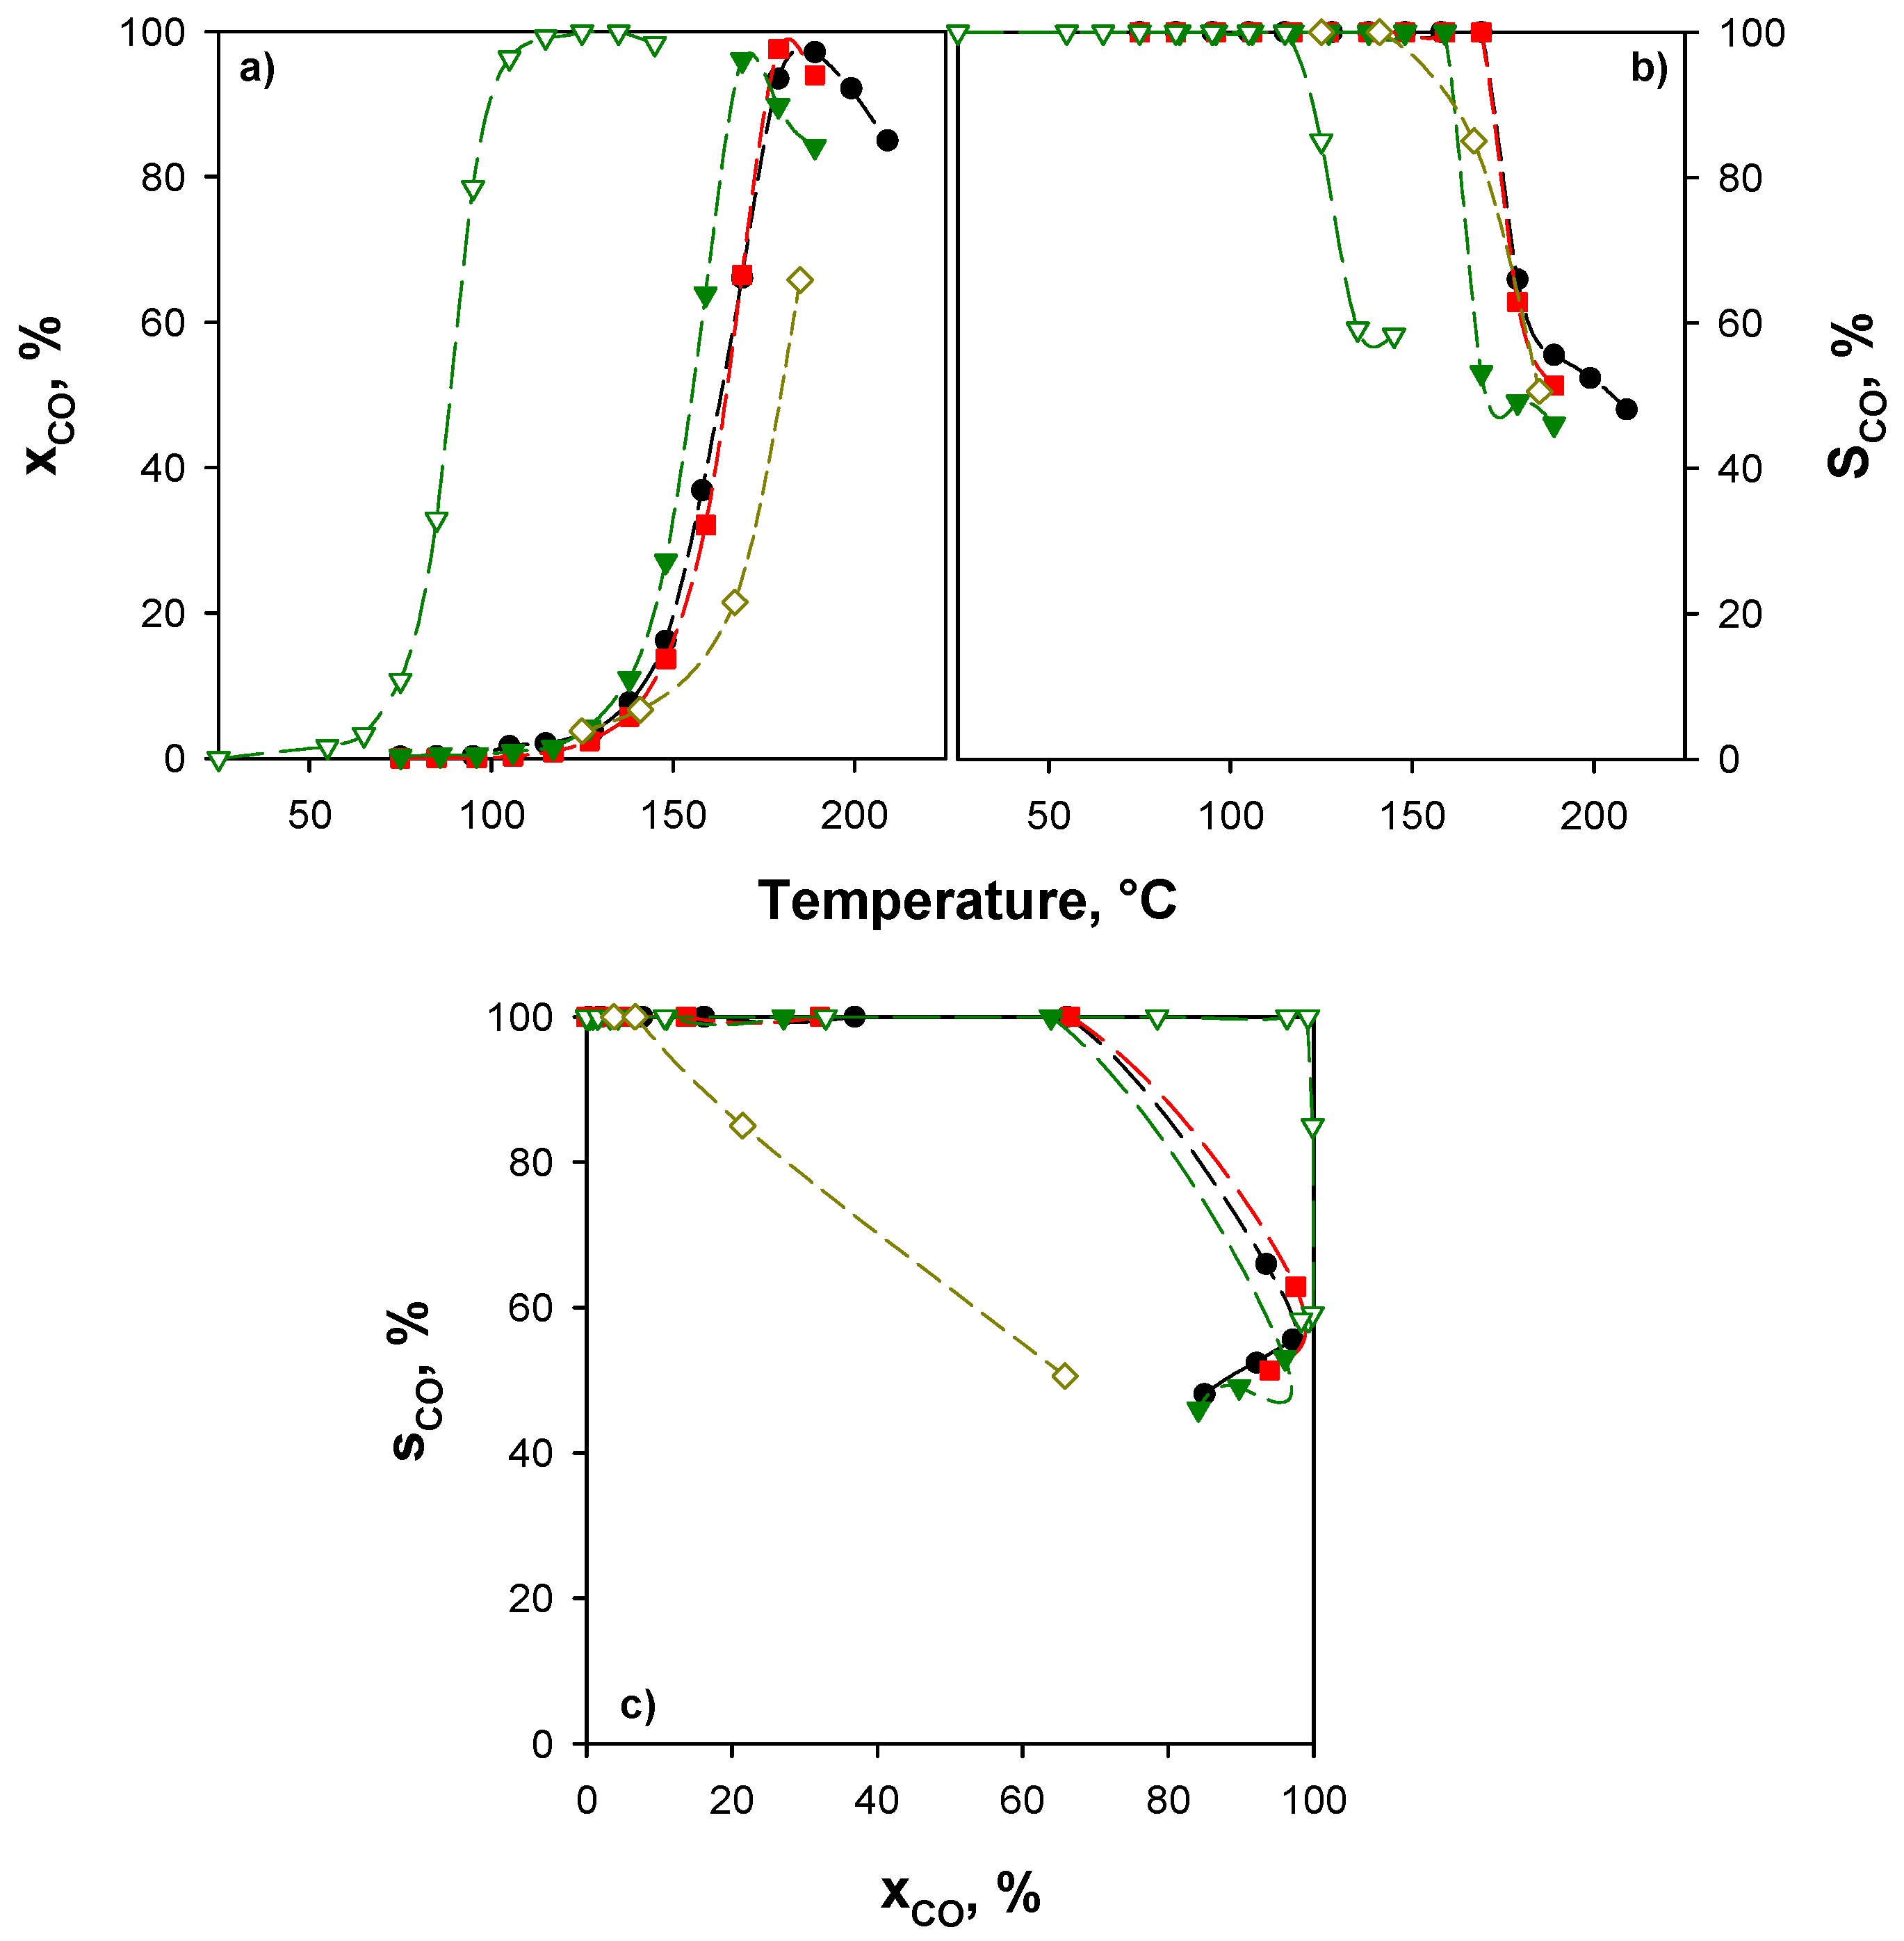
As a consequence, we hypothesized that under the conditions of tests of Figure 5, the catalytic bed is oversized and, consequently, tests were repeated under more stringent conditions, halving the contact time and reducing the oxygen concentration to 0.5 vol %. As shown in Figure 6a, under these conditions, CO conversion increases by increasing the copper content; conversion maxima are detected at about 130 °C for 4CuCe, at about 120 °C for 8CuCe, and at about 110 °C for 10CuCe, respectively. Selectivity decreases starting from about 100 °C. In Figure 6c, the selectivity-conversion plot is reported. Within the experimental error, the curves merge on a master curve, suggesting that under these reaction conditions, selectivity depends on the oxygen availability rather than on temperature. In the literature, several works report that CO oxidation sites are copper species strongly interacting with ceria, while H2 oxidation occurs on bulk (or bulk-like) copper oxide (see [21,68] and references therein, for instance). However, it has been demonstrated that the same sites can shift from CO oxidation to H2 oxidation depending on their oxidation state. In particular, while the redox cycle between Cu2+ and Cu+ is suggested for CO oxidation [19], the formation of metallic copper enhances H2 reactivity [7,20,51,66,69]. Accordingly, at lower oxygen concentrations and high CO conversion degrees, metallic copper can be formed onto xCuCe catalysts activating H2 rather than CO.
In the Figure 6a–c the performance of the 10CuCe sample at higher contact time and higher O2 concentration is reported as a reference. Unlike 4CuCe and 8CuCe, for this catalyst, conversion curves at the two different contact times are still very close, suggesting that the higher amount of copper sites active for CO oxidation, verified through TPR analysis, is also too much for a contact time of 0.027 (g·s)·cm−3 and a low O2 concentration. Therefore, for this catalyst, even more severe conditions could be operated. As reported in Figure 6c, on 10CuCe, highest selectivity can be obtained at lower contact time and oxygen partial pressure. This counterintuitive evidence can be also explained by the formation of metallic copper at high CO conversion and low O2 feed concentration: higher is the oxygen concentration in the gas phase, lower is the probability of metallic copper formation, and higher is the selectivity towards CO oxidation.
On the basis of these considerations, with respect to the comparison with the results presented in the literature (Table 3), the performance reported in Figure 6 makes the catalysts studied in this work among the most active ones investigated till now.
As mentioned before, more severe conditions can also be obtained from feeding inhibiting molecules as CO2 and/or H2O, which are generally present in the reforming-WGS stream [16,71,72,73]. Figure 7 shows the effect of H2O and CO2 on the catalytic activity of xCuCe samples. The experimental conditions are those of Figure 5 (τ = 0.054 g·s·cm−3; CO/H2/O2/ = 0.5/50/0.9) with the addition of 10 vol % H2O and 25 vol % CO2.
As expected, in the presence of CO2 and H2O, CO conversion and selectivity curves (Figure 7a,b) shift to higher temperatures due to the inhibiting effect of these compounds. In contrast with the results of Figure 5 and in agreement with those reported in Figure 6, the three samples show different activity and selectivity, 10CuCe showing again the best performance. The s-x plot (Figure 7c) shows that selectivity is mainly dependent on the CO conversion, with a slight additional dependence on the temperature for the 10CuCe catalyst. This could be related to the bulk-like CuO fraction detected on this sample (see Section 2.1), active towards H2 oxidation at high temperatures. In Figure 7, the catalytic performance of a catalyst with the same copper content and prepared by impregnation on commercial ceria (4% CuO/CeO2 in Figure 7) is also reported for comparison purposes. These unpublished data were obtained under the same reaction conditions, except for the CO2 concentration, equal to 15 vol % instead of 25 vol %. As clearly shown in Figure 7, despite of the higher CO2 concentration in the gas feed, xCuCe samples outperform, confirming the good resistance of the catalysts prepared on nanometric ceria towards the inhibiting effect of CO2 and H2O, as reported for structured systems [54]. Active sites for CO oxidation are considered those mostly affected by CO2 inhibition at T < 160 °C [21]. Thus, as expected, a strong difference between CO conversion in the absence and in the presence of CO2 is observed for 10CuCe catalyst since 100% CO conversion is achieved at temperature well below 160 °C without CO2. Twenty-five percent CO2 concentration in the feed saturates all CO conversion sites, although abundant in this catalyst, at T < 160 °C. Only when the temperature exceeds this limit value the high performance of this catalyst becomes evident.
2.3. Relevance of Mass Transfer Resistance in the Catalytic Tests
In order to calculate the controlling regime as function of temperature, we performed calculations of the inter and intraparticle mass transfer diffusion resistances. Details are reported in the Appendix A.
To this end we assumed a pseudo-first order kinetics. To verify the role of the interparticle diffusion resistances, we calculated the mass transfer coefficient with the correlations of Satterfield and Sherwood [74] between the Sherwood, the Schmidt, and the Reynolds numbers, assuming a pseudo-first order kinetic of CO oxidation.
We found that in the whole range of temperatures investigated, external mass transport is not the limiting step.
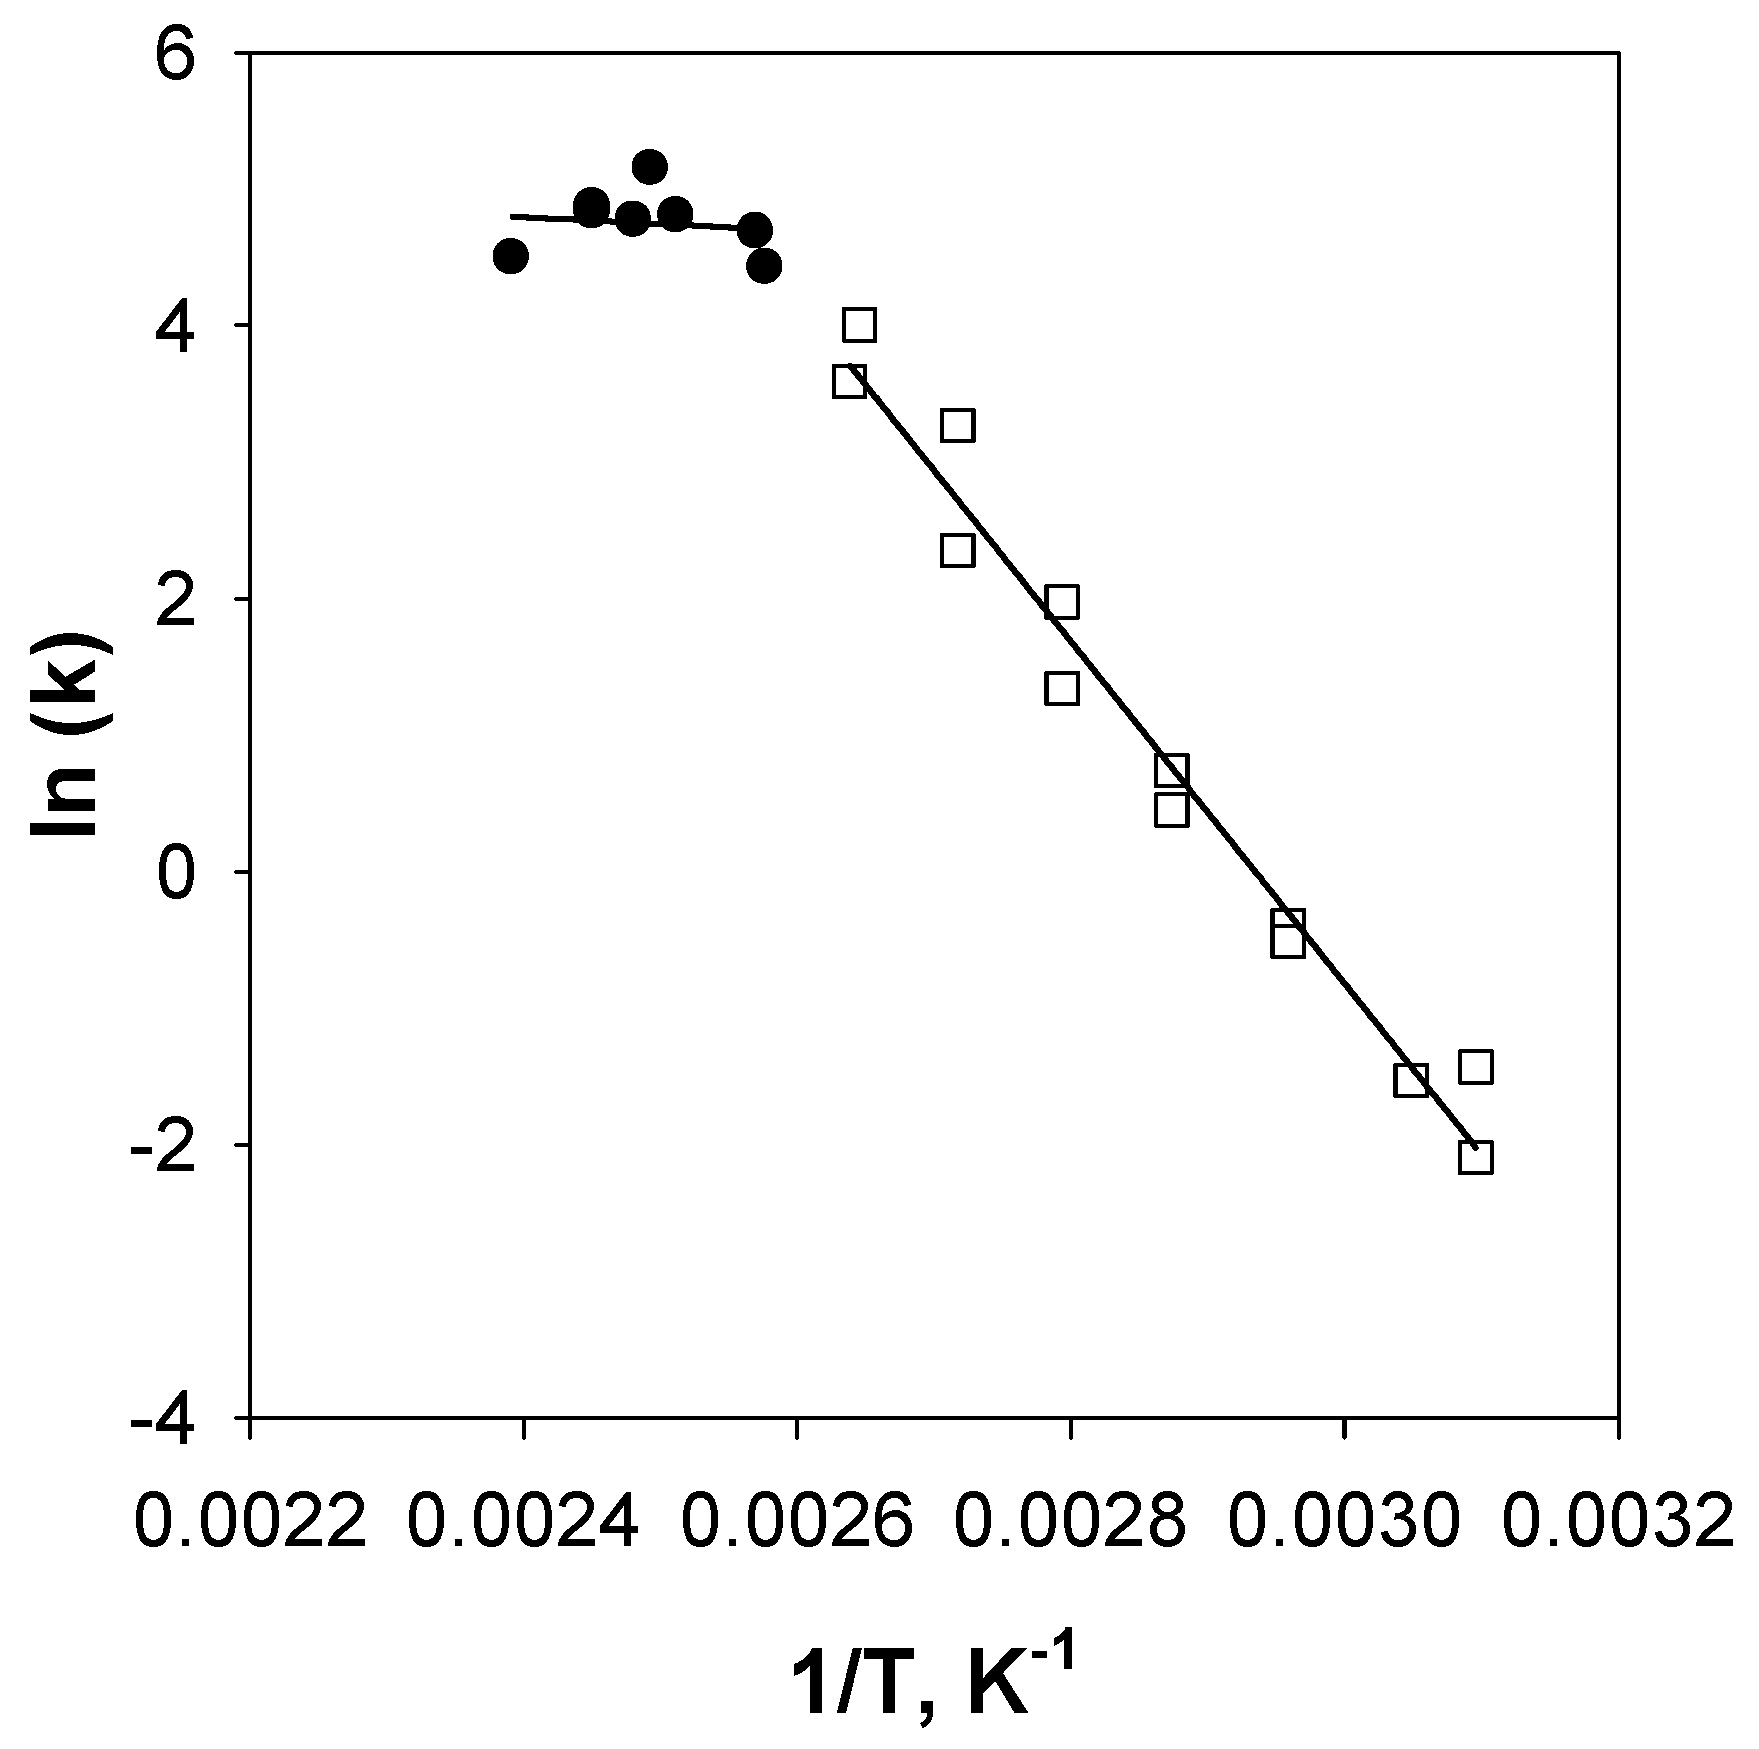
To evaluate the intraparticle diffusion resistances, we used the Prater criteria, calculating the Thiele modulus (Φ). We found that for all samples at temperatures lower than 116 °C, the reaction rate is controlled by intrinsic kinetics, while at higher temperatures a mixed regime applied, in which both intrinsic kinetics and intraparticle diffusion are controlling.
In summary, at low temperatures (<116 °C) and low CO conversion degree, the intrinsic kinetics is controlling, while at high temperatures (>116 °C) and high CO conversion, CO reaction rate is controlled also by the diffusion in the particle pores.
As a consequence, the existence of a “master curve” of CO conversion as a function of the Cu content cannot be assigned to the mass transfer limitations, but it has to be related to the catalytic reaction mechanism.
3. Discussion
The results reported in the previous section suggest more considerations than expected.
The main goal of this work, i.e., significantly improving the catalytic performance of copper/ceria catalysts thus reducing the catalytic bed volume, was successfully achieved. It was shown that commercial nanometric ceria with a high surface area can accept a larger amount of highly dispersed Cu sites, active towards CO oxidation compared to conventional CeO2, up to loads that for conventional supports involve the addition of unselective copper sites, active for H2 oxidation. This was attained using the simplest preparation technique, i.e., the wet impregnation. As highlighted in the Table 3, 10CuCe shows very high activity, higher than those reported in recent work on nano-shaped (nanosheets, nanorods, nanocubes) CuO/CeO2 catalysts [65,66,67]. The high activity can be related to the larger amount of highly dispersed copper sites in strong interaction with ceria, as evidenced by the characterization techniques. This suggests that large surface areas and improved copper–ceria interaction affect the catalytic performance more than the shape of ceria nanoparticles.
In order to underline the effect of the strongly enhanced copper dispersion, in Table 4, kinetic constants evaluated at 95 °C at the two different contact times for xCuCe catalysts of the present work were compared with those evaluated at 100 °C according to a first-order kinetics.
In both cases the temperature chosen for calculations ensures a well measurable CO conversion at 100% selectivity.
For similar contact times (0.027 g∙s∙cm−3 vs. 0.03 g∙s∙cm−3), the catalysts reported in the present study give a kinetic constant higher than that of CuCe samples reported in [52], despite of a slightly lower operating temperature. Moreover, k increases with copper load whereas a plateau value was reached for CuO load ≥4% for the reference catalysts, clearly suggesting that the additional copper does not or weakly contributes to CO oxidation. On the other hand, nanometric ceria has a high capacity to accept and disperse copper generating copper sites active for CO oxidation up to very high loads.
k values estimated at τ = 0.054 g∙s∙cm−3, all around 30, are an evident indication that only a fraction of copper sites is actually working under this condition, the exceeding fraction, increasing with the Cu load, being not involved in the reaction due to an extra catalytic bed.
In the same Table, the calculated TOF is also reported for all catalysts and conditions. As expected, for the reference catalysts, TOF decreases with increasing Cu load due to the increasing fraction of inactive copper. This finding is in agreement with the behaviors of other catalysts reported in the literature. For instance, Wang et al. [61] showed a significant improvement of the catalytic activity by increasing the Cu content from 2 to 5 wt %, while a further increase to 10 wt % showed a lower effect. Jampa et al. [46] and Gu et al. [33] reported the catalytic performance of CuO/CeO2 catalysts with different copper contents. Even if the difference among the performance of the samples is measurable, the effect of the copper load is marginal for the best catalysts. Similarly, Du et al. [64] detected an improvement of the catalytic performance only at low copper content, with further increase of the Cu load not providing higher conversion (a poor effect on the selectivity was detectable). Nevertheless, a surprisingly opposite trend was observed for xCuCe catalysts at similar contact time, suggesting that additional and even more active copper sites are dispersed on nanometric ceria at higher copper loads. At the greater contact time, the higher TOF value associated to 4CuCe indicates the good exploitation of active sites for 4CuCe. It is worth noting that 8CuCe shows constant k and TOF values, as expected, while they increase on 4CuCe and decrease on 10CuCe. So, the reaction mechanism on 8CuCe (whose copper content corresponds to about the monolayer) is unchanged by changing the contact time, while the significant variation of TOF values for the other xCuCe samples and the concomitant merge of kinetic constants by simply increasing the contact time suggest that the reaction rate could not be dependent only on the copper content (and dispersion). Data reported in this paper cannot fully explain this behavior and further investigations are needed.
In addition to these results, which could have an impact from the practical point of view, another unexpected conclusion can be drawn. The overlap of CO conversion curves as a function of temperature into a master curve, found for 10CuCe at two different contact times and at the highest contact time for all xCuCe catalysts, suggests that something not depending on the copper load limits the maximum CO conversion, as stated above. This finding was not previously reported. The investigation on the reaction mechanism is beyond the scope of this work. Nevertheless, some explanations can be attempted. Bueno-Lopez and co-workers [19] reported that the number of copper sites affects the catalytic activity at temperatures above that corresponding to main CO2 desorption, which is in turn the limiting kinetic step at low temperatures. In agreement with these authors, we demonstrated that CO oxidation sites, desorbing CO2 at temperature below 160 °C on samples prepared with conventional ceria, are related to ceria sites modified by copper [21]. TPR analysis carried out in this work confirmed that the nature of copper is mostly that of highly dispersed sites, even for high loads which, on the contrary, for conventional ceria are associated to the formation of a fraction of unselective copper oxide.
As a consequence, when the number of active sites is equal to or even exceeds that necessary to oxidize CO, the reaction is limited by CO2 desorption from ceria sites in the neighborhood of copper centers. CO2 inhibition is significant at T < 160 °C [21], a range including a large part of the operative window for xCuCe catalysts supported on nanometric CeO2.
These results suggest also a new approach for the design and the development of more active CO-PROX catalysts. In addition to large surface areas, high copper loadings and copper dispersion (i.e., a large number of Cu sites in strong interaction with ceria per unit volume), it is demanding the optimization of the CO2 desorption step.
4. Materials and Methods
4.1. Catalyst Preparation
CuO/CeO2 catalysts with different CuO content were prepared via wet impregnation. A colloidal ceria suspension (Nyacol Nano Technologies Inc., Ashland, MA, USA, particles size <20 nm) was dried at 120 °C overnight in order to obtain the nanometric support. The so-obtained fine powder was impregnated with a proper amount of copper acetate monohydrate (Sigma-Aldrich, St. Louis, MO, USA) in a rotary evaporator at 50 °C, 90 mbar, and 120 rpm, dried overnight at 120 °C, and then calcined in air at 450 °C for 2 h.
4.2. Catalytic Tests
The lab-scale set-up used for CO-PROX experiments was described elsewhere [21]. The powder catalyst with 180–300 μm particle size was placed in a tubular Pyrex reactor. Temperature was controlled with an electric tubular furnace (Lenton, Hope Valley, UK). The gaseous feed (0.5 vol % CO, 50 vol % H2 and 0.9 vol % O2 (N2 as balance)) and products were monitored with a Fisher-Rosemount NGA2000 continuous analyzer (Saint Louis, MO, USA).
Catalytic tests were conducted at different contact times, defined as the (catalyst weight)/(flow rate) ratio, by changing the total flow rate. Reaction temperature ranged from RT to 160 °C to explore the whole temperature range of interest for CO-PROX. Mass balance was always closed within ±4%. CO conversion and selectivity of oxygen reacting with carbon monoxide were calculated according to the following equations:
where xCO and sCO are the CO conversion and the O2 selectivity to CO2, while ΔO2CO and ΔO2H2 are the oxygen moles consumed for CO and H2 oxidation, respectively.
4.3. Catalyst Characterization
The actual metal content was determined by ICP-MS analysis using an Agilent 7500CE instrument (Santa Clara, CA, USA). BET surface areas (SSA) of supports and catalysts were measured by N2 adsorption at 77 K with a Quantachrome Autosorb-1C instrument (Boynton Beach, FL, USA) after degassing the samples at 150 °C for 1.5 h. The catalysts morphology was observed using a FEI Inspect Scanning Electron Microscope (SEM, Hillsboro, OR, USA) equipped with an energy dispersive X-ray (EDX) probe for the elemental mapping.
Temperature programmed reduction (TPR) analysis was carried out in a quartz-fixed bed reactor using mixtures of 2 vol % H2 in N2 with a total flow rate of 18 l(STP)/h, loading a 0.3 g sample with a particle dimension of 180–300 μm pretreated 1h under airflow at 450 °C. In all TPR tests, the reactor was heated at 10 °C/min up to 450 °C, maintaining the final temperature for 1 h. Hydrogen uptake was monitored using the same analysis system used for catalytic tests. TPR experiments were repeated three times for each sample in order to obtain reproducible profiles (the second and the third profile) after stabilization of copper centers upon the first TPR cycle. After each TPR cycle, the sample was treated under air as described above.
CO2-TPD tests were carried out by using a Micromeritics Autochem II 2020 equipped with a TC detector (Norcross, GA, USA). The samples (≈150 mg) were pretreated in synthetic air for 15 min at 450 °C, then saturated with 1 vol % CO2/N2 mixture for 1 h at 30 °C and washed in nitrogen for 0.5 h. The reactor was then heated at 10 °C/min up to 450 °C.
5. Conclusions
In this work, a nanometric ceria with large surface area was used as support for copper-based catalysts applied in the preferential oxidation of carbon monoxide in H2-rich streams. A large amount of dispersed copper sites strongly interacting with the support can be obtained by wet impregnation, providing high CO conversion and selectivity at low temperatures, as evidenced by the characterization techniques. The catalysts rank among the best catalysts proposed in the literature obtained through more complex preparation techniques leading to a significant reduction of catalytic bed volume.
The catalyst with 10 wt % CuO showed the highest performance in terms of conversion and selectivity, also showing a better resistance to the inhibiting effect of carbon dioxide and water vapor. Calculations of reaction rates and TOFs confirmed the high intrinsic activity of the catalysts.
CO conversion curves as a function of the temperature of the 10CuCe catalyst overlapped for the two different contact times explored and at the highest contact time for all xCuCe catalysts. This unexpected result suggests that the limiting step is not dependent on the copper sites once diffusional limitations were ruled out. According to literature results, we hypothesized that CO2 desorption from ceria sites in the neighborhood of copper centers controls the reaction rate.
From the obtained results, a novel approach for the design and the development of active CO-PROX catalysts is proposed which is based on the optimization not only of surface areas, copper loadings, and copper dispersion (i.e., a large number of Cu sites in strong interaction with ceria per unit volume), but also CO2 desorption features of the support at low temperatures.
Author Contributions
Authors equally contributed to the conception, the design and the analysis of the experimental activity and to the writing of the paper.
Acknowledgments
The present work has not been financially supported.
Conflicts of Interest
The authors declare no conflict of interest.
Appendix A
The evaluation of the controlling regime was performed at all temperatures investigated.
The kinetic constant has been evaluated assuming a first order reaction of CO oxidation:
where xCO is the CO conversion degree, k is the kinetic constant.
In Figure A1, the kinetic constant is plotted versus temperature (ln(k) vs. 1/T). It is possible to observe that at a temperature equal to about 165 °C, the slope of the curve changes, suggesting that the controlling regime is changed. From these data, the kinetic parameters have been evaluated.
Figure A1.
Kinetic constant as function of temperature, 4CuCe sample. CO = 5000 ppm, O2 = 0.5 vol % and H2 = 50 vol %.
Figure A1.
Kinetic constant as function of temperature, 4CuCe sample. CO = 5000 ppm, O2 = 0.5 vol % and H2 = 50 vol %.

Appendix A1. Interparticle Diffusion
In the hypothesis of first order reaction, the interparticle diffusion resistances are negligible if
where km is the mass transport coefficient and av is the specific external surface of the particle assumed equal to 400 cm−1, considering that for spherical particles, it is equal to 6/dp where dp (150 μm) is the particle size.
The mass transport coefficient has been estimated by using the Satterfield and Sherwood correlation [74]:
where:
where Sc is the Schmidt number, S is the area of the annular section of the lab reactor (0.67 cm2), ε is the reactor porosity (0.37), ρ is the gas density (0.428 kg/m3), and μ is the gas viscosity (0.02 cp).
The diffusivity of the carbon monoxide in N2, DCO-N2, in the Sc number has been estimated by using the formula of Satterfield and Sherwood [74]:
where T is the temperature (K), P the pressure (atm), MCO and MN2 are the molecular weights of CO and N2, respectively, and ΩD, the collision integral. We found DCO-N2 = 0.38 cm2·s−1. We found that in the whole range of temperatures, the control is kinetic.

Table A1.
k/(km∙av), Thiele module and efficiency for xCuCe samples at different contact times and temperatures.
Table A1.
k/(km∙av), Thiele module and efficiency for xCuCe samples at different contact times and temperatures.
| SAMPLE | τ g∙s∙cm−3 | T °C | k/(km∙av) | Φ | η |
|---|---|---|---|---|---|
| 4CuCe | 0.027 | 120 | 0.00012 | 0.28 | 0.98 |
| 0.040 | 0.005 | 0.27 | 0.98 | ||
| 0.027 | 90 | 0.00011 | 0.09 | 0.99 | |
| 0.040 | 0.0004 | 0.028 | 0.99 | ||
| 8CuCe | 0.027 | 120 | 0.005 | 0.44 | 0.97 |
| 0.054 | 0.006 | 0.34 | 0.985 | ||
| 0.027 | 90 | 0.0002 | 0.023 | 0.99 | |
| 0.054 | 0.000045 | 0.03 | 0.99 | ||
| 10CuCe | 0.027 | 120 | 0.008 | 0.7 | 0.95 |
| 0.054 | 0.0078 | 0.43 | 0.97 | ||
| 0.027 | 90 | 0.01 | 0.07 | 0.99 | |
| 0.054 | 0.03 | 0.03 | 0.98 |
Appendix A2. Intraparticle Diffusion
In order to estimate the role of intraparticle diffusion resistances, we used the Prater criteria, calculating ϕ:
where at Φ < 0.3, the diffusion inside the pores resistances are negligible.
At Φ ≈ 0.3, a mixed regime applies.
We also computed the effectiveness factor (η) through the Thiele module (Φ) calculation:
where Deff (cm2·s−1) is the effective diffusivity of CO in N2 and is equal to D∙ε/τ (ε and τ are the particle porosity and tortuosity, respectively).
Effectiveness may be calculated as function of the Thiele number:
Depending on the value of η, the controlling step may be identified:
at η = 1, diffusion inside the pore is not controlling;
at 0.97 < η < 0.95, a mixing regime applies.
In Table A1, the results are given for all the samples at two values of the contact times (0.054 and 0.027 g s/mL) and temperatures (90 and 120 °C).
From the results of Table A1, it may be concluded that at a high temperature (120 °C) reaction, over 10% and 8% samples occur in a mixed regime, while in the case of the 4% sample, a transition to a purely kinetic controlled regime occurs.
References
- Trimm, D.L.; Önsan, Z.I. Onboard Fuel Conversion for Hydrogen-Fuel-Cell-Driven Vehicles. Catal. Rev. Sci. Eng. 2001, 43, 31–84. [Google Scholar] [CrossRef]
- Zhao, Z.; Lin, X.; Jin, R.; Dai, Y.; Wang, G. High catalytic activity in CO PROX reaction of low cobalt-oxide loading catalysts supported on nano-particulate CeO2-ZrO2 oxides. Catal. Commun. 2011, 12, 1448–1451. [Google Scholar] [CrossRef]
- López, I.; Valdés-Solís, T.; Marbán, G. An attempt to rank copper-based catalysts used in the CO-PROX reaction. Int. J. Hydrogen Energy 2008, 33, 197–205. [Google Scholar] [CrossRef]
- Sedmak, G.; Hočevar, S.; Levec, J. Kinetics of selective CO oxidation in excess of H2 over the nanostructured Cu0.1Ce0.9O2−y catalyst. J. Catal. 2003, 213, 135–150. [Google Scholar] [CrossRef]
- Caputo, T.; Lisi, L.; Pirone, R.; Russo, G.; Ii, F. Kinetics of the Preferential Oxidation of CO over CuO/CeO2 Catalysts in H2-Rich. Ind. Eng. Chem. Res. 2007, 46, 6793–6800. [Google Scholar] [CrossRef]
- Martínez-Arias, A.; Hungría, A.B.; Fernández-García, M.; Conesa, J.C.; Munuera, G. Preferential oxidation of CO in a H2-rich stream over CuO/CeO2 and CuO/(Ce,M)Ox (M = Zr, Tb) catalysts. J. Power Sources 2005, 151, 32–42. [Google Scholar] [CrossRef]
- Martínez-Arias, A.; Hungría, A.B.; Munuera, G.; Gamarra, D. Preferential oxidation of CO in rich H2 over CuO/CeO2: Details of selectivity and deactivation under the reactant stream. Appl. Catal. B Environ. 2006, 65, 207–216. [Google Scholar] [CrossRef]
- Arango-Díaz, A.; Cecilia, J.A.; Moretti, E.; Talon, A.; Núñez, P.; Marrero-Jerez, J.; Jiménez-Jiménez, J.; Jiménez-López, A.; Rodríguez-Castellón, E. Comparative study of CuO supported on CeO2, Ce0.8Zr0.2O2 and Ce0.8Al0.2O2 based catalysts in the CO-PROX reaction. Int. J. Hydrogen Energy 2014, 39, 4102–4108. [Google Scholar] [CrossRef] [Green Version]
- Avgouropoulos, G.; Ioannides, T.; Matralis, H. Influence of the preparation method on the performance of CuO-CeO2 catalysts for the selective oxidation of CO. Appl. Catal. B Environ. 2005, 56, 87–93. [Google Scholar] [CrossRef]
- Reddy, L.H.; Reddy, G.K.; Devaiah, D.; Reddy, B.M. A rapid microwave-assisted solution combustion synthesis of CuO promoted CeO2-MxOy (M = Zr, La, Pr and Sm) catalysts for CO oxidation. Appl. Catal. A Gen. 2012, 445–446, 297–305. [Google Scholar] [CrossRef]
- Avgouropoulos, G.; Ioannides, T. Selective CO oxidation over CuO-CeO2 catalysts prepared via the ureanitrate combustion method. Appl. Catal. A Gen. 2003, 244, 155–167. [Google Scholar] [CrossRef]
- Gurbani, A.; Ayastuy, J.L.; González-Marcos, M.P.; Gutiérrez-Ortiz, M.A. CuO-CeO2 catalysts synthesized by various methods: Comparative study of redox properties. Int. J. Hydrogen Energy 2010, 35, 11582–11590. [Google Scholar] [CrossRef]
- Marban, G.; Fuertes, A.B. Highly active and selective CuOx/CeO2 catalyst prepared by a single-step citrate method for preferential oxidation of carbon monoxide. Appl. Catal. B Environ. 2005, 57, 43–53. [Google Scholar] [CrossRef]
- Hu, T.; Yang, J.; Zhao, J.; Wang, D.; Song, H.; Chou, L. Preparation of a Cu-Ce-O catalyst by urea combustion for removing CO from hydrogen. Chin. J. Catal. 2007, 28, 844–846. [Google Scholar] [CrossRef]
- Barbato, P.S.; Colussi, S.; Di Benedetto, A.; Landi, G.; Lisi, L.; Llorca, J.; Trovarelli, A. Origin of High Activity and Selectivity of CuO/CeO2 Catalysts Prepared by Solution Combustion Synthesis in CO-PROX Reaction. J. Phys. Chem. C 2016, 120, 13039–13048. [Google Scholar] [CrossRef]
- Landi, G.; Di Benedetto, A.; Colussi, S.; Barbato, P.S.; Lisi, L. Effect of carbon dioxide and water on the performances of an iron-promoted copper/ceria catalyst for CO preferential oxidation in H2-rich streams. Int. J. Hydrogen Energy 2016, 41, 7332–7341. [Google Scholar] [CrossRef]
- Barbato, P.S.; Colussi, S.; Di Benedetto, A.; Landi, G.; Lisi, L.; Llorca, J.; Trovarelli, A. CO preferential oxidation under H2-rich streams on copper oxide supported on Fe promoted CeO2. Appl. Catal. A Gen. 2015, 506, 268–277. [Google Scholar] [CrossRef]
- Wang, J.; Deng, L.; He, D.; Lu, J.; He, S.; He, S.; Luo, Y. A facile and rapid route to synthesize CuOx/Ce0.8Zr0.2O2 catalysts with high performance for CO preferential oxidation (CO-PROX). Int. J. Hydrogen Energy 2015, 40, 12478–12488. [Google Scholar] [CrossRef]
- Davó-Quiñonero, A.; Navlani-García, M.; Lozano-Castelló, D.; Bueno-López, A.; Anderson, J.A. Role of Hydroxyl Groups in the Preferential Oxidation of CO over Copper Oxide-Cerium Oxide Catalysts. ACS Catal. 2016, 6, 1723–1731. [Google Scholar] [CrossRef] [Green Version]
- Lee, H.C.; Kim, D.H. Kinetics of CO and H2 oxidation over CuO-CeO2 catalyst in H2 mixtures with CO2 and H2O. Catal. Today 2008, 132, 109–116. [Google Scholar] [CrossRef]
- Di Benedetto, A.; Landi, G.; Lisi, L.; Russo, G. Role of CO2 on CO preferential oxidation over CuO/CeO2 catalyst. Appl. Catal. B Environ. 2013, 142–143, 169–177. [Google Scholar] [CrossRef]
- Wang, J.B.; Lin, S.C.; Huang, T.J. Selective CO oxidation in rich hydrogen over CuO/samaria-doped ceria. Appl. Catal. A Gen. 2002, 232, 107–120. [Google Scholar] [CrossRef]
- Kotobuki, M.; Watanabe, A.; Uchida, H.; Yamashita, H.; Watanabe, M. Reaction mechanism of preferential oxidation of carbon monoxide on Pt, Fe, and Pt-Fe/mordenite catalysts. J. Catal. 2005, 236, 262–269. [Google Scholar] [CrossRef]
- Korotkikh, O.; Farrauto, R. Selective catalytic oxidation of CO in H2: Fuel cell applications. Catal. Today 2000, 62, 249–254. [Google Scholar] [CrossRef]
- Landon, P.; Ferguson, J.; Solsona, B.E.; Garcia, T.; Carley, A.F.; Herzing, A.A.; Kiely, C.J.; Golunski, S.E.; Hutchings, G.J. Selective oxidation of CO in the presence of H2, H2O and CO2 via gold for use in fuel cells. Chem. Commun. 2005, 3385. [Google Scholar] [CrossRef] [PubMed]
- Scirè, S.; Crisafulli, C.; Minicò, S.; Condorelli, G.G.; Di Mauro, A. Selective oxidation of CO in H2-rich stream over gold/iron oxide: An insight on the effect of catalyst pretreatment. J. Mol. Catal. A Chem. 2008, 284, 24–32. [Google Scholar] [CrossRef]
- Snytnikov, P.V.; Sobyanin, V.A.; Belyaev, V.D.; Tsyrulnikov, P.G.; Shitova, N.B.; Shlyapin, D.A. Selective oxidation of carbon monoxide in excess hydrogen over Pt-, Ru- and Pd-supported catalysts. Appl. Catal. A Gen. 2003, 239, 149–156. [Google Scholar] [CrossRef]
- Avgouropoulos, G.; Ioannides, T.; Papadopoulou, C.; Batista, J.; Hocevar, S.; Matralis, H.K. A comparative study of Pt/γ-Al2O3, Au/α-Fe2O3 and CuO-CeO2 catalysts for the selective oxidation of carbon monoxide in excess hydrogen. Catal. Today 2002, 75, 157–167. [Google Scholar] [CrossRef]
- Kim, D.H.; Lim, M.S. Kinetics of selective CO oxidation in hydrogen-rich mixtures on Pt/alumina catalysts. Appl. Catal. A Gen. 2002, 224, 27–38. [Google Scholar] [CrossRef]
- Kim, Y.H.; Park, E.D.; Lee, H.C.; Lee, D.; Lee, K.H. Preferential CO oxidation over supported noble metal catalysts. Catal. Today 2009, 146, 253–259. [Google Scholar] [CrossRef]
- Mariño, F.; Descorme, C.; Duprez, D. Noble metal catalysts for the preferential oxidation of carbon monoxide in the presence of hydrogen (PROX). Appl. Catal. B Environ. 2004, 54, 59–66. [Google Scholar] [CrossRef]
- Fonseca, J.D.S.L.; Ferreira, H.S.; Bion, N.; Pirault-Roy, L.; Rangel, M.D.C.; Duprez, D.; Epron, F. Cooperative effect between copper and gold on ceria for CO-PROX reaction. Catal. Today 2012, 180, 34–41. [Google Scholar] [CrossRef]
- Gu, D.; Jia, C.J.; Bongard, H.; Spliethoff, B.; Weidenthaler, C.; Schmidt, W.; Schüth, F. Ordered mesoporous Cu-Ce-O catalysts for CO preferential oxidation in H2-rich gases: Influence of copper content and pretreatment conditions. Appl. Catal. B Environ. 2014, 152–153, 11–18. [Google Scholar] [CrossRef]
- Moretti, E.; Lenarda, M.; Riello, P.; Storaro, L.; Talon, A.; Frattini, R.; Reyes-Carmona, A.; Jiménez-López, A.; Rodríguez-Castellón, E. Influence of synthesis parameters on the performance of CeO2-CuO and CeO2-ZrO2-CuO systems in the catalytic oxidation of CO in excess of hydrogen. Appl. Catal. B Environ. 2013, 129, 556–565. [Google Scholar] [CrossRef]
- Ayastuy, J.L.; Gurbani, a.; González-Marcos, M.P.; Gutiérrez-Ortiz, M.A. Selective CO oxidation in H2 streams on CuO/CexZr1−xO2 catalysts: Correlation between activity and low temperature reducibility. Int. J. Hydrogen Energy 2012, 37, 1993–2006. [Google Scholar] [CrossRef]
- Firsova, A.A.; Il’ichev, A.N.; Khomenko, T.I.; Gorobinskii, L.V.; Maksimov, Y.V.; Suzdalev, I.P.; Korchak, V.N. Selective oxidation of CO in the presence of hydrogen on CuO/CeO2 catalysts modified with Fe and Ni oxides. Kinet. Catal. 2007, 48, 282–291. [Google Scholar] [CrossRef]
- Sirichaiprasert, K.; Luengnaruemitchai, A.; Pongstabodee, S. Selective oxidation of CO to CO2 over Cu-Ce-Fe-O composite-oxide catalyst in hydrogen feed stream. Int. J. Hydrogen Energy 2007, 32, 915–926. [Google Scholar] [CrossRef]
- Ma, S.; Lu, G.; Shen, Y.; Guo, Y.; Wang, Y.; Guo, Y. Effect of Fe doping on the catalytic performance of CuO–CeO2 for low temperature CO oxidation. Catal. Sci. Technol. 2011, 1, 669. [Google Scholar] [CrossRef]
- Lendzion-Bielun, Z.; Bettahar, M.M.; Monteverdi, S. Fe-promoted CuO/CeO2 catalyst: Structural characterization and CO oxidation activity. Catal. Commun. 2010, 11, 1137–1142. [Google Scholar] [CrossRef]
- Zou, H.; Chen, S.; Liu, Z.; Lin, W. Selective CO oxidation over CuO-CeO2 catalysts doped with transition metal oxides. Powder Technol. 2011, 207, 238–244. [Google Scholar] [CrossRef]
- Ayastuy, J.L.; Fernández-Puertas, E.; González-Marcos, M.P.; Gutiérrez-Ortiz, M.A. Transition metal promoters in CuO/CeO2 catalysts for CO removal from hydrogen streams. Int. J. Hydrogen Energy 2012, 37, 7385–7397. [Google Scholar] [CrossRef]
- Iglesias-González, A.; Ayastuy, J.L.; González-Marcos, M.P.; Gutiérrez-Ortiz, M.A. CuO/CexSn1−xO2 catalysts with low tin content for CO removal from H2-rich streams. Int. J. Hydrogen Energy 2014, 39, 5213–5224. [Google Scholar] [CrossRef]
- Kydd, R.; Ferri, D.; Hug, P.; Scott, J.; Teoh, W.Y.; Amal, R. Temperature-induced evolution of reaction sites and mechanisms during preferential oxidation of CO. J. Catal. 2011, 277, 64–71. [Google Scholar] [CrossRef]
- Araújo, V.D.; Bellido, J.D.A.; Bernardi, M.I.B.; Assaf, J.M.; Assaf, E.M. CuO-CeO2 catalysts synthesized in one-step: Characterization and PROX performance. Int. J. Hydrogen Energy 2012, 37, 5498–5507. [Google Scholar] [CrossRef]
- Chuang, K.-H.; Shih, K.; Lu, C.-Y.; Wey, M.-Y. Copper catalysts prepared via microwave-heated polyol process for preferential oxidation of CO in H2-rich streams. Int. J. Hydrogen Energy 2013, 38, 100–108. [Google Scholar] [CrossRef]
- Jampa, S.; Wangkawee, K.; Tantisriyanurak, S.; Changpradit, J.; Jamieson, A.M.; Chaisuwan, T.; Luengnaruemitchai, A.; Wongkasemjit, S. High performance and stability of copper loading on mesoporous ceria catalyst for preferential oxidation of CO in presence of excess of hydrogen. Int. J. Hydrogen Energy 2017, 42, 5537–5548. [Google Scholar] [CrossRef]
- Meng, M.; Liu, Y.; Sun, Z.; Zhang, L.; Wang, X. Synthesis of highly-dispersed CuO-CeO2 catalyst through a chemisorption-hydrolysis route for CO preferential oxidation in H2-rich stream. Int. J. Hydrogen Energy 2012, 37, 14133–14142. [Google Scholar] [CrossRef]
- Maciel, C.G.; Belgacem, M.N.; Assaf, J.M. Performance of CuO-CeO2 Catalysts with Low Copper Content in CO Preferential Oxidation Reaction. Catal. Lett. 2011, 141, 316–321. [Google Scholar] [CrossRef]
- Moretti, E.; Storaro, L.; Talon, A.; Lenarda, M. One-pot mesoporous Al-Ce-Cu oxide systems as catalysts for the preferential carbon monoxide oxidation (CO-PROX). Catal. Commun. 2009, 10, 522–527. [Google Scholar] [CrossRef]
- Martínez-Arias, A.; Gamarra, D.; Fernández-García, M.; Hornés, A.; Bera, P.; Koppány, Z.; Schay, Z. Redox-catalytic correlations in oxidised copper-ceria CO-PROX catalysts. Catal. Today 2009, 143, 211–217. [Google Scholar] [CrossRef]
- Gamarra, D.; Munuera, G.; Hungría, A.B.; Fernández-García, M.; Conesa, J.C.; Midgley, P.A.; Wang, X.Q.; Hanson, J.C.; Rodríguez, J.A.; Martínez-Arias, A. Structure-activity relationship in nanostructured copper-ceria-based preferential CO oxidation catalysts. J. Phys. Chem. C 2007, 111, 11026–11038. [Google Scholar] [CrossRef]
- Caputo, T.; Lisi, L.; Pirone, R.; Russo, G. On the role of redox properties of CuO/CeO2 catalysts in the preferential oxidation of CO in H2-rich gases. Appl. Catal. A Gen. 2008, 348, 42–53. [Google Scholar] [CrossRef]
- Chung, L.-C.; Yeh, C.-T. Synthesis of highly active CuO-CeO2 nanocomposites for preferential oxidation of carbon monoxide at low temperatures. Catal. Commun. 2008, 9, 670–674. [Google Scholar] [CrossRef]
- Landi, G.; Barbato, P.S.; Di Benedetto, A.; Lisi, L. Optimization of the preparation method of CuO/CeO2 structured catalytic monolith for CO preferential oxidation in H2-rich streams. Appl. Catal. B Environ. 2016, 181, 727–737. [Google Scholar] [CrossRef]
- Barbato, P.S.; Di Benedetto, A.; Landi, G.; Lisi, L. Structuring CuO/CeO2 Catalyst as Option to Improve Performance Towards CO-PROX. Top. Catal. 2016, 59, 1371–1382. [Google Scholar] [CrossRef]
- Dudfield, C.D.; Chen, R.; Adcock, P.L. A carbon monoxide PROX reactor for PEM fuel cell automotive application. Int. J. Hydrogen Energy 2001, 26, 763–775. [Google Scholar] [CrossRef]
- Xu, D.; Cheng, F.; Lu, Q.; Dai, P. Microwave Enhanced Catalytic Degradation of Methyl Orange in Aqueous Solution over CuO/CeO2 Catalyst in the Absence and Presence of H2O2. Ind. Eng. Chem. Res. 2014, 53, 2625–2632. [Google Scholar] [CrossRef]
- Xu, J.F.; Ji, W.; Shen, Z.X.; Tang, S.H.; Ye, X.R.; Jia, D.Z.; Xin, X.Q. Preparation and Characterization of CuO Nanocrystals. J. Solid State Chem. 1999, 147, 516–519. [Google Scholar] [CrossRef]
- Zimmer, P.; Tschöpe, A.; Birringer, R. Temperature-programmed reaction spectroscopy of ceria- and Cu/ceria-supported oxide catalyst. J. Catal. 2002, 205, 339–345. [Google Scholar] [CrossRef]
- Boaro, M.; Vicario, M.; De Leitenburg, C.; Dolcetti, G.; Trovarelli, A. The use of temperature-programmed and dynamic/transient methods in catalysis: Characterization of ceria-based, model three-way catalysts. Catal. Today 2003, 77, 407–417. [Google Scholar] [CrossRef]
- Wang, W.-W.; Du, P.-P.; Zou, S.-H.; He, H.-Y.; Wang, R.-X.; Jin, Z.; Shi, S.; Huang, Y.-Y.; Si, R.; Song, Q.-S.; et al. Highly Dispersed Copper Oxide Clusters as Active Species in Copper-Ceria Catalyst for Preferential Oxidation of Carbon Monoxide. ACS Catal. 2015, 5, 2088–2099. [Google Scholar] [CrossRef]
- Kundakovic, L.; Flytzani-Stephanopoulos, M. Reduction characteristics of copper oxide in cerium and zirconium oxide systems. Appl. Catal. A Gen. 1998, 171, 13–29. [Google Scholar] [CrossRef]
- Cecilia, J.A.; Arango-Díaz, A.; Franco, F.; Jiménez-Jiménez, J.; Storaro, L.; Moretti, E.; Rodríguez-Castellón, E. CuO-CeO2 supported on montmorillonite-derived porous clay heterostructures (PCH) for preferential CO oxidation in H2-rich stream. Catal. Today 2015, 253, 126–136. [Google Scholar] [CrossRef]
- Barbato, P.S.; Di Benedetto, A.; Landi, G.; Lisi, L. CuO/CeO2 based monoliths for CO preferential oxidation in H2-rich streams. Chem. Eng. J. 2015, 279, 983–993. [Google Scholar] [CrossRef]
- Du, L.; Wang, W.; Yan, H.; Wang, X.; Jin, Z.; Song, Q.; Si, R.; Jia, C. Copper-ceria sheets catalysts: Effect of copper species on catalytic activity in CO oxidation reaction. J. Rare Earths 2017, 35, 1186–1196. [Google Scholar] [CrossRef]
- Guo, X.; Zhou, R. Identification of the nano/micro structure of CeO2(rod) and the essential role of interfacial copper-ceria interaction in CuCe(rod) for selective oxidation of CO in H2-rich streams. J. Power Sources 2017, 361, 39–53. [Google Scholar] [CrossRef]
- Gong, X.; Liu, B.; Kang, B.; Xu, G.; Wang, Q.; Jia, C.; Zhang, J. Boosting Cu-Ce interaction in CuxO/CeO2nanocube catalysts for enhanced catalytic performance of preferential oxidation of CO in H2-rich gases. Mol. Catal. 2017, 436, 90–99. [Google Scholar] [CrossRef]
- Di Benedetto, A.; Landi, G.; Lisi, L. CO reactive adsorption at low temperature over CuO/CeO2 structured catalytic monolith. Int. J. Hydrogen Energy 2017, 42, 12262–12275. [Google Scholar] [CrossRef]
- Gamarra, D.; Belver, C.; Fernández-García, M.; Martínez-Arias, A. Selective CO oxidation in excess H2 over copper-ceria catalysts: Identification of active entities/species. J. Am. Chem. Soc. 2007, 129, 12064–12065. [Google Scholar] [CrossRef] [PubMed]
- Zhu, C.; Ding, T.; Gao, W.; Ma, K.; Tian, Y.; Li, X. CuO/CeO2 catalysts synthesized from Ce-UiO-66 metal-organic framework for preferential CO oxidation. Int. J. Hydrogen Energy 2017, 42, 17457–17465. [Google Scholar] [CrossRef]
- Gamarra, D.; Martínez-Arias, A. Preferential oxidation of CO in rich H2over CuO/CeO2: Operando-DRIFTS analysis of deactivating effect of CO2 and H2O. J. Catal. 2009, 263, 189–195. [Google Scholar] [CrossRef]
- Park, J.W.; Jeong, J.H.; Yoon, W.L.; Rhee, Y.W. Selective oxidation of carbon monoxide in hydrogen-rich stream over Cu-Ce/γ-Al2O3 catalysts promoted with cobalt in a fuel processor for proton exchange membrane fuel cells. J. Power Sources 2004, 132, 18–28. [Google Scholar] [CrossRef]
- Mariño, F.; Descorme, C.; Duprez, D. Supported base metal catalysts for the preferential oxidation of carbon monoxide in the presence of excess hydrogen (PROX). Appl. Catal. B Environ. 2005, 58, 175–183. [Google Scholar] [CrossRef]
- Satterfield, C.N.; Sherwood, T.K. The Role of Diffusion in Catalysis; Addison-Wesley Pub. Co.: Boston, MA, USA, 1963. [Google Scholar]
Figure 1.
XRD patterns of xCuCe samples. Peak positions corresponding to fluorite (▼) and tenorite (■) structure.
Figure 1.
XRD patterns of xCuCe samples. Peak positions corresponding to fluorite (▼) and tenorite (■) structure.

Figure 2.
SEM images of xCuCe samples (3000× magnification) and corresponding EDS maps for Cu and Ce.
Figure 2.
SEM images of xCuCe samples (3000× magnification) and corresponding EDS maps for Cu and Ce.

Figure 3.
H2-TPR profiles of xCuCe samples (profile of 4% CuO/CeO2 from [52]; profile of S5-M from [54]).

Figure 4.
CO2-TPD profiles of xCuCe samples (profile of nanometric CeO2 support as reference).

Figure 5.
CO conversions (a) and selectivities (b) as a function of the temperature for the xCuCe catalysts. τ = 0.054 g·s·cm−3; CO/H2/O2/N2 = 0.5/50/0.9/balance. Symbols: ● 4CuCe; ![Catalysts 08 00209 i001]() 8CuCe;
8CuCe; ![Catalysts 08 00209 i002]() 10CuCe;
10CuCe; ![Catalysts 08 00209 i003]() 4%CuO/CeO2 [15].
4%CuO/CeO2 [15].
 8CuCe;
  10CuCe;
  4%CuO/CeO2 [15].
Figure 5.
CO conversions (a) and selectivities (b) as a function of the temperature for the xCuCe catalysts. τ = 0.054 g·s·cm−3; CO/H2/O2/N2 = 0.5/50/0.9/balance. Symbols: ● 4CuCe; ![Catalysts 08 00209 i001]() 8CuCe;
8CuCe; ![Catalysts 08 00209 i002]() 10CuCe;
10CuCe; ![Catalysts 08 00209 i003]() 4%CuO/CeO2 [15].
4%CuO/CeO2 [15].
8CuCe; 10CuCe; 4%CuO/CeO2 [15].
Figure 6.
CO conversions (a) and selectivities (b) as a function of the temperature and selectivities as a function of the conversions (c) for the xCuCe catalysts. τ = 0.027 g·s·cm−3; CO/H2/O2/N2 = 0.5/50/0.5/balance. Symbols: ● 4CuCe; ![Catalysts 08 00209 i001]() 8CuCe;
8CuCe; ![Catalysts 08 00209 i002]() 10CuCe;
10CuCe; ![Catalysts 08 00209 i004]() 10CuCe at τ = 0.054 g·s·cm−3 and CO/H2/O2/N2 = 0.5/50/0.9/balance.
10CuCe at τ = 0.054 g·s·cm−3 and CO/H2/O2/N2 = 0.5/50/0.9/balance.
8CuCe; 10CuCe;  10CuCe at τ = 0.054 g·s·cm−3 and CO/H2/O2/N2 = 0.5/50/0.9/balance.
Figure 6.
CO conversions (a) and selectivities (b) as a function of the temperature and selectivities as a function of the conversions (c) for the xCuCe catalysts. τ = 0.027 g·s·cm−3; CO/H2/O2/N2 = 0.5/50/0.5/balance. Symbols: ● 4CuCe; ![Catalysts 08 00209 i001]() 8CuCe;
8CuCe; ![Catalysts 08 00209 i002]() 10CuCe;
10CuCe; ![Catalysts 08 00209 i004]() 10CuCe at τ = 0.054 g·s·cm−3 and CO/H2/O2/N2 = 0.5/50/0.9/balance.
10CuCe at τ = 0.054 g·s·cm−3 and CO/H2/O2/N2 = 0.5/50/0.9/balance.
8CuCe; 10CuCe; 10CuCe at τ = 0.054 g·s·cm−3 and CO/H2/O2/N2 = 0.5/50/0.9/balance.
Figure 7.
CO conversions (a) and selectivities (b) as a function of the temperature and selectivities as a function of the conversions (c) for the xCuCe catalysts. τ = 0.054 g·s·cm−3; CO/H2/O2/CO2/H2O/N2 = 0.5/50/0.9/25/10/balance. Symbols: ● 4CuCe; ![Catalysts 08 00209 i001]() 8CuCe;
8CuCe; ![Catalysts 08 00209 i002]() 10CuCe;
10CuCe; ![Catalysts 08 00209 i004]() 10CuCe (CO/H2/O2/N2 = 0.5/50/0.9/balance); ¯ 4%CuO/CeO2 (CO/H2/O2/CO2/H2O/N2 = 0.5/50/0.9/15/10/balance).
10CuCe (CO/H2/O2/N2 = 0.5/50/0.9/balance); ¯ 4%CuO/CeO2 (CO/H2/O2/CO2/H2O/N2 = 0.5/50/0.9/15/10/balance).
8CuCe; 10CuCe; 10CuCe (CO/H2/O2/N2 = 0.5/50/0.9/balance); ¯ 4%CuO/CeO2 (CO/H2/O2/CO2/H2O/N2 = 0.5/50/0.9/15/10/balance).
Table 1.
Sample labels: nominal CuO and Cu contents, BET surface areas, and surface Cu contents measured by EDS.
Table 1.
Sample labels: nominal CuO and Cu contents, BET surface areas, and surface Cu contents measured by EDS.
| Sample | Nominal CuO Content, wt % | Nominal Cu Content, wt % | BET Area, m2/g | Surface Cu Content, wt % a |
|---|---|---|---|---|
| 4CuCe | 4 | 3.2 | 83.4 | 3.7 |
| 8CuCe | 8 | 6.4 | 61.4 | 8.8 |
| 10CuCe | 10 | 8.0 | 57.8 | 6.1 |
a as measured by EDS.
Table 2.
H2-TPR and CO2 temperature programmed desorption (TPD) quantitative analysis.
| Sample | Total H2 Uptake, µmol/g | Peak | Peak Temperature, °C | Peak Area, µmol/g | H2/Cu | CO2, µmol/g |
|---|---|---|---|---|---|---|
| CeO2 | 361 | |||||
| 4CuCe | 971 | α’ | 121 | 57.0 (6.1%) | 1.5 | 436 |
| α | 166 | 418 (44.5%) | ||||
| β + γ | 224 | 465 (49.5%) | ||||
| 8CuCe | 1618 | α | 175 | 800 (49.5%) | 1.3 | 328 |
| β + γ | 214 | 818 (50.5%) | ||||
| 10CuCe | 1750 | α | 166 | 838 (47.9%) | 1.1 | 326 |
| β + γ | 214 | 912 (52.1%) |
Table 3.
Best catalytic performance of some CuO/CeO2 based catalysts reported in the literature and in this work.
Table 3.
Best catalytic performance of some CuO/CeO2 based catalysts reported in the literature and in this work.
| Sample | CuO, | τ, | τ’, | T99, | Feed Composition | Ref. | ||
|---|---|---|---|---|---|---|---|---|
| % | g∙s∙cm−3 | s (×103) | °C | CO a | O2 b | H2 b | ||
| CuCe-2b | 7.5 | 0.003 | 9.4 | 170 | 300 | 0.03 | 1 | [13] |
| 5CuCe nano-sheet | 6.2 | 0.045 | 3.5 | 122 | 10,000 | 20 | - | [65] |
| 0.04CuCe from Ce-UiO-66 | 10.9 | 0.3 | 41.1 | 105 | 10,000 | 1 | 50 | [70] |
| CuCe(rod)-48h | 8.7 | 0.06 | 6.6 | 90 | 10,000 | 1 | 50 | [66] |
| 10CuCe-2OH-ILs | 12 | 0.06 | 9.1 | 130 | 10,000 | 1 | 50 | [67] |
| 4%CuO/CeO2 | 4 | 0.054 | 5.4 | 170 | 5000 | 0.9 | 50 | [15] |
| 4%CuO/CeO2 by SCS | 4 | 0.054 | 5.4 | 150 | 5000 | 0.9 | 50 | [15] |
| xCuCe | 4, 8, 10 | 0.054 | 5.4–13.6 | 115 | 5000 | 0.9 | 50 | This work |
| 10CuCe | 10 | 0.027 | 6.8 | 115 | 5000 | 0.5 | 50 | This work |
a ppm; b vol %.
Table 4.
Comparison of the first-order kinetic constant (k) and Turnover Frequency (TOF) evaluated at different contact times, CuO load, and temperature for CuO/CeO2 catalysts reported in [52] and in this work. CO = 5000 ppm; H2 = 50 vol %; O2 = 0.5 vol % ([52], this work at τ = 0.027 g∙s∙cm−3), 0.9 vol % (this work at τ = 0.054 g∙s∙cm−3).
| Sample | CuO, wt % | τ, g∙s∙cm−3 | τ’, s (×103) | T, °C | k, cm3∙s−1∙g−1 | TOF, s−1 | Ref. |
|---|---|---|---|---|---|---|---|
| 0.5CuCe | 0.6 | 0.03 | 0.4 | 100 | 3.1 | 6.7 | [52] |
| 4CuCe | 4.2 | 0.03 | 3.2 | 100 | 17.6 | 5.4 | [52] |
| 8CuCe | 8.2 | 0.03 | 6.2 | 100 | 16.7 | 2.6 | [52] |
| 4CuCe | 4 | 0.054 | 5.4 | 95 | 32.3 | 10.6 | This work |
| 8CuCe | 8 | 0.054 | 10.9 | 95 | 27.6 | 4.5 | This work |
| 10CuCe | 10 | 0.054 | 13.6 | 95 | 35.2 | 4.6 | This work |
| 4CuCe | 4 | 0.027 | 2.7 | 95 | 10.1 | 3.3 | This work |
| 8CuCe | 8 | 0.027 | 5.4 | 95 | 28.6 | 4.7 | This work |
| 10CuCe | 10 | 0.027 | 6.8 | 95 | 64.0 | 8.4 | This work |
© 2018 by the authors. Licensee MDPI, Basel, Switzerland. This article is an open access article distributed under the terms and conditions of the Creative Commons Attribution (CC BY) license (http://creativecommons.org/licenses/by/4.0/).
Share and Cite
MDPI and ACS Style
Di Benedetto, A.; Landi, G.; Lisi, L. Improved CO-PROX Performance of CuO/CeO2 Catalysts by Using Nanometric Ceria as Support. Catalysts 2018, 8, 209. https://doi.org/10.3390/catal8050209
AMA Style
Di Benedetto A, Landi G, Lisi L. Improved CO-PROX Performance of CuO/CeO2 Catalysts by Using Nanometric Ceria as Support. Catalysts. 2018; 8(5):209. https://doi.org/10.3390/catal8050209
Chicago/Turabian StyleDi Benedetto, Almerinda, Gianluca Landi, and Luciana Lisi. 2018. "Improved CO-PROX Performance of CuO/CeO2 Catalysts by Using Nanometric Ceria as Support" Catalysts 8, no. 5: 209. https://doi.org/10.3390/catal8050209
Note that from the first issue of 2016, this journal uses article numbers instead of page numbers. See further details here.