Ammonia Concentration Distribution Measurements on Selective Catalytic Reduction Catalysts

BOSMAL Automotive Research & Development Institute Ltd., 43-300 Bielsko-Biala, Poland
*
Author to whom correspondence should be addressed.
Catalysts 2018, 8(6), 231; https://doi.org/10.3390/catal8060231
Submission received: 18 April 2018
/
Revised: 16 May 2018
/
Accepted: 22 May 2018
/
Published: 1 June 2018
(This article belongs to the Special Issue Selective Catalytic Reduction of NOx)
Abstract
:This work presents the methodology and accurate evaluation of ammonia concentration distribution measurements at the selective catalytic reduction (SCR) catalyst outlet cross-section. The uniformity of ammonia concentration is a crucial factor influencing overall SCR effectiveness, and it contributes to the necessity of employing a reliable test method. The aftertreatment system design (mainly its geometrical features) can be evaluated in detail. The ammonia concentration is measured at the SCR catalyst outlet at grid points covering from the center to the outer edges of the catalyst. Its execution requires the introduction of a probe hovering over the back face of the SCR. To obtain the expected accuracy, it is necessary to measure a sufficient number of points in a reasonable timeframe. In order to achieve that, a fully automatic sampling device was developed. Sample results are presented showing the capabilities of the created test stand and its importance for the design development and validation stages of SCR-based engine aftertreatment.
1. Introduction
Selective catalytic reduction (SCR) has become the principle method of nitrogen oxides removal (NOx) from exhaust gases of diesel engine powertrains in the automotive industry. The SCR system utilizes water–urea solution (UWS) as a reducing agent, which is injected directly into the exhaust upstream of the SCR catalyst. The SCR system working at the rated operating conditions allows the NOx emission to be decreased by more than 98%. The excellent NOx removal efficiency of the SCR systems allows calibration of the engine for more efficient combustion strategies, thus increasing the fuel efficiency and reducing the CO2 emissions. Considering a typical NOx-particulate matter (PM) trade-off, shifting towards higher engine-out NOx emission leads to an improvement of fuel efficiency and decreases the soot emission. This in turn lowers the diesel particulate filter (DPF) soot loading and decreases the frequency of the active regeneration events.
In the automotive sector, the SCR method allows the elimination of the divergence in NOx emission values between laboratory certification driving cycles and the real-driving emissions test (RDE) that were legally enforced in 2017 for passenger vehicles [1,2,3,4]. However, it is complex to implement the SCR system onboard a vehicle, as it requires the deployment of a urea-dosing infrastructure with a urea tank, NOx/NH3 catalysts, and sensors. To decrease the aftertreatment system dimensions under the vehicle’s compartment, the SCR can be coated onto a DPF, and this type of solution is referred as an SCR-Catalyzed Diesel Particulate Filter (SDPF) [5,6].
To the achieve high NOx reduction efficiency in an SCR system, the urea dosed needs to be mixed evenly with the exhaust gas stream in order to obtain as uniform an ammonia distribution at the SCR inlet face as possible. The mixing uniformity challenge has to be met throughout the wide and continuously varying range of exhaust flow rate and temperature, which produces variability in the injected urea spray dispersion and interaction with mixing elements. This correlates the catalyst efficiency to the degree of uniformity of the ammonia. Consequently, with poor ammonia distribution, the SCR system will be prone to increased urea consumption, decreased NOx reduction, and increased NH3 slip [7,8,9]. The uniformity of ammonia entering the SCR reactor has become even more critical, since SCR technology is widely applied to light duty vehicles. This type of vehicle usually incorporates a close-coupled aftertreatment layout, leaving minimal volume and time to mix in the ammonia. As a result, a dependable methodology of urea uniformity evaluation is required. An investigation into the distribution of ammonia in SCR systems has already been investigated and characterized, as published by Song, Naber and Johnson in [10].
In the methodology presented below, in order to maximize the accuracy of the ammonia distribution evaluation at the SCR front face, a high-density grid of measuring locations at the SCR outlet was applied. A dedicated test stand was developed featuring an automatically operated gas sampling probe, allowing the efficient and flexible testing of various SCR system designs. The test method was elaborated to support Euro 6 emission-compliant SCR applications, from which NOx conversion efficiency above 95% is demanded, maintaining at the same time low ammonia slip and UWS consumption. The objective is to accurately estimate the ammonia distribution at the SCR front face. The actual measurement is impossible at this location, since it is unworkable to insert a sampling probe into such a tight environment. Assuming a linear flow of the exhaust gas throughout the SCR brick, a uniformity level of NH3 and NOx is the same on both sides of the reactor. Consequently, it was decided to measure gaseous compounds’ concentrations at the SCR back face. This location is accessible to the moving probe, and the obtained results are post-processed to calculate ammonia distribution at SCR reactor front face.
A uniformity index (UI) is commonly used to describe the ammonia distribution across the exhaust pipe or the catalyst cross-section [11]. It is based on the formula with local and mean NH3 concentrations related to the catalyst surface. Well-optimized Euro 6/VI mixing systems for light-duty and heavy-duty applications are able to achieve UI values greater than 0.98. Improper integration of a mixing element can hinder system performance and introduce urea deposit formation concerns [12].
There are three key SCR catalyst chemical reactions [13], and their precedence depends on NO2/NOx ratio. The standard reaction, which reduces only NO, is the following:
Since there is always NO2 present to some extent in the exhaust e.g., 10%, the reaction treating both NO and NO2 is (2). This reaction is the fastest and the most preferred. For this reason, the diesel oxidation catalyst (DOC) positioning upstream of SCR benefits in an enhanced NO2 share in the exhaust by platinum coating.
When the NO2/NOx ratio exceeds 50%, then reaction (3) becomes operative:
This reaction is undesirable, as the excess of NO2 can yield N2O, which is a strong greenhouse gas:
The quantity of urea that was dosed is expressed by a stoichiometric ratio, α, which was calculated as a quotient of the amount of ammonia molecules from the urea and the amount of nitrogen oxides molecules in the elementary exhaust gas mass flow:
Consequently, α = 1 is defined as the theoretical flow of UWS required for converting 100% of the incoming NOx flow.
2. Results and Discussion
2.1. Test Methodology
The test methodology is based on the measurements of NOx and NH3 concentration distribution at SCR back face and the post-process of collected results in order to calculate the ammonia uniformity index at the SCR inlet. The input data that was necessary for the NH3 uniformity index calculation was obtained by two independent test runs.
The first run was aimed at the measurement of NOx distribution, without urea water solution (UWS) injection to the exhaust. The values were further used in formula (1) for the results calculation that was acquired during the second test run.
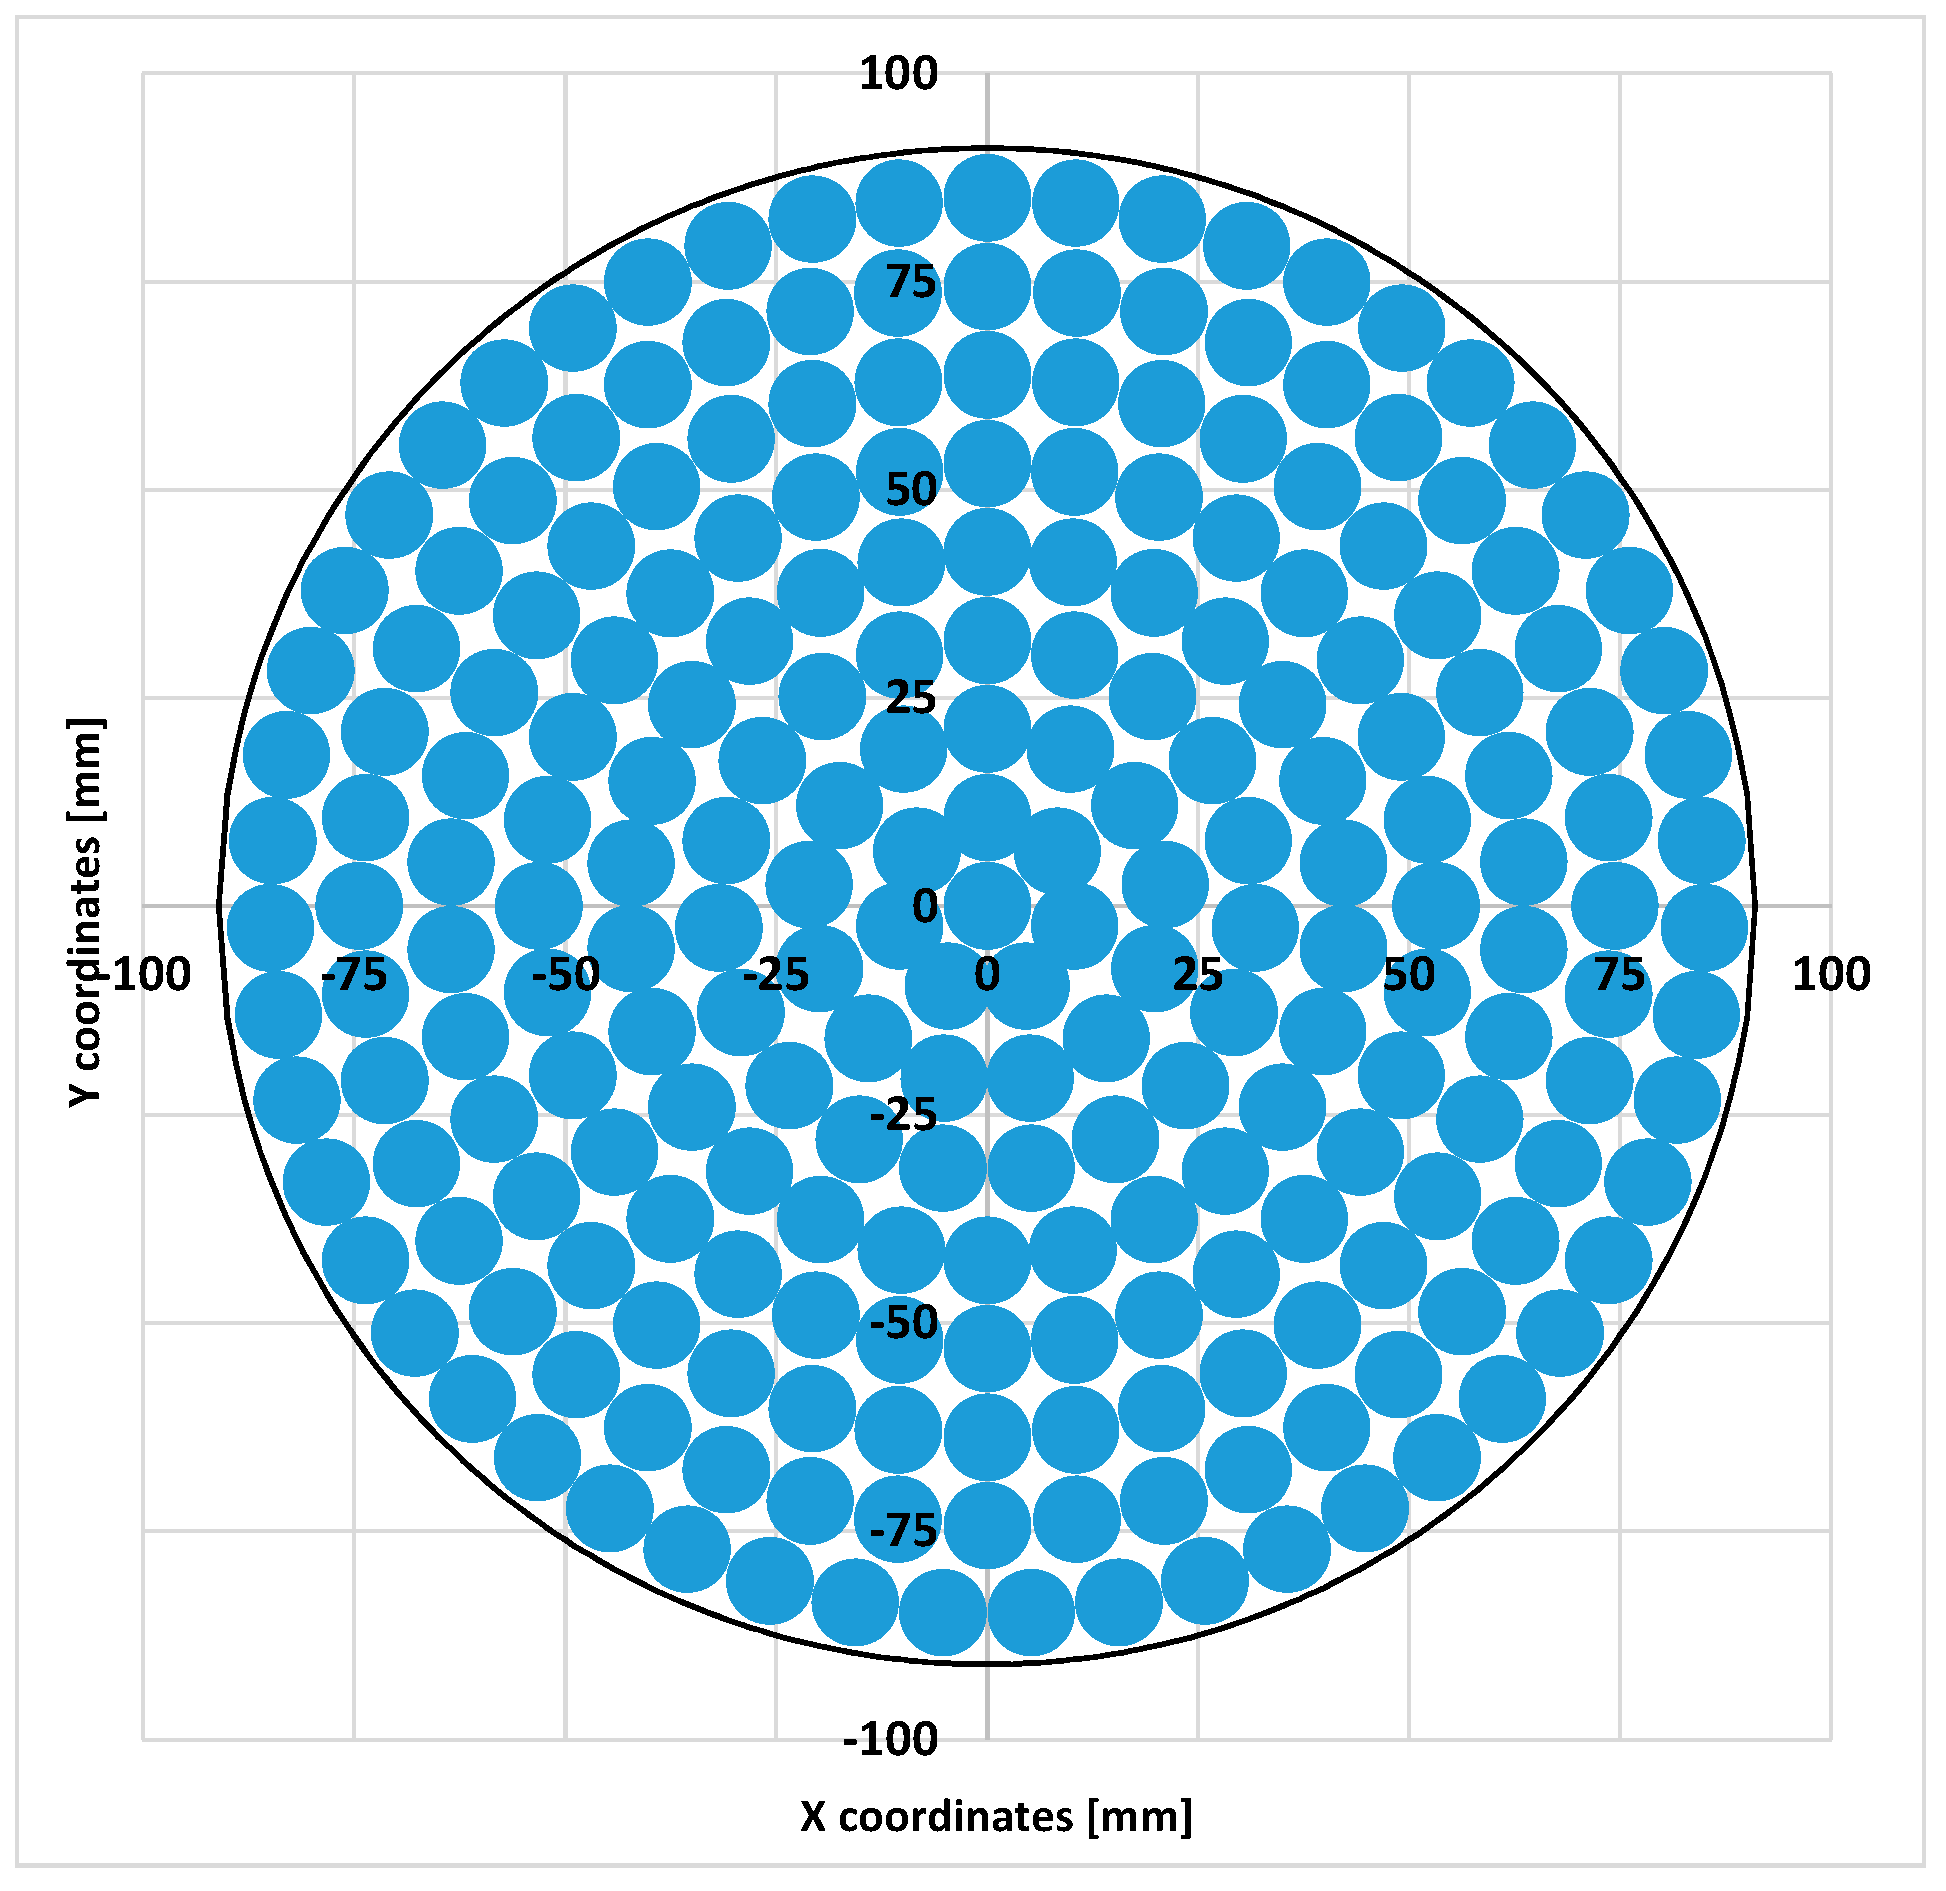
The second run was executed with an active UWS injection, and NOx and NH3 concentrations were measured. Both test runs consisted of the same number of probe locations evenly distributed over the SCR outlet face (Figure 1).
This paper presents the example test on an SCR reactor of 184-mm diameter and with 231 probe measuring positions. The grid of measurement points covered 82% of total SCR cross-section area. The sticky characteristics of NH3 demanded a relatively long stabilization time, which was needed to secure the exhaust gas exchange in the sampling lines. Trial measurements at different stabilization periods were performed to establish the minimum time that was needed to reach a stable reading of NH3. As a result, a single point location measurement lasted 40 s, and consisted of 30 s of stabilization time and 10 s of measurement phase. Consequently, a single test-run lasted 2.57 h, which was required to ensure a stable engine operating condition over the entire test time.
Before the first test run (without UWS injection), the engine and aftertreatment system were thermally stabilized for 1.5 h at test conditions, before the actual NOx measurement started. The extended preconditioning time was aimed at eliminating the urea saturation inside the SCR catalyst.
During the second test run, the UWS was injected into the exhaust gas upstream of SCR at an α coefficient equal to 1. The chosen α value corresponded to an UWS flow rate of 12.4 mg/s for the set engine operation conditions. The UWS injector was calibrated in order to accurately follow requested flow rates. Prior to NH3 measurements beginning, the engine and exhaust aftertreatment system (ATS) were also stabilized by running the engine at test parameters. The preconditioning phase was important to achieve steady-state test conditions, as the UWS that was introduced into the exhaust gas lowers its temperature due to evaporation. Moreover, the SCR catalyst needs a certain time to achieve an equilibrium in ammonia saturation level that corresponds to the particular exhaust gas conditions. The engine with ATS was considered to be preconditioned once stable readings of NOx and NH3 concentrations at a central location, as well as the gas temperature downstream of the SCR catalyst, were both measured. Nevertheless, the preconditioning was continued to reach the fixed time of 1.5 h to ensure that equilibrium conditions at regions reach with ammonia. The engine operating condition is presented in Table 1.
2.2. Acquired Results
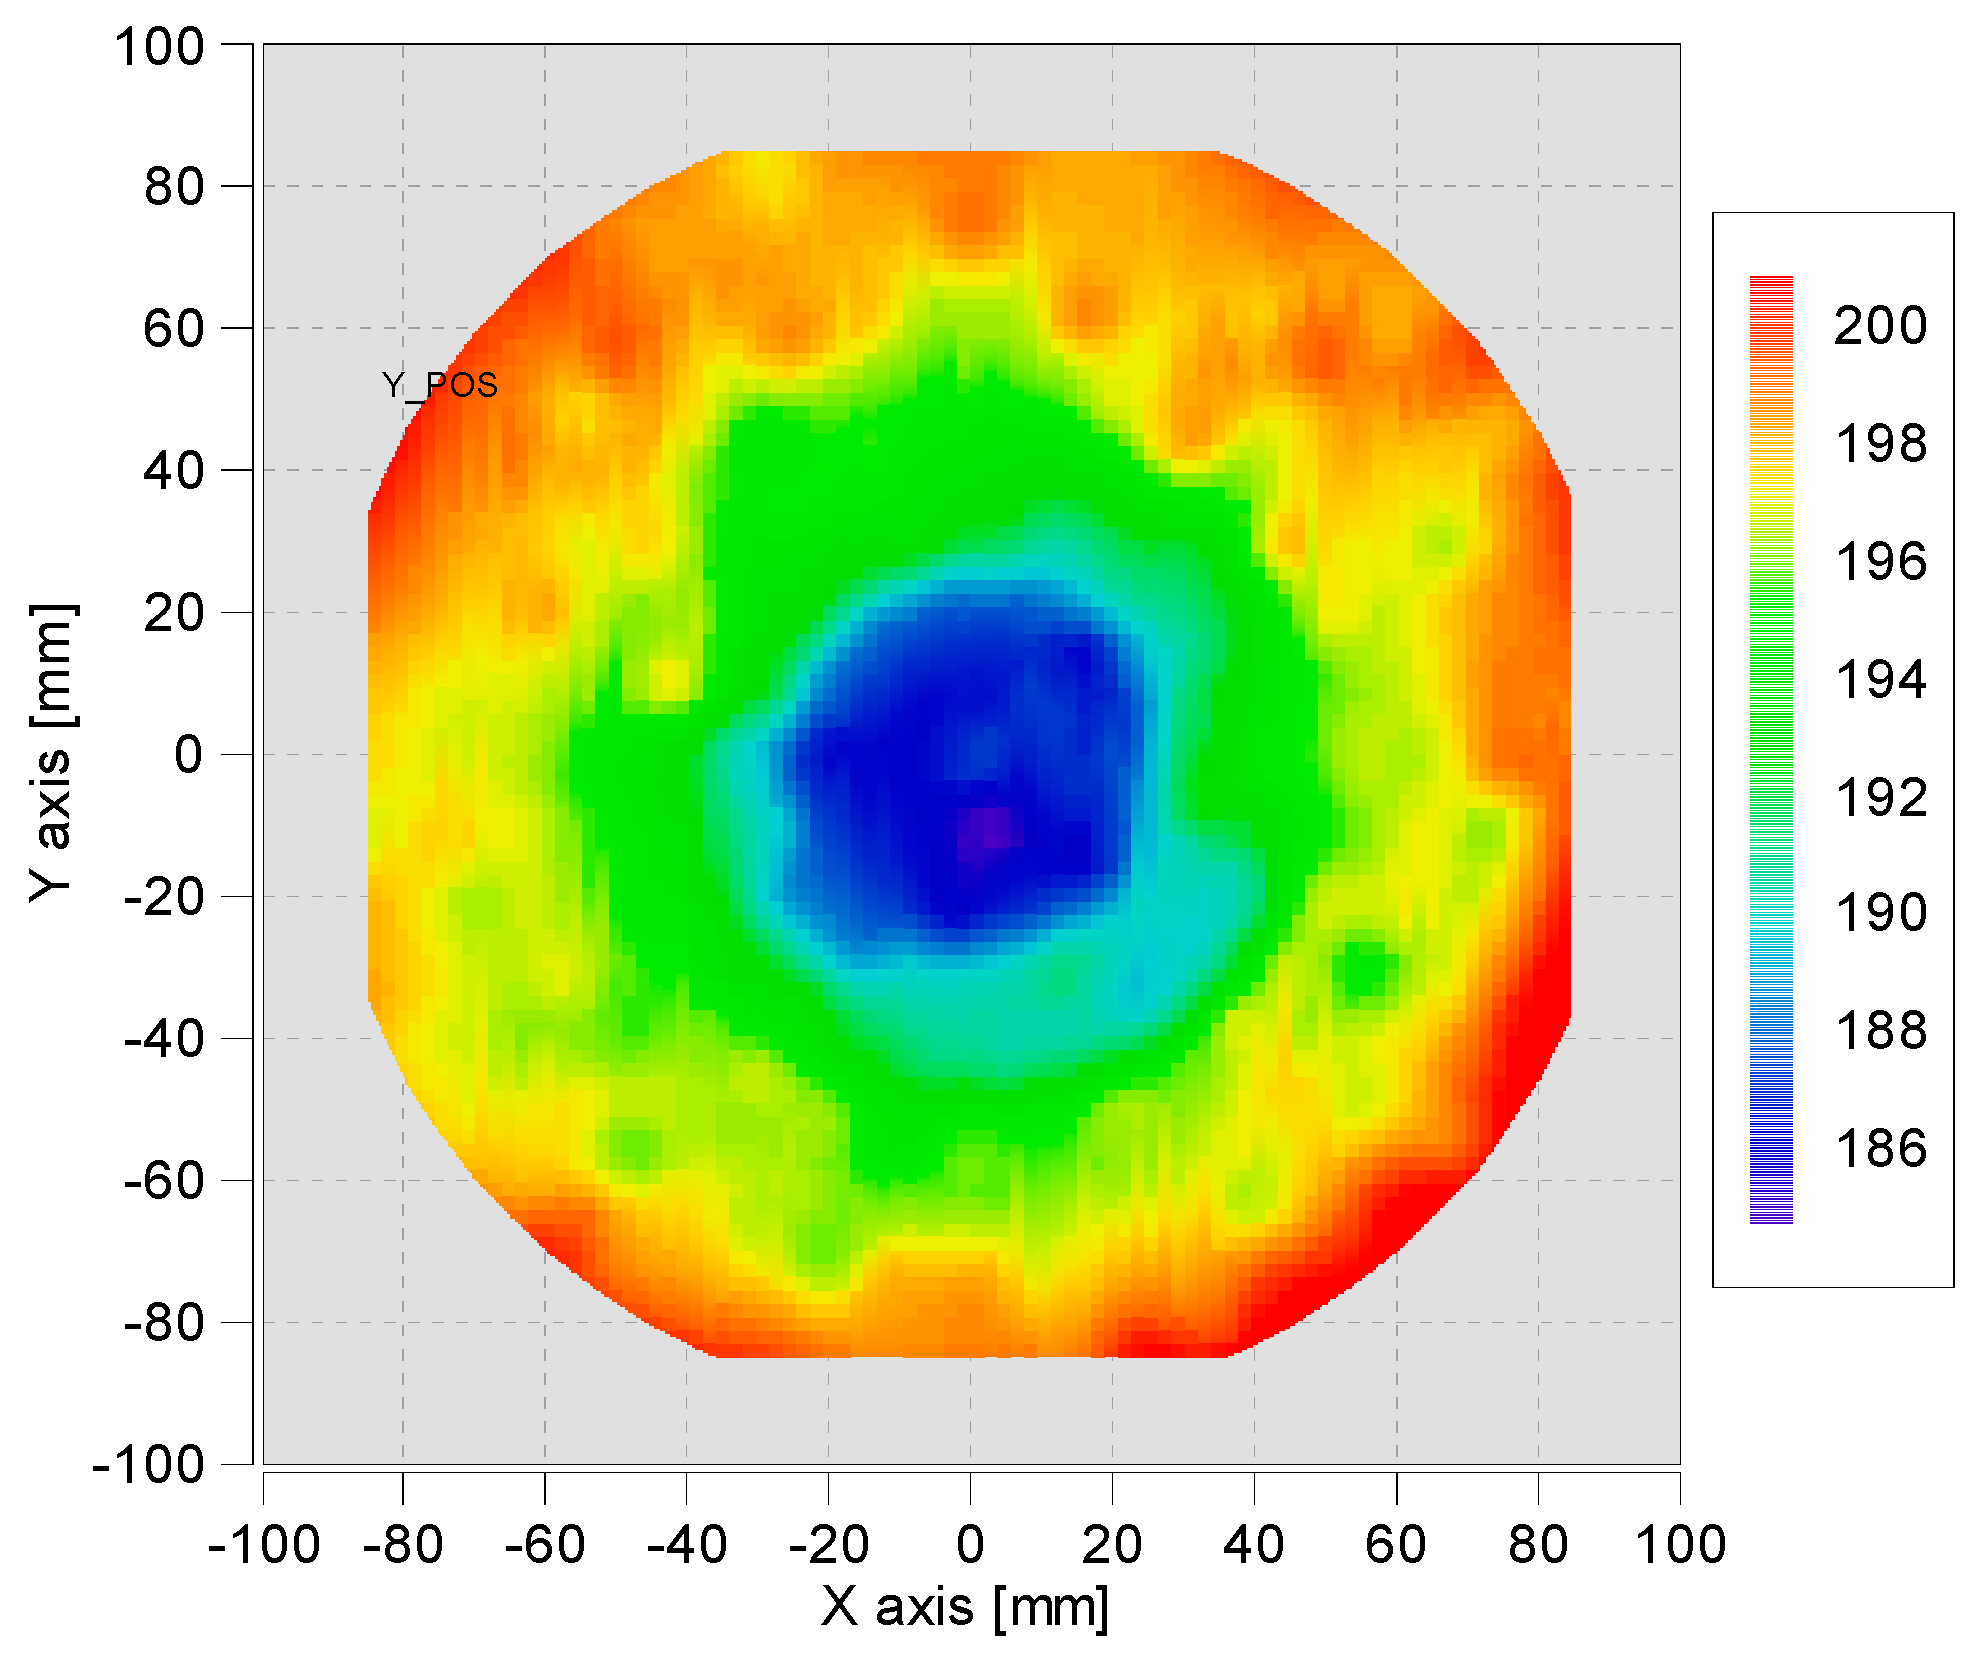
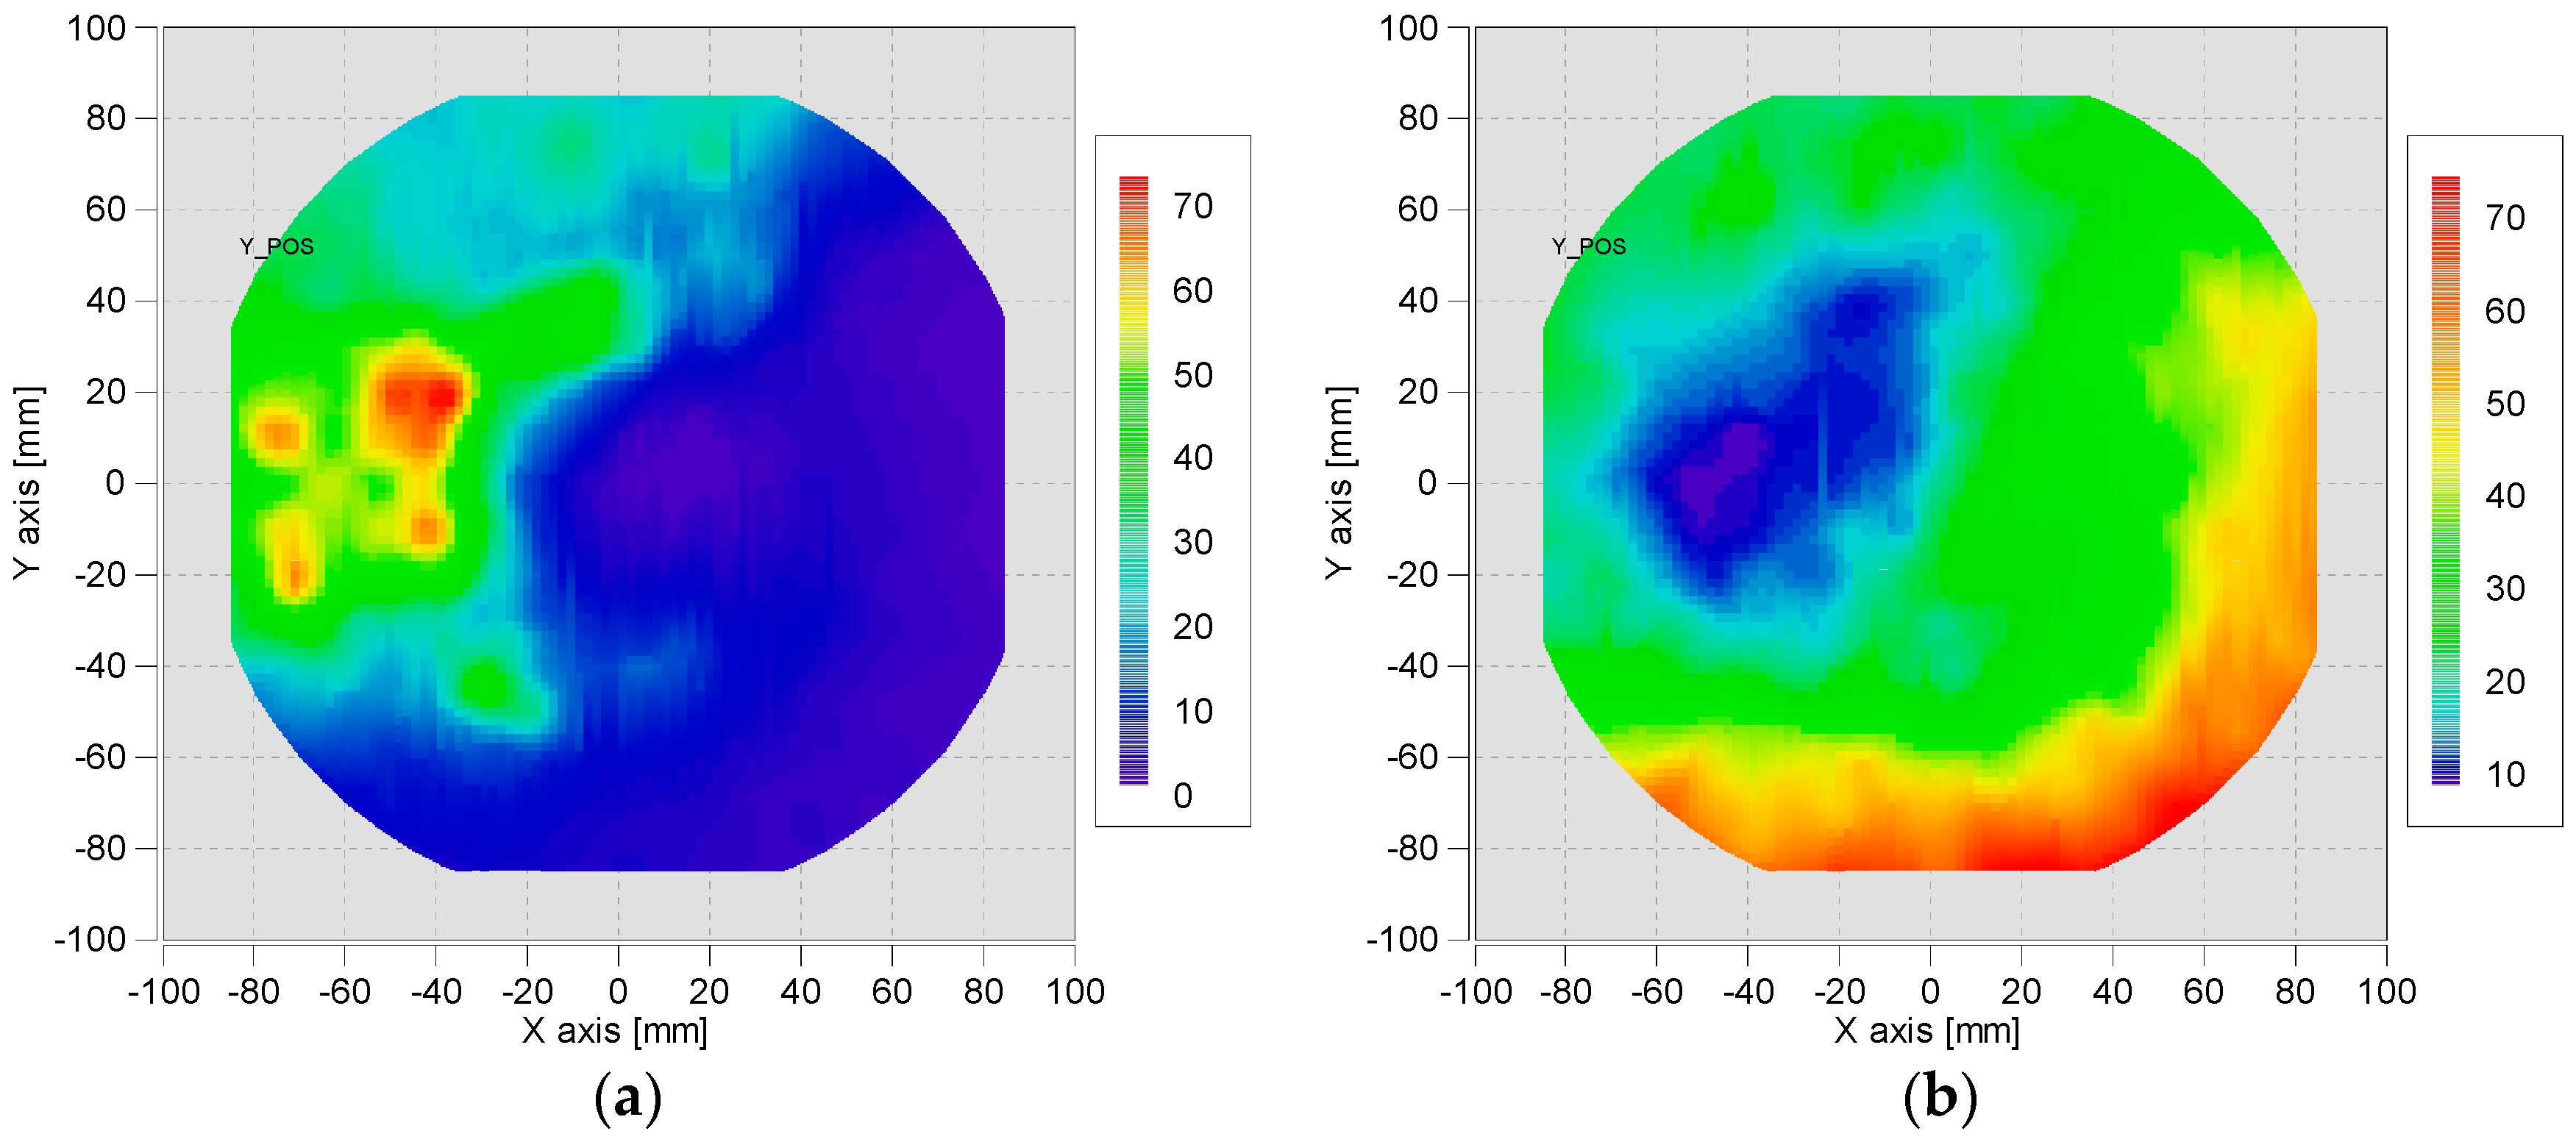
The acquired NOx and NH3 concentration results at each sampling point of both test runs were plotted against X and Y coordinates. Figure 2 presents NOx distribution measured without UWS dosing. The average NOx concentration is 3% lower than the raw engine out emission. The possible explanations of such a phenomenon is DOC lean NOx performance and reactions with diesel PM and HCs (hydrocarbons). The Figure 3 plots correspond to the test run with an active UWS dose. The SCR substrate cross-section maps that were generated clearly indicate regions of high and low concentration of both measured compounds (Figure 3).
The inhomogeneity of ammonia distribution affects the SCR’s overall effectiveness. The areas of high NOx emissions are the results of insufficient ammonia concentration upstream of the SCR to react with NOx. Since the target average α coefficient is close to 1, the regions that are lean with ammonia are compensated by other regions of NH3 enrichment across SCR outlet face. At the locations with excess NH3, the NOx emissions downstream of the SCR are 10 ppm or lower, and these areas are sources of unwanted ammonia slip. For the given test conditions, the NO2/NOx ratio at the SCR inlet was 67%.
2.3. Data Post-Processing
Assuming no NOx conversion in the SCR, the NOx concentrations measured downstream of the SCR are reflective of the NOx distribution at the SCR inlet face. Based on the obtained measurement results, the ammonia concentration at SCR inlet face is calculated according to the formula:
where:
- —local NOx concentration at selective catalytic reduction (SCR) inlet at the i-th location
- —local NOx concentration measured at SCR outlet at the i-th location
- —local NH3 concentration measured at SCR outlet at the i-th location
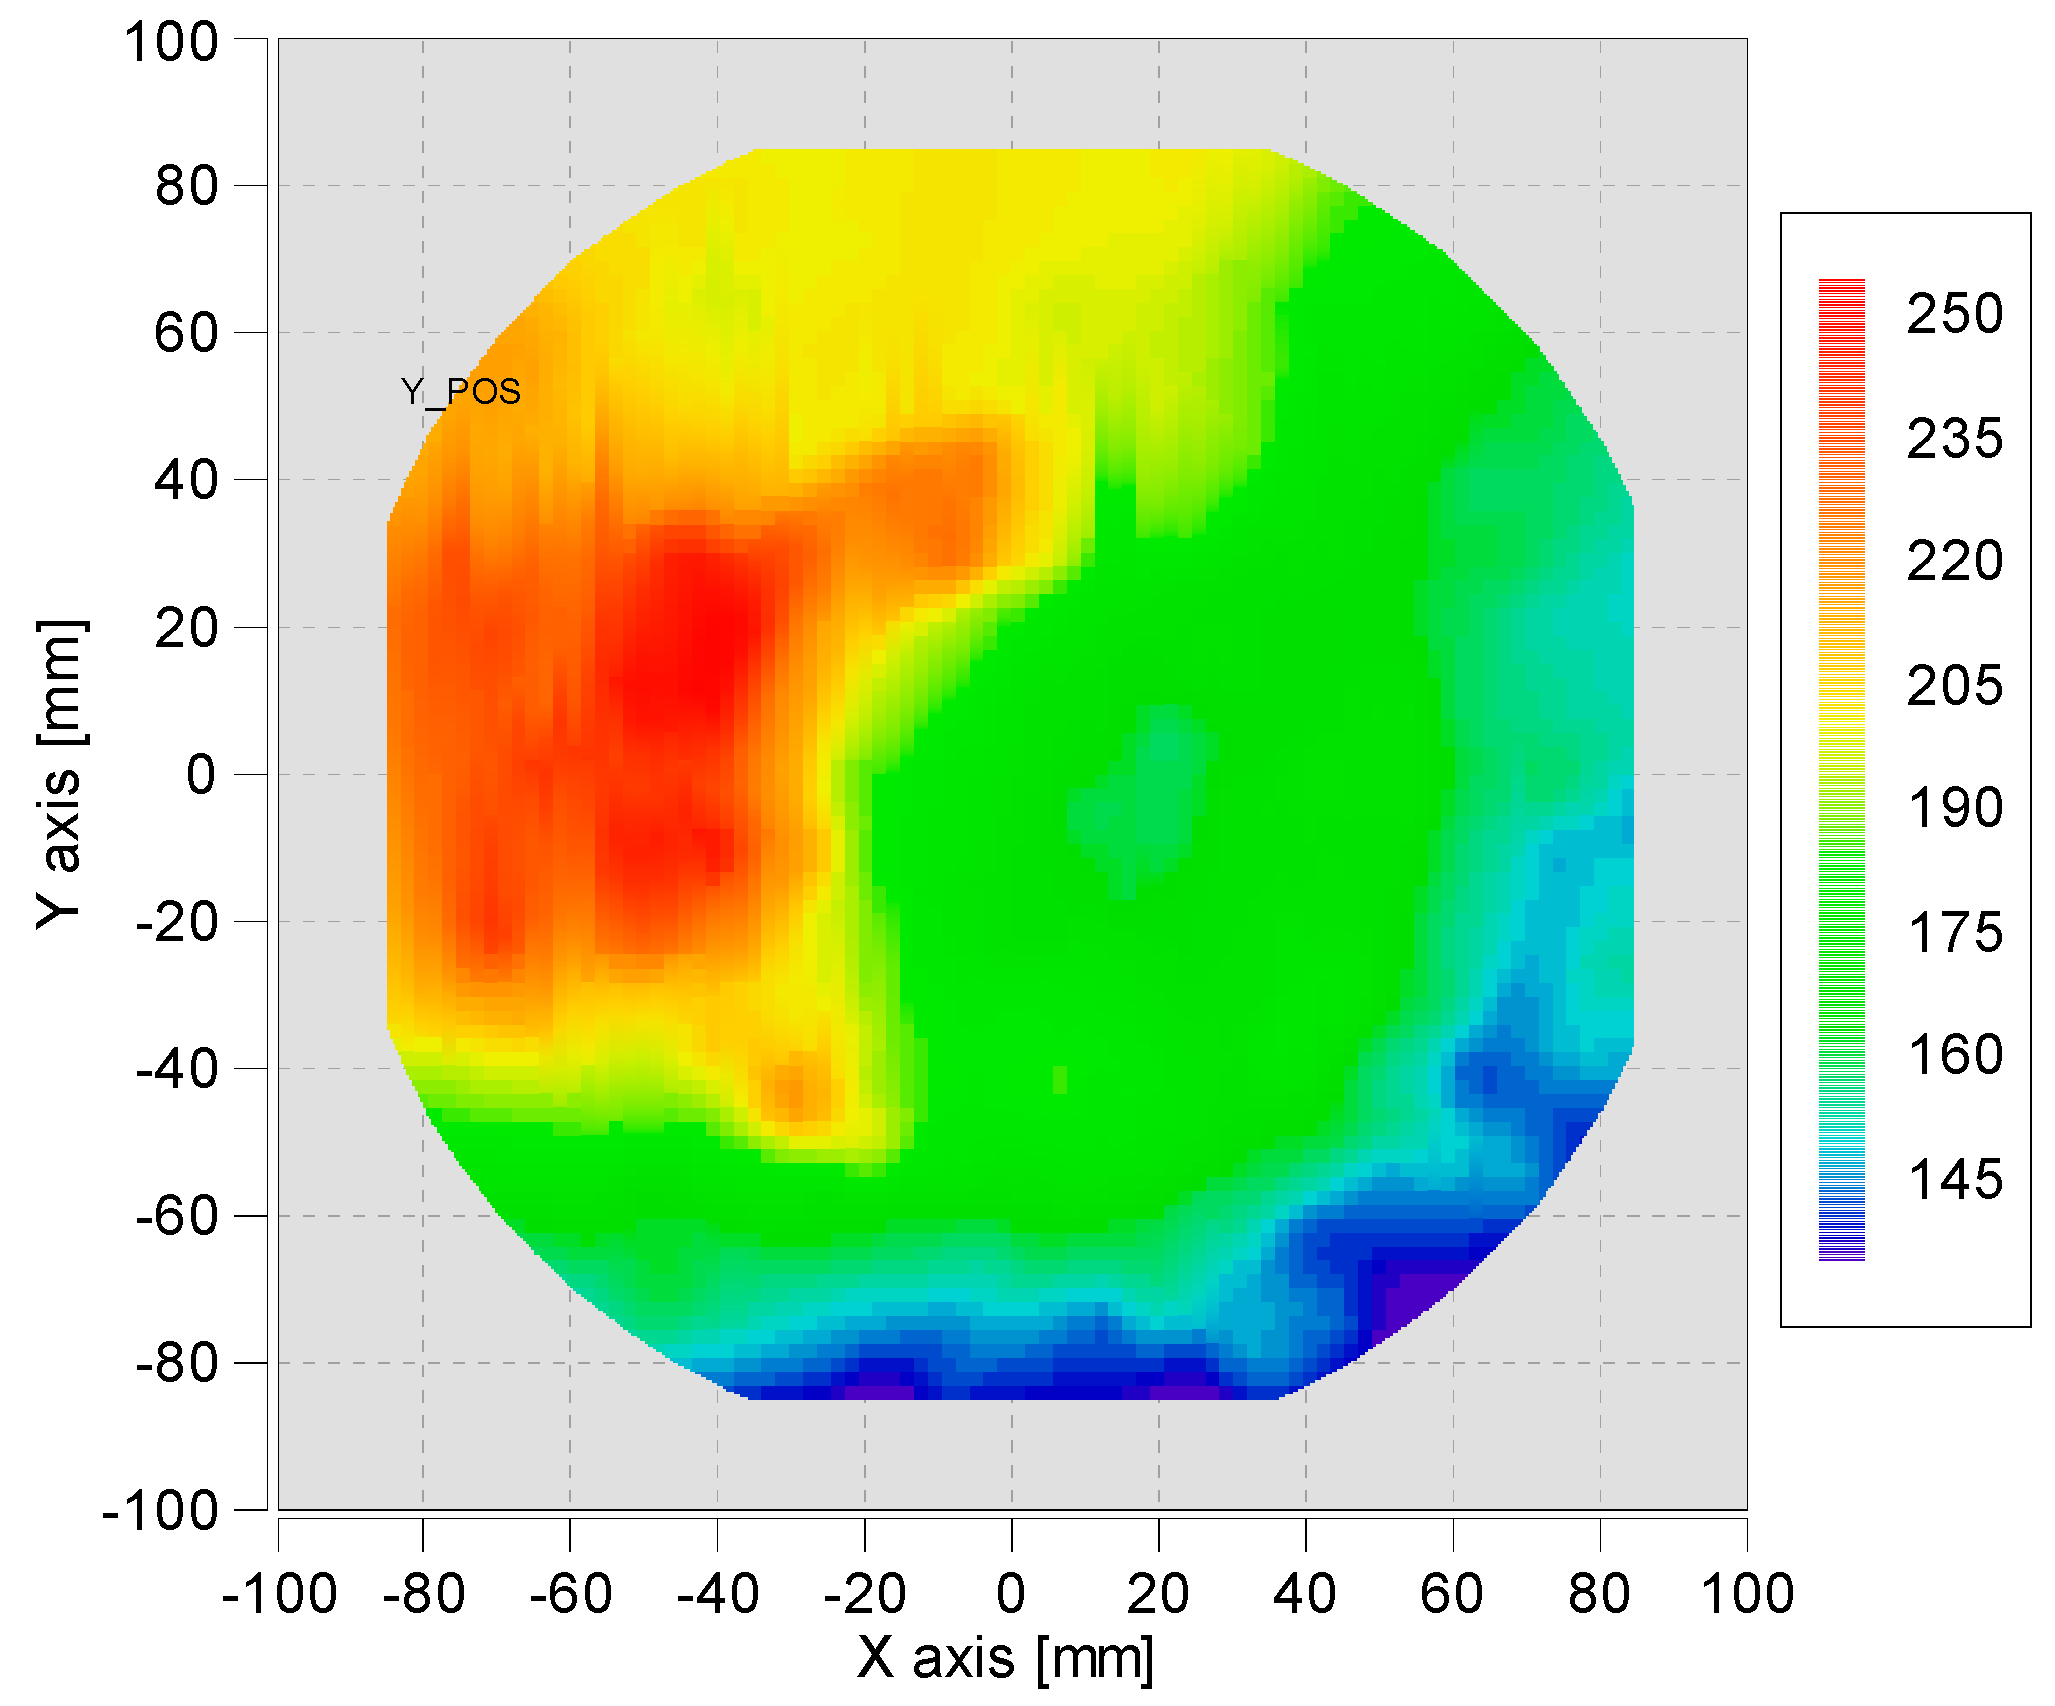
The results of the calculations are presented on Figure 4.
Following the obtained test results, the ammonia distribution can be uniformly evaluated. For this purpose, the uniformity index (UI) is calculated according to the formula:
where:
- —average ammonia concentration at SCR inlet
- —the area of the i-th measuring point
The uniformity index value for the SCR system measured was equal to 0.934. The measurements were repeated in order to establish its repeatability. The uniformity index obtained from the second run was equal to 0.926, giving a UI mean value of 0.929 ± 0.05. Formula (7) is based on the equation presented by Nova and Tronconi in [13]. The original equation takes into account the actual mass fraction of ammonia rather than its concentration. Assuming a uniform exhaust mass flow over the SCR cross-section, the concentration figures reflect the trend of the mass fraction. Consequently, the calculation can be simplified solely to the concentration readings. The measurement correctness was subsequently verified by calculation of a mean α value (αmean) of local α values at each probe position. The αmean was calculated by the formula:
In this particular case, the mean calculated α value was 0.937. It was expected that the mean α value was lower than the setpoint value. This phenomenon can be explained by incomplete urea thermolysis and hydrolysis processes, and therefore, the total mass of ammonia in SCR catalyst is always lower than the theoretical mass derived from the urea quantity introduced into the exhaust stream. Moreover, the slow SCR reaction (3) with a low reaction rate is active at the NO2/NOx shares over 50%. The NOx reduction of the slow SCR reaction mechanism is limited by kinetic factors other than the inlet NH3 maldistribution [10]. Furthermore, the possible formation of urea solid deposits inside the exhaust system decreases the amount of the reducing agent available for NOx conversion [14,15]. Cases of αmean values higher than the setpoint α should be investigated in detail for measurement errors. There are several factors affecting the correctness of the measurement. The drift of the UWS injector’s calibration curve may lead to a faulty urea injection rate, and consequently a wrong α value. Additionally, the drift of gas analyzers’ measurement, such as for instance understating the NOx and amplifying the NH3 readings, leads to an overstated α coefficient value.
3. Materials and Methods
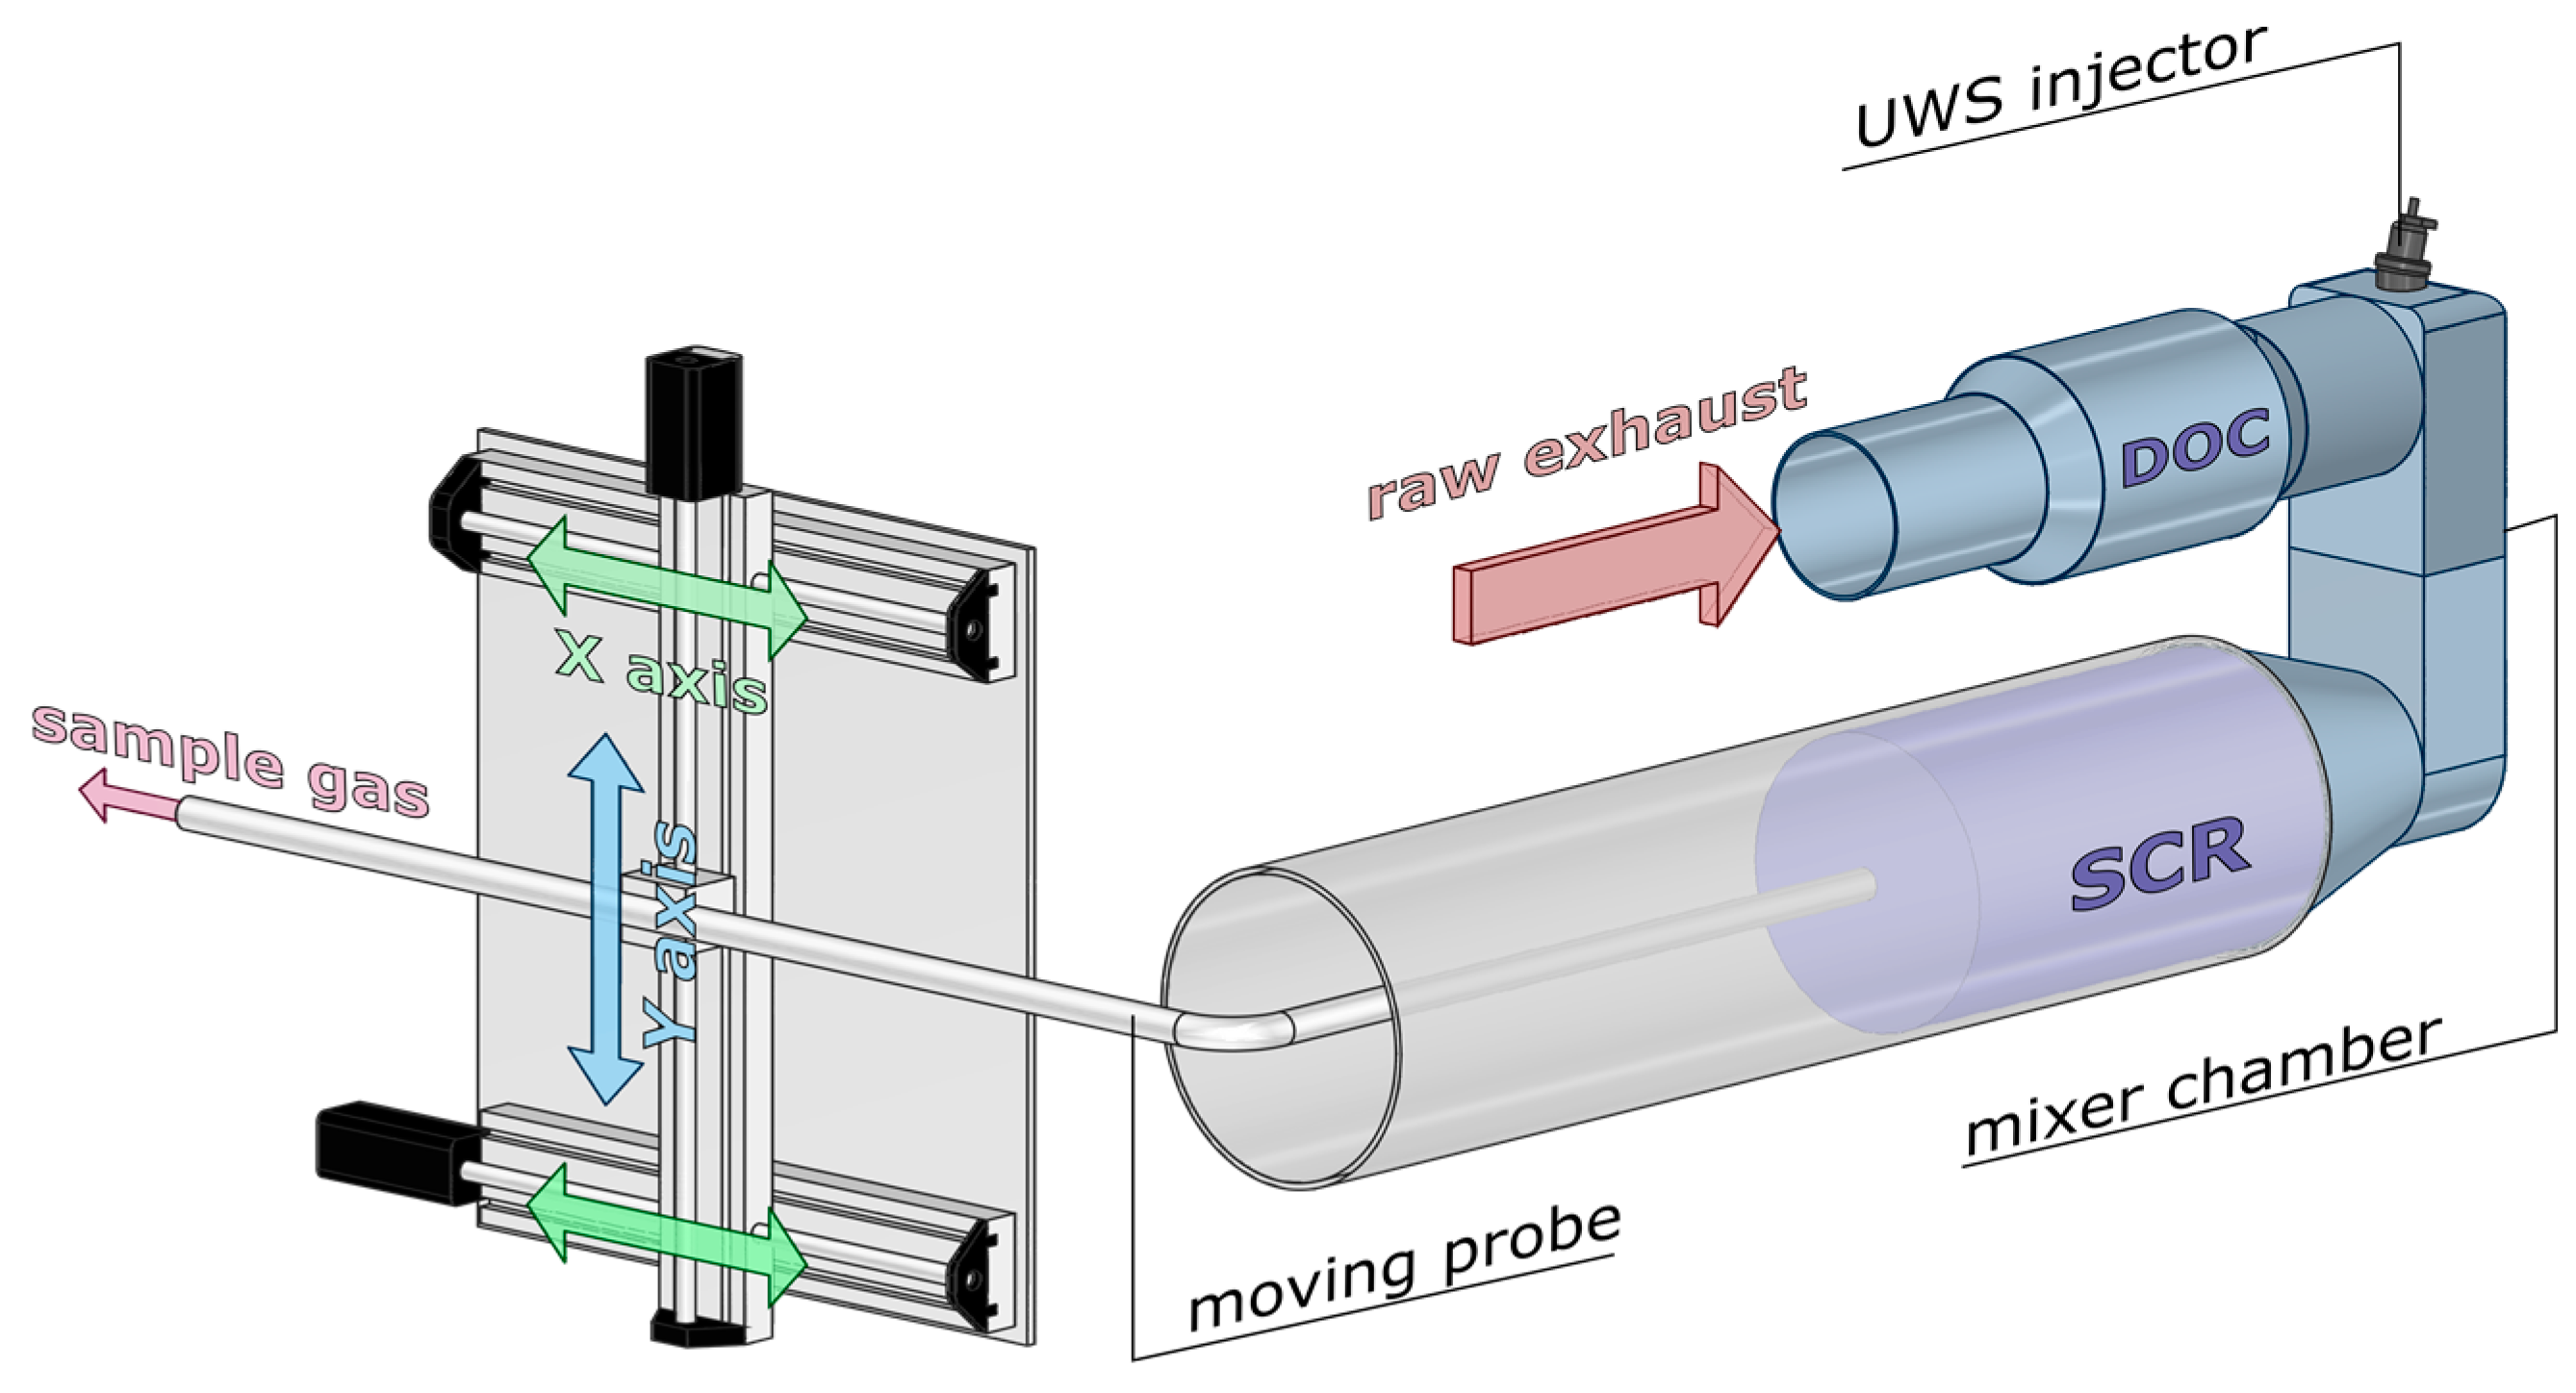
The NH3 and NOx concentration measurements were performed in an engine testing laboratory on a 2.3 L CI Euro 5 light-duty engine with a customized exhaust aftertreatment system. The close-coupled exhaust line consisted of a diesel oxidation catalyst (DOC), urea injector, urea mixer and an open-ended SCR catalyst. With an SCR substrate diameter of 184 mm, the sampling probe active diameter was 10 mm. The total area of locations covered by the probe represented 82% of the total cross-section area of the SCR brick. The SCR housing was modified by removing the outlet cone, in order to allow the moving probe access to the entire outlet face. The open-ended exhaust line was further extended by 20 cm with a metal pipe of the same diameter as the SCR to stabilize the gas flow as presented on Figure 5. Since the setup featured an open outlet, an exhaust extraction fan was placed right after the end of extension pipe, leaving a minimal gap for the moving probe.
The sampling probe was conveyed across the back face with a clearance of 3–4 mm. It consisted of an L-shaped steel pipe fixed to a ball screw linear guide driven by a stepper motor, with an accuracy of 0.05 mm, allowing for a transition in the Y-direction. The X-direction probe movement was realized by a pair of linear guides based perpendicularly to the Y-direction with a second stepper motor (Figure 5). The sampling probe trace was defined by the X,Y coordinates implemented to the automation system, together with the number of target sampling points.
The sample gas was transferred to gas analyzers, where NH3 and NOx concentrations were measured. The exhaust emission benches were an AVL AMA i60 CLD gas analyzer and an AVL LDD standalone ammonia analyzer with an accuracy of ±1%. Both emission benches were produced by AVL, Graz, Austria.
4. Conclusions
There is an ongoing effort and continuous development process on SCR system optimization for automotive applications. For light-duty vehicles equipped with diesel engines, the main constraints for SCR systems are the warm-up phase, the external dimensions of entire system, and cost.
A close-coupled aftertreatment system layout is widely chosen as a reasonable compromise for light-duty vehicles, providing a compact system package that fits into the vehicle’s engine compartment. Furthermore, its proximity to the engine ensures a short warm-up phase. However, high component density dramatically reduces the distance between the UWS injector and the SCR reactor. This, in return, is detrimental for the mixing capabilities of UWS that is introduced to the exhaust. Consequently, the development of highly effective mixers is required to ensure an acceptable uniformity level of the ammonia entering the SCR reactor. Due to the variety of the layout geometry and flow characteristics, every application design is developed separately. The preliminary design stages are based upon simulation results, which are sufficient input for the initial shape of the canning and mixers. Further development incorporates prototype validation. At this point, a reliable measurement of ammonia distribution at the SCR inlet is recommended. The results examine the correctness of the design and provide input to simulation improvements.
The experimental uniformity evaluation features challenges that are uncommon for typical automotive emission measurements. The elaboration of a new methodology was needed to meet objective requirements. In contrast to the most common transient emission measurements of light-duty applications, the distribution evaluation is executed under firmly stable conditions. In order to maximize the efficiency of the measurement campaign, a fully automatic sampling device was developed. Coupled with the test cell automation system, it is capable of performing gaseous compound distribution measurements at a rate of 90 positions per hour. Since its elaboration, the procedure has been applied to testing various SCR reactor designs at various engine-operating points. The early test runs were executed twice in order to evaluate their repeatability. Since the reliability of the method was proved, the test runs are executed once.
This research focuses on enhancing the urea evaporation process, shortening the activation time, and elaborating alternative methods of volatile ammonia introduction upstream of the SCR catalyst [16]. The methodology and test results presented here give an insight into the urea uniformity challenge in SCR catalysts and an indication of technical issues related to uneven NH3 distribution.
Author Contributions
R.S. and J.D. conceived and designed the experiments; J.K. performed the experiments; J.K. and J.D. analyzed the data and contributed reagents and materials; J.D. and R.S. wrote the paper.
Acknowledgments
This work was carried out in Engine Testing Laboratory at BOSMAL Automotive Research and Development Institute Ltd., based in Bielsko-Biala, Poland. The funding to conduct the study and the costs for open access publication were covered by BOSMAL.
Conflicts of Interest
The authors declare no conflict of interest.
References
- Yang, L.; Franco, V.; Campestrini, A.; German, J.; Mock, P. NOx Control Technologies for Euro 6 Diesel Passenger Cars; International Council on Clean Transportation: Washington, DC, USA, 2015. Available online: www.theicct.org/nox-tech-euro6-diesel-cars (accessed on 8 March 2018).
- Merkisz, J.; Pielecha, J.; Radzimirski, S. New Trends in Emission Control in the European Union; Springer Tracts on Transportation and Traffic; Springer: Berlin, Germany, 2014; Volume 4. [Google Scholar] [CrossRef]
- Yang, L.; Franco, V.; Mock, P.; Kolke, R.; Zhang, S.; Wu, Y.; German, J. Experimental assessment of NOx emissions from 73 Euro 6 diesel passenger cars. Environ. Sci. Technol. 2015, 49, e14409–e14415. [Google Scholar] [CrossRef] [PubMed]
- Marotta, A.; Pavlovic, J.; Ciuffo, B.; Serra, S.; Fontaras, G. Gaseous emissions from Light-Duty Vehicles: Moving from NEDC to the new WLTP test procedure. Environ. Sci. Technol. 2015, 49, 8315–8322. [Google Scholar] [CrossRef] [PubMed]
- Merkisz, J.; Pielecha, J.; Bielaczyc, P.; Woodburn, J. Analysis of Emission Factors in RDE Tests as Well as in NEDC and WLTC Chassis Dynamometer Tests; SAE Technical Paper 2016-01-0980; SAE: Washington, DC, USA, 2016. [Google Scholar]
- Johnson, T. Vehicular Emissions in Review. SAE Int. J. Engines 2016, 9, 1258–1275. [Google Scholar] [CrossRef]
- McKinley, T.L.; Alleyne, A.G.; Lee, C.F. Mixture non-uniformity in SCR systems: Modeling and uniformity index requirements for steady-state and transient operation. SAE Int. J. Fuels Lubr. 2010, 3, 486–499. [Google Scholar] [CrossRef]
- Brzezanski, M.; Sala, R. A Study on the Indirect Urea Dosing Method in the Selective Catalytic Reduction System; Materials Science and Engineering Volume 148; IOP Publishing: Bristol, UK, 2016. [Google Scholar] [CrossRef]
- Sala, R.; Bielaczyc, P.; Brzezanski, M. Concept of Vaporized Urea Dosing in Selective Catalytic Reduction. Catalysts 2017, 7, 307. [Google Scholar] [CrossRef]
- Song, X.; Naber, J.D.; Johnson, J.H. A study of the effects of NH3 maldistribution on a urea-selective catalytic reduction system. Int. J. Engine Res. 2015, 16, 213–222. [Google Scholar] [CrossRef]
- Weltens, H.; Bressler, H.; Terres, F.; Neumaier, H.; Neumaier, H.; Rammoser, D. Optimisation of Catalytic Converter Gas Flow Distribution by CFD Prediction; SAE Technical Paper 930780; SAE: Warrendale, PA, USA, 1993. [Google Scholar] [CrossRef]
- Nishad, K.; Sadiki, A.; Janicka, J. Numerical Investigation of AdBlue Droplet Evaporation and Thermal Decomposition in the Context of NOx-SCR Using a Multi-Component Evaporation Model. Energies 2018, 11, 222. [Google Scholar] [CrossRef]
- Nova, I.; Tronconi, E. (Eds.) Urea-SCR Technology for DeNOx after Treatment of Diesel Exhaust; Fundamental and Applied Catalysis; Springer: Berlin, Germany, 2014; pp. 467–471. [Google Scholar] [CrossRef]
- Zheng, G.; Fila, A.; Kotrba, A.; Floyd, R. Investigation of Urea Deposits in Urea SCR Systems for Medium and Heavy Duty Trucks; SAE Technical Paper 2010-01-1941; SAE: Warrendale, PA, USA, 2010. [Google Scholar] [CrossRef]
- Koebel, M.; Strutz, E.O. Thermal and hydrolytic decomposition of urea for automative decomposition selective catalytic reduction systems: Thermochemical and practical aspects. Ind. Eng. Chem. Res. 2003, 10, 2093–2100. [Google Scholar] [CrossRef]
- Baleta, J.; Martinjak, M.; Vujanović, M.; Pachler, K.; Wang, J.; Duić, N. Numerical analysis of ammonia homogenization for selective catalytic reduction application. J. Environ. Manag. 2017, 203 Pt 3, 1047–1061. [Google Scholar] [CrossRef] [PubMed]
Figure 1.
Measuring probe positions over the SCR outlet face.

Figure 2.
NOx concentration [ppm] measured at the SCR outlet face without an active water–urea solution (UWS) dose.
Figure 2.
NOx concentration [ppm] measured at the SCR outlet face without an active water–urea solution (UWS) dose.

Figure 3.
Results of test run with an active UWS dose; (a) NH3 concentration [ppm] measured at the SCR outlet face; (b) NOx concentration [ppm] measured at the SCR outlet face.
Figure 3.
Results of test run with an active UWS dose; (a) NH3 concentration [ppm] measured at the SCR outlet face; (b) NOx concentration [ppm] measured at the SCR outlet face.

Figure 4.
Calculated NH3 concentration [ppm] at the SCR inlet face.

Figure 5.
View of a modified SCR reactor and exhaust gas probing system for NH3 and NOx uniformity measurement.
Figure 5.
View of a modified SCR reactor and exhaust gas probing system for NH3 and NOx uniformity measurement.


Table 1.
Engine operation conditions during test run. SCR: selective catalytic reduction.
| Engine Parameter | Setpoint Value |
|---|---|
| Engine speed | 1300 rpm |
| Engine torque | 50 Nm |
| NOx concentration at engine outlet | 200 ppm |
| Exhaust mass flow rate | 70 kg/h |
| Exhaust gas temperature at SCR inlet | 230 °C |
© 2018 by the authors. Licensee MDPI, Basel, Switzerland. This article is an open access article distributed under the terms and conditions of the Creative Commons Attribution (CC BY) license (http://creativecommons.org/licenses/by/4.0/).
Share and Cite
MDPI and ACS Style
Sala, R.; Dzida, J.; Krasowski, J. Ammonia Concentration Distribution Measurements on Selective Catalytic Reduction Catalysts. Catalysts 2018, 8, 231. https://doi.org/10.3390/catal8060231
AMA Style
Sala R, Dzida J, Krasowski J. Ammonia Concentration Distribution Measurements on Selective Catalytic Reduction Catalysts. Catalysts. 2018; 8(6):231. https://doi.org/10.3390/catal8060231
Chicago/Turabian StyleSala, Rafal, Jakub Dzida, and Jaroslaw Krasowski. 2018. "Ammonia Concentration Distribution Measurements on Selective Catalytic Reduction Catalysts" Catalysts 8, no. 6: 231. https://doi.org/10.3390/catal8060231
Note that from the first issue of 2016, this journal uses article numbers instead of page numbers. See further details here.