Simulating Real World Soot-Catalyst Contact Conditions for Lab-Scale Catalytic Soot Oxidation Studies


1
Department of Chemical & Biomolecular Engineering, University of Notre Dame, Notre Dame, IN 46556, USA
2
Cummins Inc., 1900 McKinley Ave., Columbus, IN 47201, USA
*
Authors to whom correspondence should be addressed.
Catalysts 2018, 8(6), 247; https://doi.org/10.3390/catal8060247
Submission received: 1 June 2018
/
Revised: 10 June 2018
/
Accepted: 12 June 2018
/
Published: 14 June 2018
(This article belongs to the Special Issue Catalytic Oxidation in Environmental Protection)
Abstract
:In diesel soot oxidation studies, both well-defined model soot and a reliable means to simulate realistic contact conditions with catalysts are crucial. This study is the first attempt in the field to establish a lab-scale continuous flame soot deposition method in simulating the “contact condition” of soot and a structured diesel particulate filter (DPF) catalyst. The properties of this flame soot were examined by means of X-ray diffraction (XRD) and transmission electron microscopy (TEM) for structure analysis, Brunauer-Emmett-Teller (BET) for surface area analysis, and thermogravimetric analysis (TGA) for reactivity and kinetics analysis. For validation purposes, catalytic oxidation of Tiki® soot using the simulated contact condition was conducted to compare with the diesel particulates collected from a real diesel engine exhaust system. It was found that the flame soot is more uniform and controllable than similar samples of collected diesel particulates. The change in T50 due to the presence of the catalyst is very similar in both cases, implying that the flame deposit method is able to produce comparably realistic contact conditions to that resulting from the real exhaust system. Comparing against the expensive engine testing, this novel method allows researchers to quickly set up a procedure in the laboratory scale to reveal the catalytic soot oxidation properties in a comparable loose contact condition.

1. Introduction
Diesel soot consists of agglomerates with diameters of up to several hundred nanometers and a fine structure of spherical primary particles. Unlike the well understood formation of NOx in internal combustion engines, the formation of soot is still more ambiguous because the process is more complicated and difficult to examine [1]. For example, the characterization of diesel particulates from a particular engine at different operational conditions may vary considerably due to variations in combustion parameters [2] and diesel fuels [3]. Laboratory studies often utilize diffusion flames in burners, because the soot formation processes in burner diffusion flames are thought to be fundamentally similar to those in diesel engines [4] with sequential nucleation, growth and agglomeration steps taking place. Therefore, various flame-formed soots [5,6,7,8] have been used as model diesel soot in studies. Among these, the commercial carbon black substitute Printex-U has been extensively used. It is generally accepted that the particle size, surface area and overall reactivity of Printex-U carbon black tends to be very similar to diesel soot, and it can usually generate good reproducibility.
Until recently, the impact of soot nanostructure on reactivity has not drawn much attention [7,8,9,10]. Vander Wal et al. found by means of transmission electron microscopy (TEM) that the structural differences of soot/carbon at a nanoscale level (i.e., dimension and orientation of the graphitic layers) affect its oxidation reactivity [8,9]. Other recent studies showed that the intrinsic oxidation rate of pyrolysis soot might vary from different fuels (such as benzene, ethanol, and acetylene), resulting in differences in soot nanostructure [7,11,12]. Moreover, it has been speculated that peculiar nanostructures, such as amorphous and shell/core formations, are present in the soot formation process [13]. Amorphous nanostructures are related to soot particles and have been identified mainly in less developed soot particles and condensed species [14,15]. The study of soot nanostructure is important for both correlating reactivity and simulating non-catalytic/catalytic soot oxidation in exhaust systems.
Comparisons of the kinetic parameters of non-catalytic soot oxidation with those of catalytic soot oxidation have been made by many researchers to evaluate the effectiveness of soot oxidation catalysts, and the obtained kinetics information can also reveal the mechanism of soot oxidation reactions. However, the reported activation energy for non-catalytic soot oxidation ranges from 92 to 211 kJ/mol since the employed experimental techniques and conditions vary from one group to another. Yezerets et al. [16] compared the oxidative reactivity of diesel soot and carbon black, and the activation energies were found to be 92 and 117 kJ/mol, respectively. In another study of soot samples from different engine conditions [17], the activation energies for the soot with ash contents of 14 and 6.5% were found to be 126 and 146 kJ/mol, respectively. A recent study by Strzelec et al. [11] showed that the activation energy for diesel soot is 113 ± 6 J/mol. Hence, it seems the kinetic parameters for soot oxidation cannot simply be compared from one study to another due to the differences in the nature of the soot and the experimental conditions of the reactors (i.e., the mass and heat transfer limitations).
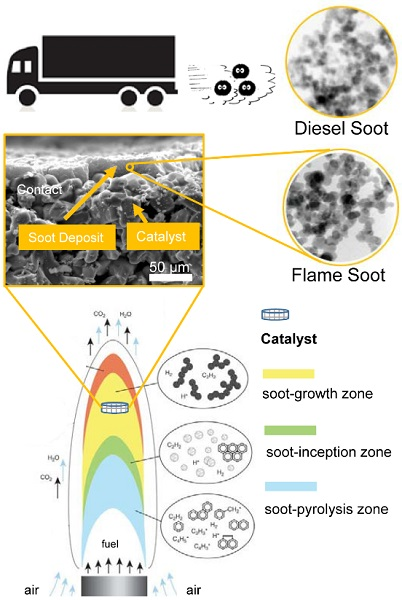
In soot oxidation studies, both well-defined model soot and a reliable means to simulate realistic contact conditions with catalysts are crucial. In catalytic soot oxidation studies, the “contact condition” refers to the nature of the contact between the soot and catalyst, with the contact range varying from “tight” to “loose”. The realistic contact condition obtained by in-situ collection on a DPF in an exhaust system is considered as “loose” contact [18,19]. Replicating this condition in laboratory studies can be challenging. In lab-scale studies, thermogravimetric analysis (TGA) has usually been used to characterize soot oxidation behavior, permitting relatively straightforward examination of kinetics during heating [4]. When the catalysts under study are in a powder form, loose contact can be simulated by gently mixing the soot and catalyst powders with a spatula [5,20] or gently shaking the sample container with catalyst/soot mixture [5,21,22]. However, these methods are not appropriate for study of catalysts incorporated onto complex support material shapes (e.g., porous cordierite/SiC filters).
In the present study, it was anticipated that producing flame soot with a Tiki© torch oil lamp and capturing the soot directly onto a catalyst/support structure would yield a contact condition simulating realistic conditions. The properties of this flame soot were examined by means of XRD and TEM for structure analysis, BET for surface area analysis, and TGA for reactivity and kinetics analysis. The flame soot is thought to be more uniform and controllable than similar samples of collected diesel particulates. For validation purposes, catalytic oxidation of Tiki© soot using the simulated contact condition was compared with the diesel particulates collected from a real diesel engine exhaust system.
2. Results
2.1. The Nature of Soots
Table 1 shows the results of elemental analysis (C, N, H, S) performed on a Costech ECS-4010 elemental analyzer. The results reveal that the majority of constituents in diesel particulates and model soot were carbon, oxygen, and hydrogen, with low concentrations of nitrogen and sulphur. In comparison, the contents of N, H, and O (contributed from hydrocarbon and adsorbents) in engine soot are significantly higher than those in the model soot. The change of elemental compositions for flame soot collected at different flame heights is negligible.
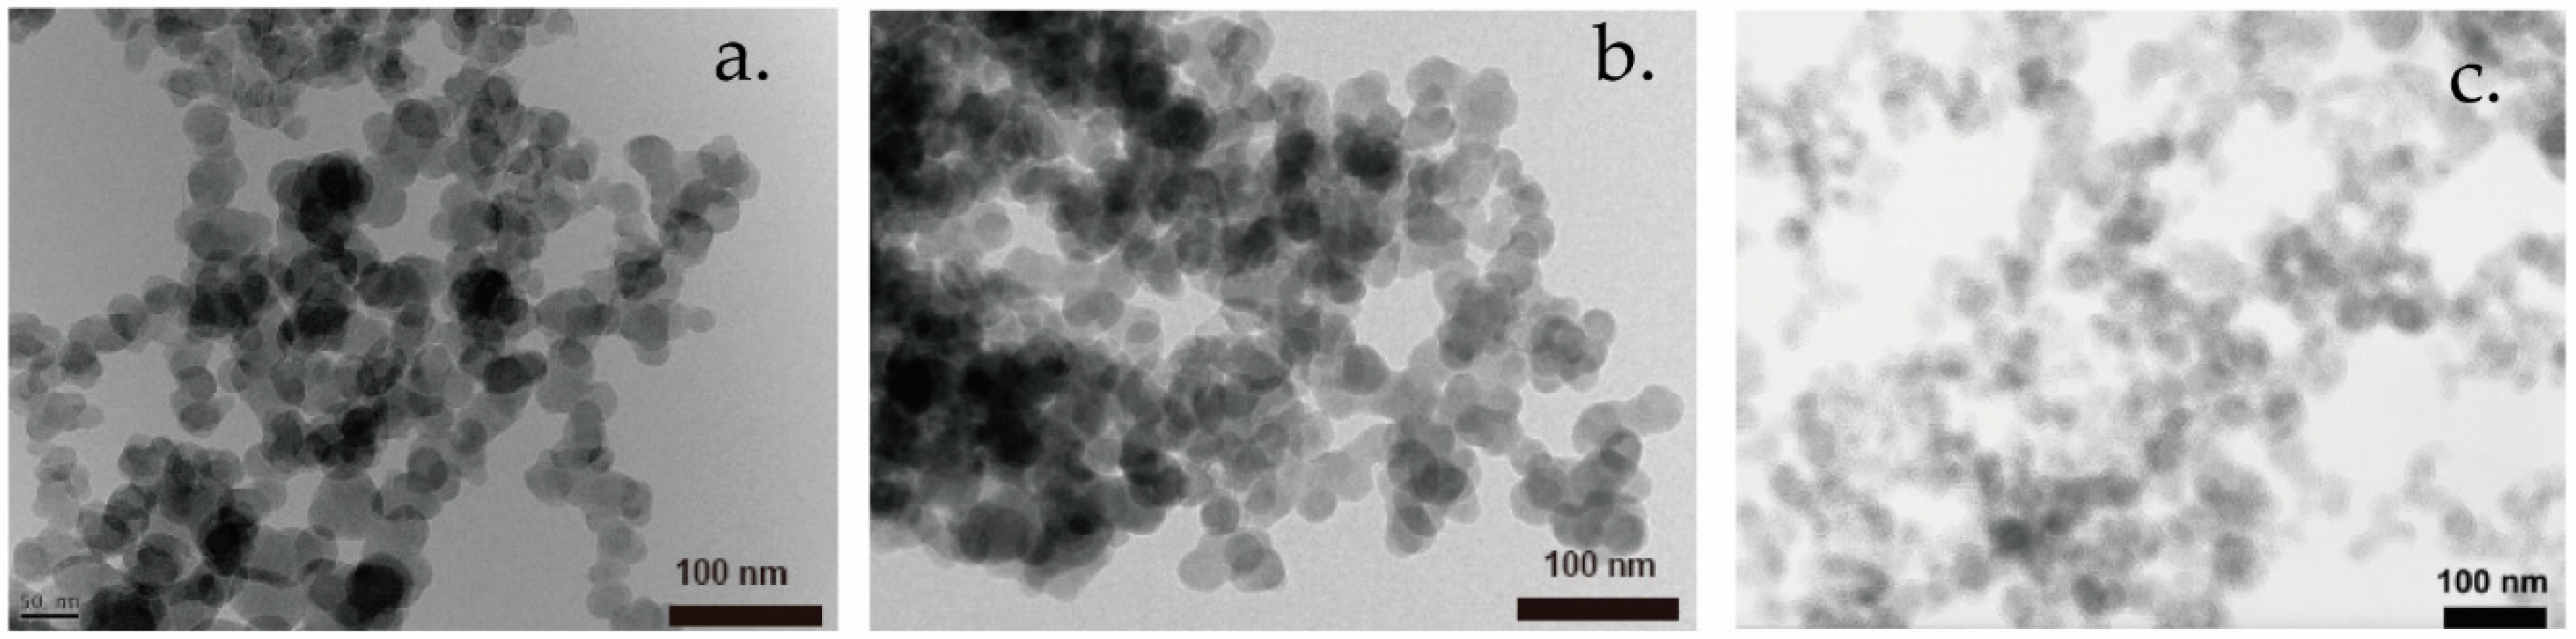
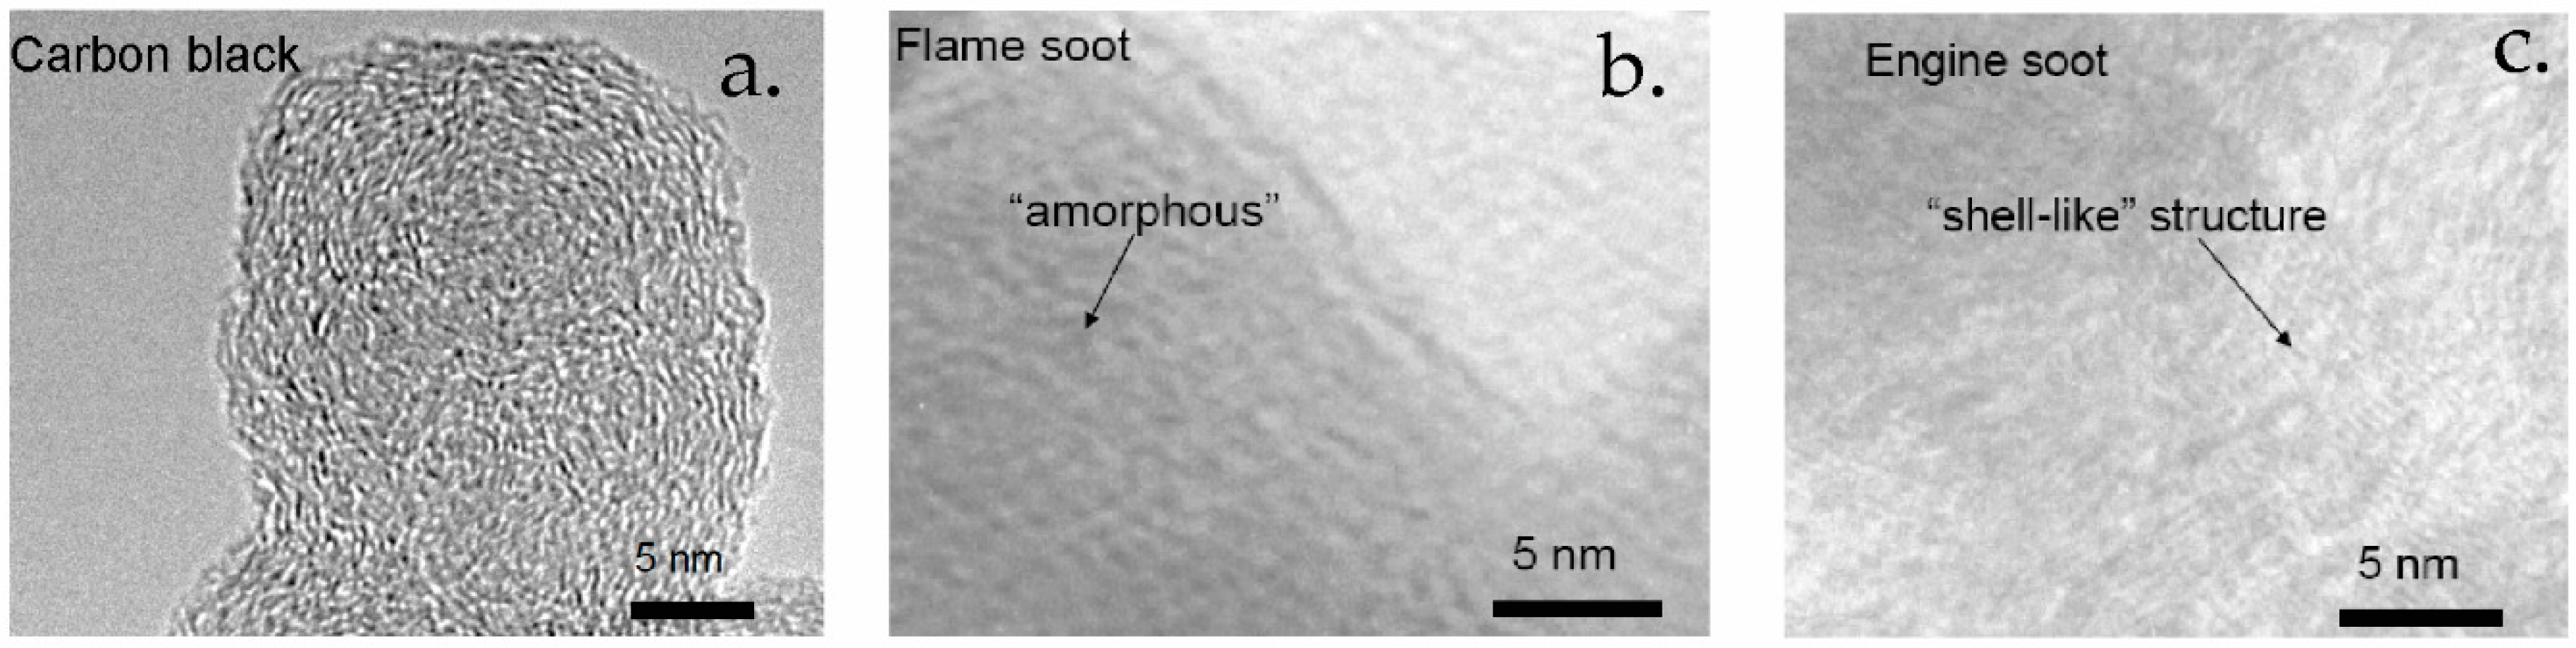
Figure 1 shows TEM images of Printex-U carbon black (CB), Tiki© flame soot FS100, and engine diesel soot (DS). It can be determined that there is a range of particles sizes and the average particle sizes for CB, FS100, and DS are 35 nm, 45 nm, 30 nm respectively. The FS100 particles exhibit slightly larger aggregate and particle size than CB and DS. Figure 2a–c depict the high-resolution transmission electron microscopy (HRTEM) images of carbon black (CB), flame soot FS100, and real engine soot (DS) respectively. In these images, the graphene layer segments comprising the crystallite stacks are observed as the dark lines blocking/scattering the incident electron beam [10]. The flame derived soot (Figure 2b) exhibits short, individual graphene segments that appear to have no orientation relative to each other. Therefore, the flame soot possesses little long-range order and no discernable crystallite structure. This lack of structure is characteristic of disordered carbon. In contrast, the engine soot shown in Figure 2c has extended carbon lamellae, many of which are oriented parallel to each other and approximately parallel to the particle surface, characteristic of a crystalline structure. For comparison, the HRTEM image of Printex-U carbon black shown in Figure 2a presents a typical carbon soot nanostructure. Some particles clearly show a recognizable central nucleus. The lamellae can distinctly be seen and show less stacking order while being shorter than in the engine soot particles.
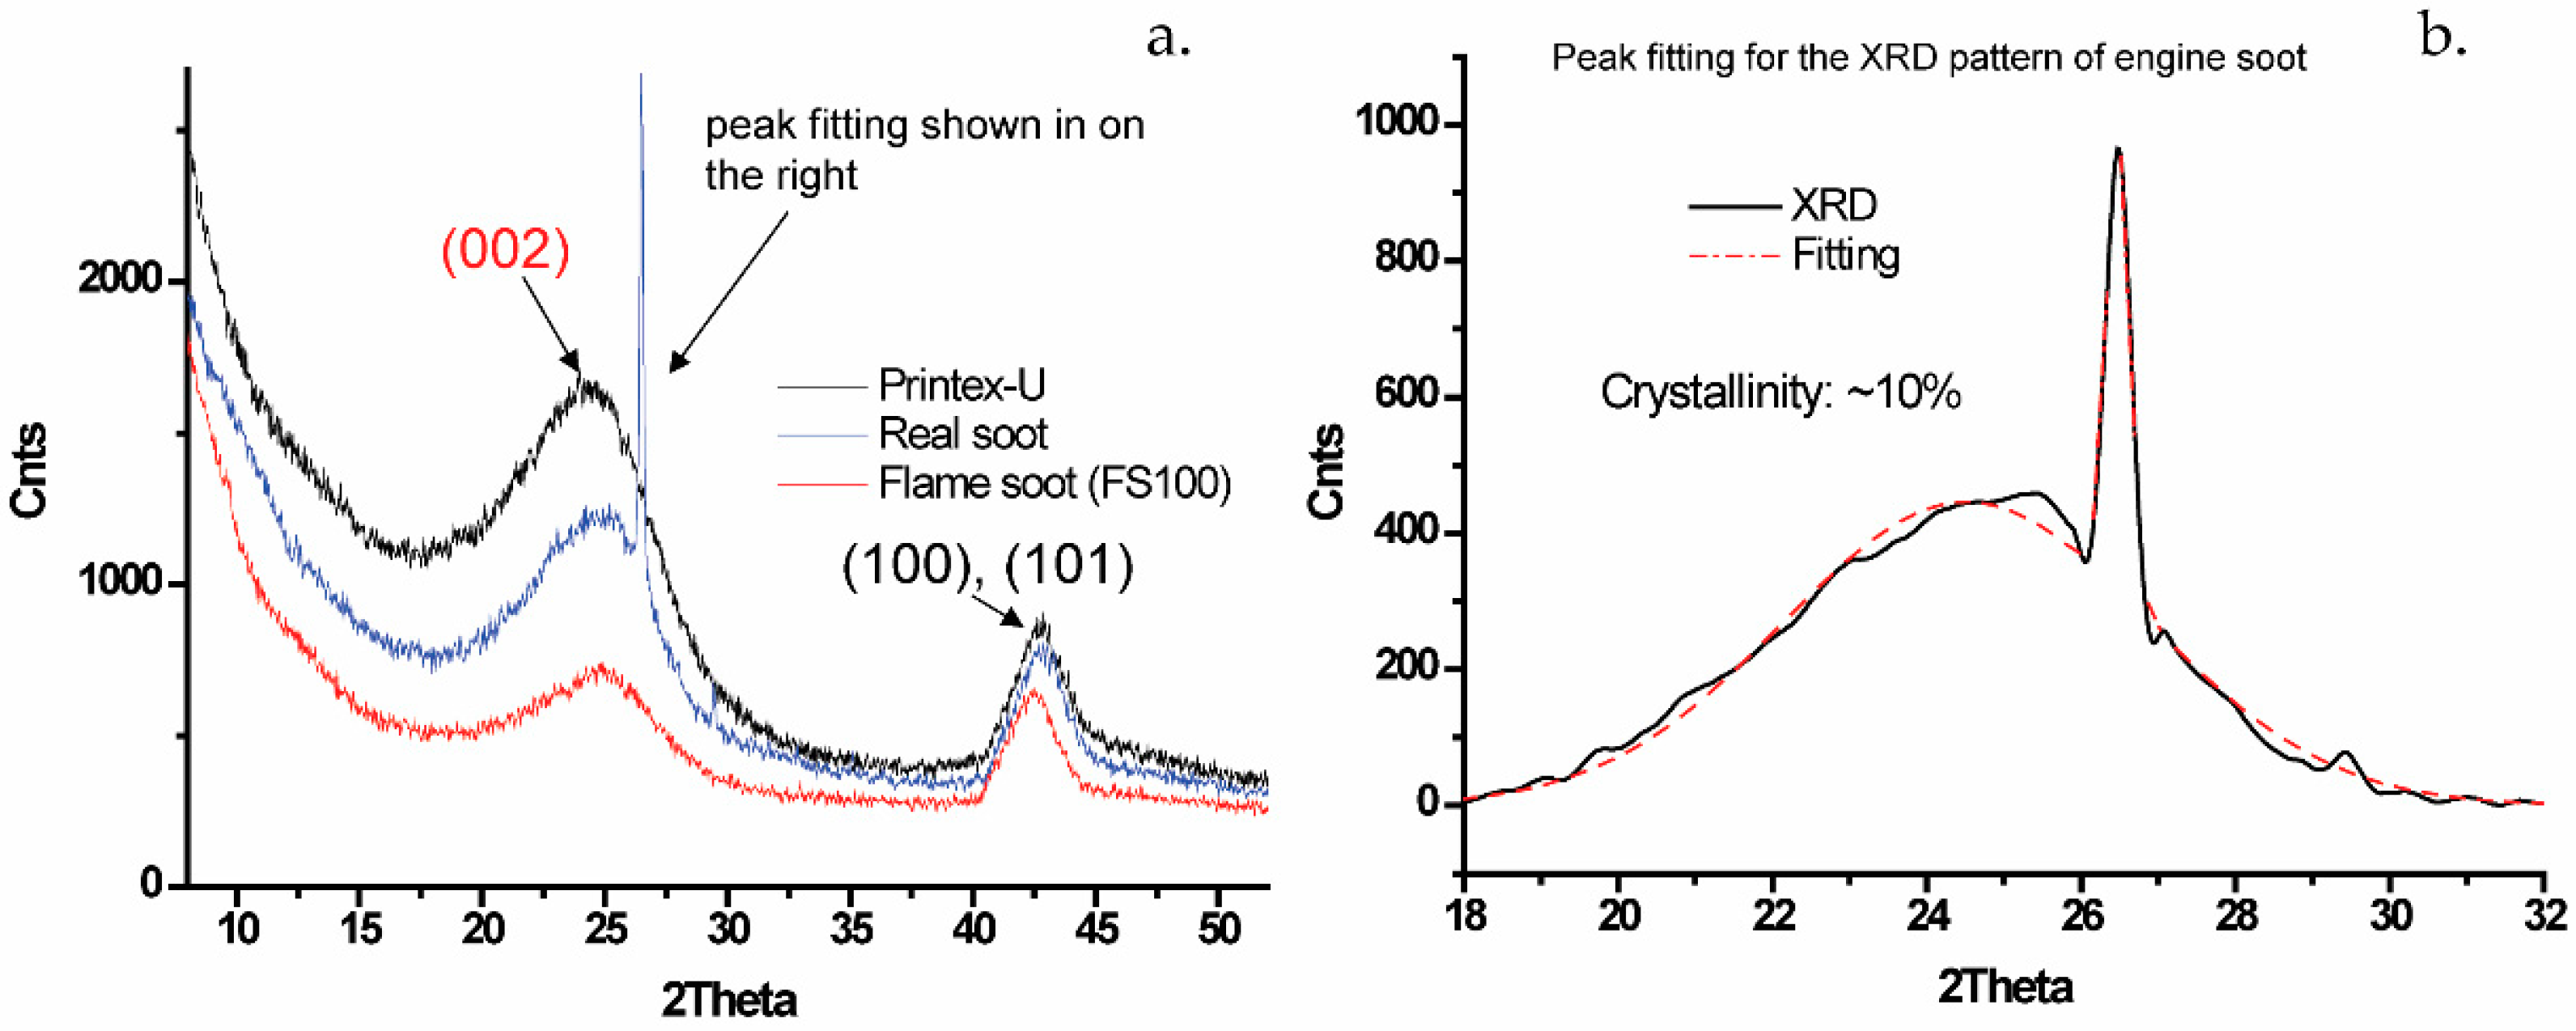
Figure 3a shows the XRD patterns of the Tiki flame soot FS100, carbon black and diesel soot. All samples show diffraction maxima associated with the (002) and (100) planes. The broad peaks and diffuse nature of the XRD profiles indicate the presence of amorphous carbon. The first peak of the profile corresponds to the (002) peak of the ordered hexagonal graphite structure. The second peak corresponds to the (100) and (101) peaks. Before analysis the diffraction profiles were corrected for absorption and normalization [23]. The corrected intensities of the samples were then used for further quantitative analysis, including the average crystalline diameter (via the Scherrer equation) and the fraction of crystallinity.
The crystallinity of carbon in the soot was obtained from the integrated intensities of the (002) reflection peak and the amorphous hump background in the range of 2θ = 18–32°. Both the flame soot FS100 and Printex-U carbon black are mostly amorphous phase with obvious diffraction peaks being absent, while the real engine soot presents a sharp diffraction peak at 2θ = 26.5°. Figure 3b shows the final fit of the XRD pattern of real engine soot in the angular range 2θ = 18–32°. Prior to ascribing the peak to graphitic component, we carefully examined XRD patterns of impurities from engine exhaust (e.g., ash powders) with Si powders as the standard reference. The crystallinity of the real soot sample can be calculated from the integrated intensities of the apparent diffraction peak (A) and the amorphous hump (B), and the calculated crystallinity of engine soot was approximately 10%.
Lc and La represent the crystalline heights of carbon grain along the c-axis and the a-axis respectively. Table 2 compares the calculated crystal parameters for various soots, where K = Lc/d002 and denotes the average number of layers per crystal. The values of d002 for carbon black and flame soot are all substantially greater than that reported for crystalline layered hexagonal graphite (3.354 nm) [PDF#751621]. For the real diesel soot, both an amorphous hump and a broadened peak are present at the (002) position, and the corresponding d002 are 3.593 and 3.364 respectively. This implies that the real diesel soot is partially crystallized, being a mixture of amorphous carbon and nanoscale graphite-like carbon. The change of d002 for flame soot collected at different heights is negligible because all soot samples were collected above the inception zone where the soot formation is thought to be complete [23]. Meanwhile, the d002 for both flame soot samples and commercial Printex-U are comparable with the d002 of the amorphous phase in real engine soot, at a value of 0.358~0.360 nm.
The crystallite heights (Lc) of Printex-U and flame soot were found to be smaller than that of engine soot. Additionally, the Lc of the flame soot was found to be constant at 1.41~1.42 nm as the flame height increased. According to Hurt et al. [13], face-to-face association of the graphene sheets is favored at low temperatures over edge-to-edge coalescence. Hence, the conditions during soot formation might be the main factor causing the differences in the structural parameter of different soot. Conversely, the change of crystallite width (La) is negligible for all soot.
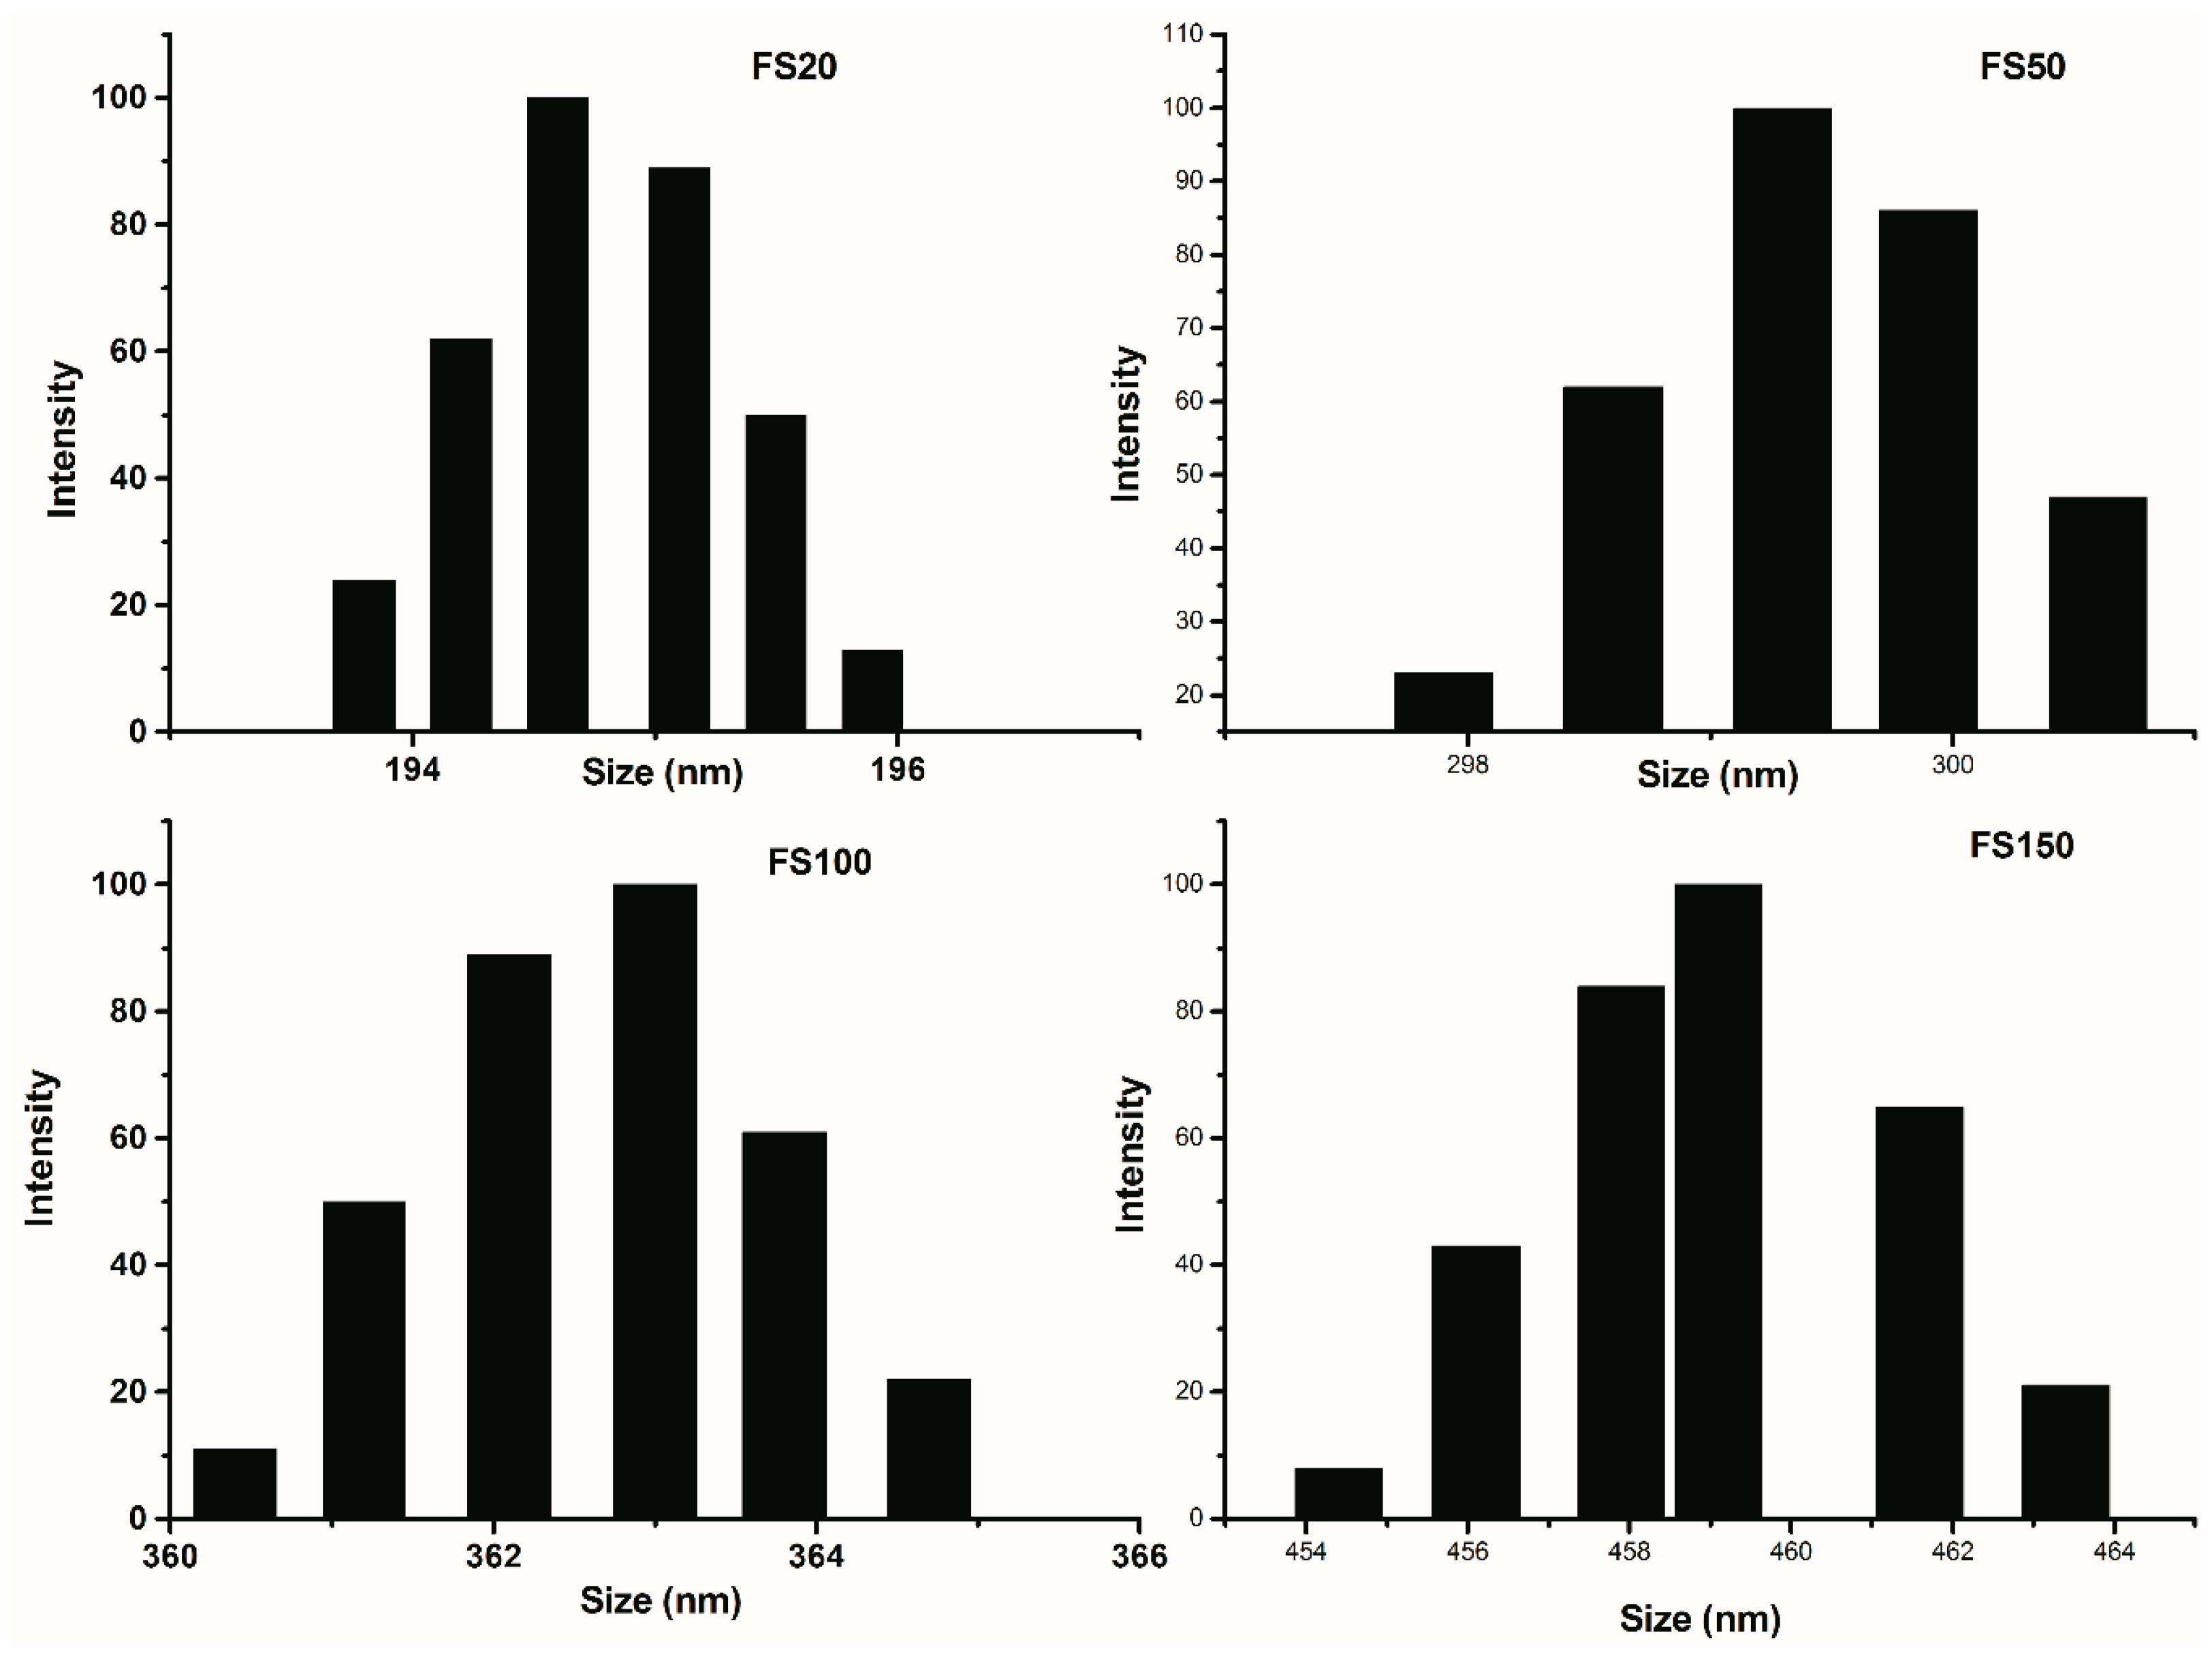
While crystalline parameters do not change with respect to flame height, it appears that agglomerate size does. Figure 4 shows the size distribution of agglomerates for the soot collected from different flame heights. It was found that the soot from the lowest flame height has smaller agglomerates with a mean size of 195 nm. The agglomerates grow to 460 nm when the flame height is 15 cm from the burner.
2.2. Temperature-Programmed-Oxidation (TPO)
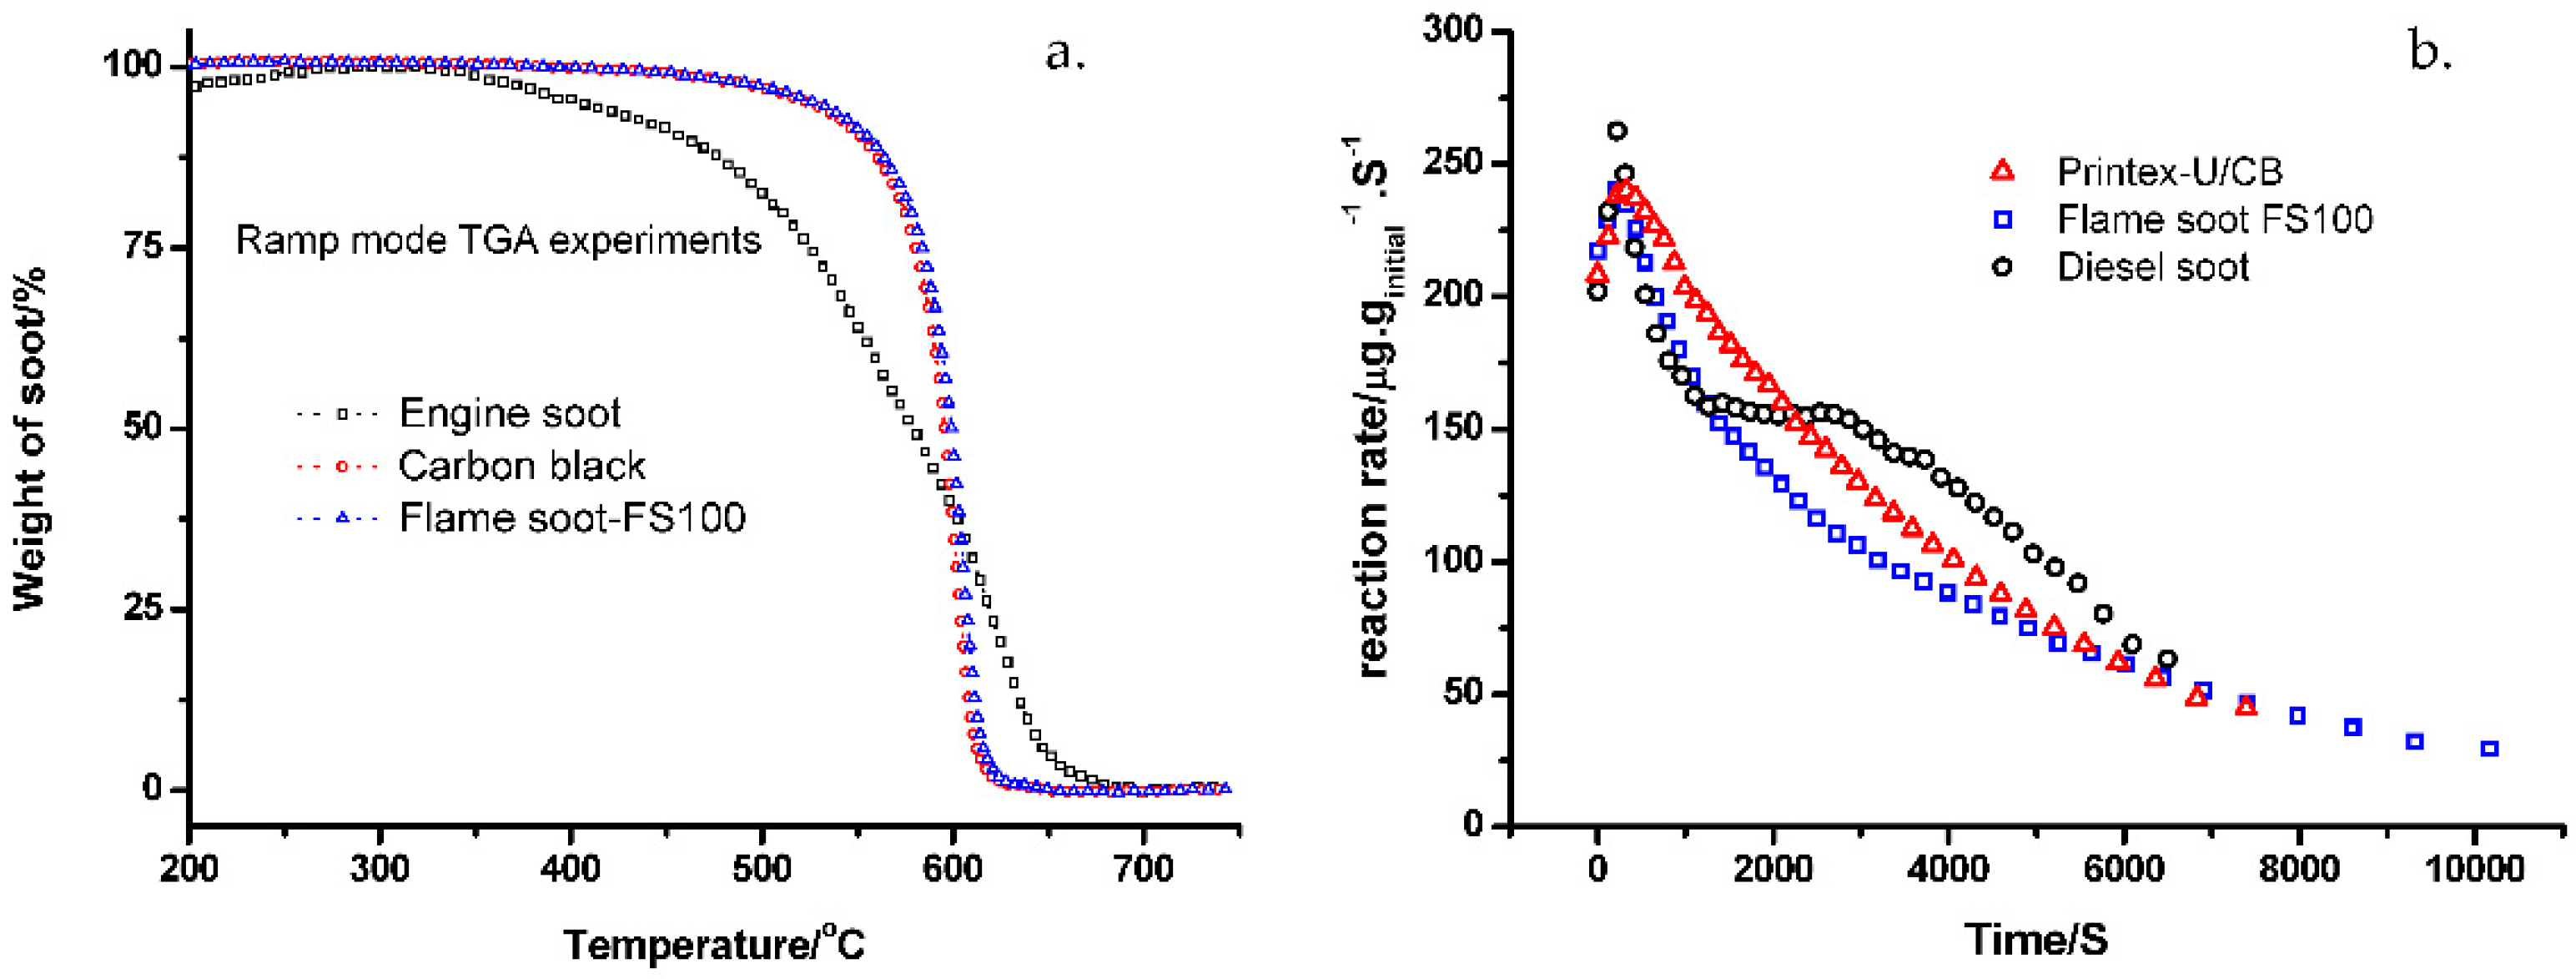
Figure 5a shows the non-catalytic oxidation curves for Printex-U carbon black, FS100 and engine soot. Samples were heated at 20 °C/min in a 10% O2 gas flow. For real engine soot, two regions of mass loss were observed. In the lower temperature region from 300–500 °C, around 20~25% weight loss resulted from the oxidation of adsorbed hydrocarbons (HCs), while in the higher temperature region from 500–650 °C, carbon soot was burned off. Both flame soot FS100 and Printex-U carbon black have relatively low amounts of HCs, and only one region of weight loss was observed from 550–650 °C. The Tig for FS100 and Printex-U carbon black are 575 °C and 580 °C respectively. It was also found that the engine soot showed a higher combustion completion temperature than flame soot FS100 and Printex-U carbon black.
Typical uncatalyzed isothermal oxidation (at 525 °C) results for Printex-U carbon black, flame soot FS100 and real soot are shown in Figure 5b. For all combustion data, the reaction rates reach a maximum at approximately 5% conversion, most likely due to the lag after switching from inert gas to the oxidizing reaction gas. The reaction rates usually remain relatively high during the initial 10% conversion, and this can be attributed to oxidation of more reactive species in the soot (e.g., absorbed HCs) during this stage of the experiment. The curves of reaction rate versus conversion for Printex-U carbon black and flame soot FS100 show an exponential-like behavior, while the reaction rate of diesel soot shows a plateau in the conversion range of 0.25–0.55. This plateau is also visible in other combustion curves of diesel soot at different temperatures.
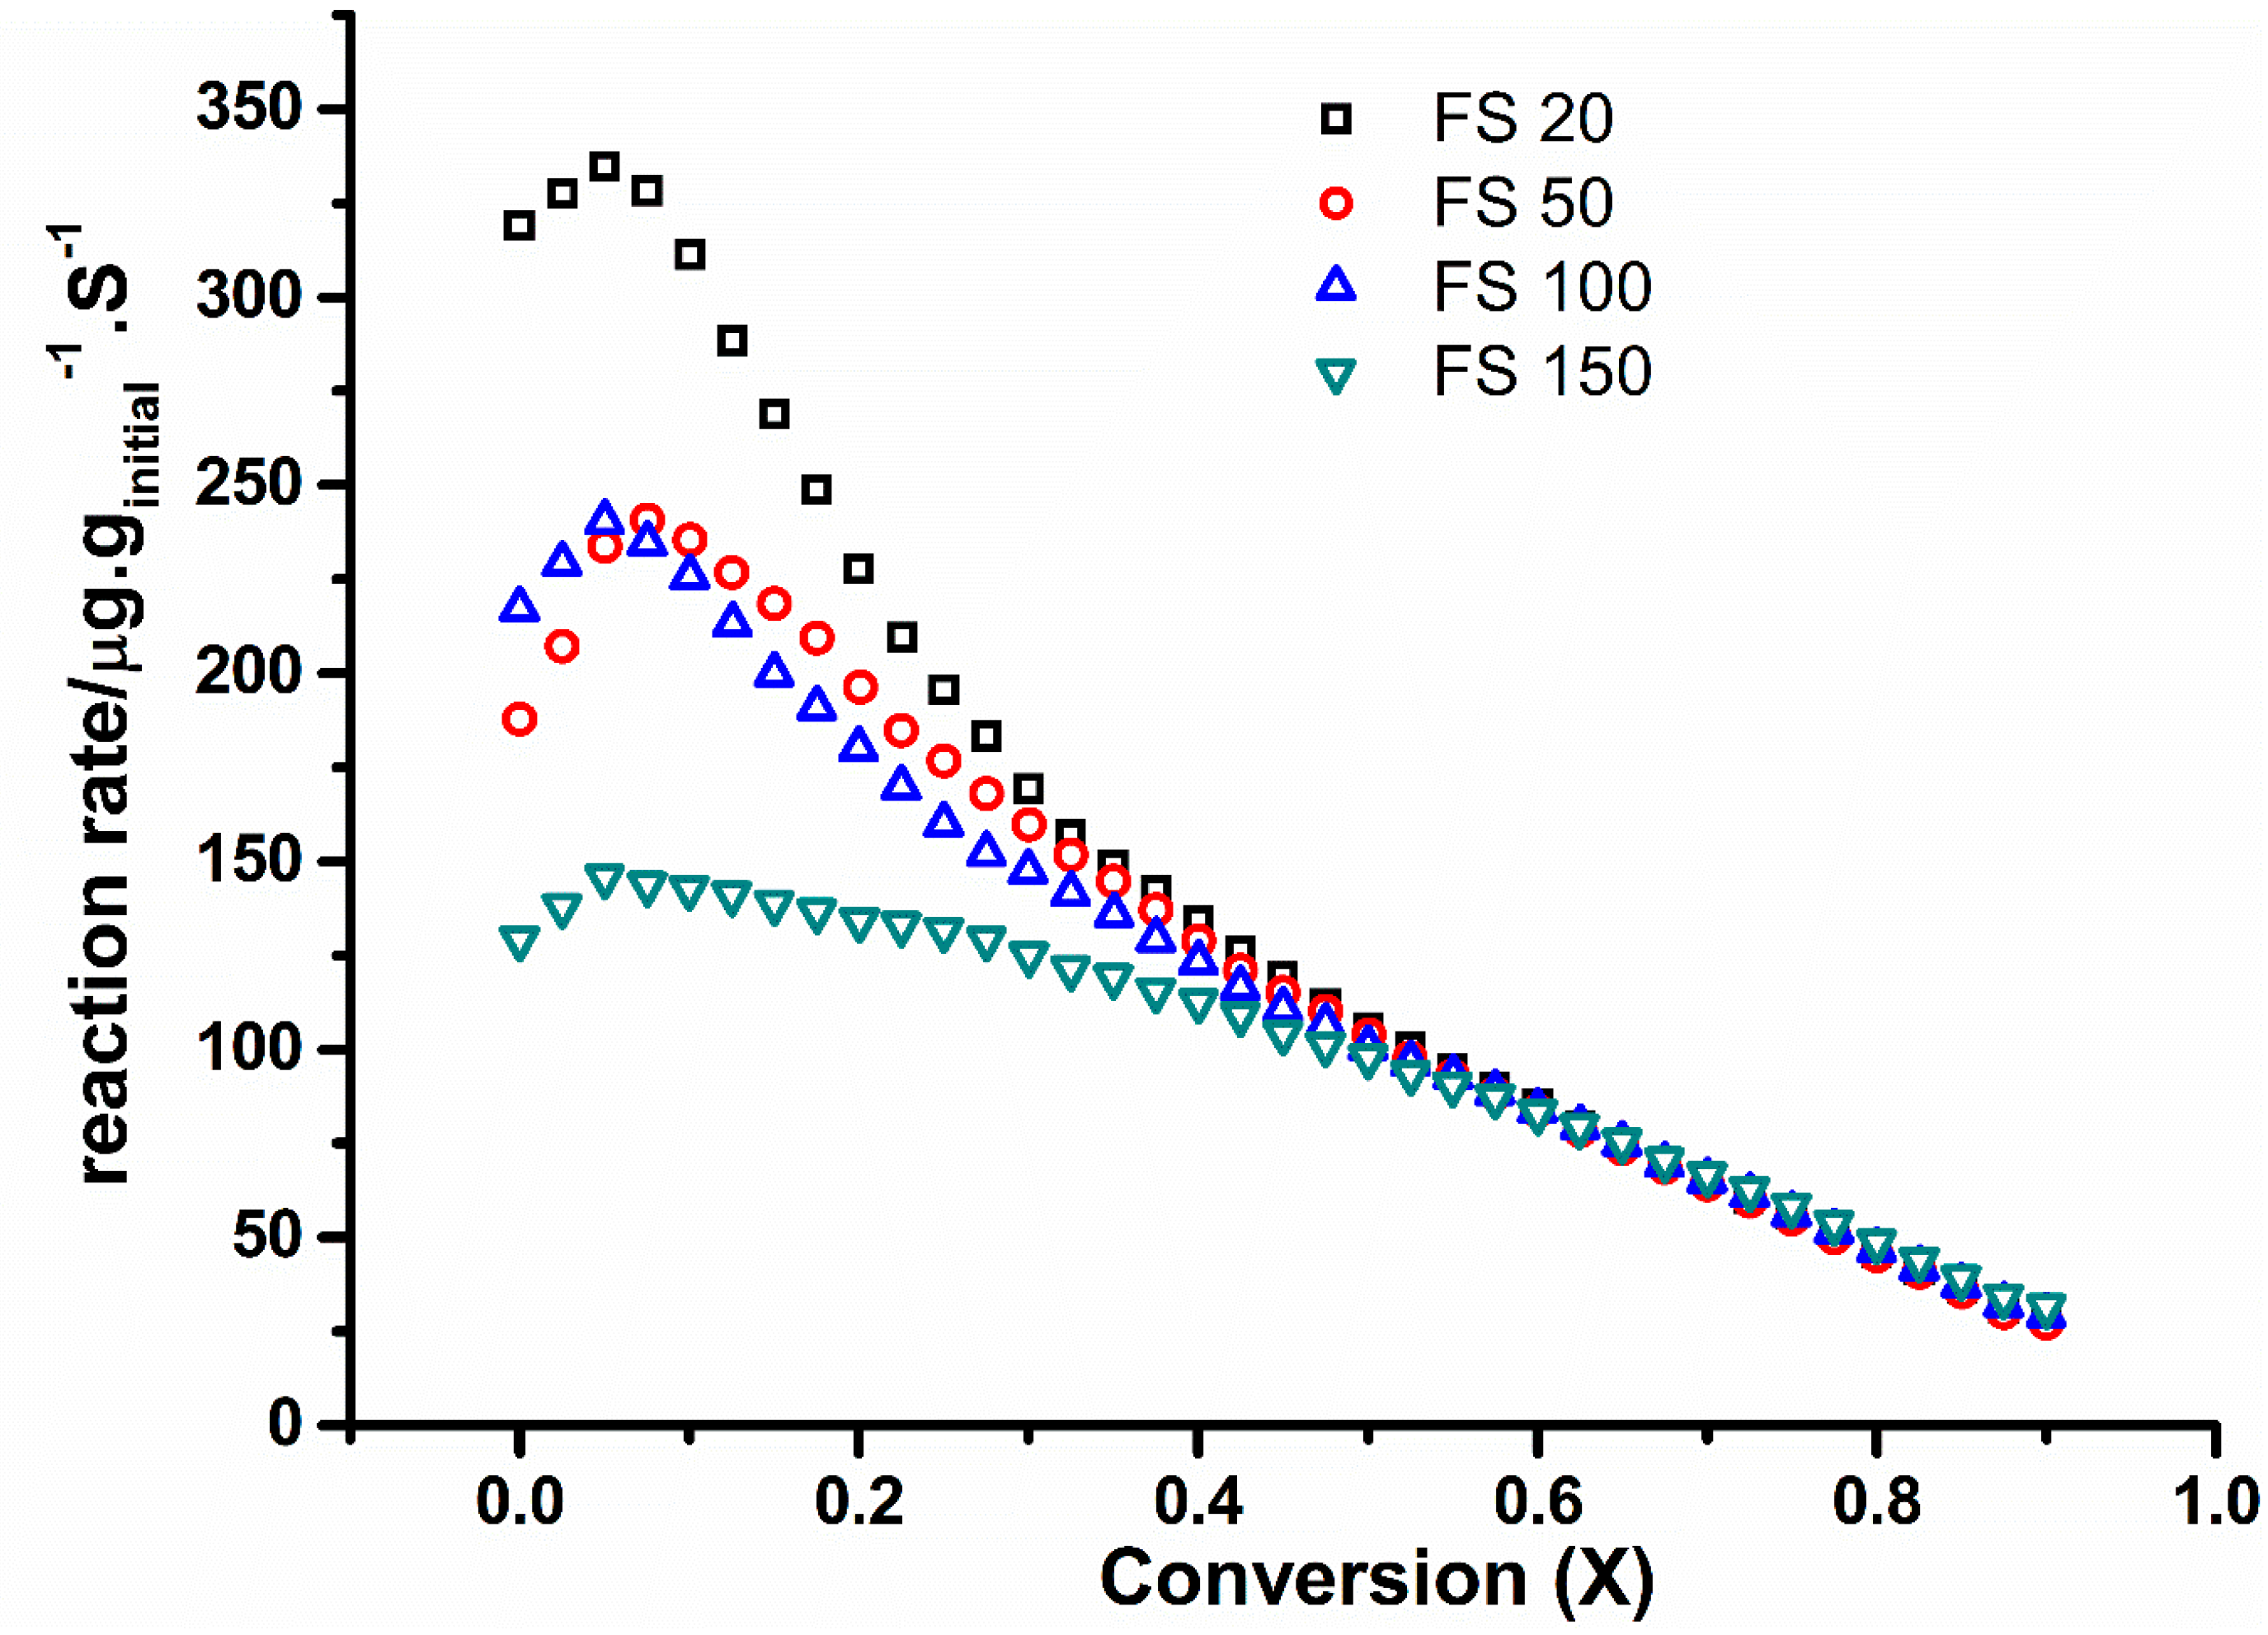
Figure 6 shows the oxidation curves for flame soot samples that were collected from different flame heights. The initial reaction rates increased with decreasing distance from the burner. The maximum reaction rate for FS20 is more than double that of FS150, whereas for FS50 and FS100 the reaction rates are very similar. When the conversions were larger than 0.4, the oxidation curves for all samples dropped to a comparable range. A correlation between the oxidation behavior and distance from the burner is discussed below.
2.3. Kinetics Analysis Based on Nonisothermal Experiments
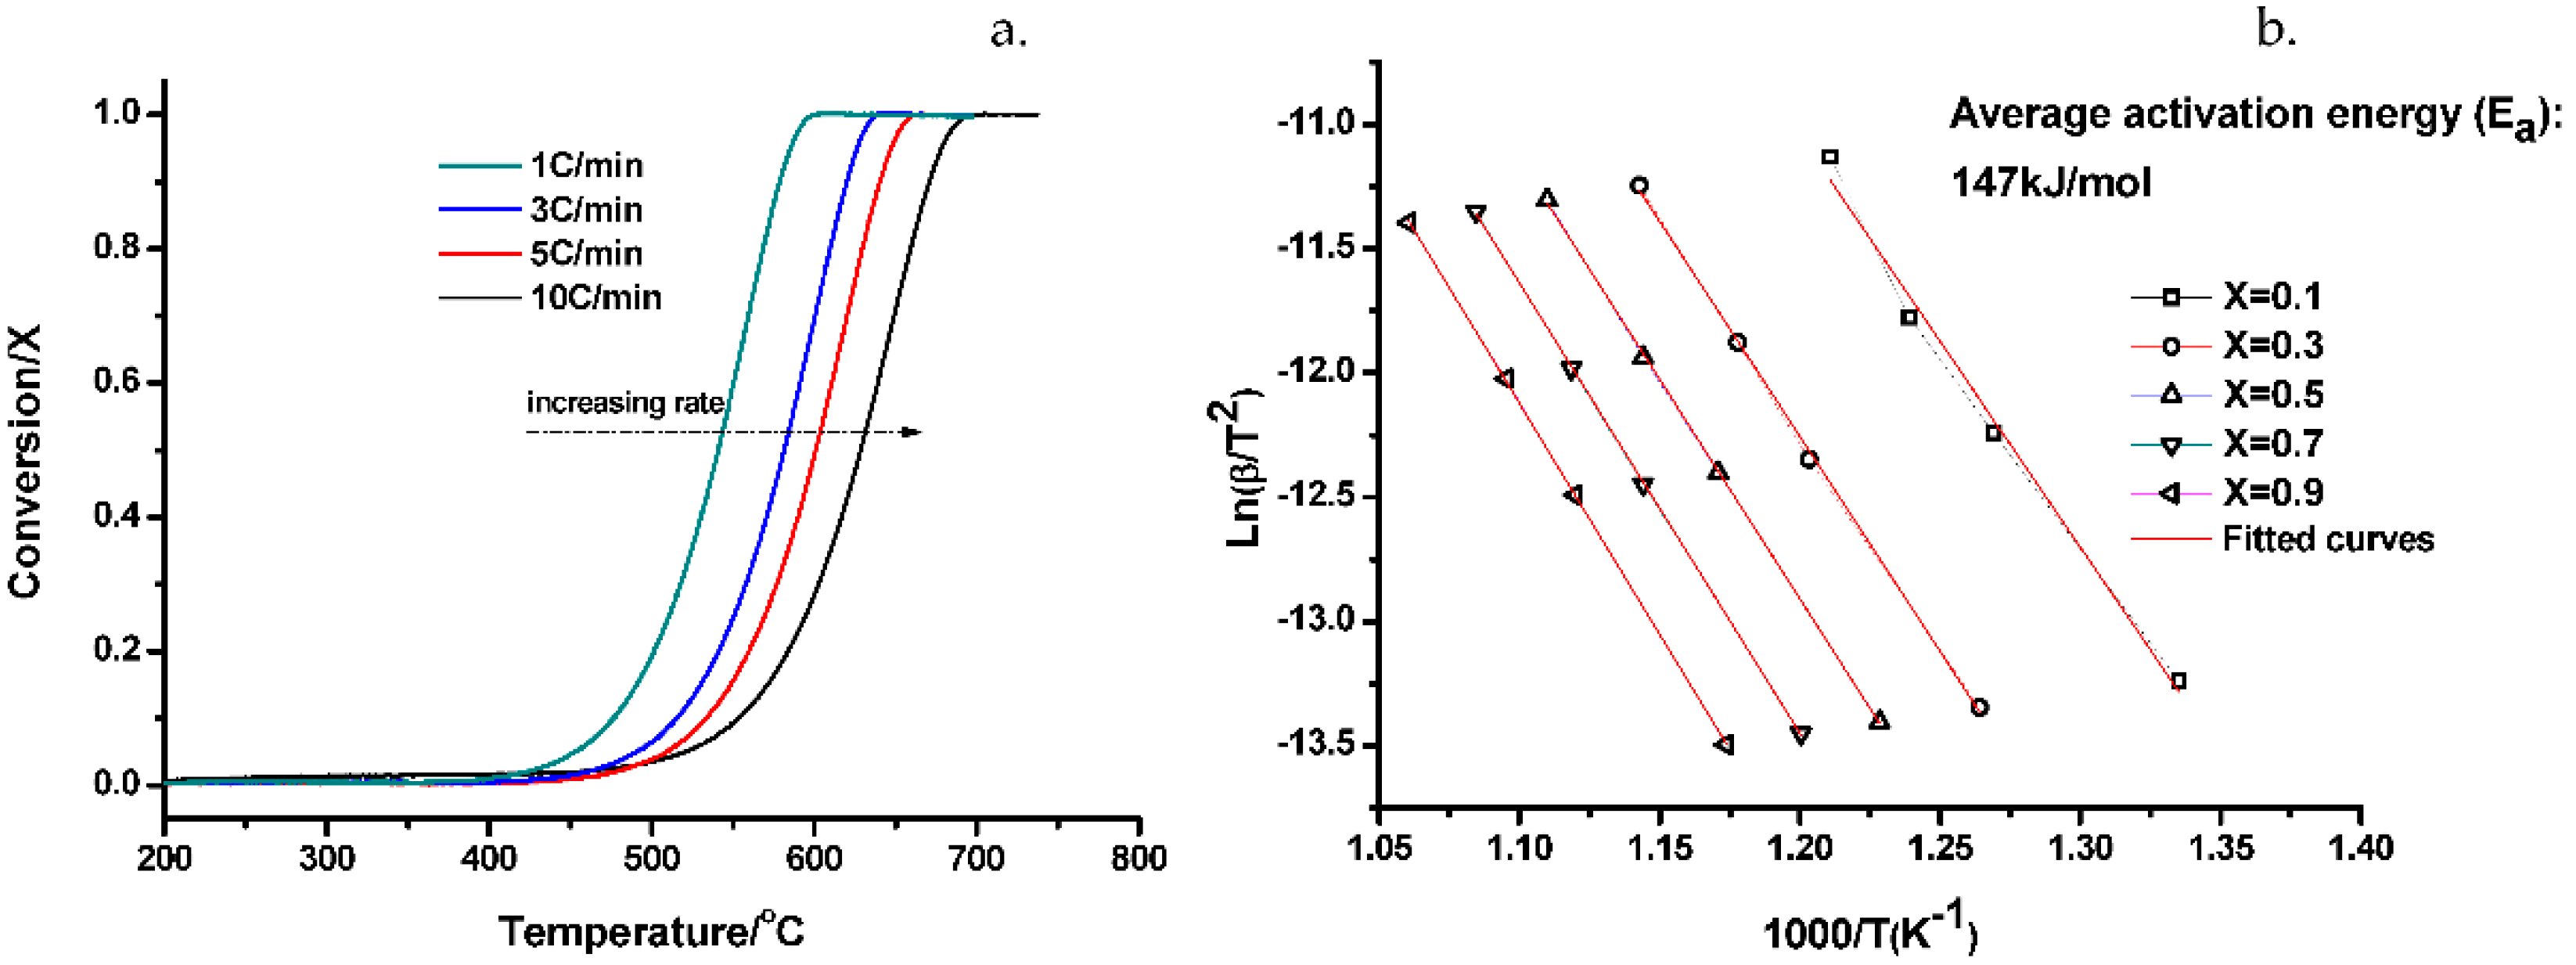
The conversion–temperature TGA curves for flame soot FS100 recorded at various constant heating rates are shown in Figure 7a. When the model-free kinetic analysis method was applied, the apparent activation energy (Ea) was determined from the slope of versus 1/T at a constant X value (X is the extent of conversion). The corresponding results are shown in Figure 7b.
The conversion vs. temperature TGA curves showed a noticeable dependence on the heating rate, such that the conversion curves were shifted to higher temperatures at higher heating rates. The activation energies and pre-exponential factors at different degrees of conversion were calculated, and it was found that the activation energy varied with the extent of conversion from 137.4 kJ/mol to 154.3 kJ/mol with a mean value of 147 kJ/mol.
The noticeable dependence of the activation energy on the extent of conversion (X) indicated that the assumption of a single-step reaction is not accurate enough in the case of flame soot oxidation. A similar variation of Ea at different conversion levels was also observed for Printex-U carbon black and real engine soot, and the mean values of Ea for these soot samples were 145 kJ/mol and 137 kJ/mol respectively.
2.4. Kinetic Analysis from Isothermal Studies (nth Order Model)
A comparative kinetics study was performed under isothermal conditions for non-catalytic oxidation of FS100. The reaction order of carbon can be determined from a series of isothermal oxidation curves at different temperatures with fixed oxygen partial pressure (10 vol % oxygen in nitrogen). The influence of oxygen partial pressure was studied in the range of 10–40% O2.
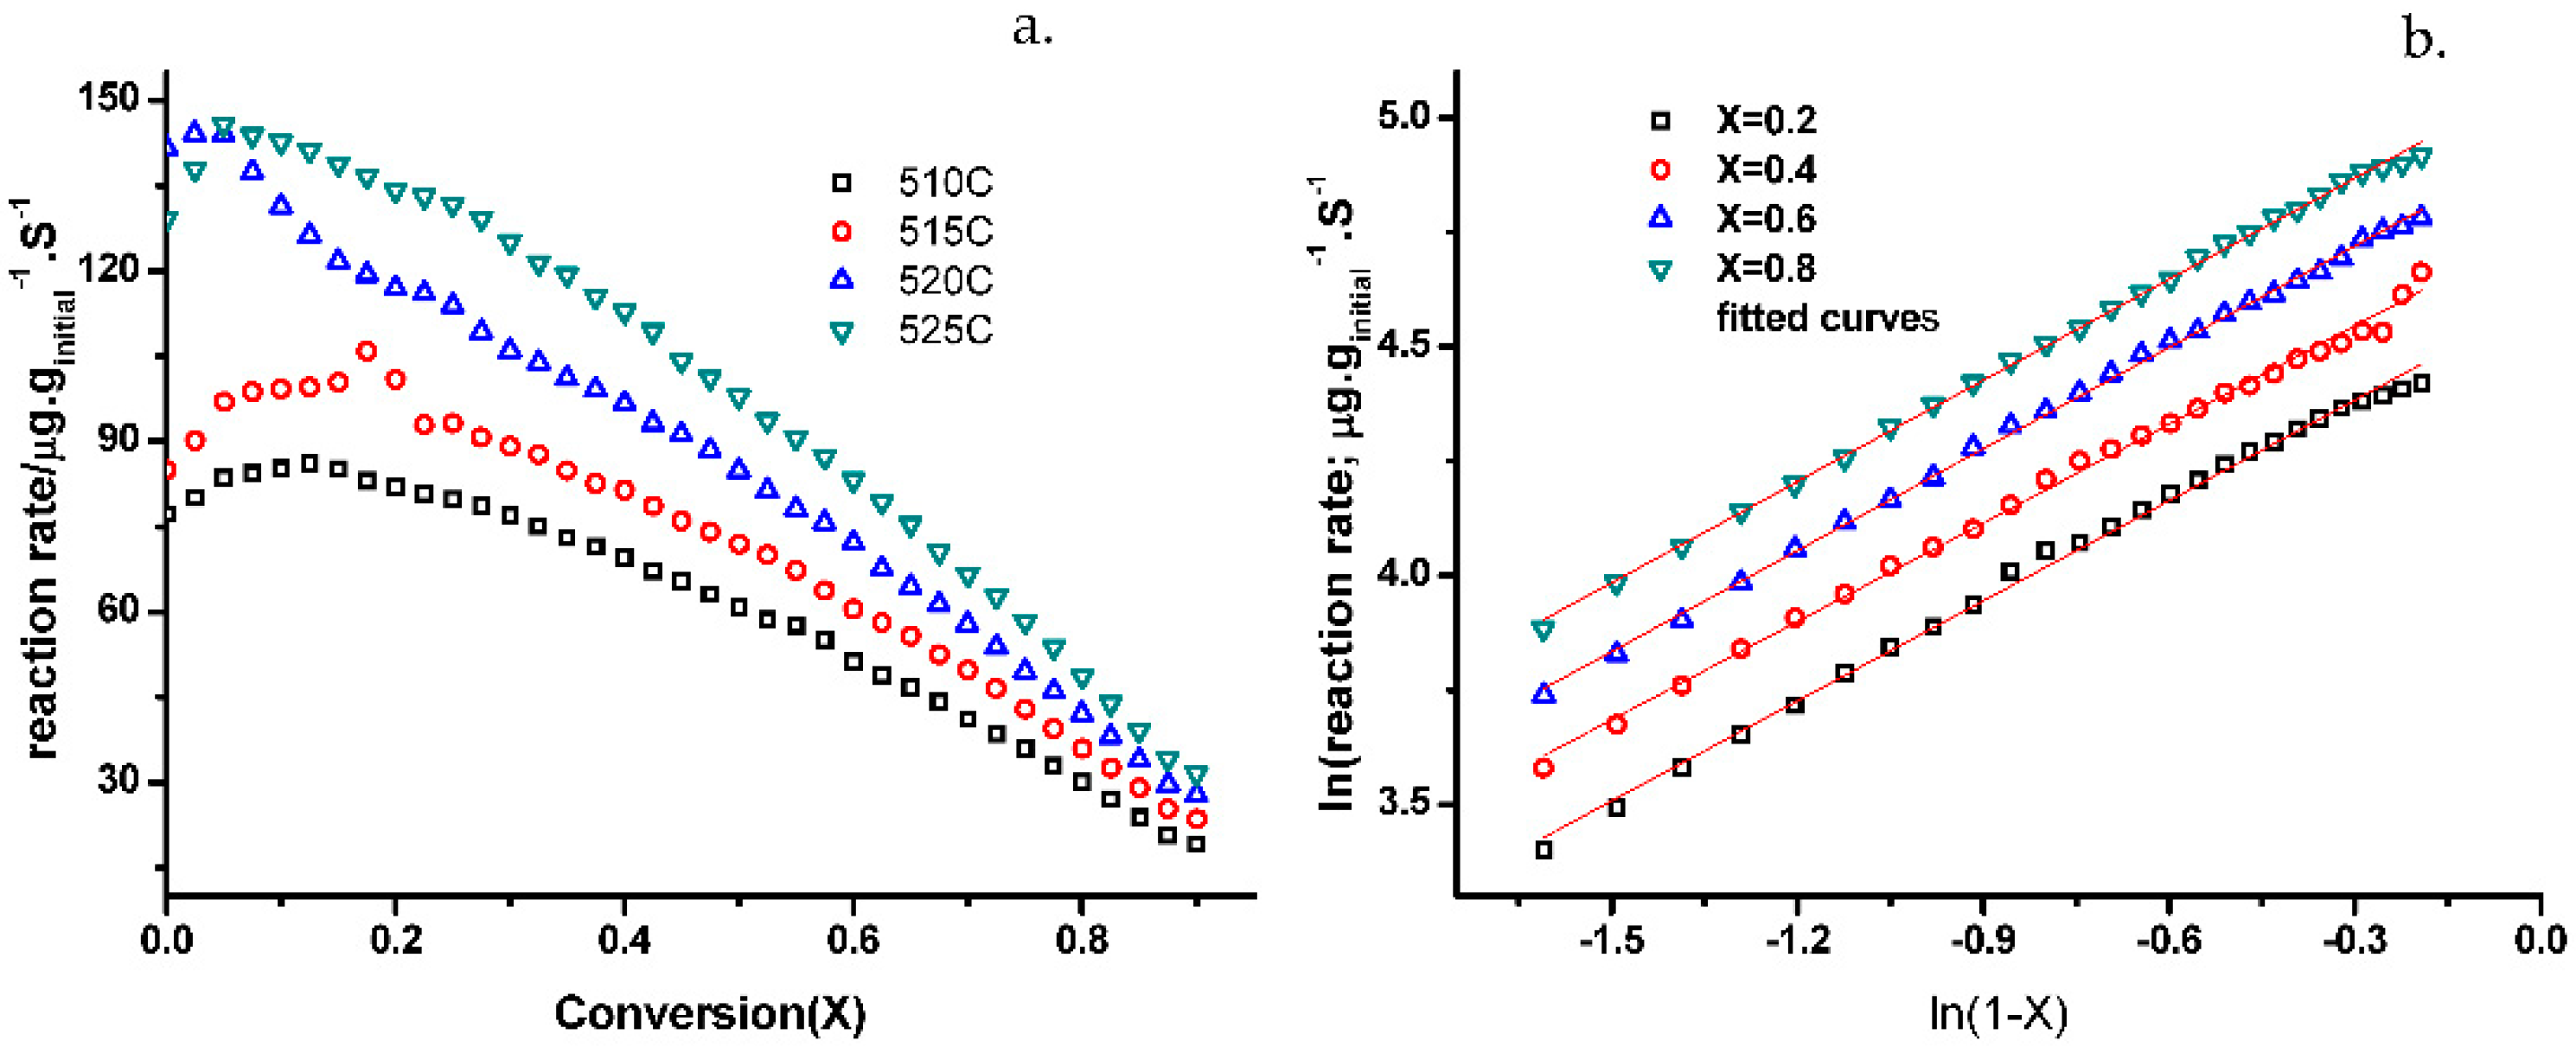
The reaction orders of carbon were determined by fitting combustion curves as shown in Figure 8a with the nth order model. ln(reaction rate) was plotted as function of ln(1 − x) in Figure 8b. The nth order model fits well to the combustion curves for flame soot in the conversion range of 0.2 to 0.9 with a mean value of 0.78 for the reaction order of carbon. The standard deviation of the determined reaction order is less than 0.1.
To determine the influence of the oxygen partial pressure on the conversion rate, isothermal experiments at various partial pressures (10% to 40%) were performed. The isotherm temperature was chosen to be 525 °C (a temperature in kinetics regime). For each partial pressure, the conversion rate was calculated at defined conversions (X = 0.2 to 0.9). A linear regression between ln(reaction rate) and was performed (Figure 9) and the order of reaction of oxygen was calculated. It was found that the order of oxygen concentration is dependent on the conversion level. The order slightly increased from 0.67 to 0.75 with the increase of conversion (from X = 0.2 to X = 0.8). This agrees with our previous studies [24], in which the order of reaction of oxygen was evaluated in a pilot reactor.
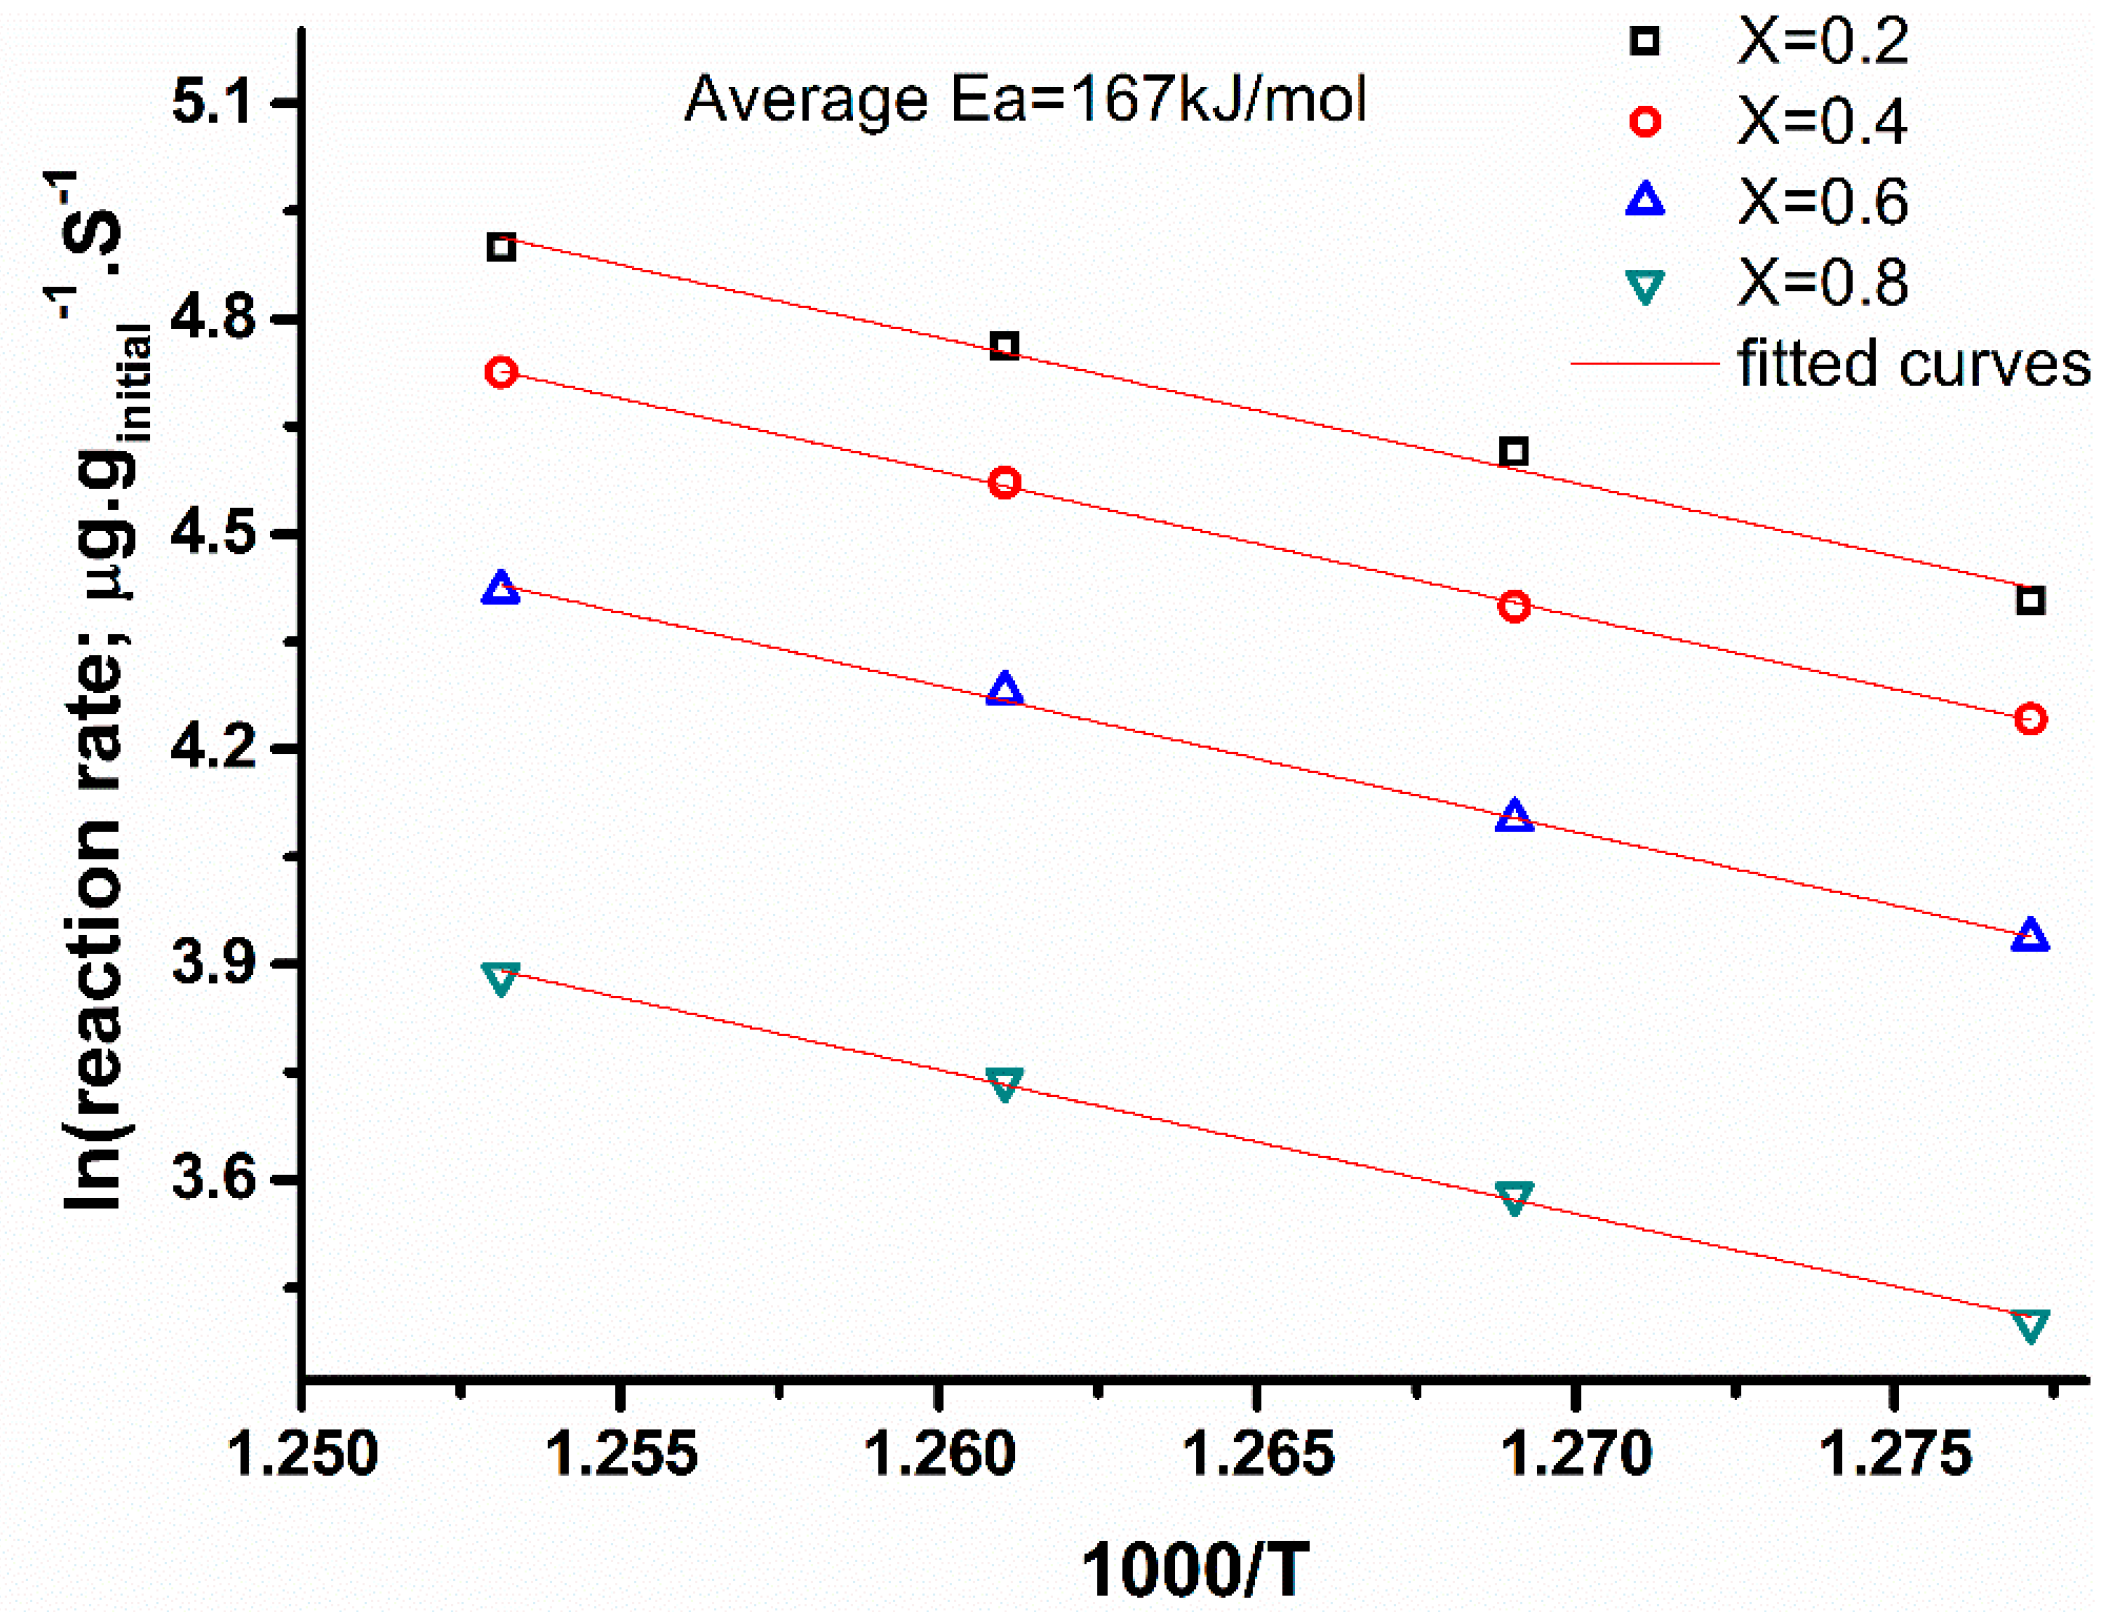
To determine the activation energy for each isotherm, the reaction rate was calculated at defined conversion: X = 0.2–0.9. For each conversion, ln(rs) was represented as a function of 1/T and a linear fit was performed to calculate the activation energy. It can be observed from the Arrhenius plot in Figure 10 that the activation energy is independent of the conversion level, resulting in an average activation energy of 167 kJ/mol. This result is consistent with our previous studies and the literature, in which Ea in the range of 130–170 kJ/mol appears frequently for different soot sources [16,17,18]. In contrast, the kinetics parameters for Printex-U carbon black and engine soot using a step-response technique [17,24] and the same fitting procedure are tabulated in Table 3.
2.5. BET Surface Area
Thermal analysis showed that all of the HCs in the soot samples can be burned out after holding at 450 °C for 30 min in air. Table 4 shows the BET surface area for all soot samples before and after hydrocarbon burnout (de-HC). It was found that both Printex-U and flame soot collected from locations closer to the flame had high initial surface areas, and their surface areas did not change after de-HC heat treatment. However, the surface area of diesel soot increased dramatically after de-HC. It was found that the surface area of real diesel soot increases by 42% from 121 to 171 m2/g after removing all of the absorbed hydrocarbons.
2.6. Flame Deposit Contact vs. Realistic Contact
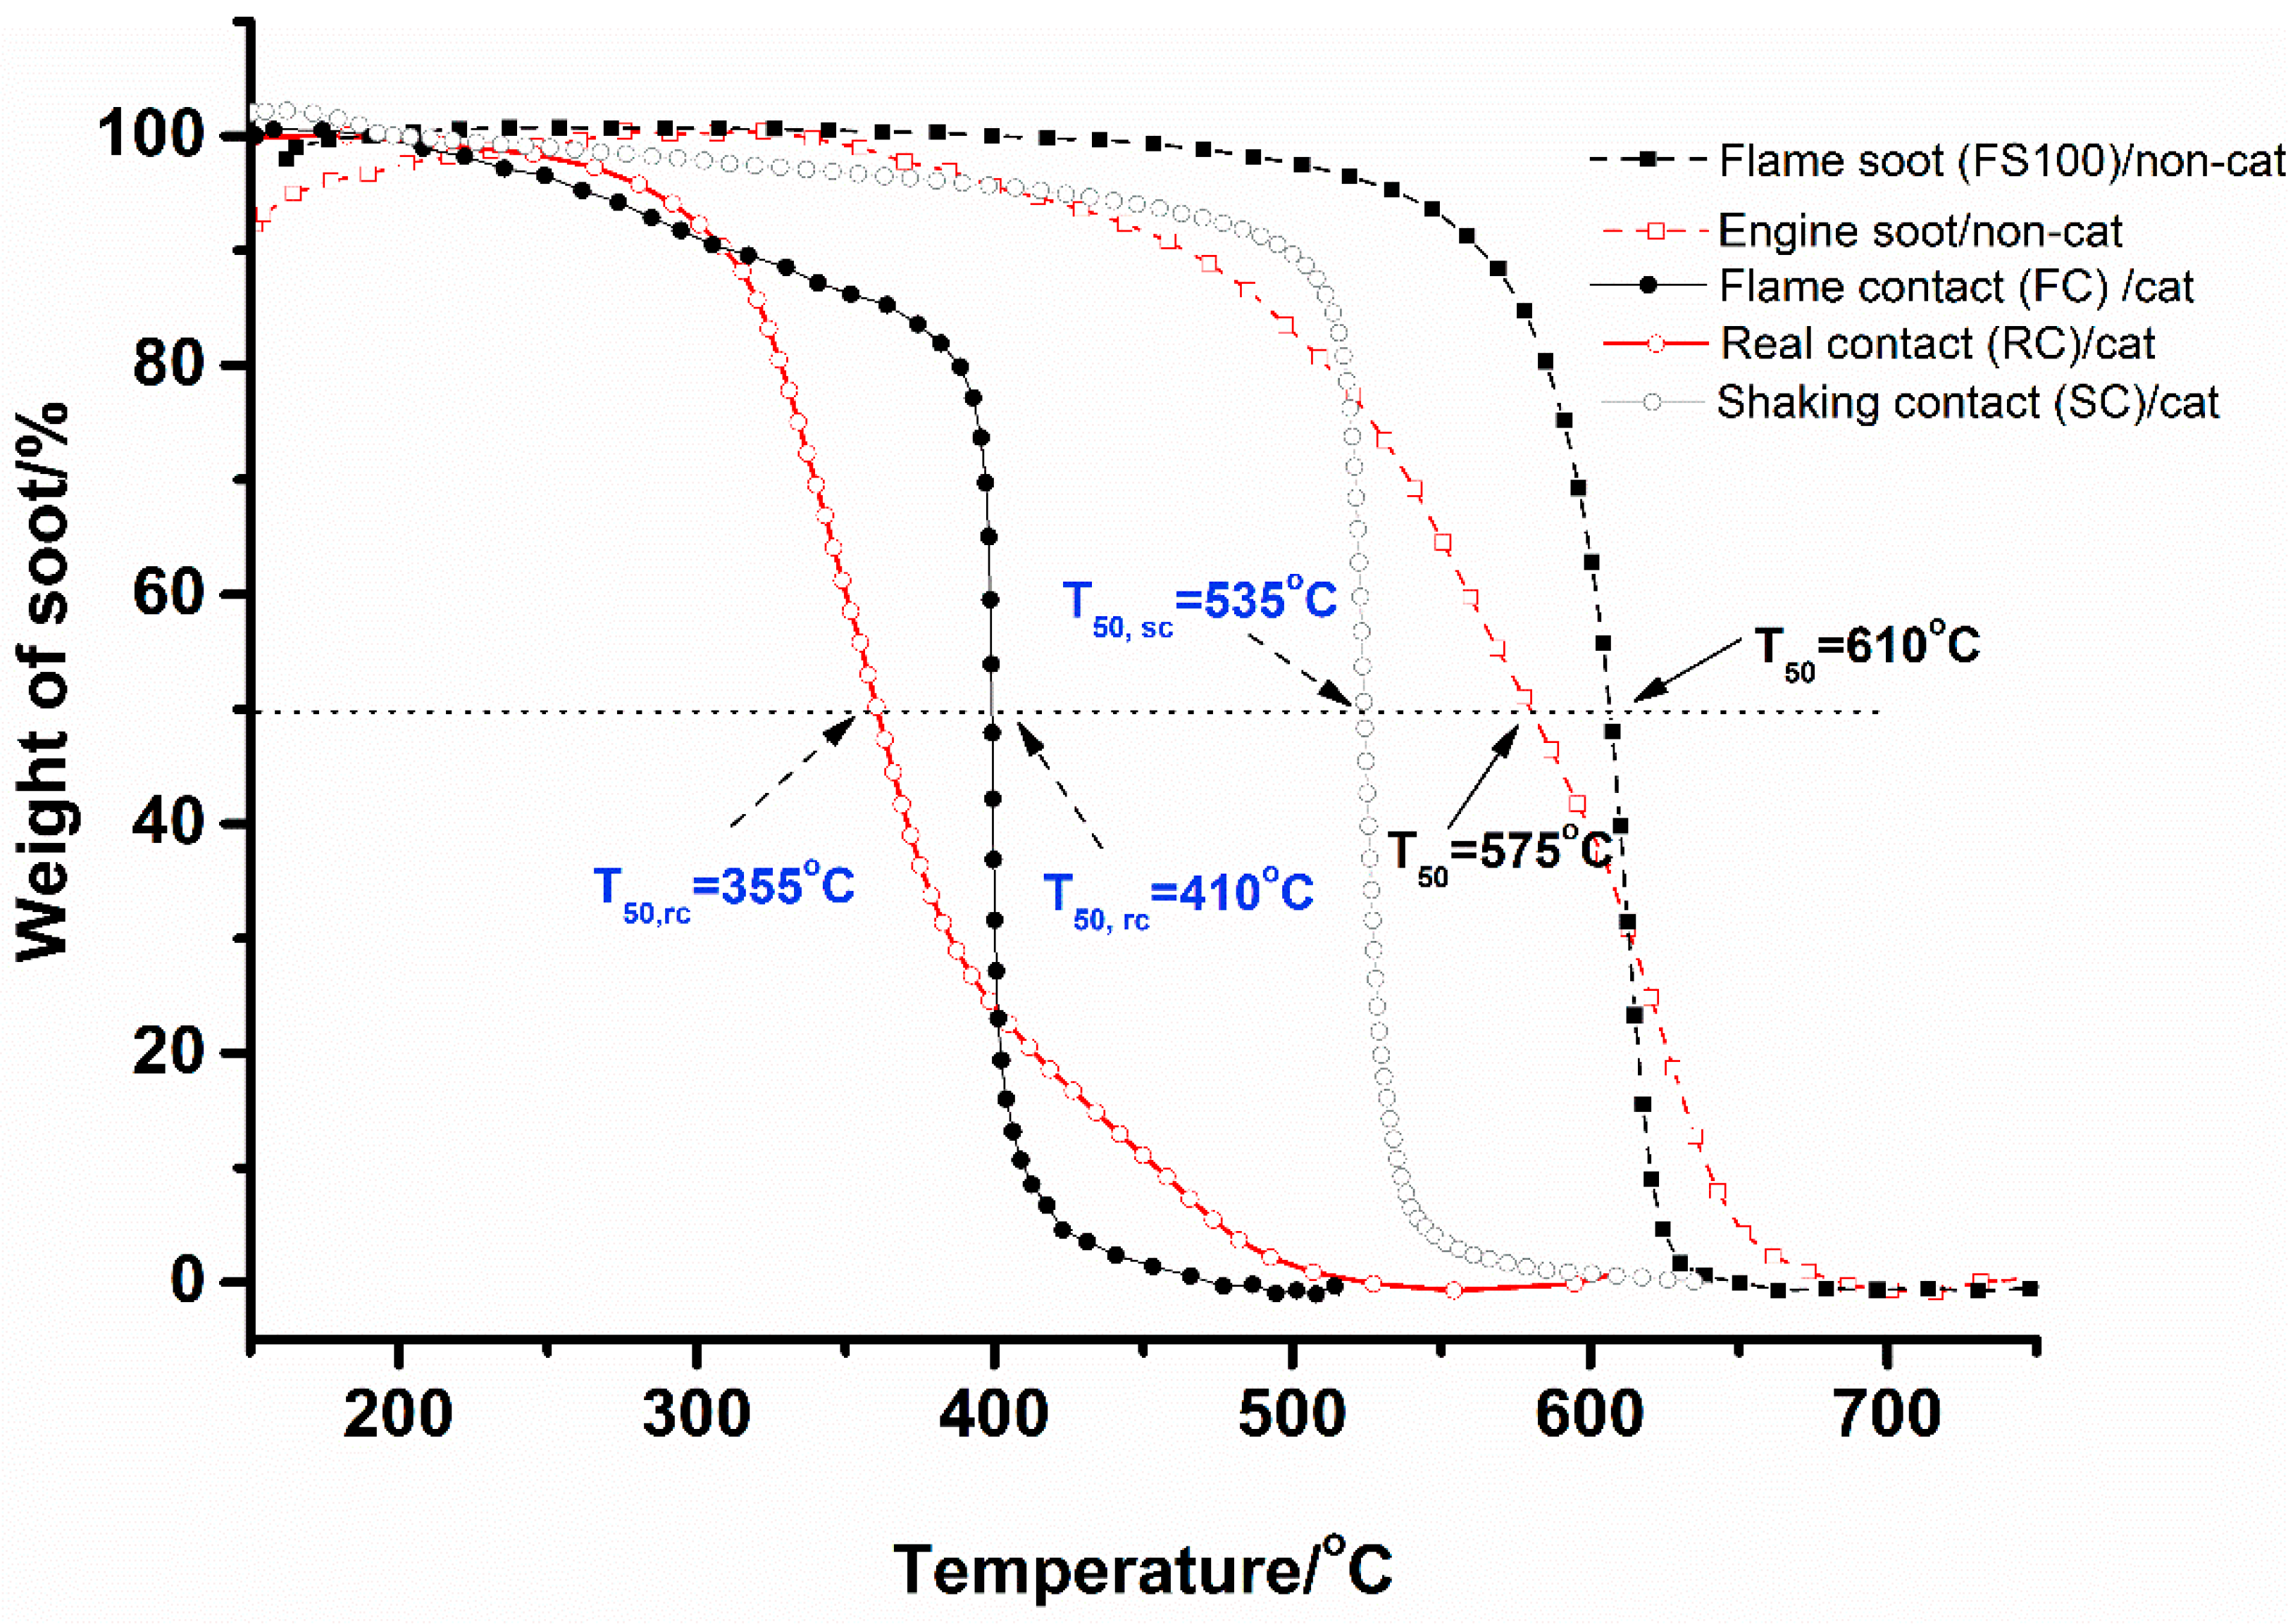
In lab-scale studies, a loose contact condition is crucial to evaluate the performance of the soot oxidation catalysts and approximate real conditions. Hence, one would like to know how well Tiki© lamp flame deposition imitates real soot contact. To address this issue, a sample holder was placed in the exhaust pipe of a diesel engine test stand to produce realistic contact and capture real engine soot for further comparative study by TGA. A blank inert substrate was used to capture pristine engine soot, and a catalyst coated substrate (previously discussed) [25,26] was used to produce a realistic contact condition between the soot and catalysts. Figure 11 shows the curves for catalyzed and non-catalyzed real diesel soot oxidation under real contact conditions. Equivalent substrates were also used to capture flame soot 10 cm (FS100) away from the burner.
It was found that the catalyzed soot oxidation Tig with realistic contact is 310 °C, while for flame deposit contact it is ~410 °C. The much lower catalytic soot oxidation Tig of engine soot can be attributed to the high content of HCs, which usually have lower intrinsic ignition temperatures than carbon. In contrast, the catalytic oxidation T50, FC (where 50 percent of soot is burned off) of flame deposited soot was roughly 60 °C higher than engine produced soot (410 °C). The T50, RC dropped by 220 °C for catalyzed oxidation with the realistic contact condition, while the T50, FC dropped by 200 °C with catalyzed oxidation with the flame deposit contact condition. The change in T50 due to the presence of the catalyst is very similar in both cases, implying that the flame deposit method is able to produce comparably realistic, albeit slightly looser, contact conditions to that resulting from the real exhaust system. The higher hydrocarbon content of the real soot gives lower Tig and T50, while the flame deposition technique provides meaningful, conservative contact testing conditions relative to a realistic exhaust system.
It is also worthy to note that the catalyzed soot oxidation T50, SC using “gently shaking” method (noted as Shaking Contact, catalyst in the powder form) [5,25] dropped by ~75 °C from the T50 of non-catalytic model soot oxidation. In comparison with 200 °C drop and 220 °C drop in T50 when using the flame deposit method (Flame Contact) and the engine deposit method (Realistic Contact) respectively, “Shaking Contact” seems to be too loose compared to the real-world established loose contact condition. It implies a risk of missing lead candidate compounds when using “Shaking Contact” for catalyst screening studies due to the measured T50, SC being too conservative.
3. Discussion
3.1. Microstructure and Reactivity
The ‘nanostructure’ of carbon is usually used to refer to the graphene layer plane dimensions, their tortuosity and relative orientation. Variations in these features are likely to affect the soot’s reactivity toward oxidation, as well as other physical properties that depend on the dimensions and relative orientations of the graphene segments. For example, it is well-known that the carbon atoms at the edges of the graphene sheets are 100–1000 times more reactive than those in the basal plane [27]. As a result, soot with smaller graphene segments (i.e., smaller La) possesses a relatively higher number of edge site carbon atoms relative to those in a basal plane position. Such dependence has implications for the design of combustion devices and their ability to meet emission requirements.
As seen in Table 2, no significant change in the crystalline parameters was found for Printex-U carbon black, flame soot, and diesel engine soot, except for the partially crystallized nature of engine soot which is seen in the XRD patterns of Figure 3 and confirmed by the “shell-like” structure in its HRTEM image (Figure 2b). The higher combustion completion temperature (Figure 5a) for engine soot is thought to be due to the “shell-like” structure of carbon in engine soot because the crystallized graphite-like structure has a higher ignition temperature than amorphous-like carbon.
Nucleation and crystalline growth only occur during the inception and the soot formation process, which are controlled by the parent fuel and combustion conditions [7,11]. Hence, the consistent crystalline parameters for the flame soot obtained at different heights from the burner can be attributed to the stability of the flame-deposit setup and the fact that all of the soot were captured above the inception zone, which is below 20 mm. Soot with higher reactivity and a less developed nanostructure can be expected for the soot precursors formed in the inception zone. It was shown in Figure 4 that the soot from the lowest flame height has smaller agglomerates with greater surface area. Thus, the change in initial activity for the soot collected from different flame heights seems to be related to the decrease of surface area, and hence to the active surface area during soot oxidation.
3.2. Soot Oxidation Kinetics
The model-free kinetic analysis is convenient for TGA characterization due to the fact that it does not include any mathematical approximations. Analysis of the conversion X at different heating rates allows the evaluation of the activation energy without knowledge of the true g(X) function, and it seems that the model-inherent problem can be bypassed. However, this isoconversional method is actually based on the assumption of a one-step reaction and that the conversion model is invariant for all considered TGA runs, so a constant E value with conversion is assumed. Based on the calculated activation energies at different conversion levels, it is not true since the E value varies for different degrees of conversion.
Consequently, the nth order model was applied to estimate the reaction order of carbon, oxygen partial pressure and apparent activation energies of non-catalytic carbon oxidation by conducting isothermal TPO experiments. The oxidation rates of carbonaceous materials are known to depend upon the active surface area (ASA), rather than the total surface area (TSA) or the total mass of the carbonaceous material [28]. For instance, a study of high purity graphitized carbon has shown that the oxidation rate is directly proportional to the fraction of ASA not occupied by stable surface oxygen complexes. It is not obvious that ASA is proportional to TSA, but ASA is often found to increase as TSA increases [29,30].
The ASA provides an explanation for the plateau shape in the combustion curves of engine soot shown in Figure 5b. The engine soot contains large amounts (~20–25%) of adsorbed hydrocarbons, which seems to result in a decrease in surface area of the soot [24]. A more detailed analysis of the pore development on diesel soot revealed that the increase in SA was mainly associated with the formation of micropores. When hydrocarbons or part of the carbon structure is oxidized during the experiment, an increasing number of micropores will be exposed [30], thus causing an increase in the total surface area. An increase in TSA will likely also result in an increase in ASA, leading to an increase in reaction rate per amount of carbon remaining. Based on these considerations, it is obvious that the reaction rate of real soot cannot simply be fitted by Equation (7) (reported in Section 4.2), as the conversion is a poor indicator for TSA or ASA and so for reactivity.
For Printex-U and FS100, it was found that Equation (7) is able to reasonably describe the combustion curves, with the orders of carbon being 0.86 and 0.78 respectively. Apparently, the amount of adsorbed hydrocarbons is so low that any increase in TSA/ASA as a function of conversion plays a less important role than in the oxidation of diesel soot. The order of 0.67 was expected for a shrinking core model of soot oxidation [24,28]. In this model, the soot particles are considered as spheres with a radius which decreases as the oxidation takes place at the surface. However, this assumption conflicts with the experimental observations. The oxidation of individual soot particles was reported to take place not only on the surface but throughout the entire particle, resulting in an increased porosity and only a small decrease in particle diameter [30]. Therefore, it is difficult to predict the dependency of TSA/ASA on the conversion since the oxidation is not limited to the outer surface of the soot particles.
Activation energies for the non-catalytic oxidation of Printex-U and FS100 were calculated as 160 kJ/mol and 167 kJ/mol respectively. These numbers are in agreement with data which is reported in literature ranging from 130~180 kJ/mol for soot oxidation. Due to surface heterogeneity and structural changes between different types of carbon, there is no standard activation energy for soot oxidation. Nevertheless, it is generally agreed that the activation energy decreases if the structure of carbon becomes more amorphous [11,31].
3.3. Implications of This Study
Due to the complexity of soot characteristics and different instrumentation, the comparison of catalytic and non-catalytic soot oxidation performances can only be based upon the same soot and experimental conditions. In general, the main variables that influence the catalytic performances of soot oxidation catalysts are the soot composition and microstructure as well as the type of catalyst-soot contact.
Besides microstructure, the physicochemical features of real engine soot depend on several aspects, such as the fuel and lubricating oil used [11], the type of engine and operating conditions etc. Real soot may come along with different amount of unburned hydrocarbons (paraffin, aromatics and oxy-generated compounds), which are related to the engine operating conditions, e.g., from ~5 wt % for a loaded engine to ~60 wt % for an idle engine [24]. In contrast, flame soot samples contain higher percentages of fixed carbon and lower percentages of soluble organic fraction (SOF), volatile organic fraction (VOF) and ash than real engine soot samples [15]. Hence, real soot combustion normally occurs at lower temperatures (e.g., Tig) than those of flame soot samples.
However, the convenience of using flame soot as a substitute of diesel soot in catalyst studies lies in the fact that repeatable and reliable results can be obtained. This is particularly critical for catalyst screening studies that ruling out soot variations is favorable to obtain intrinsic catalytic performances. The use of FS100 as a soot surrogate was found to be as good as the commercially available Printex-U carbon black for catalyst investigations.
The discrepancies in catalytic soot oxidation activity are also significantly related to the contact between soot and catalyst. The realistic contact condition obtained by in-situ collection on a DPF in an exhaust system is considered as “loose” contact [19,32]. Replicating this “loose” contact condition in laboratory studies remains a challenge in catalytic soot oxidation studies, especially since the “gently shaking” method used in powder-formed catalysts studies is not appropriate any more for structured/supported catalyst studies.
To understand how well the proposed flame deposition method imitates real soot contact condition, a sample holder was placed in the exhaust pipe of a diesel engine test stand to produce realistic contact and capture real engine soot for comparative analysis. The T50 (where 50 percent of soot is burned off) dropped by 220 °C for catalyzed oxidation with the realistic contact condition, while the T50 dropped by 200 °C with catalyzed oxidation with the flame deposit contact condition. The change in T50 due to the presence of the catalyst is very similar in both cases, implying that the flame deposit method is able to produce comparably realistic, albeit slightly looser, contact conditions to that resulting from the real exhaust system. The higher hydrocarbon content of the real soot gives lower Tig and T50, while the flame deposition technique provides meaningful, conservative contact testing conditions relative to a realistic exhaust system.
This comparably realistic “loose” contact condition achieved by flame soot deposit (Flame Contact) was utilized in our previous work for performance studies [5,25,26], durability studies (e.g., Sulphur exposure, aging exposure etc.) [26,28], as well as extended continuous soot oxidation (ECSO) investigations [33]. Particularly, differing from the previous TGA cycling method, the ECSO unit was designed to accelerate the durability assessment of studied soot oxidation catalysts which enables exposing the catalyst for an extended period of time at a constant temperature and soot loading rate.
For instance, based on estimates from larger scale bench top reactors, the total amount of soot necessary for 100,000 mi of equivalent lifetime on a TGA slice was determined to be ~93 mg for the 8 × 8 × 3 mm TGA sample size. This calculation was based on conversations with industrial collaborators concerning soot output for an average light duty diesel engine over this mileage. At an average soot deposition rate of 0.005 mg/min in the ECSO system, 100,000 mi equivalent lifetime testing requires ~300 h of flame soot exposure. It implies a significant benefit of accelerating catalyst durability test with very low cost.
From an economical point of view, by comparing against the expensive engine testing or sophisticated pilot reactor evaluation [34,35], this novel flame deposit method allows researchers to quickly set up a procedure in the laboratory scale to reveal the catalytic soot oxidation properties in a comparably realistic loose contact condition.
4. Materials and Methods
4.1. Soot Collection
Three kinds of soot were used in this study: (1) flame soot collected from a Tiki© (Menomonee Falls, WI, USA) torch oil lamp; (2) soot collected diesel engine test stand; and (3) commercial Printex-U carbon black.
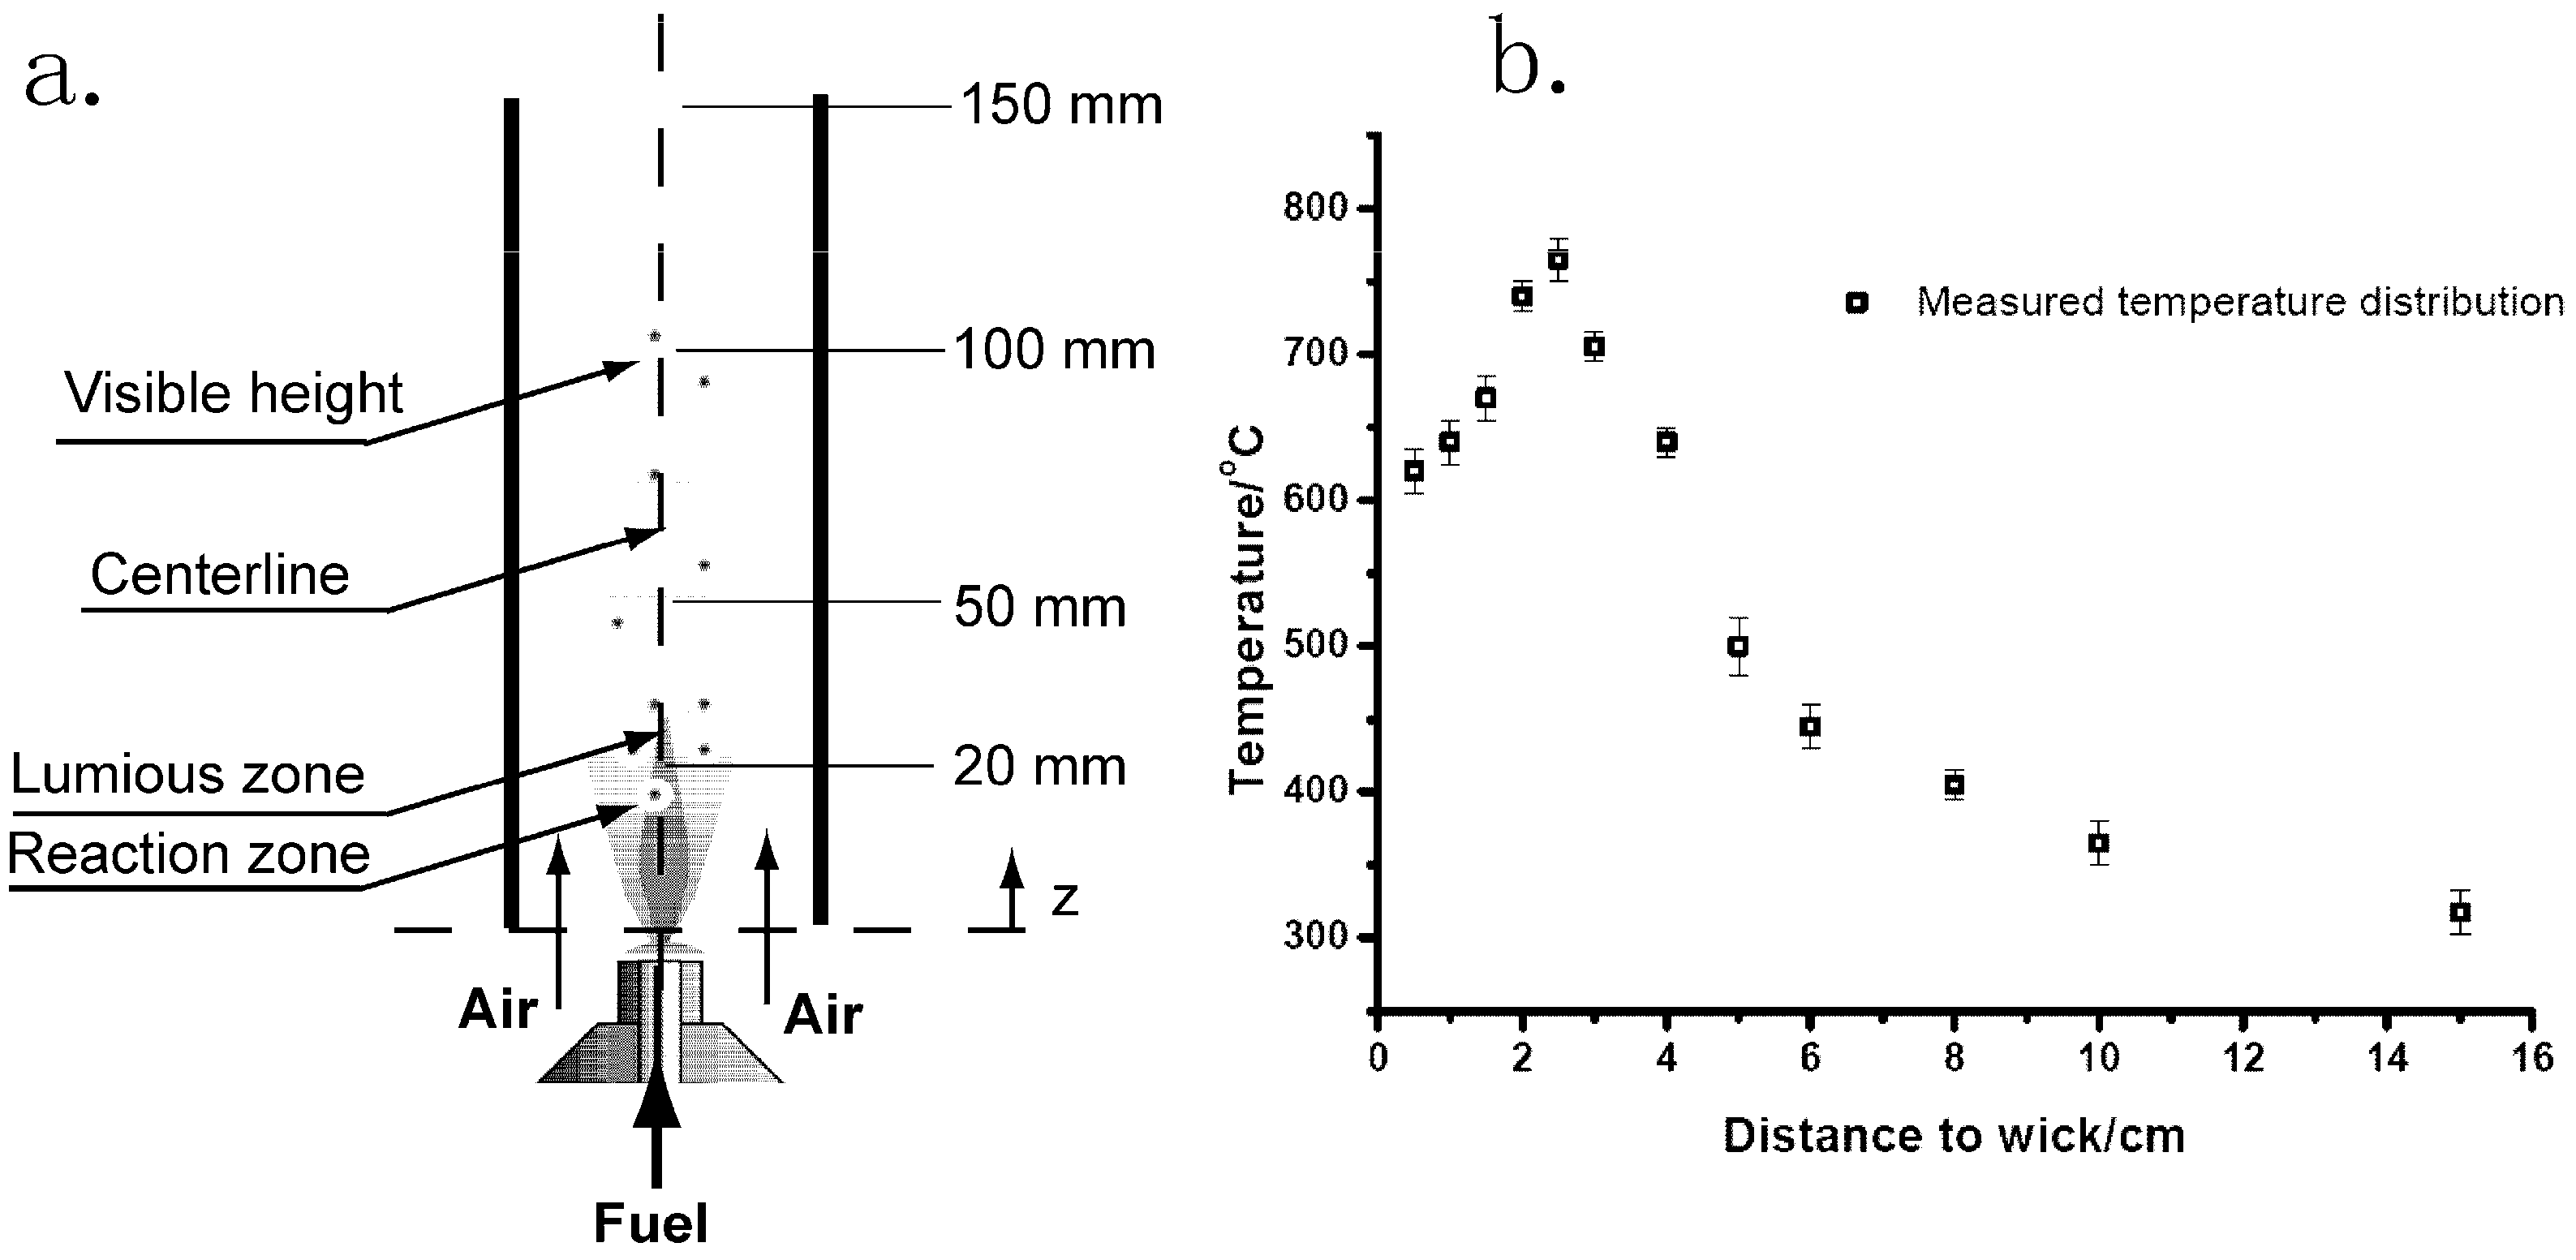
A Tiki torch oil lamp was placed in a fume hood with average face velocity of 100 ft/min. The flow conditions chosen for this study resulted in steady and consistent soot streams produced by the diffusion flames. A 2” diameter stainless steel tube was held above the wick to direct the soot onto an inert quartz disk or catalyzed structured support for analysis (Figure 12a). Figure 12b shows the temperature distribution along the flame axis which was measured by rapidly inserting a thermocouple at different Z positions. The soot collected at heights of 20 mm, 50 mm, 100 mm and 150 mm were defined as FS20, FS50, FS100 and FS150 respectively.
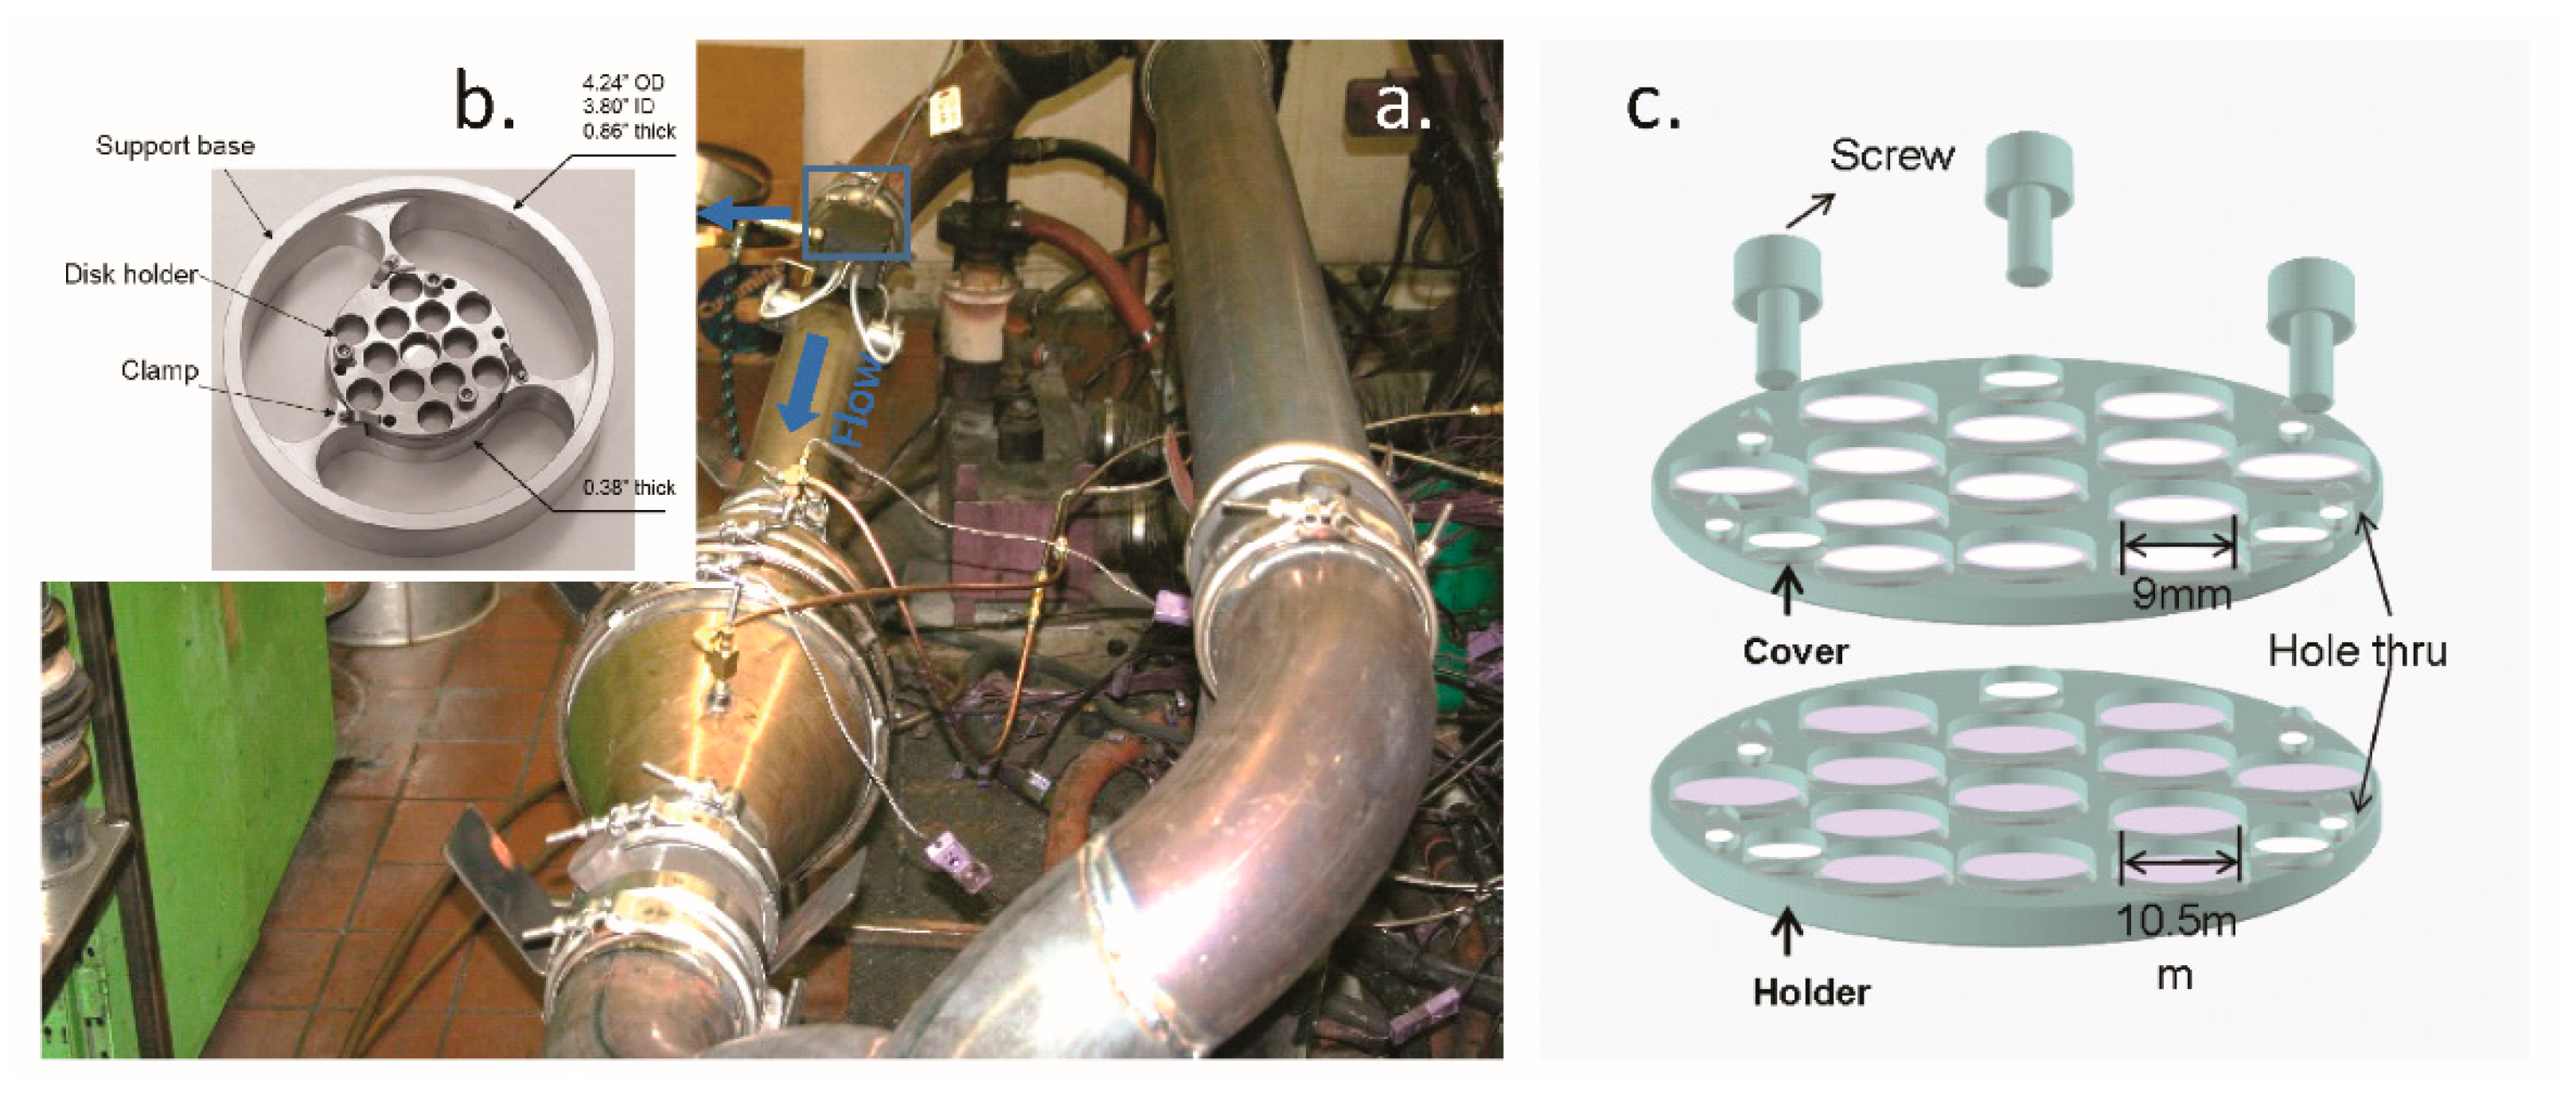
A diesel engine test stand was used to produce particulate samples at A25 condition of a Cummins ISX 15 L engine (Cummins Inc., Columbus, IN, USA). For oxidation tests, exhaust gas samples were collected onto TGA compatible inert sample holders or structured catalysts for further analysis. Figure 13 shows the schematic rendering the apparatus designed for collecting soot samples from diesel exhaust.
4.2. Soot Characterization
The crystalline structure of soot was examined by using a Bruker D8 Advance diffractometer (Madison, WI, USA) with Cu-Kα (λ = 1.54059 Å) radiation. The 2θ angle ranged from 8 to 55 with a step-size of 0.2 and an acquisition time of 10 s for every step. The XRD spectrum of each sample was recorded and the interlayer spacing (d002) was evaluated.
The carbon grain size Lc and La along the c-axis and a-axis can be calculated approximately by using the Scherrer empirical expression:
where B is the full width at half maximum (FWHM) and θ is Bragg’s angle. K is a constant depending on the reflection plane and equals to 0.89 and 1.84 for (002) and (100) [23] respectively.
The morphologies of the soot were obtained by transmission electron microscopy (TEM) using a JEOL 2010 TEM (Akishima, Tokyo, Japan) working at 200 kV. TEM was also used to determine the agglomerate size of primary soot particles. The surface area was determined by using the Brunauer, Emmet and Teller (BET) method, employing N2 adsorption at 77 K on a Coulter SA 3100 surface area analyzer. Brookhaven Instruments Corp (Holtsville, NY, USA). Zeta Plus was used to measure the particle size of soot samples, and the particle size analyzer has an effective measuring range of 2 nm–3 μm.
4.3. Temperature Programmed Oxidation & Soot Oxidation & Kinetics
Temperature programmed oxidation (TPO) was performed with a TGA 2950 and a DTA-TGA SDT 2960 (TA Instrument) (New Castle, DE, USA). Two experimental methods were carried out, namely ramp mode and isothermal conditions. Ramp mode was mainly applied to evaluate the catalytic performance based on the ignition temperature (Tig) or the temperature where half of the soot had been combusted (T50).
The conversion and reaction rate were calculated as follows:
where X is the conversion of soot oxidation, m0 is the initial weight of soot, mt is the remaining weight of soot at time t, and
The reaction rate of the soot oxidation, rs, was described as the loss of remaining mass of carbon per unit time t.
4.3.1. Kinetics from Nonisothermal Experiments
Kinetic analysis of solid-state oxidation was based on a single-step kinetics equation. Nonisothermal experiments were carried out at constant heating rates of 1, 3, 5, 10 °C min−1 while flowing 10% O2 as an oxidant gas (120 mL/min). The rate of nonisothermal oxidation for this type of reaction can be expressed as:
where T is the absolute temperature, X is the extent of conversion, β is the linear heating rate, f(X) is the conversion model, R is the gas constant, and A and Ea are the Arrhenius parameters, the pre-exponential factor and the activation energy, respectively.
The f(X) function is the dependence of the rate on the fraction of solid remaining unconverted as the reaction proceeds. Equation (4) can be integrated to yield:
Equation (6) is the basis of the model-free isoconversional method from nonisothermal data, which was developed by Kissinger, Akahira, and Sunose (KAS) [28].
Normally, a constant E value with conversion is assumed in the single-step reaction model. Likewise, both g(X) and A are assumed to remain unchanged. In other words, this model-free kinetics analysis method usually assumes that the conversion model is invariant for all considered TGA oxidation curves.
4.3.2. Kinetics from Isothermal Experiments
Isothermal experiments were performed by heating samples to desired temperatures under inert gas flow (N2). The gas flow was then switched to the reaction gas at the time defined as zero. A flow rate of 120 mL/min was chosen, and the experiments lasted 90 min to several hours to allow complete oxidation.
The reaction rate of carbonaceous materials have the general form for the nth-order kinetics model:
where r is the reaction rate, c is a constant proportional to the number of active sites, is the partial pressure of oxygen and is the order of oxygen partial pressure.
5. Conclusions
Even though the crystallite parameters are very similar for commercial Printex-U carbon black, lab-prepared flame soot, and the amorphous-like part of diesel soot, these samples showed different degrees of ordered arrangement. Real diesel soot has more hydrocarbons, showing lower apparent Tig than model soot, and the “shell-like” structured carbon results in a combustion completion temperature that is higher than flame soot and Printex-U carbon black. The pore structure of engine soot was also found to be more complicated than flame soot and Printex-U carbon black. The plateau of the reactivity curve can be attributed to the evolution of surface area during the hydrocarbon burnout process.
Flame soot (e.g., FS100) and Printex-U carbon black showed similar microstructure and non-catalytic oxidation behavior, and both are suitable for modeling diesel soot oxidation. Along with the similarity of Printex-U and FS100 in microstructure, the use of FS100 as a soot surrogate was found to be as good as the commercially available Printex-U carbon black for catalyst studies.
The comparison of flame deposit contact was found to produce a contact condition comparable to the realistic contact condition in the exhaust system. The simplicity of the set-up is very suitable for lab-scale study, particularly for depositing soot onto structured soot oxidation catalysts. Comparing against the expensive engine testing or sophisticated pilot reactor evaluation, this novel flame deposit method allows researchers in the field to quickly set up a procedure in the laboratory scale to reveal the catalytic soot oxidation properties in a comparably realistic loose contact condition. An example of using this method for accelerated catalyst durability evaluation was also discussed.
Author Contributions
University of Notre Dame initiated the concept and performed the described lab-scale soot characterization and oxidation studies. Cummins provided engine and assisted engine bench test to collect soot samples on the blank and catalytic samples that were provided by University of Notre Dame. Changsheng Su drafted the manuscript and all authors reviewed and approved the manuscript.
Funding
This work was partially supported by Notre Dame Integrated Imaging Facility (NDIIF). Partial support of the work was also received from Tenneco, Inc. & Cummins, Inc.
Acknowledgments
Thanks to Paul Majewski at Tenneco, Inc. for getting access to their engine test stand. Thanks to Aleksey Yezerets, Neal Currier, Xu Chen, Ying Yuan, and James Zokoe at Cummins Inc., Sujay Bagi, and Victor Wong from Massachusetts Institute of Technology for fruitful discussions. Thanks to Randy Vander Wal at the Pennsylvania State University for use of Printex-U carbon black HRTEM image from his group.
Conflicts of Interest
The authors declare no conflict of interest.
References
- Russo, N.; Fino, D.; Saracco, G.; Specchia, V. Studies on the redox properties of chromite perovskite catalysts for soot combustion. J. Catal. 2005, 229, 459–469. [Google Scholar] [CrossRef]
- Higgins, K. Kinetics of diesel nanoparticle oxidation. Environ. Sci. Technol. 2003, 37, 1949–1954. [Google Scholar] [CrossRef] [PubMed]
- Song, J. Effect of Fuel Formulation on Soot Properties and Regeneration of Diesel Particulate Filters, in Energy and Geo-Environmental Engineering. Ph.D. Thesis, Pennsylvania State University, University Park, State College, PA, USA, 2005. [Google Scholar]
- Stanmore, B.R.; Brilhac, J.F.; Gilot, P. The oxidation of soot: A review of experiments, mechanisms and models. Carbon 2001, 39, 2247–2268. [Google Scholar] [CrossRef]
- An, H.; Su, C.; McGinn, P.J. Application of potash glass as a catalyst for diesel soot oxidation. Catal. Commun. 2009, 10, 509–512. [Google Scholar] [CrossRef]
- Neeft, J.P.A.; Nijhus, T.X.; Smakman, E.; Makkee, M.; Moulijn, J.A. Kinetics of the oxidation of diesel soot. Fuel 1997, 76, 1129–1136. [Google Scholar] [CrossRef]
- Vander Wal, R.L.; Tomasek, A.J. Soot nanostructure: Dependence upon synthesis condition. Combust. Flame 2004, 136, 129–140. [Google Scholar] [CrossRef]
- Vander Wal, R.L.; Yezeret, A.; Currier, N.W.; Kim, D.H.; Wang, C.M. HRTEM Study of diesel soot collected from diesel particulate filters. Carbon 2007, 45, 70–77. [Google Scholar] [CrossRef]
- Vander Wal, R.L.; Tomasek, A.J. Soot oxidation: Dependence upon initial nanostructure. Combust. Flame 2003, 134, 1–9. [Google Scholar] [CrossRef]
- Boehman, A.L.; Song, J.; Alam, M. Impact of biodiesel blending on diesel soot and the regeration of particulate filters. Energy Fuels 2005, 19, 1857–1864. [Google Scholar] [CrossRef]
- Strzelec, A.; Toops, T.J.; Daw, C.S. Oxygen reactivity of devolatilized diesel engine particulates from conventional and biodiesel fuels. Energy Fuels 2013, 27, 3944–3951. [Google Scholar] [CrossRef]
- Alfe, M.; Apicella, B.; Barbella, R.; Rouzaud, J.-N.; Tregrossi, A.; Ciajolo, A. Structure–property relationship in nanostructures of young and mature soot in premixed flames. Proc. Combust. Inst. 2009, 32, 697–704. [Google Scholar] [CrossRef]
- Hurt, R.H.; Crawford, G.P.; Shim, H.S. Equilibrium nanostructure of primary soot particles. Proc. Combust. Inst. 2000, 28, 2539–2546. [Google Scholar] [CrossRef]
- Vander Wal, R.L. Onset of carbonization: Spatial location via simultaneous LIF-LII and characterization via TEM. Combust. Sci. Technol. 1996, 118, 343–360. [Google Scholar]
- Liu, Y.; Su, C.; Clerc, J.; Harinath, A.; Rogoski, L. Experimental and Modeling Study of Ash Impact on DPF Backpressure and Regeneration Behaviors. SAE Int. J. Engines 2015, 8, 1313–1321. [Google Scholar] [CrossRef]
- Yezerets, A.; Currier, N.; Eadler, H.; Popuri, S.; Suresh, A. Quantitative Flow-Reactor Study of Diesel Soot Oxidation Process; SAE Technical Paper, 2002-01-1684; SAE: Warrendale, PA, USA, 2002. [Google Scholar]
- Yezerets, A.; Currier, N.; Eadler, H.A. Experimental Determination of the Kinetics of Diesel Soot Oxidation by O2—Modeling Consequences; SAE Technical Paper, 2003-01-0833; SAE: Warrendale, PA, USA, 2003. [Google Scholar]
- Kim, S. Understanding the difference in oxidative properties between flame and diesel soot nanoparticles: The role of metals. Environ. Sci. Technol. 2005, 39, 4021–4026. [Google Scholar] [CrossRef] [PubMed]
- Neeft, J.P.A.; Makee, M.; Moulijn, J.A. Catalysts for the oxidation of soot from diesel exhaust gases. I. An exploratory study. Appl. Catal. Environ. 1996, 8, 57–78. [Google Scholar] [CrossRef]
- Zhang, H.; Xi, Y.; Su, C.; Liu, Z.G. Lab Study of Urea Deposit Formation and Chemical Transformation Process of Diesel Aftertreatment System; SAE Technical Paper, 2017-01-0915; SAE: Warrendale, PA, USA, 2017. [Google Scholar]
- Atribak, I.; Bueno-López, A.; García-García, A. Uncatalysed and catalysed soot combustion under NOx + O2: Real diesel versus model soots. Combust. Flame 2010, 157, 2086–2094. [Google Scholar] [CrossRef]
- Van Setten, B.A.A.L.; Schouten, J.M.; Makkee, M.; Moulijn, J.A. Realistic contact for soot with an oxidation catalyst for laboratory studies. Appl. Catal. B Environ. 2000, 28, 253–257. [Google Scholar] [CrossRef]
- Lu, L.; Sahajwalla, V.; Kong, C.; Harris, D. Quantitative X-ray diffraction analysis and its application to various coals. Carbon 2001, 39, 1821–1833. [Google Scholar] [CrossRef]
- Yezerets, A.; Currier, N.W.; Kim, D.H.; Eadler, H.A.; Epling, W.S.; Peden, C.H. Differential kinetic analysis of diesel particulate matter (soot) oxidation by oxygen using a step–response technique. Appl. Catal. B Environ. 2005, 61, 120–129. [Google Scholar] [CrossRef]
- Su, C.; McGinn, P.J. The effect of Ca2+ and Al3+ additions on the stability of potassium disilicate glass as a soot oxidation catalyst. Appl. Catal. B Environ. 2013, 138, 70–78. [Google Scholar] [CrossRef]
- Su, C.; McGinn, P.J. Application of glass soot catalysts on metal supports to achieve low soot oxidation temperature. Catal. Commun. 2014, 43, 1–5. [Google Scholar] [CrossRef]
- Marsh, H. Introduction to Carbon Science, 1st ed.; Butterworths: London, UK, 1989. [Google Scholar]
- Su, C. Stabilization of Potassium in Soot Oxidation Catalysts and Their Application on Diesel Particulate Filters. Ph.D. Thesis, University of Notre Dame, Notre Dame, IN, USA, 2011. [Google Scholar]
- NLaine, N.R.; Vastola, F.J.; Walker, P.L., Jr. The importance of active surface area in the coarbon-oxygen reaction. J. Phys. Chem. 1963, 67, 2030–2034. [Google Scholar]
- Tighe, C.J.; Twigg, M.V.; Hayhurst, A.N.; Dennis, J.S. The kinetics of oxidation of Diesel soots and a carbon black (Printex U) by O2 with reference to changes in both size and internal structure of the spherules during burnout. Carbon 2016, 107, 20–35. [Google Scholar] [CrossRef]
- Fino, D.; Bensaid, S.; Piumetti, M.; Russo, N. A review on the catalytic combustion of soot in diesel particulate filters for automotive applications: from powder catalysts to structured reactors. Appl. Catal. A Gen. 2016, 509, 75–96. [Google Scholar] [CrossRef]
- Bueno-López, A. Diesel soot combustion ceria catalysts. Appl. Catal. B Environ. 2014, 146, 1–11. [Google Scholar] [CrossRef] [Green Version]
- Zokoe, J.; McGinn, P.J. Catalytic diesel soot oxidation by hydrothermally stable glass catalysts. Chem. Eng. J. 2015, 262, 68–77. [Google Scholar] [CrossRef]
- Chen, X.; Kumar, A.; Klippstein, D.; Stafford, R.; Su, C.; Yuan, Y.; Zokoe, J.; McGinn, P. Development and Demonstration of a Soot Generator Integrated Bench Reactor; SAE Technical Paper, No. 2014-01-1589; SAE: Warrendale, PA, USA, 2014. [Google Scholar]
- McGinn, P.J.; Su, C. Glass Catalysts for Soot Combustion and Methods of Manufacturing the Same. U.S. Patent 9,592,490, 14 March 2017. [Google Scholar]
Figure 1.
TEM images of soot. (a) Printex-U Carbon Black (CB); (b) Flame soot FS100; (c) Engine soot (DS).
Figure 1.
TEM images of soot. (a) Printex-U Carbon Black (CB); (b) Flame soot FS100; (c) Engine soot (DS).

Figure 2.
HTEM soot images. (a) Printex-U Carbon Black (CB); (b) Flame soot FS100; (c) Engine soot (DS).
Figure 2.
HTEM soot images. (a) Printex-U Carbon Black (CB); (b) Flame soot FS100; (c) Engine soot (DS).

Figure 3.
(a) XRD patterns for Printex-U carbon black, Engine soot, and flame soot FS100; (b) The fitted curve for the XRD pattern of engine soot.
Figure 3.
(a) XRD patterns for Printex-U carbon black, Engine soot, and flame soot FS100; (b) The fitted curve for the XRD pattern of engine soot.

Figure 4.
The size distribution of agglomerates for soot collected from different flame heights: FS20, FS50, FS100 and FS150. (Measured by particle size analyzer.)
Figure 4.
The size distribution of agglomerates for soot collected from different flame heights: FS20, FS50, FS100 and FS150. (Measured by particle size analyzer.)

Figure 5.
Non-catalytic oxidation experiments for Printex-U carbon black, FS100, and diesel engine soot. (a) Ramp mode TGA curves; (b) Typical oxidation behavior for isothermal experiments at 525 °C. Feed: 10% O2.
Figure 5.
Non-catalytic oxidation experiments for Printex-U carbon black, FS100, and diesel engine soot. (a) Ramp mode TGA curves; (b) Typical oxidation behavior for isothermal experiments at 525 °C. Feed: 10% O2.

Figure 6.
Isothermal soot oxidation curves at 525 °C for flame soot collected from different heights. Feed: 10% O2.
Figure 6.
Isothermal soot oxidation curves at 525 °C for flame soot collected from different heights. Feed: 10% O2.

Figure 7.
(a) TGA oxidation curves for flame soot FS100 obtained at different heating rates; (b) Isoconversion plots at various conversion degrees for flame soot FS100. (Non-isothermal oxidation at different heating rates: 1 °C/min, 3 °C/min, 5 °C/min and 10 °C/min.)
Figure 7.
(a) TGA oxidation curves for flame soot FS100 obtained at different heating rates; (b) Isoconversion plots at various conversion degrees for flame soot FS100. (Non-isothermal oxidation at different heating rates: 1 °C/min, 3 °C/min, 5 °C/min and 10 °C/min.)

Figure 8.
(a) Oxidation rate of flame soot FS100 vs. conversion as a function of temperature; (b) Linear fitting of reaction order in carbon for flame soot FS100.
Figure 8.
(a) Oxidation rate of flame soot FS100 vs. conversion as a function of temperature; (b) Linear fitting of reaction order in carbon for flame soot FS100.

Figure 9.
Linear fits of the reaction order of oxygen partial pressure at carbon conversions of 0.2–0.8.
Figure 9.
Linear fits of the reaction order of oxygen partial pressure at carbon conversions of 0.2–0.8.

Figure 10.
Arrhenius plots for non-catalytic oxidation of flame soot FS100.

Figure 11.
TPO curves for real engine soot: catalytic oxidation under real contact (RC) vs. non-catalytic soot oxidation, flame soot (FS100): catalytic oxidation under flame deposition contact (FC) vs. non-catalytic soot oxidation; and catalytic soot oxidation under “gently-shaking” contact (SC).
Figure 11.
TPO curves for real engine soot: catalytic oxidation under real contact (RC) vs. non-catalytic soot oxidation, flame soot (FS100): catalytic oxidation under flame deposition contact (FC) vs. non-catalytic soot oxidation; and catalytic soot oxidation under “gently-shaking” contact (SC).

Figure 12.
(a) Sketch of non-premixed burner showing sampling position on the flame axis; (b) The measured temperature profile over flame axis.
Figure 12.
(a) Sketch of non-premixed burner showing sampling position on the flame axis; (b) The measured temperature profile over flame axis.

Figure 13.
(a) layout of exhaust pipeline from engine test bench; (b) photograph of the sample holder being installed at the marked location of Figure 13a; (c) sketch showing the dimensions of TGA compatible sample holder.
Figure 13.
(a) layout of exhaust pipeline from engine test bench; (b) photograph of the sample holder being installed at the marked location of Figure 13a; (c) sketch showing the dimensions of TGA compatible sample holder.


Table 1.
Elemental compositions of diesel engine soot, carbon black, and flame soot FS100.
| Soot Sample | C | H | N | S | O | Ash |
|---|---|---|---|---|---|---|
| Carbon Black | 95.3 | 0.5 | 0.28 | 0.17 | 2.7 | <0.1 |
| Engine soot | 80.1 | 2.2 | 1.4 | 0.20 | 14.6 | 1.5 |
| Flame soot-FS100 | 96.4 | 0.3 | 0.2 | 0.15 | 2.8 | <0.1 |
Table 2.
Crystalline dimensions for various soot samples.
| Soot Symbol | Soot Origin | d002 (nm) | Lc | La | K |
|---|---|---|---|---|---|
| CB | Printex Carbon black | 0.360 | 1.268 | 6.89 | ~4 |
| DS | Diesel engine soot | 0.359/0.336 | 1.446/22.42 | 7.26 | ~4/~67 |
| FS25 | Flame soot, h = 25 mm | 0.357 | 1.422 | 7.24 | ~4 |
| FS50 | Flame soot, h = 50 mm | 0.358 | 1.413 | 7.27 | ~4 |
| FS100 | Flame soot, h = 100 mm | 0.358 | 1.426 | 7.22 | ~4 |
| FS150 | Flame soot, h = 150 mm | 0.359 | 1.418 | 7.18 | ~4 |
Table 3.
Kinetic parameters for the non-catalytic combustion of Printex-U carbon black, flame soot FS100, and real engine soot.
Table 3.
Kinetic parameters for the non-catalytic combustion of Printex-U carbon black, flame soot FS100, and real engine soot.
| Soot Sample | Reaction Order of C | Reaction Order of O2 | Ea-nth Order Model (kJ/mol) | Ea-Model Free (kJ/mol) |
|---|---|---|---|---|
| Printex-U carbon black | 0.86 | 0.72 | 160 | 145 |
| Printex-U carbon black * | 1 | 0.71 | 132 | -- |
| FS100 | 0.78 | 0.69 | 167 | 147 |
| Engine soot | -- | -- | -- | 139 |
| Engine soot * | 1 | 0.61 | 137 | -- |
Table 4.
Surface area of soots before and after hydrocarbon burnout.
| Sample | Content of HC | Initial SA (m2/g) | Final SA (m2/g) |
|---|---|---|---|
| Printex-U | <3% | 112 | 110 |
| FS-20 | <3% | 108 | 109 |
| FS-50 | <3% | 103 | 103 |
| FS-100 | <3% | 97 | 98 |
| FS-150 | <3% | 71 | 73 |
| Diesel soot | 22–25% | 121 | 171 |
© 2018 by the authors. Licensee MDPI, Basel, Switzerland. This article is an open access article distributed under the terms and conditions of the Creative Commons Attribution (CC BY) license (http://creativecommons.org/licenses/by/4.0/).
Share and Cite
MDPI and ACS Style
Su, C.; Wang, Y.; Kumar, A.; McGinn, P.J. Simulating Real World Soot-Catalyst Contact Conditions for Lab-Scale Catalytic Soot Oxidation Studies. Catalysts 2018, 8, 247. https://doi.org/10.3390/catal8060247
AMA Style
Su C, Wang Y, Kumar A, McGinn PJ. Simulating Real World Soot-Catalyst Contact Conditions for Lab-Scale Catalytic Soot Oxidation Studies. Catalysts. 2018; 8(6):247. https://doi.org/10.3390/catal8060247
Chicago/Turabian StyleSu, Changsheng, Yujun Wang, Ashok Kumar, and Paul J. McGinn. 2018. "Simulating Real World Soot-Catalyst Contact Conditions for Lab-Scale Catalytic Soot Oxidation Studies" Catalysts 8, no. 6: 247. https://doi.org/10.3390/catal8060247
Note that from the first issue of 2016, this journal uses article numbers instead of page numbers. See further details here.