Mode Transition of Filaments in Packed-Bed Dielectric Barrier Discharges
by
 ,
,
Mingxiang Gao
1, 
Ya Zhang
1,2,*,
Hongyu Wang
3,4,
Bin Guo
1,
Quanzhi Zhang
2 and
Annemie Bogaerts
2 1
Department of Physics, Wuhan University of Technology, Wuhan 430070, China
2
Research group PLASMANT Department of Chemistry University of Antwerp, B-2610 Wilrijk-Antwerp, Belgium
3
School of Physics Science and Technology, Anshan Normal University, Anshan 114007, China
4
Shanghai Bright-Tech Information Technology Co. Ltd., Shanghai 201206, China
*
Author to whom correspondence should be addressed.
Catalysts 2018, 8(6), 248; https://doi.org/10.3390/catal8060248
Submission received: 15 May 2018
/
Revised: 12 June 2018
/
Accepted: 13 June 2018
/
Published: 15 June 2018
(This article belongs to the Special Issue Plasma Catalysis)
Abstract
:We investigated the mode transition from volume to surface discharge in a packed bed dielectric barrier discharge reactor by a two-dimensional particle-in-cell/Monte Carlo collision method. The calculations are performed at atmospheric pressure for various driving voltages and for gas mixtures with different N and O compositions. Our results reveal that both a change of the driving voltage and gas mixture can induce mode transition. Upon increasing voltage, a mode transition from hybrid (volume+surface) discharge to pure surface discharge occurs, because the charged species can escape much more easily to the beads and charge the bead surface due to the strong electric field at high driving voltage. This significant surface charging will further enhance the tangential component of the electric field along the dielectric bead surface, yielding surface ionization waves (SIWs). The SIWs will give rise to a high concentration of reactive species on the surface, and thus possibly enhance the surface activity of the beads, which might be of interest for plasma catalysis. Indeed, electron impact excitation and ionization mainly take place near the bead surface. In addition, the propagation speed of SIWs becomes faster with increasing N content in the gas mixture, and slower with increasing O content, due to the loss of electrons by attachment to O molecules. Indeed, the negative O ion density produced by electron impact attachment is much higher than the electron and positive O ion density. The different ionization rates between N and O gases will create different amounts of electrons and ions on the dielectric bead surface, which might also have effects in plasma catalysis.
1. Introduction
Plasma catalysis is gaining increasing interest for various environmental applications, such as gaseous pollutant removal, the splitting of CO, hydrogen generation and O production [1,2,3,4,5,6,7,8,9]. Plasma catalysis can be regarded as the combination of a plasma with a catalyst, and often results in improved performance, in terms of selectivity and energy efficiency of the process. Plasma is an ionized gas, consisting of various reactive species, like electrons, positive ions, negative ions and radicals. These reactive species are created by applying a potential difference to a gas. The gas itself remains at room temperature, which is beneficial in terms of energy saving compared to classical thermal catalysis. Plasma-based pollutant removal and gas conversion have recently gained increased attention, being possible alternatives for chemical reactors. The production of new molecules in the plasma can be selective when a catalyst is added to the plasma. Plasma catalysis can be realized by introducing dielectric packing beads (coated with catalyst material) in the discharge gap, forming a packed bed dielectric barrier discharge (PB-DBD) reactor. The DBD generally occurs in a filamentary mode by applying a high driving voltage [10,11,12,13,14], which induces a very fast ionization avalanche, propagating from powered electrode to grounded electrode, i.e., a so-called streamer [12,13,15,16,17,18,19]. Each streamer starts when the driving voltage passes a certain threshold, and will further polarize the dielectric surface [20].
The ionization avalanches can occur either within the bulk plasma (so-called volume discharge) or along the surface of a dielectric (so-called surface discharge), sustained by electron impact surface ionization waves (SIWs) [21]. SIW discharges operating in N at low pressure (5–100 Torr) and created by high voltage (10–15 kV) nanosecond pulses, traveling along a dielectric surface or a liquid surface, have been experimentally investigated by Intensified Charge Coupled Device (ICCD) camera images [22], with measured propagation speeds of ∼ m/s. Furthermore, a SIW discharge in hydrogen was experimentally reported, by measuring the time-resolved electric field at special positions, within tens of nanosecond pulse scales, using a picosecond four-wave mixing technique [23]. The results showed that the discharge developed itself as a SIW propagating along the dielectric surface at an average speed of ∼ m/s with a maximum electric field of ∼ V/m [23].
On the other hand, volume discharges can be sustained by filamentary microdischarges (MDs) in a PB-DBD reactor, by limiting the dimensions at atmospheric pressure, following the famous Paschen law [24,25,26]. A filamentary MD may be tens of micrometers in space and can exist for a few nanoseconds [27], yielding a high concentration of reactive species in a narrow gap, which is beneficial for pollutant remediation. Furthermore, filamentary MDs can co-exist with SIWs along the surface of the dielectric beads in a PB-DBD reactor under proper conditions [28,29]. This may yield high concentrations of chemically active species and radicals on the surface due to electric field enhancement along the dielectric surface, compared to an unpacked DBD.
The generation of reactive species at catalyst surfaces and in the gaps between the packing beads is very important for plasma catalysis. Therefore, it is crucial to understand the properties of surface and volume discharges and their formation mechanisms. However, only a few theoretical studies have been performed for PB-DBD reactors [11,29,30,31,32,33,34,35,36,37]. Russ et al. [30] adopted a two-dimensional (2D) hydrodynamic theory to study transient MDs in a PB-DBD reactor for a gas mixture 80% N , 20% O, and 500 ppm NO, with 23 species and 120 plasma reactions. However, this work was limited to a one-directional discharge, without considering discharge channels in the voids of the packed beads. Kang et al. [31] implemented a 2D fluid model to investigate the typical properties of MDs in a ferroelectric PB-DBD, focusing only on the surface discharge with strong electric field for two packing beads. Chang et al. [32] studied a ferroelectric packed bed N plasma for a spherical void between two pellets based on the 1D Poisson equation and transport equations. This work focused on the electron density, electron temperature, and electric field as a function of the applied voltage, the discharge gap size, and the dielectric constants of the packing beads.
In our previous work, we employed a kinetic 2D particle-in-cell/Monte Carlo collision (PIC/MCC) model to investigate the formation and propagation of a filamentary MD in a PB-DBD, and the results were compared to an unpacked DBD [11]. Van Laer and Bogaerts developed a comprehensive 2D fluid model for a PB-DBD in helium [33,34,35]. They reported that a packing enhanced the electric field strength and electron energy near the contact points of the dielectric beads. Microplasma discharges in humid air in a PB-DBD reactor were experimentally characterized through ICCDimaging and numerically simulated by the 2D multi-fluid simulator non PDPSIM, with a negative driving voltage at atmospheric pressure [29]. The behavior of three kinds of discharge modes, including positive streamers (restrikes), filamentary MDs and SIWs, were reported in their work. Wang et al. [36] studied the microplasma characteristics by means of fluid modelling and experimental observations using ICCD imaging, for packing materials with different dielectric constants, in dry air at atmospheric pressure. They also studied the same three types of discharges predicted in Ref. [29]. In addition, they reported a transition in discharge mode from surface discharges to local filamentary discharges upon increasing the dielectric constant of the packing from 5 to 1000. Finally, Kang et al. [37] experimentally and numerically investigated surface streamer propagation on an alumina bead, and predicted three distinct phases, i.e., the generation and propagation of a primary streamer with a moderate electric field and velocity, rapid primary streamer acceleration with an enhanced electric field, and slow secondary streamer propagation.
Although several studies have been performed to better understand the microplasma properties in a PB-DBD reactor, as outlined above, the interaction mechanisms between the plasma and the catalyst are still poorly understood. Both physical and chemical effects can play a role in this interaction, and this will affect the discharge types and properties. Therefore, in the present work, we investigate the filament formation and mode transition between volume and surface discharges, as a function of driving voltage and O/N mixing ratio at atmospheric pressure, by using a 2D PIC/MCC model in a micro gap PB-DBD reactor. Specifically, we aim to obtain a better understanding of the production mechanisms and concentrations of reactive species sustained by the different modes.
2. Results and Discussion
The spatial and temporal evolutions of the species densities, electric field, and excitation and ionization rates are presented in this section, including the whole process of filament formation and transition to SIWs.
2.1. Effect of Driving Voltage
It has been reported that the SIW properties are dependent on both the direction and value of the driving voltage and the surface properties [21]. In Figure 1, Figure 2, Figure 3, Figure 4, Figure 5, Figure 6 and Figure 7, we present the effect of driving voltage on the density of the reactive species and the electric field for a dry air discharge (so only a mixture of N and O, no other air components).
Figure 1 shows the electron density for four different driving voltages, i.e., −5 kV (a1–a4), −10 kV (b1–b4), −20 kV (c1–c4) and −30 kV (d1–d4), and four different time intervals. Note that the different time intervals at various driving voltages are based on the filament formation times under the different conditions. The driving voltages are all above the breakdown voltage of air (∼3 kV/mm) in glow mode. Since a filamentary discharge needs higher breakdown voltage than a glow discharge, no filament occurs at −5 kV, so only the seed electron density (∼ m) is shown in Figure 1a1–a4, which corresponds with the values in Ref. [29]. A limited volumetrically sustained filament appears at −10 kV, with an average speed of m/s and a maximum electric field of V/m. For −20 kV, the filament is formed in the gap at around 0.25 ns with an average speed of m/s. Subsequently, the SIWs are developed and start dominating the discharge. The SIWs can be further classified as downward- and upward-propagating modes. The downward-directed SIWs are formed in the time interval of 0.25–0.6 ns with an average velocity of m/s, while the upward-directed SIWs are developed in the time range of 0.6–0.8 ns with an average velocity of m/s. It is worth to note that a multi-channel filamentary MD also develops with the upward-directed SIWs, i.e., the plasma extends away from the dielectric surface. However, the maximum density in the MD is nearly two orders of magnitude lower than in the SIWs, as shown in Figure 1c4, which indicates that the discharge is mainly governed by the SIWs. For the driving voltage of −30 kV, the filament is formed and sustained in the time range of 0–0.2 ns, as nearly pure SIWs propagating downward along the surface with a high speed of m/s, while no upward-directed SIW develops. There is obvious asymmetry in the electron density for −30 kV, due to the inherent statistical character of the streamers.
Therefore, as the driving voltage increases, a mode transition will happen, i.e., the filament is mainly sustained by an MD at low driving voltage (−10 kV), it becomes a combination of a limited portion of MD and significant SIW at a moderate driving voltage (−20 kV), and finally it is almost completely dominated by SIWs. The physical mechanism is that the charged species will rapidly escape to the dielectric surface under the effect of high driving voltage (strong electric field) and charge the dielectric. The surface charging will induce a strong tangential component of electric field along the dielectric surface, and lead to the formation of SIWs. The SIWs will in turn yield high concentrations of reactive species, as well as high electron density on the surface, which will further charge the dielectric, and gradually form a filament along the dielectric surface. This filament may increase the surface activity of the beads, which is probably beneficial for plasma catalysis.
Our results are consistent with the theoretical and experimental predictions in Refs. [22,23,29,36]. For −10 kV, the average speed of the volume streamer is m/s, which is in the same order as in Refs. (∼ and ∼– m/s) [29,36]. For −20 kV, both volume and surface filaments co-exist. Therefore, the filament could propagate in the gaps and on the surface of the dielectric beads. This trend is in good agreement with recent experimental observations by fast-camera imaging for numerous packing beads with dielectric constant of 25. Once the SIWs are initiated in the PB-DBD, we calculate a propagation speed of the SIWs around m/s, which is in the same order as in literature (∼ and ∼ m/s) [22,23]. The reactive species are highly concentrated on the surface due to the presence of SIWs along the catalyst surface, which agrees with experimental observations in literature [22,36].
Figure 2, Figure 3 and Figure 4 show the density of N, O and O ions, respectively, for the same conditions as in Figure 2.
As shown in Figure 2, the N ion density profile is a bit different from the electron density distribution at −20 kV, i.e., with a higher density in the voids between the beads. The maximum N ion density is a bit higher than the electron density, due to loss of electrons by attachment to O molecules. However, the N ion density profile becomes very similar to the electron density distribution at −30 kV, because the discharge is now dominated by pure surface discharges. This indicates that the electron attachment is not significant for a pure surface discharge.
Figure 3 clearly shows that the O ions are mainly formed along the dielectric surface by the SIWs, and the maximum density is about 20 times lower than the maximum electron density for all driving voltages, because it is more difficult for the discharge to become sustained in O gas [38]. This can be justified by the ionization rate shown later in Figure 5.
Figure 4 presents the O ion density distribution. The O ions are generated by electron impact attachment. Thus, the space and time distributions of the O ion density are nearly the same as for the electron density, but the maximum density is about two times smaller than the maximum electron density due to the smaller fraction of O in air.
Therefore, in total, the electrons and N ions are present both along the dielectric surface and in the gaps between the beads, whereas the O and O ions only concentrate along the dielectric surface at −20 kV. The difference in spatial distributions of charged reactive species may affect the catalytic selectivity, which is important for plasma catalysis, as the interaction between the charged species and the surface might influence the morphology and work function of the catalyst, and accordingly affect the catalyst performance. However, the exact influence cannot be deduced from our model and can be quite complicated, which is beyond the scope of this work.
It has been reported [11,33,36,39] that the local electric field can be enhanced near the contact points and at the boundaries between beads and dielectric layers. This is because the dielectric beads and plates are strongly polarized by the applied electric field, which reduces the potential drop in the dielectric, but increases the potential drop in the gas gap. However, most of the previous works only focus on local electric field in the gas gap [29,40], but they do not study the variation and influence of the electric field in the dielectric materials.
Figure 6 shows the electric field amplitudes for the same conditions as in Figure 1, and Figure 7 shows the vertical and horizontal electric field components for −20 kV (at 0.8 ns) and −30 kV (at 0.2 ns). As clearly seen from Figure 6 and Figure 7, the presence of dielectric beads and plates induces a sharp boundary with the gas phase, which strongly enhances the displacement electric field inside the dielectric material near this boundary. As a result, the electric field on the surface and in the voids of the packing beads is also enhanced, due to the significant charge accumulation in the narrow gaps (see Figure 1, Figure 2, Figure 3 and Figure 4 above). Indeed, the local electric field inside the vertical gaps between two beads (or between bead and plate) is enhanced so much that the maximum value is much larger than the average external electric field, even for the lowest driving voltage of −5 kV without breakdown. The maximum values, presented in Figure 6, stay constant when there is no breakdown, but they increase with time when there is a discharge.
The electric field is more enhanced in the vertical gaps between the dielectric beads than inside the materials for the −10 kV case, due to the very limited filamentary MD, as displayed in Figure 1b. On the other hand, at −20 kV and −30 kV, the electric field on and near the surface of the dielectric materials is significantly enhanced, due to the high concentration of the charged species on the catalyst surfaces (see Figure 1, Figure 2, Figure 3 and Figure 4 above). In addition, as shown in Figure 6c4, the electric field is also obviously enhanced in the head of the upward-directed SIWs (noted in Figure 1c4 above), where the electric field is characterized by an overlap of both vertical and horizontal electric field components. Behind the SIW head, the vertical component rapidly reduces, as shown in Figure 7a1.
Moreover, at −30 kV, the electric field has its maximum values on the surface of the beads and plates, and the values gradually decrease away from the surface boundary, because of the pure surface discharge mode. The high electric field on the dielectric bead surface is important for plasma catalysis [8], because it could induce locally stronger electron impact reactions, thus higher reaction rates and a higher plasma density. The SIW discharges therefore play an important role in a PB-DBD reactor for plasma catalysis applications. The physical mechanism is related to the high concentration of reactive species on the surface of the beads, which yields tangential components of the electric field, and the latter in turn enhance the SIWs.
We calculated the tangential components of the electric field to be around V/m, as shown in Figure 7b2, which is larger than the value of V/m from literature [29]. The difference is mainly due to the much smaller discharge gap of 1 mm, and bead size of 508 m (bead diameter) used in this work, compared to the large discharge gap of 1 cm and bead size of 1.8 mm (bead diameter) in Ref. [29], as the same driving voltage will induce a much stronger electric field in a smaller gap. In addition, we consider ZrO dielectric beads with a dielectric constant of 22, which yields stronger polarization than for quartz material with a dielectric constant of 4, used in Ref. [29]. This stronger polarization also induces a higher electric field in the gap.
In order to elucidate the mechanisms giving rise to the SIWs on the dielectric surfaces, we need to distinguish where the reactive species are generated, either on the dielectric surfaces or in the gap. To clarify this, the electron impact excitation rate (a1–b1) and ionization rate (a2–b2), for N (a1–a2) and O (b1–b2) components in the mixture, are plotted in Figure 8, for 0.8 ns and a driving voltage of −20 kV.
As seen in Figure 5, both excitation and ionization mainly take place on the surface of the beads. The maximum excitation rate is about one order of magnitude higher than the maximum ionization rate, due to the lower threshold energy needed for excitation reactions (see Table 1 below). The excitation rate for the N component is almost uniformly distributed on all surfaces, and fills the gaps between beads 3, 4 and 5, indicating that the excited N molecules will be fairly uniformly distributed on these surfaces and in the gaps. The ionization rate for the N component is locally enhanced on the top surface of dielectric bead 4 and the bottom dielectric plate, due to the high local electric field there, which corresponds to the higher N ion density at these positions, shown in Figure 2c4. Although the excitation and ionization rates for the N component spread out from the surface and cause restrikes [29], which may further give rise to multi-channel filamentary MD (see Figure 1c4 above), the maximum values in the restrikes are about one order of magnitude smaller than on the surface, as shown in Figure 5a1–a2. This again demonstrates that the SIWs are the main discharge mode at the driving voltage of −20 kV, while the MDs sustained by column-like filaments are more or less negligible.
On the other hand, both the excitation and ionization rates for the O component show discontinuous distributions on the bead surfaces, except for the top surface of central bead 4, as shown in Figure 5b1–b2. This indicates that the production of the excited O molecules and the O ions is not a continuous process, but rather a discrete process, as predicted in Ref. [29]. This discontinuous ionization rate leads to a rather discretely distributed O ion density (see Figure 3 above).
The difference between the ionization rate for N and O gas components may be attributed to the different mean free path for ionization collisions. The mean free path for ionization collisions with N is about 250 m (hence similar to the radius of the beads, i.e., 254 m), while it is ∼2 mm (similar with the perimeter of the beads) for O. A shorter ionization mean free path results in more intensive ionization collisions, whereas an ionization mean free path longer than the bead radius and the gap distance between beads results in weaker ionization and may yield a discrete distribution, as shown in Figure 5b2. Although the densities of the excited species (N and O) are not displayed in this work, the electron impact excitation rate reveals that these excited species are highly concentrated on the surface. The electron impact ionization rate profile can be considered as evidence for SIW formation on the surface.
2.2. Effect of the Gas Composition
We vary the O/N mixing ratio in this subsection, to obtain better insight in the different character between electropositive and electronegative gases. The effect of gas composition on the production of MDs inside porous ceramics was investigated experimentally by Hensel et al. [38], using photographic visualization and optical emission spectroscopy. It was predicted that a higher O content resulted in the redistribution of the MD channels inside the porousceramics [38], while the total number of MD channels was reduced, since the breakdown voltage was increased. Their results can be partially correlated to the excitation and ionization rates, which are stronger in N than in O, as shown in Figure 5 above. Therefore, it is important to understand the effect of gas composition on the mechanisms of filament formation and mode transition between volume and surface filaments in a PB-DBD reactor, which has not been reported before.
In this section, we will demonstrate that the gas composition is a critical parameter for mode transition. Figure 8, Figure 9, Figure 10 and Figure 11 present the density of charged species (electrons, N, O and O ions) at 0.2, 0.25, 0.4 and 0.7 ns, for a driving voltage of −20 kV, and different compositions of N and O in the mixture, i.e., N (a1–a4), O and N (b1–b4), O and N (c1–c4), and O (d1–d4).
Figure 8 shows the electron density. The filament is initiated from t = 0 with a few seed electrons. The filaments travel for a similar distance within 0.2 ns, and arrive at the central bead 4 at 0.25 ns, for the different gas compositions, except in the case of O and O. However, after the filaments reach the central bead, their propagation speed becomes faster in N gas and gradually becomes slower with increasing O contents, as shown in Figure 8 at 0.4 and 0.7 ns. Indeed, the average speed of the filaments is m/s during the first 0.25 ns, while during 0.25–0.4 ns, the average speed is m/s for pure N gas, indicating the fastest SIW, m/s for O, m/s for O, and m/s for pure O.
The physical mechanism is that the discharge is more difficult to be sustained, and thus it needs a higher breakdown voltage and leads to a slower discharge evolution, for electronegative gas, due to the loss of electrons by attachment to O molecules. This feature was experimentally confirmed by Hensel et al. [38], through measurements of the breakdown voltage in a N/O gas mixture. Therefore, for the same driving voltage, the discharge can more easily be created in N than in O, resulting in gradually slower propagation speeds of the filaments upon higher O fractions in the mixture.
For pure N gas, our calculations predict a dominated surface discharge with a negligible volume discharge. Indeed, the maximum electron density ( m) on the surface is approximately five orders of magnitude higher than in the gap ( m). The electron density is almost uniformly distributed on the bead surfaces after the filament reaches the central bead 4.
The maximum electron density on the bead surfaces is represented by the red color in Figure 8. It is smooth for the first two cases, indicating that the electron density is indeed uniformly distributed, while it becomes discontinuous with increasing O contents. However, the maximum electron density still occurs on the surface and not in the gap, giving rise to a high concentration of electrons on a specific part of the surface in pure O. Again it shows that the SIWs can produce a high density of charged species on the surface of the beads, which might be beneficial for gas treatment by plasma catalysis [46]. Finally, while adding more O to the mixture makes the SIWs to become discontinuous, the gas mixture almost does not affect the volume discharge, as seen in Figure 8.
The ion density profiles, for the same conditions as in Figure 8, are plotted in Figure 9 (N), Figure 10 (O), and Figure 11 (O).
The N ion density profile is similar to the electron density profile, but the maximum N ion density is two times larger than the electron density, again due to the loss of electrons by attachment to the O molecules. The number of lost electrons can be determined by the O ion density (see Figure 11 below). The maximum N ion density ( m) is always found on the surfaces, and the speed of the N ion filament is almost the same as for the electron filament discussed above.
The O ion density exhibits different profiles with increasing O content, as shown in Figure 10. The O ion density is at least two times smaller than the electron density, for the same reason as explained above, i.e., it becomes harder for the discharge to be created for high O content at a fixed driving voltage, resulting in a lower O ion density. As a result, the O ion density is at least four times smaller than the N ion density at equal gas fractions (/ mixture). In pure O, the propagation speed of the SIW is about two times slower than in pure N, and no MD channel is formed above the surface of beads 3 and 5, due to the absence of an upward-directed SIW.
The O ions are again mainly formed on the surface by the SIWs, with a maximum value of m in O, which is 2.6 times higher than the maximum electron density and 5.8 times higher than the maximum O ion density, indicating that electron attachment is quite significant. Indeed, attachment is easier than ionization, because it requires no threshold energy, while the ionization threshold is 12.06 eV for O and 15.58 eV for N. Therefore, the O ion density sharply increases with rising O content, as expected.
3. Description of the Model
3.1. Model Assumptions
The dimensions of the whole reactor are 1.65 mm in the y direction and 10 mm in the x direction. The discharge is sustained between two parallel plate electrodes covered by two dielectric layers of 0.3 mm thickness, separated by a gap of 1 mm in the y direction. Dielectric beads are inserted in the gap, forming a packed bed reactor. The dielectric constant of the layers and the beads is , characteristic for ZrO. A schematic illustration of the reactor is presented in Figure 12, showing in the x direction only the central part including the dielectric beads, but the entire simulation region is taken from 0 to 10 mm in the x dimension. The dielectric layers and beads are colored in blue. We consider five dielectric spheres with diameter d = 508 m. In order to leave some gas space for the filament formation between the packing beads, these five beads are packed in a non-strict spherical packing manner [11], with distance between adjacent bead centers of in the y dimension and 1.1d in the x dimension. Note that some gaps are present between the dielectric beads in Figure 12. This was intentional to show filament formation. Indeed, streamers cannot propagate in a 2D system without gaps between the beads, while they can propagate either along the bead surfaces or the gaps between the beads in a 3D case. We thus assume a certain gap between the beads, to allow the streamers propagate in our 2D model. Furthermore, even in experimental (3D) packed-bed reactors, there are some gaps between the dielectric beads, i.e., the cross sections between the beads are similar with the 2D model, when a lot of beads are packed together, as the beads cannot touch each other perfectly. This can be observed from Ref. [49]. On the other hand, it needs extremely long calculation times to model a PB-DBD with 5 beads in an entire 3D geometry, owing to severe mesh requirements and very large number of macro particles. Therefore, we consider a 2D model.
The upper electrode (y = 1.65 mm) is powered by a pulsed voltage with a rise time of 0.1 ns and then kept constant for the duration of the simulation, considered as the cathode. The lower electrode (anode; y = 0 mm) is grounded. The dielectric surfaces are considered as absorption boundaries for the reactive plasma species, i.e., all reactive species will be removed from the simulation if they hit the surface of the dielectrics and they cannot participate in the discharge anymore. The absorbing boundary condition is a reasonable and widely used boundary condition in PIC model [50]. When charged species are absorbed on the dielectrics, they can emit a secondary electron and they will deposit their charge on the dielectric surface. The deposited charge is determined by the charge of the ion striking the dielectric surface and the secondary electron emission charge and coefficient, accounting for the formalism . Here, Q is the deposited charge with initial value of zero, Q is the charge of the ions striking the dielectric surfaces of the beads or layers, and Q is the charge of the secondary electron, respectively. The effect of secondary electron emission is self-consistently coupled in the PIC/MCC model, assuming a constant ion impact secondary electron emission coefficient of 0.15 [29].
Photoionization is neglected in this study. Indeed, we found in our previous work [39] that the results are nearly the same with and without photoionization in a gap of tens of m, which is the typical gap size between the packing beads and between the dielectric layers and the beads in a PB-DBD. Furthermore, the photoionization rate was nearly two or three orders of magnitude lower than the electron impact ionization rate, even in a large gap (hundreds of m ) [29,36]. Indeed, as will be shown below, the filaments in the present model are mainly sustained by SIWs, and the volume discharges will be negligible in a narrow gap of ∼10 m.
The simulations are applied to a mixture of N and O at atmospheric pressure with a temperature of 300 K. Only charged species, i.e., electrons (e) and ions (N , O and O), are simulated in this PIC/MCC model, as the total ionization degree is typically less than . Filaments are initiated from initial seeding electrons emitted from the surface of the top dielectric plate in the region mm. A few seed electrons can be generated by cosmic radiation or external emission. The emission current density is set as Am. Subsequently, the filament sustains itself through anode-directed avalanches due to the electron impact ionization and secondary electron emission. Dissociation process, and the behavior of atomic ions, are not included in the model, because the cross sections of these reactions are relatively small, thus omitting these reactions will almost not affect the kinetics of the streamer.
3.2. Simulation Method
We developed a 2D PIC/MCC model based on the VSIM simulation software [51], which has been widely used and validated [11,39,51]. This PIC/MCC simulation is based on an explicit and electrostatic method, which was first introduced and described in detail in Ref. [52]. The PIC/MCC model takes advantage of accounting for the detailed kinetic behavior of charged particles, compared to a fluid model. There are four steps in a PIC/MCC model: (1) pushing the particle velocity based on the previous electric field; (2) weighting from the positions of all charged particles to obtain the charge density; (3) summing and extrapolating the charge density to achieve a new electric field based on the Poisson equation; and (4) using a standard MCC method to describe electron impact elastic collisions, excitations, ionizations and electron attachment.
The particle pushing procedure is described by the Newton equations
where
Here n represents the nth time step ().The new electric field in time is solved by the Poisson
where is the permittivity, and is the total charge density, given by
Here, p represents the electrons (e) and ions (N, O and O), and , , , and S are the particle position, velocity, charge, mass and shape function in space. The shape function is chosen to be a first order b-spline () function, , with . The time step fulfills the Courant condition
with the light speed c, and the space steps in x and y directions and . As mentioned above, the simulation region is 1.65 mm in the y direction and 10 mm in the x direction, and we use a mesh of 1000 × 500 uniform grid points. Dirichlet boundary conditions are adopted in the y direction, and Neumann conditions are used in the x direction.
A standard MCC method [53] is used to account for the electron impact elastic, excitation, ionization and attachment collisions with N and O gas molecules, as listed in Table 1. The cross sections and threshold energies used for these reactions are adopted from the Refs. [41,42,43,44] and downloaded from LXCat database [45].
We consider only three types of ions, since they are the most important ones, with the lowest ionization threshold and largest density compared to other ions. We consider a simulation time up to 0.8 ns, which is enough to develop both the volume and surface discharges in a PB-DBD reactor. Thus, the effect of electron-ion and negative ion-positive ion recombination is negligible. Indeed the recombination reactions have a larger relaxation time up to the microsecond time scale, as predicted by Kruszelnicki et al. [29], as it requires a sequence of two-body reactions or three body reactions.
4. Conclusions
We have applied a 2D PIC/MCC model to study the formation and mode transition of filamentary discharges for a PB-DBD reactor with various driving voltages and N/O gas mixtures at atmospheric pressure. The discharge is sustained between two parallel plate electrodes covered by two dielectric plates, separated by a gap distance of 1mm. Dielectric beads are inserted in the gap to form a PB- DBD reactor.
As the driving voltage increases, a pure surface discharge gradually dominates, because the charged species can more easily escape to the beads and charge the bead surface due to the strong electric field at high driving voltage. This significant surface charging will enhance the tangential component of the electric field along the bead surface, yielding SIWs. The SIWs, in turn, yield a high concentration of reactive species on the bead surface, which will affect the chemical reactions (and energy efficiency) in plasma catalysis. Indeed, electron impact excitation and ionization mainly take place on the bead surfaces.
The propagation speed of SIWs becomes faster in N gas and slower with increasing O content, because it is more difficult for the discharge to be created, and it yields a slower discharge evolution in electronegative gas, due to the loss of electrons by attachment to O molecules. This trend can also be understood from the significant difference in ionization rates between N and O gases. These different ionization rates will create different amounts of electrons and ions on the dielectric bead surface, which might have consequences for plasma catalysis.
Author Contributions
Visualization and Simulations, M.G.; Conceptualization, Y.Z.; Formal analysis, Y.Z., B.G., Q.Z. and A.B.; Software, H.W.; Writing—original draft, Y.Z.
Funding
This work was supported by the Natural Science Foundation of China (NSFC) (11775164, 11775090, 11575135) and the Fundamental Research Funds for the Central Universities (WUT: 2018IB011 and 2017IVA79). Ya Zhang gratefully acknowledges the Belgian Federal Science Policy Office for financial support.
Acknowledgments
The authors are very grateful to Wei Jiang for the useful discussions on the particle-in- cell/Monte-Carlo collision model.
Conflicts of Interest
The authors declare no conflict of interest.
References
- Neyts, E.C.; Ostrikov, K.; Sunkara, M.K.; Bogaerts, A. Plasma Catalysis: Synergistic Effects at the Nanoscale. Chem. Rev. 2015, 115, 13408–13446. [Google Scholar] [CrossRef] [PubMed]
- Yi, H.; Du, H.; Hu, Y.; Yan, H.; Jiang, H.L.; Lu, J. Precisely Controlled Porous Alumina Overcoating on Pd Catalyst by Atomic Layer Deposition: Enhanced Selectivity and Durability in Hydrogenation of 1,3-Butadiene. ACS Catal. 2015, 5, 2735–2739. [Google Scholar] [CrossRef]
- O’Neill, B.J.; Jackson, D.H.; Lee, J.; Canlas, C.; Stair, P.C.; Marshall, C.L.; Elam, J.W.; Kuech, T.F.; Dumesic, J.A.; Huber, G.W. Catalyst design with atomic layer deposition. ACS Catal. 2015, 5, 1804–1825. [Google Scholar] [CrossRef]
- Chen, H.L.; Lee, H.M.; Chen, S.H.; Chao, Y.; Chang, M.B. Review of plasma catalysis on hydrocarbon reforming for hydrogen production—Interaction, integration, and prospects. Appl. Catal. B Environ. 2008, 85, 1–9. [Google Scholar] [CrossRef]
- Van Durme, J.; Dewulf, J.; Leys, C.; Van Langenhove, H. Combining non-thermal plasma with heterogeneous catalysis in waste gas treatment: A review. Appl. Catal. B Environ. 2008, 78, 324–333. [Google Scholar] [CrossRef] [Green Version]
- Chen, H.L.; Lee, H.M.; Chen, S.H.; Chang, M.B.; Yu, S.J.; Li, S.N. Removal of volatile organic compounds by single-stage and two-stage plasma catalysis systems: A review of the performance enhancement mechanisms, current status, and suitable applications. Environ. Sci. Technol. 2009, 43, 2216–2227. [Google Scholar] [CrossRef] [PubMed]
- Whitehead, J.C. Plasma catalysis: A solution for environmental problems. Pure Appl. Chem. 2010, 82, 1329–1336. [Google Scholar] [CrossRef] [Green Version]
- Neyts, E.; Bogaerts, A. Understanding plasma catalysis through modelling and simulation—A review. J. Phys. D Appl. Phys. 2014, 47, 224010. [Google Scholar] [CrossRef]
- Takashima, K.; Kaneko, T. Ozone and dinitrogen monoxide production in atmospheric pressure air dielectric barrier discharge plasma effluent generated by nanosecond pulse superimposed alternating current voltage. Plasma Sources Sci. Technol. 2017, 26, 065018. [Google Scholar] [CrossRef]
- Dong, L.; Xiao, H.; Fan, W.; Yin, Z.; Zhao, H. Temporal symmetry of individual filaments in different spatial symmetry filaments pattern in a dielectric barrier discharge. Phys. Plasmas 2010, 17, 102314. [Google Scholar] [CrossRef]
- Zhang, Y.; Wang, H.y.; Jiang, W.; Bogaerts, A. Two-dimensional particle-in cell/Monte Carlo simulations of a packed-bed dielectric barrier discharge in air at atmospheric pressure. New J. Phys. 2015, 17, 083056. [Google Scholar] [CrossRef] [Green Version]
- Babaeva, N.Y.; Kushner, M.J. Self-organization of single filaments and diffusive plasmas during a single pulse in dielectric-barrier discharges. Plasma Sources Sci. Technol. 2014, 23, 065047. [Google Scholar] [CrossRef]
- Babaeva, N.Y.; Naidis, G.V.; Kushner, M.J. Interaction of positive streamers in air with bubbles floating on liquid surfaces: Conductive and dielectric bubbles. Plasma Sources Sci. Technol. 2018, 27. [Google Scholar] [CrossRef]
- Fan, W.; Sheng, Z.; Liu, F.; Zhong, X.; Dong, L. Mechanisms of fine structure formation in dielectric barrier discharges. Phys. Plasmas 2018, 25, 023502. [Google Scholar] [CrossRef] [Green Version]
- Chanrion, O.; Neubert, T. A PIC-MCC code for simulation of streamer propagation in air. J. Comput. Phys. 2008, 227, 7222–7245. [Google Scholar] [CrossRef]
- Papageorghiou, L.; Panousis, E.; Loiseau, J.; Spyrou, N.; Held, B. Two-dimensional modelling of a nitrogen dielectric barrier discharge (DBD) at atmospheric pressure: Filament dynamics with the dielectric barrier on the cathode. J. Phys. D Appl. Phys. 2009, 42, 105201. [Google Scholar] [CrossRef]
- Babaeva, N.Y.; Kushner, M.J. Ion energy and angular distributions onto polymer surfaces delivered by dielectric barrier discharge filaments in air: I. Flat surfaces. Plasma Sources Sci. Technol. 2011, 20, 035017. [Google Scholar] [CrossRef]
- Akishev, Y.; Aponin, G.; Balakirev, A.; Grushin, M.; Karalnik, V.; Petryakov, A.; Trushkin, N. DBD surface streamer expansion described using nonlinear diffusion of the electric potential over the barrier. J. Phys. D Appl. Phys. 2013, 46, 464014. [Google Scholar] [CrossRef]
- Inada, Y.; Aono, K.; Ono, R.; Kumada, A.; Hidaka, K.; Maeyama, M. Two-dimensional electron density measurement of pulsed positive primary streamer discharge in atmospheric-pressure air. J. Phys. D Appl. Phys. 2017, 50, 174005. [Google Scholar] [CrossRef]
- Kogelschatz, U. Dielectric-barrier discharges: Their history, discharge physics, and industrial applications. Plasma Chem. Plasma Process. 2003, 23, 1–46. [Google Scholar] [CrossRef]
- Vasilyak, L.M.; Kostyuchenko, S.; Kudryavtsev, N.N.; Filyugin, I. Fast ionisation waves under electrical breakdown conditions. Physics-Uspekhi 1994, 37, 247–268. [Google Scholar] [CrossRef]
- Petrishchev, V.; Leonov, S.; Adamovich, I.V. Studies of nanosecond pulse surface ionization wave discharges over solid and liquid dielectric surfaces. Plasma Sources Sci. Technol. 2014, 23, 065022. [Google Scholar] [CrossRef]
- Goldberg, B.M.; Böhm, P.S.; Czarnetzki, U.; Adamovich, I.V.; Lempert, W.R. Electric field vector measurements in a surface ionization wave discharge. Plasma Sources Sci. Technol. 2015, 24, 055017. [Google Scholar] [CrossRef]
- Kushner, M.J. Modeling of microdischarge devices: Pyramidal structures. J. Appl. Phys. 2004, 95, 846–859. [Google Scholar] [CrossRef]
- Bruggeman, P.; Brandenburg, R. Atmospheric pressure discharge filaments and microplasmas: Physics, chemistry and diagnostics. J. Phys. D Appl. Phys. 2013, 46, 464001. [Google Scholar] [CrossRef]
- Zhang, Y.; Jiang, W.; Zhang, Q.; Bogaerts, A. Computational study of plasma sustainability in radio frequency micro-discharges. J. Appl. Phys. 2014, 115, 193301. [Google Scholar] [CrossRef]
- Šimek, M. Optical diagnostics of streamer discharges in atmospheric gases. J. Phys. D Appl. Phys. 2014, 47, 463001. [Google Scholar] [CrossRef]
- Tu, X.; Gallon, H.J.; Whitehead, J.C. Transition behavior of packed-bed dielectric barrier discharge in argon. IEEE Trans. Plasma Sci. 2011, 39, 2172–2173. [Google Scholar] [CrossRef]
- Kruszelnicki, J.; Engeling, K.W.; Foster, J.E.; Xiong, Z.; Kushner, M.J. Propagation of negative electrical discharges through 2-dimensional packed bed reactors. J. Phys. D Appl. Phys. 2017, 50, 025203. [Google Scholar] [CrossRef]
- Russ, H.; Neiger, M.; Lang, J.E. Simulation of micro discharges for the optimization of energy requirements for removal of NO x from exhaust gases. IEEE Trans. Plasma Sci. 1999, 27, 38–39. [Google Scholar] [CrossRef]
- Kang, W.S.; Park, J.M.; Kim, Y.; Hong, S.H. Numerical study on influences of barrier arrangements on dielectric barrier discharge characteristics. IEEE Trans. Plasma Sci. 2003, 31, 504–510. [Google Scholar] [CrossRef]
- Takaki, K.; Chang, J.S.; Kostov, K.G. Atmospheric pressure of nitrogen plasmas in a ferroelectric packed bed barrier discharge reactor. Part I. Modeling. IEEE Trans. Dielectr. Electr. Insul. 2004, 11, 481–490. [Google Scholar] [CrossRef]
- Van Laer, K.; Bogaerts, A. Fluid modelling of a packed bed dielectric barrier discharge plasma reactor. Plasma Sources Sci. Technol. 2016, 25, 015002. [Google Scholar] [CrossRef]
- Van Laer, K.; Bogaerts, A. Influence of gap size and dielectric constant of the packing material on the plasma behaviour in a packed bed DBD reactor: A fluid modelling study. Plasma Process. Polym. 2017, 14. [Google Scholar] [CrossRef]
- Van Laer, K.; Bogaerts, A. How bead size and dielectric constant affect the plasma behaviour in a packed bed plasma reactor: A modelling study. Plasma Sources Sci. Technol. 2017, 26, 085007. [Google Scholar] [CrossRef]
- Wang, W.; Kim, H.H.; Van Laer, K.; Bogaerts, A. Streamer propagation in a packed bed plasma reactor for plasma catalysis applications. Chem. Eng. J. 2018, 334, 2467–2479. [Google Scholar] [CrossRef]
- Kang, W.S.; Kim, H.H.; Teramoto, Y.; Ogata, A.; Lee, J.Y.; Kim, D.W.; Hur, M.; Song, Y.H. Surface streamer propagations on an alumina bead: Experimental observation and numerical modeling. Plasma Sources Sci. Technol. 2018, 27, 015018. [Google Scholar] [CrossRef]
- Hensel, K.; Martišovitš, V.; Machala, Z.; Janda, M.; Leštinskỳ, M.; Tardiveau, P.; Mizuno, A. Electrical and optical properties of AC microdischarges in porous ceramics. Plasma Process. Polym. 2007, 4, 682–693. [Google Scholar] [CrossRef]
- Zhang, Y.; Wang, H.Y.; Zhang, Y.R.; Bogaerts, A. Formation of microdischarges inside a mesoporous catalyst in dielectric barrier discharge plasmas. Plasma Sources Sci. Technol. 2017, 26, 054002. [Google Scholar] [CrossRef]
- Zhang, Y.R.; Van Laer, K.; Neyts, E.C.; Bogaerts, A. Can plasma be formed in catalyst pores? A modeling investigation. Appl. Catal. B Environ. 2016, 185, 56–67. [Google Scholar] [CrossRef]
- Lieberman, M.A.; Lichtenberg, A.J. Principles of Plasma Discharges and Materials Processing; John Wiley & Sons: Hoboken, NJ, USA, 2005. [Google Scholar]
- Furman, M.; Pivi, M. Probabilistic model for the simulation of secondary electron emission. Phys. Rev. Spec. Top. 2002, 5, 124404. [Google Scholar] [CrossRef]
- Phelps, A.; Petrovic, Z.L. Cold-cathode discharges and breakdown in argon: Surface and gas phase production of secondary electrons. Plasma Sources Sci. Technol. 1999, 8, R21. [Google Scholar] [CrossRef]
- Pancheshnyi, S.; Biagi, S.; Bordage, M.; Hagelaar, G.; Morgan, W.; Phelps, A.; Pitchford, L. The LXCat project: Electron scattering cross sections and swarm parameters for low temperature plasma modeling. Chem. Phys. 2012, 398, 148–153. [Google Scholar] [CrossRef] [Green Version]
- LXCat Website. Biagi-v8.9 Database. Available online: www.lxcat.net (accessed on 11 June 2015).
- Kim, H.H.; Prieto, G.; Takashima, K.; Katsura, S.; Mizuno, A. Performance evaluation of discharge plasma process for gaseous pollutant removal. J. Electrost. 2002, 55, 25–41. [Google Scholar] [CrossRef]
- Song, H.K.; Choi, J.W.; Yue, S.H.; Lee, H.; Na, B.K. Synthesis gas production via dielectric barrier discharge over Ni/γ-Al2O3 catalyst. Catal. Today 2004, 89, 27–33. [Google Scholar] [CrossRef]
- Van Durme, J.; Dewulf, J.; Sysmans, W.; Leys, C.; Van Langenhove, H. Efficient toluene abatement in indoor air by a plasma catalytic hybrid system. Appl. Catal. B Environ. 2007, 74, 161–169. [Google Scholar] [CrossRef]
- Kim, H.H.; Teramoto, Y.; Sano, T.; Negishi, N.; Ogata, A. Effects of Si/Al ratio on the interaction of nonthermal plasma and Ag/HY catalysts. Appl. Catal. B Environ. 2015, 166, 9–17. [Google Scholar] [CrossRef]
- Tskhakaya, D.; Matyash, K.; Schneider, R.; Taccogna, F. The Particle-In-Cell Method. Contrib. Plasma Phys. 2007, 47, 563–594. [Google Scholar] [CrossRef]
- Nieter, C.; Cary, J.R. VORPAL: A versatile plasma simulation code. J. Comput. Phys. 2004, 196, 448–473. [Google Scholar] [CrossRef]
- Birdsall, C.K. Particle-in-cell charged-particle simulations, plus Monte Carlo collisions with neutral atoms, PIC-MCC. IEEE Trans. Plasma Sci. 1991, 19, 65–85. [Google Scholar] [CrossRef]
- Nanbu, K.; Mitsui, K.; Kondo, S. Self-consistent particle modelling of dc magnetron discharges of an O2 /Ar mixture. J. Phys. D Appl. Phys. 2000, 33, 2274. [Google Scholar] [CrossRef]
Figure 1.
Electron density (m) at different times, for different driving voltages, i.e., −5 kV (a1–a4), −10 kV (b1–b4), −20 kV (c1–c4), and −30 kV (d1–d4), in an air discharge. The same color scale is used in all panels to allow comparison. The different time intervals for different driving voltages are based on the different filament formation times for the different conditions.

Figure 2.
N ion density (m) for the same conditions as in Figure 1.
Figure 2.
N ion density (m) for the same conditions as in Figure 1.

Figure 3.
O ion density (m) for the same conditions as in Figure 1.
Figure 3.
O ion density (m) for the same conditions as in Figure 1.

Figure 4.
O ion density (m) for the same conditions as in Figure 1.
Figure 4.
O ion density (m) for the same conditions as in Figure 1.

Figure 5.
(a1,b1) Electron impact excitation rate (ms) and (a2,b2) electron impact ionization rate (ms), at 0.8 ns for a driving voltage of −20 kV, in an air discharge, for the nitrogen (a1,a2) and oxygen (b1,b2) components. The same color scale is used in all panels to allow comparison. The maximum values are noted in the figure.
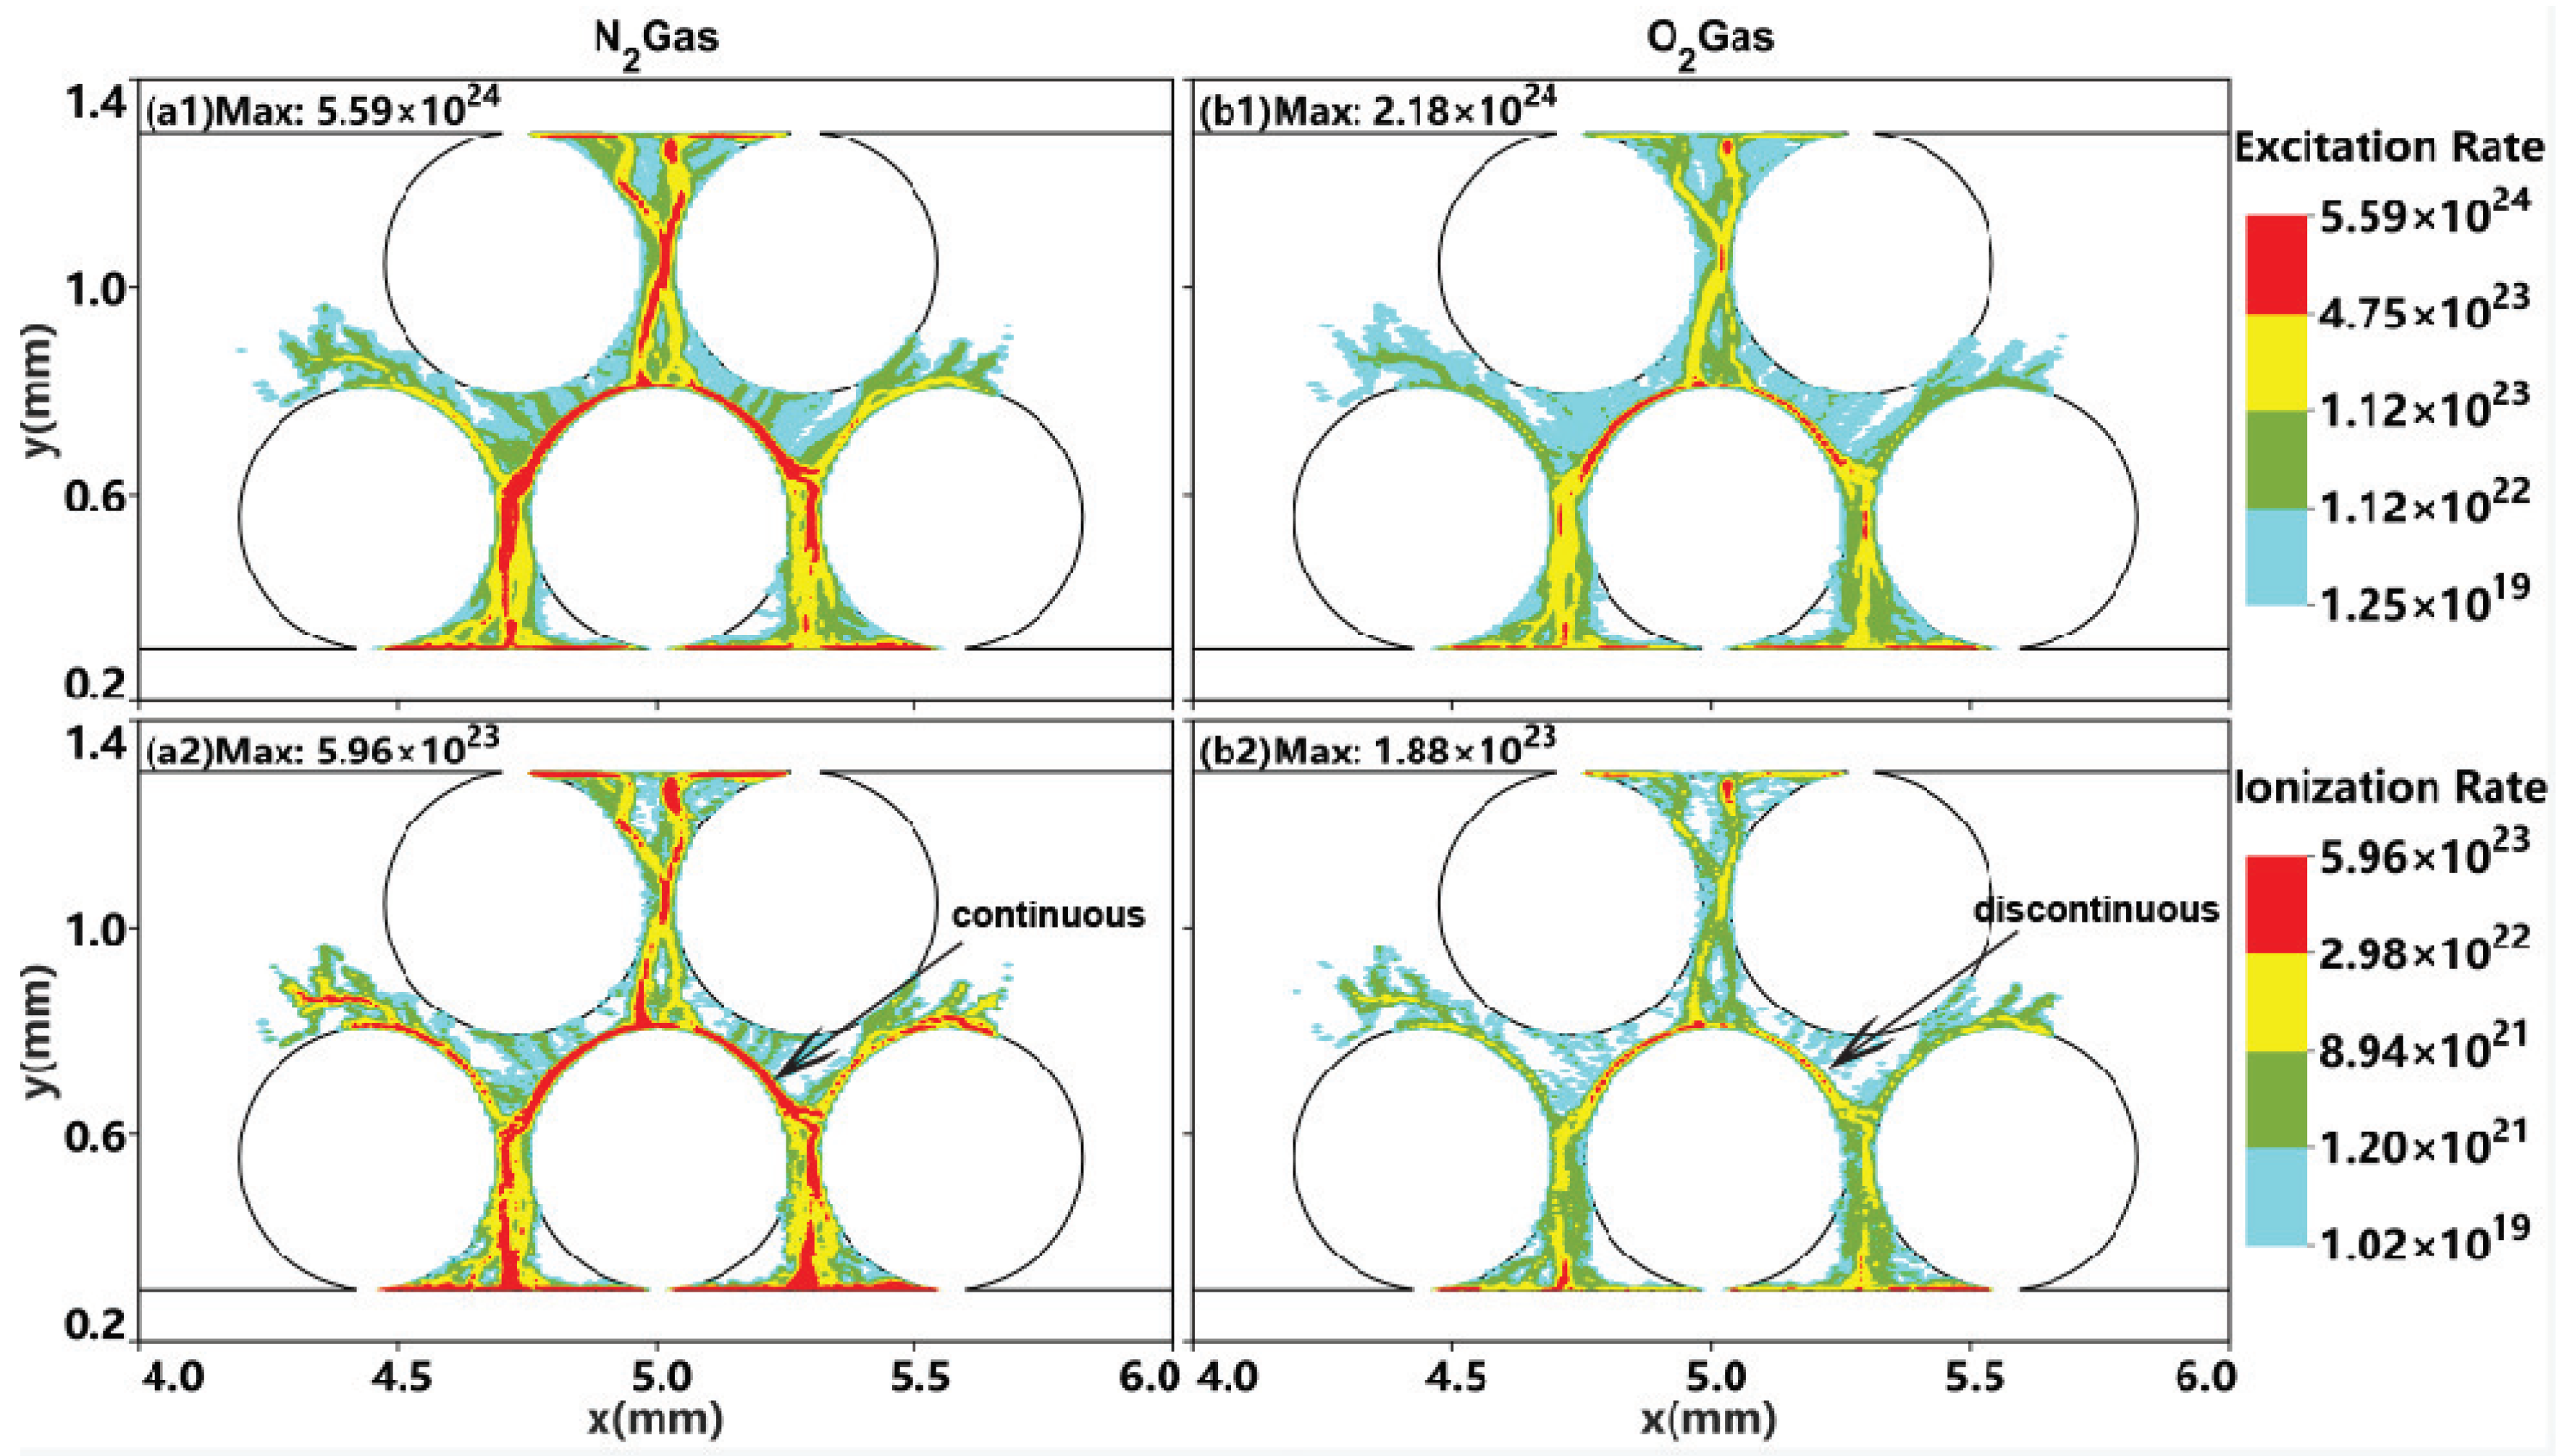
Figure 6.
Electric field amplitude (V/m) for the same conditions as in Figure 1. The maximum values are noted in each panel. They occur at the contact points between the beads, and are larger than the color scale, but the color scale is chosen in such a way to better illustrate the general behavior.
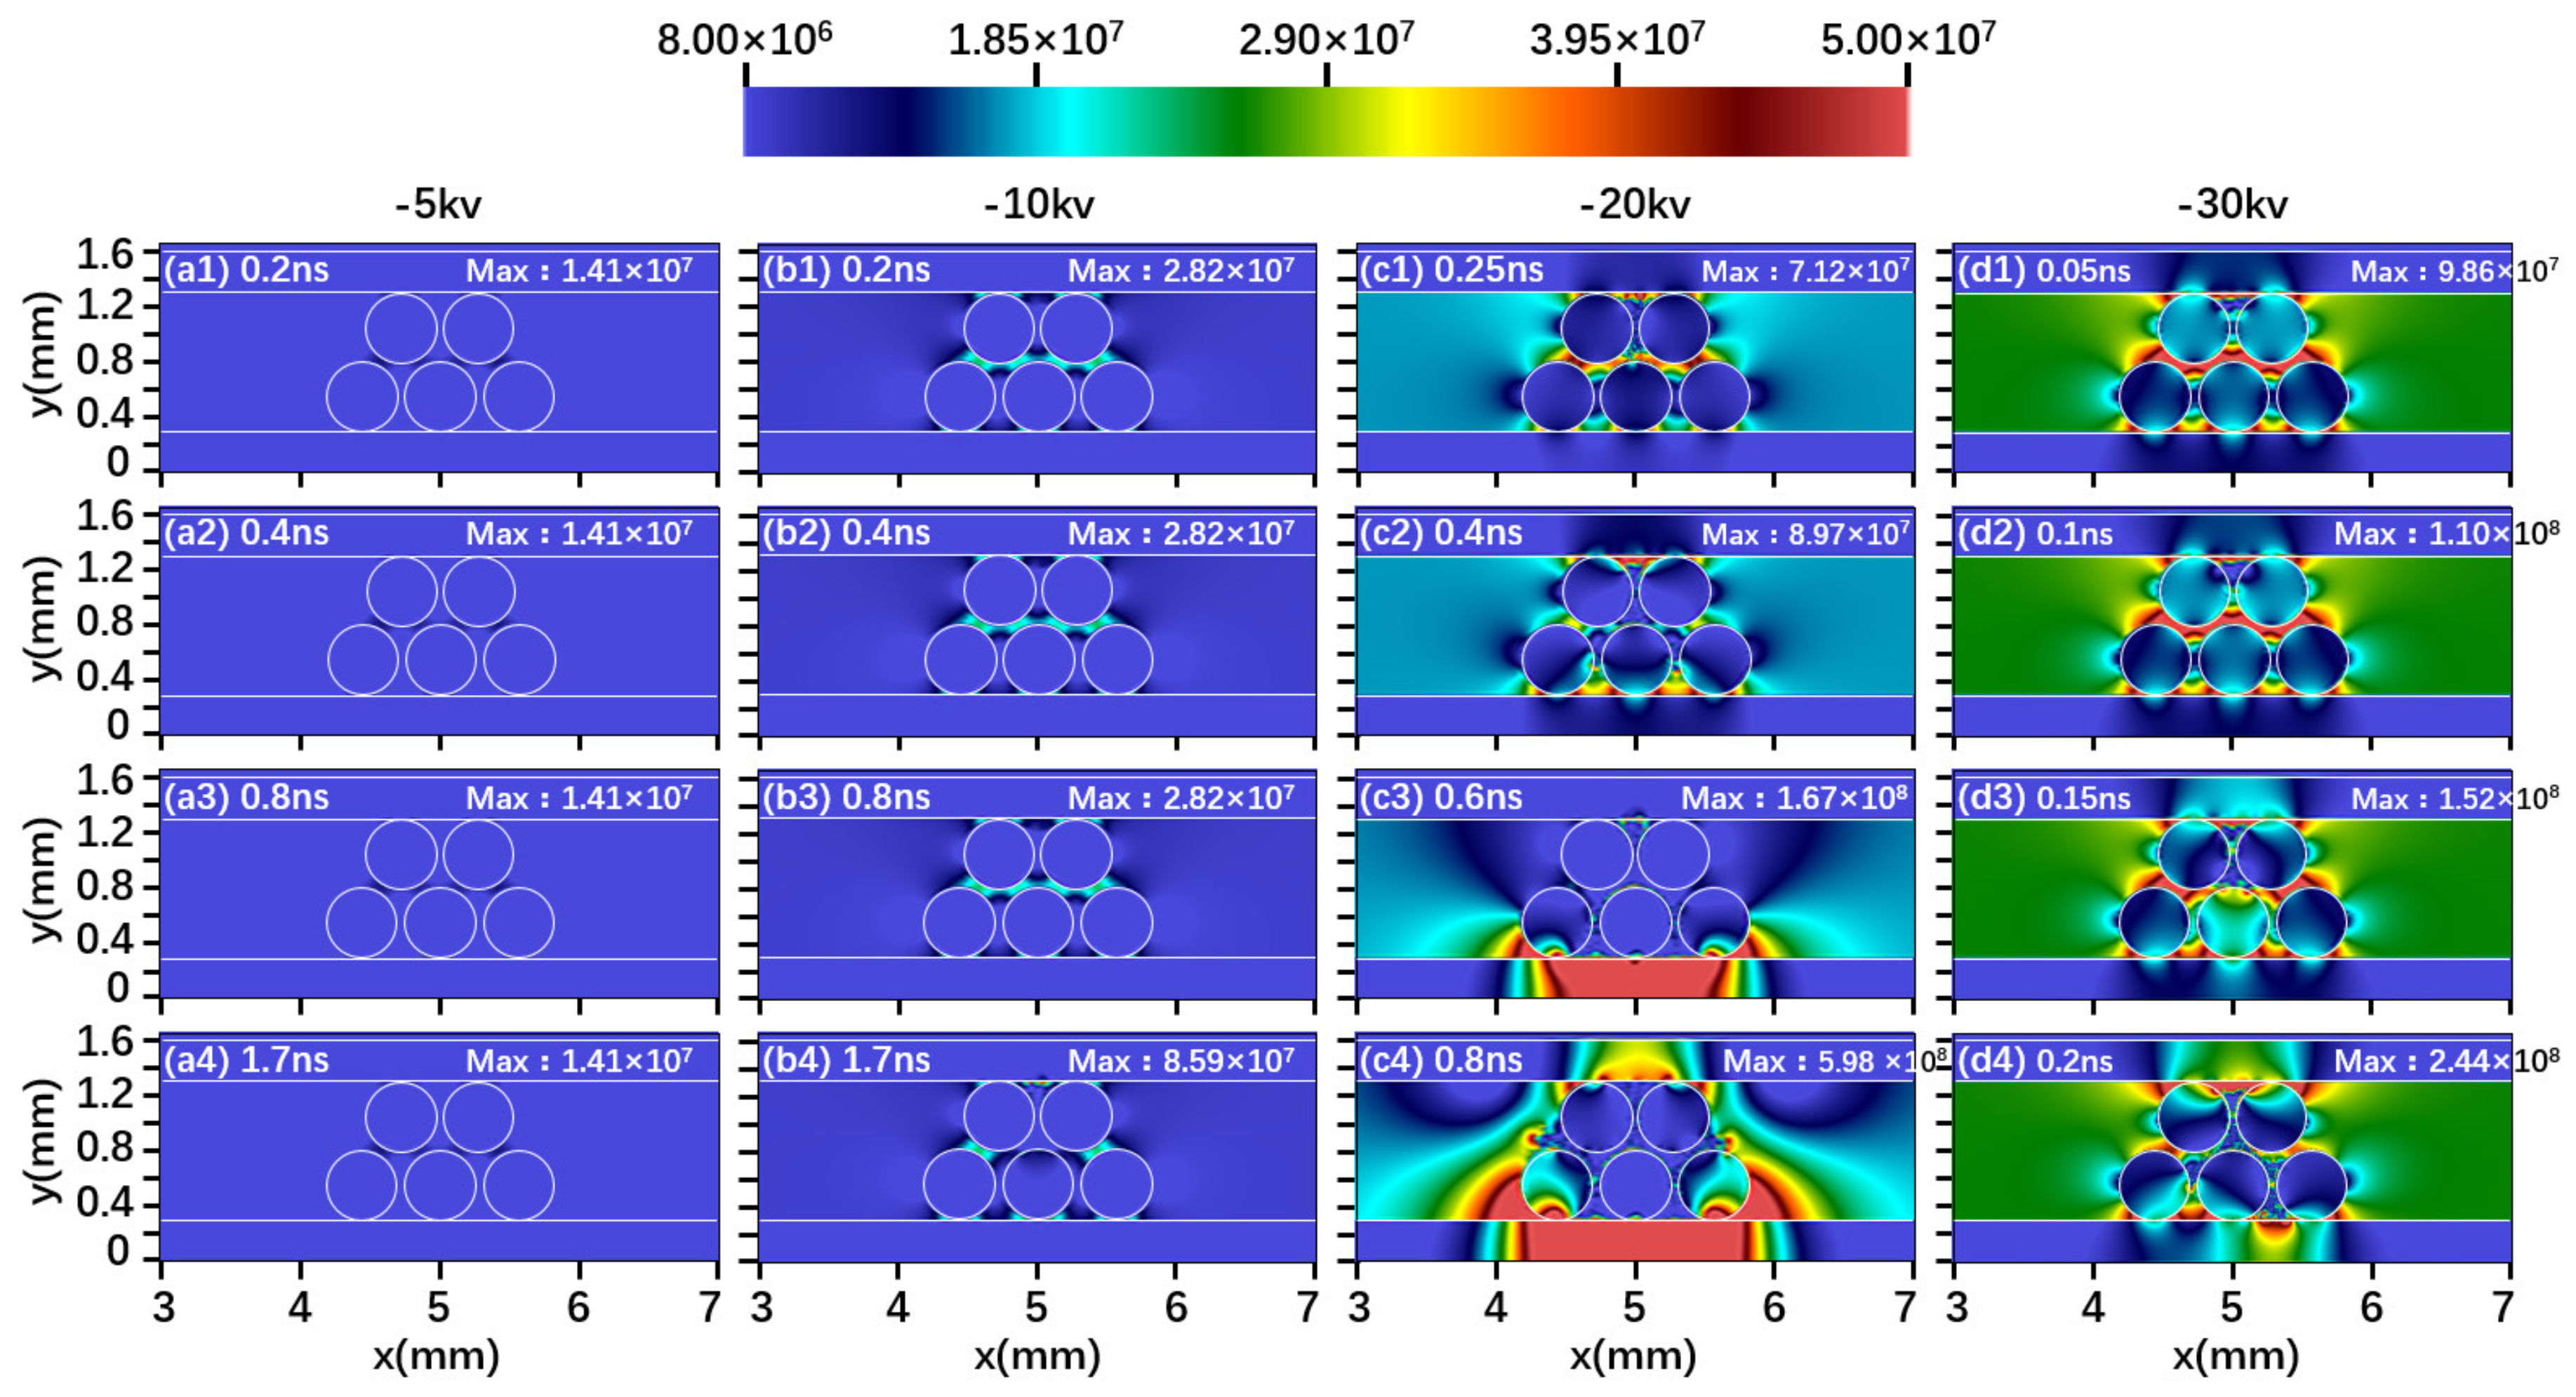
Figure 7.
Electric field components in the y and x direction, (a1,b1) (V/m) and (a2,b2) (V/m), (a1,a2) for −20 kV (0.8 ns), and (b1,b2) for −30 kV (0.2 ns), in an air discharge. The maximum values are noted under the figure. They occur at the contact points between the beads, and are larger than the color scale, but the color scale is chosen in such a way to better illustrate the general behavior.
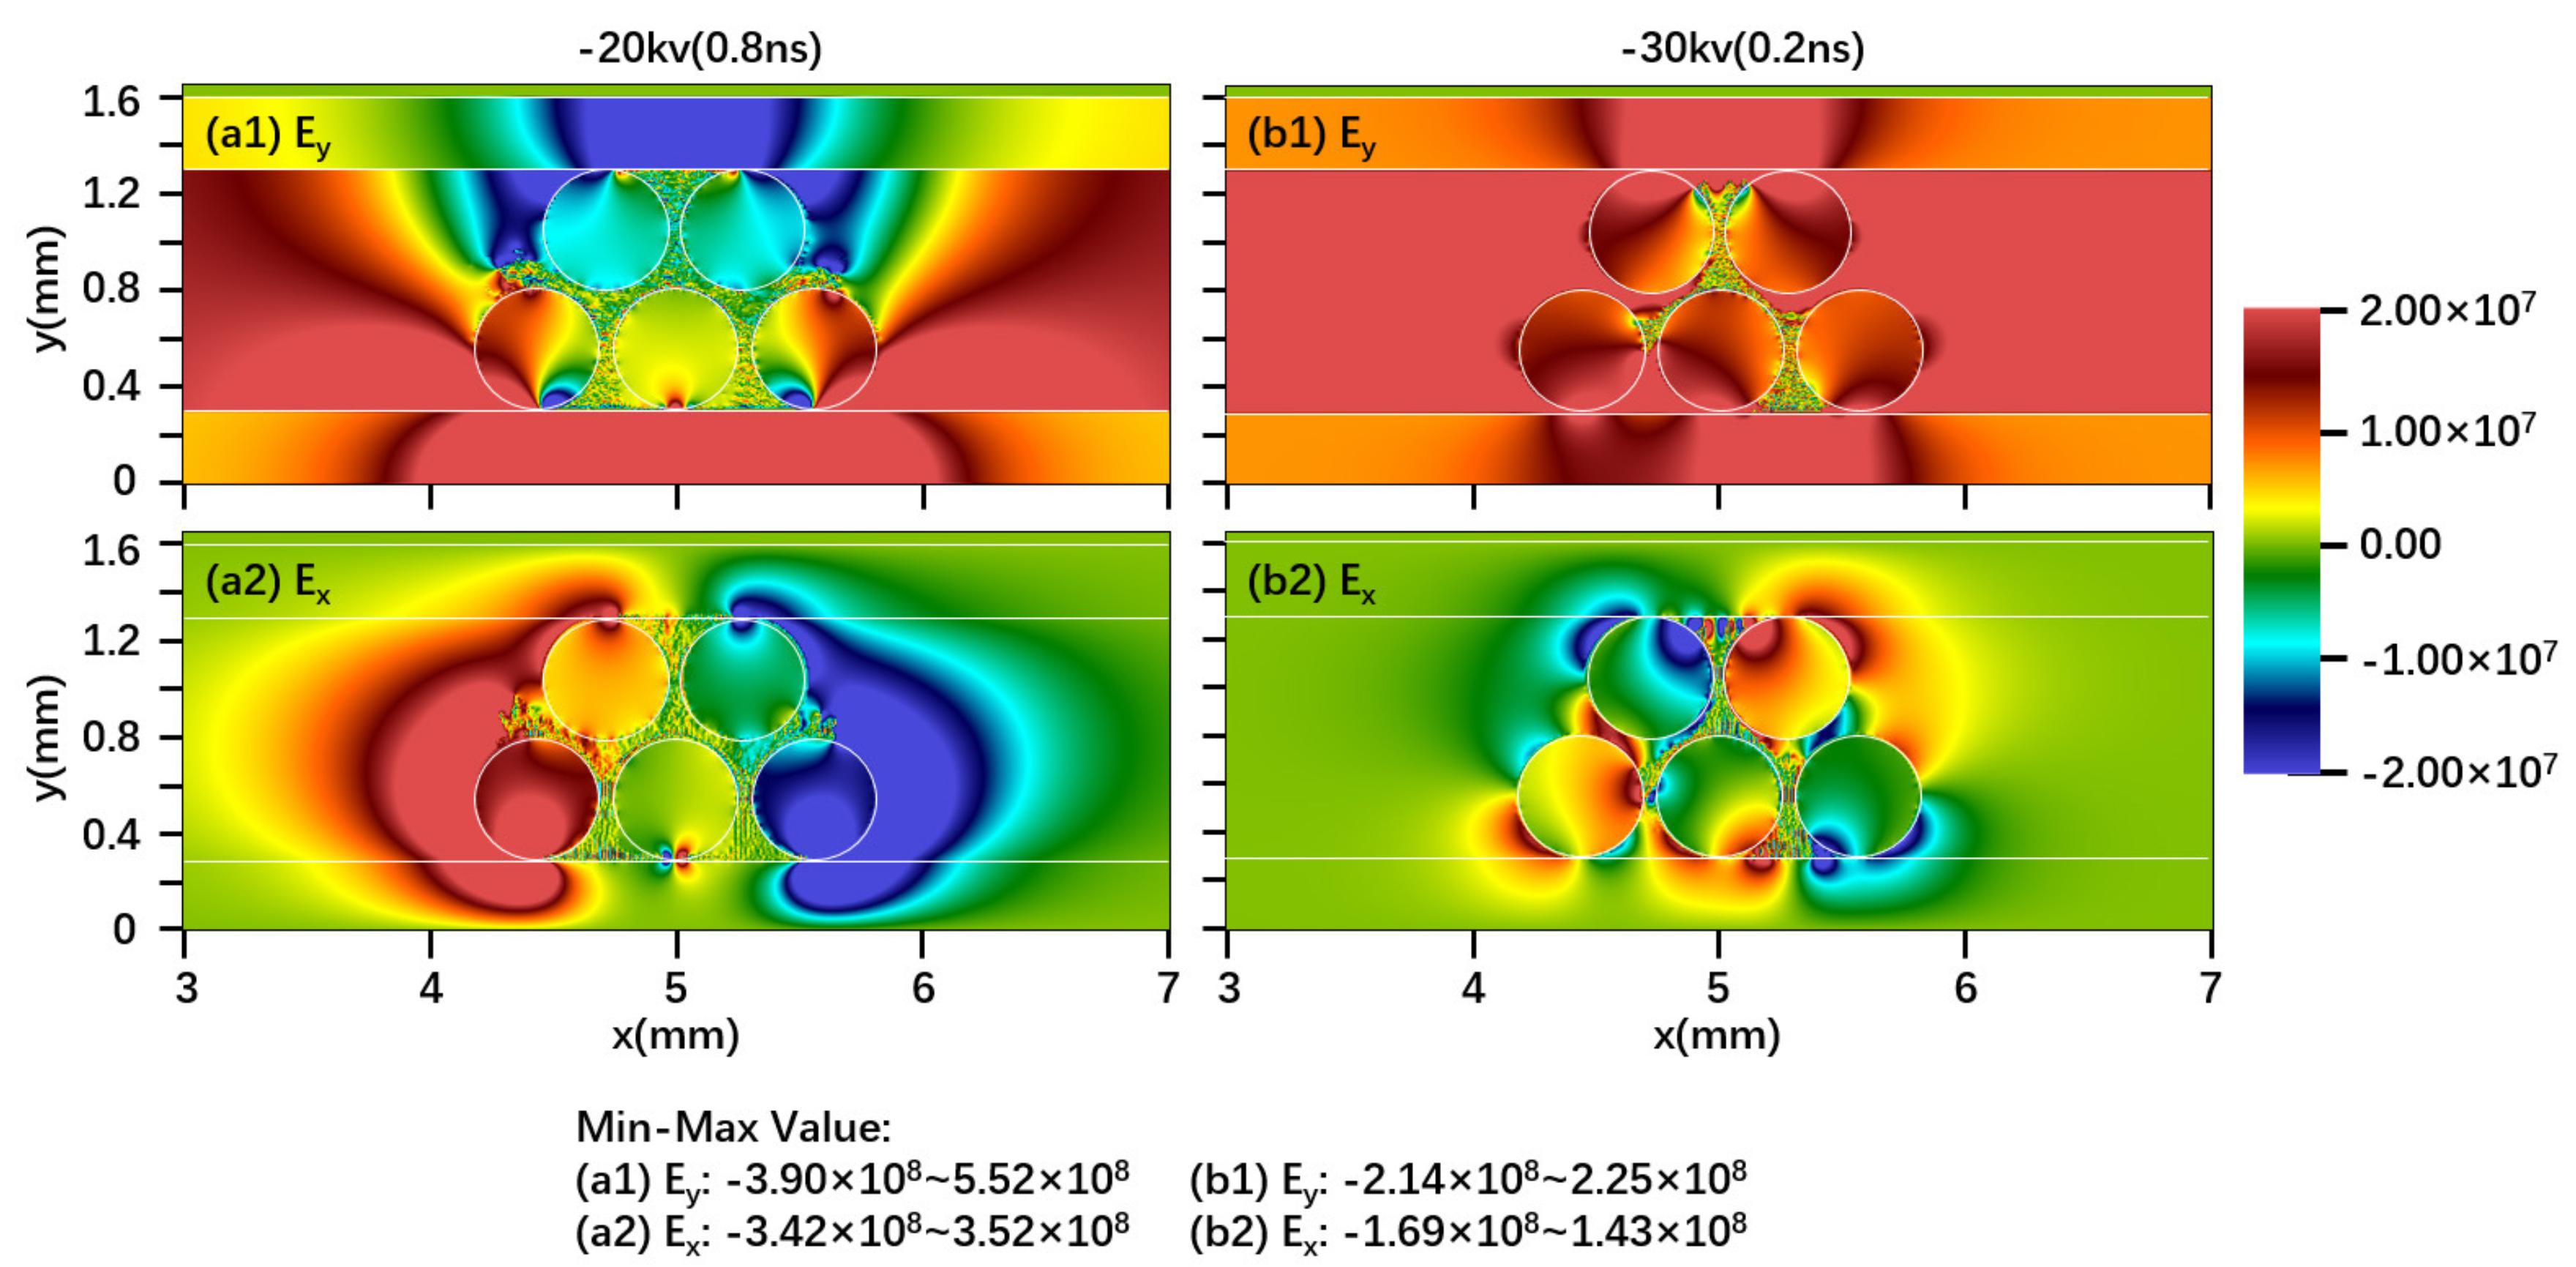
Figure 8.
Electron density (m) at 0.2, 0.25, 0.4 and 0.7 ns, for a driving voltage of −20 kV, in a gas mixture of nitrogen and oxygen with different composition, (a1–a4) 100% N, (b1–b4) 10% O and 90% N, (c1–c4) 50% O and 50% N, and (d1–d4) 100% O. The same color scale is used in all panels to allow comparison.

Figure 9.
N ion density (m) for the same conditions as in Figure 8.
Figure 9.
N ion density (m) for the same conditions as in Figure 8.

Figure 10.
O ion density (m) for the same conditions as in Figure 8.
Figure 10.
O ion density (m) for the same conditions as in Figure 8.

Figure 11.
O ion density (m) for the same conditions as in Figure 8.
Figure 11.
O ion density (m) for the same conditions as in Figure 8.
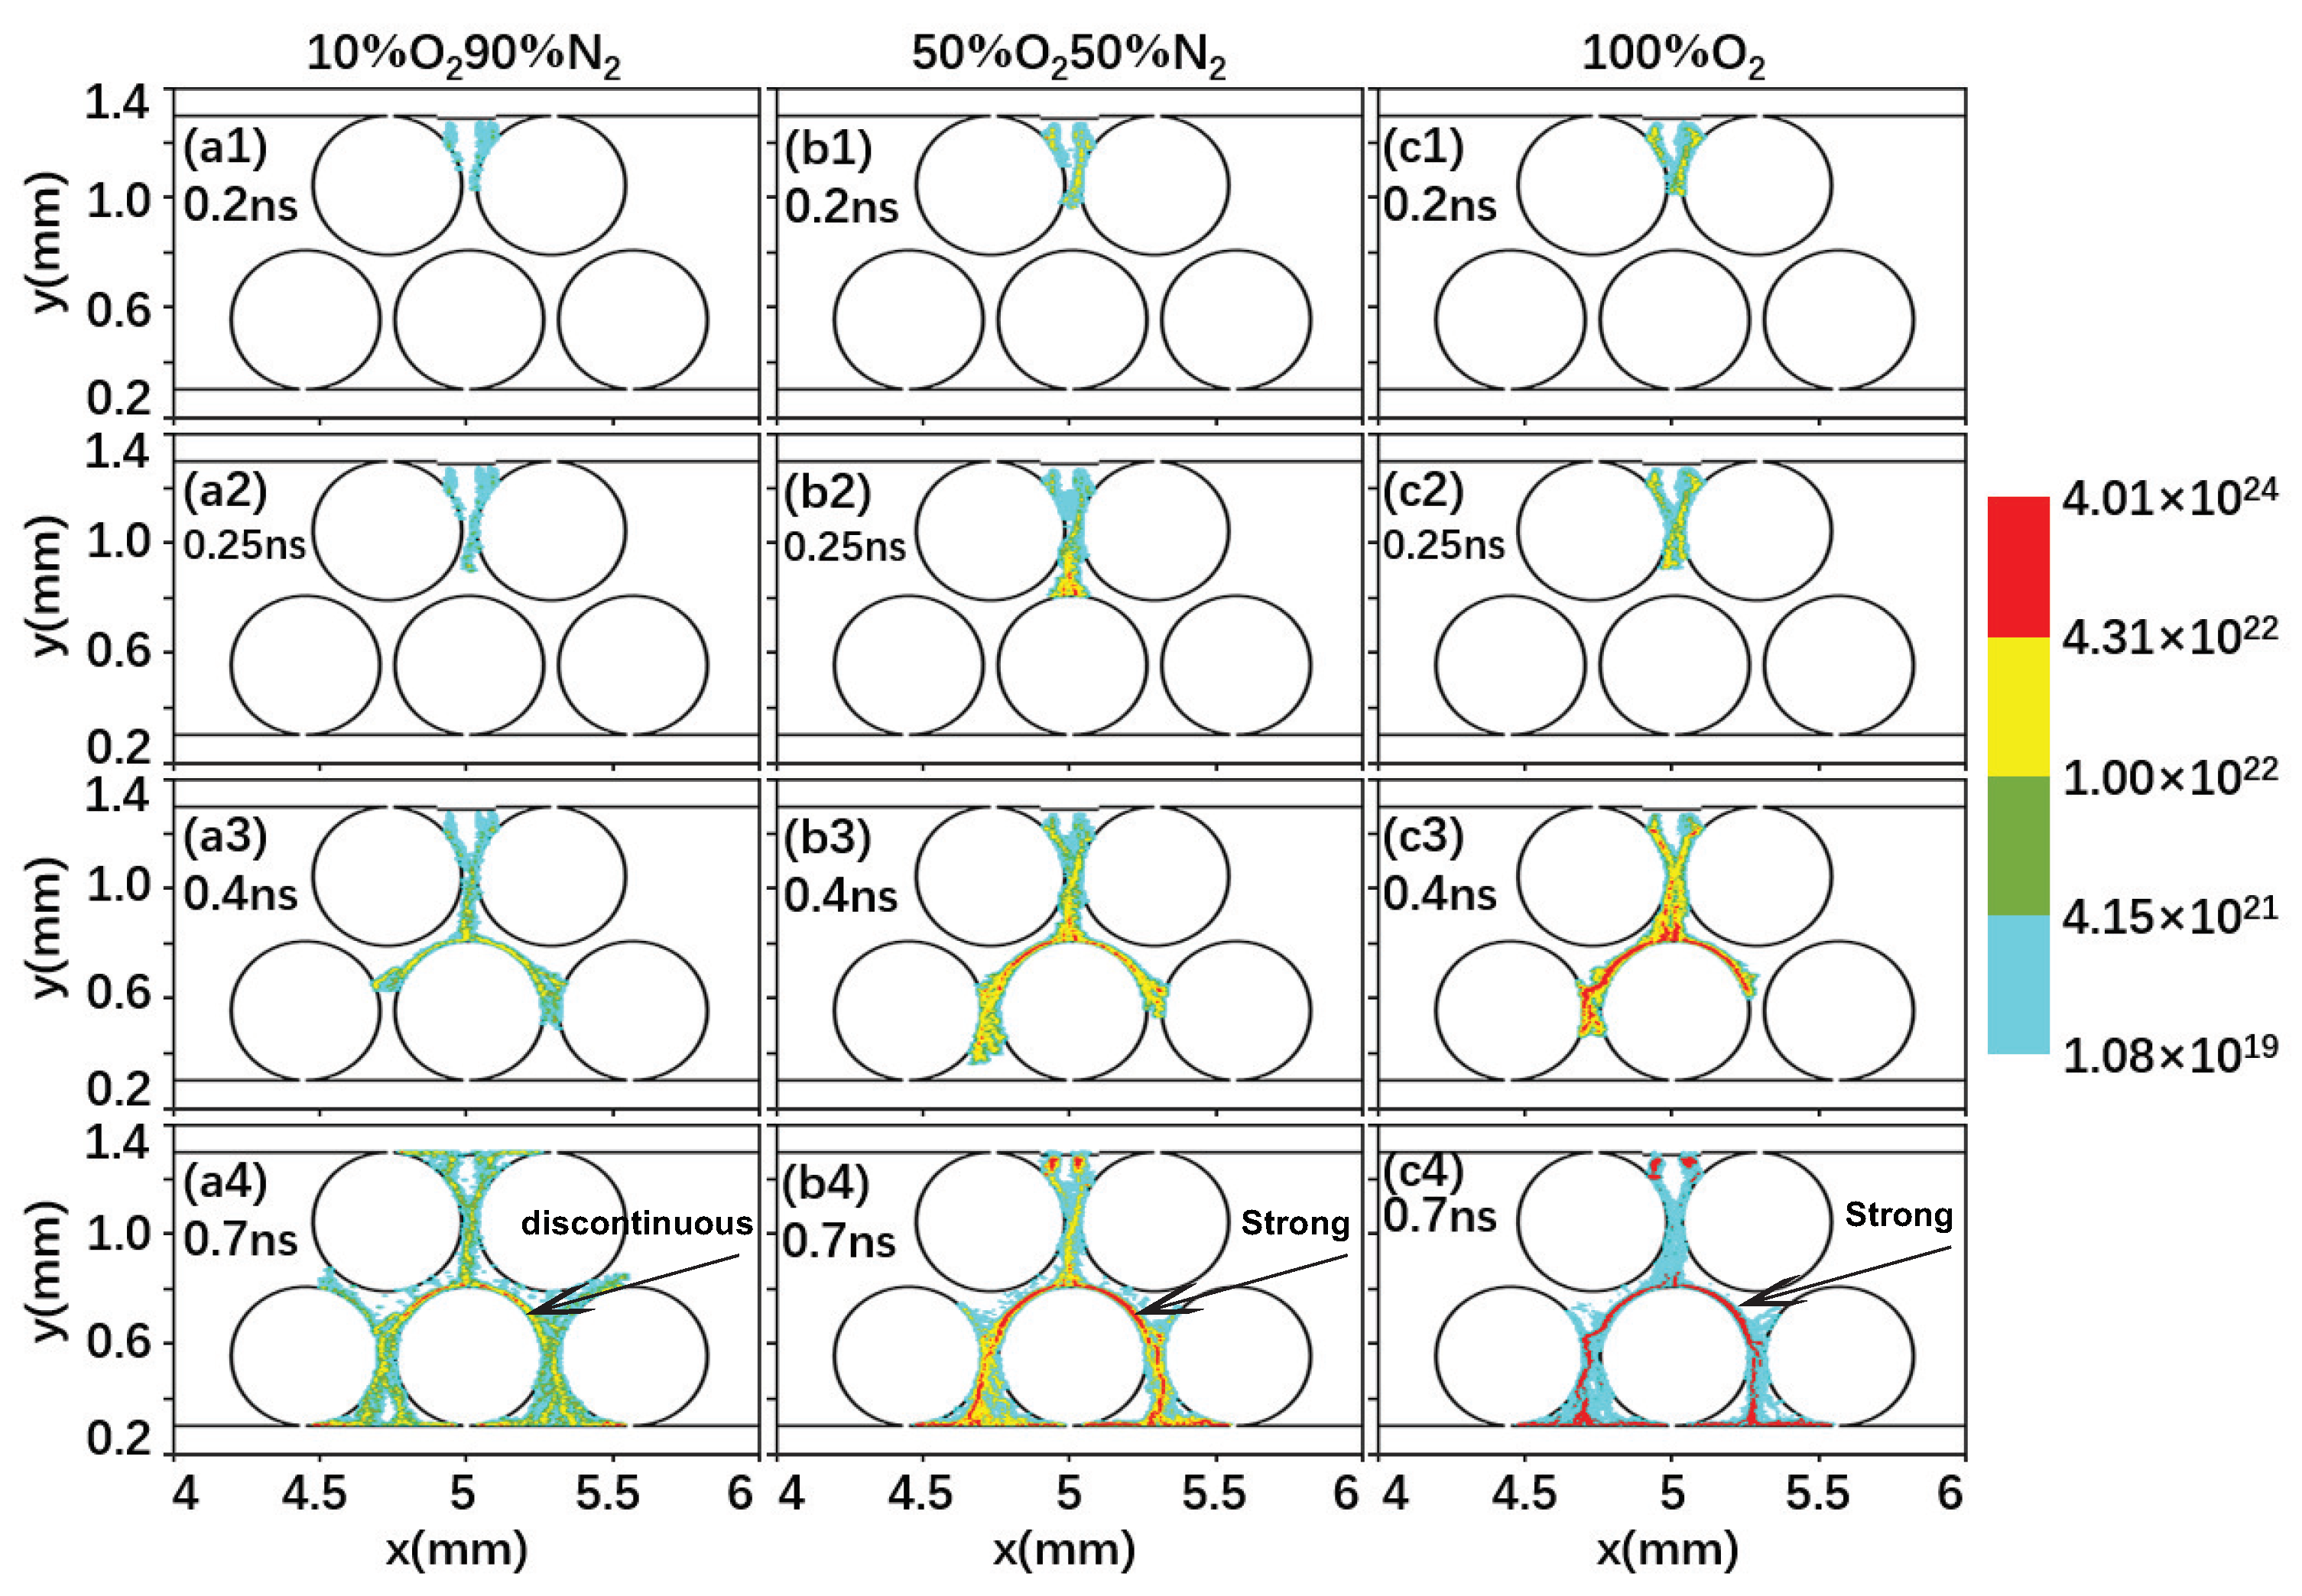
Figure 12.
Geometry used in the packed-bed dielectric barrier discharge (PB-DBD) reactor. The entire simulation domain is 10 mm in the x dimension and 1.65 mm in the y dimension, but only a smaller part in the x direction is shown here, for clarity. The discharge gap is 1 mm, and the top and bottom electrodes are covered by 0.3 mm thick dielectric plates. The top electrode is 0.05 mm thick, and it acts as powered electrode. The bottom electrode (x = 0) is grounded. Dielectric packing beads with diameter of 508 m are placed in the gap. The numbering is used later in the paper.


Table 1.
Reaction set of a N/O gas mixture used in the model, as well as the threshold energy for electron impact ionization and excitation collisions. The cross sections for all reactions are adopted from Refs. [41,42,43,44], and are downloaded from the LXCat database [45].
| Reactions | Threshold Energy (eV) |
|---|---|
| Electron-impact ionization | |
| 12.06 | |
| 15.58 | |
| Attachment | |
| Electron-impact excitation | |
| 0.98 | |
| 1.63 | |
| 6.0 | |
| 8.4 | |
| 10.00 | |
| 6.169 | |
| 7.353 | |
| 7.362 | |
| 8.165 | |
| 8.399 | |
| 8.549 | |
| 8.89 | |
| 9.7537 | |
| 11.032 | |
| 12.771 | |
| 13.37 | |
| 13.382 | |
| 14.0 | |
| Elastic collision | |
© 2018 by the authors. Licensee MDPI, Basel, Switzerland. This article is an open access article distributed under the terms and conditions of the Creative Commons Attribution (CC BY) license (http://creativecommons.org/licenses/by/4.0/).
Share and Cite
MDPI and ACS Style
Gao, M.; Zhang, Y.; Wang, H.; Guo, B.; Zhang, Q.; Bogaerts, A. Mode Transition of Filaments in Packed-Bed Dielectric Barrier Discharges. Catalysts 2018, 8, 248. https://doi.org/10.3390/catal8060248
AMA Style
Gao M, Zhang Y, Wang H, Guo B, Zhang Q, Bogaerts A. Mode Transition of Filaments in Packed-Bed Dielectric Barrier Discharges. Catalysts. 2018; 8(6):248. https://doi.org/10.3390/catal8060248
Chicago/Turabian StyleGao, Mingxiang, Ya Zhang, Hongyu Wang, Bin Guo, Quanzhi Zhang, and Annemie Bogaerts. 2018. "Mode Transition of Filaments in Packed-Bed Dielectric Barrier Discharges" Catalysts 8, no. 6: 248. https://doi.org/10.3390/catal8060248
Note that from the first issue of 2016, this journal uses article numbers instead of page numbers. See further details here.