Article

An Efficient Photocatalyst for Fast Reduction of Cr(VI) by Ultra-Trace Silver Enhanced Titania in Aqueous Solution

1
State Key Laboratory of Geohazard Prevention and Geoenvironment Protection, Chengdu University of Technology, Chengdu 610059, China
2
Department of Civil and Environment Engineering, The Hong Kong Polytechnic University, Hong Kong, China
3
School of Environmental Science and Engineering, Zhongkai University of Agriculture and Engineering, Guangzhou 510225, China
*
Author to whom correspondence should be addressed.
Catalysts 2018, 8(6), 251; https://doi.org/10.3390/catal8060251
Submission received: 10 May 2018 / Revised: 12 June 2018 / Accepted: 14 June 2018 / Published: 19 June 2018

Abstract

:
For the purpose of establishing a simple route to prepare a metal-semiconductor hybrid catalyst efficiently and reduce its cost through precise doping noble metals. In this study, ultra-trace silver doped TiO2 photocatalysts were fabricated via a “green” ultrasonic impregnation-assisted photoreduction strategy in an ethanol system, and its photocatalytic performance was systematically investigated by utilizing Cr(VI) as the model contaminant. A schottky energy barrier was constructed in Ag@TiO2, which served as a recombination center and possessed superior photocatalytic activity for Cr(VI) reduction. The obtained catalysts exhibited a significant e/h+ separation efficiency which directly led to an obvious photocatalytic property enhancement. Then, the resultant Ag@TiO2 (0.06 wt %, 30 min irradiation) showed about 2.5 times the activity as that of commercial P25 NPs for Cr(VI) degradation. Moreover, after five cycles, it still maintained considerably high catalytic ability (62%). This work provides a deep insight into preparation techniques of metal-semiconductor photocatalyst and broadens their application prospect.

Graphical Abstract

1. Introduction

Nowadays, heavy metals pollution in aquatic environments poses serious risks to public health and ecological systems since the rapid development of industrialization [1]. As a non-degradable and toxic metal ion, Cr(VI) has been commonly identified in aquatic circumstances, due to its carcinogenic, mutagenic and teratogenic effects on living creatures [2]. The Ministry of Ecology and Environment of the People’s Republic of China and World Health Organization (WHO) have regulated the maximum concentration authorized in drinking water as being below 0.05 mg/L (Sanitary Standard for Drinking Water Quality (2001)) [3,4]. However, the inevitable drawbacks of high cost or secondary contamination still exist among conventional methods to remove heavy metals from aqueous solutions, such as chemical reduction [5,6], membrane separation [7], electrolytic [8], ferrite method [9,10], precipitation [11], adsorption [12,13], ion exchange [14] and biological method [15]. Hence, it is important to explore a cost-efficient method for Cr(VI) removal.
Heterogeneous photocatalysis is achieved by the excitation of electrons from semiconductors’ valence band (VB) to the conduction band (CB) upon light irradiation, wherein the excited electrons and holes can be directly applied in redox processes. Owing to the highly reductive property of photo-generated electrons, photocatalysis [16] can be served as a desirable reductive. Compared to the conventional methods, it has relatively broader application prospects due to its recyclable and non-secondary pollution advantages [17]. For example, reduced graphene oxide and ZnO hybrids (RGO/ZnO) was utilized in different particle sizes for photocatalytic reduction of Cr(VI) [18]. In parallel, the photocatalytic Pb(II) reduction over WO3/TiO2 nanomaterials, the reduction capacity was increased from 52.2% to 74.7% via WO3 doping [19]. Moreover, The photocatalytic removal of heavy metal ions by TiO2 nanotubes could be further enhanced through Cu2+ loadings [20].
Furthermore, to improve the semiconductors’ catalytic performance [21], the noble metal deposition [22] recently has been proven to be a predominant way to heighten the activity of photocatalysis by creating the Schottky barrier at the semiconductor metal interface, which helps in separating the photo-excited electrons in the CB onto the metal nanoparticles (NPs) [23]. During the past decade, various noble metals such as Pt, Au, and Ag have been frequently immobilized on TiO2 [24,25] or other semiconductors to enhance their photocatalytic performance. However, among a wide variety of metal-semiconductor hetero-structures [26], Ag@TiO2 [27] photocatalysts aroused tremendous attention as they showed the most efficient plasmon resonance which was favorable for catalytic enhancement [28]. Therefore, various methods to obtain Ag@TiO2 composites have been developed, such as hydrothermal [29], sol-gel [30], magnetron co-sputtering [31], photodeposition [32], sedimentation and impregnation [33]. These methods are usually either complex or require rather extreme conditions to operate. To obtain an efficient Ag@TiO2 photocatalyst, the silver dosage is still relatively high (>1 wt %), which greatly elevates its cost and limits its actual application. For instance, Chen and Zhang [30] synthesized an Ag@TiO2 compound through a novel one-pot sol-gel strategy with 3.9 wt % silver addition and systematically studied its potent antibacterial activities. Liu et al. [34] demonstrated the deposition of Ag nanoparticles on TiO2 nanofibers with 4.65 wt % silver dosage by a facile polyol synthesis, and the result showed superior natural antibacterial activity and high-performance photocatalytic disinfection under solar irradiation. Considering the conventional complex procedures and high silver consumption in Ag@TiO2 preparation, how to simplify the fabrication steps and control the silver doping amount would be the crucial steps to control the cost and broaden the practical application of Ag@TiO2. Particularly, how to obtain an efficient catalyst under an ultra-trace noble metal deposition.
In this work, a facile photoreduction strategy was utilized to in situ synthesize Ag@TiO2 photocatalysts with ultra and exhibited superior photocatalytic activity on reducing highly toxic Cr(VI) to low-toxic Cr(III). The photoreduction properties of Ag@TiO2 were evaluated in different influencing parameters, such as the amount of Ag, the initial pH of solution, the amount of catalyst dosage, the light intensity and the coexisting ions. The results shown that the synthesized Ag@TiO2 bears good Cr(VI) reduction performance, which provides a deep insight for the application of photocatalysis in wastewater treatment.

2. Results and Discussion

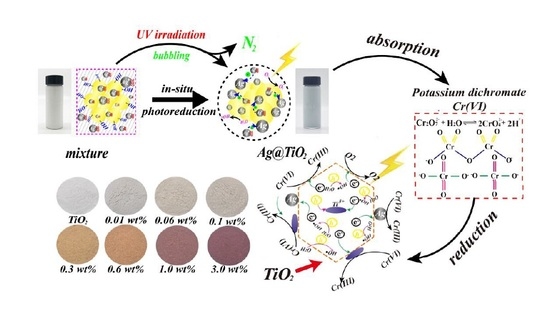
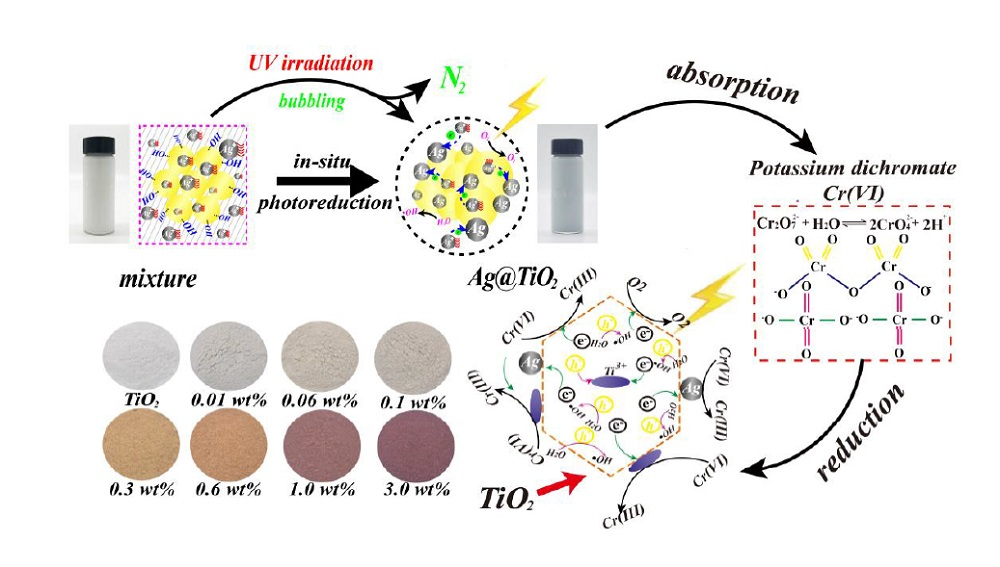
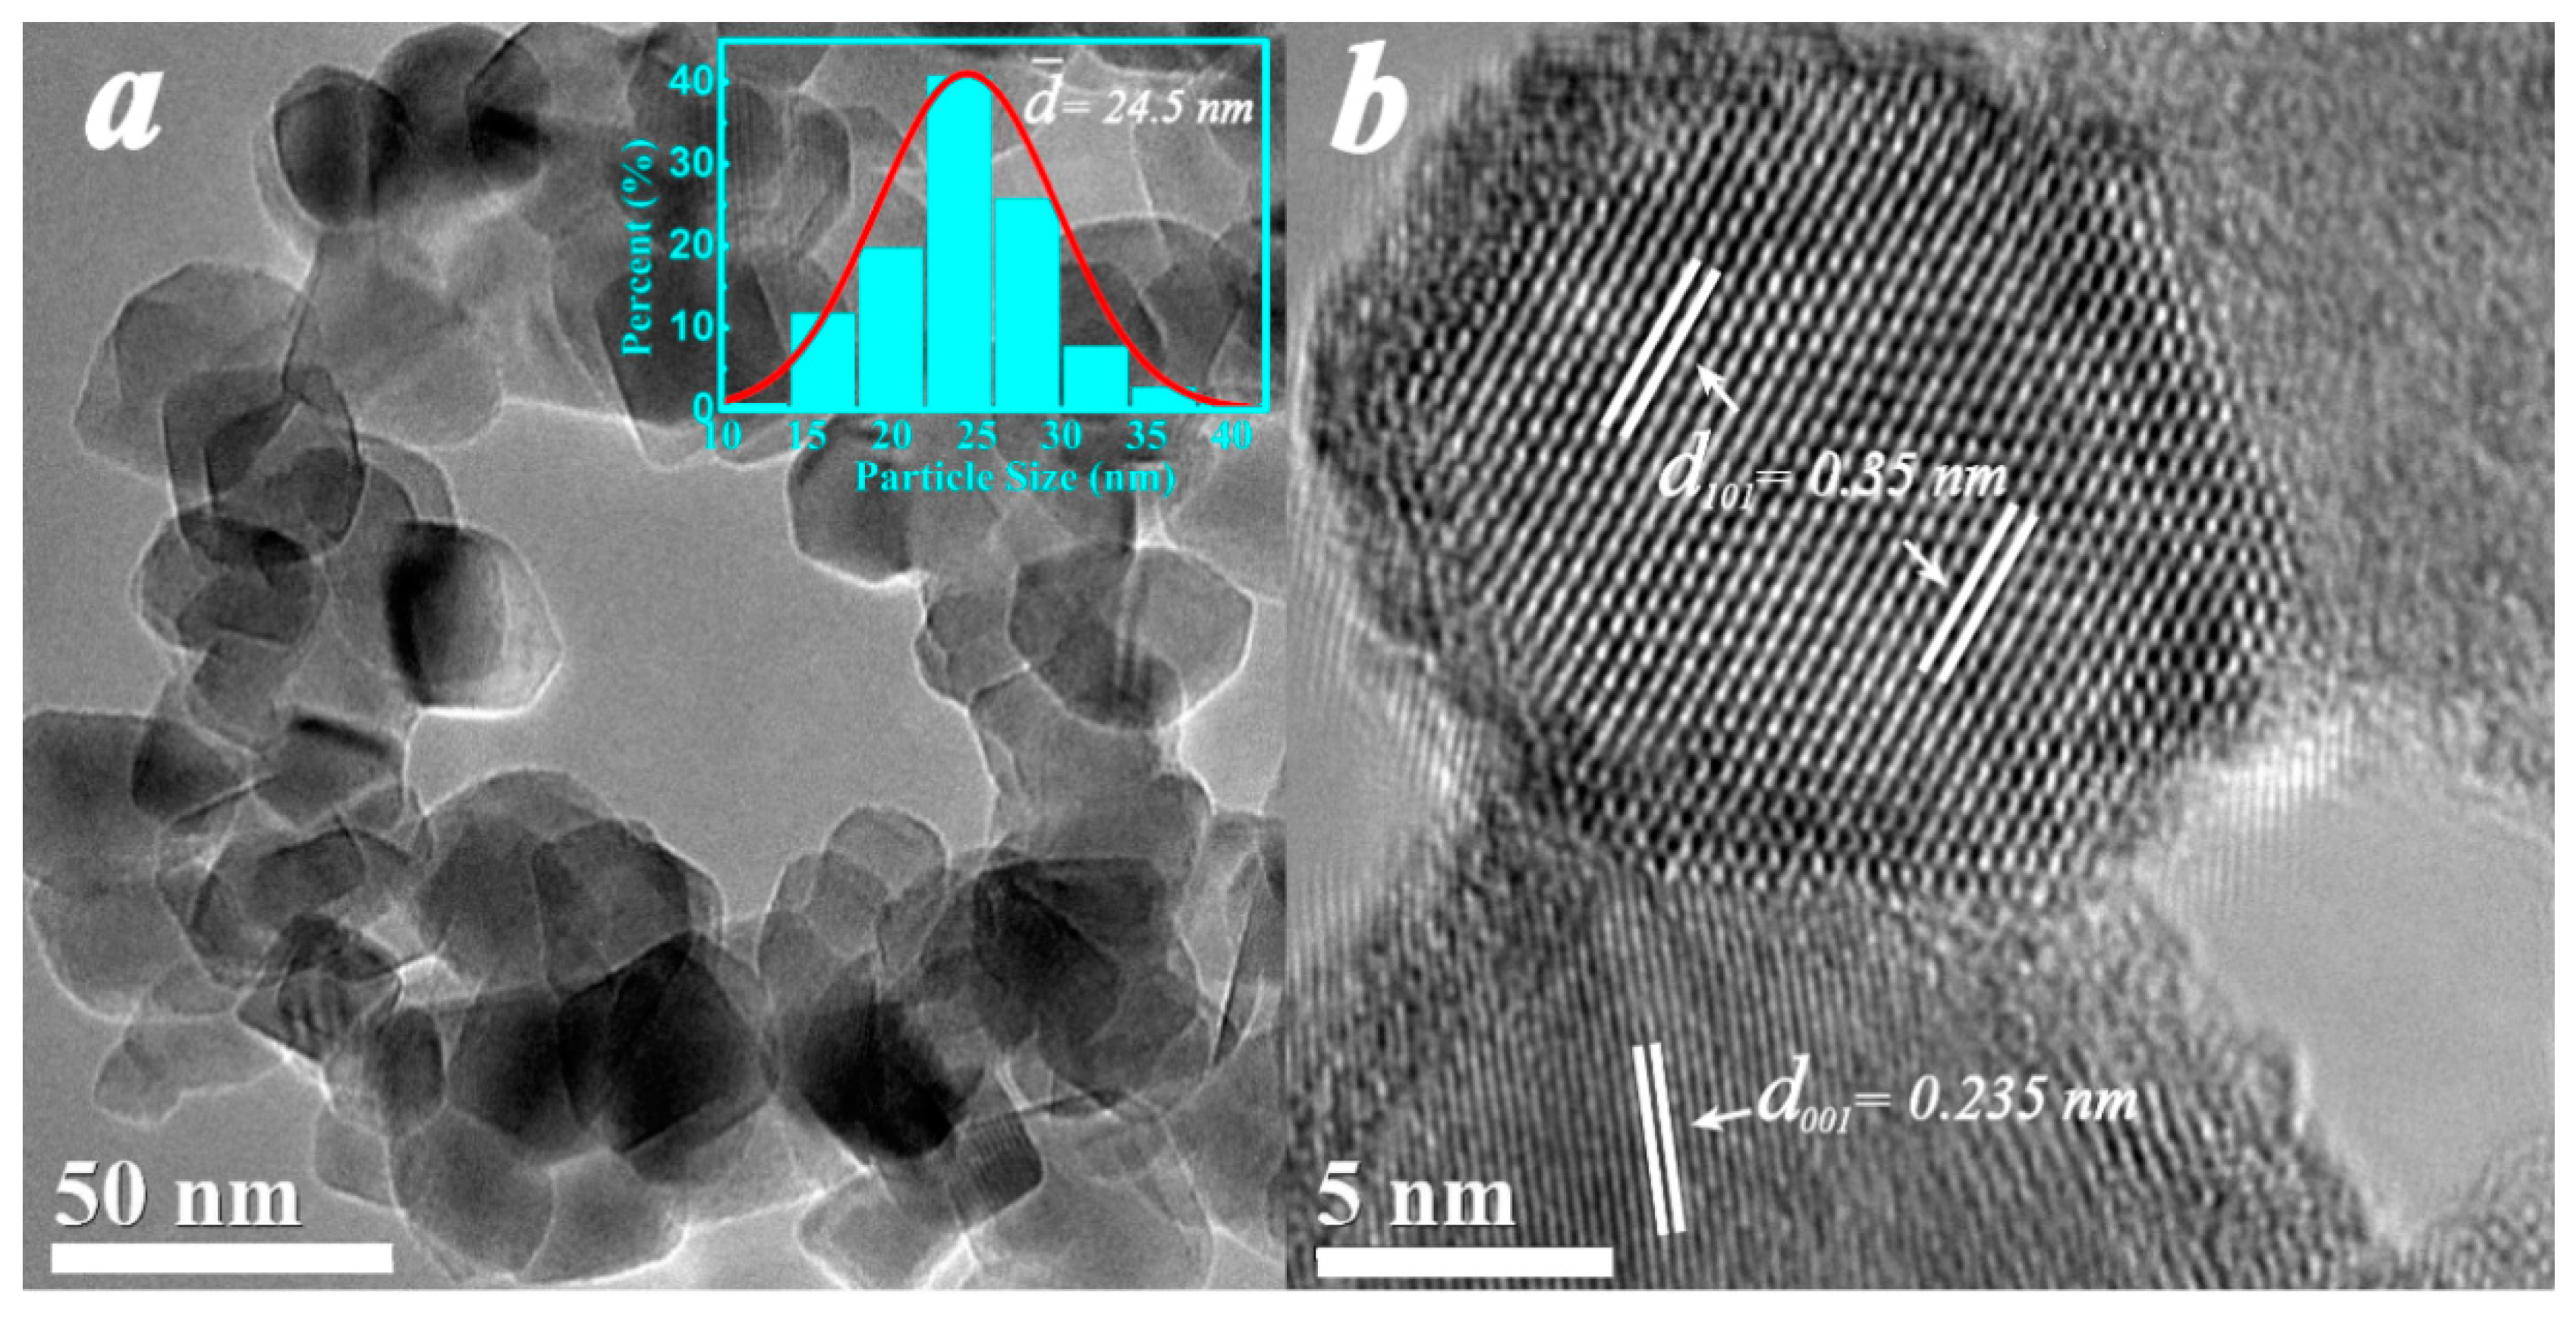
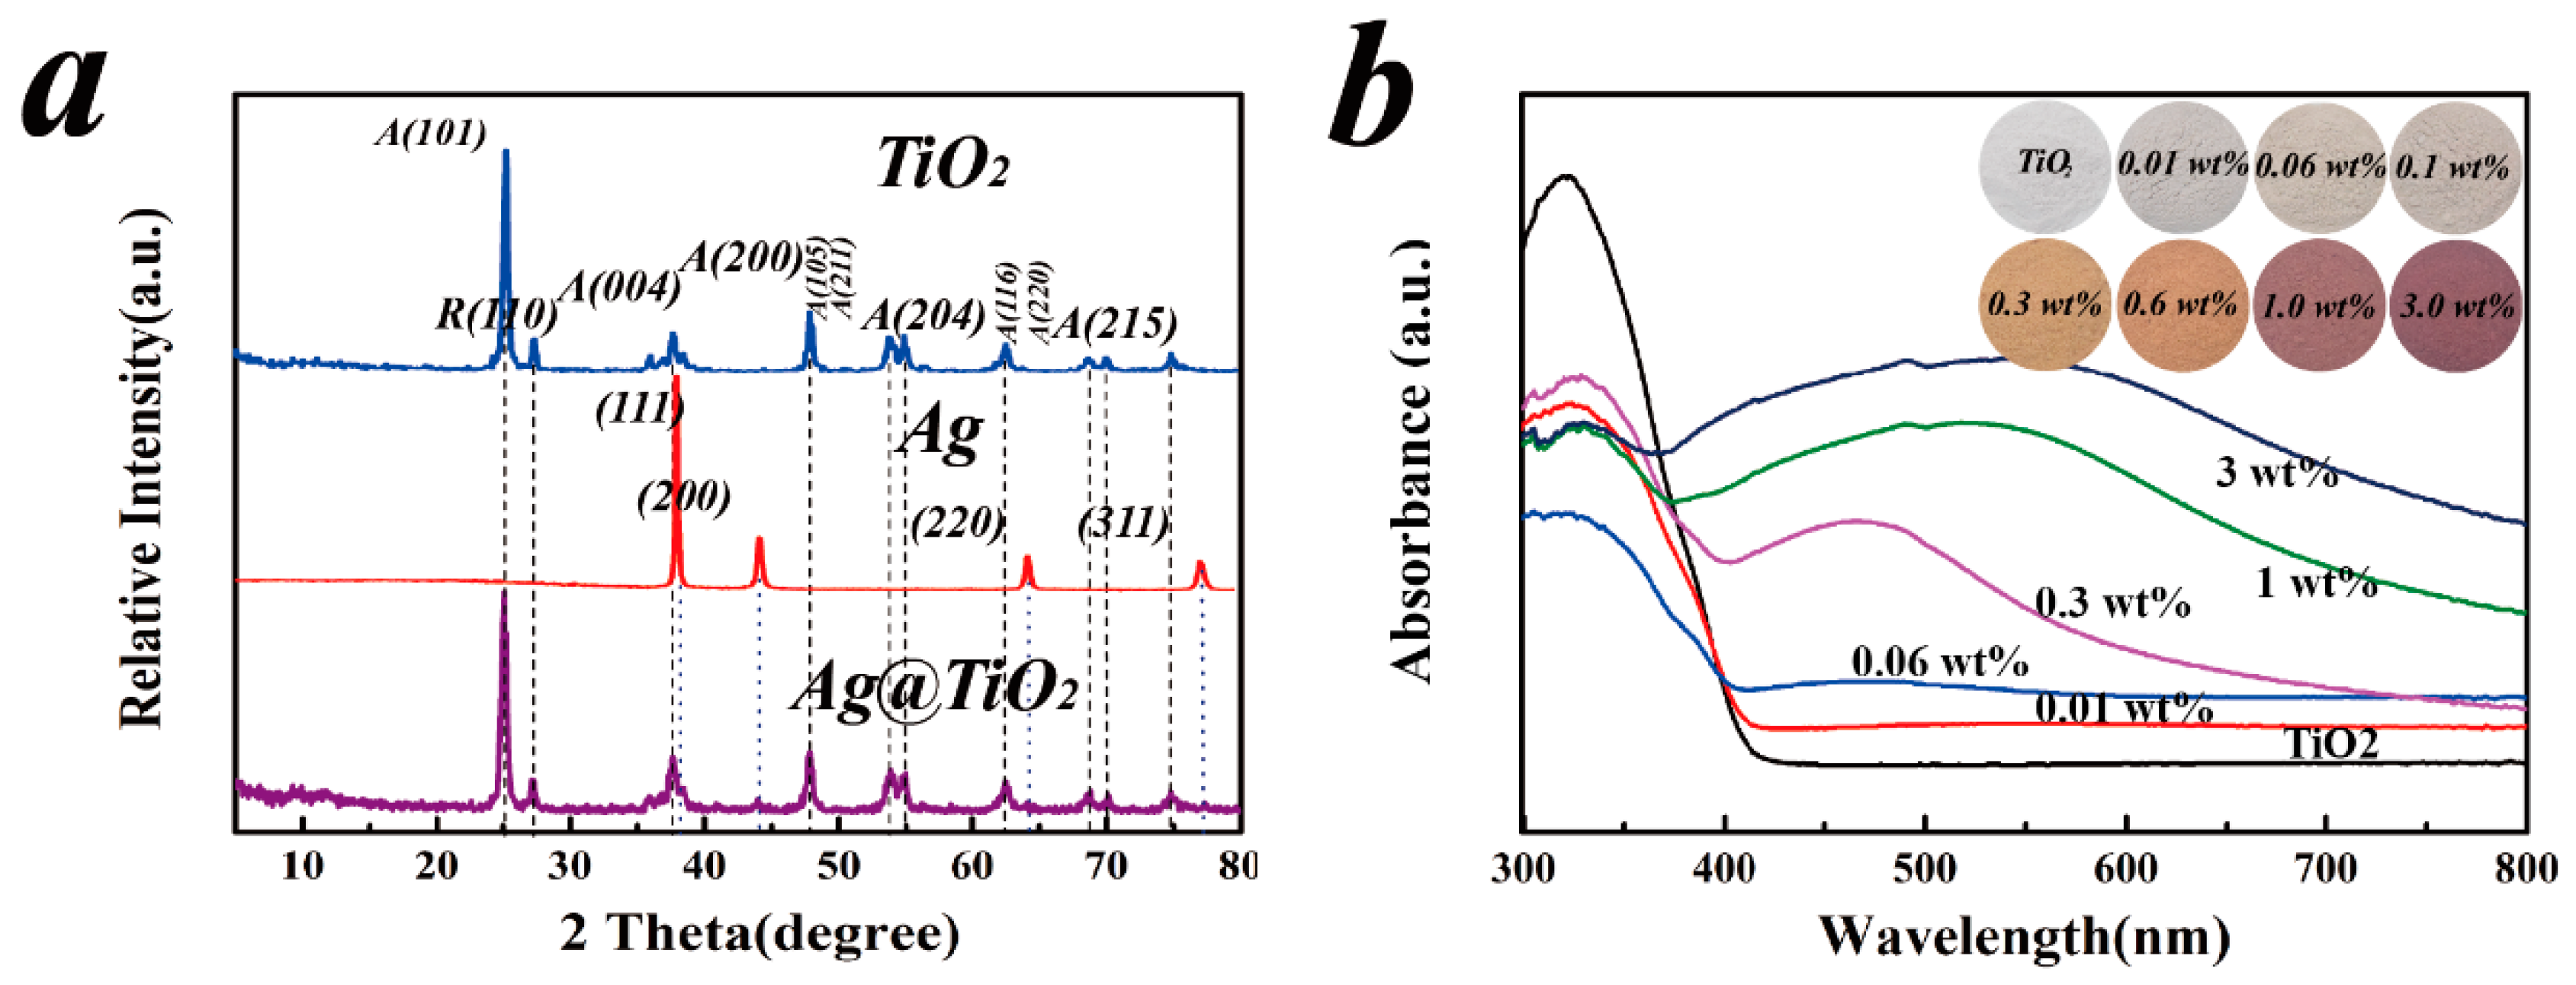
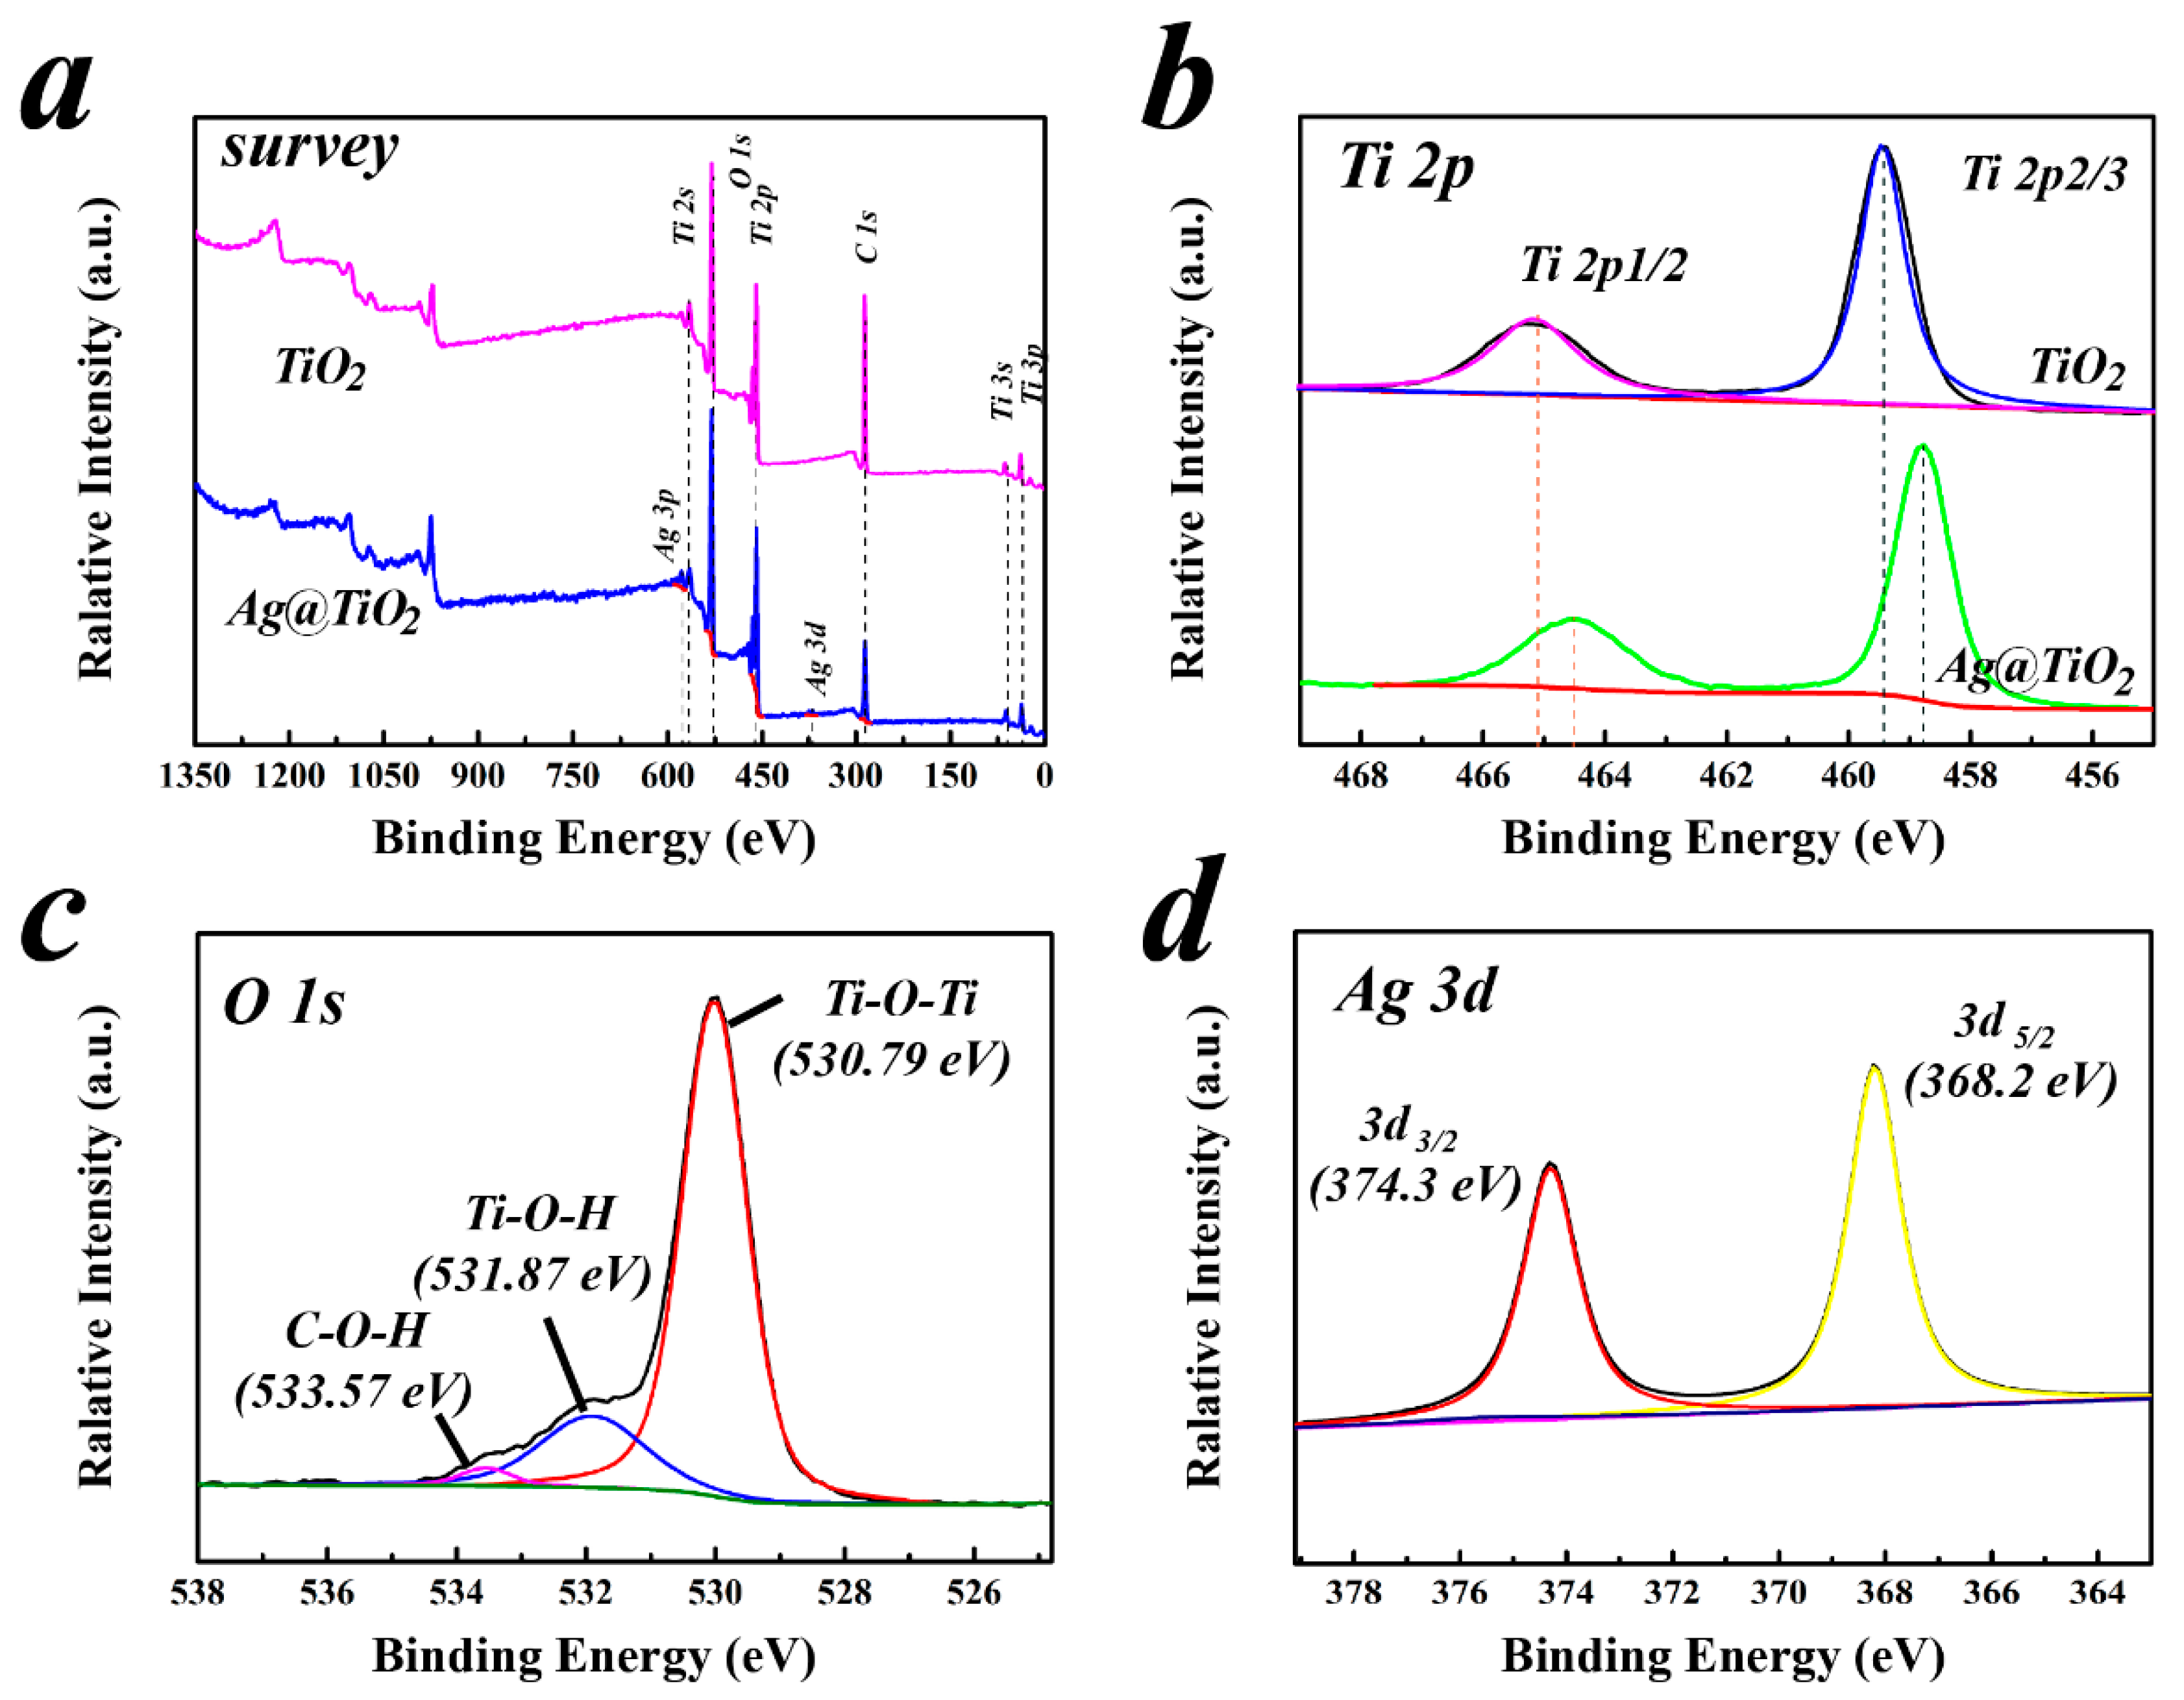
2.1. Preparation and Characterizations of Ultra-Trace Silver Enhanced Titania Photocatalyst

The ultra-trace silver doped TiO2 photocatalysts were prepared via a “green” ultrasonic impregnation assisted photoreduction strategy, as shown in Figure 1. Firstly, the color of ethanol and TiO2 mixture maintained no change under dark conditions after AgNO3 addition. During the illuminated period, the mixture’s color gradually turned from initial ecru to light blue (the color of products gradually deepened with the Ag dosage increasing, such as yellow-brown, purple-brown, etc., which mainly due to the photogenerated electrons (e) assisted Ag+ reduction process (Figure 1a). Then, the obtained catalysts were used for Cr(VI) reduction (Figure 1b). Cr(VI) was first adsorbed on the surface of Ag@TiO2, and then Cr(VI) was reduced to Cr(III) gradually by the CB formed e.
Figure 2a shows the typical morphology and surface composition of the resultant Ag@TiO2 compound. The transmission electron microscope (TEM) image clearly shows the sphere-like synthesized material with an average diameter of ca. 24.5 ± 2 nm. High resolution transmission electron microscope (HRTEM, Figure 2b) observation revealed that TiO2 nanoparticles crystallized well with a lattice fringes spacing of 0.35 nm, which well matches the d-spacing of (111) plane of TiO2 (d = 0.35 nm). Furthermore, the d-spacing of 0.235 nm could be found either which fits the (001) plane d spacing of TiO2 (d = 0.235 nm) and no obvious Ag nanoparticles could be found since the rather trace silver addition of 0.06 wt %. However, as shown in Figure S1 and Table 1, silver nanoparticles exist on the surface of TiO2. According to the BET surface area analysis (Tables S1 and S2), the Ag doping ratio and h+ scavenger (ethanol) concentration do not influence the specific surface area of Ag@TiO2 obviously.
Considering the mild experimental conditions, the obtained nanocompounds exhibited similar X-ray diffraction (XRD) patterns to the pure TiO2, as shown in Figure 3 and Figure S2. Specifically, the peaks of Ag@TiO2 at 2θ values of 25.1°, 37.6°, 47.9°, 53.7°, 55.1°, 62.6°, 68.8°, 70.1°, and 75.0° might belong to (101), (004), (200), (105), (211), (204), (116), (220), and (215) crystal planes of anatase phase (JCPDS Card No. 21-1272), respectively. Moreover, the peaks at 27.4° and 36.0° were ascribed to the (110) and (101) planes of rutile phase (JCPDS Card No. 21-1276). In comparison to bare TiO2, the peaks at 2θ value of 38.1°, 44.23°, 64.4°, and 77.4° could be found, which belong to the (111), (200), (220), and (311) planes of Ag (JCPDS card number: 04-0783), respectively. However, since the Ag addition was rather low and overlapping by the TiO2 characteristic peak at 38.1°, these peaks were relatively weak in the XRD pattern. Finally, according to the XRD and TEM analyses above, the results revealed that Ag nanoparticles were formed and successfully loaded on the TiO2 surface.
It was noteworthy that the obvious improvement of visible light absorption in the range of 400–700 nm could be noticed under the addition of Ag, which fits the gradual color change from ecru to purple (Figure 3b, insert). A significant optical adsorption enhancement could be observed in different Ag contents of 0.3 wt %, 1.0 wt % and 3.0 wt %, whose absorption peaks appeared as a red shift moved from 480 nm to 580 nm. However, there were almost no differences between Ag@TiO2 doping ratios of 0.01 wt % and 0.06 wt %, which were similar to bare TiO2. The observed peaks should be attributed to the surface plasmon resonance (SPR) effect of spatially confined electrons in Ag nanoparticles and this red-shift might be related to the interaction between Ag and TiO2. Moreover, the adsorption peak range might be continuously broadened as the Ag dosage increases.

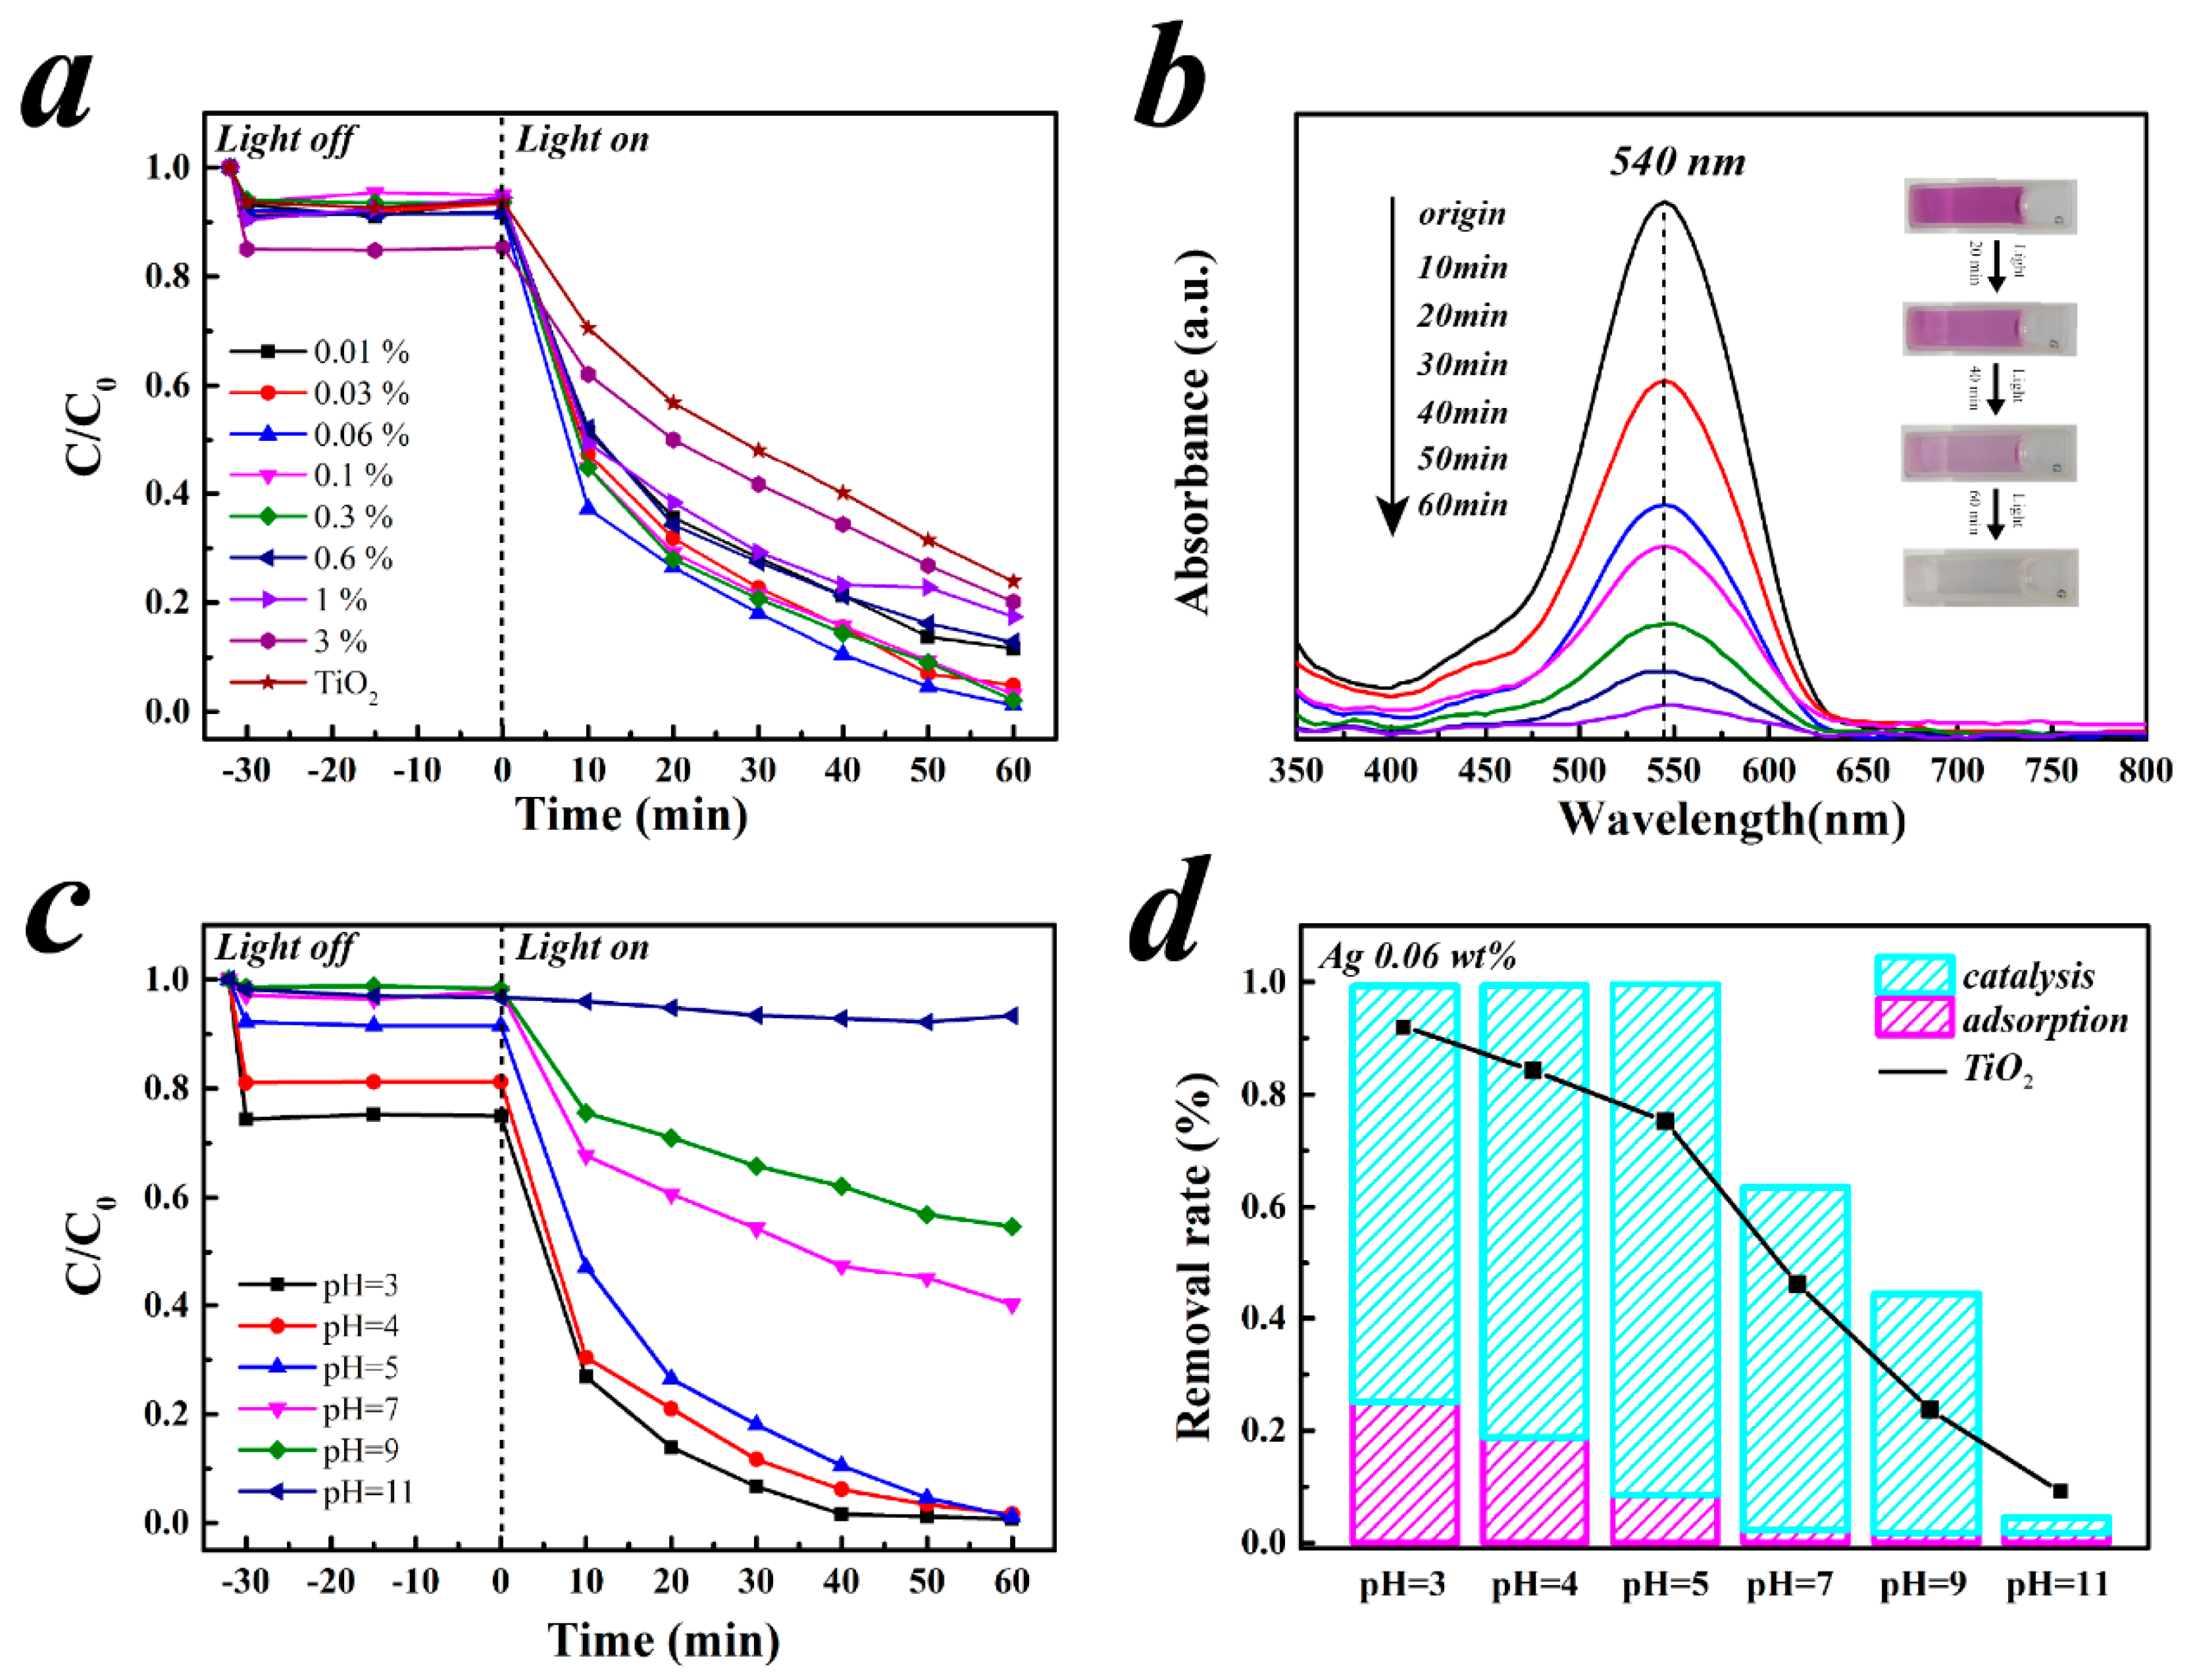
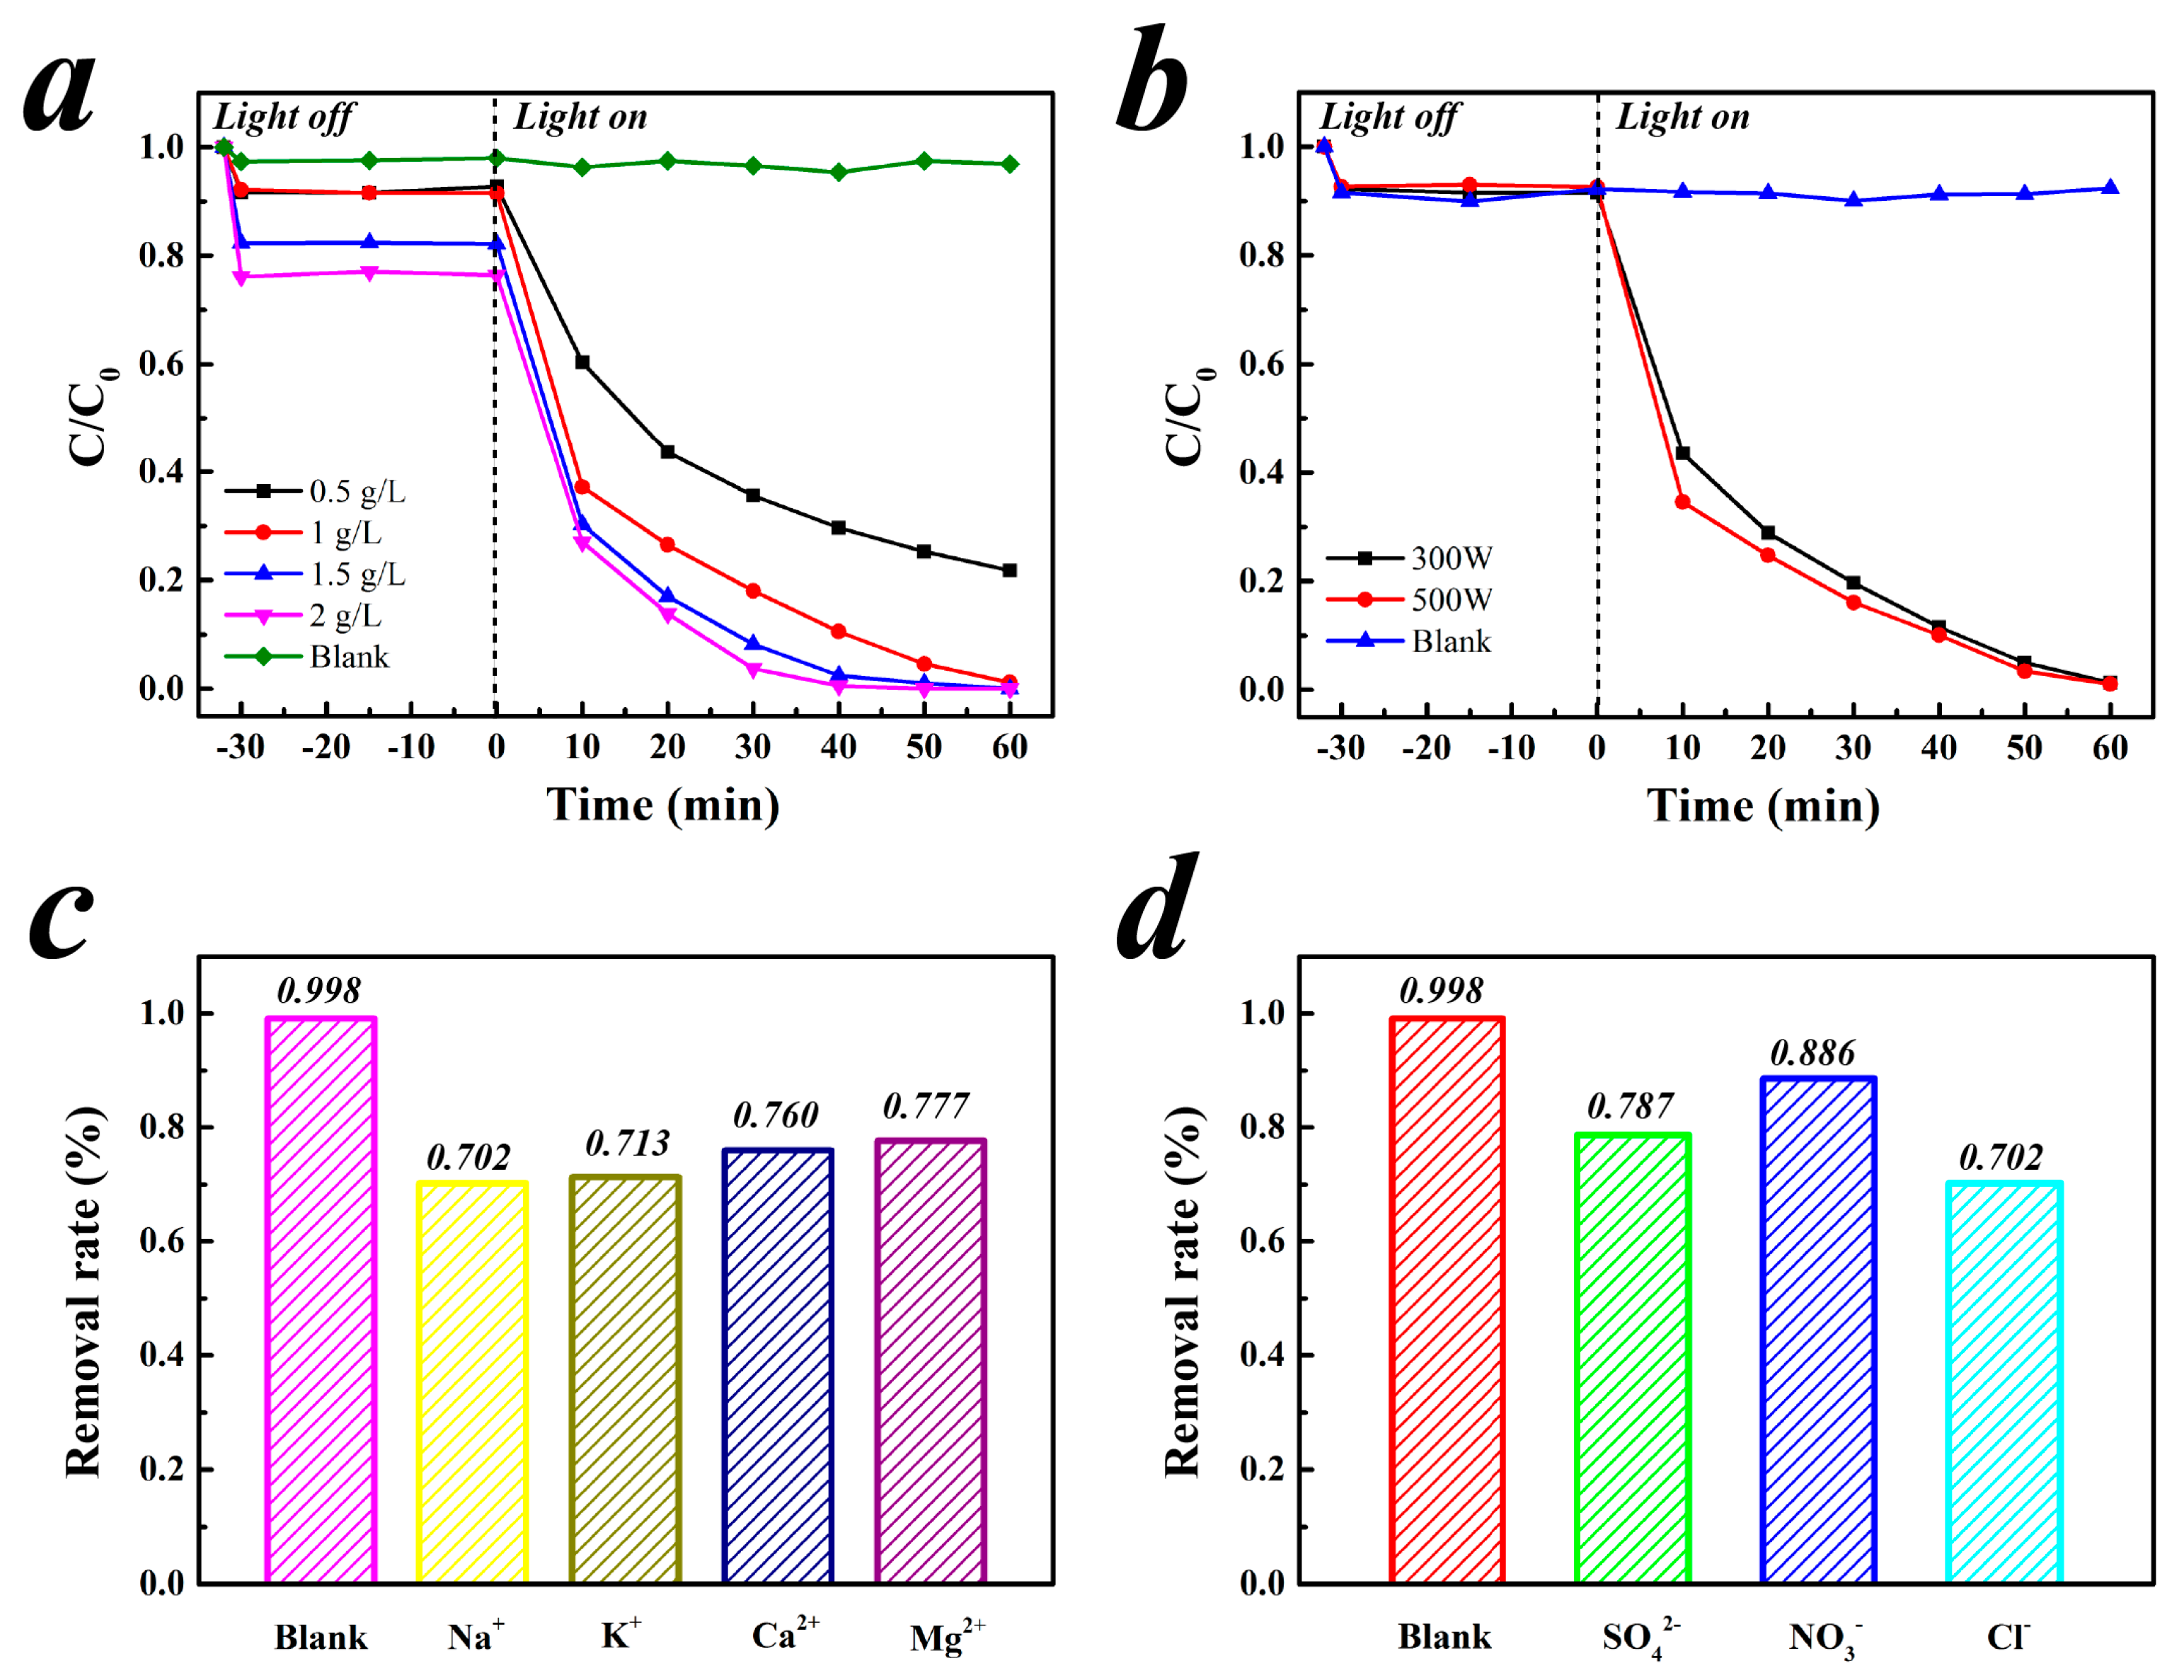
2.2. Catalytic Activity for Cr(VI) Photoreduction

The catalytic properties of Ag@TiO2 photocatalysts were evaluated by Cr(VI) imitated heavy metal wastewater. As shown in Figure 4a, Cr(VI) was firstly adsorbed onto the surface of Ag@TiO2 and adsorption equilibrium could be reached within 30 min under dark conditions. The aquatic Cr(VI) could be fully reduced to Cr(III) within 60 min under UV irradiation. The results illustrated that the Cr(VI) photocatalytic reduction efficiency got improved through Ag loading, which might be due to the following reasons. The photoresponse range could be enhanced, as presented in Figure 3b. Then, the Schottky junction would be formed at the interface with Ag deposition. Under light irradiation, photo-generated electrons (e) tend to migrate and accumulate on Ag nanoparticles which served as effective electron acceptors, and the extra acceptors subsequently promoted the e/h+ separation efficiency and ultimately enhanced the photocatalytic reduction of Cr(VI). It is noteworthy that the amount of metal deposition has a great influence on the photocatalytic ability of the obtained photocatalysts. However, the photocatalytic efficiency gradually decreases once the Ag loading exceeds 0.06 wt %, which is mainly due to the shielding effect by the excessive Ag coverage. In addition, when the Ag doping ratio gets higher (>0.06 wt %), the extra Ag sites tend to act as the e/h+ recombination centers which may lead to the recombination enhancement and result in photon quantum efficiency drop. The effect of different concentration of Ethanol on Cr(VI) reduction is shown in Figure S3. Figure 4b shows that the maximum UV-visible absorption of Cr(VI) solution was at 545 nm, which was close to the standard value of 540 nm. It can be obviously noticed that the Cr(VI) absorbance decreased rapidly in the first 20 min, but slowly later on.
The impact of the initial pH on the Cr(VI) reduction was investigated, and its degradation efficiency was gradually reduced with pH increasing from 3.0 to 11.0 (Figure 4c,d). Therefore, the initial pH plays a significant role in the whole Cr(VI) photocatalytic reduction processes, which not only affects the surface adsorption but also the chromium’s redox potential [35]. On the other hand, as the main catalytic reaction occurred on the interface, the adsorption ability to substrates would be a crucial role in the migration and captures of photogenerated carriers, which would directly affect the surface reactivity in the following photocatalytic reaction processes [36]. First of all, the Cr(VI) adsorption procedure was the prerequisite step for photocatalytic reduction, and the influence of initial pH on adsorption as well as resultant removal rate are shown in Figure 4d. Cr(VI) interface adsorption rapidly increases with pH decreasing. The maximum adsorption rate of 25% (pH = 3) was five times that of the lowest one 1% (pH = 11). This phenomenon was mainly due to the electrostatic attraction that the negatively charged Cr2O72− would spontaneously attach to positively charged subjects. According to the ζ potential testing in (Figure S4), the pHpzc (pH of zero-point charge) value of Ag@TiO2 was 5–6. So, when initial pH <5, the surface would be positively charged which was in favor of the Cr2O72− adsorption. On the contrary, its surface would become negatively charged when pH >5, which will result in a decrease in the adsorption capacity of Cr(VI). Therefore, it could be concluded that the adsorption capacity for Cr(VI) plays an important role in the photoreduction processes.
On the other hand, the metal pair’s redox potential was either a significant factor that determines the photocatalytic ability of the resultant composites. As shown in Figure 4c, the Cr(VI) photoreduction rate gradually drops with pH increasing. Specifically, the equilibrium could be reached within 40 min under the condition of pH = 3, but no obvious reduction could be found at pH = 11, which indicated that the oxidation ability of Cr(VI) was strongly affected by the H+ concentration. Moreover, as the initial pH got higher, the redox potential of Cr(VI) decreased which leads to the drop of its oxidation ability (See Supplementary Materials, Equations (S1)–(S3)). It could be concluded that the photoreduction of Cr(VI) should be easier under acidic conditions and relatively difficult under neutral or alkaline conditions could be drawn. And, it also indicated that the negative effect of the proton deficiency could be inhibited via providing enough protons to the reaction system. Moreover, it is noteworthy that Ag@TiO2 exhibits a higher photocatalytic activity than pure TiO2 at the same pH (Figure 4d, line), which may be due to the available free electrons on the Ag@TiO2 surface or the active sites that can donate electrons to Cr(VI) being more than pure TiO2. Therefore, the initial pH impact on Cr(VI) reduction came from the integrative actions of various changes in the physicochemical properties of all the substances involved. The high efficiency of the obtained ultra-trace Ag doped TiO2 photocatalyst under acidic, neutral and alkaline conditions suggests its promising potential for wastewaters purification and treatment.
The effect of the catalyst dosage on Cr(VI) reduction is shown in Figure 5a, the Cr(VI) reduction efficiency exhibited a positive dependence on the Ag@TiO2 dosage. There was not any reduction that could be detected in the absence of catalyst addition and the Cr(VI) removal efficiency gradually increased with dosage increasing. When the dosage was increased to 2 g/L, Cr(VI) could be fully reduced to Cr(III) within 30 min, and the removal rate could still reach above 75% at a lower dosage (0.5 g/L). It was mainly due to that the increasing dosage providing more reaction sites for Cr(VI) adsorption and photoreduction, as well as to producing more photogenerated electrons.
Figure 5b shows the Cr(VI) photocatalytic reduction under the UV-light intensity that varied from 0 W (blank) to 500 W. The removal rate for adsorption was maintained obviously at less than 10% until the equilibrium and the photoreduction was significantly improved under UV-light compared to the blank one. However, it should be noted that there are little differences between the 300 W and 500 W mercury lamps although the intense illumination might facilitate electron production. The Cr(VI) removal efficiency could reach about 95% within 50 min under the illumination intensities 300 W or 500 W. Therefore, it would be more advisable to utilize the 300 W lamp for considering the energy consuming.
Since industrial wastewater contains a variety of conventional materials which are usually comprised of routine anions and cations, these co-existing substances tend to reduce the catalytic performance of Ag@TiO2 composites. To explore the potential synergistic effect between co-existing ions and Ag@TiO2 composites, a series of co-existing ions, such as Cl, SO42−, NO3 and Na+, K+, Mg2+, Ca2+ ions were utilized in the control group. As the amount of co-existing ions in practical industrial wastewater usually reaches thousands of ppm, in order to imitate the actual situation, its concentrations are all set at 0.1 mol/L, which in turn may affect the rate of photocatalytic reduction.
As illustrated in Figure 5c, all co-existing ions have a significant impact on the Cr(VI) reduction process. Two sequences on the impact of co-existing ions were drawn through experiments, like Cl > SO42− > NO3 and Na+ > K+ > Ca2+ > Mg2+. The main reason for the inhibiting effect by co-existing anions was the competition between anionic and dichromate adsorption and active sites on the surface. To be more specific, NO3 have very few effects whereas SO42− or Cl were more rapidly adsorbed by the catalyst than Cr(VI), which is similar to a previous report [37]. Obviously, the Na+ introduced together has a certain influence on the removal rate of the experiment (Figure 5d). As for cations, the impacts on photoreduction can be neglected since Na+, K+, Mg2+ and Ca2+ ions are already in their highest oxidation states, so they can neither capture radicals or photo-generated holes [38]. Therefore, the inhibiting phenomenon by cations may be caused by the presence of Cl. The Cr(VI) removal rates in Mg2+ and Ca2+-containing systems are better than that in K+ and Na+-containing systems, which may be due to the higher affinity of higher valence cations for Cr2O72−, and enhances anion transfer rate in solution. For the same valence state, the larger the ion radius (K+ > Na+ or Ca2+ > Mg2+), the ion center contains more positive charge which promotes the anions’ adsorption [39].
Additionally, the reusability of the Ag@TiO2 photocatalyst was also evaluated. The performance of Ag@TiO2 nanocomposite within five recycles is shown in Figure 6a. Obviously, the removal efficiency slowly decreases with the recycling continuing. It may be due to that the increasing amount of adsorbed Cr(III) on Ag@TiO2 which will inhibit its surface adsorption and active site reduction properties. To further identify the adsorbed species on the catalyst surface, high resolution XPS spectra of the dry Ag@TiO2 sample after the reaction were used to characterize the changes in the catalyst surface. The XPS spectra of Cr peaks were obviously presented in Figure 6b. The bands at binding energy of 577.2 eV and 585.9 eV were attributed to Cr(III) 2p3/2 and Cr(III) 2p1/2, respectively. The peaks at 580.6 eV belonged to the Cr(VI) 2p3/2. The results show that the adsorption and reduction were simultaneously carried out during the Cr(VI) photoreduction and the generated Cr(III) was also adsorbed on the Ag@TiO2 surface, which results in a low Cr(VI) reduction rate. Second, it was found that the XPS of Ag shifted to a certain extent after the reaction (Figure S5), indicating that more Ag2O was produced. It is possible that the ability to transfer electrons might decreased, which will lead to a decline in catalytic performance. However, after five consecutive cycles, Ag@TiO2 removal rate could still reach 62%, indicating that the resultant photocatalyst has a relatively good reusability.
It is well known that the selective adsorption of Cr(VI) and the desorption of Cr(III) at the surface of photocatalysts are very important factors in determining the photocatalytic reduction. The modification of Ti3+ and hydroxyl groups can enhance the positive charge on the surface of the catalyst and further increase the preferential adsorption of Cr(VI) and repulsion of Cr(III) by electrostatic action [40]. Moreover, it might be a simpler way to make the catalyst aspects of active-site reusable by external force, like: thermal, chemical reactivation, calcine, and Ultrasonic cleaning et al.

2.3. Kinetic Modeling Study

The reaction between Ag@TiO2 photocatalysts and Cr(VI) was related to the multiphase surface reaction. Langumir-Hinshelwood first order kinetic model was applied to evaluate the reaction kinetics.
r 0   =   dC dt   =   kKCs 1 + KCs
where r0 is the initial photocatalytic reduction efficiency (mg/L∙min); t is the reaction time (min); k is the reaction efficiency constant (min−1)); K is the reaction equilibrium constant; and Cs is the reactant concentration (mg/L); k and K are determined by many factors in the reaction system, including the amount of catalyst, light intensity, initial concentration of reactants, reaction temperature, physical properties of the reactants, gas phase oxygen concentration, etc.
When the reaction substrate concentration is rather low, KC ≪ 1, the equation can be simplified to the apparent first order equation:
r 0   =   dC dt   =   kKC   =   k ap C
where kap is the apparent rate constant of a pseudo first order reaction. In the beginning of the reaction, t = 0, Ct = C0, the equation can be obtained after deformation:
ln ( C t C 0 )   =   k ap t + b
where Ct is the concentration of Cr(VI) in the solution at t min; C0 is the initial Cr(VI) concentration; b represents a constant; kap is the apparent rate constant (min−1).
From Figure 7, it can be seen that ln(Ct/C0) − t is in a good linear relationship and its performance fits the first order reaction. The apparent reaction kinetic constant can be applied to estimate the total reaction rate, and then compare the photocatalytic efficiency under different conditions. In Figure 7, initial pH and Ag loading affected the obtained reaction kinetic constant. The first-order kinetic equation, reaction rate constant, reaction rate and the correlation coefficients (R2) of the photocatalytic reaction under different conditions are shown in Table 2. It can be seen that the apparent rate constant kap decreases as initial pH grows, and kap under acidic condition (pH = 3) was about six times as much as the neutral one (pH = 7) and quickly dropped to about zero under alkaline conditions (pH = 11), indicating that acidic environment promotes the photocatalytic reduction processes. In addition, kap presents a trend that gradually rises to 0.0534 min−1 until the silver doping ratio reaches 0.06 wt % and then continuously decreases to 0.0211 min−1 as the Ag loading grows to 3.0 wt %. Furthermore, the results show that Cr(VI) reduction efficiency by 0.06 wt % Ag loading was 2.5 times compared to pure TiO2, indicating that suitable Ag loading on TiO2 surface promoted its photocatalytic ability significantly.

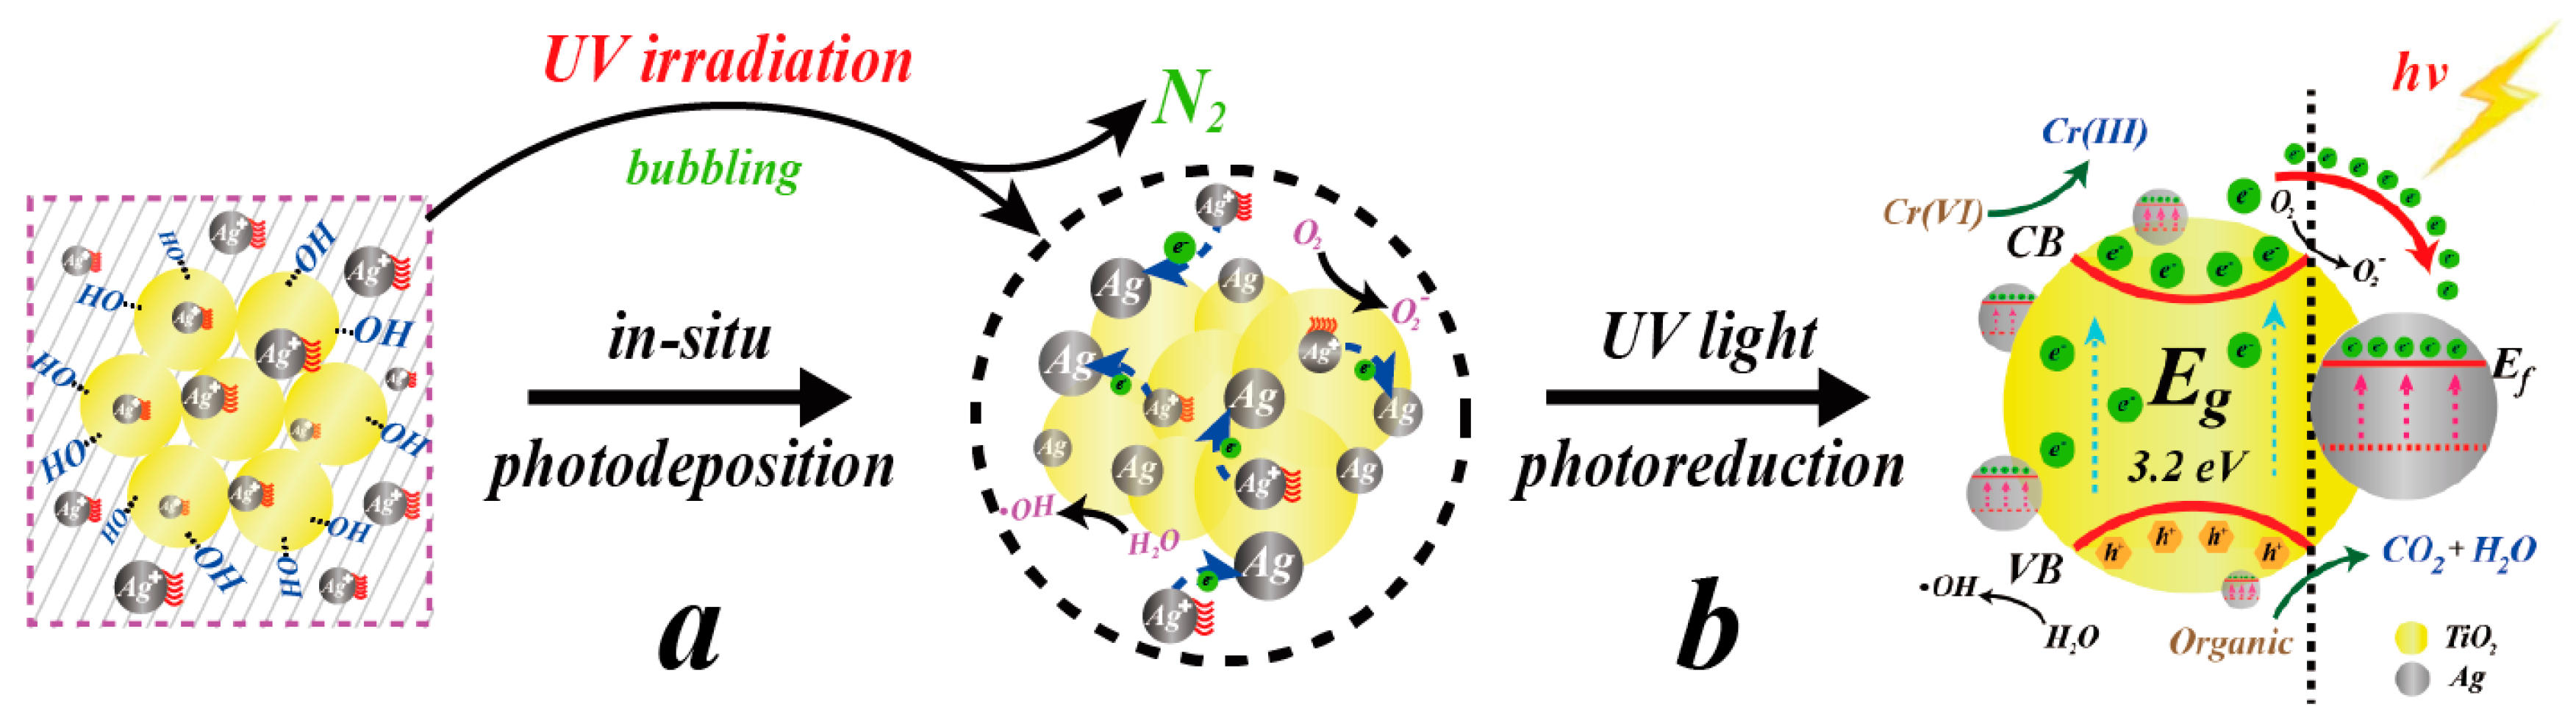
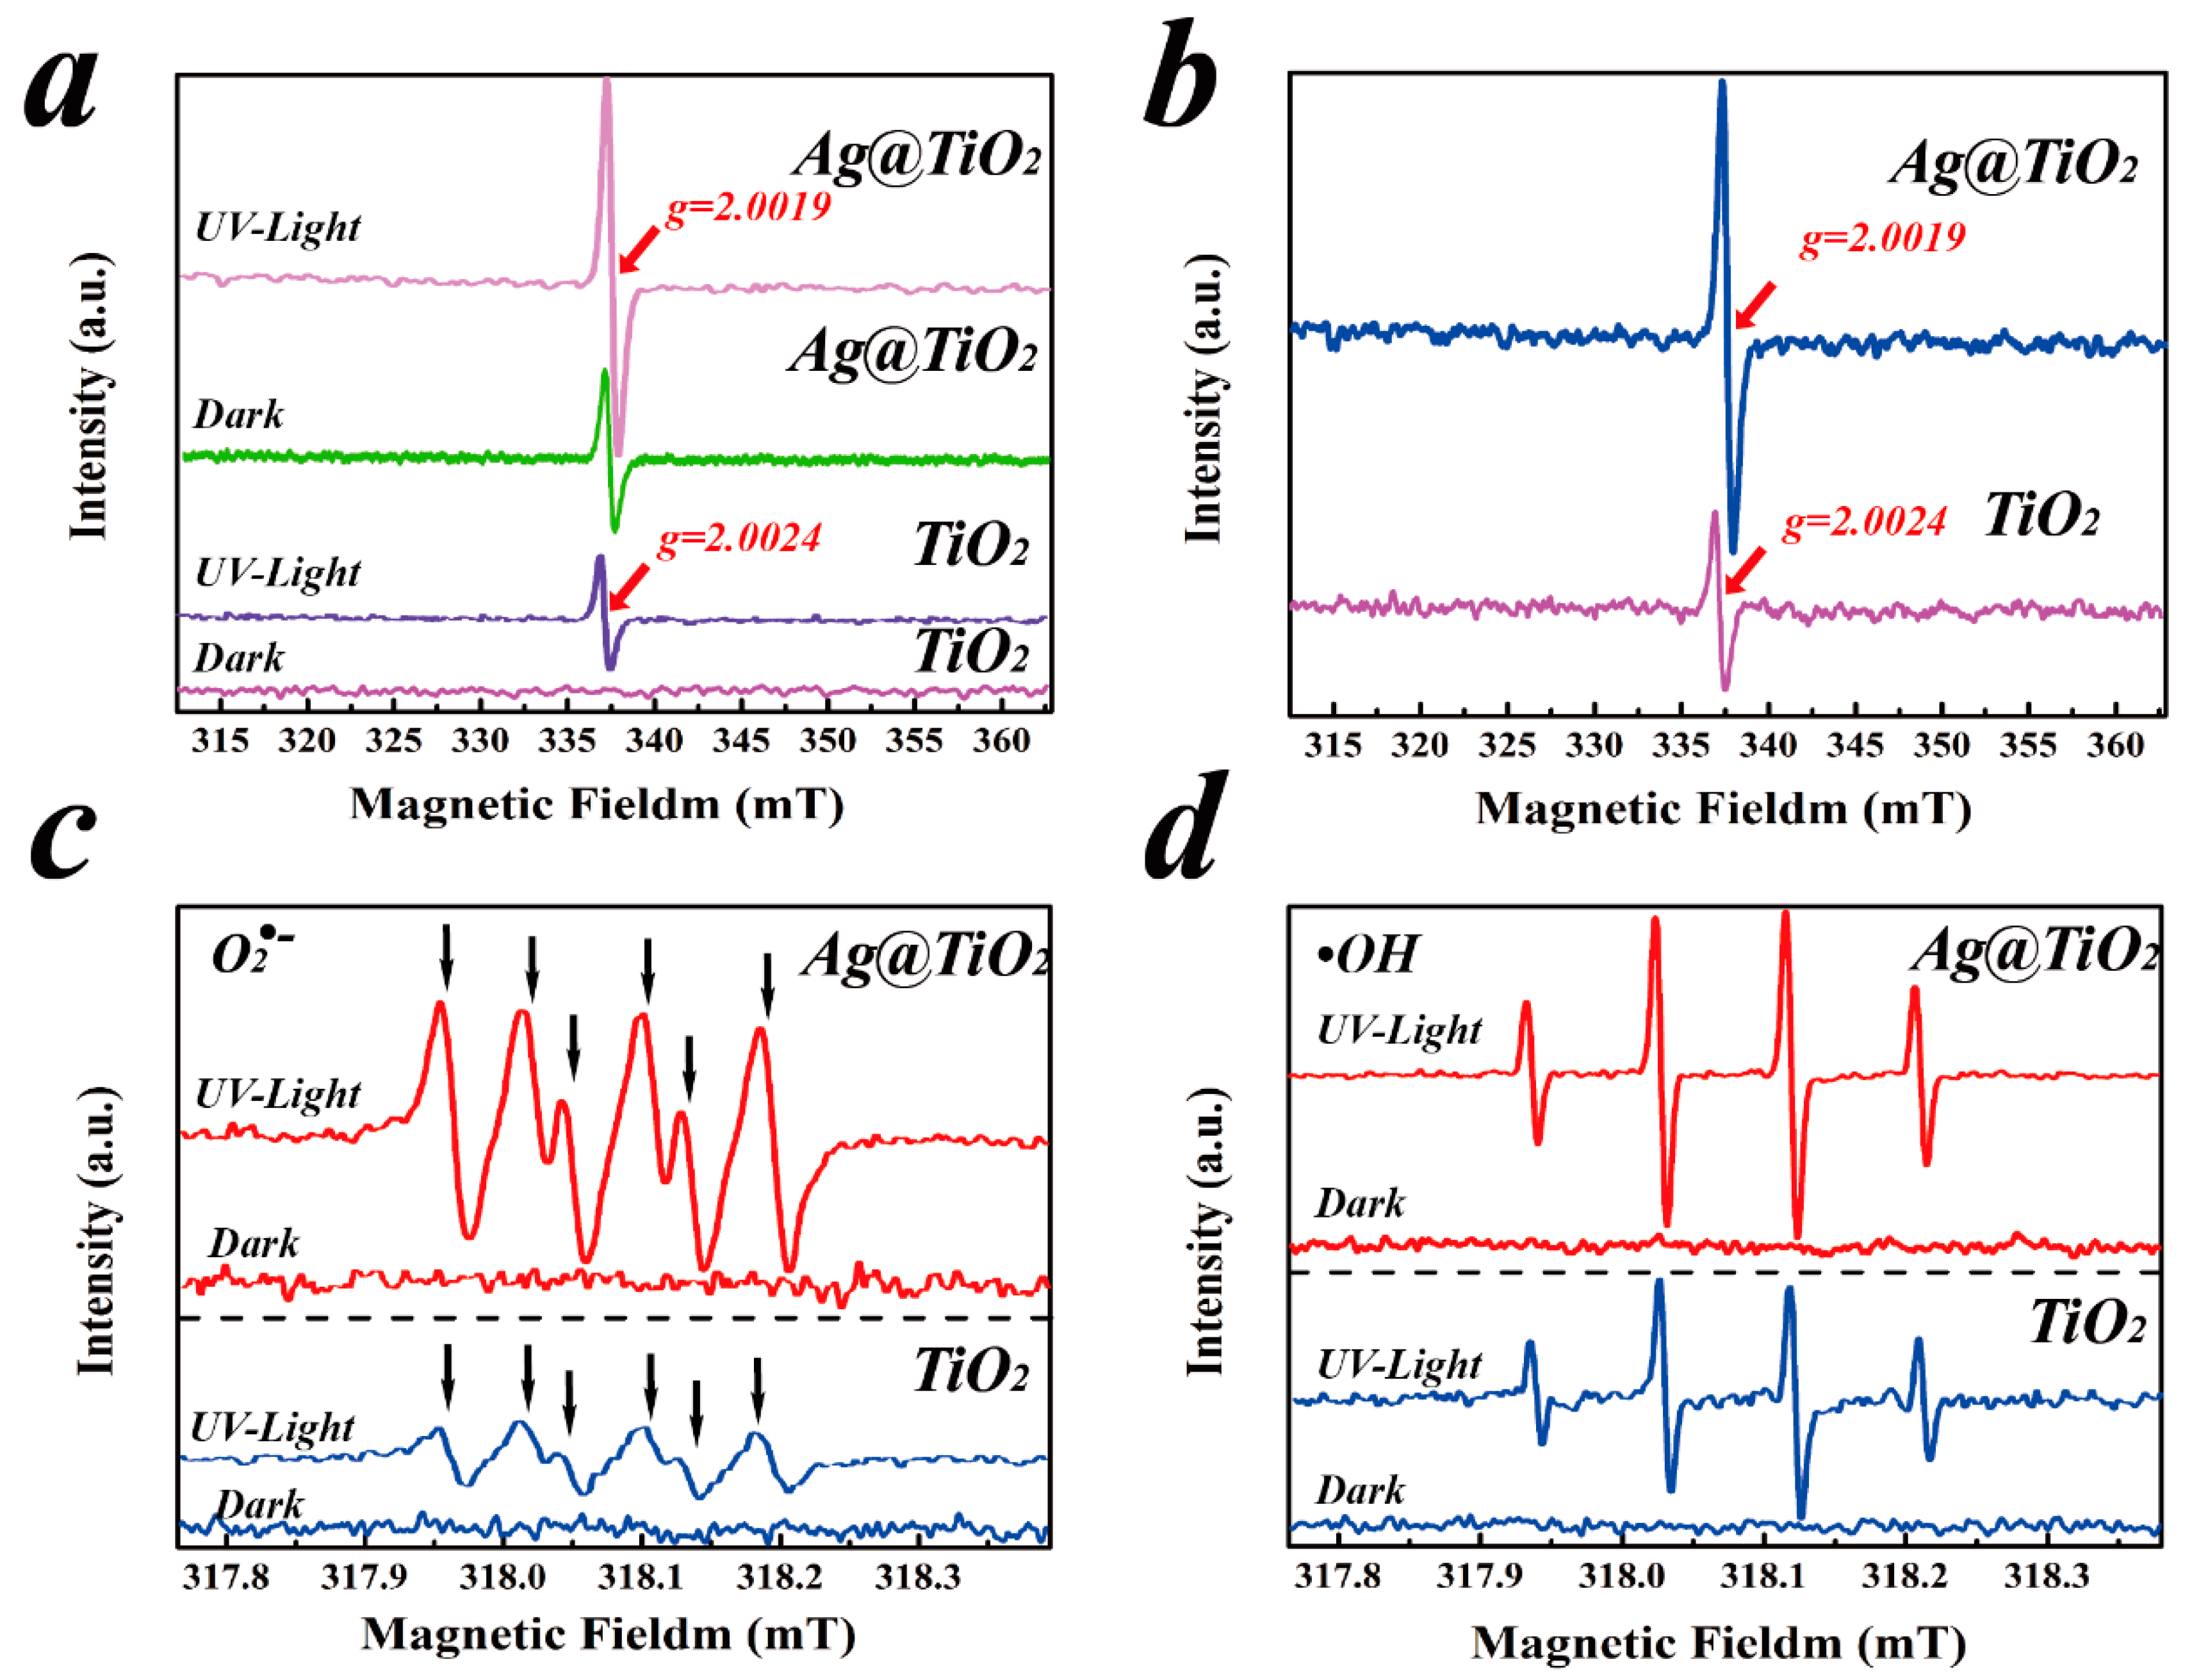
2.4. Mechanism of Photoreduction

To identify the radical species involved in the reduction of Cr(VI) by Ag@TiO2 system, EPR experiments using DMPO as the spin-trapping agent were carried out. EPR analysis results of TiO2 and Ag@TiO2 solids are shown in Figure 8a; it can be clearly seen that one signal appeared after UV irradiation both for bare TiO2 and Ag@TiO2; the g-factors were 2.0024 and 2.0019, respectively, which was considered to be a free electron in the conduction band of TiO2 or an oxyanion vacancy. The enhancement of the peak signal intensity proves that more free electrons and oxygen vacancies are generated in the Ag@TiO2 system, which may be due to the photogenerated electrons being transferred to silver elements and stored therein.
Figure 8c,d shows the EPR spectra of DMPO-trapped O2•− in methanol medium and DMPO-trapped OH in aqueous medium which have been investigated in the active radical species for the TiO2 and Ag@TiO2. It be able to evidently noted that four characteristic peaks (1:2:2:1) of DMPO-OH adducts and six characteristic peaks of the DMPO-O2•− adducts were observed on TiO2 or Ag@TiO2 nanocomposite systems under UV light irradiation, but no signal was detected in the dark. It could be noted that, the intensity signals of the hydroxyl radical and superoxide radical species formed in Ag@TiO2 were stronger than those in TiO2 under UV irradiation, which represent the sample of Ag@TiO2 effectively promoted electron/hole pair separation and prolonged the lifetime. This, in turn, explains why there is a higher photocatalytic activity of Ag@TiO2 than TiO2 toward the contaminants removal.
To further identify the elemental constitution and its valences, the resultant Ag@TiO2 photocatalyst was characterized via XPS spectra. The full spectrum of TiO2 loaded with Ag nanoparticles was illustrated in Figure 9a and Figure S6, the main elements were Ti, O, C and Ag. The C emergence is due to the introduction of exogenous substances during the testing processes. As presented in Figure 9b, it can be seen that the loading of silver nanoparticles has obvious effects on the binding of Ti 2p orbitals. Compared with pure TiO2, the combination of Ti 2p1/2 and Ti 2p3/2 can change from to 465.13 eV and 459.45 eV to 458.77 eV and 464.57 eV, respectively. The affection was due to that the load of Ag makes the heterojunction between Ag and TiO2, and the plasmonic effect produced by Ag makes the electron field which would influence TiO2. Figure 9c shows the XPS peak of O 1s, from which we can find the asymmetry peak of O. Therefore, two peaks were obtained by Gauss Lorentz method. The peaks at 531.87 eV and 530.79 eV were assigned to Ti-OH bond and the Ti-O-Ti bond in lattice oxygen, respectively. The binding energy at 533.57 eV was due to the adsorbed oxygen on the catalyst surface. The X-ray spectrum of Ag 3d is shown in Figure 9d, indicating that the XPS peak of Ag 3d mainly contains two characteristic peaks. The binging energies of Ag 3d3/2 and Ag 3d5/2 were observed at 368.2 eV and 374.2 eV, respectively. The results showed that the difference of binding energies between Ag 3d5/2 and Ag 3d3/2 was 6.1 eV, revealing that the Ag element depositing on TiO2 surface exists in the form of zero valences, which was reported in the previous literature [27,41]. To further elucidate the surface metal composition, Ag 3d peaks of the catalysts were deconvoluted, and the content of Ag was calculated to be 0.6655% (Table S3). Combined with the XRD and HRTEM results, the existence of Ag and TiO2 nanoparticles in the resultant compound can be further proved.
The photocatalytic reaction was considered to be a heterogeneous interfacial reaction, and mainly contained two parts of the reaction mechanism (Figure 10). Firstly, the good adsorption of Cr(VI) on the surface of Ag@TiO2 was a prerequisite of photoreduction. Then, the Cr(VI) was reduced to Cr(III) by using photogenerated electrons from the light source. Adsorption of oxygen on the catalyst surface as an electron competitor was generally considered to have the potential to reduce the rate in the photoreduction reaction. Oxygen reduction state (O2•−) can promote the photoreduction of Cr(VI) in TiO2 system as electron transfer intermediates [42]. From the results of photoreduction experiments and the EPR spectra of DMPO-trapped O2•−, it can be seen that a substantial increase of O2•− did not inhibit the reduction activity of photocatalysis, which may indicate the O2•− as a reduced product formed by obtaining electrons and also has strong reducibility, resulting in the transformation of Cr(VI), a strongly oxidizing species, to Cr(III). Therefore, the photoreduction of Cr(VI) by Ag@TiO2 system under UV light is a complex synergistic processes with multi-actions. However, more photogenerated electrons were probably exposed, and resulted in a higher photocatalytic activity due to the loading of Ag on TiO2.

3. Materials and Methods

3.1. Materials

Potassium dichromate (K2Cr2O7), sodium hydroxide (NaOH), hydrochloric acid (HCl, 36.0–38.0%) were all of analytical grade. Absolute ethanol (C2H5OH) was premium grade pure. All of the chemicals above were purchased from Kelong Chemical Reagent Company (Sichuan, China). TiO2 (P25) nanoparticles powder was supplied by Degussa Company (Essen, Germany), which is a mixture of anatase and rutile (8:2) with primary particle sizes of 20–30 nm. Silver nitrate (AgNO3) was obtained from Aladdin Industrial Corporation (Shanghai, China). Deionized (D.I.) water was produced by Ulupure Milli-Q water purification system.

3.2. Preparation of Ag@TiO2 Photocatalyst via Ultrasonic Impregnation Assisted Photoreduction Deposition

Silver was deposited onto the surface of TiO2 formed via a “green” ultrasonic impregnation assisted photoreduction strategy. Firstly, a suspension of titanium dioxide nanoparticles (P25, 10 g/L) with absolute ethanol solution (different concentrations of ethanol solution ca. 0%, 25%, 50%, 75% and 100%, as an electron donor) and a precious metal precursor solution (AgNO3 0.074 mM) were stirred and ultrasound 30 min under dark conditions. Then, the suspension was transferred to a quartz reactor under UV irradiation (300 W mercury lamp) for another 30 min. Finally, the obtained Ag@TiO2 nanocomposites were filtered and washed with a large amount of ultrapure water to remove unreacted silver nitrate, and freeze-dried for further experiments. A typical silver loading was evaluated to be ca. 0.0648 wt % (Ag/TiO2) by using ICP-AES (Table 1).

3.3. Batch Experiments of Photoreduction

The prepared photocatalyst was suspended in a quartz reactor containing 50 mL (10 mg/L) target contamination (Cr(VI)). The suspension was dispersed for about 2 min by ultra-sonication before irradiation, and then stirred in the dark for 30 min to allow equilibrium adsorption of the heavy metal. A 300 W mercury lamp was used as a light source (irradiation about 60 min) to excite TiO2 to generate photo-generated electrons and photogenerated holes to reduce heavy metals. Effects of silver load, pH, catalyst dosage and coexisting ions on Cr(VI) reduction were fully considered. A 20 mg/L Cr(VI) aqueous solution was diluted from 100 mg/L Cr(VI) stock solution in 1 L ultra-pure water before experiments. The pH was monitored by PHS-320 and adjusted by 1.0 M HCl or NaOH. The sample aliquots were intermittently (0, 10, 20, 30, 40, 50 and 60 min) withdrawn and filtered through a 0.45–μm aqueous syringe filter for the analysis of Cr(VI) using the DPC (diphenyl-carbazide) method at 540 nm (UV-vis spectrophotometer).

3.4. Catalyst Characterization and Involved Analytical Method

The crystal structure of Ag@TiO2 was characterized by Ultima IV XRD (Rigaku Corp., Tokyo, Japan) employing Cu Kα radiation (λ = 0.154 nm, 40 KV) in the range of 3° to 80°. The micromorphology was observed by JEM2100 TEM (JEOL, Tokyo, Japan) operated at 200 kV. XPS measurements were performed by a K-Alpha Probe (Thermo Scientific, Waltham, MA, USA) with a monochromated Al-Kα radiation (300 W). UV-vis spectra was obtained on a spectrophotometer (Shanghai United Instrument Corp., Ltd., Shanghai, China). Zeta Potential (ZP) of the nanoparticles was determined by Malvern Zeta Sizer Nano series 3600 (Malvern Instruments Ltd., Worcestershire, UK). The BET surface area was measured at 77 K using F-Sorb 2400 N2 adsorption analysis (Gold APP Instruments, Beijing, China).
Electron paramagnetic resonance spectra (EPR) was performed on an EMX-8 spectrometer (Bruker BioSpin Corp., Karlsruhe, Germany). First, the sample was dispersed in aqueous solution (1 mg/mL) and dispersed by ultrasonic uniformity; Second, add DMPO (100 mM) and mix well; Third, the mixed sample was placed in a flat pool, and then set in the instrument test chamber; Fourth, in situ lighting test (5 min) and record the data.
Inductively coupled plasma atomic emission spectrometry (ICP-AES) was used to evaluate the Ag amount in the obtained photocatalyst by Agilent 720 (Agilent Technologies Inc., Palo Alto, CA, USA). First, 0.0164 g Ag@TiO2 was dissolved in aqua regia and boiled. After cooling, set it in a 50 mL volumetric flask. Then, dilutes the solution according to different dilution factors for detection. At last, record the data on the display. The conversion is obtained from the readings and the actual participating of samples.

4. Conclusions

Based on ultrasonic impregnation-assisted UV-photoreduction, Ag+ could be fully reduced via a facile in-situ synthetic approach toward ultra-trace silver-doped TiO2 photocatalysts without using any reducing agents. The results demonstrated that all obtained Ag@TiO2 photocatalysts have a significant photocatalytic activity compared to commercial P25 nanoparticles in the reduction of Cr(VI), which is interpreted as the loading of Ag being used as an intermediary container for electron transfer and storage to promote the separation of photogenerated e and h+. The Langmuir-Hinshelwood kinetic model can well explain the removal kinetics of Cr(VI) reduction. Regeneration performance of Ag@TiO2 indicated that the photocatalyst still maintained a rather high catalytic activity after five cycles (62%) and could be reused. Taking the practical application of photocatalytic removal of wastewater into account, the solution pH, coexistence of ions, dosing and other factors were considered, which will provide a useful guide for further reaction model simulation. The facile-fast, low-cost and eco-friendly method of synthesizing Ag@TiO2 nanomaterials can provide a valid strategy for the broad-scale preparation of precious metal matrix composites, and might be used as a promising photocatalyst for wastewater treatment.

Supplementary Materials

The following are available online at https://www.mdpi.com/2073-4344/8/6/251/s1. Table S1 BET data for different silver loadings. Table S2 BET data for different solvent concentration. Table S3 XPS date of atomic (Ag@TiO2, 0.6 wt %). Figure S1 The Energy Dispersive Spectrdmeter of Ag@TiO2 catalyst. Figure S2 XRD patterns of the Ag@TiO2 nanocomposites, in which A is anatase phase and R is rutile phase. Figure S3 Effect of different concentration of empty scavenger (Ethanol) on Cr reduction. Figure S4 Zeta potential of bare TiO2 and Ag@TiO2 catalyst. Figure S5 High resolution XPS of Ag 3d of Ag@TiO2 catalyst before (a) and after (b) reaction. Figure S6 The survey spectrum XPS spectra of the Ag@TiO2 composites.

Author Contributions

S.P., R.Z., and W.C. initiated the concept; S.P. and Y.H. designed and conceived of the experiments; Y.H. and H.C. performed the experiments; S.P., Y.H. and Z.Y. analyzed the data; H.C., R.Z., and D.D. performed the characterizations, interpreted the data; S.P. contributed reagents/materials/analysis tools; S.P., Y.H. and S.X. drafted the manuscript, W.C. and Z.D. corrected the manuscript. All authors read and approved the final manuscript.

Funding

This research received no external funding.

Acknowledgments

The authors thank Anatoly ZINCHENKO for a helpful discussion. This work was supported by the National Natural Science Foundation of China (No. 41772264) and the Research Fund of State Key Laboratory of Geohazard Prevention and Geoenvironment Protection (SKLGP2018Z006). Wei Chu.

Conflicts of Interest

The authors declare no conflict of interest.

References

  1. De Flora, S.; Bagnasco, M.; Serra, D.; Zanacchi, P. Genotoxicity of chromium compounds. A review. Mutat. Res. 1990, 238, 99–172. [Google Scholar] [CrossRef]
  2. Ellis, A.S.; Bullen, T.D. Chromium isotopes and the fate of hexavalent chromium in the environment. Science 2002, 295, 2060–2062. [Google Scholar] [CrossRef] [PubMed]
  3. Kebir, M.; Chabani, M.; Nasrallah, N.; Bensmaili, A.; Trari, M. Coupling adsorption with photocatalysis process for the Cr(VI) removal. Desalination 2011, 270, 166–173. [Google Scholar] [CrossRef]
  4. Cimino, G.; Passerini, A.; Toscano, G. Removal of toxic cations and Cr(VI) from aqueous solution by hazelnut shell. Water Res. 2000, 34, 2955–2962. [Google Scholar] [CrossRef]
  5. Sheng, G.; Hu, J.; Li, H.; Li, J.; Huang, Y. Enhanced sequestration of Cr(VI) by nanoscale zero-valent iron supported on layered double hydroxide by batch and XAFS study. Chemosphere 2016, 148, 227–232. [Google Scholar] [CrossRef] [PubMed]
  6. Yang, L.; Zheng, X.; Liu, M.; Luo, S.; Luo, Y.; Li, G. Fast photoelectro-reduction of Cr(VI) over MoS2@TiO2 nanotubes on Ti wire. J. Hazard. Mater. 2017, 329, 230–240. [Google Scholar] [CrossRef] [PubMed]
  7. Bhowal, A.; Datta, S. Studies on transport mechanism of Cr(VI) extraction from an acidic solution using liquid surfactant membranes. J. Membr. Sci. 2001, 188, 1–8. [Google Scholar] [CrossRef]
  8. Chuang, S.M.; Vinh, Y.; Feng, C.L.; Lee, S.J.; Choo, K.H.; Li, C.W. Electrochemical Cr(VI) reduction using a sacrificial Fe anode: Impacts of solution chemistry and stoichiometry. Sep. Purif. Technol. 2017, 191, 167–172. [Google Scholar] [CrossRef]
  9. Alowitz, M.J.; Scherer, M.M. Kinetics of nitrate, nitrite, and Cr(VI) reduction by iron metal. Environ. Sci. Technol. 2002, 36, 299–306. [Google Scholar] [CrossRef] [PubMed]
  10. Pu, S.; Xiang, C.; Zhu, R.; Ma, H.; Zinchenko, A.; Chu, W. An efficient heterogeneous Fenton catalyst based on modified diatomite for degradation of cationic dye simulated wastewater. Desalin. Water Treat. 2017, 79, 378–385. [Google Scholar] [CrossRef]
  11. Gheju, M.; Balcu, I. Removal of chromium from Cr(VI) polluted wastewaters by reduction with scrap iron and subsequent precipitation of resulted cations. J. Hazard. Mater. 2011, 196, 131–138. [Google Scholar] [CrossRef] [PubMed]
  12. Ma, H.; Pu, S.Y.; Ma, J.; Yan, C.; Zinchenko, A.; Pei, X.J.; Chu, W. Formation of multi-layered chitosan honeycomb spheres via breath-figure-like approach in combination with co-precipitation processing. Mater. Lett. 2018, 211, 91–95. [Google Scholar] [CrossRef]
  13. Hu, J.; Chen, G.; Lo, I.M. Removal and recovery of Cr(VI) from wastewater by maghemite nanoparticles. Water Res. 2005, 39, 4528–4536. [Google Scholar] [CrossRef] [PubMed]
  14. Galán, B.; Castañeda, D.; Ortiz, I. Removal and recovery of Cr(VI) from polluted ground waters: A comparative study of ion-exchange technologies. Water Res. 2005, 39, 4317–4324. [Google Scholar] [CrossRef] [PubMed]
  15. Barrera, C. A review of chemical, electrochemical and biological methods for aqueous Cr(VI) reduction. J. Hazard. Mater. 2012, 1, 223–224. [Google Scholar]
  16. Chen, D.; Ray, A.K. Removal of toxic metal ions from wastewater by semiconductor photocatalysis. Chem. Eng. Sci. 2001, 56, 1561–1570. [Google Scholar] [CrossRef] [Green Version]
  17. Minero, C.; Mariella, G.; Maurino, V.; Vione, A.D.; Pelizzetti, E. Photocatalytic Transformation of Organic Compounds in the Presence of Inorganic Ions. 2. Competitive Reactions of Phenol and Alcohols on a Titanium Dioxide-Fluoride System. Langmuir 2015, 16, 8964–8972. [Google Scholar] [CrossRef]
  18. Zhang, Y.; Chen, Z.; Liu, S.; Xu, Y.J. Size effect induced activity enhancement and anti-photocorrosion of reduced graphene oxide/ZnO composites for degradation of organic dyes and reduction of Cr(VI) in water. Appl. Catal. B 2013, 140–141, 598–607. [Google Scholar] [CrossRef]
  19. Mirghani, M.; Al-Mubaiyedh, U.A.; Nasser, M.S.; Shawabkeh, R. Experimental study and modeling of photocatalytic reduction of Pb2+ by WO3/TiO2 nanoparticles. Sep. Purif. Technol. 2015, 14, 285–293. [Google Scholar] [CrossRef]
  20. Sreekantan, S.; Lai, C.W.; Zaki, S.M. The Influence of Lead Concentration on Photocatalytic Reduction of Pb(II) Ions Assisted by Cu-TiO2 Nanotubes. Int. J. Photoenergy 2014, 2014, 839106. [Google Scholar] [CrossRef]
  21. Dozzi, M.V.; Marzorati, S.; Longhi, M.; Coduri, M.; Artiglia, L.; Selli, E. Photocatalytic activity of TiO2–WO3 mixed oxides in relation to electron transfer efficiency. Appl. Catal. B 2016, 186, 157–165. [Google Scholar] [CrossRef]
  22. Dozzi, M.V.; Saccomanni, A.; Selli, E. Cr(VI) photocatalytic reduction: Effects of simultaneous organics oxidation and of gold nanoparticles photodeposition on TiO2. J. Hazard. Mater. 2012, 99, 188–195. [Google Scholar] [CrossRef] [PubMed]
  23. Matamoros-Ambrocio, M.; Ruiz-Peralta, M.; Chigo-Anota, E.; García-Serrano, J.; Pérez-Centeno, A.; Sánchez-Cantú, M.; Rubio-Rosas, E.; Escobedo-Morales, A. A Comparative Study of Gold Impregnation Methods for Obtaining Metal/Semiconductor Nanophotocatalysts: Direct Turkevich, Inverse Turkevich, and Progressive Heating Methods. Catalysts 2018, 8, 161. [Google Scholar] [CrossRef]
  24. Ku, Y.; Jung, I.L. Photocatalytic reduction of Cr(VI) in aqueous solutions by UV irradiation with the presence of titanium dioxide. Water Res. 2001, 35, 135–142. [Google Scholar] [CrossRef]
  25. Colón, G.; Hidalgo, M.C.; NavıO, J.A. Photocatalytic deactivation of commercial TiO2 samples during simultaneous photoreduction of Cr(VI) and photooxidation of salicylic acid. J. Photochem. Photobiol. 2001, 138, 79–85. [Google Scholar] [CrossRef]
  26. Zheng, Z.; Huang, B.; Qin, X.; Zhang, X.; Dai, Y.; Whangbo, M.H. Facile in situ synthesis of visible-light plasmonic photocatalysts M@TiO2 (M = Au, Pt, Ag) and evaluation of their photocatalytic oxidation of benzene to phenol. J. Mater. Chem. 2011, 21, 9079–9087. [Google Scholar] [CrossRef]
  27. Cheng, B.; Le, Y.; Yu, J. Preparation and enhanced photocatalytic activity of Ag@TiO2 core-shell nanocomposite nanowires. J. Hazard. Mater. 2010, 177, 971–977. [Google Scholar] [CrossRef] [PubMed]
  28. Hirakawa, T.; Kamat, P.V. Photoinduced electron storage and surface plasmon modulation in Ag@TiO2 clusters. Langmuir 2004, 20, 5645–5647. [Google Scholar] [CrossRef] [PubMed]
  29. Xiang, Q.; Yu, J.; Cheng, P.; Ong, H.C. Microwave-Hydrothermal Preparation and Visible-Light Photoactivity of Plasmonic Photocatalyst Ag-TiO2 Nanocomposite Hollow Spheres. Chem. Asian J. 2010, 5, 1466–1474. [Google Scholar] [CrossRef] [PubMed]
  30. Zhang, H.; Chen, G. Potent antibacterial activities of Ag/TiO2 nanocomposite powders synthesized by a one-pot sol-gel method. Environ. Sci. Technol. 2009, 43, 2905–2910. [Google Scholar] [CrossRef] [PubMed]
  31. Wang, Y.; Chao, Y.; Lei, C.; Zhang, Y.; Yang, J. Controllable Charge Transfer in Ag-TiO2 Composite Structure for SERS Application. Nanomaterials 2017, 7, 159. [Google Scholar] [CrossRef] [PubMed]
  32. Guin, D.; Manorama, S.V.; Latha, J.N.L.; Singh, S. Photoreduction of Silver on Bare and Colloidal TiO2 Nanoparticles/Nanotubes: Synthesis, Characterization, and Tested for Antibacterial Outcome. J. Phys. Chem. C 2007, 111, 13393–13397. [Google Scholar] [CrossRef]
  33. Behnajady, M.A.; Modirshahla, N.; Shokri, M.; Rad, B. Enhancement of photocatalytic activity of TiO2 nanoparticles by Silver doping: Photodeposition versus liquid impregnation methods. Glob. NEST J. 2007, 10, 1–7. [Google Scholar]
  34. Liu, L.; Liu, Z.; Bai, H.; Sun, D.D. Concurrent filtration and solar photocatalytic disinfection/degradation using high-performance Ag/TiO2 nanofiber membrane. Water Res. 2012, 46, 1101–1112. [Google Scholar] [CrossRef] [PubMed]
  35. Pu, S.Y.; Hui, M.; Zinchenko, A.; Wei, C. Novel highly porous magnetic hydrogel beads composed of chitosan and sodium citrate: An effective adsorbent for the removal of heavy metals from aqueous solutions. Environ. Sci. Pollut. Res. 2017, 24, 1–11. [Google Scholar] [CrossRef] [PubMed]
  36. Deng, Z.; Ning, J.; Su, Z.; Xu, S.; Xing, Z.; Wang, R.; Lu, S.; Dong, J.; Zhang, B.; Yang, H. Structural Dependences of Localization and Recombination of Photogenerated Carriers in the top GaInP Subcells of GaInP/GaAs Double-Junction Tandem Solar Cells. ACS Appl. Mater. Interfaces 2015, 7, 690–695. [Google Scholar] [CrossRef] [PubMed]
  37. Yang, C.K.; Wang, S.F.; Tsai, H.Y.; Lin, S.Y. Intrinsic photocatalytic oxidation of the dye adsorbed on TiO2 photocatalysts by diffuse reflectance infrared Fourier transform spectroscopy. Appl. Catal. B 2001, 30, 293–301. [Google Scholar] [CrossRef]
  38. Davis, R.J.; Gainer, J.L.; O’Neal, G.; Wu, I.W. Photocatalytic Decolorization of Wastewater Dyes. Water Environ. Res. 1994, 66, 50–53. [Google Scholar] [CrossRef]
  39. Pu, S.; Wang, M.; Wang, K.; Hou, Y.; Yu, J.; Shi, Q.; Pei, X.; Chu, W. Preparation of CS-Fe@Fe3O4 nanocomposite as an efficient and recyclable adsorbent for azo dyes removal. Desalin. Water Treat. 2018, 95, 319–332. [Google Scholar] [CrossRef]
  40. Li, Y.; Bian, Y.; Qin, H.; Zhang, Y.; Bian, Z. Photocatalytic reduction behavior of hexavalent chromium on hydroxyl modified titanium dioxide. Appl. Catal. B 2017, 206, 293–299. [Google Scholar] [CrossRef]
  41. Lei, X.F.; Xue, X.X.; Yang, H. Preparation and characterization of Ag-doped TiO2 nanomaterials and their photocatalytic reduction of Cr(VI) under visible light. Appl. Surf. Sci. 2014, 321, 396–403. [Google Scholar] [CrossRef]
  42. Aguado, M.A.; GimãNez, J.; Cervera-March, S. Continuous photocatalytic treatment of Cr(VI) effluents with semiconductor powders. Chem. Eng. Commun. 1991, 104, 71–85. [Google Scholar] [CrossRef]
Figure 1. Schematic illustration of (a) synthesis of ultra-trace silver doped TiO2 composites via ultrasonic impregnation assisted deposition through an in situ UV-assisted photoreduction strategy; (b) photoreduction of highly toxic Cr(VI) to nontoxic Cr(III) by resultant Ag@TiO2 photocatalysts under UV irradiation.
Catalysts 08 00251 g001
Figure 2. (a) TEM image of Ag@TiO2 (0.06 wt %, 30 min radiation) and NPs size distribution graphic (obtained by counting 114 Ag@TiO2 particles); (b) HRTEM images of the prepared Ag@TiO2 composites, d001 = 0.235 nm, d101 = 0.35 nm.
Catalysts 08 00251 g002
Figure 3. (a) XRD patterns of the Ag@TiO2 photocatalysts, in which A is anatase phase and R is rutile phase (no obvious Ag characteristic peak was found due to the ultra-trace loaded amount); (b) UV-vis diffuse spectra of Ag@TiO2 in different doping ratio (dried sample images with different Ag loadings, insert).
Catalysts 08 00251 g003
Figure 4. (a) Photocatalytic reduction efficiency by pure TiO2 and Ag@TiO2 composites with various Ag loading ratio (effect of different loading on adsorption balance before irradiation, insert); (b) UV-vis full wave band scanning of Cr(VI) under different irradiation times (the color change of Cr(VI) simples with different reduction time, insert); (c) Effect of different initial pH on Cr(VI) reduction rate; (d) The contribution of adsorption and photoreduction in Cr(VI) removal with different initial pH value using bare TiO2 and Ag@TiO2. (Both (b,c,d) using the simple with 0.06 wt % Ag addition. The experimental conditions were [Cat] = 1 g/L, [Cr(VI)]0 = 10 mg/L, 300 W and 60 min irradiation.
Catalysts 08 00251 g004
Figure 5. (a) Photocatalytic redaction of Cr(VI) by Ag@TiO2 composites of various dosages (the blank sample catalytic system showed that no obvious Cr(VI) degradation could be observed under UV irradiation); (b) Effect of illumination on Cr(VI) reduction; (c) Removal rate of co-existing cations on Cr(VI) reduction efficiency (metal salts:, NaCl, KCl, MgCl2, CaCl2; (d) Removal rate of co-existing anions on Cr(VI) reduction efficiency (metal salts: NaCl, Na2SO4, NaNO3); Both (ad) using the Ag@TiO2 with 0.06 wt %. The experimental conditions were [Cr(VI)]0 = 10 mg/L, initial pH = 5.
Catalysts 08 00251 g005
Figure 6. (a) The reusability of synthetic catalysts by 5 recycle on Cr(VI) removal (using the Ag@TiO2 with 0.06 wt %); (b) High resolution XPS of Cr on the surface of Ag@TiO2 catalyst. The experimental conditions were [Cr(VI)]0 = 10 mg/L).
Catalysts 08 00251 g006
Figure 7. The study of kinetics at different Ag loadings (a) and pH values (b).
Catalysts 08 00251 g007
Figure 8. (a) EPR spectra in activation of the as prepared Ag@TiO2 (0.06 wt %) and pure TiO2 powder; (b) EPR difference spectrum between dark and UV-light of TiO2 and Ag@TiO2; (c) EPR spectra of radical adducts trapped by DMPO in TiO2 and Ag@TiO2 dispersions under UV light irradiation: DMPO-O2•− formed in irradiated methanol dispersions; (d) DMPO-OH formed in irradiated aqueous dispersions. Reaction conditions: [Ag@TiO2] = 1 mg/mL, [TiO2] = 1 mg/mL, [DMPO] = 100 mM, [Illumination time] = 5 min.
Catalysts 08 00251 g008
Figure 9. The survey spectrum (a); Ti 2p (b), O 1s (c), and Ag 3d (d) XPS spectra of the Ag@TiO2 composites (0.6 wt %, 30 min irradiation).
Catalysts 08 00251 g009
Figure 10. Mechanism of Cr(VI) photoreduction by ultra-trace Ag enhanced TiO2 composites. 3. Materials and Methods.
Catalysts 08 00251 g010
Table 1. ICP-AES date of Ag@TiO2.
Mass/gVolume/mLDilution FactorElementReadings mg/LConversion mg/kgAg/TiO2 wt %
0.0164501Ag0.1778542.030.0648
50Ti3.2883501260.67
Table 2. The relevant parameters obtained from kinetic study.
Kinetics Equationkap (min−1)r0 (mg/L·min)R2
0.01 wt %ln (Ct/C0) = 0.0377t − 0.05490.03770.37700.9947
0.03 wt %ln(Ct/C0) = 0.0470t − 0.10460.04700.47000.9954
0.06 wt %ln(Ct/C0) = 0.0534t − 0.15720.05340.53400.9966
0.1 wt %ln(Ct/C0) = 0.0497t − 0.11490.04970.49700.9895
0.3 wt %ln(Ct/C0) = 0.0525t − 0.11830.05250.52500.9963
0.6 wt %ln(Ct/C0) = 0.0304t − 0.22330.03040.30400.9731
1 wt %ln(Ct/C0) = 0.0281t − 0.23560.02810.28100.9858
3 wt %ln(Ct/C0) = 0.0211t − 0.11370.02110.21100.9909
Bareln(Ct/C0) = 0.0209t − 0.05620.02090.20900.9937
pH = 3ln(Ct/C0) = 0.0786t − 0.10700.07860.78600.9954
pH = 4ln(Ct/C0) = 0.615t − 0.13470.06150.61500.9989
pH = 5ln(Ct/C0) = 0.0552t − 0.06520.05520.55200.9920
pH = 7ln(Ct/C0) = 0.0131t − 0.15230.01310.13100.9213
pH = 9ln(Ct/C0) = 0.0086t − 0.11510.00860.08600.9039
pH = 11ln(Ct/C0) = − 0.02220.00010.00100.5126
Na+ln(Ct/C0) = 0.0189t − 0.05600.01890.18900.9948
K+ln(Ct/C0) = 0.0175t − 0.08360.01750.17500.9881
Ca2+ln(Ct/C0) = 0.0202t − 0.06070.02020.20200.9915
Mg2+ln(Ct/C0) = 0.0209t − 0.08900.02090.20900.9895
SO42−ln(Ct/C0) = 0.0234t − 0.15600.02340.23400.9808
NO3ln(Ct/C0) = 0.0320t − 0.17580.03200.32020.9843
Clln(Ct/C0) = 0.0190t − 0.06000.01900.19000.9948

