Study of Extraction and Enzymatic Properties of Cell-Envelope Proteinases from a Novel Wild Lactobacillus plantarum LP69


1
School of Food and Biological Engineering, Shaanxi University of Science and Technology, Xi’an 710021, China
2
College of Animal Science and Technology, Northwest A&F University, Yangling 712100, China
3
College of Food Engineering and Nutritional Science, Shaanxi Normal University, Xi’an 710119, China
*
Authors to whom correspondence should be addressed.
Catalysts 2018, 8(8), 325; https://doi.org/10.3390/catal8080325
Submission received: 17 July 2018
/
Revised: 5 August 2018
/
Accepted: 7 August 2018
/
Published: 8 August 2018
(This article belongs to the Special Issue Biocatalysts: Design and Application)
Abstract
:Lactobacilli cell-envelope proteinases (CEPs) have been widely used in the development of new streams of blockbuster nutraceuticals because of numerous biopharmaceutical potentials; thus, the development of viable methods for CEP extraction and the improvement of extraction efficiency will promote their full-scale application. In this study, CEP from a novel wild Lactobacillus plantarum LP69 was released from cells by incubating in calcium-free buffer. The extraction conditions of CEP were optimized by response surface methodology with the enzyme activity and specific activity as the detective marker. The optimal extraction conditions were: time of 80 min, temperature of 39 °C and buffer pH of 6.5. Under these conditions, enzyme activity and specific activity were (23.94 ± 0.86) U/mL and (1.37 ± 0.03) U/mg, respectively, which were well matched with the predicted values (22.12 U/mL and 1.36 U/mg). Optimal activity of the crude CEP occurred at pH 8.0 and 40 °C. It is a metallopeptidase, activated by Ca2+, inhibited by Zn2+ and ethylene-diamine-tetra-acetic acid, and a serine proteinase which is inhibited by phenylmethylsulfonyl fluoride. Kinetic studies showed that CEP from LP69 could hydrolyze whey protein, lactoglobulin and casein. Our study improves the extraction efficiency of CEPs from LP69, providing the reference for their industrial development.
1. Introduction
Lactic acid bacteria (LAB) have proteolytic systems which consist of a cell-envelope proteinase (CEP) and a host of intracellular peptidases such as endopeptidases, aminopeptidases, tripeptidases and dipeptidases [1]. The proteolytic system can hydrolyze proteins and subsequently release different sizes of peptides and some free amino acids to meet the needs of bacterial growth. The peptides produced by hydrolysis exhibit various biological activities, such as antioxidative, antimicrobial, antihypertensive, immunomodulatory and cytomodulatory effects [2]. The CEP, anchored at the LAB surface, is an important enzyme in the proteolytic system, since it is responsible for the initial stage in the hydrolysis of milk proteins which is beneficial to the development of texture and sensory characteristics of fermented dairy products. Moreover, CEPs may also cause the release of bioactive peptides from food proteins which can contribute to health improvement beyond basic nutrition [3].
CEPs have many biotechnological potentials. The development of efficient and commercially feasible methods for CEP extraction and the optimization of the extraction conditions, including pH, conductivity and temperature are therefore essential. Several methods have been confirmed for releasing CEPs from lactobacilli [4,5,6]. The most commonly used approach of extracting CEPs from lactobacilli is by washing the cells with a calcium-free buffer [4,7]. However, this method could not release CEP from some lactobacilli species [8,9,10]. Other methods have also been used to extract cell-surface-associated proteins, such as the use of muramidases, lithium chloride, guanidine hydrochloride, glycine, and urea. A study found that the presence of urea led to many cell surface proteins released from Lactobacillus rhamnosus [6]. Bhowmik et al. [11] also observed that guanidine hydrochloride solution was the most effective extraction agent on Lactobacillus acidophilus, since it could release abundant cell surface proteins. The proteinases from Lactobacillus delbrueckii subsp. bulgaricus CNRZ 397 were released by the use of lysozyme/mutanolysin treatment with cold temperature shock [12]. Agyei [13] found that some extraction methods did not extract CEPs from certain lactobacillis, which depend on the differences in the localization of CEPs on the bacterial cell-envelope. Therefore, the method for the release of CEP is dependent on the species and/or strain, and no single method is suitable for all lactobacilli.
In the past few decades, the proteolytic systems of Lactococcus have been widely studied, especially regarding biochemical and genetic aspects. Unlike the lactococcal proteolytic system, limited information is available on the proteolytic activity of lactobacilli [3,14]. Among the lactobacilli, the proteinase system of Lactobacillus casei has been extensively studied [4,15]. Properties of partly purified Lactobacillus CEP have been reported for L. delbrueckii subsp. bulgaricus [16], Lactobacillus sanfrancisco CB1 [17], Lactobacillus helveticus [14] and L. delbrueckii subsp. lactis [3]. A previous study identified the sub-cellular location of CEPs from L. delbrueckii subsp. lactis 313 and compared that the influence of different extraction methods on enzyme activity of CEPs from L. delbrueckii subsp. lactis 313 [13]. Besides, another study found that the CEPs from L. helveticus CRL 1062 was existed in the cell membrane fraction and obtained the maximum activity at pH 6.5–7.0 and 42 °C [14]. However, to date, the proteinase system of Lactobacillus plantarum has been less described.
L. plantarum is a commercially typical probiotic, which contributes to flavor development during the fermentation process. It could be helpful for improving the digestion of dairy products by lactose-intolerant patients [18]. However, relatively little is known about the biochemical and research data of L. plantarum LP69 in the dairy industry, and L. plantarum LP69 remains an understudied species. In previous studies, we have found that the goat milk fermented by L. plantarum LP69 exhibited strong ACE-inhibitory activity and antioxidant activity [19,20]. We further studied the proteolytic system of CEP from LP69 and found that hydrolysates of goat milk catalyzed by CEP have strong ACE-inhibitory activity and antioxidant activity, which showed that CEPs of L. plantarum could hydrolyze goat milk and subsequently release bioactive peptides [18]. The scope of technological and industrial applications of CEPs from LP69 is therefore expansible, but these prospects largely depend on the extraction efficiency of CEP. Thus, the purpose of this study was to optimize the extraction conditions of CEP from L. Plantarum LP69 by response surface methodology (RSM) and further study the enzymatic properties of the crude CEP from LP69.
2. Results
2.1. Optimization of Extraction Conditions of CEP by RSM
2.1.1. Box–Behnken Design and Response Surface Method
The enzyme activity (U/mL) and specific activity (U/mg) is represented by Y1 and Y2, respectively. The results of the Box–Behnken design for extracting conditions of CEP from L. plantarum LP69 are shown in Table 1. Response results of enzyme activity and specific activity are shown in Table 2.
Equations (1) and (2) show the effect of time, temperature and buffer pH on enzyme activity and specific activity, respectively. The parameters of the equation are obtained by multiple regression analysis of the experimental data. The following quadratic model explains the experimental data:
where Y is the predicted response in actual value; X1 is the uncoded value of variable time; X2 is the uncoded value of variable temperature; X3 is the uncoded value of variable buffer pH.
As shown in Table 2, the model for enzyme activity of CEP from L. plantarum LP69 is significant (p = 0.0084; <0.05). The p-value of the lack of fit is more than 0.05, which is not significant. Therefore, the model equation is confirmed to be a suitable model to describe the influence of three variables on enzyme activity. The value of determination coefficient (R2 = 95.19%) showed that only 4.81% of the variability in enzyme activity could not be explained by the model Equation (1). The R2adj value of 0.8652 close to the R2 value showed the significance of the model, suggesting a good relationship between the predicted value and the actual value of enzyme activity.
The high significance for regression equation (p = 0.0014; <0.05) and insignificance for the lack of fit (p = 0.7506; >0.05) reveal the effectiveness of regression analysis, which suggest that the influence of three factors on specific activity could be fitted by the regression model. The model Equation (2) explains 97.69% of the variation in the specific activity according to the value of determination coefficient (R2 = 0.9769). The R2adj value of 0.9352 close to the R2 value reveals the significance of the model, indicating a good relationship between the predicted value and the actual value of specific activity.
2.1.2. The Influence of Time, Temperature and Buffer pH on the Response Value
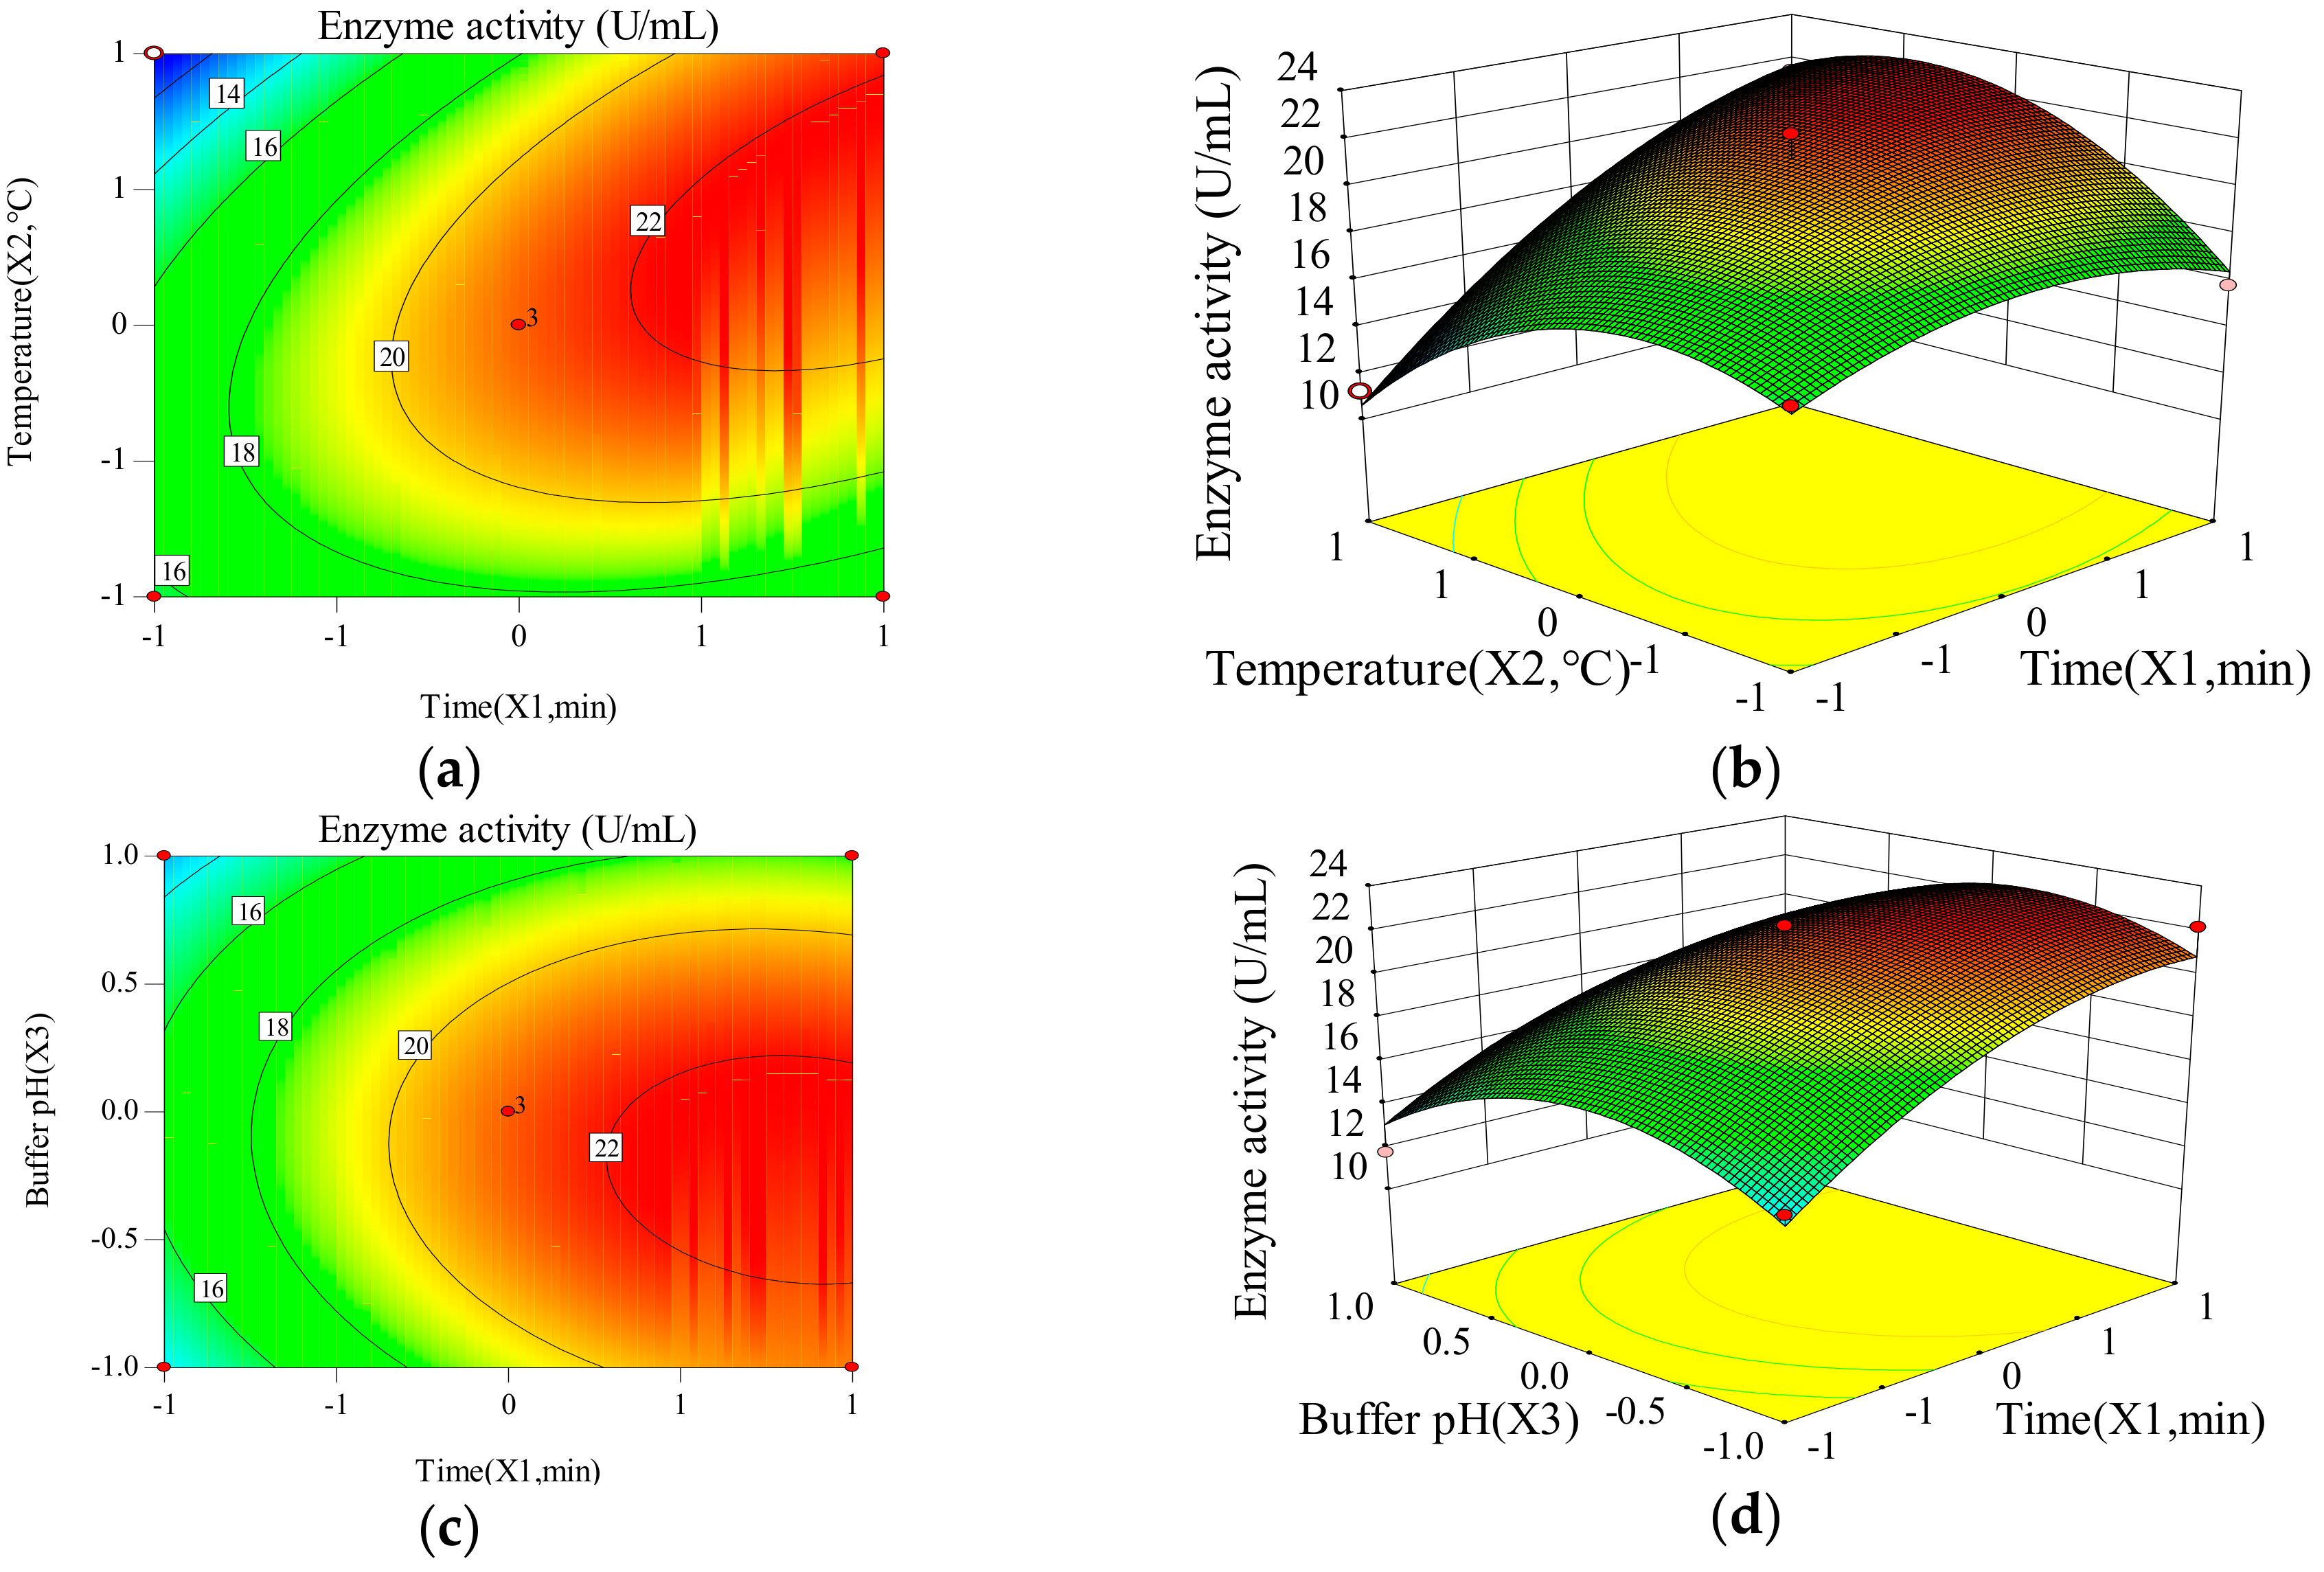
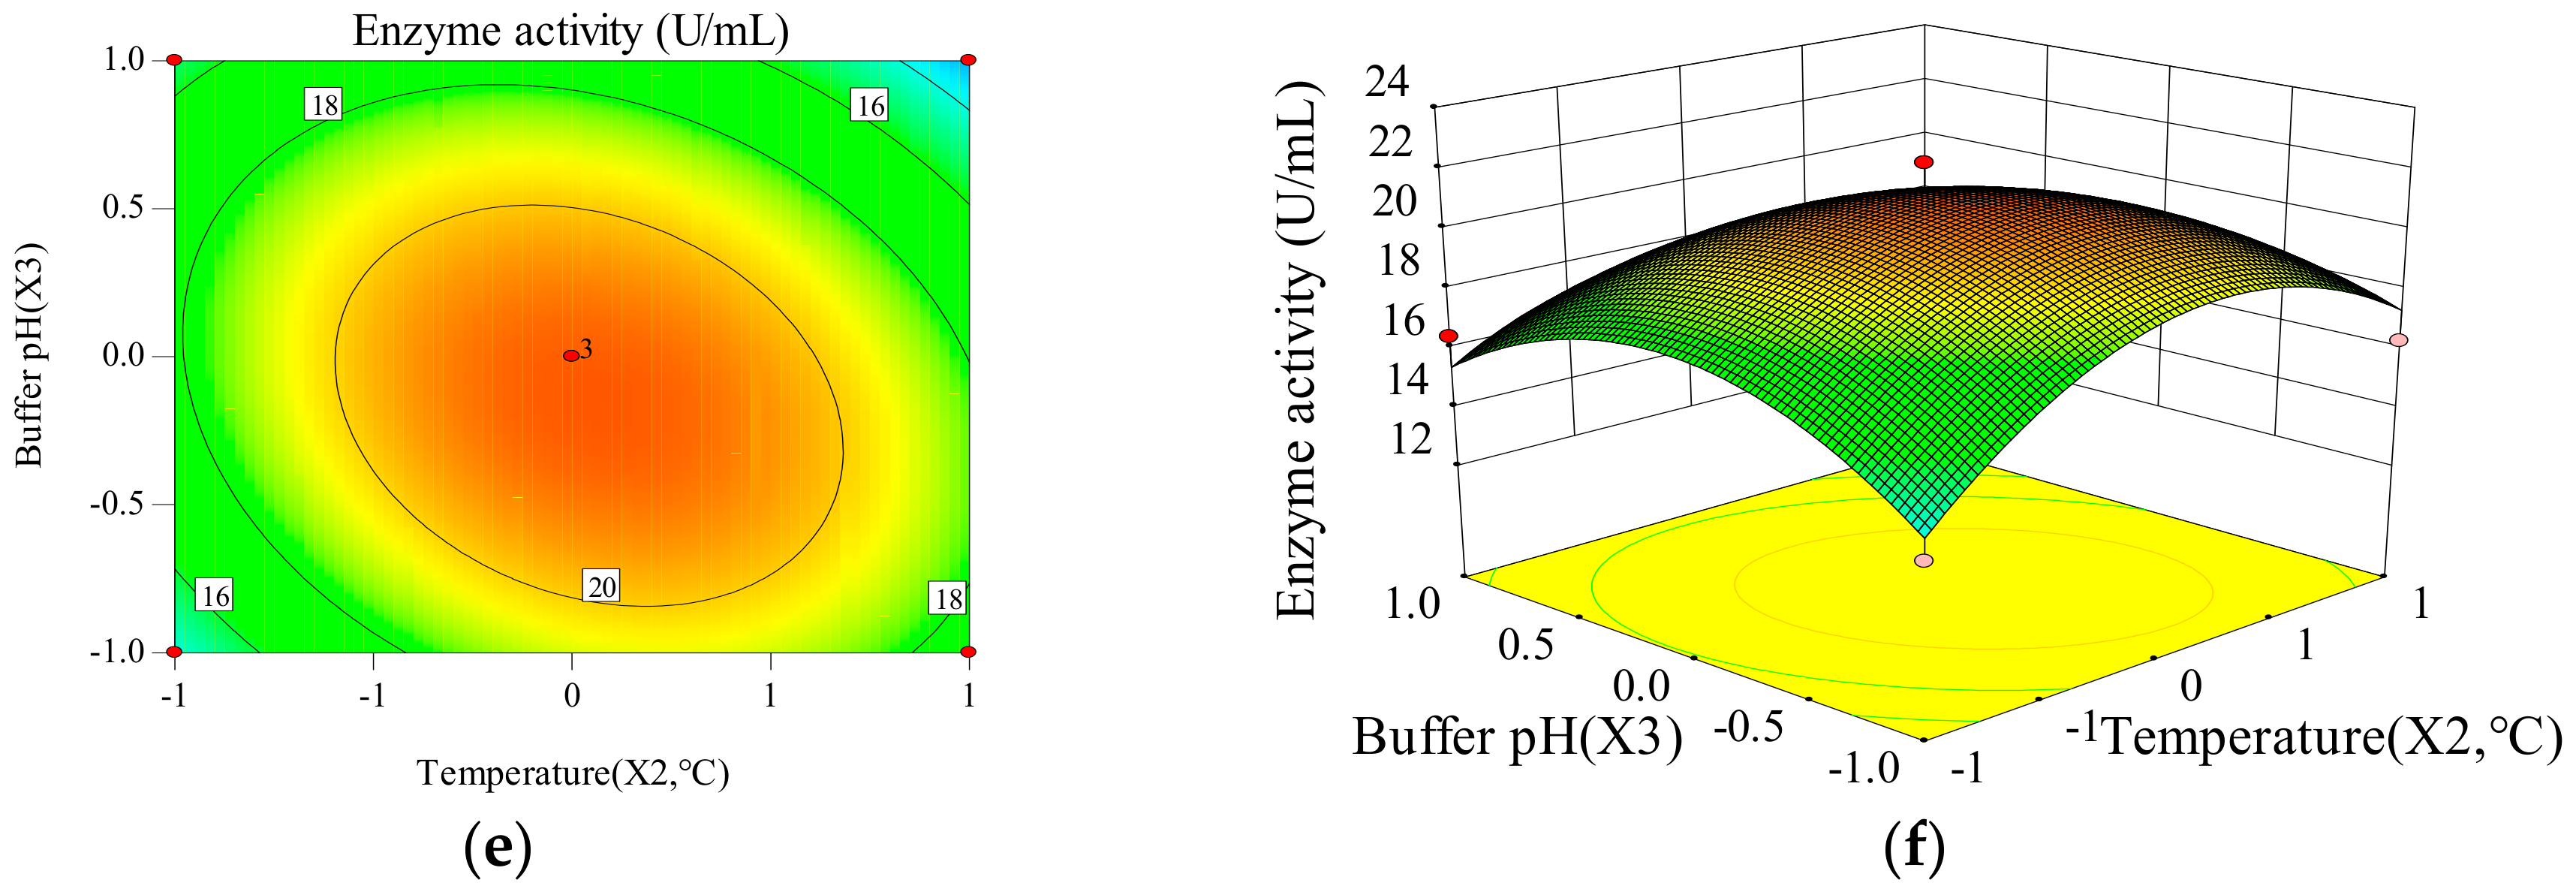
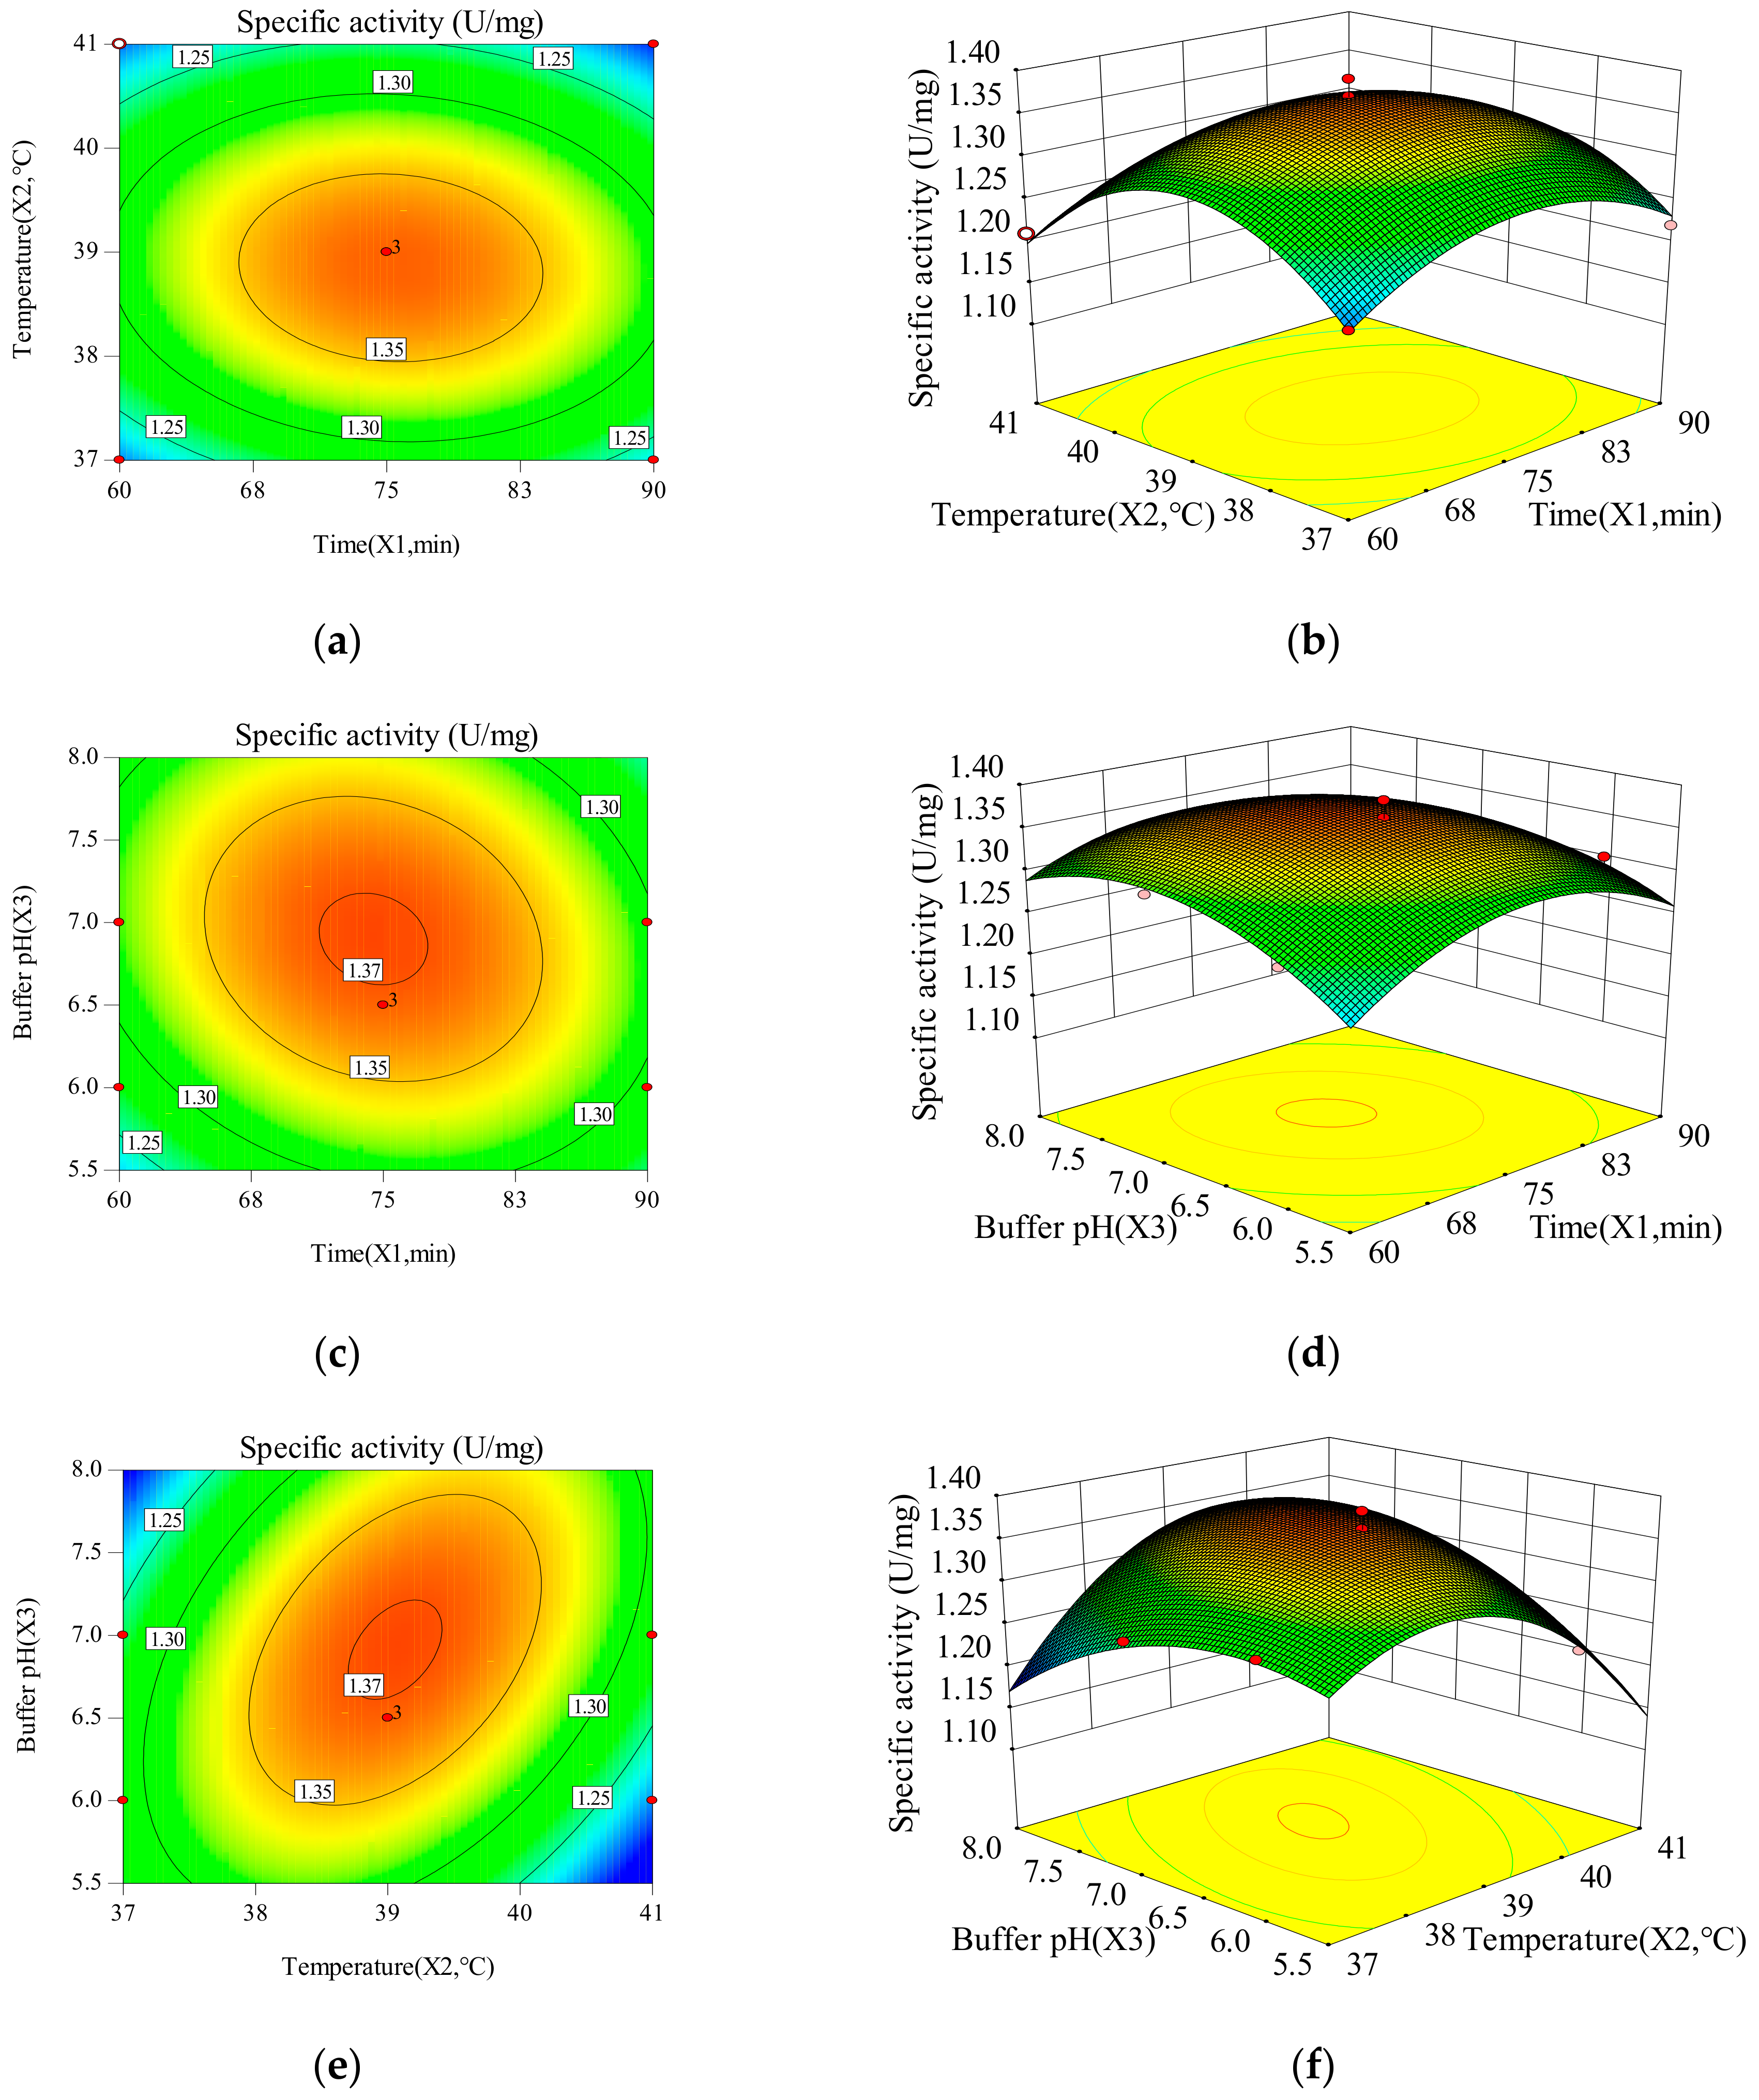
Two-dimensional contours reveal that enzyme activity and specific activity of CEP change with the changes of time, temperature and buffer pH. The three-dimensional response surface is used to illustrate the interaction of the three variables and determine the optimal experimental conditions (Figure 1 and Figure 2). X1X2, X1X3, and X2X3 have mutual interactions for the enzyme activity, since the contour plots seems to be elliptical or nearly circular (Figure 1). X1, X22 and X32 have a significant impact (p < 0.05) on the enzyme activity of CEP, revealing that there is not a simple linear relationship between the variables and enzyme activity. The p-value of X1X2 is smaller than 0.05, which represents a significant interaction between time and temperature. X1X2, X1X3, and X2X3 have mutual interactions for the specific activity, because of their elliptical or nearly circular contour plots (Figure 2). The p-value of X2X3 is smaller than 0.05, which represents a significant interaction between temperature and buffer pH. Thus, the influence of one variable on specific activity depends on the level of another. The quadratic main effects of time and temperature are significant (pX12 = 0.0007; <0.05, pX22 < 0.0001), suggesting that there is not a simple linear relationship between the variables and specific activity.
2.1.3. Model Validation
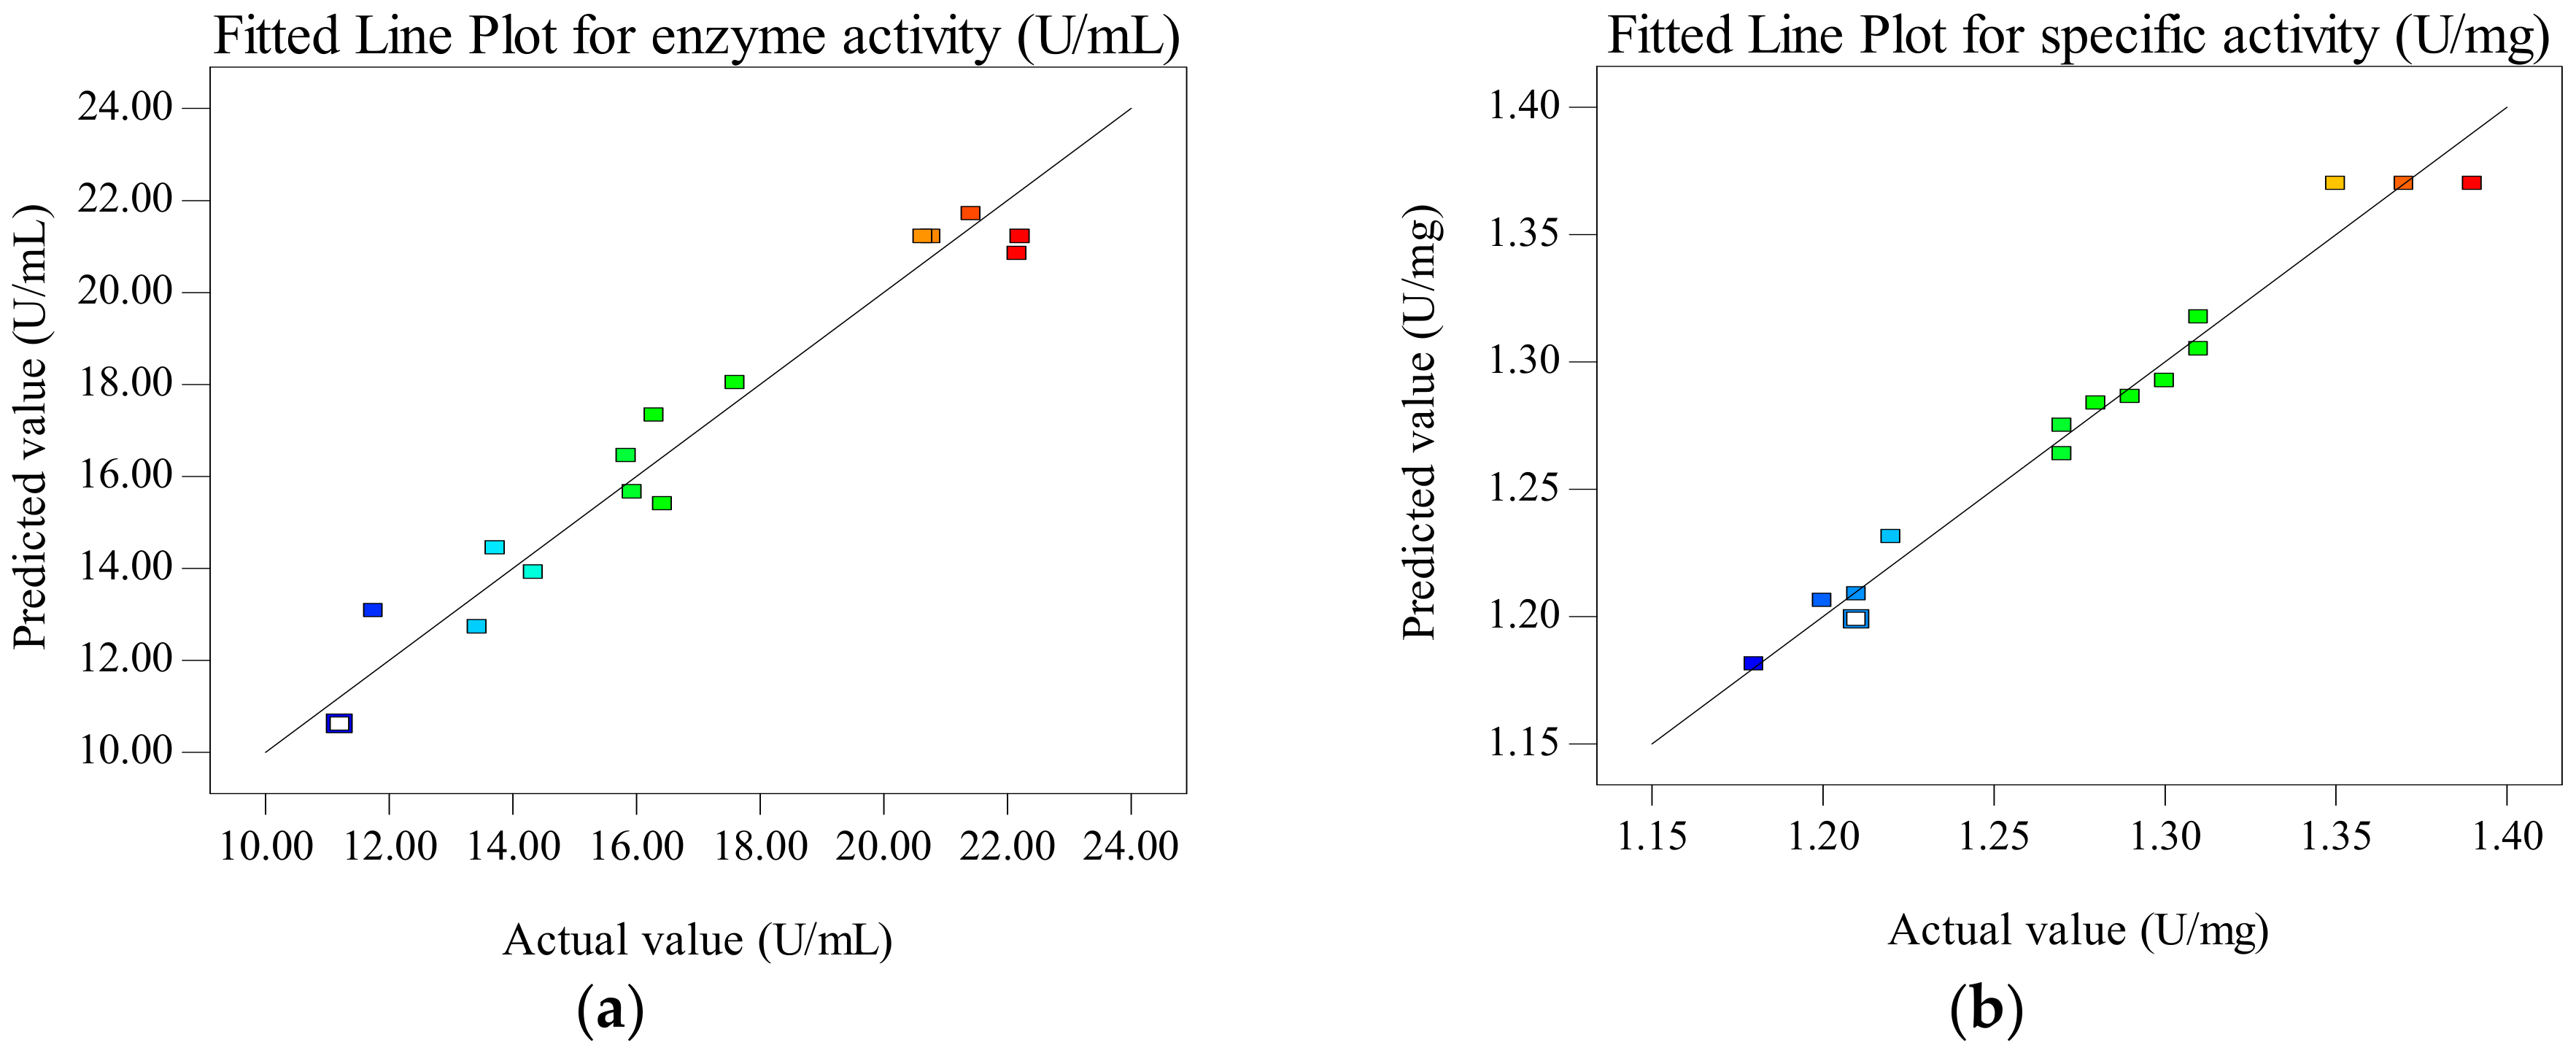
The comparison between the actual value and the predicted value is used to reflect the accuracy of the response surface equations [21]. Figure 3a,b shows the overall closeness of these variables, thus suggesting that the response surface model can be used to predict the effect of extraction parameters on enzyme activity and specific activity of CEP. The maximum response values of enzyme activity (22.12 U/mL) and specific activity (1.36 U/mg) of CEP from LP69 are obtained at a time of 80 min, temperature of 39 °C and buffer pH of 6.5 as the predicted values, respectively. The verification experiment is carried out according to the optimization results (time: 80 min, temperature: 39 °C, buffer pH: 6.5). The results show that the mean value of enzyme activity and specific activity of CEP from LP69 were (23.94 ± 0.86) U/mL and (1.37 ± 0.03) U/mg by testing in triplicate, which is almost consistent with the predicted values. The control has values of CEP enzyme activity as 20.64 U/mL and specific activity as 1.19 U/mg without optimizing extraction conditions. The enzyme activity and specific activity are improved by 15.99% and 15.13% using RSM optimization compared to the control.
2.2. Enzymatic Properties of CEP
2.2.1. Effects of pH and Temperature on Enzyme Activity
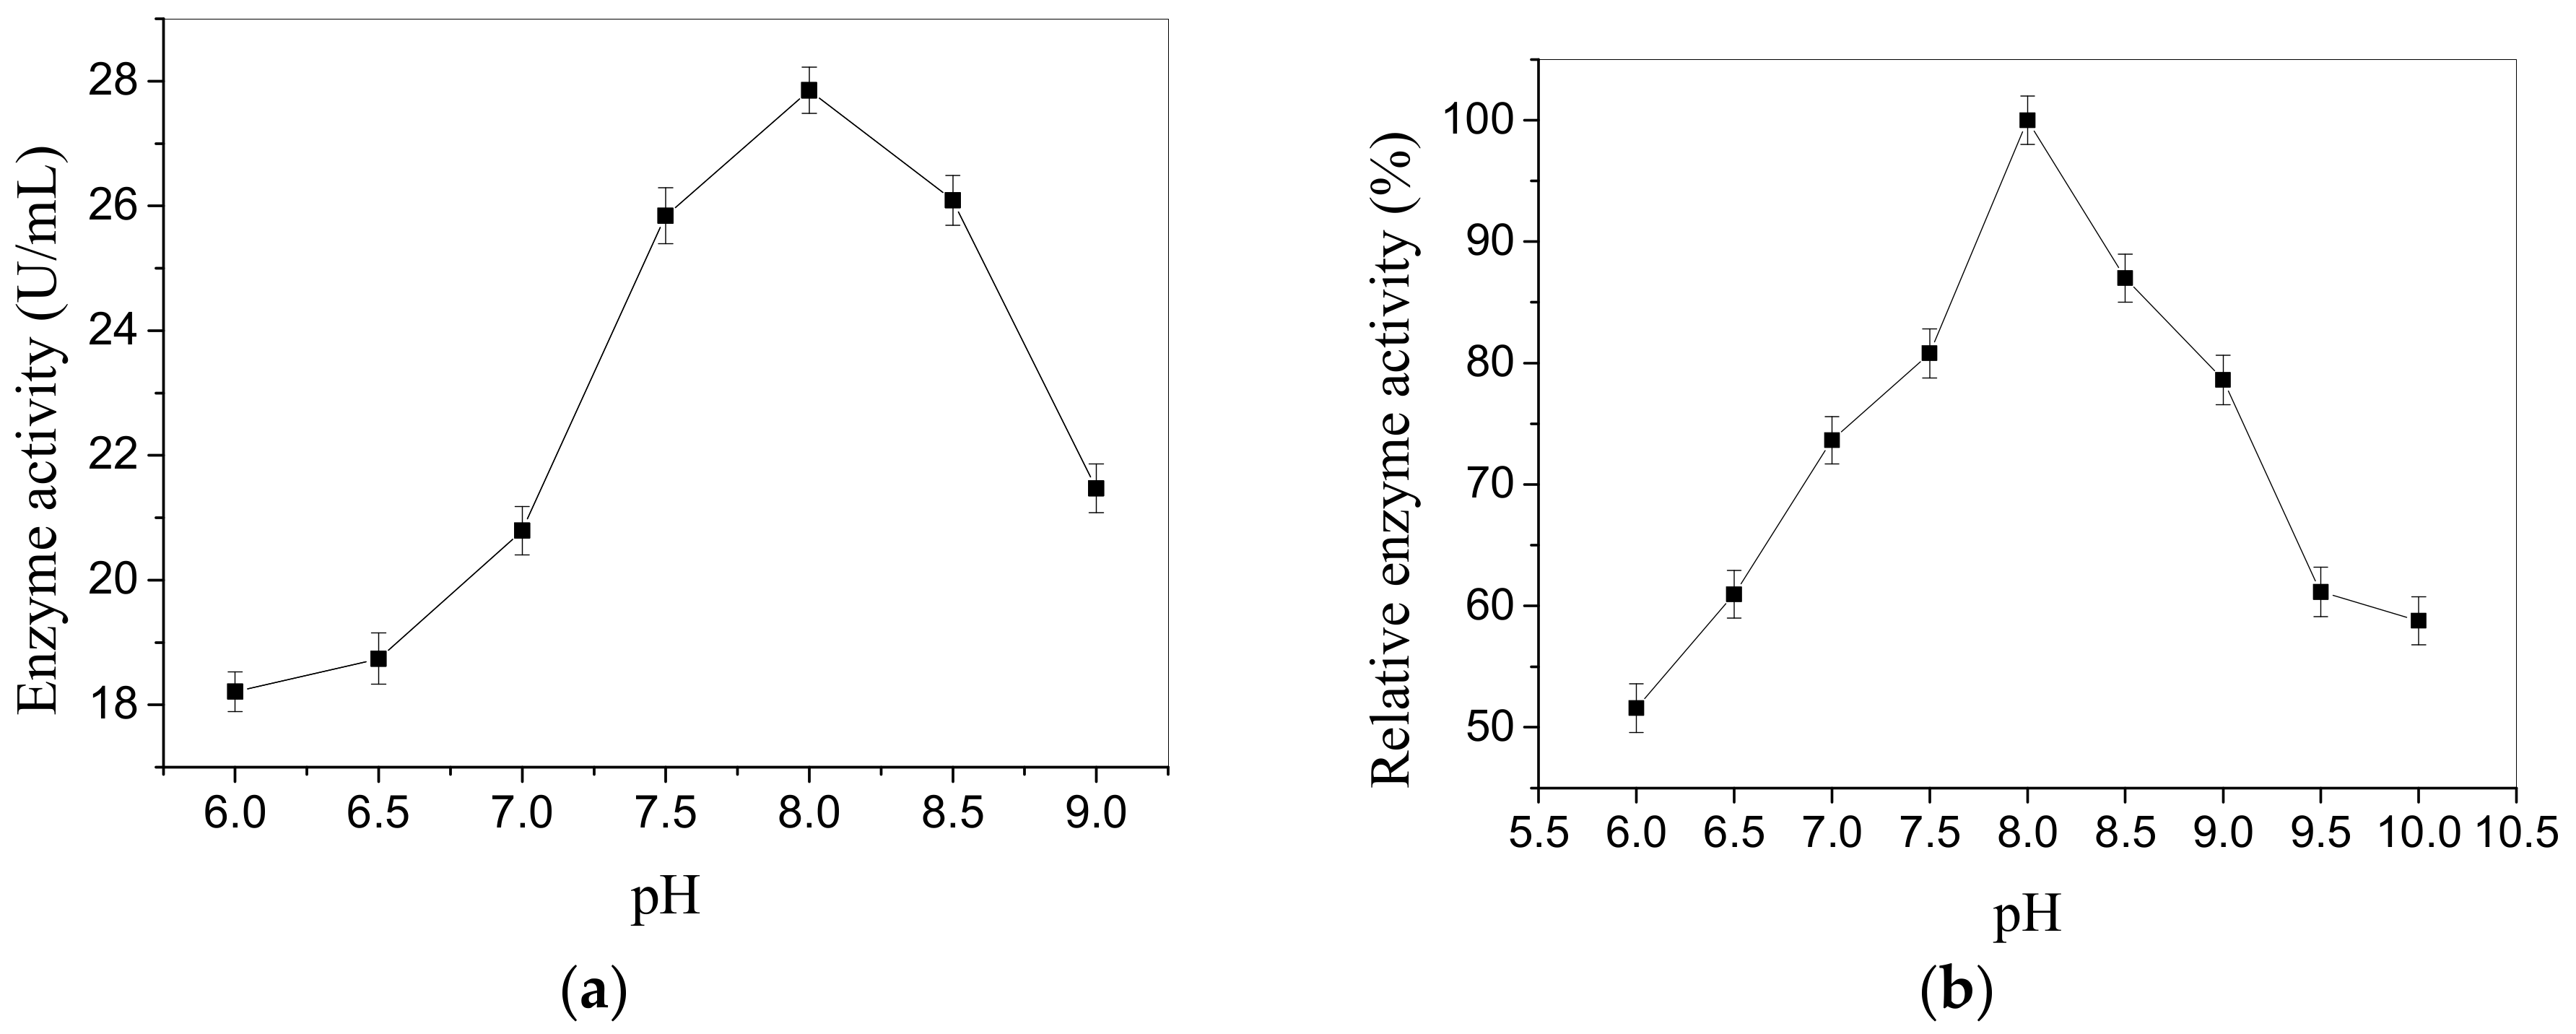
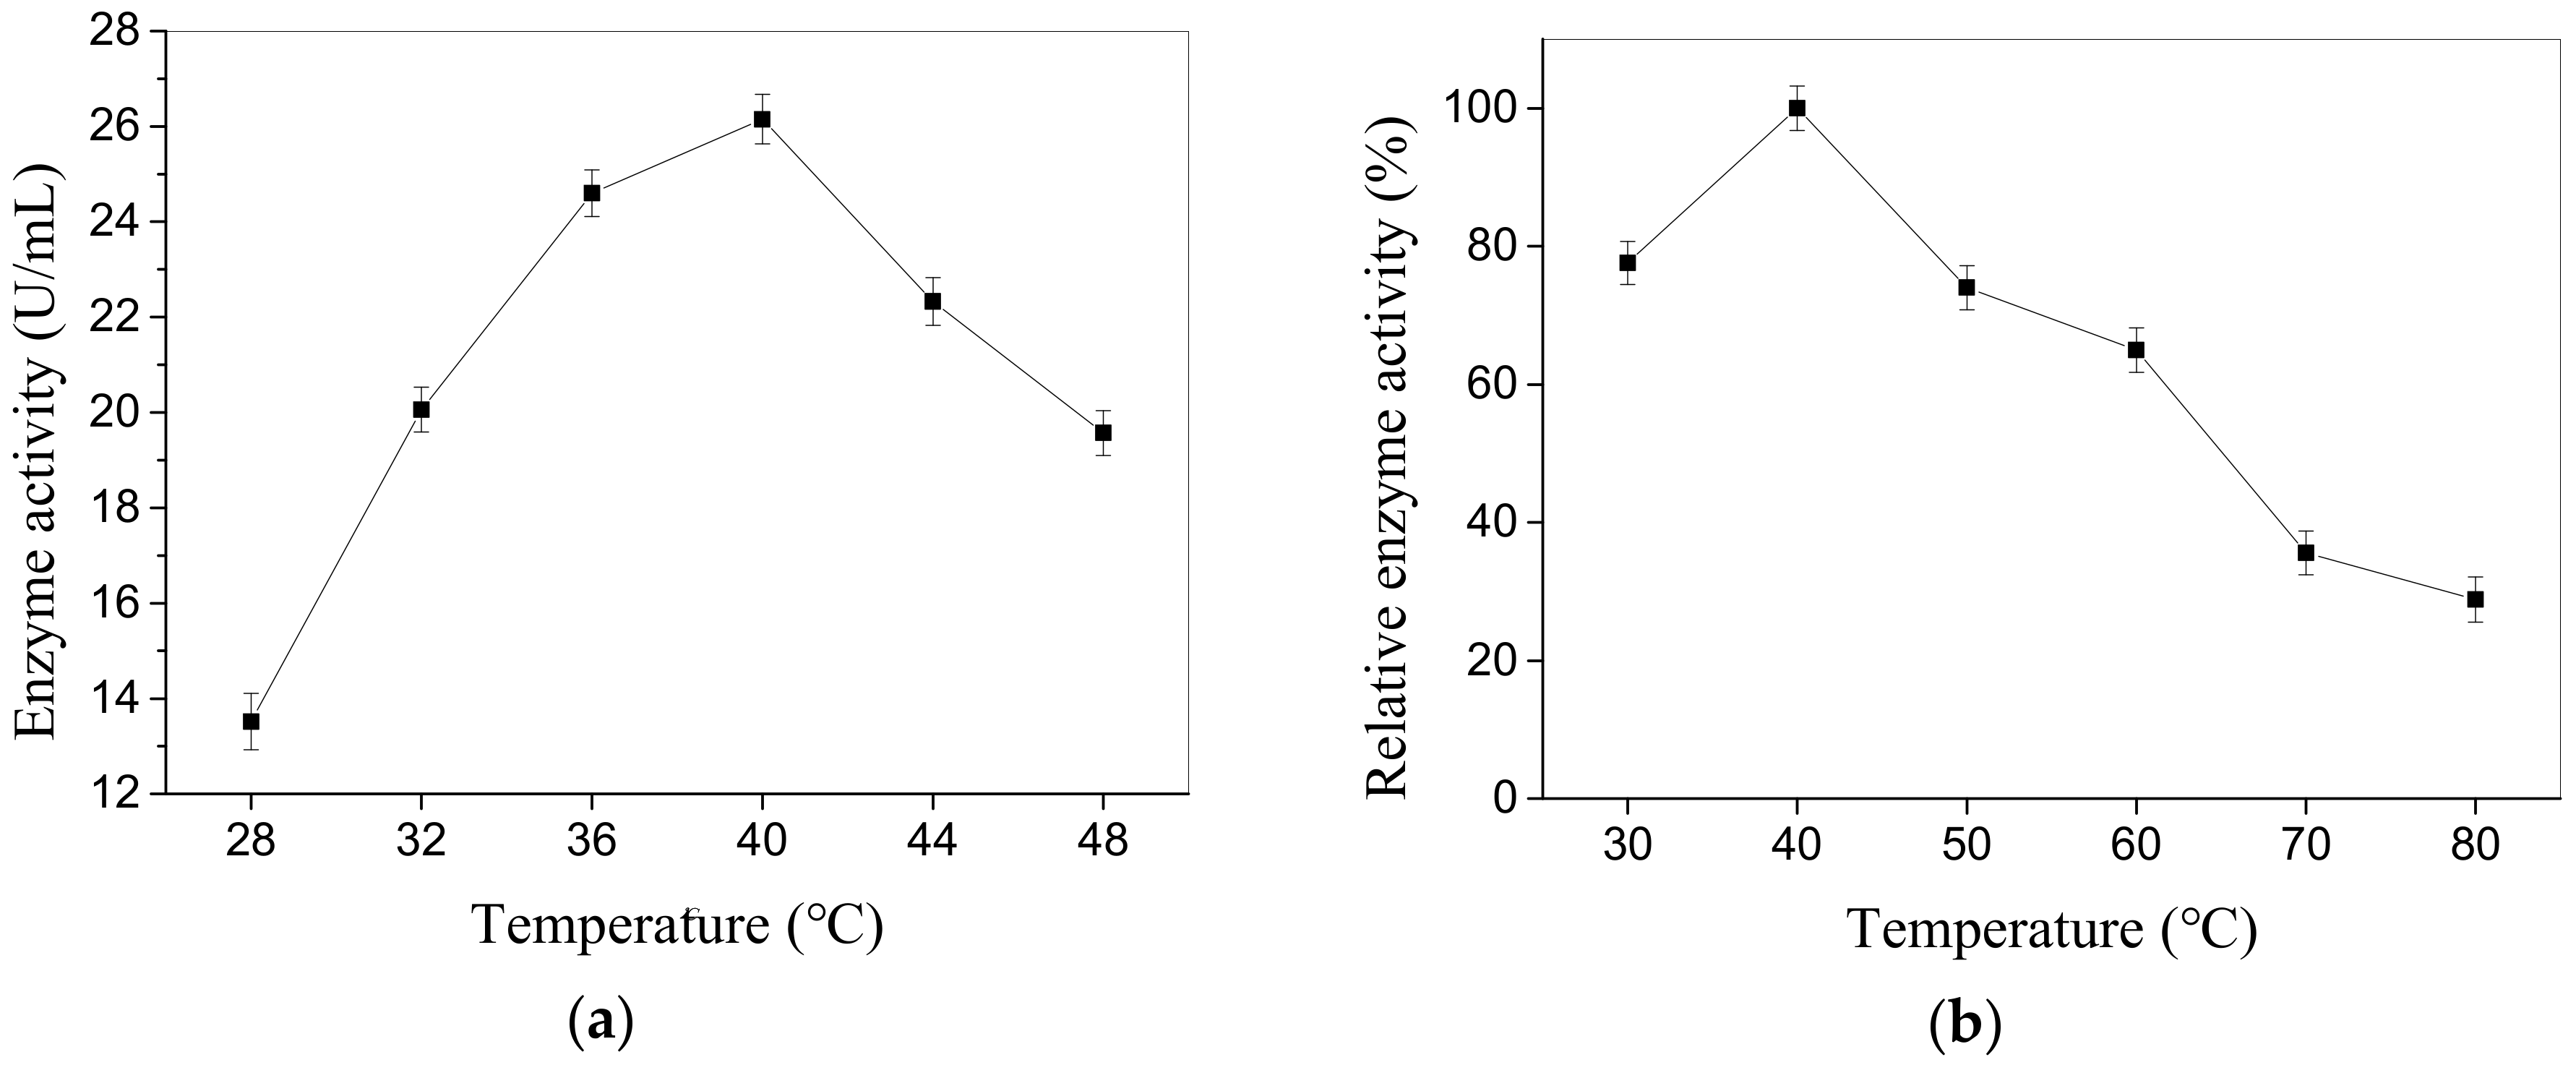
The enzymatic properties of CEP from L. plantarum LP69 are studied. The results from Figure 4a indicate that the maximum activity of 27.85 U/mL is obtained at pH 8.0 and the relative enzyme activity reaches 100%. It maintains 93% of the maximum activity in the range of pH 7.5–8.5. Figure 4b shows that less than 60% of the relative enzyme activity is assayed at pH 6.0 or 10.0 when incubated for 30 min, but more than 70% of the relative enzyme activity is observed in the range of pH 7.0–9.0. Thus, the enzyme exhibits good stablity when incubated for 30 min in the pH range 7.0–9.0. Moreover, it has high activity at temperatures ranging from 36 to 44 °C. The CEP has a maximum activity (26.15 U/mL) at 40 °C and its relative enzyme activity reaches 100% (Figure 5a). The relative enzyme activity of CEP is still 28.84% in 80 °C for 30 min (Figure 5b), which indicates that the enzyme has a good anti-heat ability.
2.2.2. Effect of Metal Ions and Inhibitors on Enzyme Activity
The effects of various compounds on the enzyme activity are shown in Table 3. The enzyme is activated by Ca2+ and it can be strongly activated by Ca2+ to 122.82% with a concentration of 10 mM. Na+, Zn2+, EDTA and PMSF have significant inhibitory effects on enzyme activity. The presence of 1 mM K+ inhibits the activity of the CEP, while the enzyme is activated at a concentration of 10 mM of K+.
2.2.3. Kinetic Studies of CEP
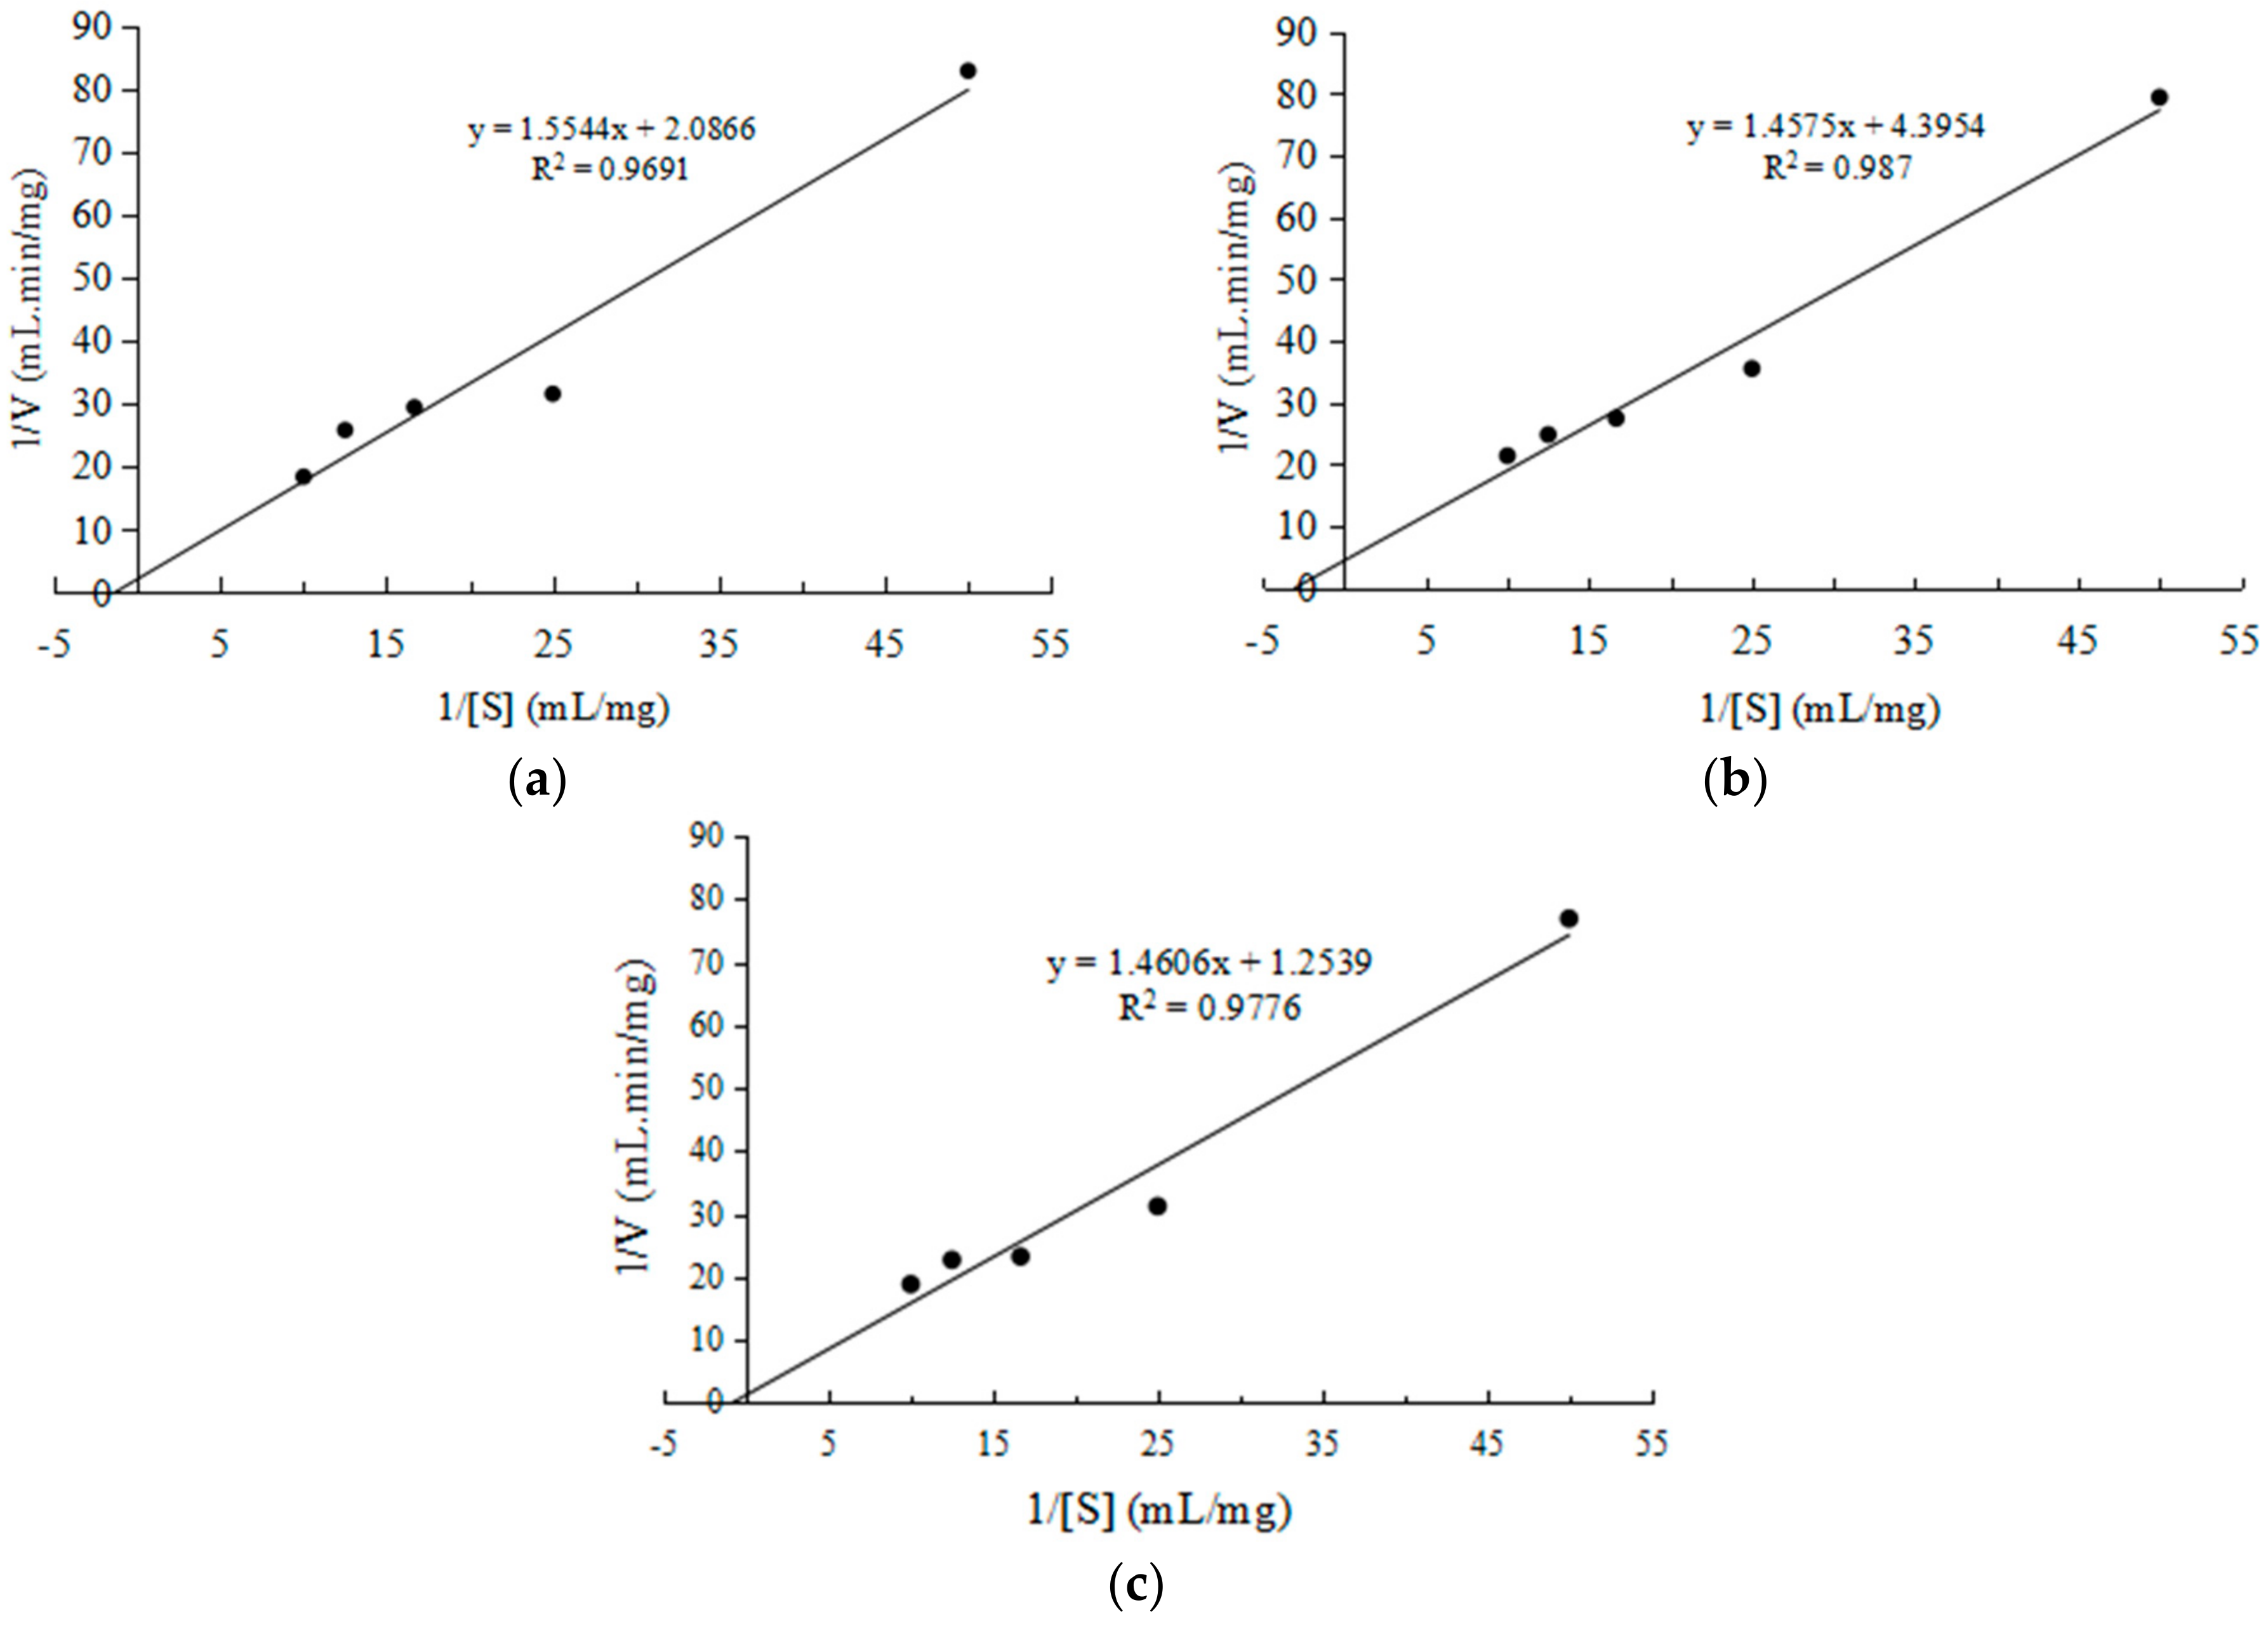
According to the linear Lineweaver–Burk plot of 1/V against 1/[S], the values of kinetic parameters Km and Vmax for the CEP from L. plantarum LP69 are measured. When whey protein is used as a substrate, at a pH of 8, temperature of 40 °C, and enzyme-to-substrate ratio (E/S) of 10% (w/w), the kinetic parameter Km is 0.745 mg/mL and Vmax is 0.479 mg/mL·min (Figure 6a). It could be seen from Figure 6b that the Km and Vmax of CEP are 0.332 mg/mL and 0.228 mg/mL·min when lactoglobulin is employed as a substrate. Figure 6c shows the Km and Vmax of CEP are 1.176 mg/mL and 0.798 mg/mL·min with casein as the substrate.
3. Discussion
There exists a direct relationship between the total activity of the crude CEP and the specific activity in Equation (3). It suggests that higher levels of enzyme activity cause an increase in the specific activity. Our study found that time has the most positive (p = 0.0017; <0.05) effect on enzyme activity of CEP (Table 2). Time is an important parameter for the CEP extraction because an inappropriate time can disrupt the natural structure of the enzyme and leads to a decrease in enzyme activity. Besides, long incubation times will contribute to a high processing cost. The results indicate that the best time for extracting CEP from LP69 is 80 min. Mehrnoush et al. [21] reported that the incubation time affected the total activity of the CEP; in fact, increasing the incubation time above the optimum point caused the protein/enzyme to denature due to the loss of tertiary structure. In addition, increasing the time led to the emergence of unwanted proteins or contaminants in the extracted sample. The temperature has the most significant (p = 0.0479; <0.05) impact on the specific activity of CEP. The temperature of 39 °C is the desirable temperature to release CEP of LP69. A higher or lower temperature will cause the decline of activity and stability of proteinases [22]. A study reported that the attachment of some cell-surface proteins to bacterial cells is dependent on pH, and these surface proteins were usually attached/released at neutral or slightly alkaline pH [5]. This pH dependency implies that extraction agents must be used at the optimal pH. Figure 2 shows that the maximum specific activity (1.36 U/mg) of CEP is obtained at pH of 6.5.
The optimal pH of CEP is in the range of 7.5–8.5. Besides, the enzyme activity of CEP in the range of pH 6.0–7.5 decreased faster than that at pH of 8.5–10.0, indicating that the proteinase is more stable under alkaline conditions compared to under acidic conditions. It is, therefore, assumed that CEP is an alkaline proteinase. The enzyme shows an optimal activity at pH of 8.0, which is consistent with the optimal condition for CEP from L. fermentium [23]. However, the optimum pH of some Lactobacillus CEP was in the range of 5–7.5, such as L. helveticus CP790 [23], L. delbrueckii ssp. lactis ACA-DC178 [4] and Lactococcus lactis ssp. lactis LB12 [1]. It suggestes that optimum pH of CEP is dependent on LAB strains. The highest proteinase acticity was obtained at 40 °C, which is the same as that for the CEP extracted from L. helveticus CP790 [23], L. delbrueckii ssp. lactis ACA-DC178 [4] and Lactococcus lactis ssp. lactis LB12 [1]. Besides, our enzyme is found to be more stable than that isolated from L. casei ssp. casei IFPL731 [24] which exhibited a 50% loss of activity at 35 °C and a total loss at 50 °C after incubating for 30 min. Crude CEP has good thermal stability when heated with the substrate.
The enzyme is activated by K+, Ca2+ and inhibited by Na+, Zn2+ and EDTA, suggesting that CEP is a metallopeptidase. Because its activity is inhibited by the serine proteinase inhibitor PMSF, CEP is assumed to be a serine proteinase. However, PMSF shows higher % inhibition than EDTA. Based on only this data, serine proteinase might be the major proteinase. In this study, we observe that CEP from L. plantarum LP69 can be released from the cell surface when incubated in the Ca2+-free buffer and the enzyme activity is measured of 20.35 U/mL. EDTA is a metal-chelator. It could chelate metal calcium ions. The removal of Ca2+ in CEP initates a structural rearrangement in the proteinase domain, causing the release of the enzyme from the cell surface and a lower specific activity. Genov et al. [25] observed four Ca2+-binding sites in LAB-related serine proteinases (subtilases) and found that the association of Ca2+ with these sites affected the activity and thermal stability of the proteinases and protected the enzymes from autoproteolytic degradation. Another study reported that the presence of Ca2+ ions could stabilize the CEP activity after release, which is consistent with the result of our finding [1]. Our study found that the relative activity of CEP is significantly increased to 105.96% and 122.82% in present of 1 mM and 10 mM Ca2+ ions, respectively. It indicates that the CEP from L. plantarum LP69 is a Ca2+ dependent enzyme and its active site is related to metal ions.
Enzymatic hydrolysis is an extensively used method, which contributes to the production of protein hydrolysates with improved functional, nutritional and physiological properties [26]. Corrochano et al. [27] have confirmed that hydrolysates from whey proteins exhibit radical scavenging activity and reducing power. Furthermore, whey protein hydrolysate hydrolyzed by the purified CEP showed strong ACE-inhibitory activity [1]. A previous study [28] indicated that proteolytic products of β-lactoglobulin catalyzed by both pepsin and trypsin have antioxidant activity. Rezvan et al. [29] found that the proteases produced by Lactcoccus lactis subsp. cremoris and Lactcoccus lactis subsp. hordniea reduce significantly the allergenicity of lactoglobulin. Kumarb et al. [30] studied camel milk casein hydrolysates catalyzed by Alcalase, α-Chymotrypsin and Papain. They found that all the three hydrolysates had antioxidant activity. Our study found that CEP from LP69 is able to hydrolyze whey protein, lactoglobulin and casein (Figure 6). Kinetics parameter Km values show that CEP has strong affinity with lactoglobulin, followed by whey protein. CEP and casein have the worst binding ability. Furthermore, Vmax values show that casein has the maximum reaction rate, followed by whey protein and lastly lactoglobulin. The maximum reaction rate of lactoglobulin catalyzed by CEP is low. It might be due to the lactoglobulin having a compact and globular (ellipsoidal) structure which could prevent the proteinase from contacting the internal peptide bonds [31]. It demonstrates CEP has a good potential for the production of bioactive peptides-rich dairy products.
4. Materials and Methods
4.1. Strains and Chemicals
L. plantarum LP69 was isolated from fermented bovine milk from Inner Mongolia, China and conserved by the School of Food and Biological Engineering, Shaanxi University of Science & Technology. The Man Rogosa Sharpe (MRS) broth was purchased from Land Bridge Technology Co., Ltd (Beijing, China). Whey protein, lactoglobulin and casein were obtained from Aoboxing Bio-tech Co., Ltd (Beijing, China). Phenylmethylsulphonyl fluoride (PMSF) and ethylene-diamine-tetra-acetic acid (EDTA) were purchased from Sigma Chemicals Co. Ltd. (St. Louis, MO, USA). Other chemicals were from Hongyan chemical reagent factory (Tianjin, China).
4.2. Preparation of Cell-Free Extracts of L. Plantarum LP69
L. plantarum LP69 was inoculated 5% (v/v) into MRS broth and subcultured twice in MRS broth at 37 °C; final growth was incubated at 37°C for 22 h. Cells were collected by centrifugation at 6000 × g for 15 min at 4 °C (Model GL21, Instrumentation, Hunan, China). The pellet was washed three times with 50 mM Tris-HCl buffer (pH 7.8) in the presence of 30 mM CaCl2. The cells were resuspended in 50 mM Tris-HCl buffer containing 50 mM EDTA-Na2 at pH 6–7 and incubated at different temperatures (37–41 °C) for 60–90 min. The cells were cooled to room temperature (RT) and centrifuged at 6000× g for 15 min at 4 °C, after which the clear supernatant was collected and was designated as the cell-free extracts to determine enzyme activity, protein contents and specific activity.
4.3. Determination of Enzyme Activity
Enzyme activity was measured as described by the method of Folin [32] with some modifications. The reaction mixture consisted of 1 mL of the cell-free extracts and 1 mL of substrate solution (2 mg/mL casein in 50 mM sodium phosphate buffer; pH 7.0). After incubating at 40 °C for 10 min, the reaction was terminated by the addition of 2 mL of 65.4 g/L trichloroacetic acid (TCA) followed by centrifugation (6000× g, 5 min). Then, the mixture of 1 mL supernatant, 5 mL of 42.4 g/L Na2CO3 and 1 mL of 2 N Folin and Ciocalteu’s reagent was incubated for 20 min at 40 °C in water bath. The release of tyrosine was determined by measuring absorbance at 680 nm. One enzyme activity unit (U) was expressed as hydrolyzing casein to produce 1.0 μM (181 μg) of tyrosine per hour at pH 7.0 at 40 °C. The blank control replaced the enzyme solution with buffer.
4.4. Determination of Protein Concentration
Protein contents of the cell free extracts were estimated by the method of Bradford [33] using the Coomassie Brilliant Blue G-250 and bovine serum albumin as the standard.
4.5. Specific Activity Assay
The specific activity of the cell free extracts (U/mg) was determined by the ratio of the total enzyme activity of the cell free extracts (U) and total protein (mg) [34]:
4.6. Experimental Design
In the previous study, the influence of main extraction parameters had been settled through Plackett-Burman design. Time, temperature and buffer pH were selected as the best extraction parameters for L. plantarum LP69. Moreover, the optimal range of these parameters was screened by path steepest ascent experiment. Thus, a Box-Behnken design (BBD) was used for exploring the optimal extraction conditions of CEP from L. plantarum LP69 and the interactions of these variables. The BBD was applied with three factors and three levels (15 experiments with three replicates at the central points). Indeed, for each of the three selected factors, three levels (−1, 0 and 1) were allocated: time (60–90 min, X1), temperature (37–41 °C, X2) and buffer pH (6–7, X3). The factors level was shown in Table 4. All tests and measurements were performed three more times, and the average of enzyme activity and specific activity was selected as the response (Y). Second-degree polynomial equation was set to evaluate fitness of data and the response value was calculated by the following quadratic equation:
where Y is the predicted value of the dependent variable, βo is the second-order reaction constant terms, βi is the linear terms coefficient, βii is quadratic terms coefficient and βij is interaction terms coefficient; Xi and Xj are the independent variables.
4.7. Enzymatic Properties of CEP from L. plantarum LP69
4.7.1. Effect of pH on the Enzyme Activity
The influence of pH in the range 6.0–9.0 was measured at 37 °C with casein as substrate, using 50 mM Tris-HCl buffer. To check the pH stability of the enzyme, the enzyme was dissolved in 50 mM Tris-HCl buffer within the pH range 6.0–10.0 and incubated for 30 min at 37 °C. The relative enzyme activity was subsequently determined at 37 °C. The relative activity of CEP was determined by taking the ratio of actual enzyme activity and the maximum enzyme activity.
4.7.2. Temperature Optimum
Enzyme activity were measured in 50 mM Tris-HCl buffer (pH 7.8) at different temperatures from 28 to 48 °C, using casein as the substrate. The enzyme solutions were incubated for 30 min at temperatures ranging from 30 to 80 °C to evaluate the thermal stability of the CEP. The relative enzyme activity was subsequently assayed at 37 °C with casein as the substrate.
4.7.3. Influence of Metal Ions and Inhibitors on Enzyme Activity
The enzyme was pre-incubated with different metal ions (Na+, K+, Zn2+ and Ca2+) and inhibitors (PMSF and EDTA) for 30 min at 37 °C, at a final concentration of 1.0 mM and 10.0 mM in 50 mM Tris-HCl buffer (pH 7.8), respectively. The activity was then assayed at 37 °C using casein as substrate. Controls were used to eliminate the interference of inhibitors or metal ions.
4.7.4. Kinetic Studies of CEP
The standard tetrapeptide Gly-Gly-Tyr-Arg was dissolved in 5% TCA solution and was formulated into various concentrations (0.0, 0.2, 0.4, 0.6, 0.8, 1.0, 1.2, 1.4, 1.6, and 1.8 mg/mL), respectively. 6 mL of the above solution was mixed with 4 mL of biuret reagent. The mixture was cooled to RT and centrifuged at 6000× g for 10 min. The absorbance of the sample was measured at 540 nm using a UV/Vis spectrophotometer (Shanghai Spectrum Instruments Co., Ltd., Shanghai, China), drawn the standard curve.
Three substrates of whey protein, lactoglobulin and casein were formulated into different concentrations of 0.02, 0.04, 0.06, 0.08, 0.10 mg/mL, respectively. The hydrolysis conditions of three substrates were temperature of 40 °C, pH of 8 and E/S of 10% (w/w). When the hydrolysis time was between 0 min and 9 min, it was sampled every 3 min. The reaction was stopped by heating under 90 °C. The absorbance at 540 nm of supernatant was measured to determine the protein contents after centrifuging at 10,664× g for 15 min. The production of protein reflected the initial speed of enzymatic reaction [35].
The Km and Vmax values were determined from a Lineweaver-Burk plot of the kinetic data. The model of the Lineweaver-Burk equation was as follows [36]:
where V was the reaction rate, Km was the Michaelis-Menten constant, Vmax was the maximum reaction rate, and [S] was the substrate concentration.
4.8. Statistical Analysis
Data from three replicated trials for each treatment are presented as means with standard deviation (Mean±SD). All modeling and Statistical analysis were performed using Design of Expert software (Version 8.0.6, Stat-Ease Corp., Minneapolis, MN, USA), and differences were considered statistically significant at p < 0.05. The Origin 9 software package (Origin Lab Inc., Alexandria, VA, USA) and Microsoft Excel 2010 (Redmond, WA, USA) were used for describing enzyme properties.
5. Conclusions
In the present study, the influence of three main factors on the extraction of CEP from L. plantarum LP69 was investigated by RSM. Time has the most significant (p < 0.05) impact on enzyme activity of CEP. Inappropriate time could disrupt the natural structure of the proteinase and cause a high processing cost. The temperature has the most significant (p < 0.05) influence on specific activity. A higher or lower temperature led to loss of the activity and stability of proteinases. The release of CEP from LP69 was also affected by buffer pH. The results suggest that the optimum extraction conditions of CEP from L. plantarum LP69 were achieved using a temperature of 39 °C, time of 80 min, and buffer pH of 6.5. The optimized conditions result in an increase in enzyme activity and specific activity of the CEP to (23.94 ± 0.86) U/mL and (1.37 ± 0.03) U/mg, respectively. The maximum activity of crude CEP is obtained at pH 8.0 and 40 °C. The CEP is a metallopeptidase, since it is activated by Ca2+ and inhibited by Zn2+ and EDTA. It is a serine proteinase which is inhibited by PMSF. The CEP was able to hydrolyze whey protein, lactoglobulin and casein, which demonstrates it has a good potential for the production of bioactive peptide-rich dairy products.
Author Contributions
H.C. and L.C. conceived and designed the experiments; J.H. and N.L. performed the experiments; N.S. analyzed the data; H.C. and B.C. contributed reagents/materials/analysis tools; J.H. wrote the paper.
Funding
This research was funded by the Science and Technology Project of Xianyang city (No. 2017K02-69) and the Science and Technology Overall Planning for innovation Engineering project of Shaanxi Province (No. 2016KTZDNY02-03).
Acknowledgments
This work was partly supported by the Scientific Research Program Funded by Shaanxi Provincial Education Department (No. 17JF005), which are greatly acknowledged.
Conflicts of Interest
The authors declare no conflict of interest.
References
- Guo, Y.X.; Pan, D.D.; Zeng, X.Y.; Tanokura, M. Purification and characterization of CEP from Lactococcus lactis ssp. Lactis. Food Chem. 2009, 112, 533–538. [Google Scholar] [CrossRef]
- Fung, W.Y.; Liong, M.T. Evaluation of proteolytic and ACE-inhibitory activity of Lactobacillus acidophilus in soy whey growth medium via response surface methodology. LWT Food Sci. Technol. 2010, 43, 563–567. [Google Scholar] [CrossRef]
- Espeche, T.M.B.; Savoy de Giori, G.; Hebert, E.M. Release of the cell-envelope-associated proteinase of Lactobacillus delbrueckii subspecies lactis CRL 581 is dependent upon pH and temperature. J. Agric. Food Chem. 2009, 57, 8607–8611. [Google Scholar] [CrossRef] [PubMed]
- Tsakalidou, E.; Anastasiou, R.; Vandenberghe, I.; van Beeumen, J.; Kalantzopoulos, G. Cell-wall-bound proteinase of Lactobacillus delbrueckii subsp. lactis ACA-DC 178: Characterization and specificity for β-casein. Appl. Environ. Microbiol. 1999, 65, 2035–2040. [Google Scholar] [PubMed]
- Sánchez, B.; Bressollier, P.; Chaignepain, S.; Schmitter, J.M.; Urdaci, M.C. Identification of surface-associated proteins in the probiotic bacterium Lactobacillus rhamnosus GG. Int. Dairy J. 2009, 19, 85–88. [Google Scholar] [CrossRef]
- Jarocki, P.; Podlesny, M.; Wasko, A.; Siuda, A.; Targonski, Z. Differentiation of three Lactobacillus rhamnosus strains (E/N, Oxy and Pen) by SDS-PAGE and two-dimensional electrophoresis of surface-associated proteins. J. Microbiol. Biotechnol. 2010, 20, 558–562. [Google Scholar] [PubMed]
- Fira, D.; Kojic, M.; Banina, A.; Spasojevic, I.; Strahinic, I.; Topisirovic, L. Characterization of cell envelope-associated proteinases of Thermophilic lactobacilli. J. Appl. Microbiol. 2001, 90, 123–130. [Google Scholar] [CrossRef] [PubMed]
- Laloi, P.; Atlan, D.; Blanc, B.; Gilbert, C.; Portalier, R. Cell-wall-associated proteinase of Lactobacillus delbrueckii subsp. bulgaricus CNRZ397: differential extraction, purification and properties of the enzyme. Appl. Microbiol. Biotechnol. 1991, 36, 196–204. [Google Scholar]
- MartÍn-Hernández, M.C.; Alting, A.C.; Exterkate, F.A. Purification and characterization of the mature, membrane-associated cell-envelope proteinase of Lactobacillus helveticus L89. Appl. Microbiol. Biotechnol. 1994, 40, 828–834. [Google Scholar] [CrossRef]
- Hébert, E.M.; Raya, R.; de Giori, G.S. Characterization of a cell membrane-associated proteinase from Lactobacillus helveticus CRL 581. Curr. Microbiol. 1997, 35, 161–164. [Google Scholar] [CrossRef]
- Bhowmik, T.; Johnson, M.C.; Ray, B. Isolation and partial characterization of the surface protein of Lactobacillus acidophilus strains. Int. J. Food Microbiol. 1985, 2, 311–321. [Google Scholar] [CrossRef]
- Atlan, D.; Laloi, P.; Portalier, R. X-prolyl-dipeptidylamino peptidase of Lactobacillus delbrueckii subsp. bulgaricus: Characterization of the enzyme and isolation of deficient mutants. Appl. Environ. Microbiol. 1990, 56, 2174–2179. [Google Scholar] [PubMed]
- Agyei, D.; Lim, W.; Zass, M.; Tan, D.; Danquah, M.K. Bioanalytical evaluation of Lactobacillus delbrueckii subsp. lactis 313 cell-envelope proteinase extraction. Chem. Eng. Sci. 2013, 95, 323–330. [Google Scholar]
- Sadat-Mekmene, L.; Genay, M.; Atlan, D.; Lortal, S.; Gagnaire, V. Original features of cell-envelope proteinases of Lactobacillus helveticus: A review. Int. J. Food Microbiol. 2011, 146, 1–13. [Google Scholar] [CrossRef] [PubMed]
- Stefanovic, E.; Kilcawley, K.N.; Rea, M.C.; Fitzgerald, G.F.; McAuliffe, O. Genetic, enzymatic and metabolite profiling of the Lactobacillus casei group reveals strain biodiversity and potential applications for flavour diversification. J. Appl. Microbiol. 2017, 122, 1245–1261. [Google Scholar] [CrossRef] [PubMed]
- Zhang, S.; Zhang, L.; Zhang, L.; Feng, Z.; Shigwedha, N. Screening, purification, and characterization of proteinase from 3 Lactobacillus delbrueckii subsp. bulgaricus. RSC Adv. 2015, 5, 93733–93738. [Google Scholar] [CrossRef]
- Gobbetti, M.; Smacchi, E.; Corsetti, A. The proteolytic system of Lactobacillus sanfrancisco CB1: purification and characterization of a proteinase, a dipeptidase, and an aminopeptidase. Appl. Environ. Microbiol. 1996, 62, 3220–3226. [Google Scholar] [PubMed]
- Chen, H.; Ji, Z.; Shu, G.W.; Xing, H. Effect of probiotic Lactobacillus strains on Angiotensin-I Converting enzyme inhibitory activity from fermented goat milk. Adv. Mater. Res. 2012, 531, 442–445. [Google Scholar] [CrossRef]
- Shu, G.W.; Yang, H.; Chen, H.; Zhang, Q.H.; Tian, Y. Effect of incubation time, inoculum size, temperature, pasteurization time, goat milk powder and whey powder on ACE-inhibitory activity in fermented milk by L. plantarum LP69. Acta Sci. Pol. Technol. Aliment. 2015, 14, 107–116. [Google Scholar] [PubMed]
- Shu, G.W.; Huang, J.; Chen, L.; Lei, N.; Chen, H. Characterization of Goat Milk Hydrolyzed by Cell Envelope Proteinases from Lactobacillus plantarum LP69: Proteolytic System Optimization, Bioactivity, and Storage Stability Evaluation. Molecules 2018, 23, 1317. [Google Scholar] [CrossRef] [PubMed]
- Mehrnoush, A.; Mustafa, S.; Zaidul, I.S.M.D.; Mohd, Y.A.M. Optimization of the Conditions for Extraction of Serine Protease from Kesinai Plant (Streblus asper) Leaves Using Response Surface Methodology. Molecules 2011, 16, 9245–9260. [Google Scholar] [CrossRef] [PubMed]
- Zhu, X.; Pan, D.D. Purification and Enzymatic Properties of Cell Envelope Protease from Lactobacillus fermentum. Food Sci. 2011, 32, 262–268. [Google Scholar]
- Yamamoto, N.; Akino, A.; Takano, T. Purification and specificity of a cell wall-associated proteinase from Lactobacillus helveticus CP790. Int. J. Biochem. 1993, 114, 740–750. [Google Scholar] [CrossRef]
- Fernandez de Palenzia, P.; Pelaez, C.; Martin-Hernandez, M.C. Purification and characterization of the cell wall proteinase of Lactobacillus casei subsp. casei IFPL731 isolated from raw goat’s milk cheese. J. Agric. Food Chem. 1997, 45, 3401–3405. [Google Scholar]
- Genov, N.; Filippi, B.; Dolashka, P.; Wilson, K.S.; Betzel, C. Stability of subtilisins and related proteinases (subtilases). Int. J. Pept. Protein Res. 1995, 45, 391–400. [Google Scholar] [CrossRef] [PubMed]
- Rodríguez Patino, J.M.; Miňones Conde, J.; Linares, H.M.; Pedroche Jiménez, J.J.; Car-rera Sánchez, C.; Pizones, V.; Rodríguez, F.M. Interfacial and foamingproperties of enzyme-induced hydrolysis of sunflower protein isolate. Food Hydrocoll. 2007, 21, 782–793. [Google Scholar] [CrossRef]
- Corrochano, A.R.; Buckin, V.K.; Phil, M.; Giblin, L. Invited review: Whey proteins as antioxidants and promoters of cellular antioxidant pathways. J. Dairy Sci. 2018, 101, 1–15. [Google Scholar] [CrossRef] [PubMed]
- Ma, S.; Wang, C.N.; Guo, M.G. Changes in structure and antioxidant activity of β-lactoglobulin by ultrasound and enzymatic treatment. Ultrason. Sonochem. 2018, 43, 227–236. [Google Scholar] [CrossRef] [PubMed]
- Rezvan, K.; Asghar, T.K.; Ahmad, M.; Reihane, K. Allergenicity reduction of bovine milk β-lactoglobulin by proteolytic activity of lactococcus lactis BMC12C and BMC19H isolated from Iranian dairy products. Int. J. Biol. Macromol. 2018, 112, 876–881. [Google Scholar]
- Kumar, D.; Chatli, M.K.; Singh, R.; Mehta, N.; Kumar, P. Antioxidant and antimicrobial activity of camel milk caseinhydrolysates and its fractions. Small Ruminant Res. 2016, 139, 20–25. [Google Scholar] [CrossRef]
- Carter, D.; He, X.; Munson, S.; Twigg, P.; Gernert, K.; Broom, M.; Miller, T. Three-dimensional structure of human serum albumin. Science 1989, 244, 1195–1198. [Google Scholar] [CrossRef] [PubMed] [Green Version]
- Agyei, D.; He, L.Z. Evaluation of cross-linked enzyme aggregates of lactobacillus cell-envelope proteinases, for protein degradation. Food Bioprod. Process. 2015, 94, 59–69. [Google Scholar] [CrossRef]
- Bradford, M.M. A rapid and sensitive method for the quantitation of microgram quantities of protein utilizing the principle of protein-dye binding. Anal. Biochem. 1976, 72, 248–254. [Google Scholar] [CrossRef]
- Ngo, L.T.A.; Pham, T.L.; Le, V.V.M. Purification of Endopolygalacturonase from submerged culture of Aspergillus awamori L1 using a two-step procedure: Enzyme precipitation and gel filtration. J. Food Res. Int. 2008, 15, 135–140. [Google Scholar]
- Liu, Z.L.; Pan, J.H. A practical method for extending the biuret assay to protein determination of corn-based products. Food Chem. 2017, 224, 289–293. [Google Scholar] [CrossRef] [PubMed]
- Lineweaver, H.; Burk, D. The determination of enzyme dissociation constants. J. Am. Chem. Soc. 1934, 56, 658–666. [Google Scholar] [CrossRef]
Figure 1.
Contour plot of (a) time (X1) and temperature (X2); (b) time (X1) and buffer pH (X3); (c) temperature (X2) and buffer pH (X3) and 3D plot of (d) time (X1) and temperature (X2); (e) time (X1) and buffer pH (X3); (f) temperature (X2) and buffer pH (X3) on enzyme activity of CEP from L. plantarum LP69.


Figure 2.
Contour plot of (a) time (X1) and temperature (X2); (b) time (X1) and buffer pH (X3); (c) temperature (X2) and buffer pH (X3) and 3D plot of (d) time (X1) and temperature (X2); (e) time (X1) and buffer pH (X3); (f) temperature (X2) and buffer pH (X3) on specific activity of CEP from L. plantarum LP69.

Figure 3.
Fitted line plot showing the closeness between predicted values and actual values for enzyme activity (a) and specific activity (b) of CEP from L. plantarum LP69.
Figure 3.
Fitted line plot showing the closeness between predicted values and actual values for enzyme activity (a) and specific activity (b) of CEP from L. plantarum LP69.

Figure 4.
Influence of pH on activity of the CEP (a) and relative enzyme activity of CEP after 30 min incubation at pH ranging from 6.0 to 10.0 (b). The error bars express standard deviation of average value (n = 3).
Figure 4.
Influence of pH on activity of the CEP (a) and relative enzyme activity of CEP after 30 min incubation at pH ranging from 6.0 to 10.0 (b). The error bars express standard deviation of average value (n = 3).

Figure 5.
Influence of temperature on activity of the CEP (a) and relative enzyme activity of CEP after 30 min incubation at temperatures ranging from 30 to 80 °C (b). The error bars express standard deviation of average value (n = 3).
Figure 5.
Influence of temperature on activity of the CEP (a) and relative enzyme activity of CEP after 30 min incubation at temperatures ranging from 30 to 80 °C (b). The error bars express standard deviation of average value (n = 3).

Figure 6.
Determination of Lineweaver–Burk graph for CEP from L. plantarum LP69 at five different concentrations of various substrates (a) whey protein, (b) lactoglobulin and (c) casein.
Figure 6.
Determination of Lineweaver–Burk graph for CEP from L. plantarum LP69 at five different concentrations of various substrates (a) whey protein, (b) lactoglobulin and (c) casein.

Table 1.
Experimental design used in RSM studies by using three independent variables with three central points, showing observed enzyme activity (Y1, U/mL) and specific activity (Y2, U/mg). Time (min, X1), temperature (°C, X2) and pH (X3) were chosen as the three independent variables.
Table 1.
Experimental design used in RSM studies by using three independent variables with three central points, showing observed enzyme activity (Y1, U/mL) and specific activity (Y2, U/mg). Time (min, X1), temperature (°C, X2) and pH (X3) were chosen as the three independent variables.
| Runs | Variables | Enzyme Activity (Y1, U/mL) | Specific Activity (Y2, U/mg) | ||
|---|---|---|---|---|---|
| Time (min, X1) | Temperature (°C, X2) | pH (X3) | |||
| 1 | 1 (90) | 0 (39) | 1 (7.0) | 17.6 ± 0.52 | 1.31 ± 0.02 |
| 2 | 0 (75) | 0 | 0 (6.5) | 20.64 ± 0.73 | 1.35 ± 0.04 |
| 3 | 1 | −1 (37) | 0 | 15.84 ± 0.59 | 1.22 ± 0.06 |
| 4 | −1 (60) | 0 | 1 | 11.75 ± 0.66 | 1.31 ± 0.02 |
| 5 | −1 | 0 | −1 (6.0) | 14.34 ± 0.71 | 1.27 ± 0.03 |
| 6 | 0 | 0 | 0 | 22.21 ± 0.67 | 1.39 ± 0.07 |
| 7 | 1 | 1 (41) | 0 | 21.42 ± 0.78 | 1.18 ± 0.06 |
| 8 | 0 | 1 | 1 | 13.43 ± 0.87 | 1.28 ± 0.03 |
| 9 | 1 | 0 | −1 | 22.16 ± 0.76 | 1.30 ± 0.10 |
| 10 | 0 | 1 | −1 | 16.29 ± 0.81 | 1.20 ± 0.03 |
| 11 | 0 | −1 | −1 | 13.72 ± 0.52 | 1.29 ± 0.07 |
| 12 | −1 | 1 | 0 | 11.21 ± 0.54 | 1.21 ± 0.11 |
| 13 | 0 | −1 | 1 | 16.43 ± 0.57 | 1.27 ± 0.08 |
| 14 | 0 | 0 | 0 | 20.77 ± 0.75 | 1.37 ± 0.04 |
| 15 | −1 | −1 | 0 | 15.94 ± 0.69 | 1.21 ± 0.05 |
Table 2.
ANOVA for enzyme activity (Y1, U/mL) and specific activity (Y2, U/mg).
| Source | DF | Enzyme Activity (Y1, U/mL) | Specific Activity (Y2, U/mg) | ||||
|---|---|---|---|---|---|---|---|
| MS | F | Pr > F | MS | F | Pr > F | ||
| Model | 9 | 20.73 | 10.99 | 0.0084 * | 0.0062 | 23.47 | 0.0014 * |
| X1 | 1 | 70.69 | 37.47 | 0.0017 * | <0.0001 | 0.047 | 0.8366 |
| X2 | 1 | 0.022 | 0.012 | 0.9181 | 0.0018 | 6.79 | 0.0479 * |
| X3 | 1 | 6.66 | 3.53 | 0.1190 | 0.0015 | 5.71 | 0.0625 |
| X1X2 | 1 | 26.57 | 14.09 | 0.0133 * | 0.0004 | 1.51 | 0.2739 |
| X1X3 | 1 | 0.97 | 0.51 | 0.5054 | 0.0002 | 0.85 | 0.3991 |
| X2X3 | 1 | 7.76 | 4.11 | 0.0984 | 0.0025 | 9.43 | 0.0277 * |
| X12 | 1 | 12.02 | 6.37 | 0.0529 | 0.015 | 56.63 | 0.0007 * |
| X22 | 1 | 40.20 | 21.31 | 0.0058 * | 0.038 | 142.84 | <0.0001 * |
| X32 | 1 | 31.91 | 16.91 | 0.0092 * | 0.0002 | 1.07 | 0.3490 |
| Residual | 5 | 1.89 | 0.0002 | ||||
| Lack of fit | 3 | 2.64 | 3.47 | 0.2315 | 0.0001 | 0.44 | 0.7506 |
| Pure error | 2 | 0.76 | 0.0004 | ||||
| R2 | 0.9519 | 0.9769 | |||||
| R2adj | 0.8652 | 0.9352 | |||||
* significant at (p <0.05); DF: degrees of freedom; MS: mean square; F: F-value; Pr > F: p-value.
Table 3.
Influence of various concentrations of metal ions and inhibitors on the crude CEP activity of L. plantarum LP69.
Table 3.
Influence of various concentrations of metal ions and inhibitors on the crude CEP activity of L. plantarum LP69.
| Inhibitors and Ions a | Relative Enzyme Activity (%) b | |
|---|---|---|
| Compound Concentration (mM) | ||
| 1.00 | 10.00 | |
| None | 100.00 | 100.00 |
| Ca2+ | 105.96 | 122.82 |
| Na+ | 91.42 | 93.75 |
| K+ | 94.23 | 106.01 |
| Zn2+ | 53.59 | 42.34 |
| PMSF | 40.94 | 25.73 |
| EDTA | 45.20 | 34.93 |
The crude CEP activity was the average of three replicates twice analyzed. a PMSF, phenylmethylsulfonyl fluoride; EDTA, ethylene-diamine-tetra-acetic acid. b The activity of the control in the absence of chemical reagents and metal ions was taken as 100%.
Table 4.
Factors and levels of the experimental design for CEP extraction conditions.
| Factors | Symbol | Coded Levels | ||
|---|---|---|---|---|
| −1 | 0 | 1 | ||
| Time (min) | X1 | 60 | 75 | 90 |
| Temperature (°C) | X2 | 37 | 39 | 41 |
| Buffer pH | X3 | 6.0 | 6.5 | 7.0 |
© 2018 by the authors. Licensee MDPI, Basel, Switzerland. This article is an open access article distributed under the terms and conditions of the Creative Commons Attribution (CC BY) license (http://creativecommons.org/licenses/by/4.0/).
Share and Cite
MDPI and ACS Style
Chen, H.; Huang, J.; Cao, B.; Chen, L.; Song, N.; Lei, N. Study of Extraction and Enzymatic Properties of Cell-Envelope Proteinases from a Novel Wild Lactobacillus plantarum LP69. Catalysts 2018, 8, 325. https://doi.org/10.3390/catal8080325
AMA Style
Chen H, Huang J, Cao B, Chen L, Song N, Lei N. Study of Extraction and Enzymatic Properties of Cell-Envelope Proteinases from a Novel Wild Lactobacillus plantarum LP69. Catalysts. 2018; 8(8):325. https://doi.org/10.3390/catal8080325
Chicago/Turabian StyleChen, He, Jie Huang, Binyun Cao, Li Chen, Na Song, and Ni Lei. 2018. "Study of Extraction and Enzymatic Properties of Cell-Envelope Proteinases from a Novel Wild Lactobacillus plantarum LP69" Catalysts 8, no. 8: 325. https://doi.org/10.3390/catal8080325
Note that from the first issue of 2016, this journal uses article numbers instead of page numbers. See further details here.