Characteristics of Vanadium-Based Coal Gasification Slag and the NH3-Selective Catalytic Reduction of NO
by
Fang Han
1, 
Yanchun Gao
1,
Qihuang Huo
1,
Lina Han
2,
Jiancheng Wang
1,*,
Weiren Bao
1 and
Liping Chang
1 1
State Key Laboratory Breeding Base of Coal Science and Technology Co-founded by Shanxi Province and the Ministry of Science and Technology, Taiyuan University of Technology, Taiyuan 030024, China
2
College of Materials Science and Engineering, Taiyuan University of Technology, Taiyuan 030024, China
*
Author to whom correspondence should be addressed.
Catalysts 2018, 8(8), 327; https://doi.org/10.3390/catal8080327
Submission received: 8 July 2018
/
Revised: 2 August 2018
/
Accepted: 4 August 2018
/
Published: 9 August 2018
(This article belongs to the Section Biomass Catalysis)
Abstract
:In order to realize the resource utilization of coal gasification slag (CGS) and to effectively control the emission of nitrogen oxides (NOx) in coke oven gas, the effect of the reaction conditions and vanadium loading over the CGS catalysts was carried out for the selective catalytic reduction (SCR) of NO by NH3. The various vanadium loaded CGS catalysts were prepared using impregnation methods. The addition of 1% vanadium to the CGS catalyst (V1/CGS) significantly enhanced the NO conversion at a wide temperature range of 180–290 °C. The catalysts were characterized by N2 adsorption/desorption, X-ray photoelectron spectroscopy, H2-temperature programmed reduction, NH3-temperature programmed desorption, Inductively coupled plasma optical emission spectrometer (ICP-OES), thermo gravimetric analyses (TGA), Fourier Transform infrared spectroscopy (FTIR), Scanning electron microscope-Energy dispersive spectrometer (SEM-EDS), and X-ray powder diffraction (XRD). The experimental results show the following: That (1) the NO removal efficiency of the sample CGS3 was the best, and it could be up to 100% under the experimental conditions; (2) The NO removal efficiency of the catalysts was higher in the atmosphere with SO2 than that without SO2; (3) The XRD results indicated the active component of vanadium was homogeneously dispersed over CGS and the active component of catalyst was V2O5 according to the XPS results. In particular, the NH3-TPD spectra of the vanadium loaded CGS catalyst showed that vanadium produced more acid sites, and the Lewis acid sites on the vanadium species were the active sites for the catalytic reduction of NO at 240–290 °C.
1. Introduction
The coking chemical industry is an important part of the coal industry. However, the nitrogen oxides emitted from coke oven flue gas pollute our living environment and endanger our physical health. Therefore, the coking industry’s flue gas treatment is imminent. According to reports, NH3- selective catalytic reduction (SCR) technology is the most effective technology for removing NOx from flue gases [1,2]. The commonly adopted commercial catalyst is V2O5–WO3(MoO3)/TiO2 [2,3,4], and its working temperature must be above 300 °C in order to obtain good catalytic activity and to avoid pore plugging caused by the deposition of ammoniumsulfate salts over the catalyst surface. However, at low temperatures, the presence of H2O and SO2 can seriously affect SCR activity [5]. According to the literature, some catalysts (such as MnO2/Al2O3, CuO/AC (activated carbon), and Fe2O3/AC) show a high SCR activity at 120–250 °C, but they are prone to SO2 deactivation because of the formation of sulfate salts [6,7,8]. Developing a catalyst that is resistant to SO2 poisoning is critical to the SCR process. Studies have shown that in resisting the anti-ammonium sulfate, activated carbon or coke as a carrier is superior to TiO2 and SiO2 [9]. Zhu et al. [10] reported a carbon-supported vanadium oxide (V2O5/AC) catalyst for the SCR reduction. The catalytic activity was greatly promoted in the presence of SO2. Numerous studies have reported that coal and coal-based materials (e.g., coal fly ash) could be prepared for activated carbons [11,12]. So, from the perspective of simplifying the process and saving costs, can we use coal gasification slag (CGS) as an alternative activated carbon for NO removal?
CGSs are solid by-products of the coal gasification process, including coarse slag (slags from lock hopper) and fine slag (slags from filter). They contain rich silica, alumina, and iron oxide as well as calcium oxide, magnesium oxide, titanium dioxide, and other inorganic materials. Recently, there have been some studies regarding the properties and applications of CGSs. Acosta et al. [13] used a 50% of lowcarbon coal gasification slag (burning loss rate only 2.64%) and clay to prepare the building bricks. Acosta et al. [14] found that the gas installations of a combined cycle (GICC) slag can be used as a raw material to produce glass fibers, glass ceramics, and ceramic sintered materials, in principle. However, most of the CGS is generally stored or placed in landfills, resulting in a waste of resources and pollution of the surrounding environment. Considering the similar properties of the CGS and coal-based materials, can coal gasification slag be high valued-added when used as an alternative source of activated carbon? For example, highly porous activated carbons were prepared from a coal gasification slag (CGS) precursor, and Pb2+ was removed from aqueous solution by KOH activation [15]. However, few studies have focused on using CGS to remove NOx in flue gas.
In this study, CGS was used as a carrier and a V/CGS catalyst was prepared by pore volume impregnation. The SCR experiments were carried out by using a fixed bed reactor. The effects of the vanadium loading, temperature, and atmosphere on the NO removal activity of catalyst were investigated. The feasibility of using the gasified slag as the support for the SCR of NO by NH3 was discussed.
2. Results and Discussion
2.1. Effect of Carrier
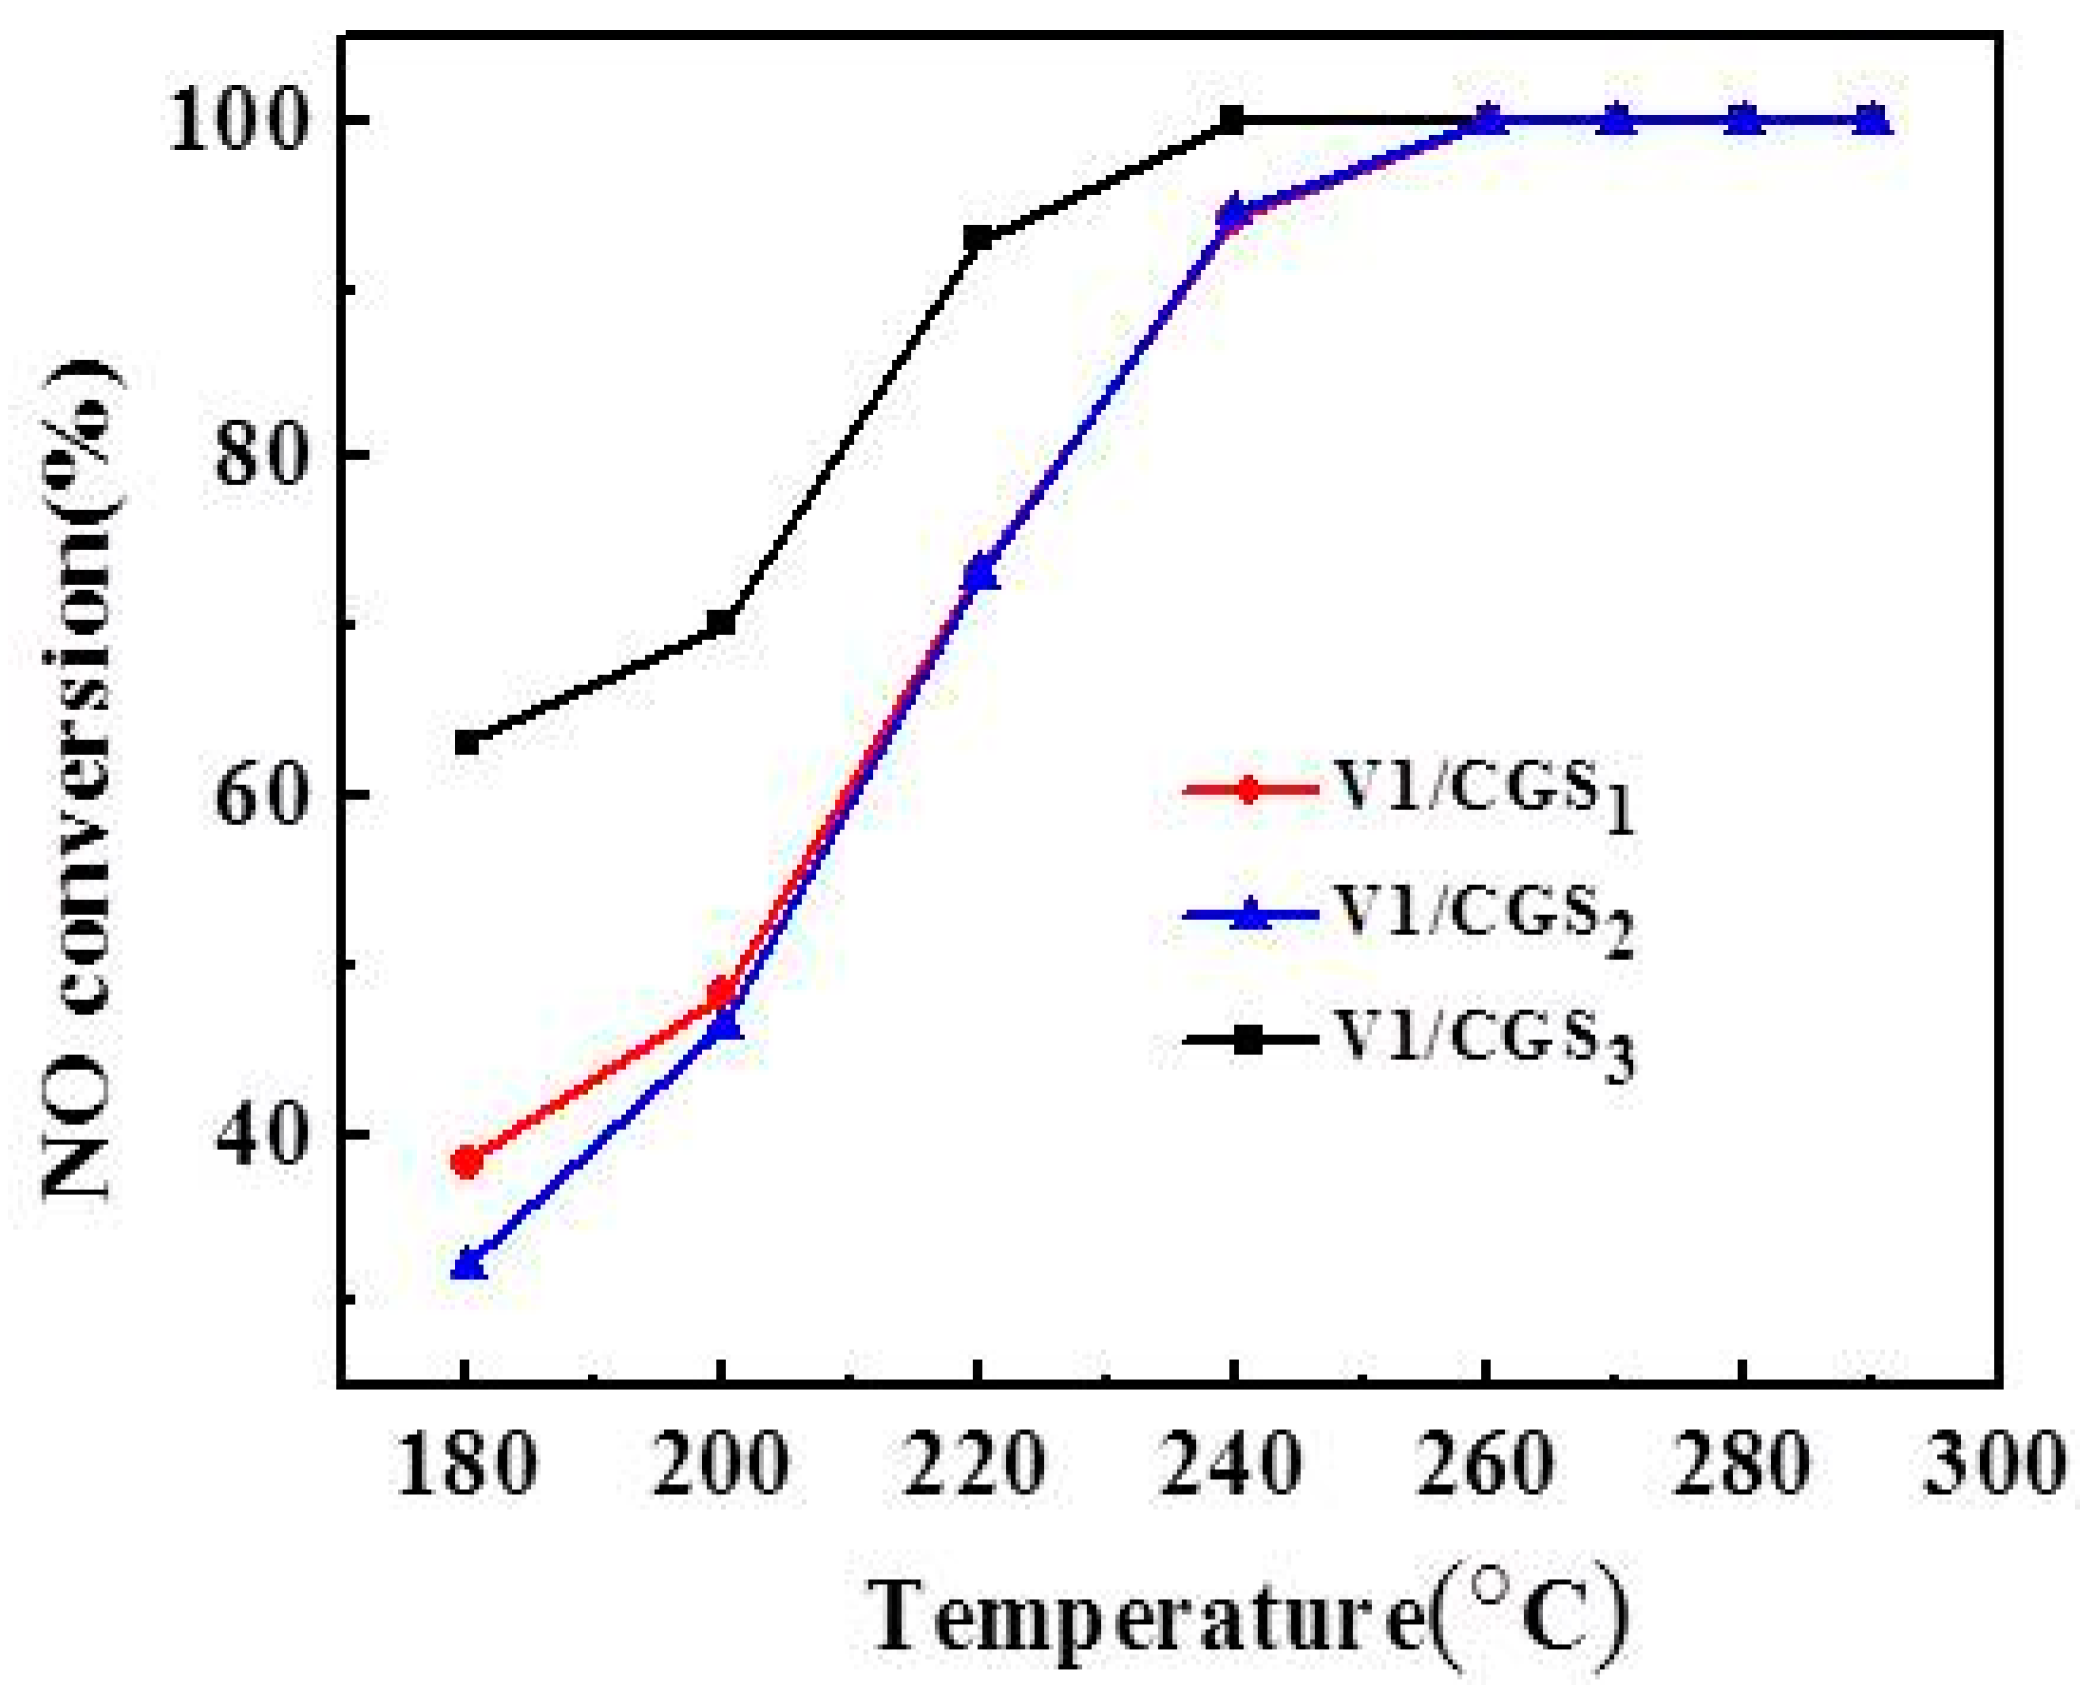
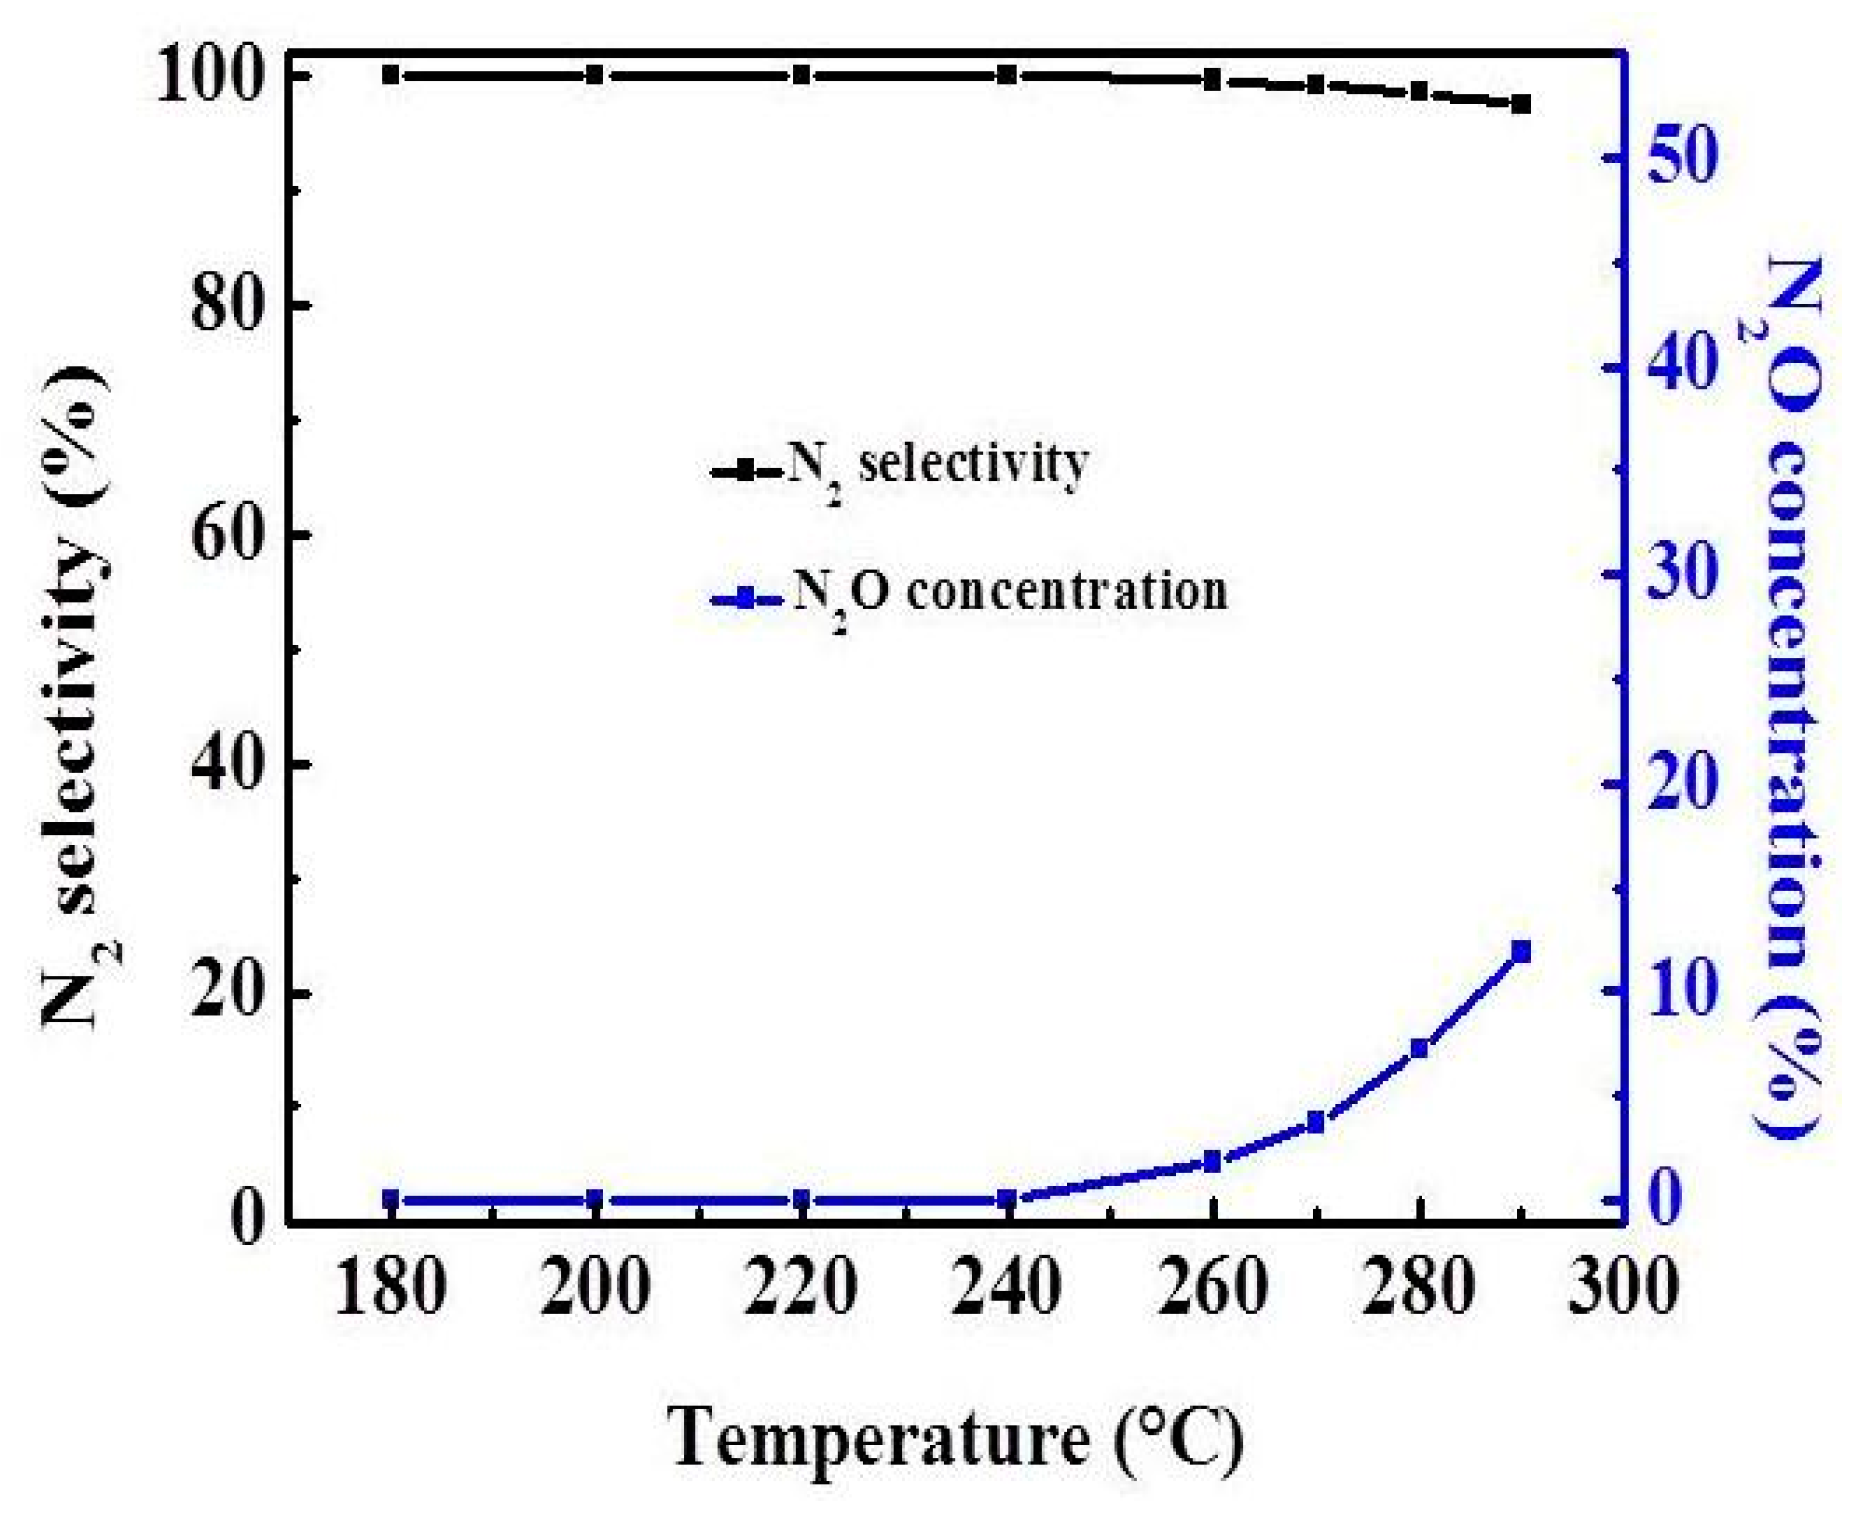
Figure 1 shows that the NO conversions increases with the increase of temperature, and the NO conversion of the catalyst is close to 100% in the temperature range of 260–290 °C. In the range of 180–260 °C, V1/CGS3 shows a relatively higher DeNOx activity than V1/CGS1 and V1/CGS2, which may be due to the physical properties of V1/CGS3 catalyst (see Table 1). Therefore, CGS3 was used as the support in the following experiments. Figure 2 shows the N2O formation and N2 selectivity experiment of the V1/CGS3 catalyst. Clearly, the N2O formation slightly increases with an increase in temperature. Moreover, the N2 selectivity of the V1/CGS3 catalyst is always above 97% during the reaction, indicating that the catalyst has a good selectivity.
2.2. Effect of V Loading
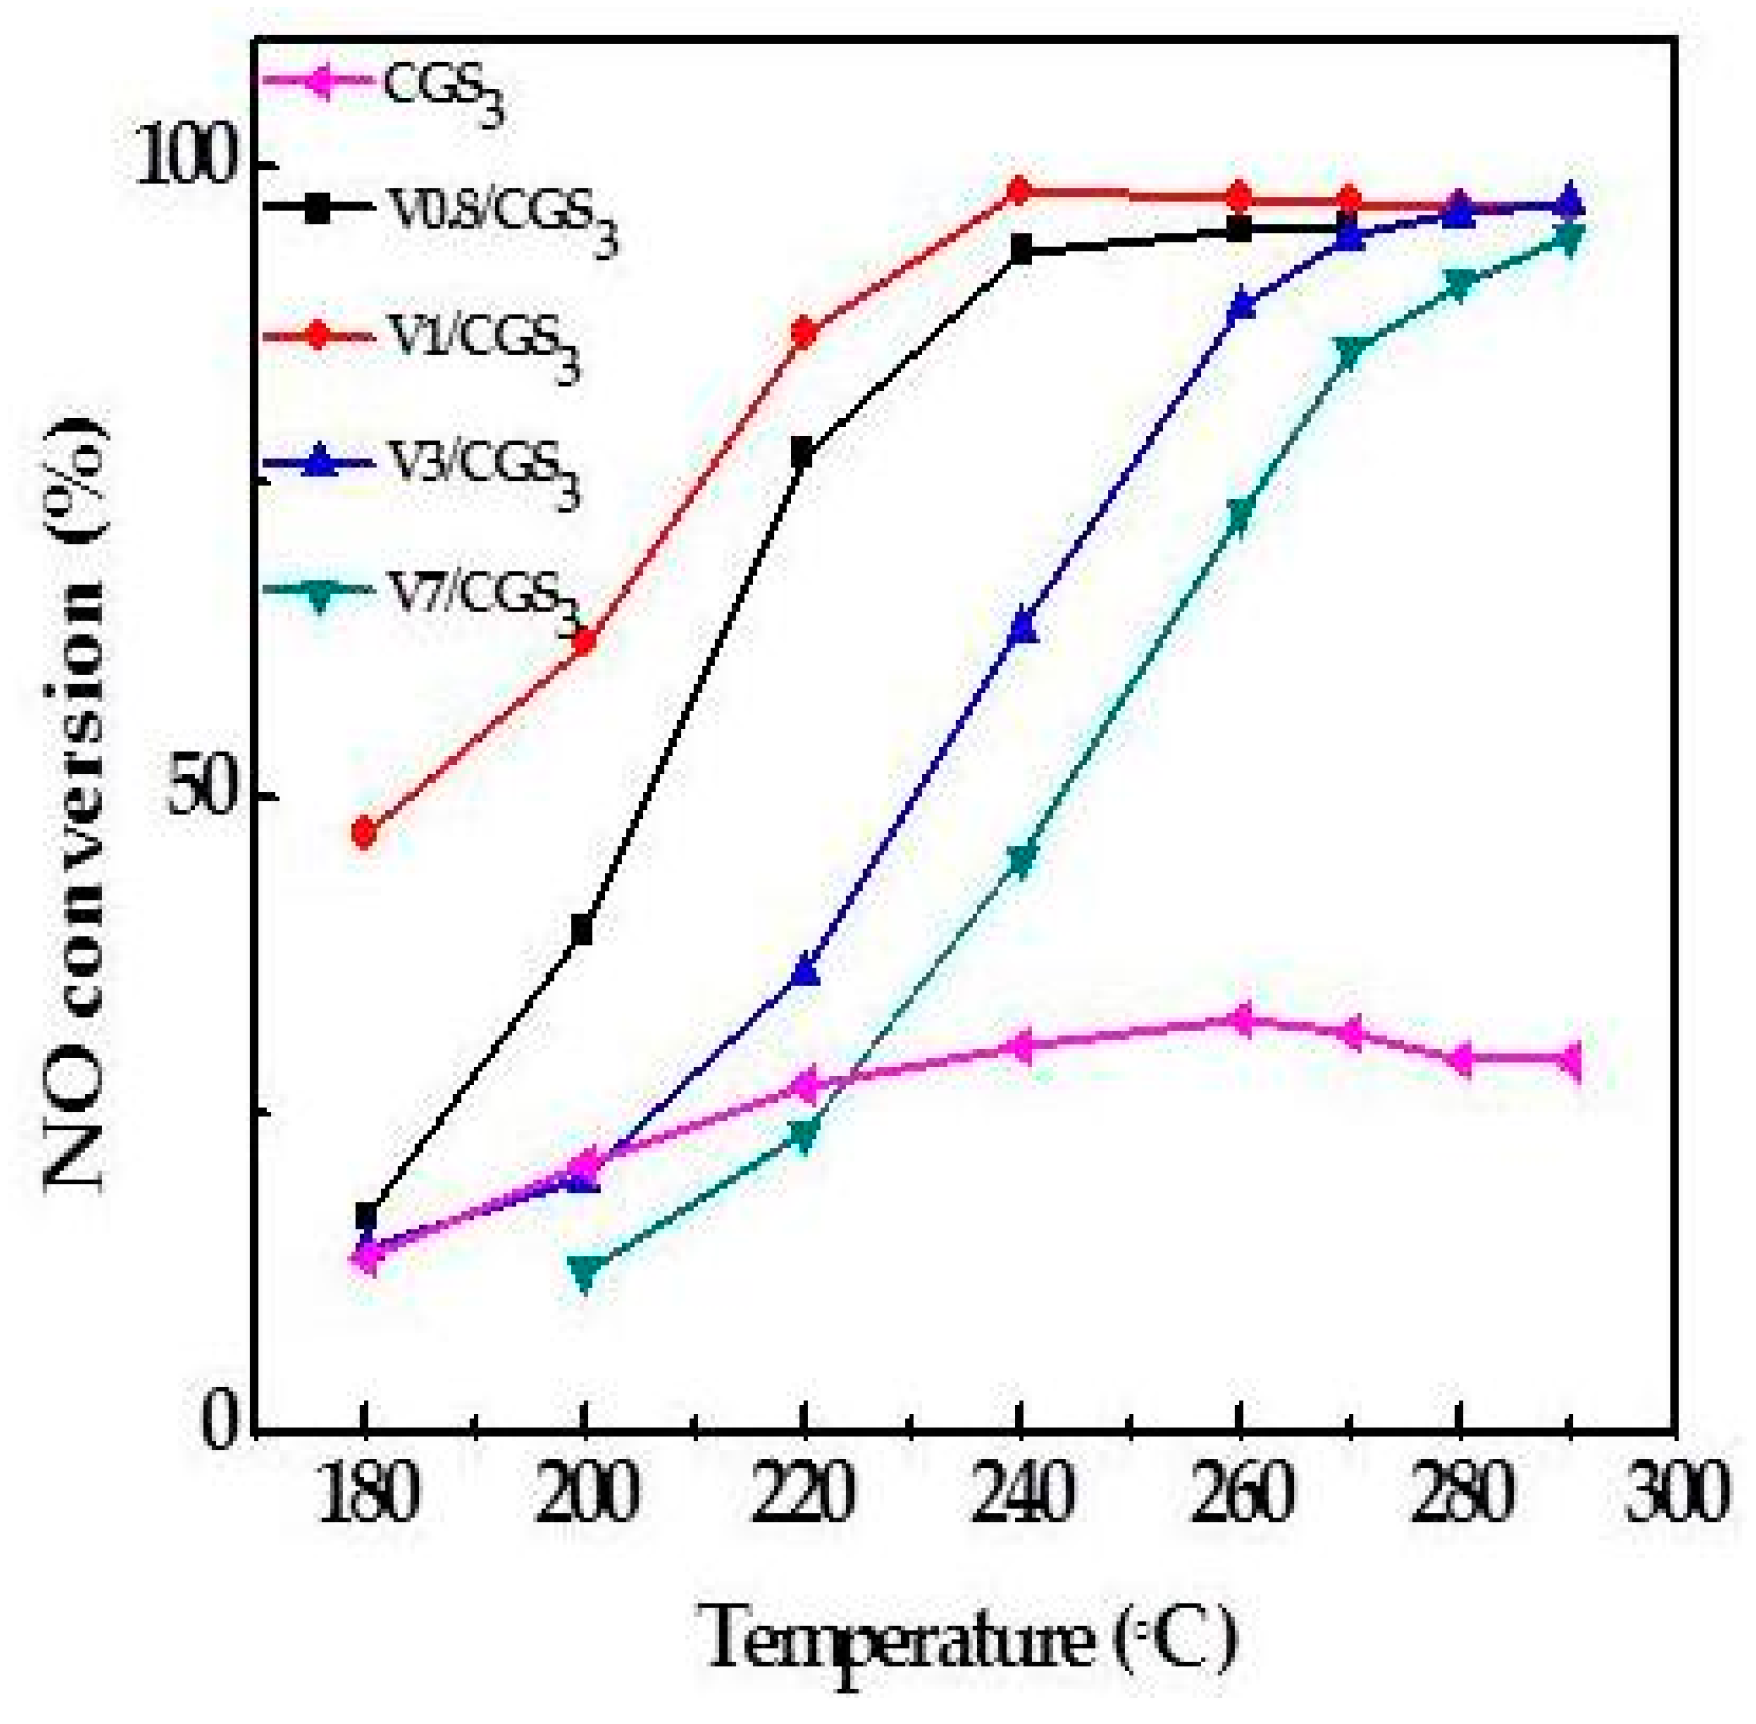
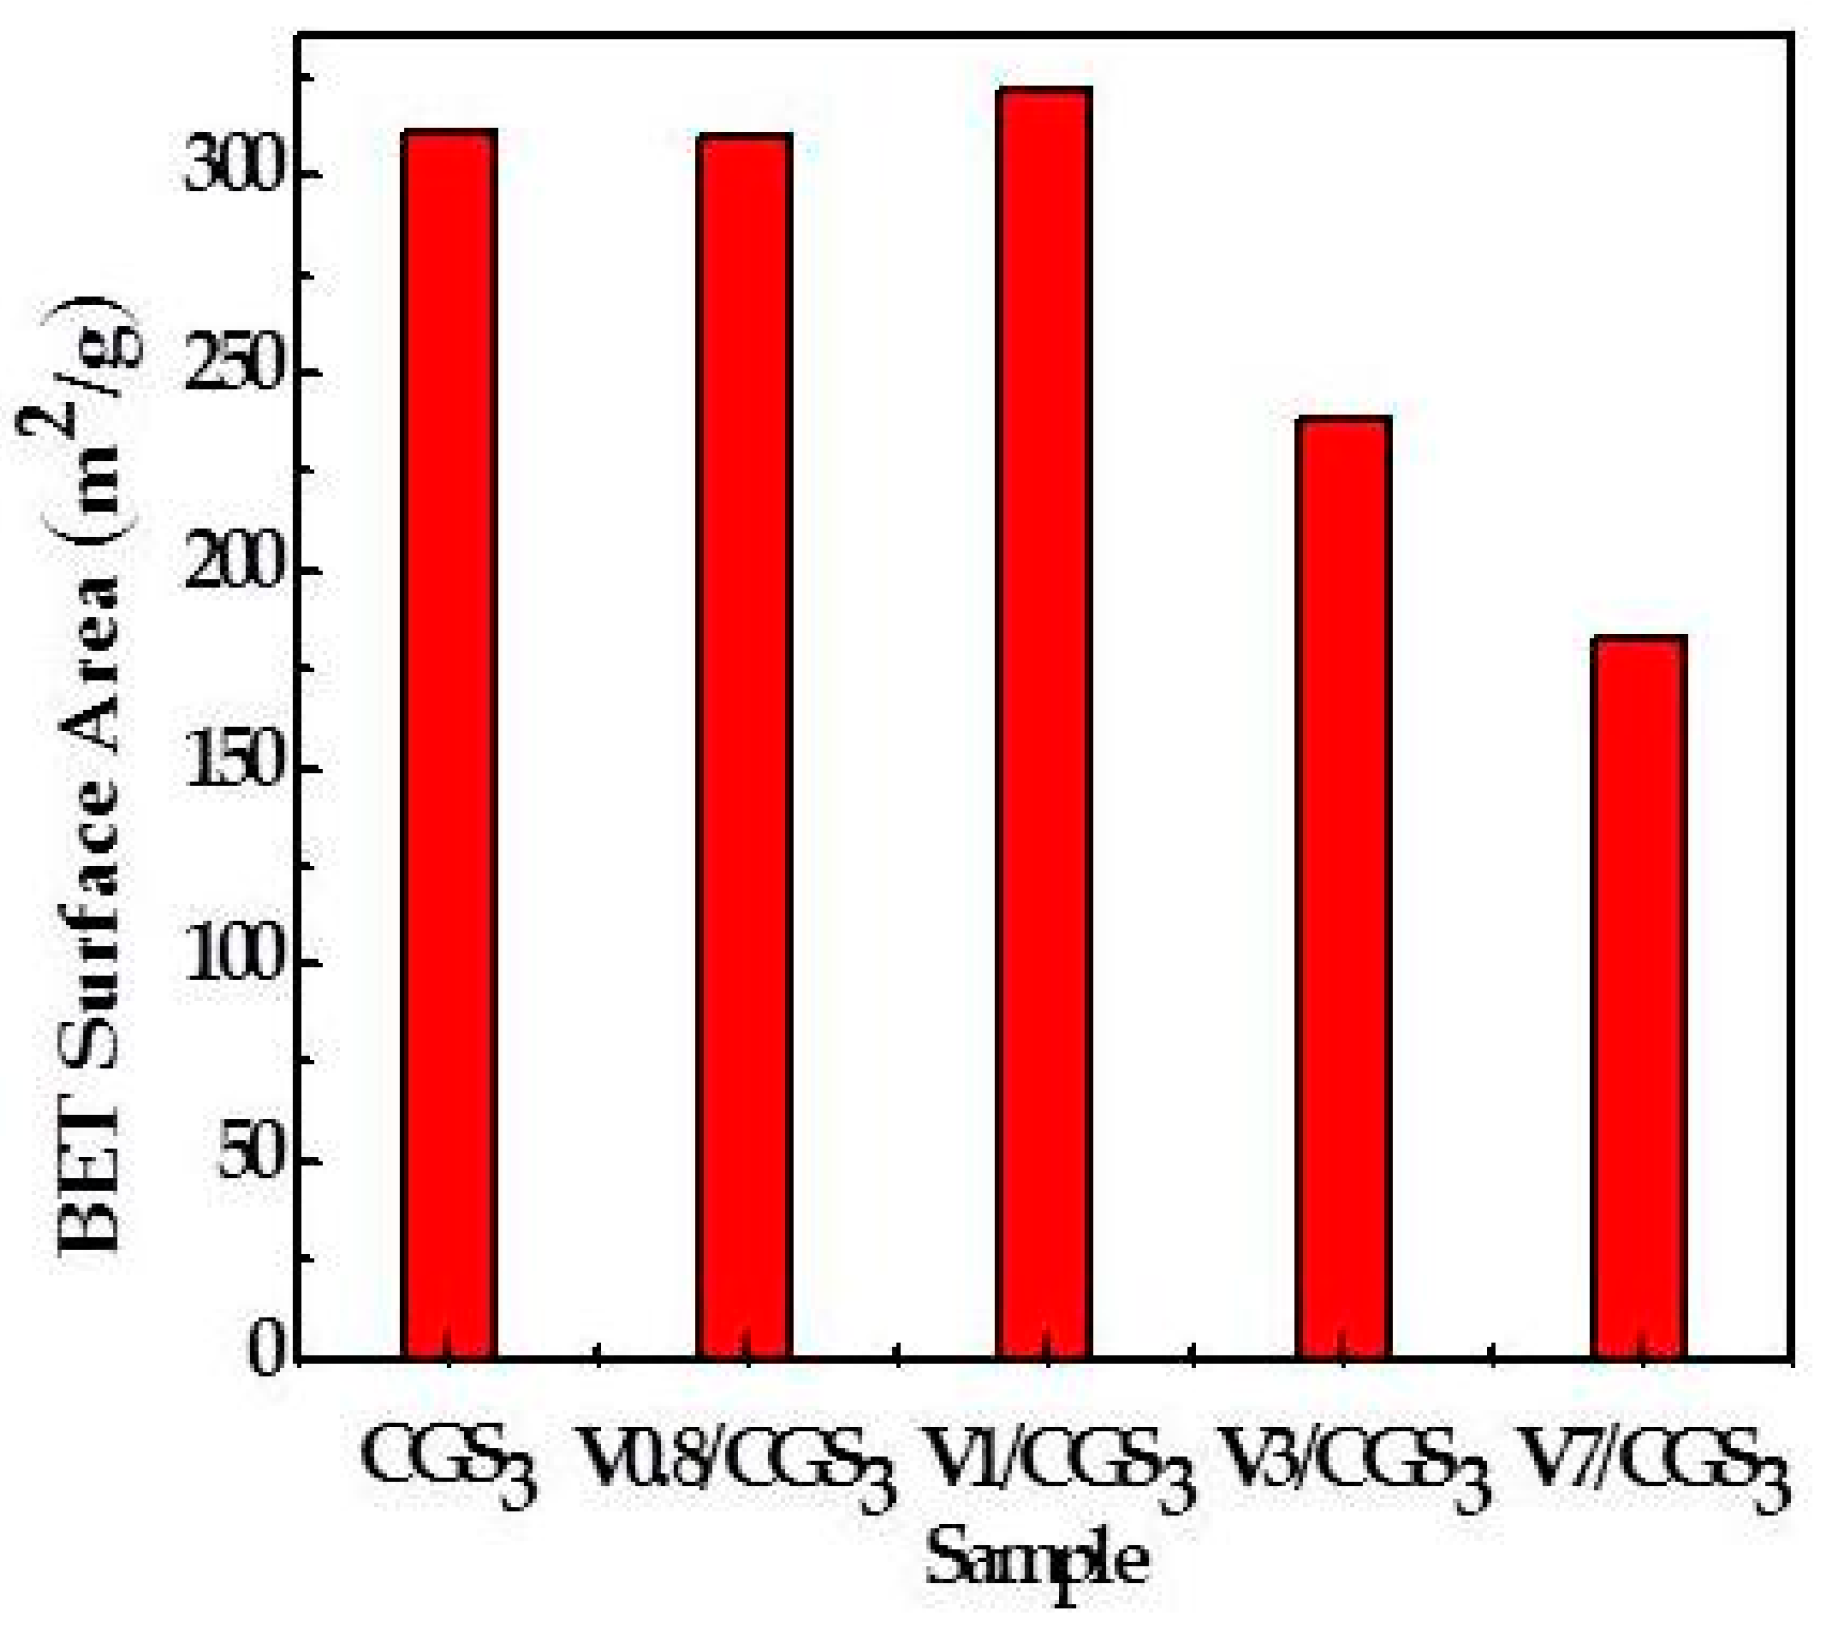
Figure 3 shows the NO conversion curves over CGS3 modified with different amounts of V2O5. Compared with the raw CGS3, the NO reduction efficiencies of the V/CGSs are observed to be higher. S. Hums et al. [16] agrees that V2O5 could be more active than other vanadium species such as vavadates or polivanadates. The CGS activities are quite low in the reaction temperature. After the temperature reached 260 °C, the NO conversion rate decreased. But, the activity of the catalyst changed greatly when adding vanadium to the CGS. These results indicate that V loading is crucial to the SCR reaction. Moreover, it can be observed that the V0.8/CGS3 catalyst activity is lower than that of the V1/CGS3 catalyst, which may be due to the difference in the amount of V on the carrier. Adding litter vanadium to the catalyst does not influence the activity. However, when the content of V2O5 continues to increase, the catalyst activity decreased remarkably. At a certain temperature, the NO conversions over the V1/CGS3 catalysts are in the following order of increasing: 7 wt%–3 wt%–1 wt%. It is possible that when the amount of V is lower, the vanadium active site on the catalyst surface is less. In addition, less SO2 is adsorbed on the surface and less ammonium sulfate is formed on the surface of the catalyst, thus the activity is higher. Huang Zhanggen et al. [17] showed that the V2O5/AC catalyst activity can be enhanced by the large specific surface area activated coke carrier, because of the NH3 adsorption and the dispersion of V2O5 on the catalyst. Figure 4 shows the Brunner-Emmet-Teller (BET) specific surface area of different samples, and it can be seen that the BET specific surface area of the V1/CGS3 catalyst is larger than the other catalysts. In addition, the specific surface area of the V1/CGS3 catalyst is slightly higher than that of the carrier. On the one hand, the difference is caused by the uneven distribution of CGS3 itself. On the other hand, the difference in data may be caused by certain experimental errors, such as the error of sampling and weighing the sample. Of course, the surface area was not the determining factor for the SCR activity. In a word, considering the effects of the V loading on the NO removal rate of the V/CGS3 catalyst, the suitable V loading is 1 wt%.
2.3. Effect of Atmosphere
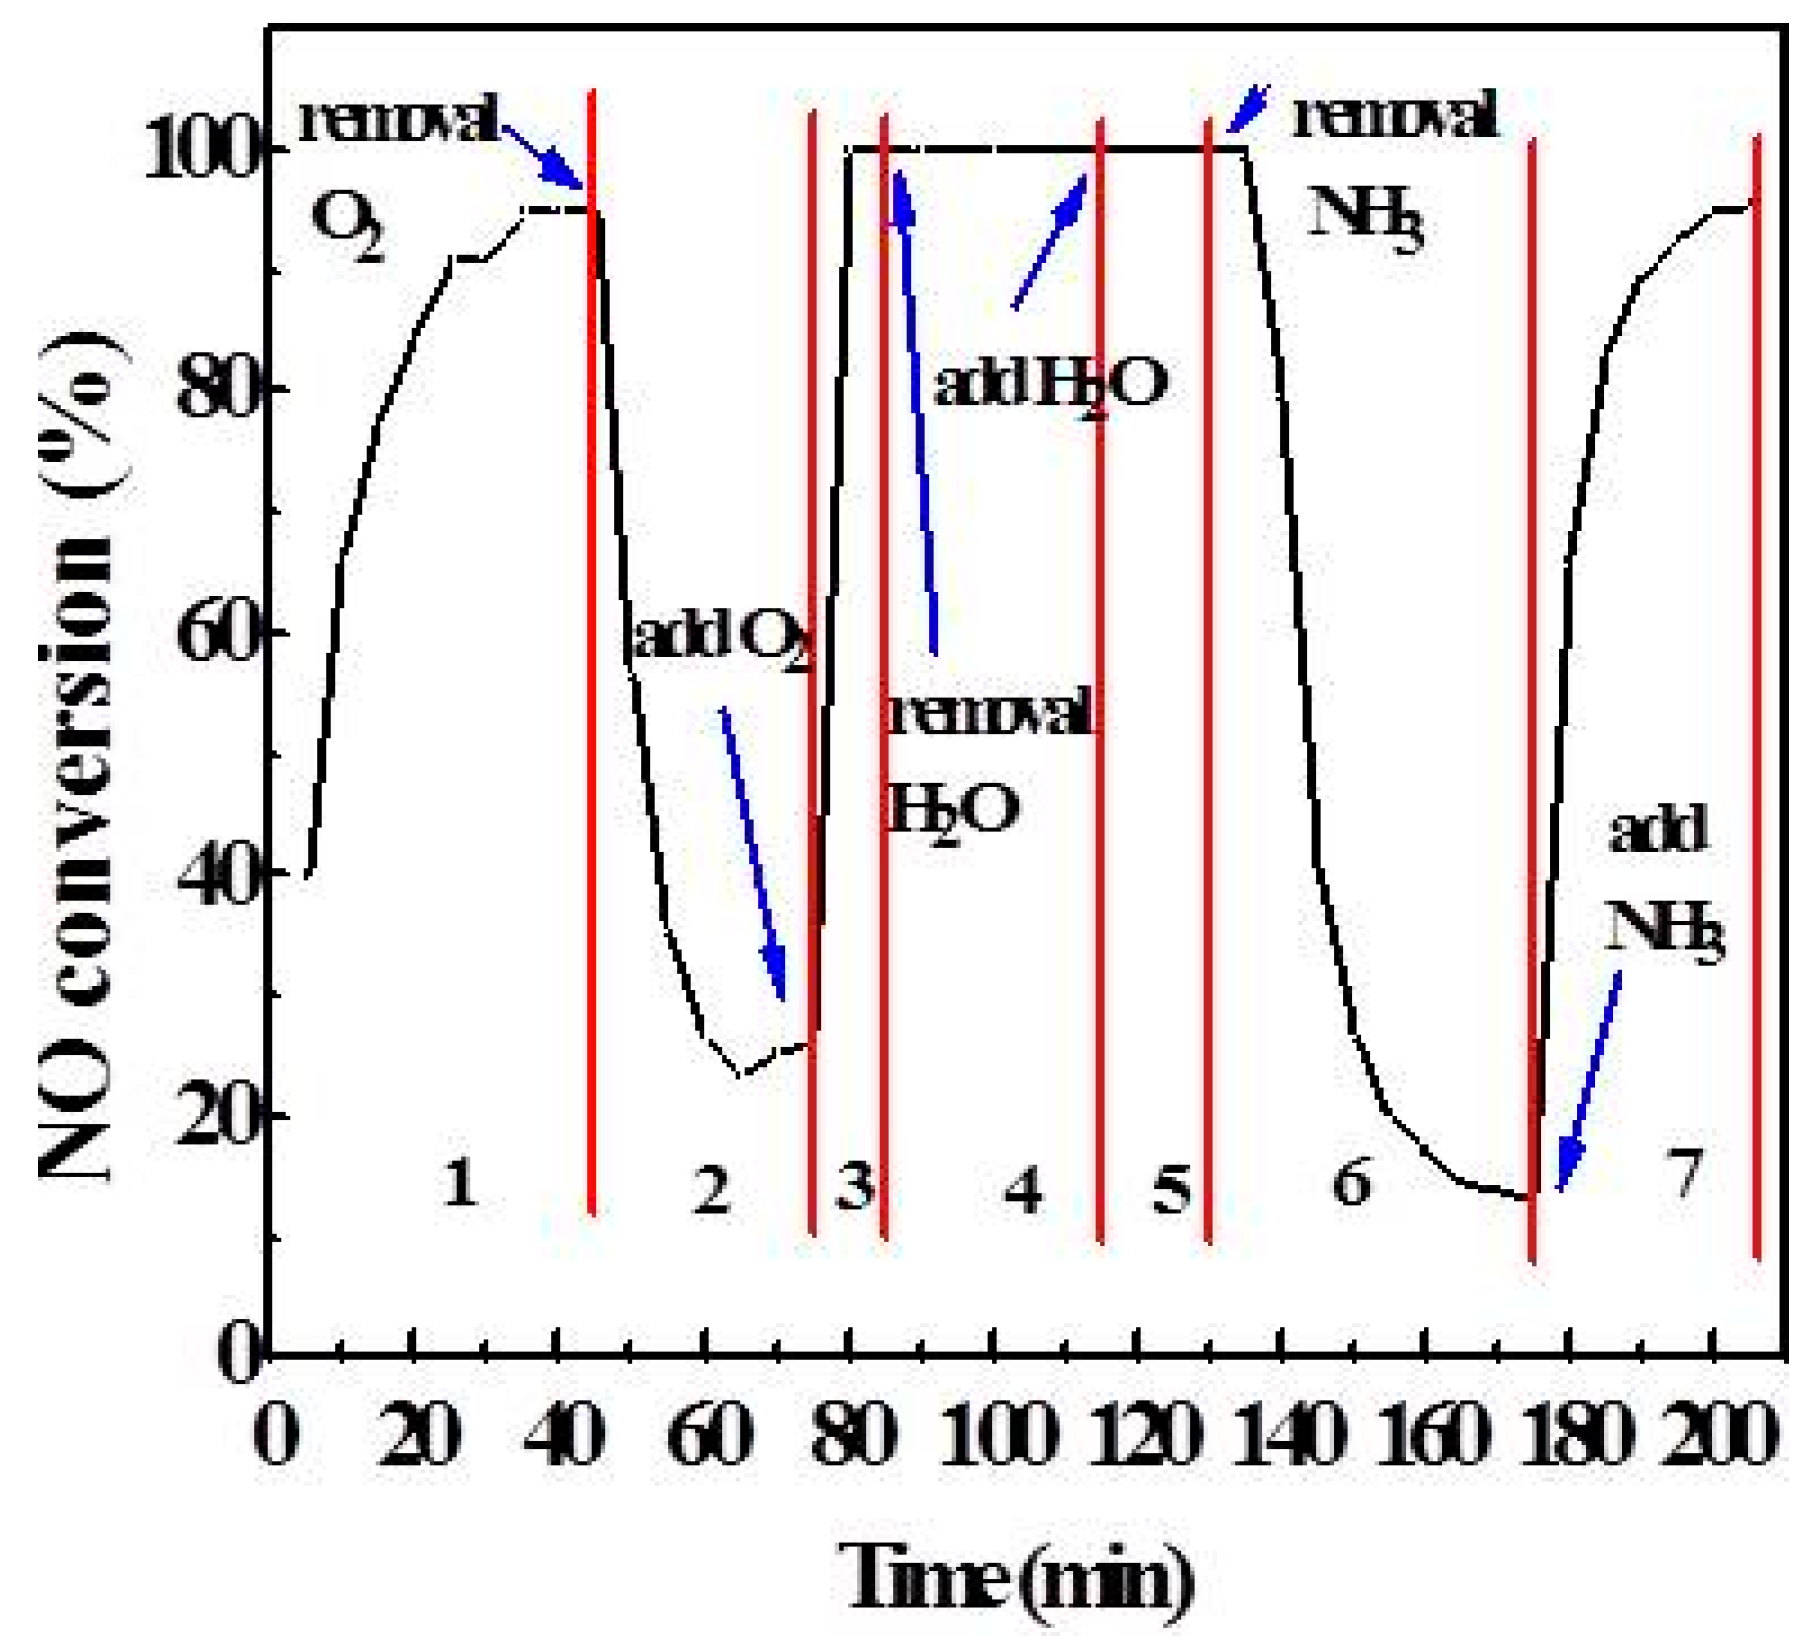
As is known to all, the content of O2 and H2O in flue gas is much higher than that of SO2 and NO, and the literature indicates that O2 and H2O have an effect on catalytic activity [1,18]. So, the effects of O2 and H2O on DeNOx activity were investigated using transient response technology, as shown in Figure 5. In stage one, the NO conversion stabilized at about 95% under all of the atmosphere conditions. But in stage two, when the O2 was cut off and N2 was added to keep the total flow rate unchanged, the NO conversion rate decreased sharply, indicating that the SCR reaction mainly consumed gaseous O2. In stage three, O2 was added to make the atmosphere composition the same as that in stage one, and the catalytic activity was quickly restored. The NO conversion of stage four (cutting off the water in the atmosphere) is basically the same as stage five (adding to water), maintaining 100%. It indicated that a smaller amount of H2O has no effect on catalytic activity at 260 °C, which is different from the conclusion that water will inhibit and poison the catalyst under the condition of SO2 [5,19,20,21]. In stage six, the NH3 was cut off, and N2 was added to keep the total flow rate unchanged. At this time, the NO conversion gradually decreased to 16%. After the recovery of NH3 in stage seven, the NO conversion increased rapidly to 95%. According to the phenomenon of stage six and stage seven, the main substance is the adsorptive NH3 involved in the SCR reaction. Hence, it can be seen that O2 and NH3 are crucial in the process of SCR.
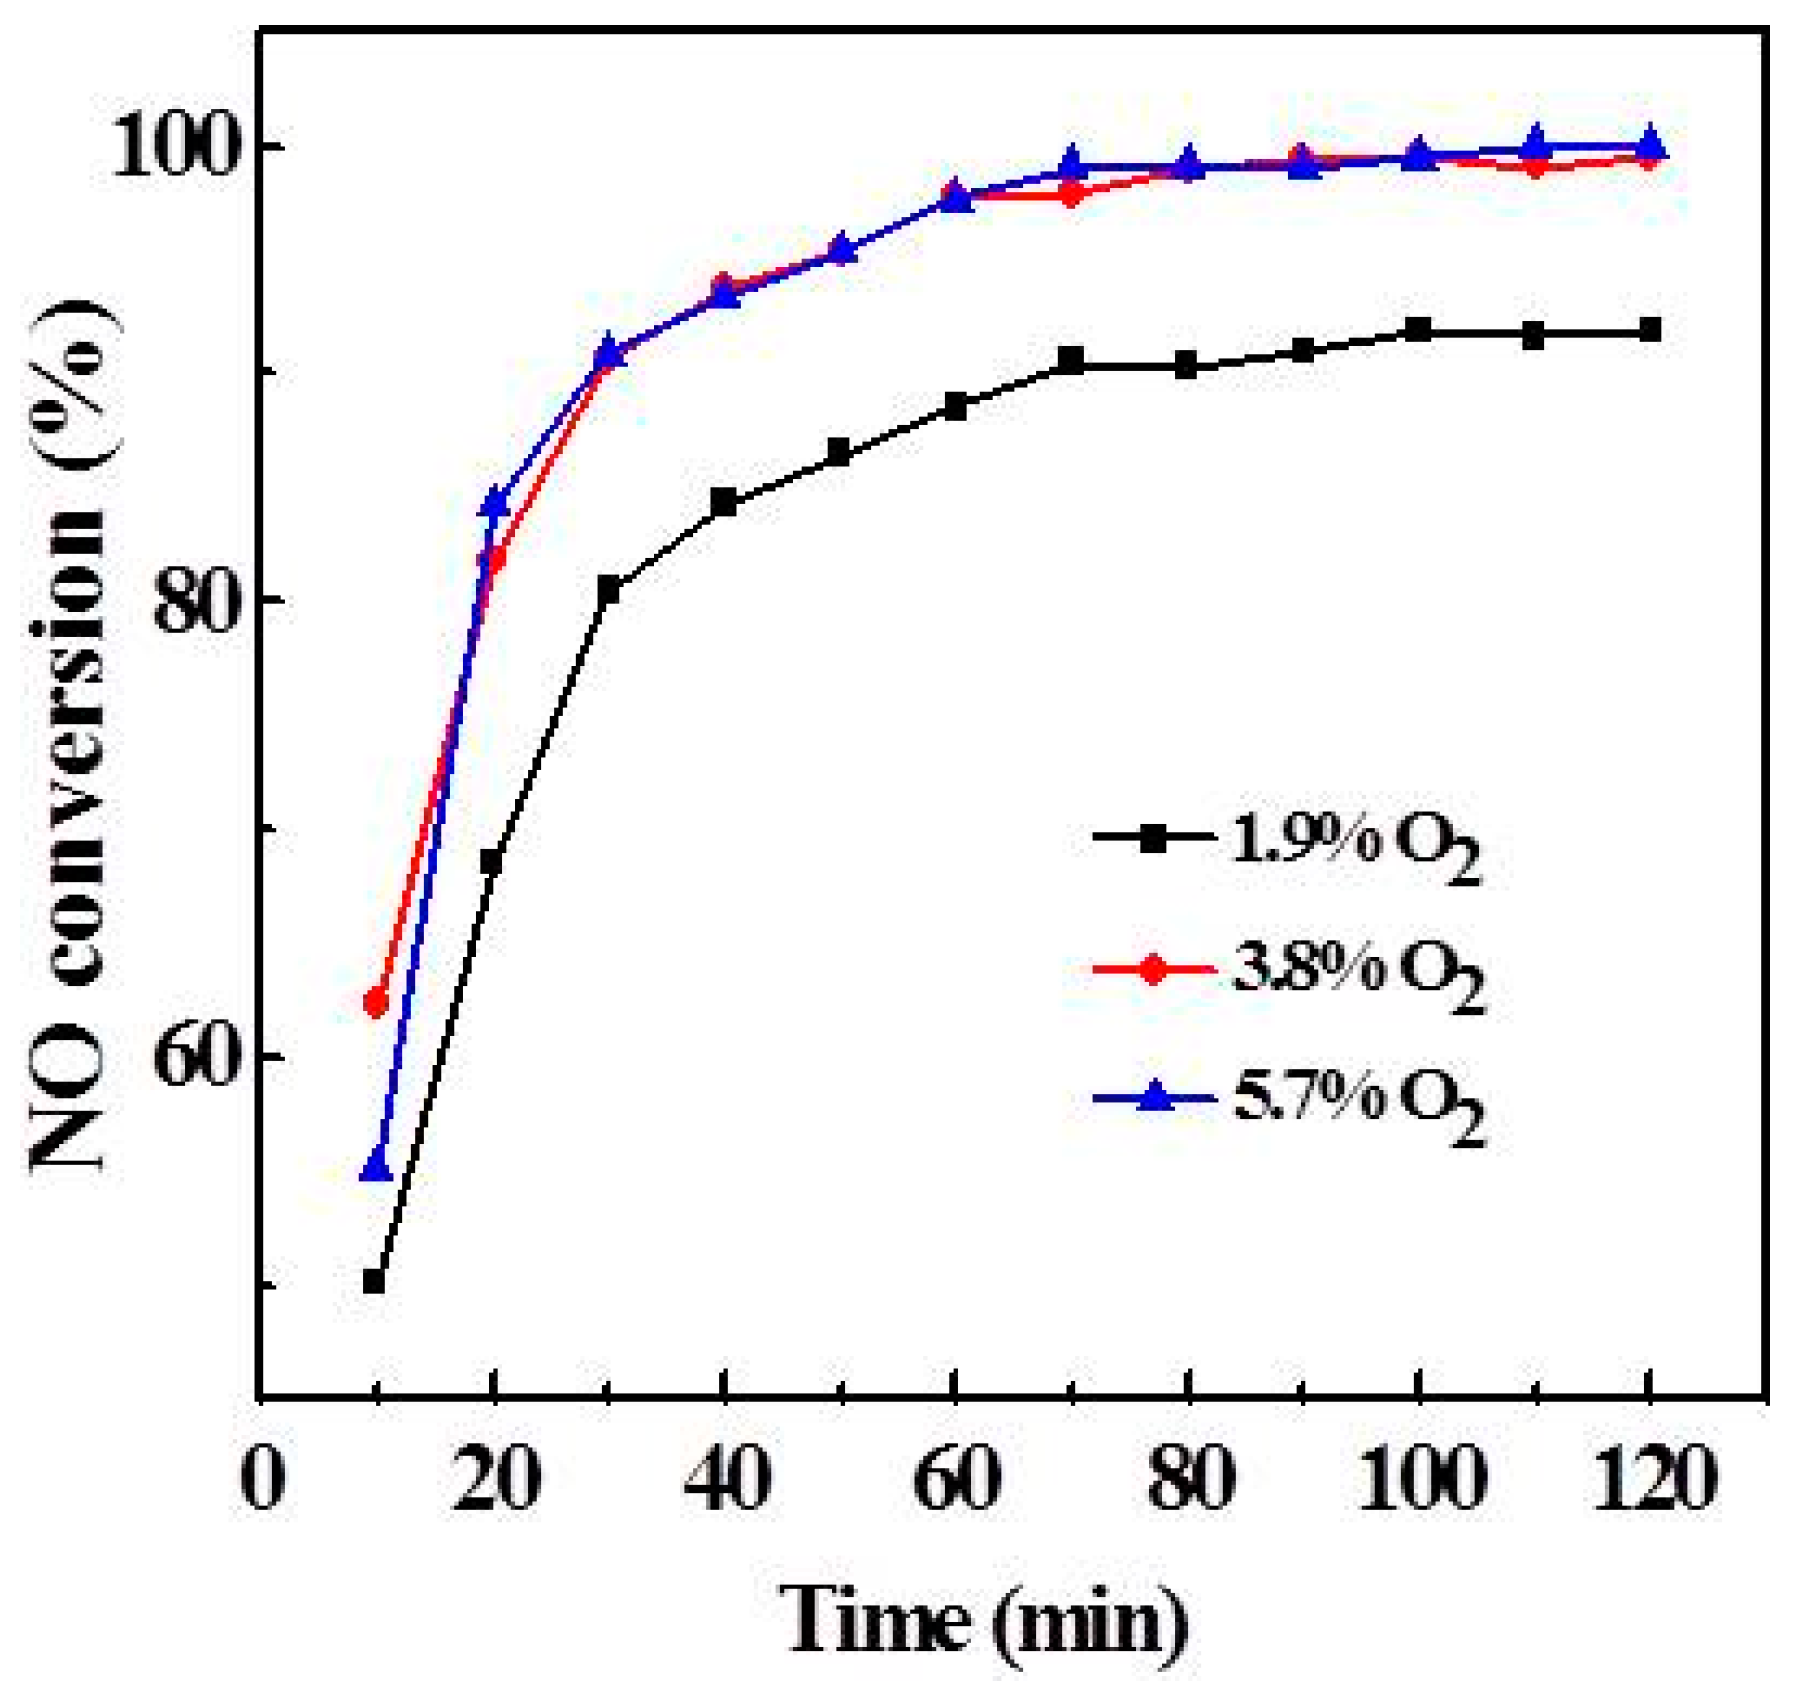
As can be seen from Figure 5, O2 is crucial in the NH3-SCR process, but how much O2 is required to ensure the reaction? Different concentrations of O2 were investigated, as shown in Figure 6. When the O2 content was 1.9%, the NO conversion was stable at about 90% after 60 min. When the O2 concentrations were 3.8% and 5.9%, respectively, the NO conversion curves basically coincided, indicating that the activity did not change with the O2 concentration during the NH3-SCR process. Therefore, the oxygen content under the experimental conditions is sufficient for the SCR reaction.
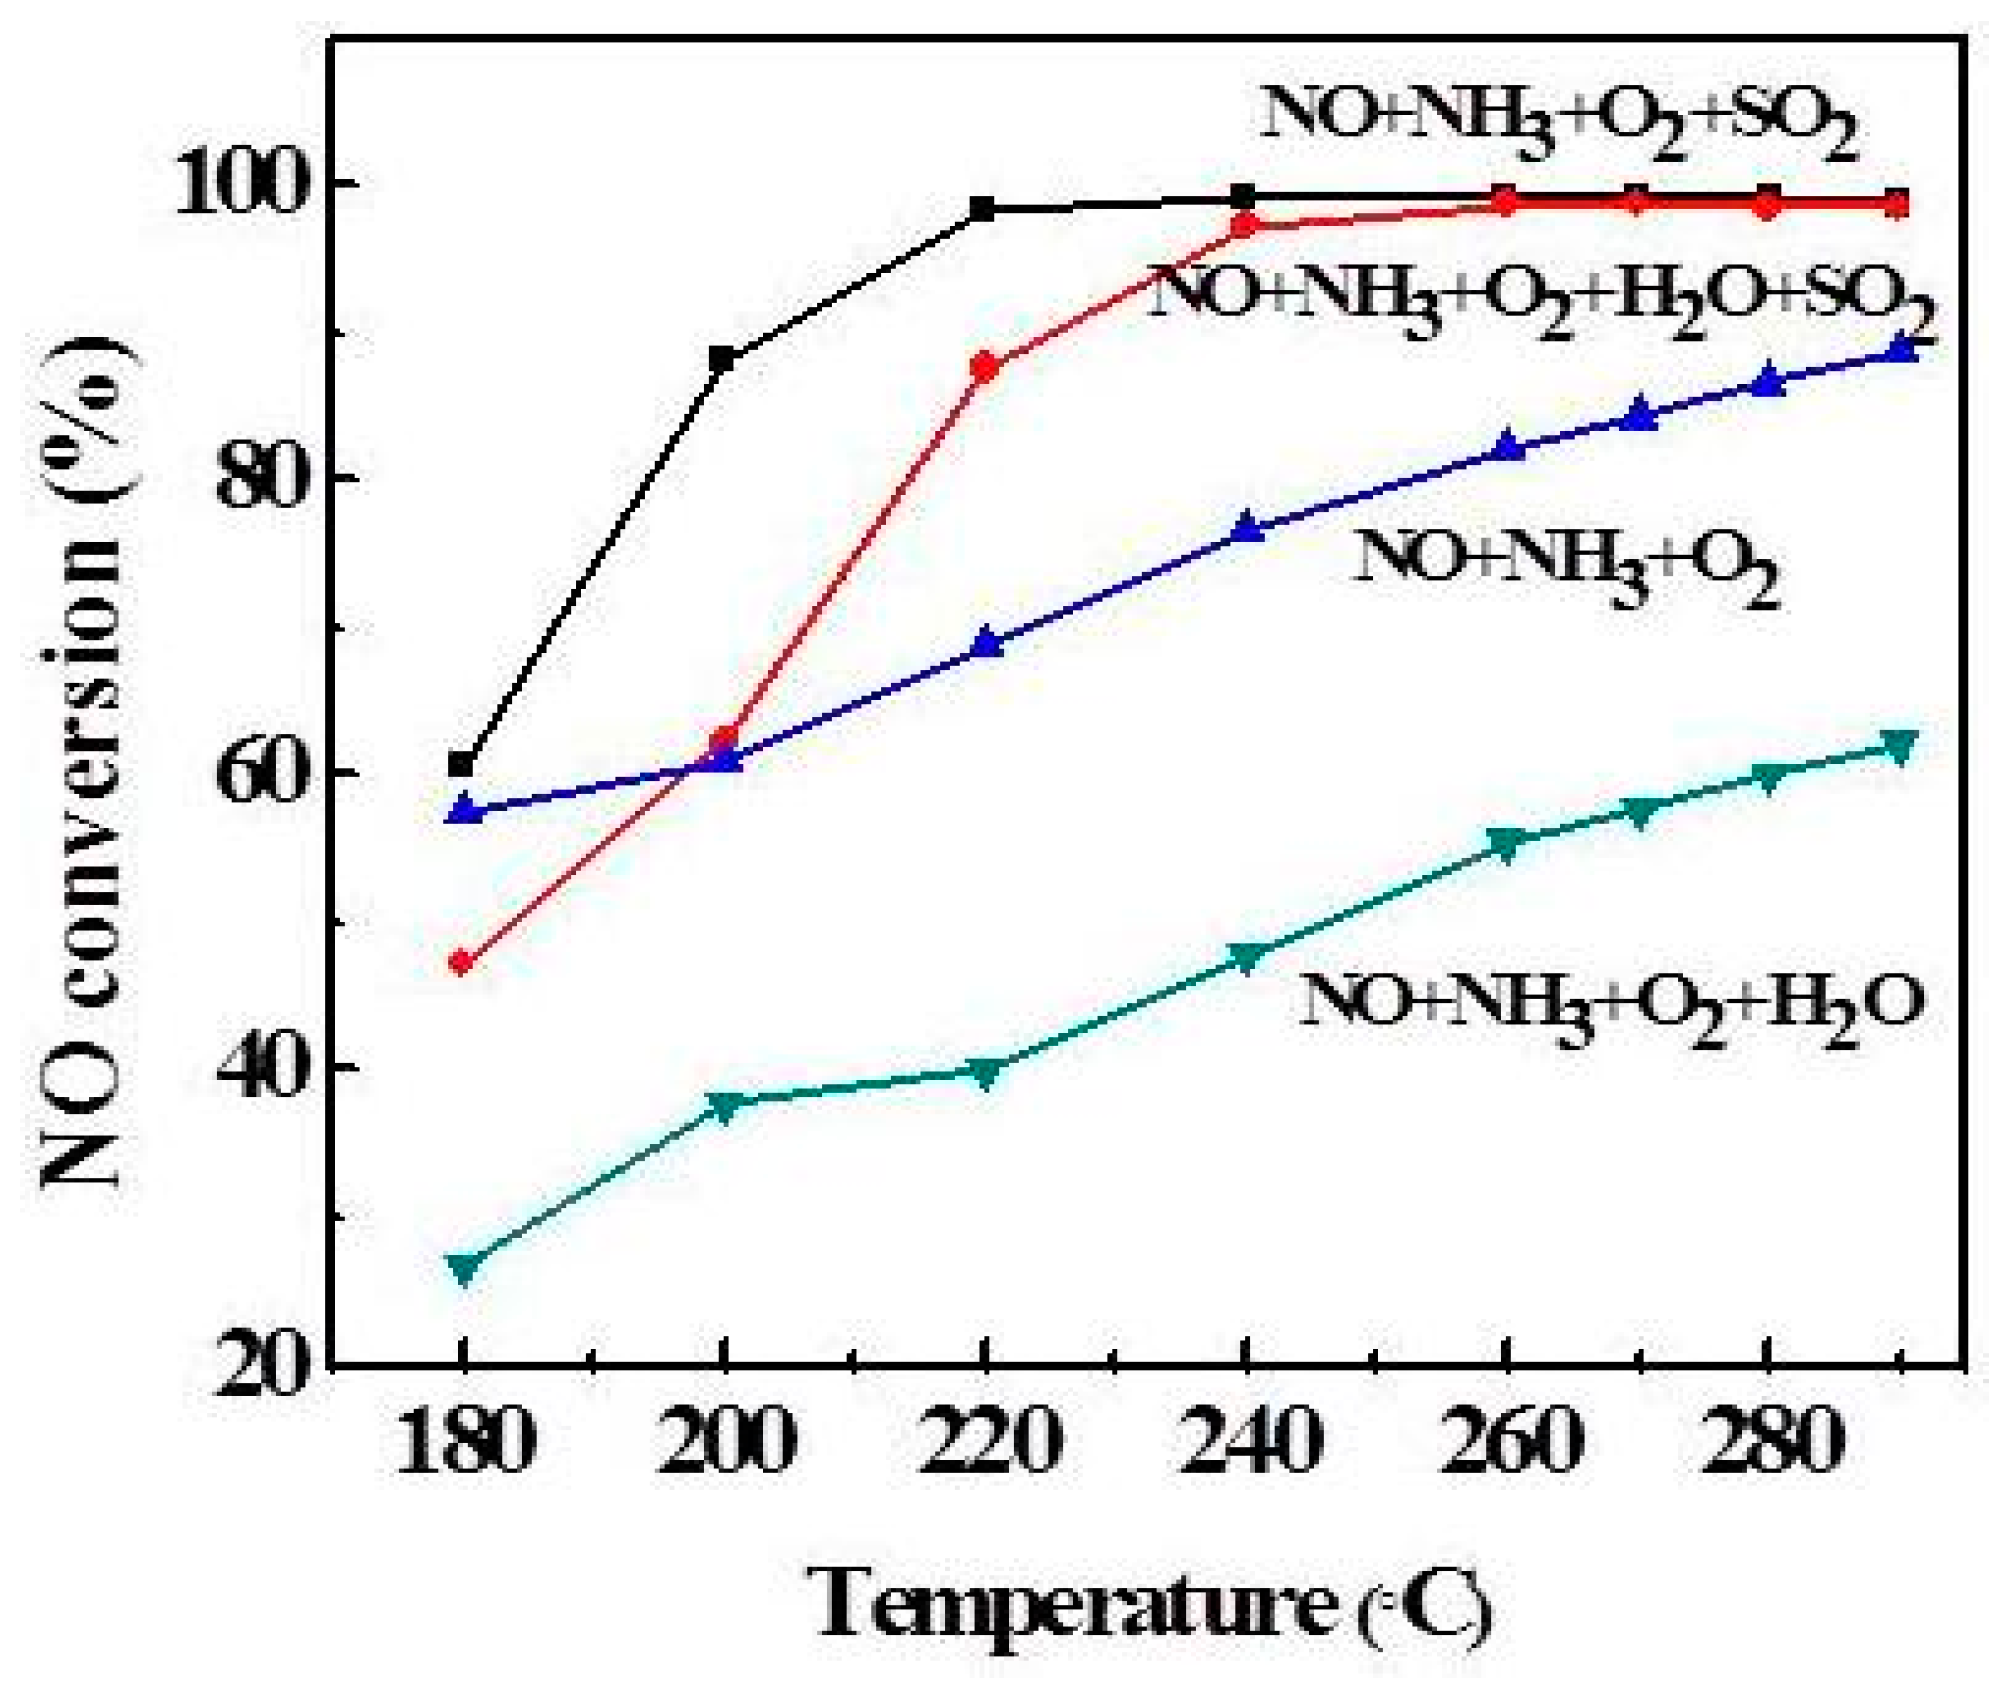
Transient response experiments revealed that H2O had no significant effect on the activity at 260 °C. To further explore the effect of H2O and SO2 on the DeNOx activity, a temperature-programming experiment was designed. The results are shown in Figure 7. When H2O was added to the reactant gas, the NO conversion rose slowly and eventually reached 60%, while over 60% was reached in absence of H2O. This phenomenon is well documented in the literature on Mn-based catalysts [22] as a result of the competitive adsorption of H2O and NH3. Moreover, it also can be seen from Figure 7 that the NO conversion is the best in the presence of SO2, reaching 100% at 240–290 °C. This result agrees with the XPS analysis, where the SO2 promotion was attributed to the formation of SO42− on the catalyst surface, which increased the NH3 adsorption and promoted the NH3 reaction with NO. However, the NO conversion decreased sharply when the reaction temperature is lower than 220 °C in the presence of SO2 and H2O. Zhu et al. [10] has reported that there was higher activity over the V2O5/AC catalyst when SO2 was present in the reactant gas mixture. They believe that the reason is the formation of sulphate species on the catalyst surface. In summary, catalytic activity was promoted by SO2. The possible reason is that V2O5 provides the adsorption and oxidation sites for SO2, and increases the acidity, thus promoting the catalyst activity.
2.4. Effect of Reaction Temperature
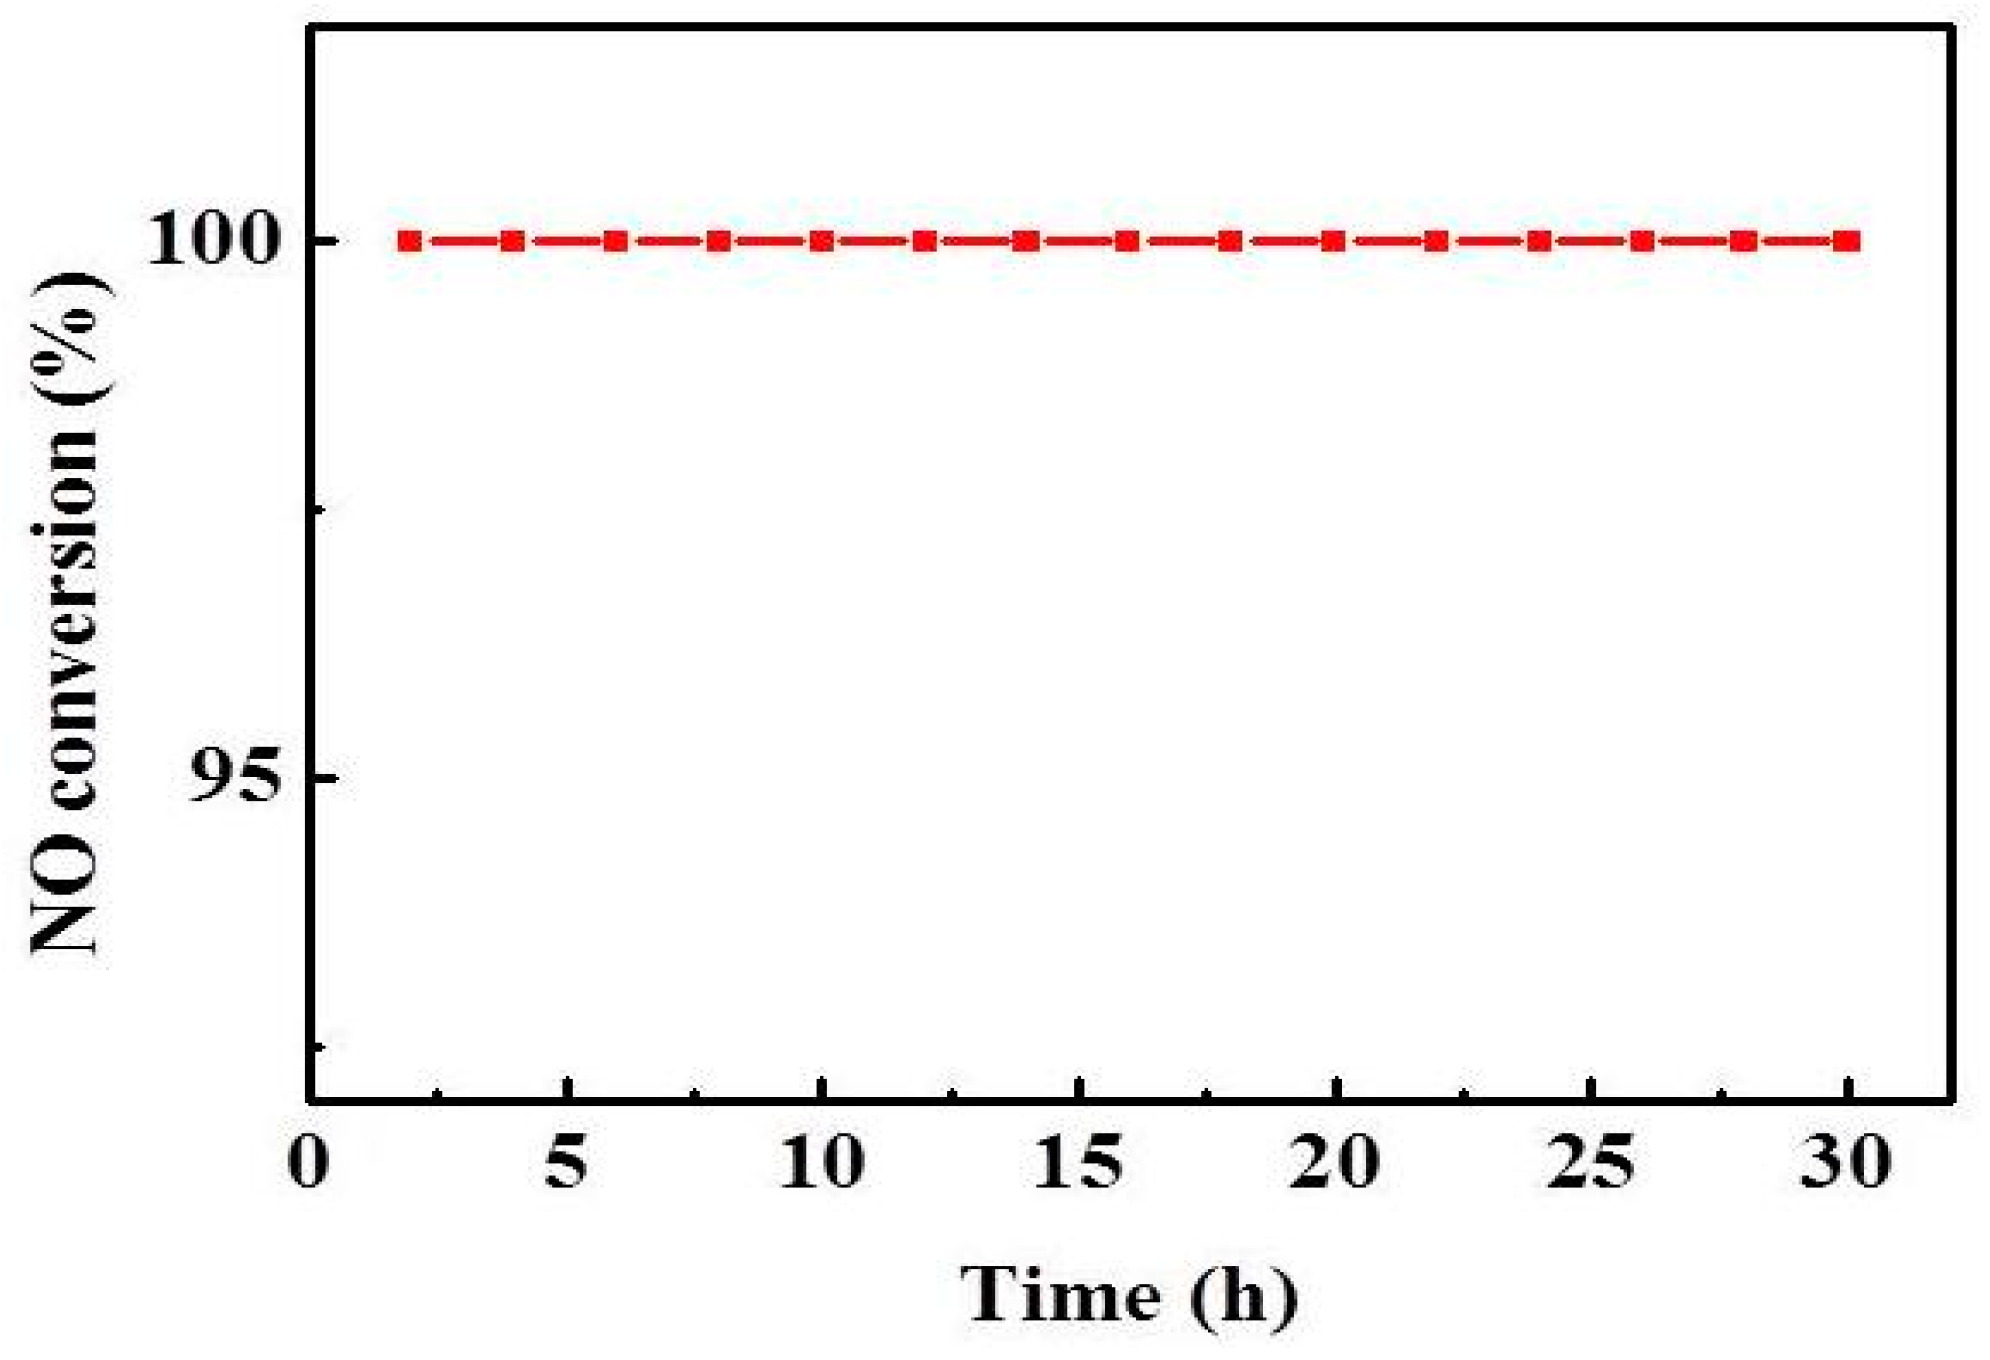
As shown in Figure 3, 240–290 °C is the optimum temperature for the catalyst, and the NO conversion increases with the increasing reaction temperature, and the NO conversion is up to 95% at 240 °C. The effect of temperature on the SCR activity is that the increase of temperature will increase the thermal reaction of the molecules, and more molecules will reach the activated state, thereby improving the NO conversion. Moreover, the stability of the V1/CGS3 catalyst experiment was investigated, as shown in Figure 8. The results showed that the NO conversion was maintained at 100% within 30 h of continuous testing at 260 °C. It shows that the catalyst exhibits a better stability.
2.5. The Physical Properties of CGS
When the V/CGS catalyst is used for the reduction of NO by NH3, the catalytic activity is affected by the specific surface area of the carrier. For this purpose, three different gasification slags were selected to prepare the V1/CGS catalyst, so as to select the best active gasification residue carrier. The surface area and pore structure of the catalysts are listed in Table 1. It can be seen that the BET surface areas and mesopore volumes of CGS3 are between the CGS1 and CGS2 carrier, but its micro-pore area is higher than the other two CGSs, by up to 111 m2/g. It can be seen that after loading vanadium, the BET areas and micro-pore volumes of the catalysts are increased slightly. According to the literature, the conversion rate of NO can be improved to a certain extent by micropore and mesoporous; the micro-pores were conducive to the dispersion of the active component and the mesopores ensured that the reactants can enter to the interior of the AC [23,24]. In the study, the addition of vanadium to the CGS catalyst led to new micro-pores and mesopores, thus improving the NO conversion (shown in Figure 3). Moreover, after the reaction, the BET surface areas and micropore volumes of V1/CGS3 decreased significantly. The results suggested that the ammonium sulfate salts or H2SO4 may have formed during the SCR reaction, or indicated that a large amount of material was generated in the reaction, blocking the channel [25].
Table 2 presents the ash analyses of the CGSs’ catalyst. The samples were calcined at a high temperature and then digested with concentrated acid. Finally, the element analysis was carried out using ICP. There are mainly SiO2, CaO, Fe2O3, and Al2O3 in the ash. SiO2 is often taken as a catalyst support, and it is advantageous for the SCR reaction. Of course, Al2O3 has been widely used as a carrier in the field of catalysis because of its pore structure, surface acidity, and other properties [26,27]. It has been reported that CaO can deactivate the SCR catalyst because it interacts with the active component V2O5, thereby reducing the acidity and reducibility of the catalyst surface [28,29]. However, CaO has a certain desulfurization activity. Ma et al. [30] used activated coke, prepared from semicoke through steam, to support Ca for the flue gas SO2 removal. Ca/AC showed a high SO2 removal capacity. Moreover, Fe2O3 is taken as a support for removing Hg. For example, Yang et al. [31] used Mn/γ-Fe2O3 magnetic adsorbents to remove the elemental mercury from the flue gas. In the present study, Fe2O3 has a slight effect on the SCR reaction. Moreover, Li et al. [32] reported that although the total contents of the ashes in the ACs were equal to or higher than the V2O5 loadings in the catalysts, the ashes cannot interfere with the catalytic activity of V2O5. In a word, it can be seen from Table 2 that the ash content of CGS3 is less than that of other gasification slags, indicating that its carbon skeleton structure plays a major role and provides a specific surface area and pores.
2.6. Thermo Gravimetric (TG) and Derivative Thermo Gravimetric (DTG
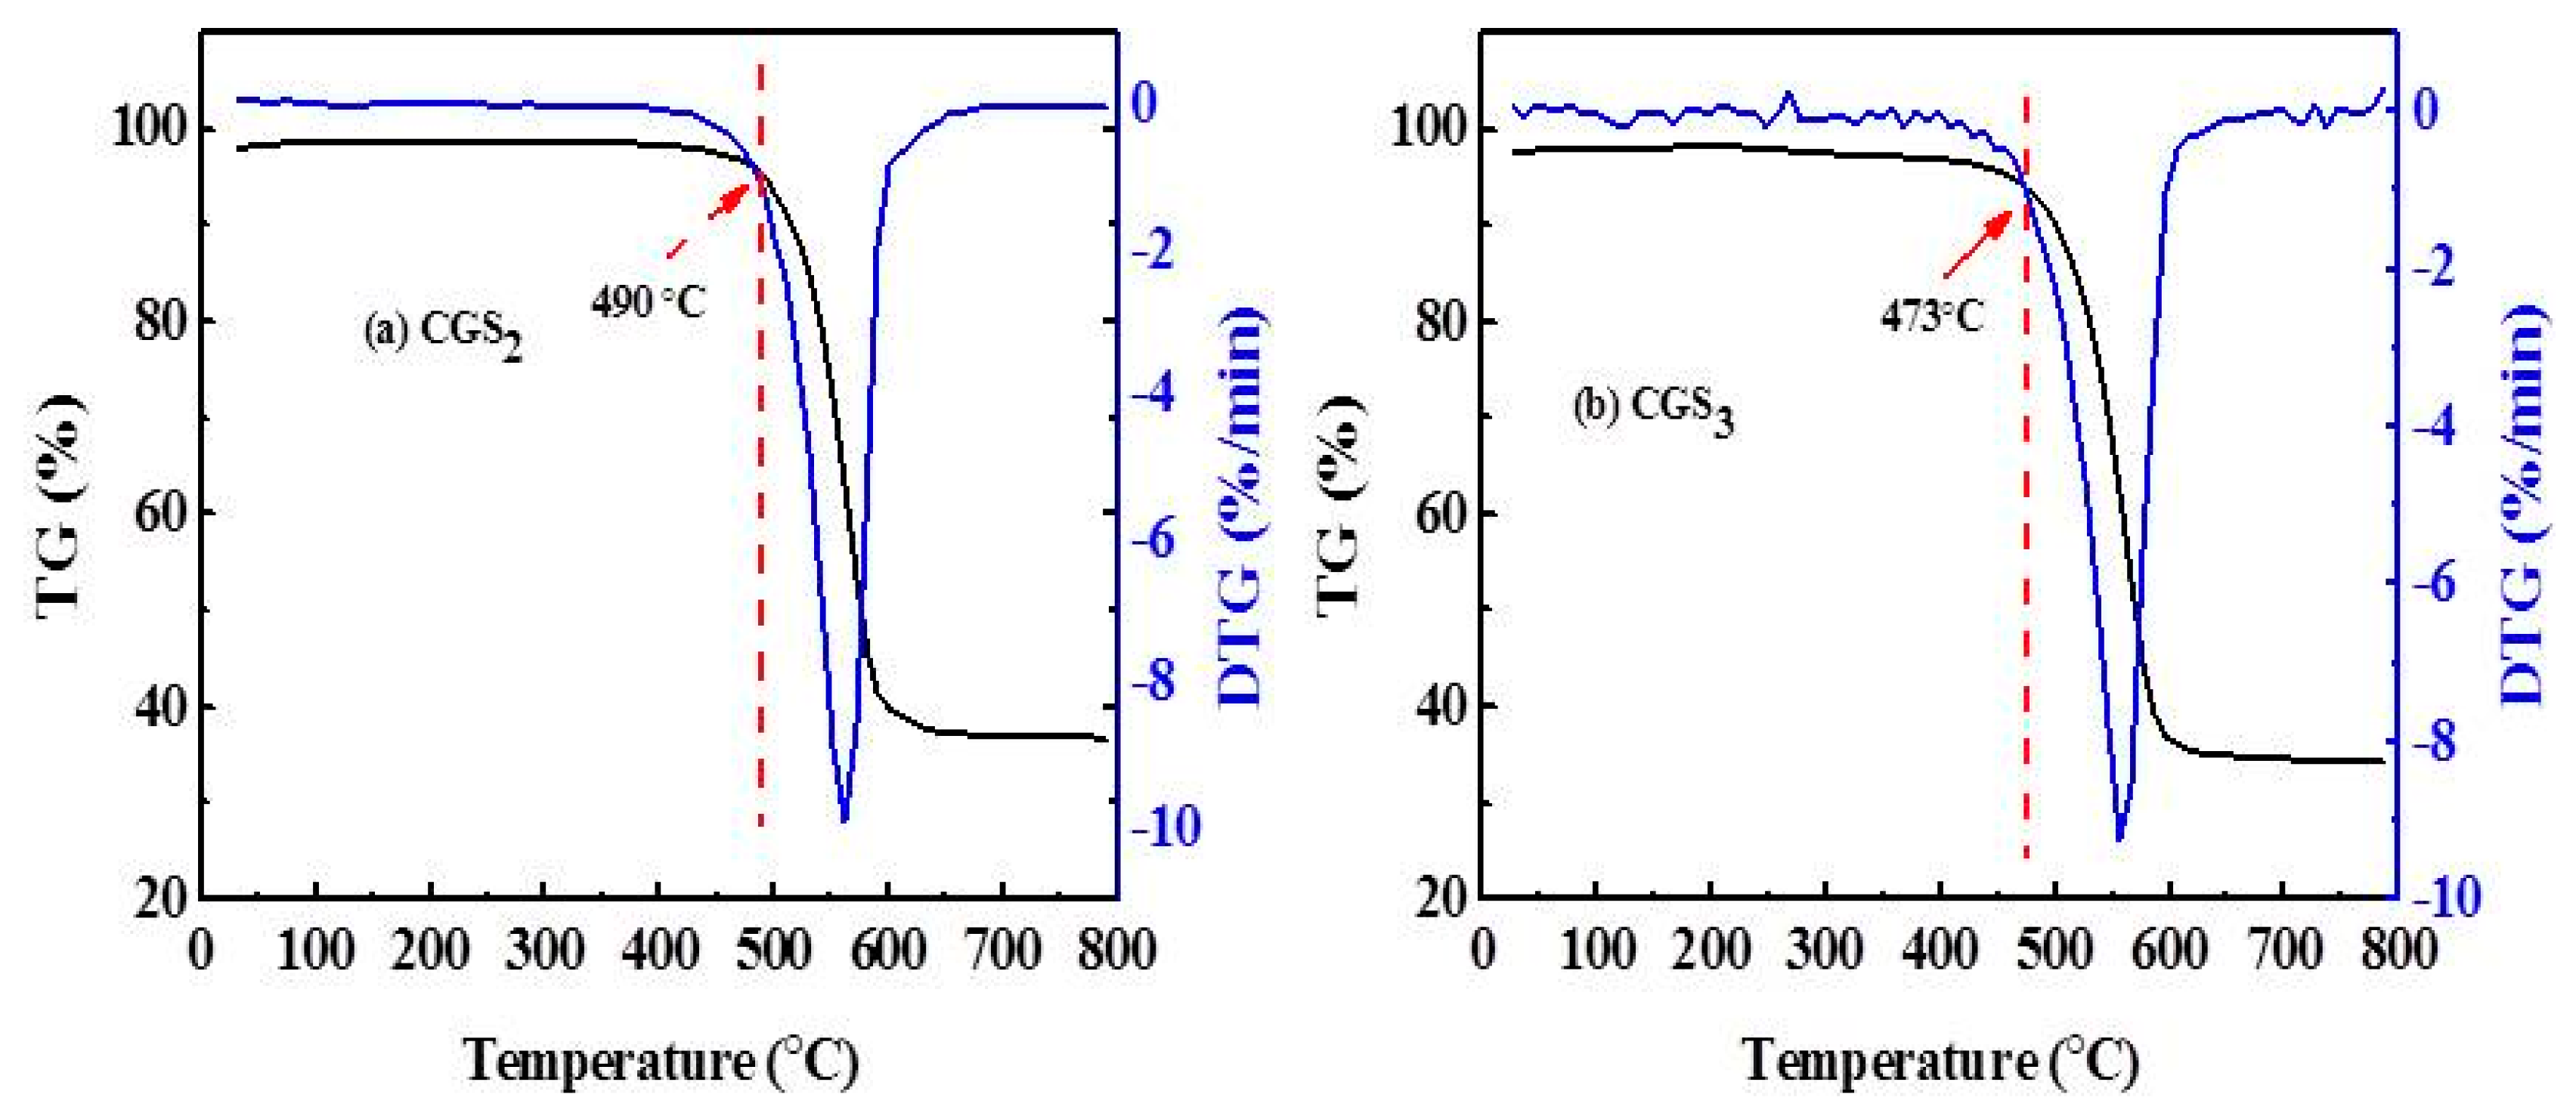
As Figure 9 shows, it was obvious that the mass of the CGSs began to significantly decline at 470 °C, and the weight losses of the CGSs were different, for which CGS2 was 50% and CGS3 was 54%. The departure of the water molecules and hydration may be responsible for this phenomenon. In a word, it can also indicate that the gasification slag has a certain stability under the experimental temperature.
2.7. XRD
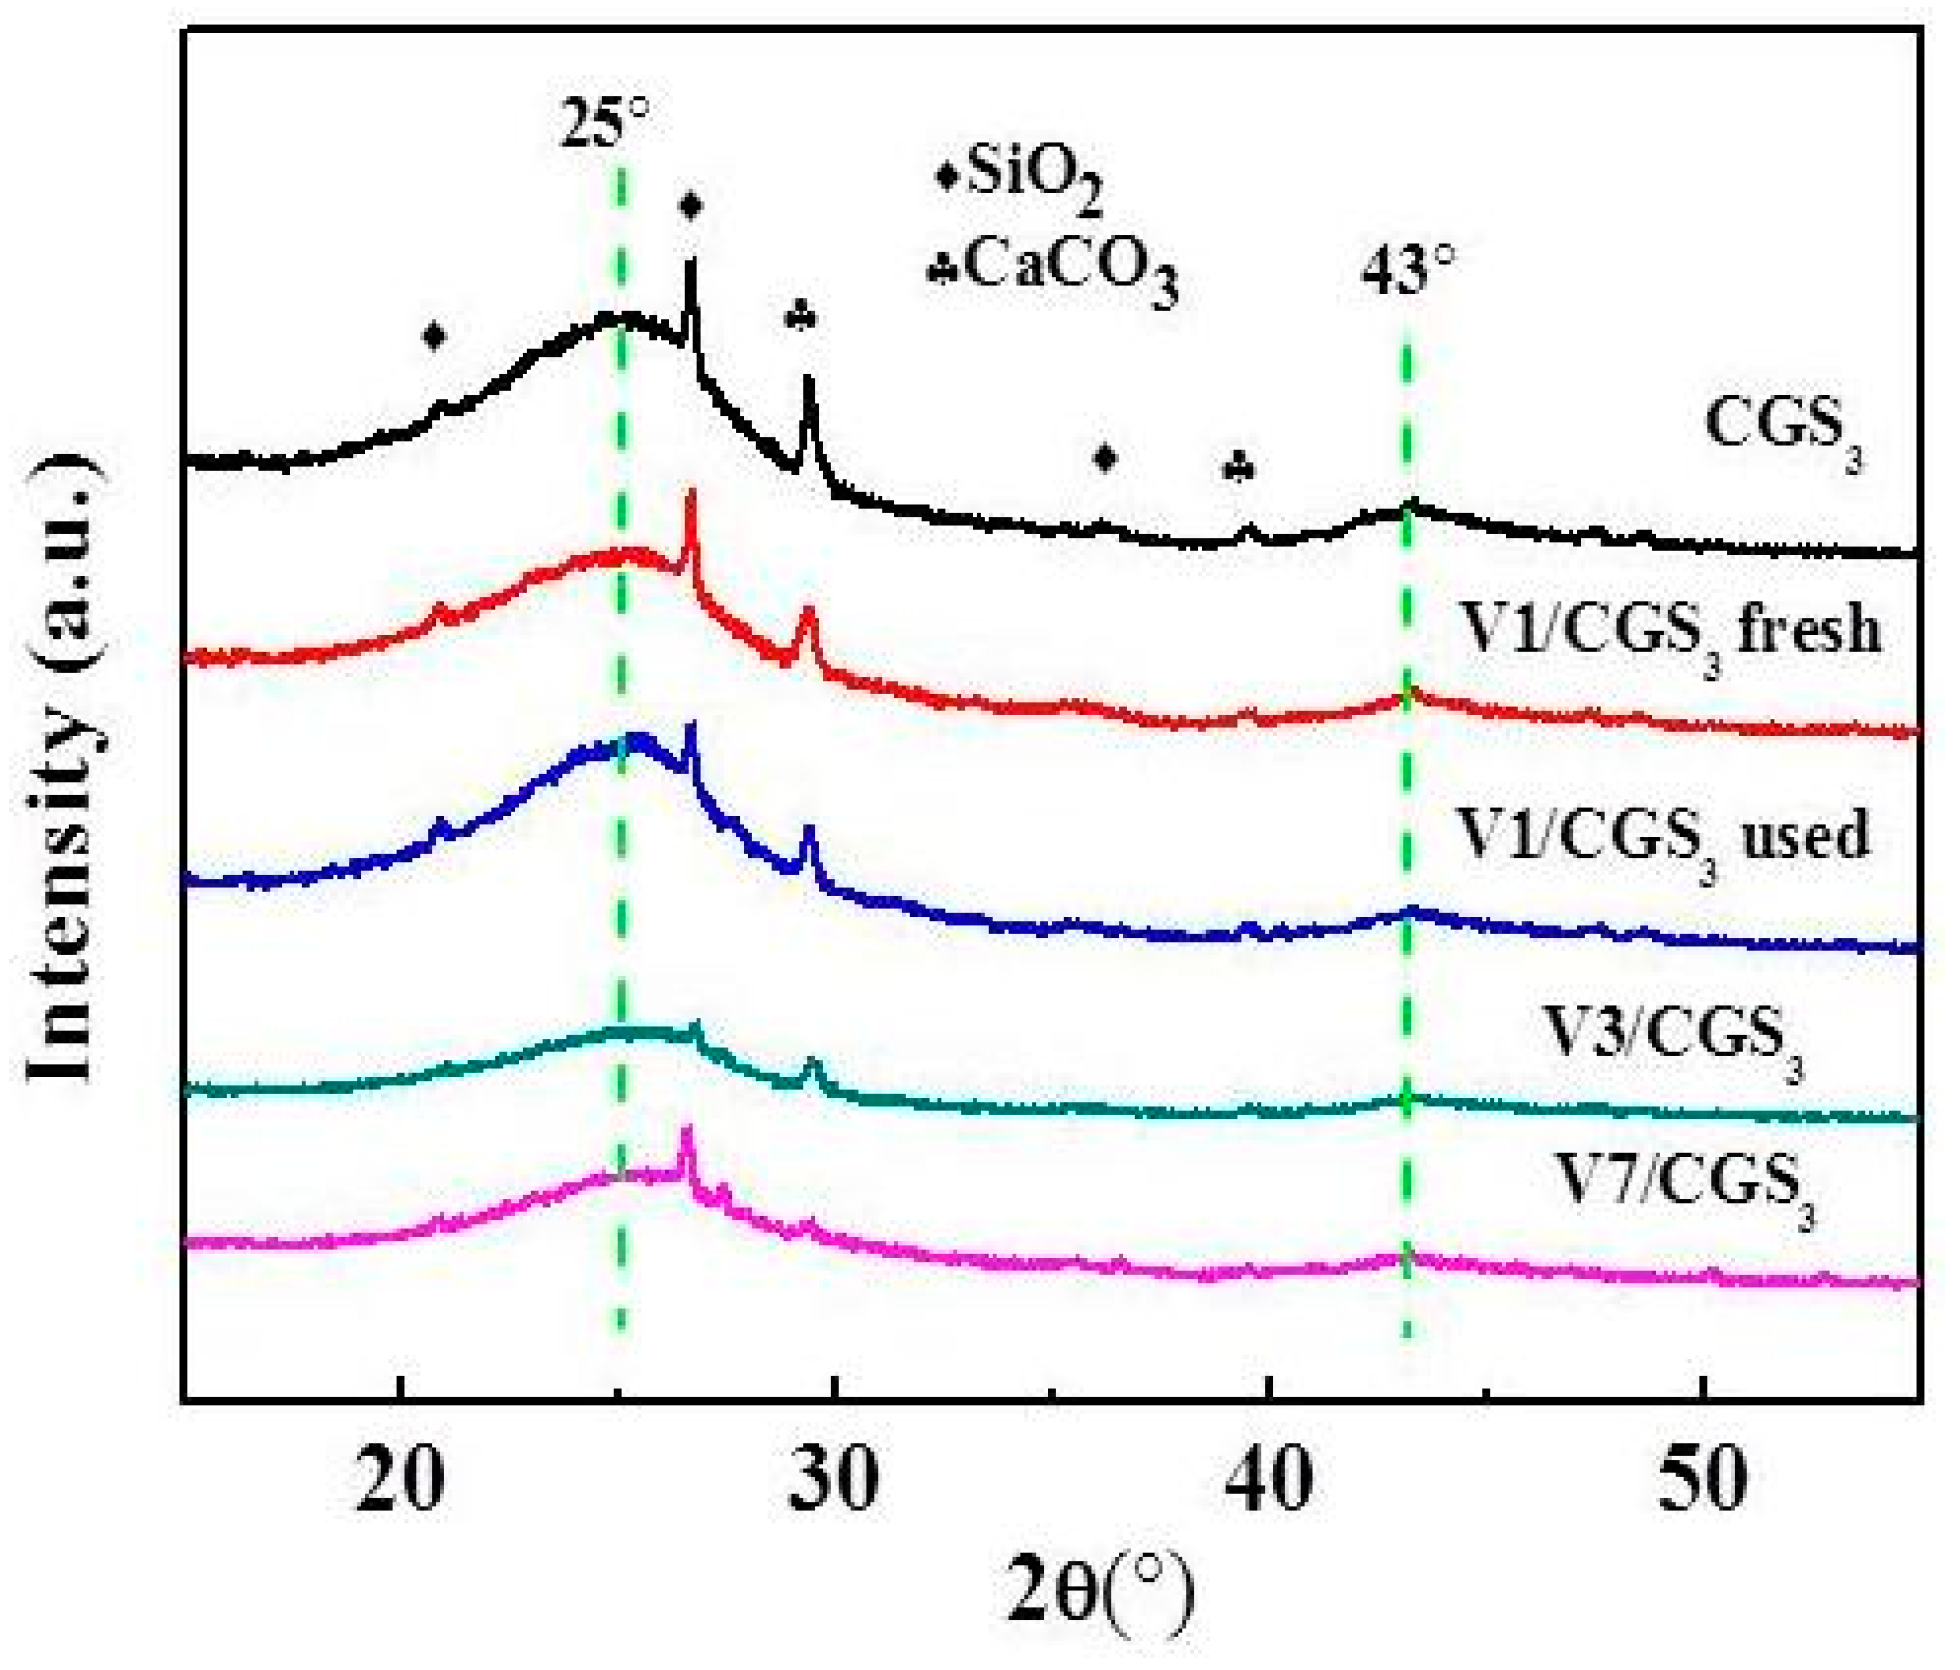
The XRD patterns of the catalyst samples are depicted in Figure 10. It was observed that all of the samples show two broad peaks at 25° and 43°. These peaks could be ascribed to the diffraction of the graphite (002) and (100) crystal planes, respectively [33]. It also showed that the other peaks of patterns were ascribed to the SiO2 and CaCO3. For the CGS3 and V1/CGS3 peaks, the intensity and peak width were almost same. Moreover, with the increase of V loading (1%–7%), the intensity and width of the peak becomes weak, but the diffraction peaks attributed to the V species were not observed, suggesting that the loaded active phase was highly dispersed on the CGS support, so that the catalytic activity improved, as shown in Figure 3.
2.8. XPS
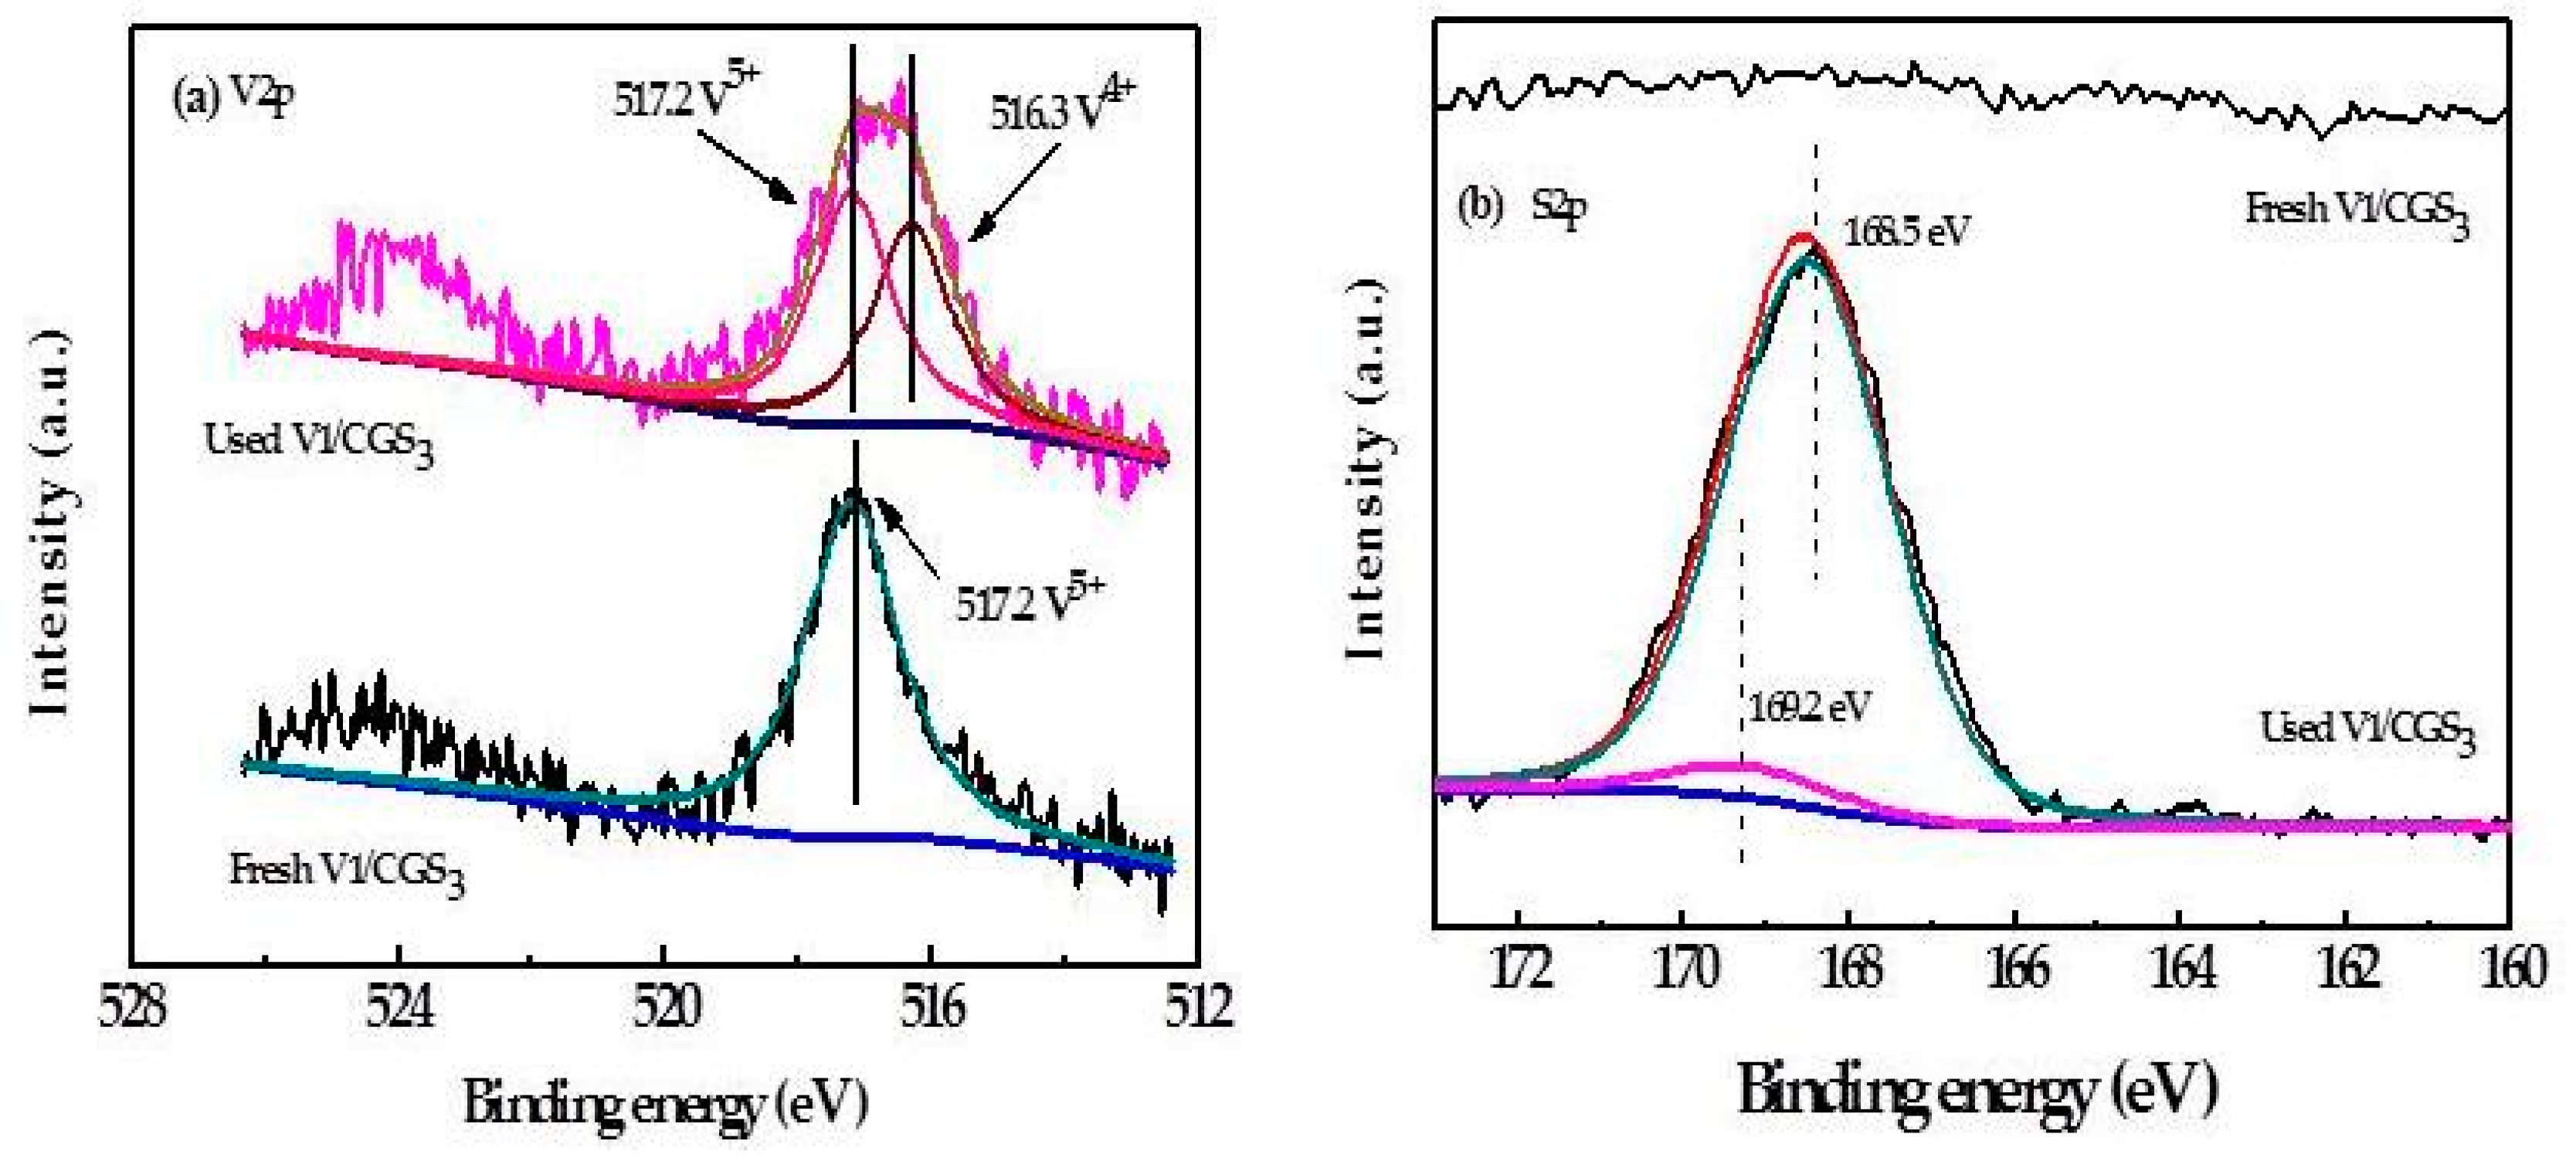
In order to investigate the chemical information of V1/CGS3 surface, the surface binding energies and valence states of the various catalyst materials were studied using XPS analysis. The results are shown in Figure 11. The XPS spectrogram of the sample 505–530 eV is shown in Figure 11a. According to the V 2p photoelectron peak, the peak at 516.4–517.0 eV was assigned to V5+, the peak at 515.7–516.2 eV was ascribed to V4+ [34], and the peak at 513.1–514.7 eV was assigned to V3+ [35], respectively. V5+ is a stable oxidation state and has an important influence on the catalyst activity. In Figure 11a, it can be discerned that the V 2P3/2 peak at 517.2 eV in the fresh catalyst is ascribed to V5+, and in the used catalyst, there is a new peak at 516.3 eV ascribed to V4+, which indicates a partial reduction of V5+ to the lower-valence V4+, and there may be V2O4 or VOSO4 on the used catalyst surface, except for V2O5. In the SP3/2 spectrum, as shown in Figure 11b, no peaks were observed on the fresh catalyst. In adition, the SP3/2 spectrum of the used catalyst was composed of two peaks at 168.5 and 169.2 eV. The peak at 168.5 eV is attributed to the S6+ species. It may confirm the formation of a small amount of VOSO4 during the activity test. The last peak may correspond to H2SO4, because the peak at 169.7 eV was assigned to H2SO4 in the literature [36]. At present, it is not clear what caused the peak deviation.
2.9. FTIR
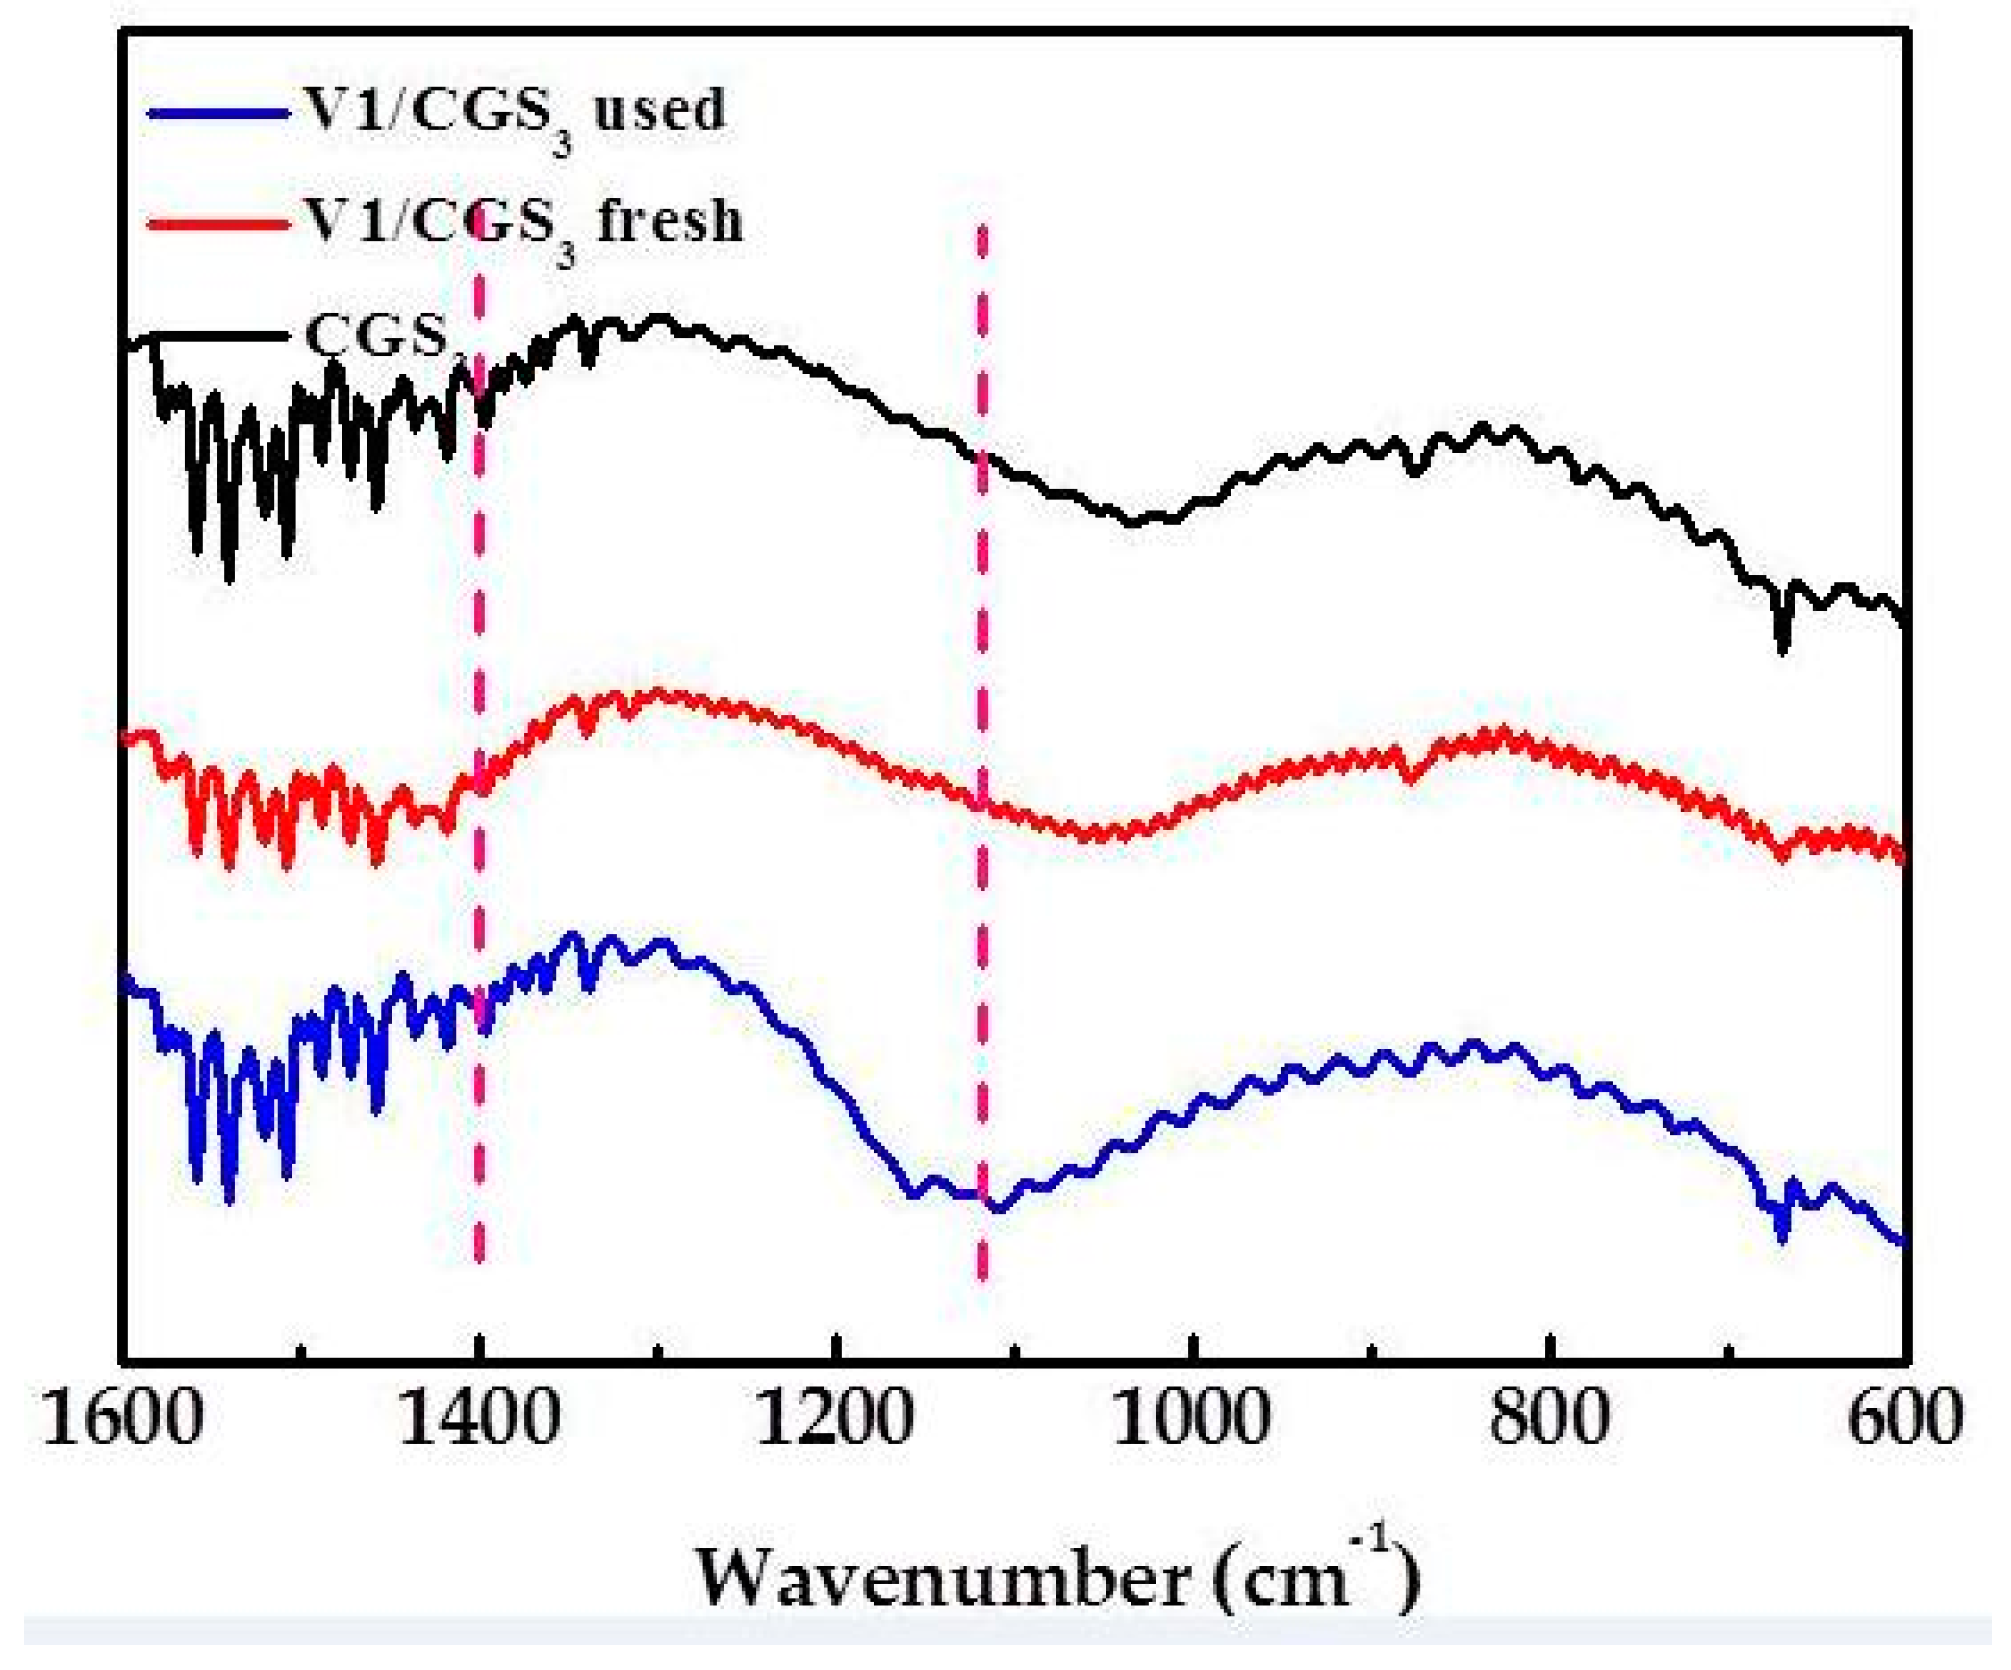
Figure 12 shows the FTIR spectra of the V1/CGS3 before and after the SCR reaction in the presence of H2O and SO2. There is a broad band at 1000–1220 cm−1 attributed to the V5+=O stretching vibration in V2O5/AC, which is stronger than the fresh catalyst [37]. The phenomenon shows that the symmetry of the vanadium species is higher than that of the fresh catalyst. The bands at 1104 and 668 cm−1 may be the vibration of the SO42− ions. The SO42− ions show two infrared peak at 1104 (ν1) and 613 (ν2) [4]. The band around 1460 cm−1 was assigned to the symmetrical bending vibrations of the NH4+ species [38]. Leo et al. [39] showed that the band at 1000 cm−1 was due to the V–O stretching vibration peak of VOSO4. Hwever, Raziyeh et al. [40] showed that the bands at 1410 cm−1 and 1150 cm−1 were attributed to VOSO4, which may be due to the influence of the carrier carbon changing its symmetry. Therefore, the 1400 cm−1 band is attributed to the formation of VOSO4. The catalyst after the SCR reaction is shown to contain SO42− and NH4+ by FTIR, which suggests that the ammonium sulfate salts deposited on the catalyst surface during the SCR reaction.
Therefore, it can be seen from the XPS and FTIR results that H2SO4, ammonium sulfate, and VOSO4 are formed on the surface after the NH3-SCR reaction.
2.10. SEM-EDS
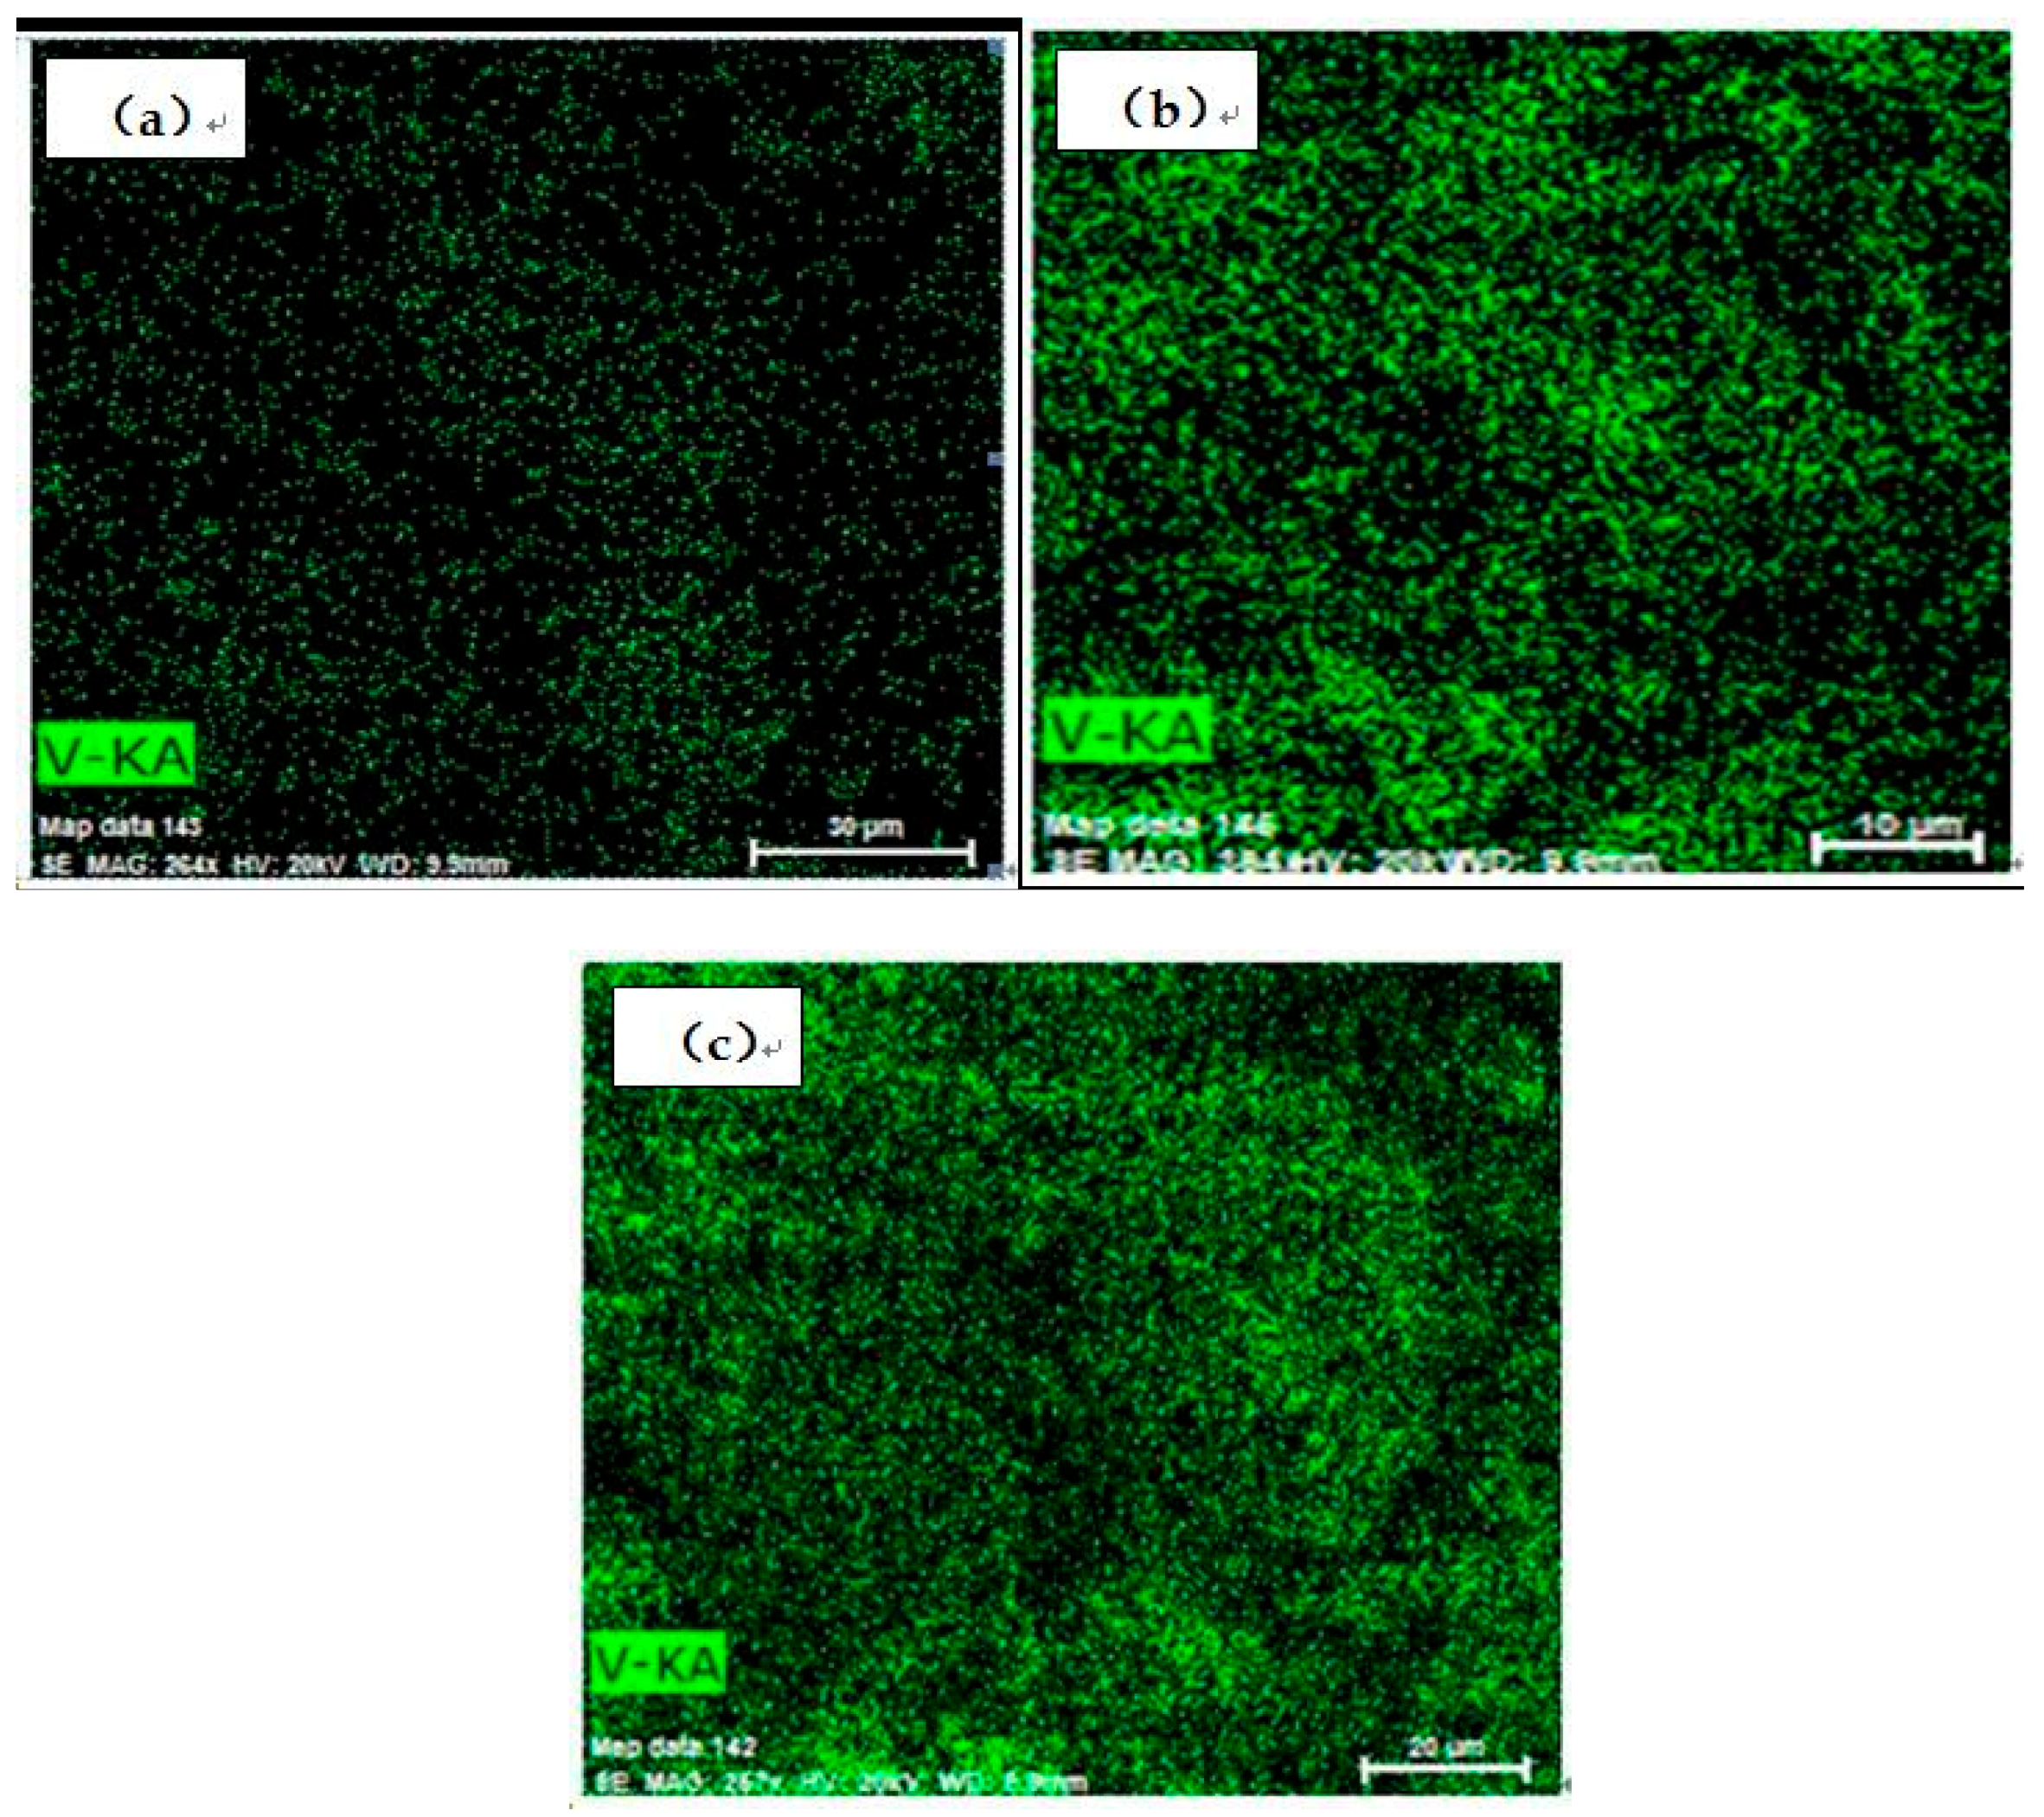
Figure 13 shows the EDS spectra of the vanadium distribution on different samples. It can be seen that by increasing the vanadium loading, the vanadium is more likely to aggregate together and is more compactly dispersed on the surface of the CGS3. When the V loading is slightly higher, more active reaction sites can be provided for the SCR reaction. However, when the V loading is too high, the pores of the catalyst are blocked to some extent, and the specific surface area is lowered, which inhibits the SCR reaction. The results can be seen from Figure 3 and Figure 4.
2.11. NH3-TPD
TPD analysis, one of the most common techniques, was carried out to characterize the functional groups on the carbonaceous surfaces [41]. The acid strength in V1/CGS3 was determined by NH3-TPD. Figure 14 shows the NH3-TPD profiles over CGS1, CGS2, CGS3, V1/CGS3, V3/CGS3, and V7/CGS3. It was observed that the V1/CGS3 catalyst shows two types of acid sites, so NH3 can be adsorbed on the catalyst. According to the authors of [42], it could be considered that the formation of a low-temperature peak was mainly attributed to the desorption of ammonia bound to weak Bronsted acid sites and physisorbed ammonia molecules, while the high-temperature maximum could be caused by the desorption of NH3 from the Lewis acid sites. With the addition of V to the CGS support, the bound NH3 absorption increased significantly, suggesting that V produced more acid sites for the catalyst. In particular, the vanadium species showed a significant adsorption ability toward NH3 at the Lewis (L) acid sites. Huang et al. [43] found that the Lewis acid sites on the surface of the V2O5/CNT are the active sites in the process of NH3-SCR at low temperatures. Moreover, it was clear that by increasing the vanadium loading (1%–7%), the peak intensity of the L acid site becomes weak. According to the EDS results, the more vanadium supported on the carrier, the easier it is to gather together. As a result, the effective active component of vanadium provided on the catalyst is reduced, thereby reducing the activity. This is the main reason that the activity is reduced when the amount of vanadium is increased. All in all, in connection with the catalytic activity, it is believed that the Lewis acid sites on the vanadium species were the active sites for the SCR of NO with NH3 at 240–290 °C on the V1/CGS3 catalyst.
2.12. H2-TPR
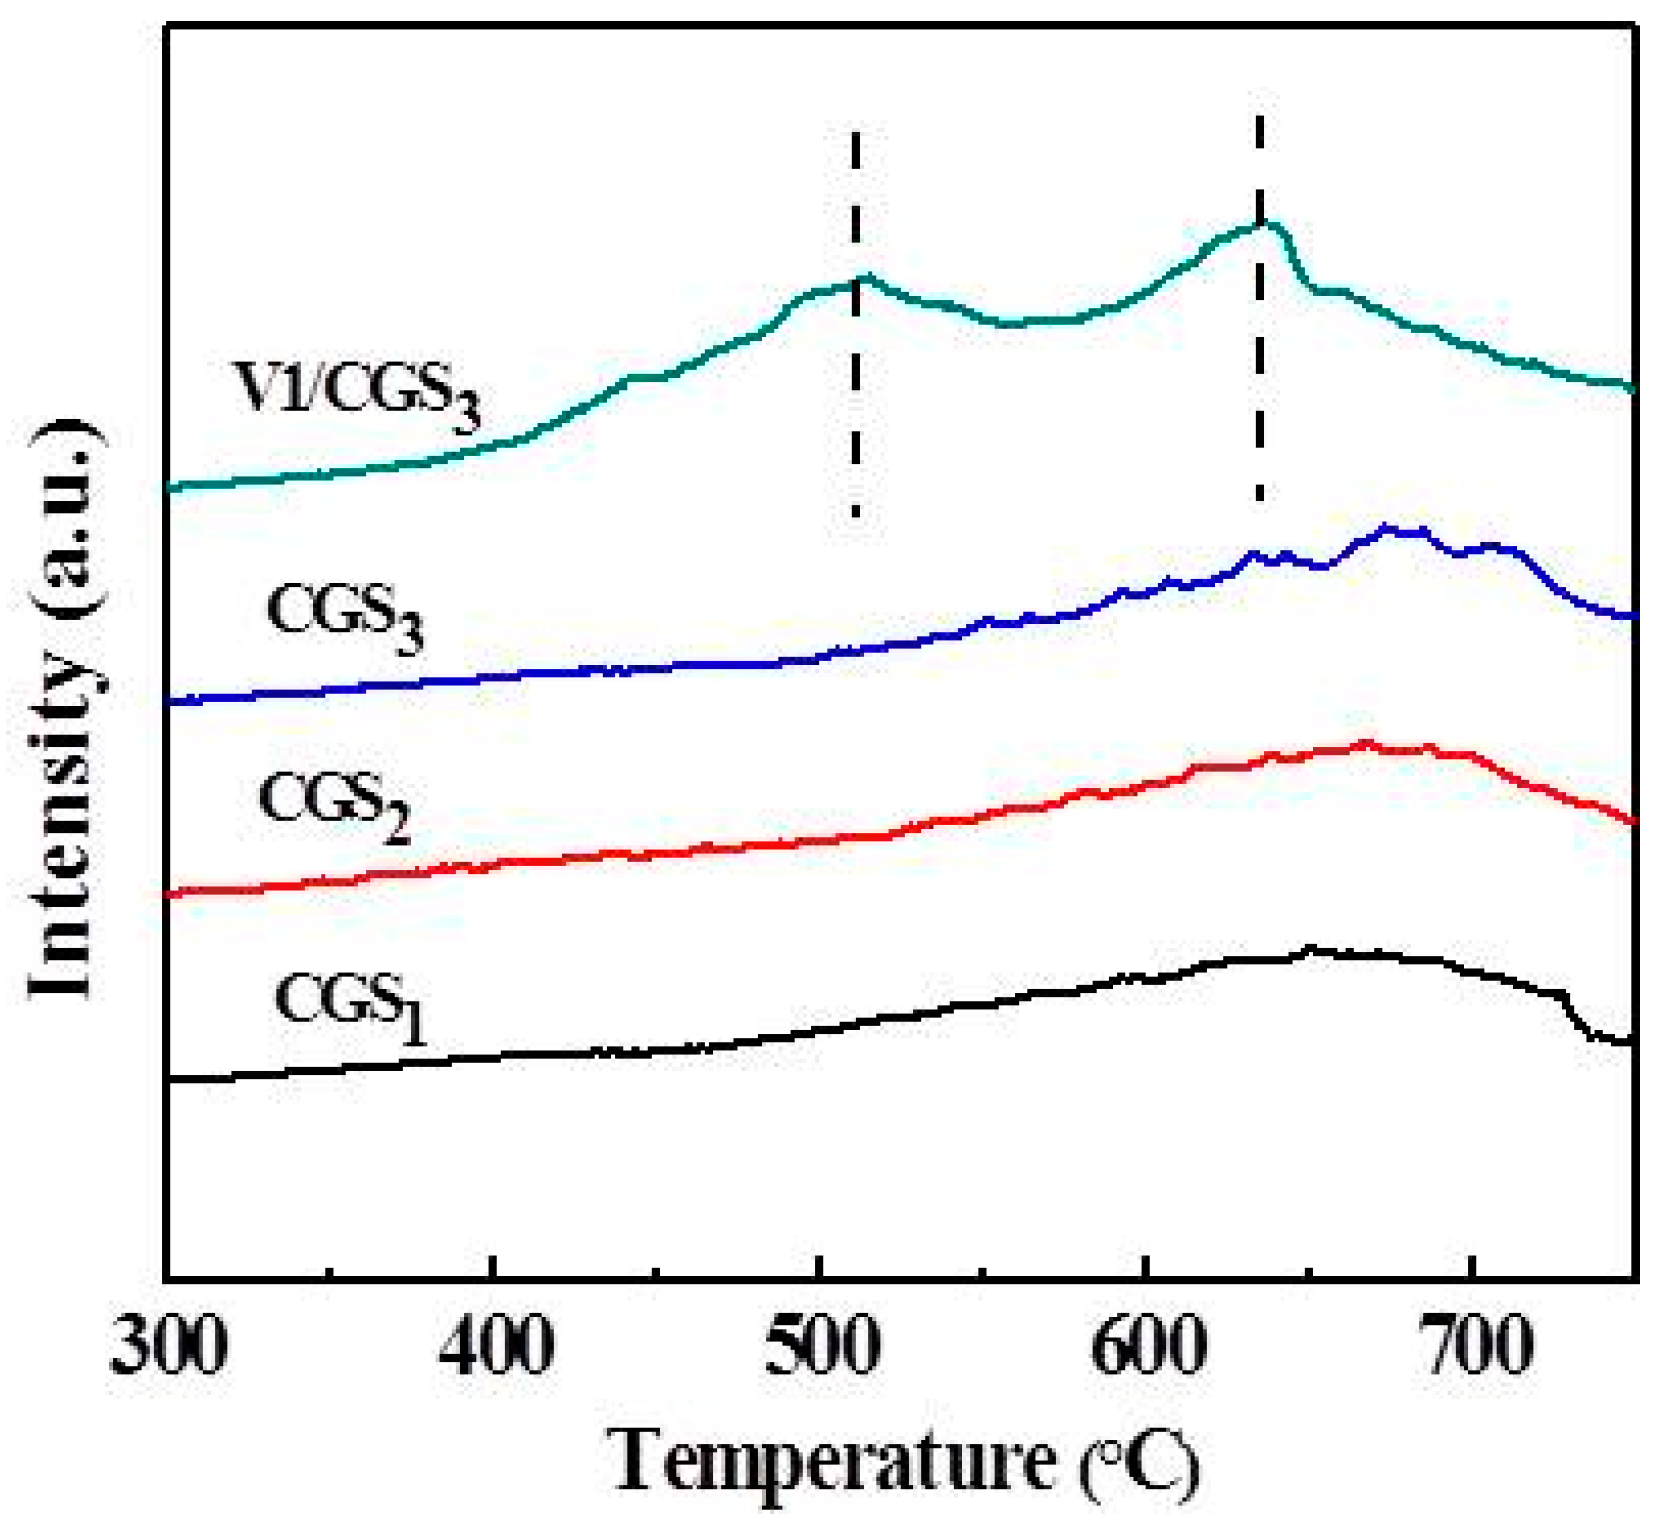
The redox ability of the VOx species was thought to be another key factor in the SCR process. Temperature program reduction (TPR) has become one of the techniques to characterize the reduction behaviors of the dispersed VOx species. As shown in Figure 15, the CGS1, CGS2, and CGS3 catalysts only showed one broad peak, which may be related to the nature of the gasification residue itself. With the introduction of V into the support, it was obviously observed that the V1/CGS3 catalyst shows two redox peaks. The redox peaks in the range of 450–600 °C were assigned to the reduction of the VOx monolayer species from V5+ to V3+ [44]. With the addition of vanadium, the redox peaks shifted to the lower temperature side, which could be due to a good dispersion of V.
3. Materials and Methods
3.1. Preparation of Supports and Catalysts
Three gasification residues are chosen and labeled as CGS1, CGS2, and CGS3 (China), respectively. The CGS was grounded to 40–60 mesh, and a V/CGS catalyst was prepared using pore volume impregnation [5]. The vanadium oxide was supported on the CGS with an aqueous of ammonium meta-vanadate (Tianjin, China, 99%) in oxalic acid (Tianjin, China, 99%). The V loading in the catalysts were determined by the concentration of the ammonium meta-vanadate used in the impregnation. After the impregnation, the catalyst was dried at 50 °C and then 120 °C for 5 h, and subsequently calcined in N2 for 5 h at 500 °C and pre-oxidized in air at 250 °C for 5 h.
3.2. Catalytic Activity Test
The SCR activity measurement was conducted in a fixed-bed quartz reactor. Mass flow meters were used to control the flow rate. The catalyst was placed in the middle of the reactor (D24 × 50 mm) and heated to the experimental temperature in the atmosphere of N2, and then passed into the simulated flue gas and the reducing agent, NH3. To prevent the formation of ammonium sulfate salts [1] in the inlet tubing of the reactor, the gases were sent to the buffer bottle fully mixed before entering the reaction tube. The simulated flue gas composition was as follows: 500 ppm NO, 500 ppm NH3, 200 ppm SO2 (when used), 3 vol% H2O (when used), and 6 vol% O2, and the balance gas that was used was N2. In all of the runs, the total gas flow rate was maintained at 400 mL/min. The concentration of the inlet and outlet NO was simultaneously measured usng an on-line Flue Gas Analyzer (KM9106) equipped with an NO sensor. The NO conversion was calculated using the formula given below.
where ηNO is the NO conversion, and CNO,in and CNO,out are the NO concentrations in the inlet and outlet gas, as measured by a flue gas analyzer, respectively. SN2 is the N2 selectivity, CNO2, out is the NO2 concentration in the outlet gas, CN2O,out is the N2O concentration in the outlet gas, and CNH3,in is the NH3 concentration in the inlet gas.
3.3. Catalysts Characterization
The specific surface area and pore structure parameters of the catalysts were determined using the nitrogen physical adsorption instrument (Micromeritics, Norcross, GA, USA). The inductively coupled plasma optical emission spectrometer (ICP-OES) (SPECTRO, Kleve, Germany) was used to analyze the ash contents of the catalysts. The surface element valence of the sample was analyzed by X-ray photoelectron spectroscopy (Thermo Fisher Scientific, Waltham, MA, USA). The structural characterizations of the catalysts were analyzed using X-ray powder diffraction (XRD) (Rigaku, Tokyo, Japan). The diffraction patterns were scanned in the 2θ range from 10° to 70° at the scanning rate of 5°/min. The thermo gravimetric analyses (TGA) were performed with a NETZSCH Thermal Analysis System to study the catalyst stability (NETZSCH Corporation, Bavaria, Germany). The Fourier Transform infrared spectroscopy (FTIR) spectra were collected on a Bruker TENSOR 27 (Bruker Corporation, Karlsruhe, Germany). The surface morphology of the samples was studied by field-emission scanning electron microscopy (SEM) (JEOL, Tokyo, Japan), combined with an energy dispersive spectrometer (EDS) (Bruker, Karlsruhe, Germany).
Temperature program reduction (TPR) and temperature programmed desorption (TPD) tests were carried out on the AutoChem II type high performance chemical adsorption instrument (Micromeritics, Norcross, GA, USA). The 150 mg samples were dried at 150 °C for 30 min in Ar (30 mL/min), and cooled to 50 °C. Then, the sample was heated up to 800 °C at a 10 °C/min rate in 10% H2/Ar atmosphere. For NH3-TPD, the 150 mg samples were pretreated in carrier gas for 30 min at 150 °C, and then exposed to 10% NH3/He (30 mL/min) at 50 °C for 30 min, followed by a temperature ramp to 700 °C at a rate of 10 °C/min; the concentration of desorbed NH3 was determined by the thermal conductivity detector.
4. Conclusions
In this work, the SCR activity and physicochemical properties of the V/CGS catalyst have been investigated. The results showed that the prepared catalyst in the 240–290 °C temperature range showed good catalytic activity. The high-carbon content gasification slag has a developed pore structure and is similar to the structure of activated carbon made of coal. The active metal vanadium shows good activity, and the main active component for DeNOx of V1/CGS catalyst is V2O5; the V1/CGS catalyst impregnated with 1 wt% vanadium has the best DeNOx activity; and the NO conversion increases from 60% to 100% with the increasing temperature (200–250 °C). The vanadium loaded CGS catalyst showed that vanadium gave rise to more acid sites for the catalyst, and the Lewis acid sites on the vanadium species were the active sites for catalytic reduction of NO, and the certain sulfur-resistance ability over V/CGS is shown. The above results indicate that the gasification slag can be used as a carrier to prepare a carbon-based catalyst for the NOx removal from the flue gas. The simultaneous removal of SO2, NOx, and Hg over this catalyst will be studied in our future work.
Author Contributions
The experimental work was conceived and designed by F.H. and J.W; F.H. and Y.G. performed the experiments; F.H. and Q.H. analyzed the date; and F.H. drafted the paper. The manuscript was amended through the comments of W.B., L.C., L.H, and J.W. All of the authors have given approval for the final version of the manuscript.
Acknowledgments
This work was supported by the National Natural Science Foundation of China (21476154), the Shanxi Province Natural Science Foundation (201601D011083), the Research Project Supported by Shanxi Scholarship Council of China (2016-026), and the State Key Laboratory of Coal Combustion (FSKLCCA1606).
Conflicts of Interest
The authors declare no conflict of interest.
References
- Bosch, H.; Janssen, F. Formation and control of nitrogen oxides. Catal. Today 1988, 2, 369–379. [Google Scholar]
- Cho, S.M. Properly apply selective catalytic reduction for NOx removal. Chem. Eng. Prog. 1994, 90, 39–45. [Google Scholar]
- Chen, J.P.; Yang, R.T. Mechanism of poisoning of the V2O5/TiO2 catalyst for the reduction of NO by NH3. J. Catal. 1990, 125, 411–420. [Google Scholar] [CrossRef]
- Chen, J.P.; Yang, R.T. Selective catalytic reduction of NO with NH3 on SO42−/TiO2 superacid catalyst. J. Catal. 1993, 139, 277–288. [Google Scholar] [CrossRef]
- Huang, Z.; Zhu, Z.; Liu, Z. Combined effect of H2O and SO2 on V2O5/AC catalysts for NO reduction with ammonia at lower temperatures. Appl. Catal. B 2002, 39, 361–368. [Google Scholar] [CrossRef]
- Zhu, Z.; Hu, T. NO reduction with NH3 over an activated carbon—supported copper oxide catalysts at low temperatures. Appl. Catal. B 2000, 26, 25–35. [Google Scholar] [CrossRef]
- Singoredjo, L.; Korver, R.; Kapteijn, F.; Moulijn, J. Alumina supported manganese oxides for the low-temperature selective catalytic reduction of nitric oxide with ammonia. Appl. Catal. B 1992, 24, 297–316. [Google Scholar] [CrossRef]
- Grzybek, T.; Papp, H. Cheminform abstract: Selective catalytic reduction of nitric oxide by ammonia on Fe3+- promoted active carbon. Appl. Catal. B 1992, 24, 271–283. [Google Scholar] [CrossRef]
- Zhu, Z.; Niu, H.; Liu, Z.; Liu, S. Decomposition and reactivity of NH4HSO4 on V2O5/AC catalysts used for NO reduction with ammonia. J. Catal. 2000, 195, 268–278. [Google Scholar] [CrossRef]
- Zhu, Z.; Liu, Z.; Niu, H.; Liu, S. Promoting effect of SO2 on activated carbon-supported vanadia catalyst for NO reduction by NH3 at low temperatures. J. Catal. 1999, 187, 245–248. [Google Scholar] [CrossRef]
- Lorenc-Grabowska, E.; Gryglewicz, G. Adsorption characteristics of congo red on coal-based mesoporous activated carbon. Dyes Pigments 2007, 74, 34–40. [Google Scholar] [CrossRef]
- Rubio, B.; Izquierdo, M.T.; Mayoral, M.C.; Bona, M.T.; Andres, J.M. Unburnt carbon from coal fly ashes as a precursor of activated carbon for nitric oxide removal. J. Hazard. Mater. 2007, 143, 561–566. [Google Scholar] [CrossRef] [PubMed]
- Acosta, A.; Iglesias, I.; Aineto, M.; Romero, M.; Rincón, J.M. Utilisation of igcc slag and clay steriles in soft mud bricks (by pressing) for use in building bricks manufacturing. Waste Manag. 2002, 22, 887–891. [Google Scholar] [CrossRef]
- Acosta, A.; Aineto, M.; Iglesias, I.; Romero, M.; Rincón, J.M. Physico-chemical characterization of slag waste coming from gicc thermal power plant. Mater. Lett. 2001, 50, 246–250. [Google Scholar] [CrossRef]
- Xu, Y.; Chai, X. Characterization of coal gasification slag based activated carbon and its potential application in lead removal. Environ. Technol. 2017, 41, 382–391. [Google Scholar] [CrossRef] [PubMed]
- Hums, E. Is advanced scr technology at a standstill? A provocation for the academic community and catalyst manufacturers. Catal. Today 1998, 42, 25–35. [Google Scholar] [CrossRef]
- Huang, Z.; Niu, H. Effect of activated coke property on V2O5/AC activity for reduction of NO in flue gas at low temperature. Coal Convers. 2001, 24, 74–78. [Google Scholar]
- Davini, P. Adsorption and desorption of sulphur dioxide from simulated flue gas on active carbon: The effect of the ash content. Carbon 1993, 31, 47–51. [Google Scholar] [CrossRef]
- Long, R.Q.; Yang, R.T. Superior Fe-ZSM-5 catalyst for selective catalytic reduction of nitric oxide by ammonia. J. Am. Chem. Soc. 1999, 121, 5595–5596. [Google Scholar] [CrossRef]
- Long, R.Q.; Yang, R.T. Selective catalytic reduction of NO with ammonia over V2O5 doped TiO2 pillared clay catalysts. Appl. Catal. B 2000, 24, 13–21. [Google Scholar] [CrossRef]
- Long, R.Q.; Yang, R.T. Selective catalytic reduction of nitrogen oxides by ammonia over Fe3+-exchanged TiO2-pillared clay catalysts. J. Catal. 1999, 186, 254–268. [Google Scholar] [CrossRef]
- Pan, S.; Luo, H.; Li, L.; Wei, Z.; Huang, B. H2O and SO2 deactivation mechanism of MnOx/MWCNTs for low-temperature SCR of NOx with NH3. J. Mol. Catal. A-Chem. 2013, 377, 154–161. [Google Scholar] [CrossRef]
- Li, P.; Liu, Q.; Liu, Z. N2O and CO2 formation during selective catalytic reduction of NO with NH3 over V2O5/AC catalyst. Ind. Eng. Chem. Res. 2011, 50, 341–350. [Google Scholar]
- Boyano, A.; Gálvez, M.E.; Moliner, R.; Lázaro, M.J. Carbon-based catalytic briquettes for the reduction of NO: Effect of H2SO4 and HNO3 carbon support treatment. Fuel 2008, 87, 2058–2068. [Google Scholar] [CrossRef]
- Yang, W.; Liu, F.; Xie, L.; Lian, Z.; He, H. Effect of V2O5 additive on the SO2 resistance of a Fe2O3/AC catalyst for NH3-SCR of NOx at low temperatures. Ind. Eng. Chem. Res. 2016, 55, 2677–2685. [Google Scholar] [CrossRef]
- Potdar, H.S.; Jun, K.W.; Bae, J.W.; Kim, S.M.; Lee, Y.J. Synthesis of nano-sized porous γ-alumina powder via a precipitation/digestion route. Appl. Cataly. A-Gen. 2007, 321, 109–116. [Google Scholar] [CrossRef]
- Parida, K.M.; Pradhan, A.C.; Das, J.; Sahu, N. Synthesis and characterization of nano-sized porous gamma-alumina by control precipitation method. Mater. Chem. Phys. 2009, 113, 244–248. [Google Scholar] [CrossRef]
- Klimczak, M.; Kern, P.; Heinzelmann, T.; Lucas, M.; Claus, P. High-throughput study of the effects of inorganic additives and poisons on NH3-SCR catalysts—Part I: V2O5-WO3/TiO2 catalysts. Appl. Catal. B 2010, 95, 39–47. [Google Scholar] [CrossRef]
- Kröcher, O.; Elsener, M. Chemical deactivation of V2O5-WO3/TiO2 SCR catalysts by additives and impurities from fuels, lubrication oils, and urea solution: I. Catalytic studies. Appl. Catal. B 2008, 77, 215–227. [Google Scholar] [CrossRef]
- Jianrong, M.; Mengxue, A. A novel Ca/AC desulphurizer. Coal Convers. 2001, 24, 48–53. [Google Scholar]
- Yang, S.; Guo, Y.; Yan, N.; Qu, Z.; Xie, J.; Yang, C.; Jia, J. Capture of gaseous elemental mercury from flue gas using a magnetic and sulfur poisoning resistant sorbent Mn/γ-Fe2O3 at lower temperatures. J. Hazard. Mater. 2011, 186, 508–515. [Google Scholar] [CrossRef] [PubMed]
- Li, P.; Liu, Z.; Li, Q.; Wu, W.; Liu, Q. Multiple roles of SO2 in selective catalytic reduction of NO by NH3 over V2O5/AC catalyst. Ind. Eng. Chem. Res. 2014, 53, 7910–7916. [Google Scholar] [CrossRef]
- Liu, L.; Liu, Z.; Yang, J.; Huang, Z.; Liu, Z. Effect of preparation conditions on the properties of a coal-derived activated carbon honeycomb monolith. Carbon 2007, 45, 2836–2842. [Google Scholar] [CrossRef]
- Xiao, Y.; Liu, Z.; Liu, Q.; Wang, J.; Xing, X.; Huang, Z. Mechanism of SO2 influence on NO removal over V2O5/AC catalyst. Chin. J. Catal. 2008, 29, 81–85. [Google Scholar]
- Seo, P.W.; Lee, J.Y.; Shim, K.S.; Hong, S.H.; Hong, S.C.; Hong, S.I. The control of valence state: How V/TiO2 catalyst is hindering the deactivation using the mechanochemical method. J. Hazard. Mater. 2009, 165, 39–47. [Google Scholar] [CrossRef] [PubMed]
- Wren, A.G.; Phillips, R.W.; Tolentino, L.U. Surface reactions of chlorine molecules and atoms with water and sulfuric acid at low temperatures. J. Colloid Interface Sci. 1979, 70, 544–557. [Google Scholar] [CrossRef]
- Zhu, Z.; Liu, Z.; Niu, H.; Liu, S.; Hu, T.; Liu, T. Mechanism of SO2 promotion for NO reduction with NH3 over activaed carbon—Supported vanadium oxide catalyst. J. Catal. 2001, 197, 6–16. [Google Scholar] [CrossRef]
- Pan, Y.; Zhao, W.; Zhong, Q.; Cai, W.; Li, H. Promotional effect of Si-doped V2O5/TiO2 for selective catalytic reduction of NOx by NH3. Acta Sci. Circumstantiae 2013, 25, 1703–1711. [Google Scholar]
- Frederickson, L.D.; Hausen, D.M. Infrared spectra-structure correlation study of vanadium-oxygen compounds. Anal. Chem 1963, 35, 818. [Google Scholar] [CrossRef]
- Khodayari, R.; Odenbrand, C.U.I. Regeneration of commercial SCR catalysts by washing and sulphation: Effect of sulphate groups on the activity. Appl. Catal. B 2001, 33, 277–291. [Google Scholar] [CrossRef]
- Zhuang, Q.; Kyotani, T.; Tomita, A. Drift and TK/TPD analyses of surface oxygen complexes formed during carbon gasification. Energy Fuels 1994, 8, 714–718. [Google Scholar] [CrossRef]
- Niwa, M.; Habuta, Y.; Okumura, K.; Katada, N. Solid acidity of metal oxide monolayer and its role in catalytic reactions. Catal. Today 2003, 87, 213–218. [Google Scholar] [CrossRef]
- Huang, B.; Huang, R.; Jin, D.; Ye, D. Low temperature scr of NO with NH3 over carbon nanotubes supported vanadium oxides. Catal. Today 2007, 126, 279–283. [Google Scholar] [CrossRef]
- Amiridis, M.D.; Wachs, I.E.; Deo, G.; Jehng, J.M.; Du, S.K. Reactivity of V2O5 catalysts for the selective catalytic reduction of NO by NH3: Influence of vanadia loading, H2O, and SO2. J. Catal. 1996, 161, 247–253. [Google Scholar] [CrossRef]
Figure 1.
NO conversion of catalysts with different carriers.

Figure 2.
N2O formation and N2 selectivity for experiments of V1/CGS3.

Figure 3.
NO conversion of catalysts with different V loadings.

Figure 4.
Surface areas of samples.

Figure 5.
Effect of H2O and O2 on NO conversion.

Figure 6.
Effect of O2 concentration on NO conversion.

Figure 7.
Effect of H2O and SO2 on NO conversion over V1/CGS3 catalyst.

Figure 8.
Stability of V1/CGS3 catalyst.

Figure 9.
Thermo gravimetric (TG) and Derivative Thermo Gravimetric (DTG) profiles of the (a) CGS2 and (b) CGS3.
Figure 9.
Thermo gravimetric (TG) and Derivative Thermo Gravimetric (DTG) profiles of the (a) CGS2 and (b) CGS3.

Figure 10.
X-ray diffraction (XRD) patterns of catalysts.

Figure 11.
X-ray photoelectron spectrometry (XPS) spectra of (a) V2p and (b) S2p for the fresh and used V1/CGS3.
Figure 11.
X-ray photoelectron spectrometry (XPS) spectra of (a) V2p and (b) S2p for the fresh and used V1/CGS3.

Figure 12.
FTIR spectra of the fresh and used V1/CGS3.

Figure 13.
Surface characteristics of (a) V1/CGS3; (b) V3/CGS3; and (c) V7/CGS3.

Figure 14.
NH3-temperature programmed desorption (TPD) patterns of catalysts.
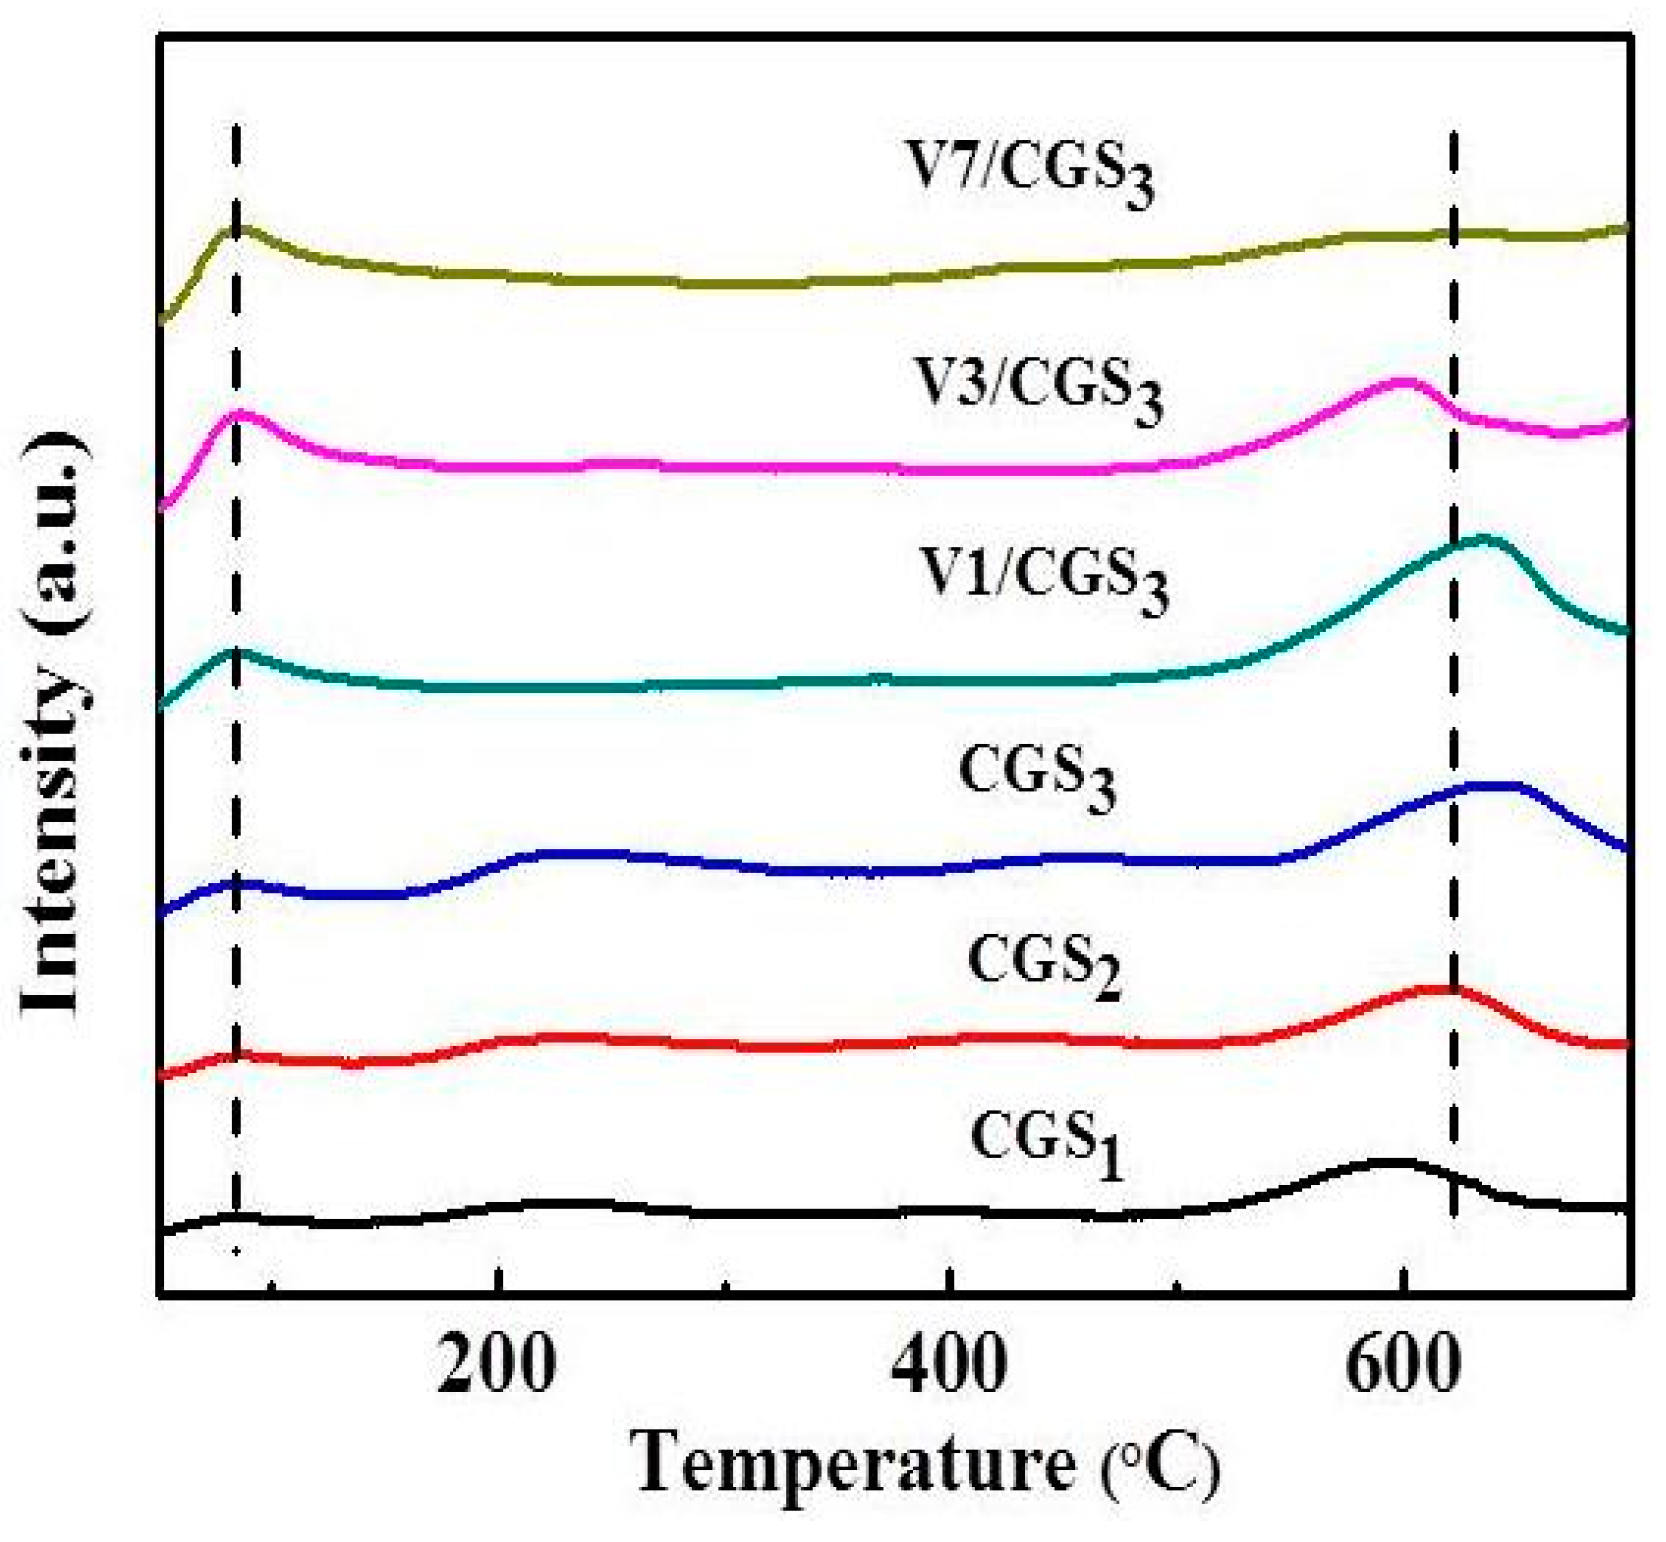
Figure 15.
H2-temperature programmed reduction (TPR) patterns of catalysts.


Table 1.
Physical property of the coal gasification slags (CGSs) and V1/CGS Catalysts.
| Samples | BET Surface Area (m2/g) | Micro-Pore Area (m2/g) | Mesopore Volume (cm3/g) | Micro-Pore Volume (cm3/g) |
|---|---|---|---|---|
| CGS1 | 212.8 | 94.5 | 0.13 | 0.04 |
| CGS2 | 318.7 | 93.1 | 0.27 | 0.04 |
| CGS3 | 311.4 | 111.0 | 0.18 | 0.05 |
| V1/CGS3 fresh | 321.5 | 115.6 | 0.19 | 0.05 |
| V1/CGS3 used | 203.5 | 61.2 | 0.15 | 0.03 |
Table 2.
Elemental analysis of CGS3 and V1/CGS3 catalyst.
| Samples | Composition (wt %) | ||||||
|---|---|---|---|---|---|---|---|
| SiO2 | Fe2O3 | CaO | Al2O3 | Na2O | TiO2 | V2O5 | |
| CGS1 | 14.5 | 20.0 | 7.9 | 3.9 | 0.8 | 0.2 | 0 |
| CGS2 | 12.8 | 6.4 | 5.1 | 5.1 | 0.8 | 0.2 | 0 |
| CGS3 | 11.9 | 3.0 | 2.9 | 3.1 | 0.5 | 0.1 | 0 |
| V1/CGS3 fresh | 8.9 | 2.9 | 2.6 | 2.6 | 0.4 | 0.1 | 1.3 |
| V1/CGS3 used | 7.4 | 2.5 | 3.0 | 2.3 | 0.3 | 0.1 | 1.0 |
© 2018 by the authors. Licensee MDPI, Basel, Switzerland. This article is an open access article distributed under the terms and conditions of the Creative Commons Attribution (CC BY) license (http://creativecommons.org/licenses/by/4.0/).
Share and Cite
MDPI and ACS Style
Han, F.; Gao, Y.; Huo, Q.; Han, L.; Wang, J.; Bao, W.; Chang, L. Characteristics of Vanadium-Based Coal Gasification Slag and the NH3-Selective Catalytic Reduction of NO. Catalysts 2018, 8, 327. https://doi.org/10.3390/catal8080327
AMA Style
Han F, Gao Y, Huo Q, Han L, Wang J, Bao W, Chang L. Characteristics of Vanadium-Based Coal Gasification Slag and the NH3-Selective Catalytic Reduction of NO. Catalysts. 2018; 8(8):327. https://doi.org/10.3390/catal8080327
Chicago/Turabian StyleHan, Fang, Yanchun Gao, Qihuang Huo, Lina Han, Jiancheng Wang, Weiren Bao, and Liping Chang. 2018. "Characteristics of Vanadium-Based Coal Gasification Slag and the NH3-Selective Catalytic Reduction of NO" Catalysts 8, no. 8: 327. https://doi.org/10.3390/catal8080327
Note that from the first issue of 2016, this journal uses article numbers instead of page numbers. See further details here.