Article

Novel Composite Electrode of the Reduced Graphene Oxide Nanosheets with Gold Nanoparticles Modified by Glucose Oxidase for Electrochemical Reactions

1
Institute for Sustainable Energy, College of Sciences, Shanghai University, Shanghai 200444, China
2
Zhaoqing Leoch Battery Technology Co., Ltd., Zhaoqing 526238, China
3
Shipbuilding Technology Research Institute, Shanghai 200032, China
*
Authors to whom correspondence should be addressed.
Catalysts 2019, 9(9), 764; https://doi.org/10.3390/catal9090764
Submission received: 15 August 2019 / Revised: 8 September 2019 / Accepted: 8 September 2019 / Published: 11 September 2019

Abstract

:
Graphene-based composites have been widely explored for electrode and electrocatalyst materials for electrochemical energy systems. In this paper, a novel composite material of the reduced graphene oxide nanosheets (rGON) with gold nanoparticles (NPs) (rGON-AuNP) is synthesized, and its morphology, structure, and composition are characterized by scanning electron microscopy (SEM), high-resolution transmission electron microscopy (HRTEM), X-ray diffraction (XRD), energy dispersive X-ray (EDX), Fourier transform infrared spectroscopic (FTIR), Raman, and UV-Vis techniques. To confirm this material’s electrochemical activity, a glucose oxidase (GOD) is chosen as the target reagent to modify the rGON-AuNP layer to form GOD/rGON-AuNP/glassy carbon (GC) electrode. Two pairs of distinguishable redox peaks, corresponding to the redox processes of two different conformational GOD on AuNP, are observed on the cyclic voltammograms of GOD/rGON-AuNP/GC electrode. Both cyclic voltammetry and electrochemical impedance spectroscopy are employed to study the mechanism of direct electron transfer from GOD to GC electrode on the rGON-AuNP layer. In addition, this GOD/rGON-AuNP/GC electrode shows catalytic activity toward glucose oxidation reaction.

Graphical Abstract

1. Introduction

In the last several decades, research and development of carbon-based nanomaterials for electrodes and electrocatalysts in electrochemical energy conversion devices such as fuel cells, lithium batteries, metal-air batteries, lead-acid batteries, and supercapacitors have been given tremendous efforts for many applications [1,2,3,4,5]. Recently, one type of the advanced carbon materials, graphene-based ones with the morphology of one-atom-thick planar sheet which are comprised of sp2-bonded carbon atoms, have attracted great attention because of their excellent intrinsic physical and chemical properties [6]. Their ultra-large surface area and ultra-high electrical conductivity make them an alternative electrode and electrocatalyst material for electrode reactions in electrochemical energy technologies [7].
Despite its superior physical, chemical, mechanical, and electrical properties, graphene has faced several challenges when it is directly used as the matrix for electrochemical reactions, including poor reliability, less colloidal stability, non-specificity, and irreversible self-agglomerations [8,9]. To overcome the challenges, the properties of graphene can be modified through surface modification. For example, noble-metal nanoparticles especially gold nanoparticles (AuNP) can be used for this purpose. It is demonstrated that AuNP have several good characteristics, such as high effective surface area, water solubility, and biocompatibility, electrical conductivity, and catalytic activity, which would greatly promote the application of graphene as the platform for electrochemical systems [10]. Generally, the performance of AuNP strongly depends on the size of the nanoparticles. Small-sized particles can load more active material with reactive sites, enhancing the electron transfer. Although there have been many reports on preparation of graphene/AuNP complexes, the sizes of the AuNP within the composites normally ranged from 20 to 50 nm, and the AuNP in the composites were likely to aggregate [9]. There are very few researches reporting the synthesis of graphene/AuNP composites with well-dispersed sub-10 nm AuNP [11,12,13], which suggests the difficulty in the size-control and dispersion-control of AuNP in the graphene/AuNP composites.
In this work, we developed a facile way to in situ synthesize a composite of graphene oxide nanosheets (GON) with AuNP through reducing HAuCl4 with N,N-dimethylformamide (DMF) in the presence of GON and (3-aminopropyl) trimethoxysilane. This composite is abbreviated as GON-AuNP. It is observed that in such a GON-AuNP, highly dispersed AuNP with the diameter ranging from 5 to 10 nm are tightly anchored on the GON. The obtained GON-AuNP composite is deposited on a glassy carbon electrode (GCE). Then, the potentiostatic reduction is carried out to remove some oxygen functionalities to form the reduced GON (abbreviated as rGON) to produce a rGON-AuNP material. To validate the electrochemical activity of rGON-AuNP, glucose oxidase (GOD) is immobilized on the rGON-AuNP through adsorption to form a GOD/rGOD-AuNP composite. GOD is a dimetric glycoprotein comprising two identical polypeptide chain subunits, and each subunit contains a flavin adenine dinucleotide (FAD) redox center. GOD has received special attention as a catalyst for enzymatic biofuel cells because of its reliability, stability, selectivity, catalytic activity, as well as low cost [14].
Although the FAD center is deeply buried inside GOD, the electron transfer between GOD and electrode is still facilitated by AuNP on the rGOD-AuNP composite. However, different from those reported one-pair of well-defined redox peaks in literatures [15,16,17,18,19,20], two-pairs of overlapped redox peaks are observed on the cyclic voltammograms of the GOD/rGON-AuNP electrode. It is reported that once adsorbed onto the AuNP, GOD goes through a massive structural rearrangement [21]. GOD adsorbs onto AuNP in different spatial orientations, and the two pairs of redox peaks might correspond to the redox processes of two different conformational GOD on AuNP. In our research, GOD maintains its catalytic activity toward glucose oxidation on the GON-AuNP composite. The research results are helpful for better understanding the electrode behavior of GOD on graphene-based composite, which is crucial in developing advanced electrode materials for electrochemical energy devices.

2. Results and Discussion

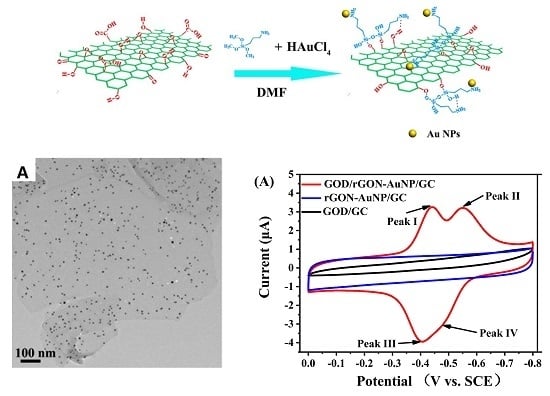
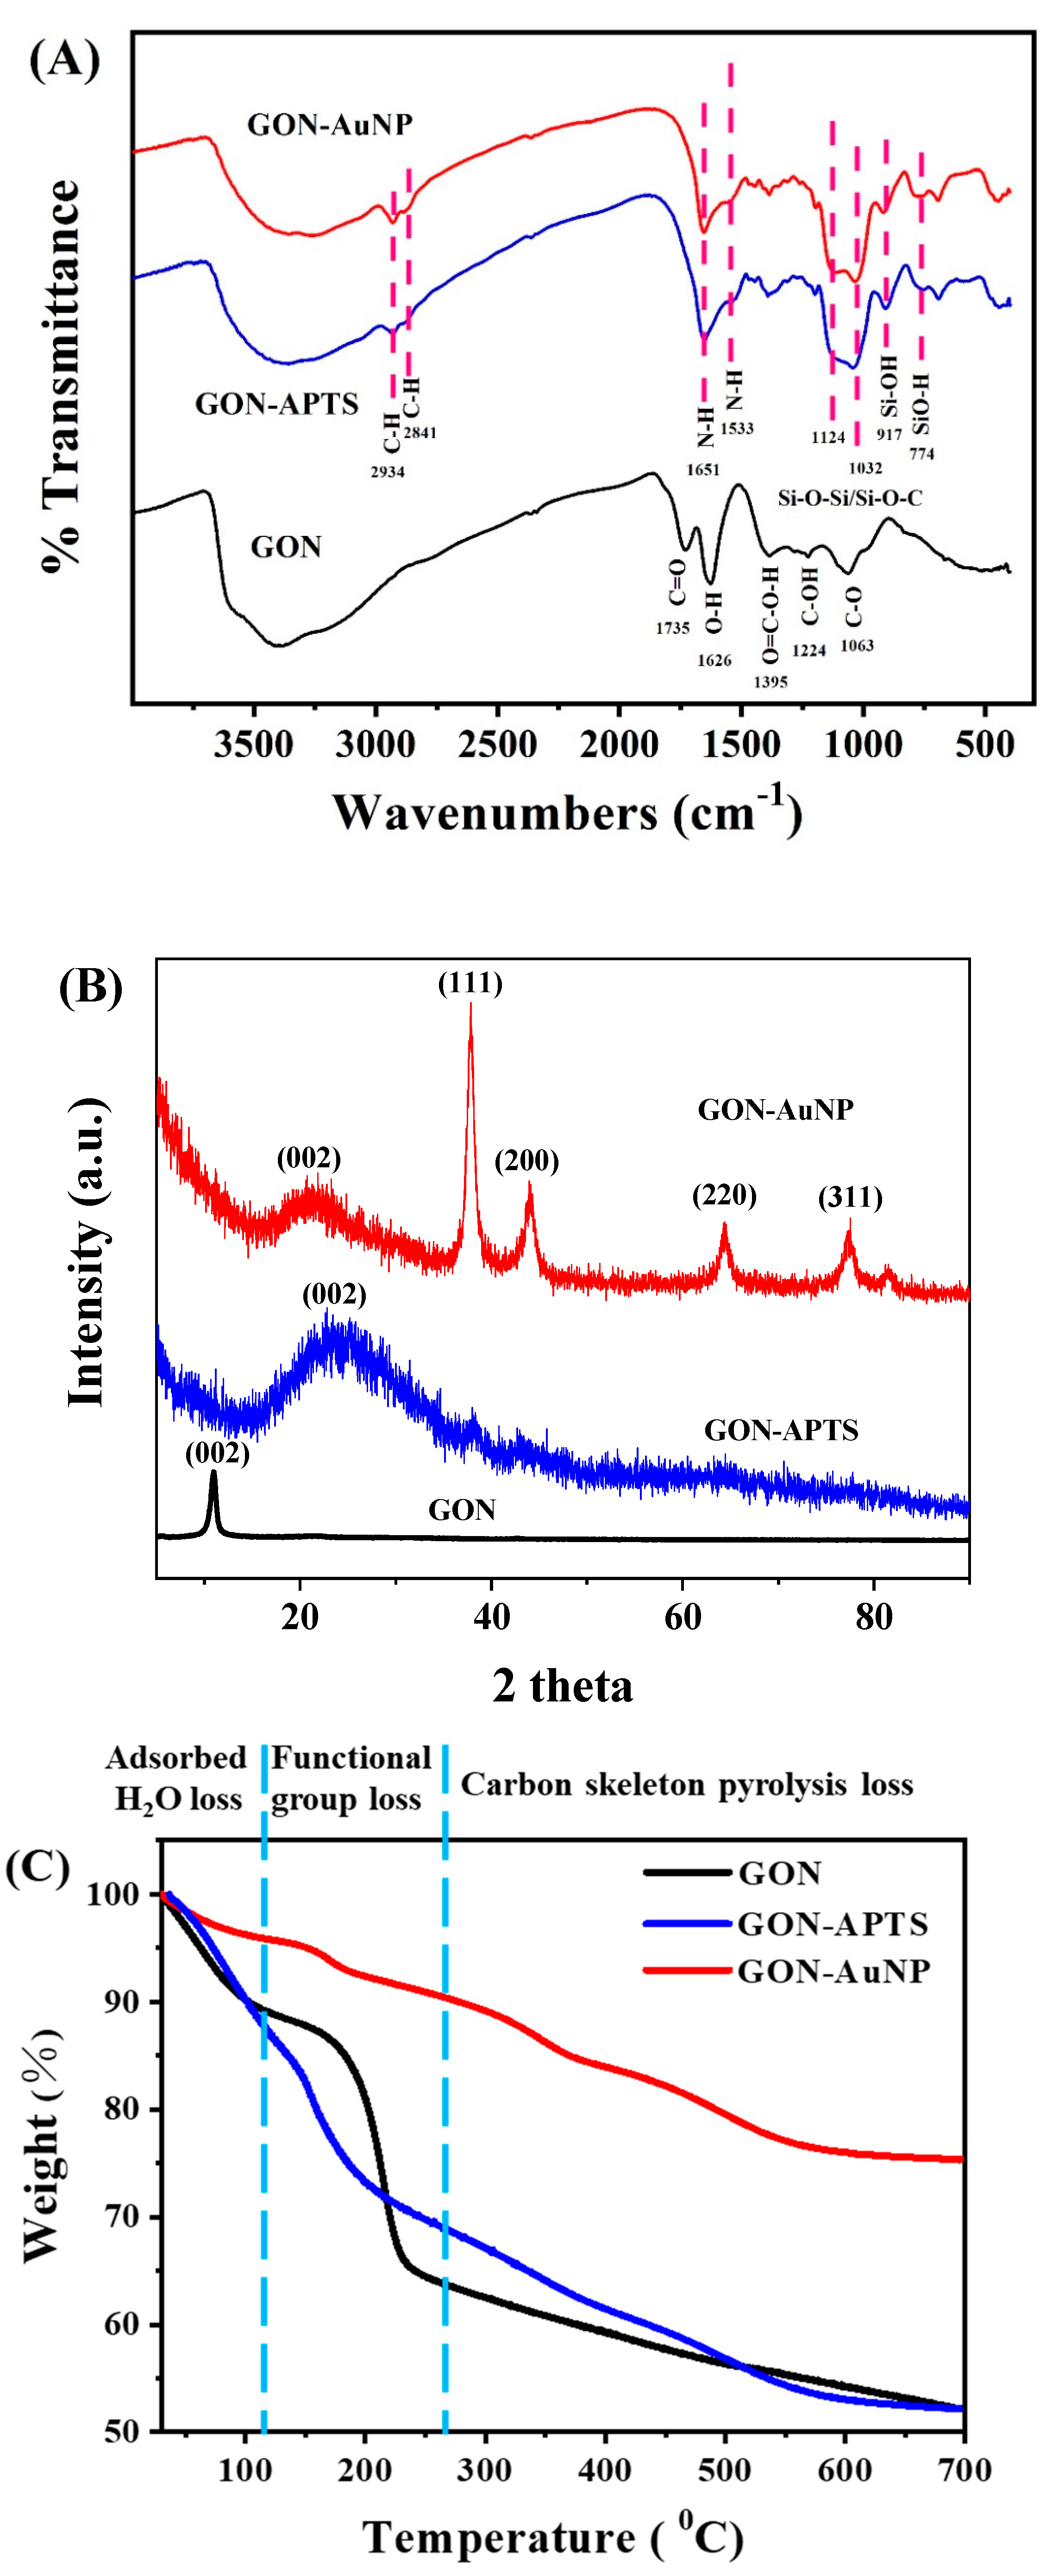
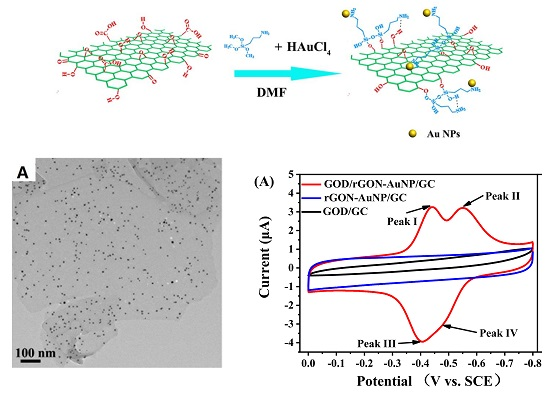
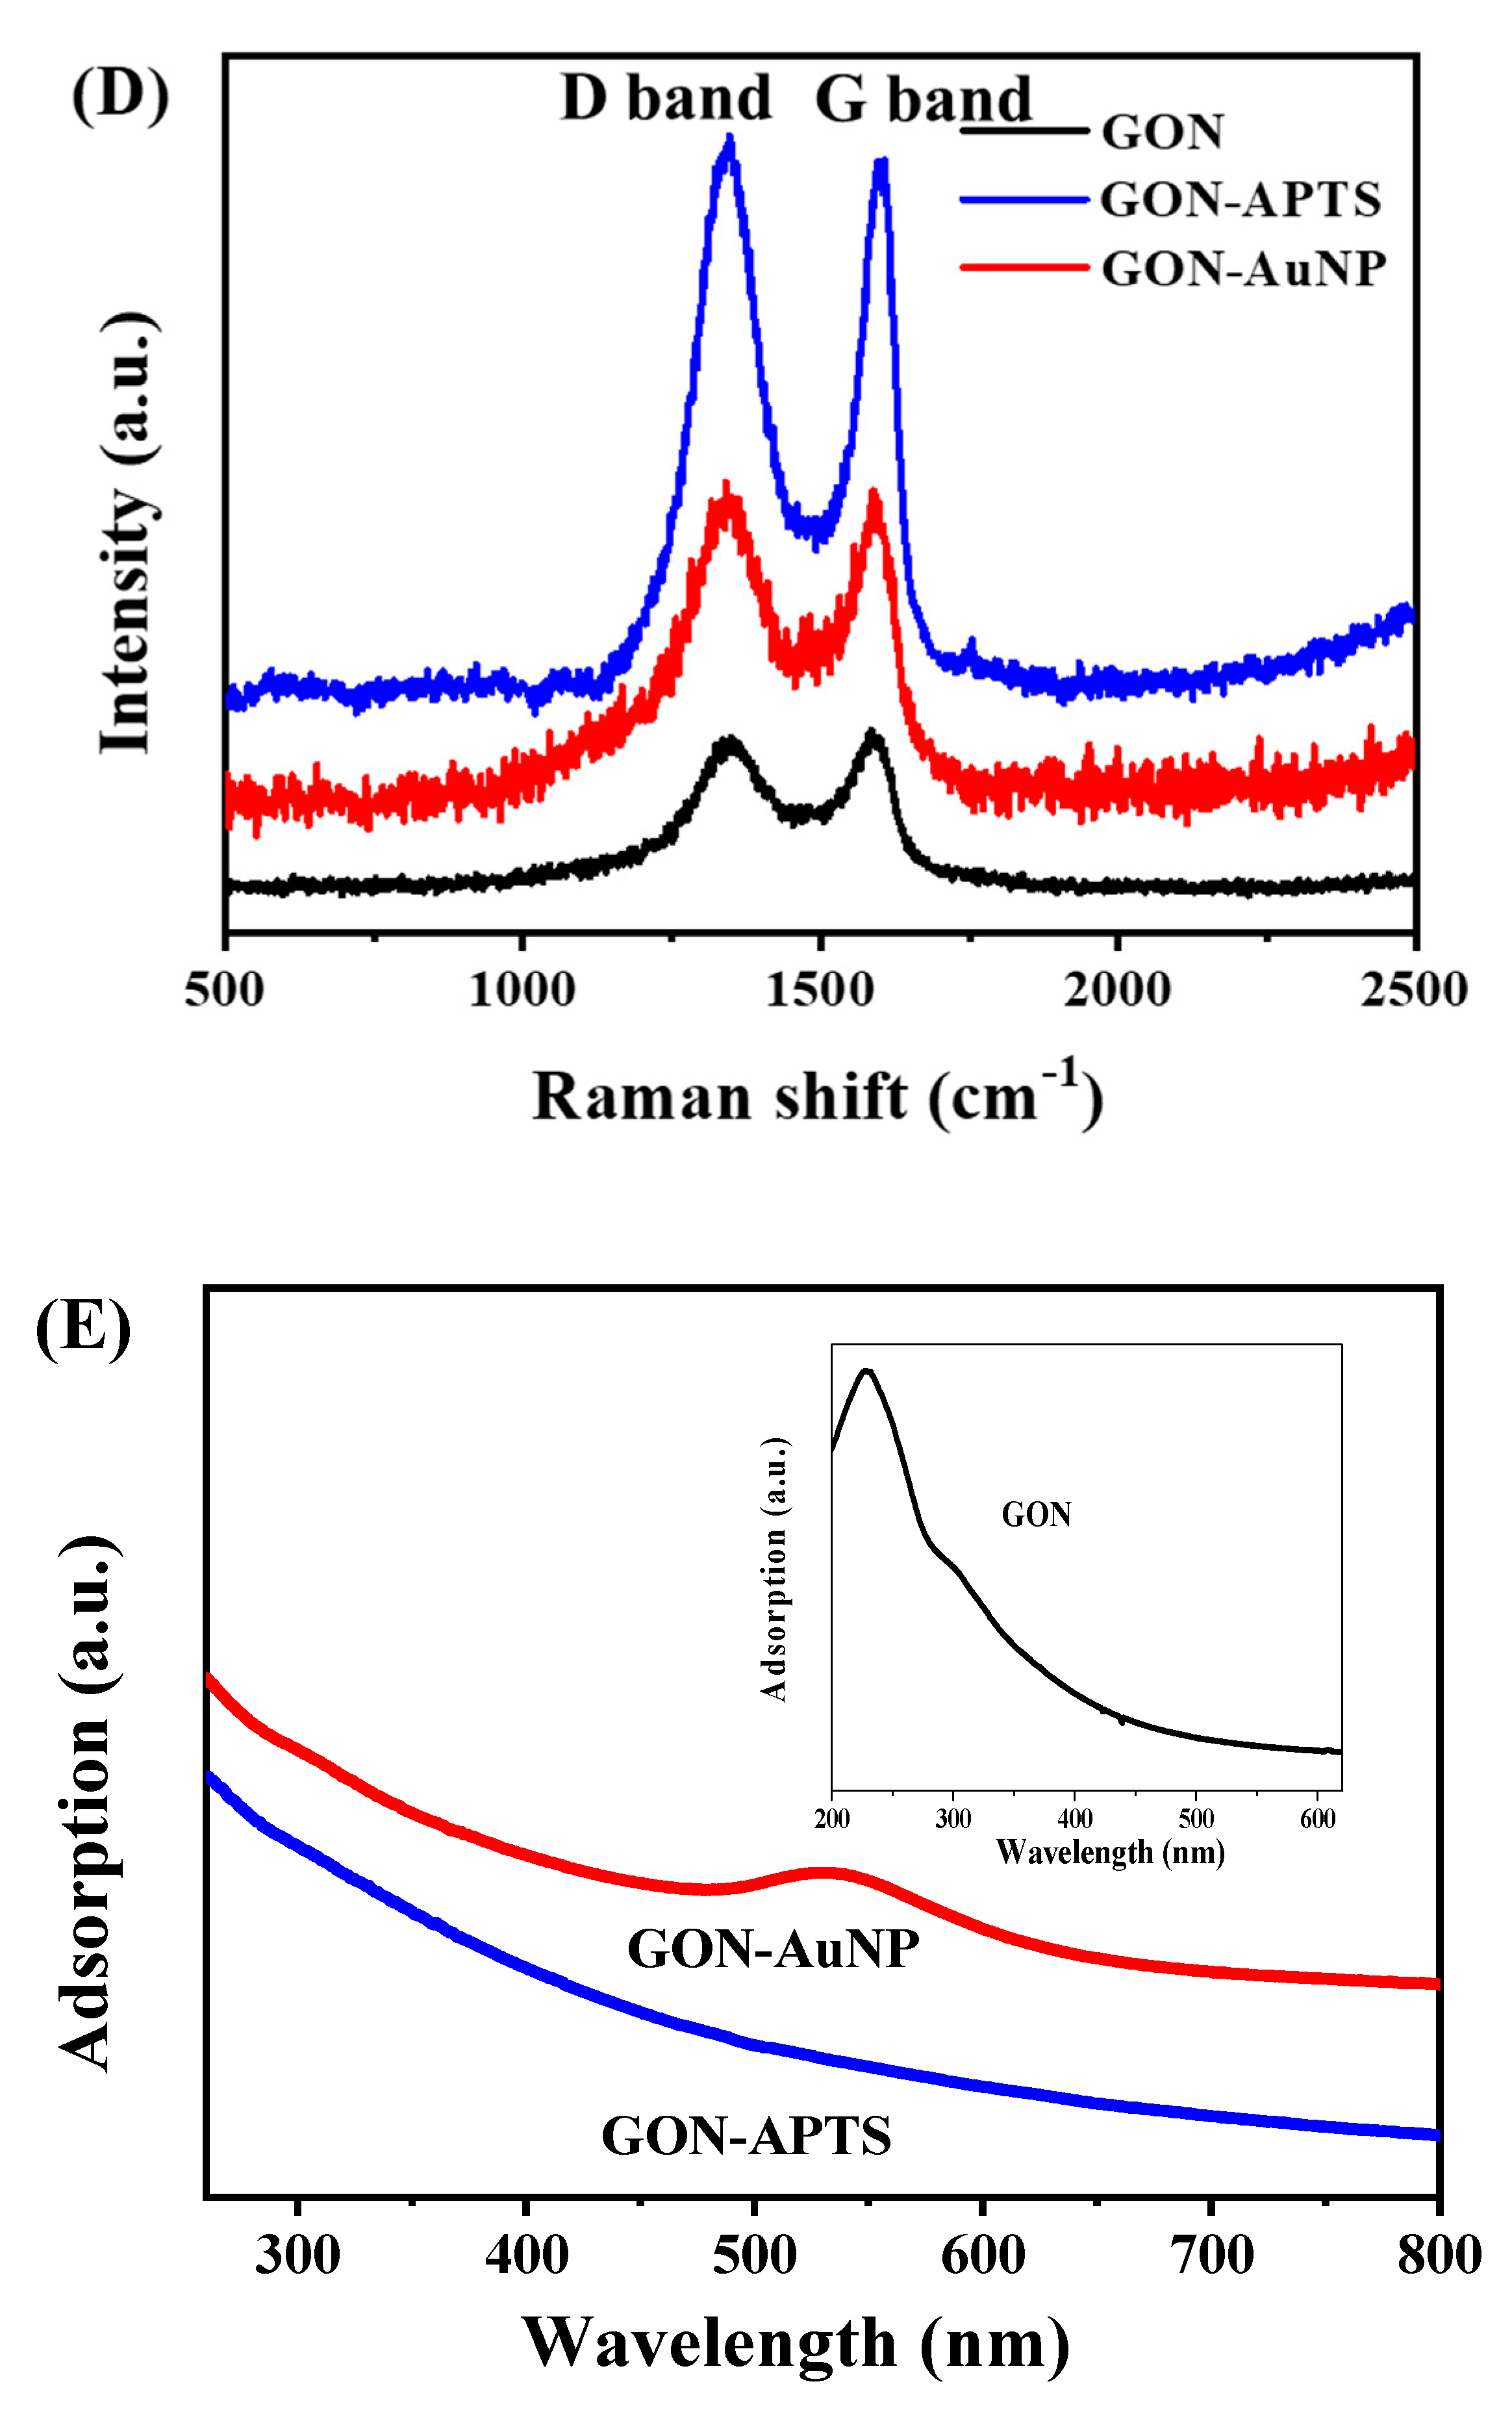
2.1. Morphology and Composition of GON-AuNP Composite

In this work, graphene oxide (GO) was first prepared from graphite flake according to the Hummers’ method [22]. As shown in Scheme 1, GON-AuNP composite is prepared according to the reference with some modification [23]. The morphology of GON-AuNP was first characterized by TEM, HRTEM, and SEM, as shown in Figure 1. The TEM (Figure 1A) and SEM (Figure 1C) images of GON-AuNP illustrates the flake-like shape and multi-layer structure of GON. It can also be seen that the well-dispersed AuNP with an average diameter of 6.36 nm are tightly anchored on the GON. The inset of Figure 1A shows corresponding size distribution of GON-AuNP. The HRTEM image shows space fringes of 0.23 nm which are well matched with the (111) planes of Au (Figure 1B). The EDX analysis confirms the presence of gold element in the composite (Figure 1D), and the peaks of N and Si in the EDX spectrum suggest the existence of APTS in GON-AuNP.
Figure 2A demonstrates the FTIR spectra of GON, GON-APTS, and GON-AuNP. In the spectrum of GON, the intense peak at 1735 cm−1 is assigned to the C = O stretching of carbonyl groups [24]. The distinct peaks at 1626 cm−1 is due to the O–H bending vibration of adsorbed water [25]. The peak at 1395 cm−1 corresponds to the O–H stretching vibration of carboxyl groups. The peak at 1224 and 1063 cm−1 are ascribed to the C–O stretching vibrations of epoxy groups and hydroxyl groups, respectively [24]. In the FTIR spectra of GON-APTS and GON-AuNP, several new peaks appear, confirming the presence of silane on the surface of GON. The anchored propyl groups on GON can be verified by the appearance of two new peaks at 2934 and 2841 cm−1, corresponding to the C–H asymmetric and symmetric stretching vibrations of propyl backbone of APTS [23], respectively. The broad peak at 1651 cm−1 is assigned to the N–H deformation vibration of free amino groups [26], confirming the presence of free amino groups on the surface of GON in both GON-APTS and GON-AuNP. The peak at 1533 cm−1 corresponds to N–H bending vibration of H-bonded amino groups, suggesting there are some amino groups forming H-bonds with hydroxyl groups [27] (Scheme 1). The bands at 1124 and 1032 cm−1 are due to Si–O–C/Si–O–Si vibrations, corresponding to siloxane units formed during the silanization process [28]. The adsorption peaks at 917 and 774 cm−1 are typical peaks for Si–OH stretching and SiO–H bending vibrations, respectively [27]. The two peaks appear once trimethoxy groups are broken to form silanol groups. The silanol groups can interact with hydroxyl moieties on GON to form Si–O–C bonds, leaving the amino groups of APTS extended from the surface of GON (Scheme 1). The adsorption band at 1735 cm−1 can be assigned to the C = O stretching of carbonyl groups on GON, however, disappears in the spectra of both GON-APTS and GON-AuNP because of the removal of oxygen-functionalities on GON by DMF [29]. During the preparation of GON-AuNP, negatively charged AuCl4 ions can be adsorbed on the amino groups of APTS on GON. DMF acts as the reductant, reducing AuCl4 ions to AuNP [30].
The structures of GON, GON-APTS, and GON-AuNP were further probed by XRD measurements (Figure 2B). XRD pattern of GON shows a representative (002) peak around 10.98°, representing an interlayer space of 8.05 Å. The interlayer space of GON is much larger than that of graphite, which can be ascribed to the existence of oxygen-containing groups and the adsorbed water molecules on GON [31]. In the XRD pattern of APTS-GON, the (002) peak shifts to 23.82°, corresponding to an interlayer space of 3.73 Å. The interlayer space of GON-APTS is much smaller than that of GON, presumably owning to the removal of oxygen-containing groups on GON by DMF. The larger interlayer space of GON-APTS than that of graphite can be ascribed to silane moieties grafted onto GON. In the XRD pattern of GON-AuNP, the peaks at 21.21°, 37.90°, 44.04°, 64.43°, and 77.32° are assigned to the (111), (200), (220), (311), and (222) planes of gold (JCPDS 04-0784) [32]. Crystallite size of AuNP is calculated from the Au (111) diffraction line using Scherrer’s equation. The average size of AuNP is calculated to be about 6.2 nm, which is consistent with the result from both TEM and SEM images (Figure 1). The characteristic (002) peak of GON, can also be observed in the XRD pattern of GON-AuNP, confirming the successful synthesis of GON-AuNP composite. The (002) peak locates at 21.21° corresponds to an interlayer space of 4.19 Å, which is larger than that of GON-APTS. The larger interlayer space can be attributed to the AuNP on the surface of GON-APTS.
Figure 2C illustrates the TGA curves of GON, GON-APTS, and GON-AuNP. Two major weight losses are observed on the TGA curve of GON. The continuous weight loss from ambient temperature to 110 °C is due to the loss of the adsorbed water. The weight loss between 160 and 250 °C is probably attributed to the decomposition of oxygen groups on GON [33]. The weight loss beyond 250 °C is caused by the pyrolysis of the carbon skeleton of GON [34]. On the TGA curve of GON-APTS, the weight loss between 160 and 200 °C is smaller than that of GON because many oxygen-containing groups on GON were converted and removed. From 460 to 580 °C, GON-APTS shows a mass loss presumably caused by pyrolysis of the silane moieties bonded to GON [35]. The residual weight percentage of GON-APTS at 700 °C is about 52%, which is almost the same as that of GON. On the TGA curve of GON-AuNP, the weight losses because of the decomposition of oxygen functionalities and pyrolysis of silane groups are both observed. The residual weight percentage of GON-AuNP is 75% at 700 °C, indicating that the Au content in the composite is about 23%.
The Raman spectra of GON, GON-APTS, and GON-AuNP are displayed in Figure 2D. The spectra of all three samples contain both D band at about 1348 cm1 which corresponds to the breathing mode of κ-point phonons of A1 g and G band at around 1586 cm−1 which is assigned to the E2 g phonon of C sp2 atoms. The relative intensity ratio of G and D bands (ID/IG) reveals the change of the electronic conjugation of GON [36]. The ID/IG value of GON is 0.902. The ID/IG values of GON-APTS and GON-AuNP are 1.025 and 1.040, respectively. As some oxygen functionalities on GON are removed by DMF, the ID/IG values of GON-APTS and GON-AuNP are increased because of the decrease of the average size of sp2 domains [36].
Figure 2E displays the UV-vis spectra of GON-APTS and GON-AuNP DMF dispersions. The insert of Figure 2E is the UV-vis spectrum of GON aqueous dispersion, in which the characteristic peak at 230 nm is assigned to the π-π* transitions of aromatic C = C bonds, while the shoulder peak at 300 nm belongs to the n-π* transitions of C = O bonds [37]. The spectra of GON-APTS and GON-AuNP DMF dispersions were recorded after 265 nm because of the impossible appropriately recompensing for the strong absorption of both solvents at smaller wavelengths [38] In the spectra of GON-APTS and GON-AuNP, the peak at 300 nm disappears, which is attributed to the conversion and removal of oxygen functionalities on GON. In the spectrum of GON-AuNP, the characteristic surface plasmon resonance at 534 nm is observed, confirming the existence of AuNP in the composite.

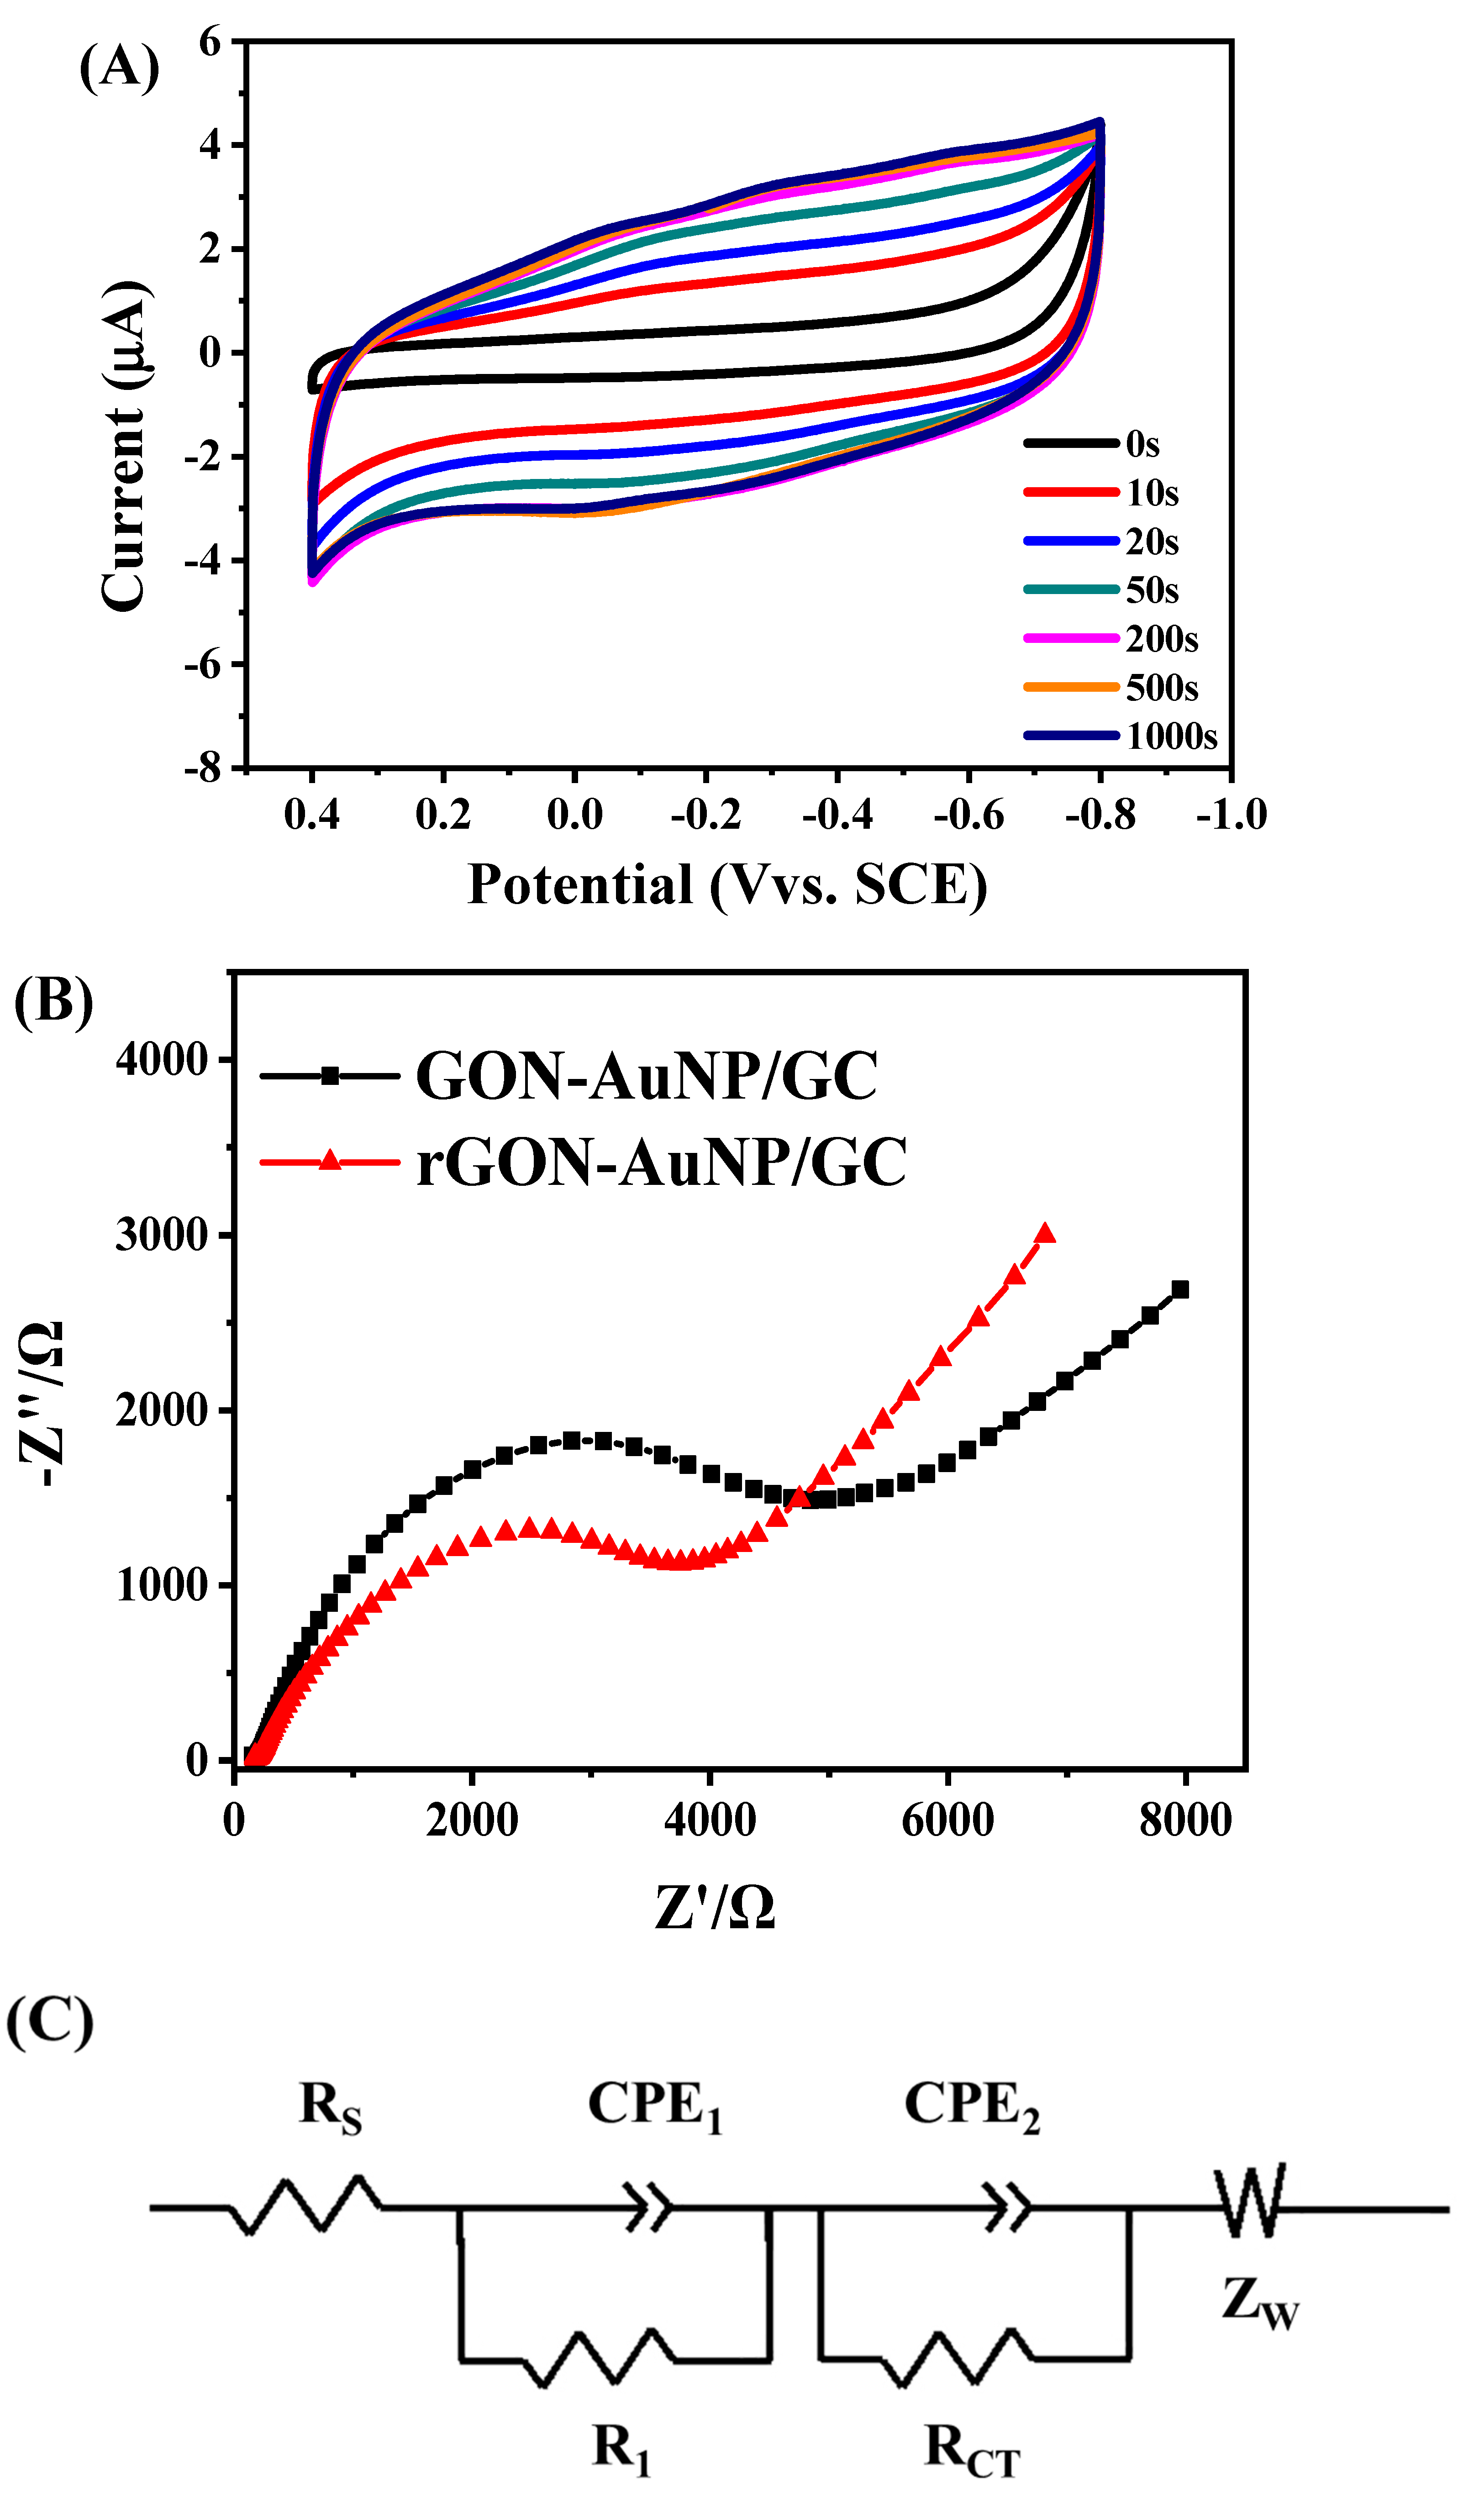
2.2. Potentiostatic Reduction of GON-AuNP

Potentiostatic reduction of GON-AuNP was conducted in 0.1 M KCl at an electrode potential of −1.0 V (vs. SCE). Figure 3A shows the cyclic voltammograms of GON-AuNP after potentiostatic reduction at different times. The cyclic voltammetric techniques were performed between −0.8 to 0.4 V at the sweep speed of 50 mV/s. In Figure 3A, the black line is the cyclic voltammograms of GON-AuNP. Because of the oxygen functionalities on GON, a strong reduction peak at −0.5 V can be observed. The red line in Figure 3A is the cyclic voltammogram of GON-AuNP after potentiostatic reduction at −1.0 V for 10 s. The removal of oxygen-containing groups after electrochemical reduction can result in the recovery of the π-conjugated network and the increase of the conductivity of GON-AuNP, leading to the increase of the double layer currents [29]. However, the reduction peak current decreases because of the removal of some oxygen-containing groups. With increasing reduction time, the double layer current of GON-APTS increases, while the reduction peak current of GON-AuNP decreases. After 200 s of reduction, the reduction peak cannot be observed any more on the cyclic voltammograms, and the double layer currents almost keep constant, suggesting nearly no more oxygen functionalities could be removed after 200 s. rGON-AuNP was prepared by potentiostatic reduction of GON-AuNP for 1000 s.
Electrochemical impedance spectroscopy (EIS) was performed to examine the electrochemical behaviors of GON-AuNP and rGON-AuNP. Figure 3B displays the Nyquist plots of GON-AuNP and rGON-AuNP. Both the plots show semicircles in the high frequency region and a straight line (45°) in the low frequency region. The high-frequency semicircles correspond to the charge transfer resistances initiated from the Faradic reactions (Rct) and the double-layer capacitance at the interface of solution and electrode (Cdl). The Rct values of GON-AuNP and rGON-AuNP are 3.1 × 10³ and 2.3 × 10³ Ω, respectively. The Rct value of rGON-AuNP is smaller than that of GON-AuNP, which can be attributed to the removal of some oxygen-containing groups and the restack of the π-conjugated network. The Rct value of rGON-AuNP is 2.3 × 10³ Ω, which is much larger than that of rGO reported [39], indicating the residual oxygen-containing groups on GON. To fit the EIS data, the electrical equivalent circuit obtained based on electrochemical impedance measurements is shown in Figure 3C, where RS, CPE, and RCT represent the electrolyte resistance, constant phase element, and the charge transfer resistance, respectively. In the EIS spectrum of rGON-AuNP, the straight line portion with the slope of 45° is called the Warburg resistance (Zw in Figure 3C) which is due to the frequency dependence of ion diffusion in the electrolyte to the electrode interface, confirming an ion diffusion process.
Figure S1A shows the FTIR spectrum of rGON-AuNP. As a comparison, the FTIR spectrum of GON-AuNP is also shown. The IR bands at 2932, 2817, 1625, 1124, and 1032 cm−1 can be still observed in the spectrum of rGON-AuNP. Figure S1B displays the XRD patterns of rGON-AuNP. As a comparison, the XRD pattern of GON-AuNP is also shown. In the XRD pattern of rGON-AuNP, the (002) peak is located at 25.33°, corresponding to a d002 value of 3.51 Å, which is smaller than that of GON-AuNP. The decrease in the d002 value of GON-AuNP after electrochemical reduction can be ascribed to the removal of oxygen-containing groups. Figure S1C shows the Raman spectra of GON-AuNP and rGON-AuNP. The ID/IG value of rGON-AuNP is 1.069, which is larger than that of the GON-AuNP, suggesting the decrease in the average size of sp2 domains of GON after electrochemical reduction.

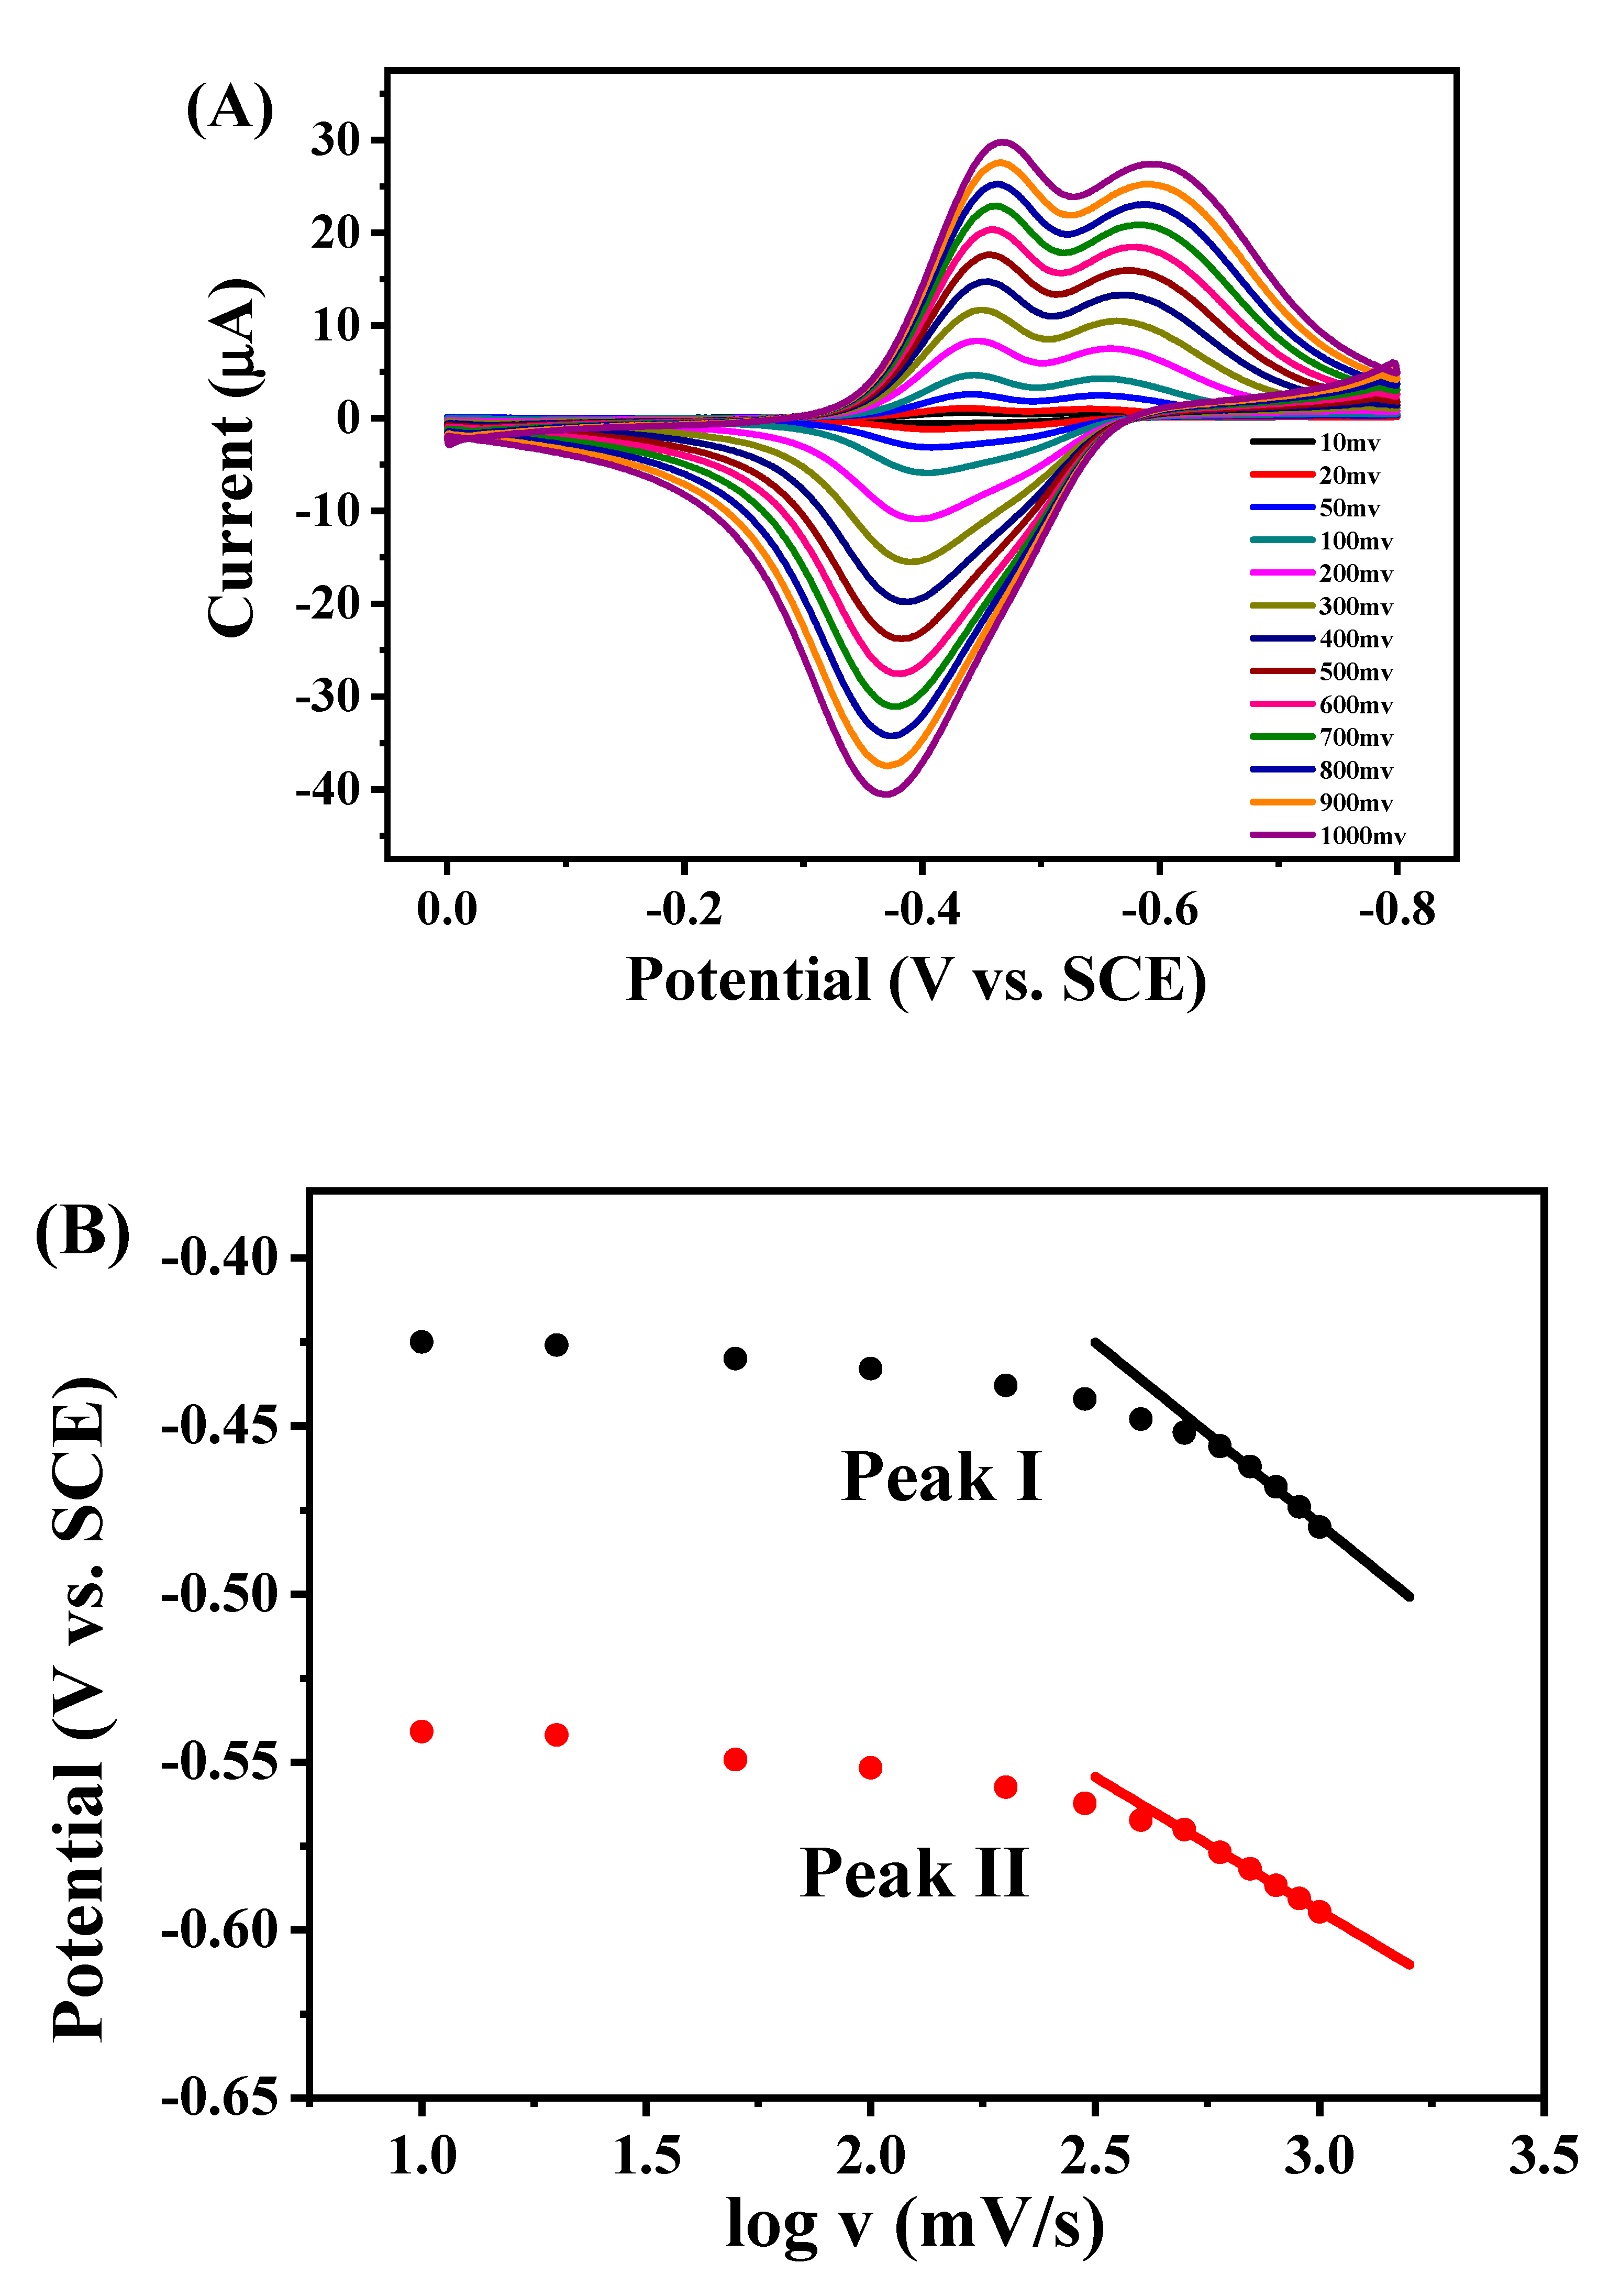
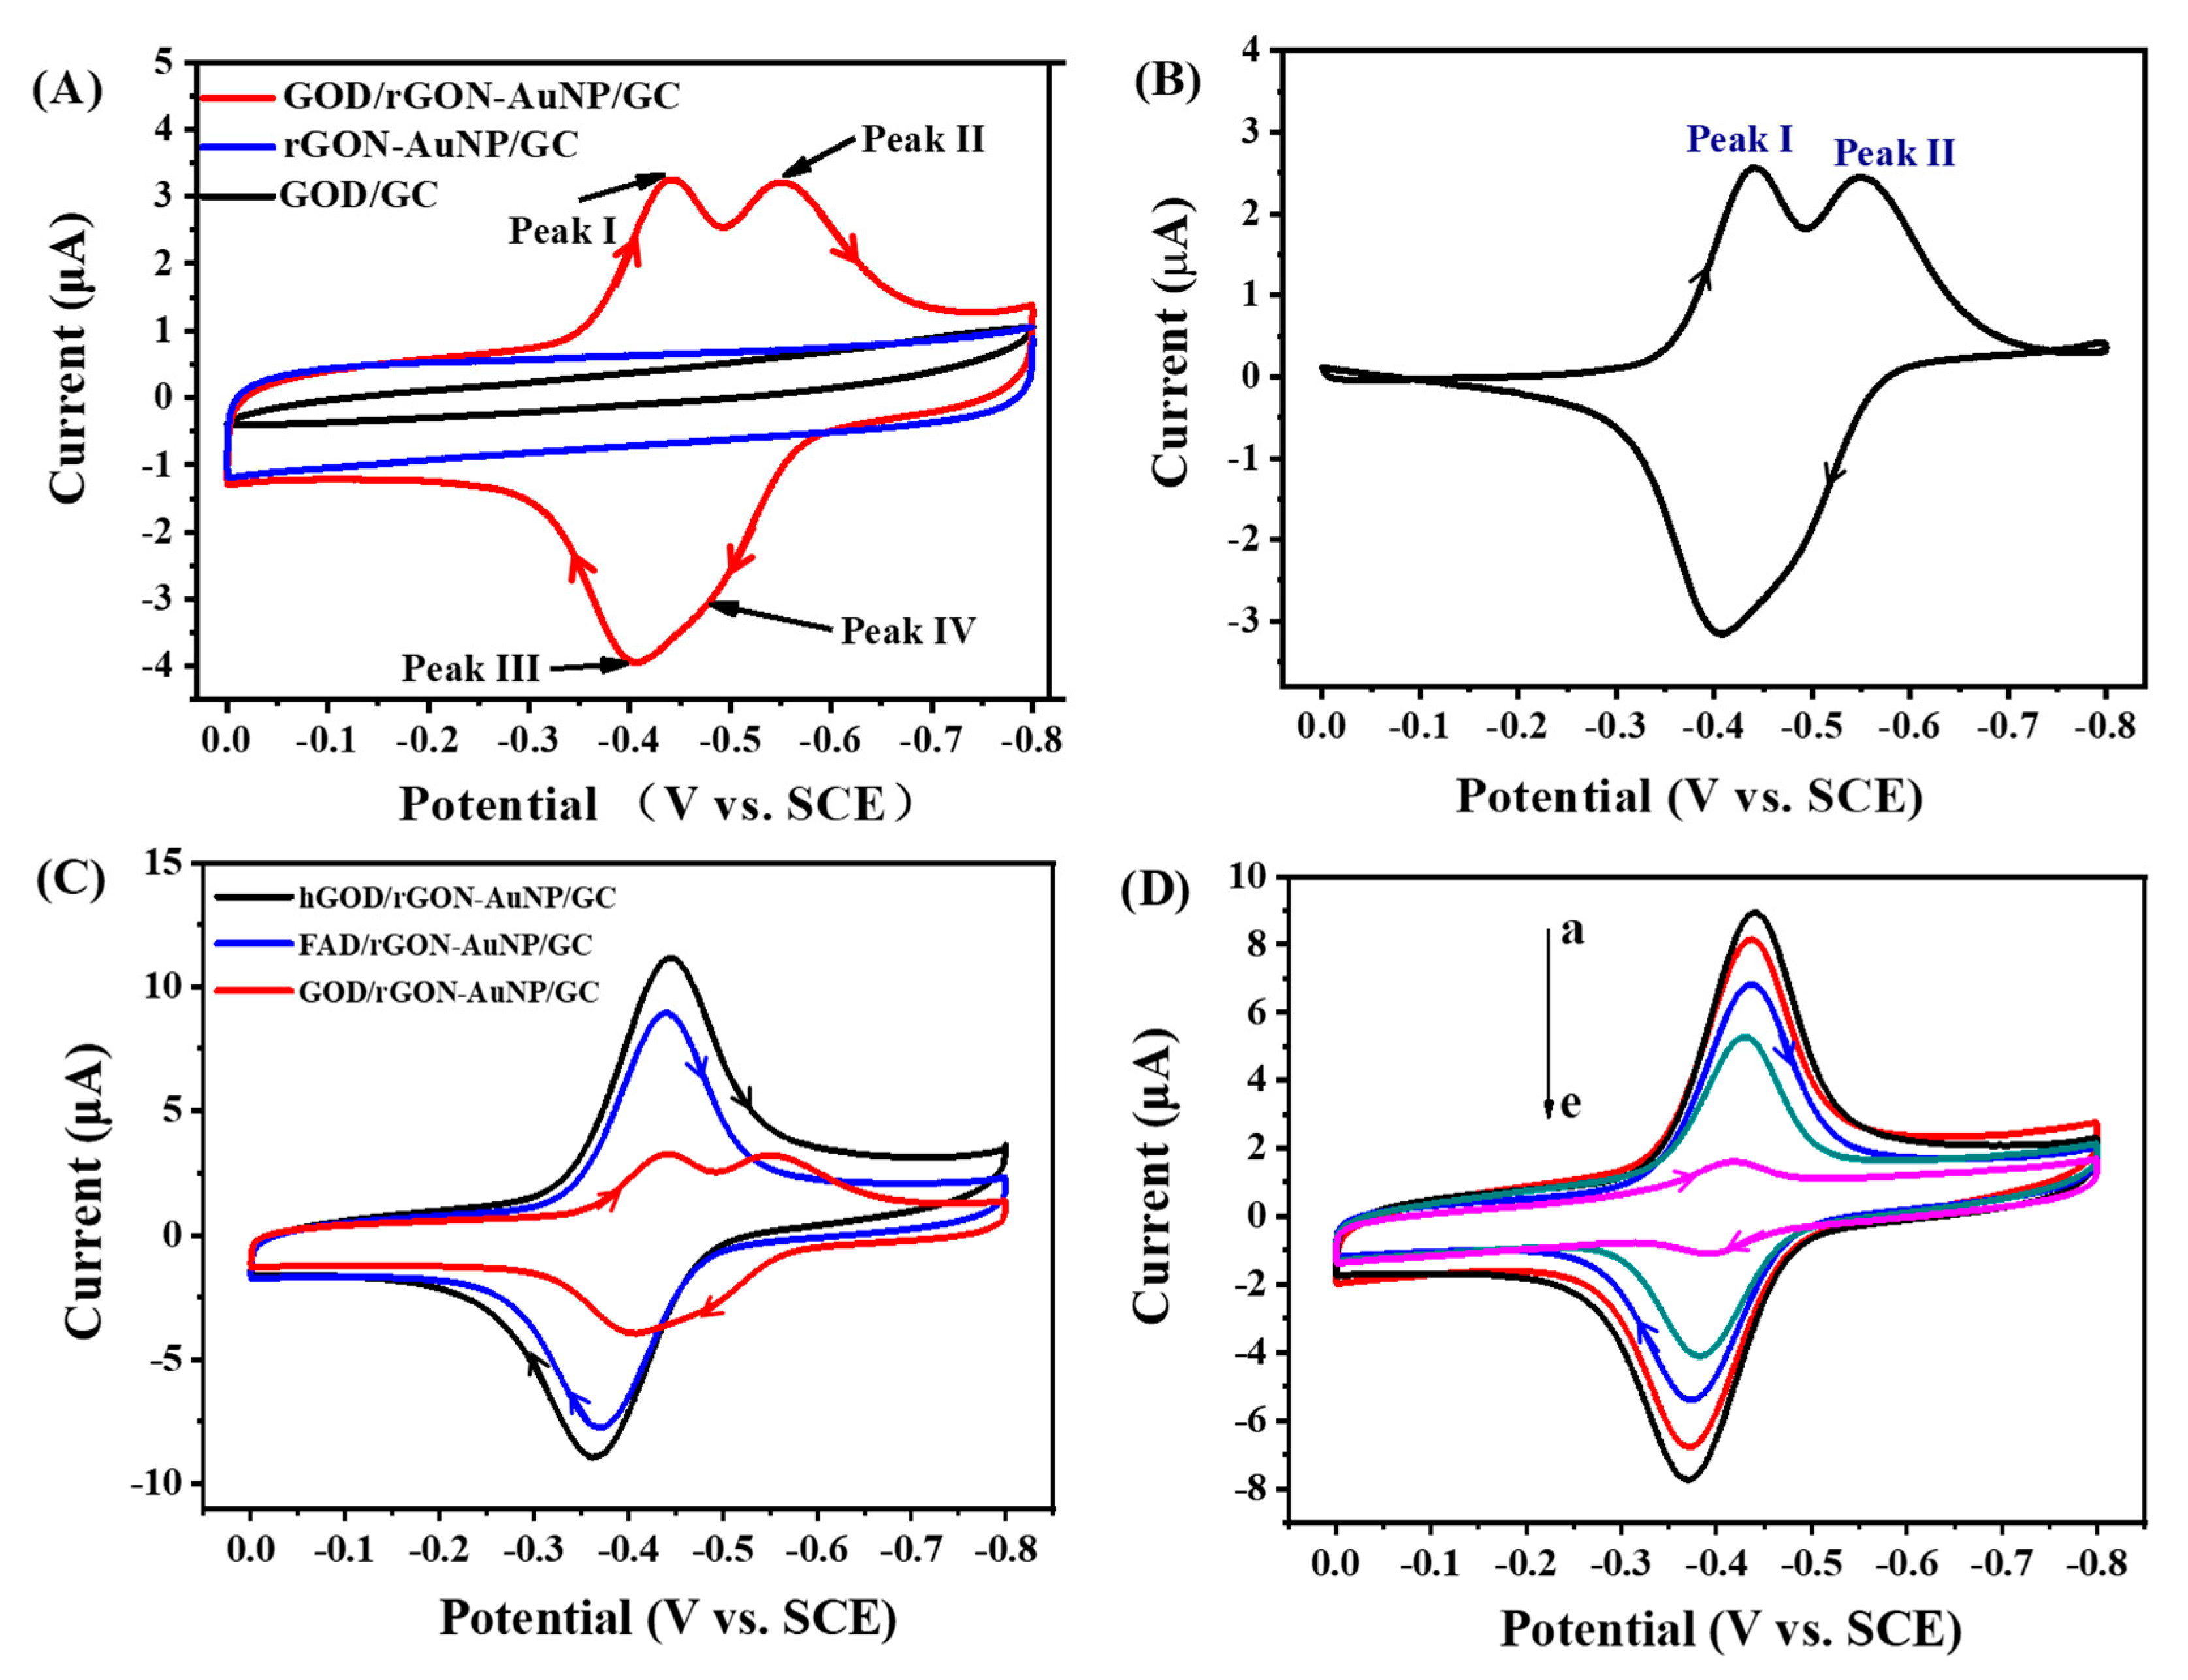
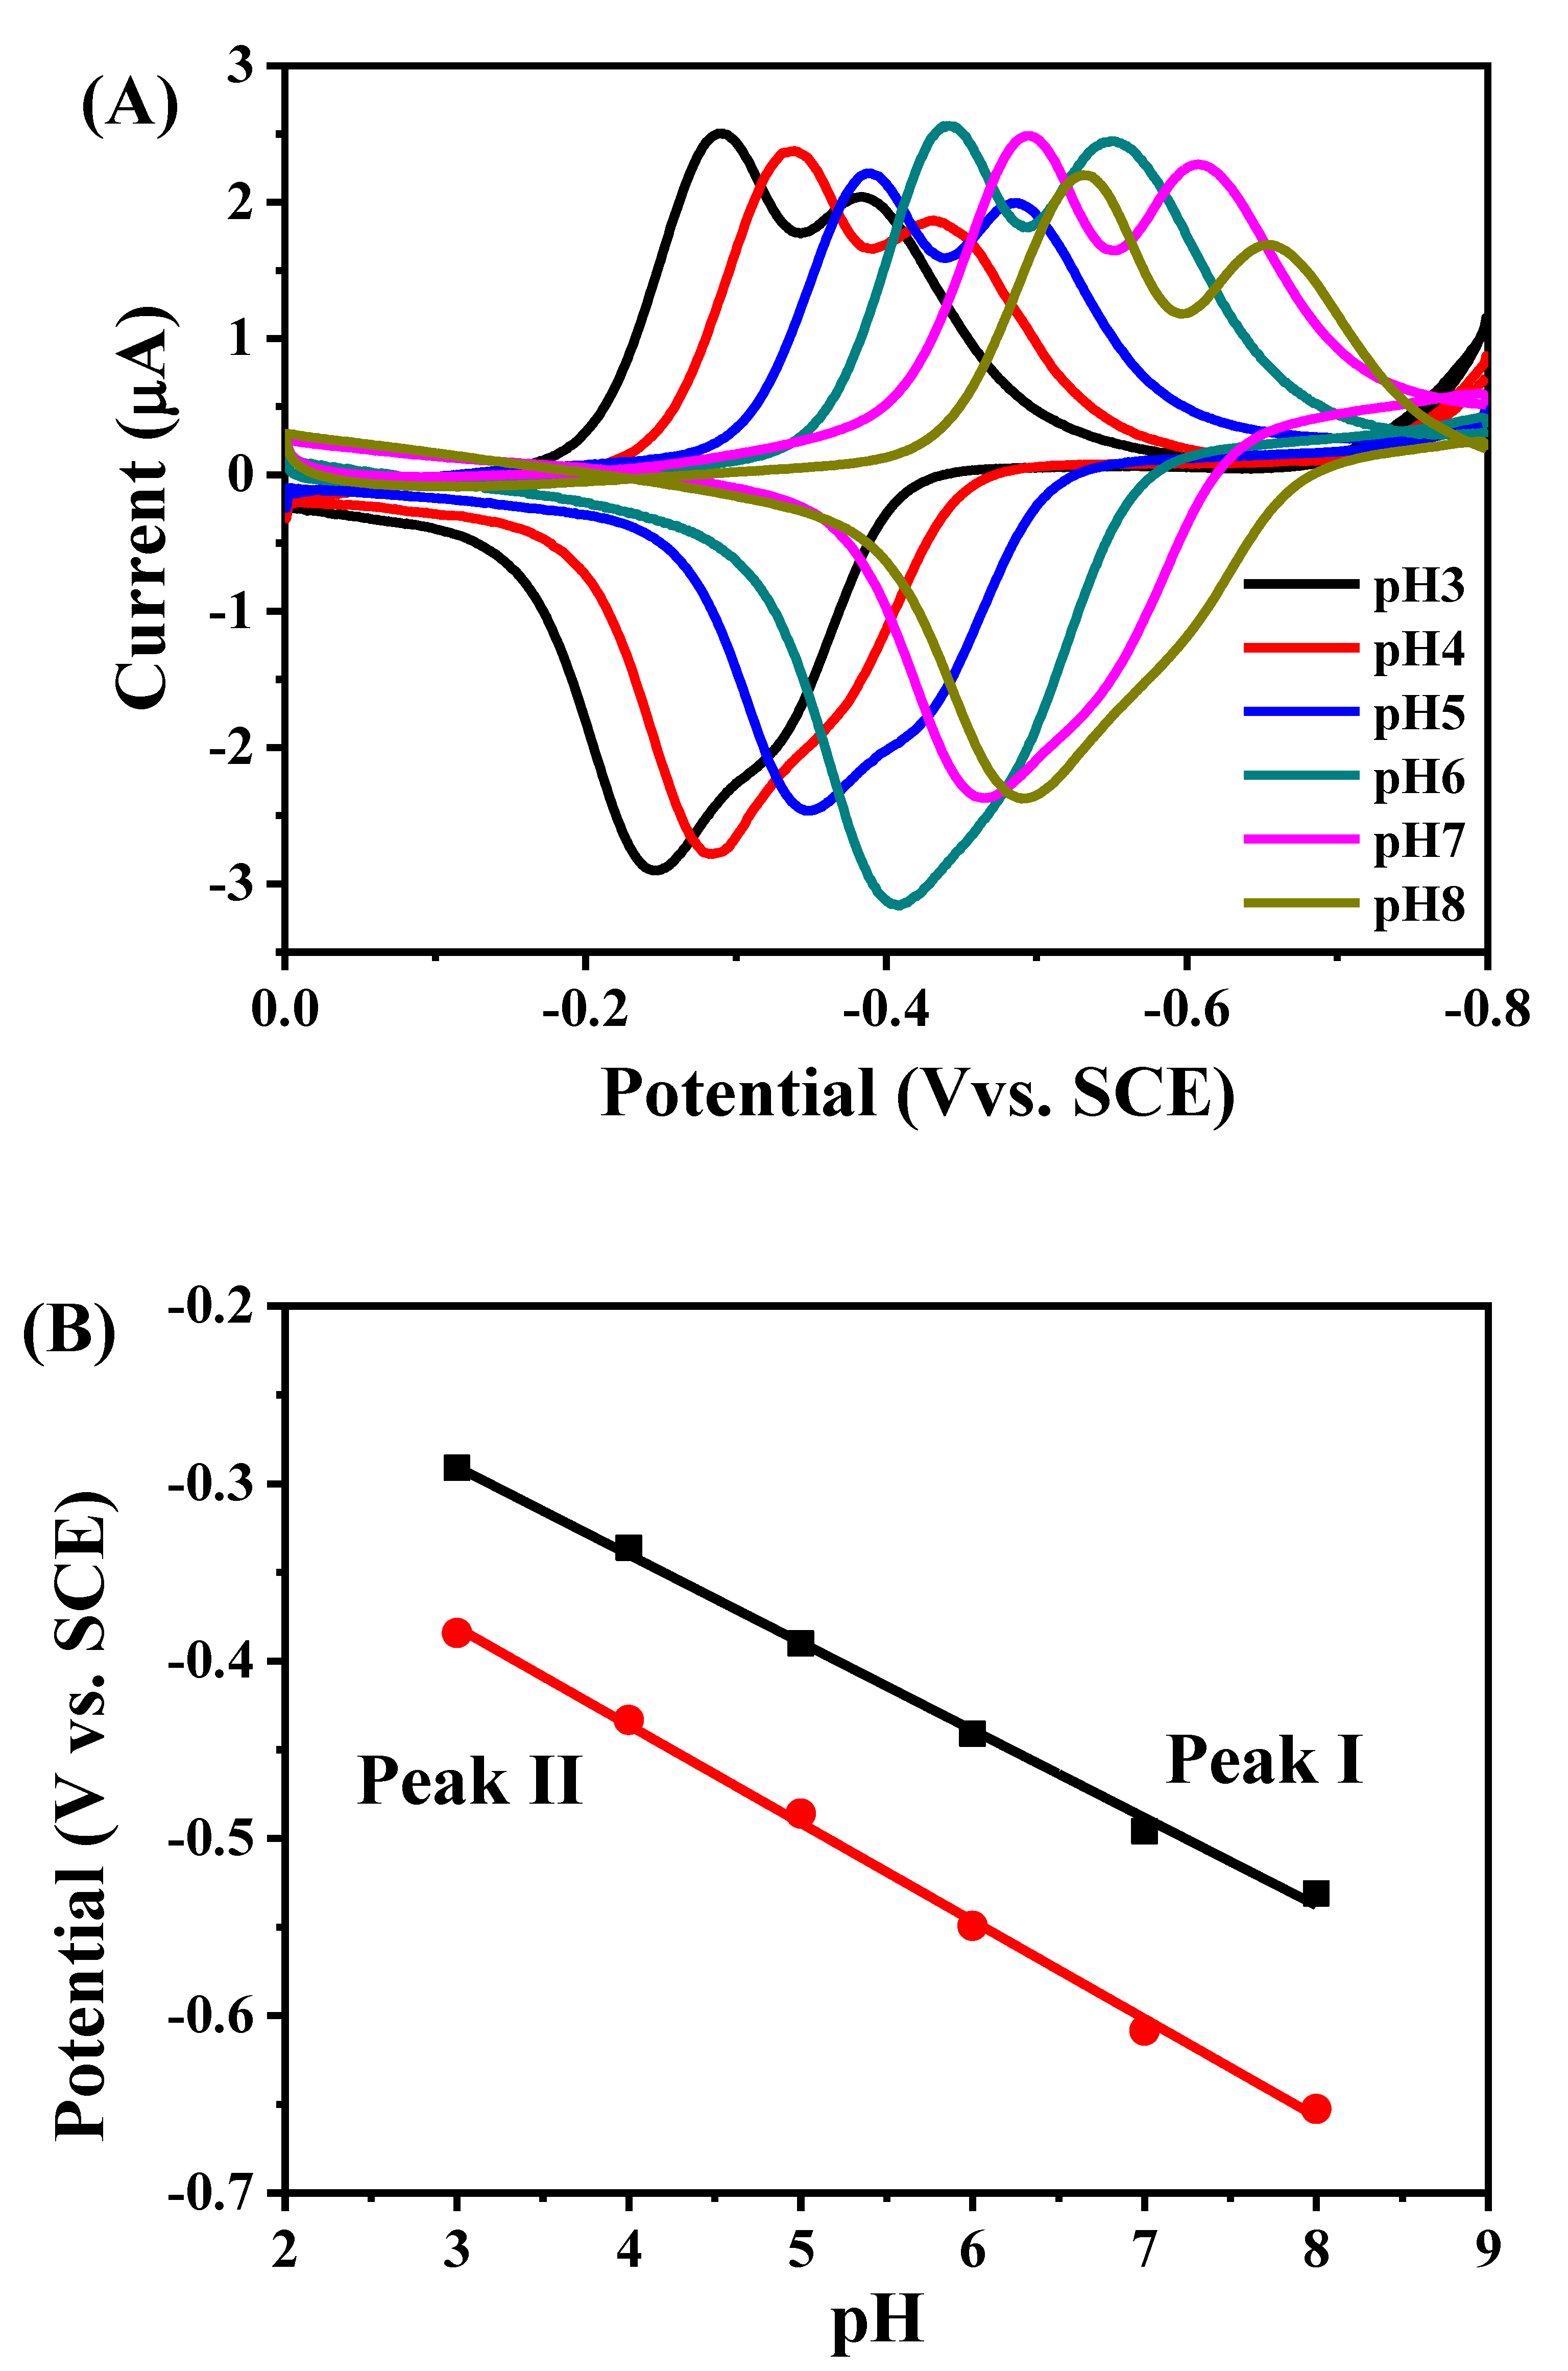
2.3. Direct Electron Transfer between GOD and rGON-AuNP/GC Electrode

Figure 4A presents the cyclic voltammograms of GOD/GC, rGON-AuNP/GC, and GOD/rGON-AuNP/GC electrodes in 0.1 M PBS at a potential scanning rate of 50 mV/s. No redox peaks are observed on the cyclic voltammogram of GOD/GC electrode, suggesting that there is no electron transfer between GOD and the bare GC electrode. The cyclic voltammogram of rGON-AuNP/GC electrode shows no redox peaks in the potential scanning range, while two pairs of overlapped redox peaks are observed on the cyclic voltammogram of GOD/rGON-AuNP/GC electrode, which is different from that of GOD on other reported electrode materials. The peak potentials of peak I and peak II (EpI and EpII) can be directly obtained from the cyclic voltammograms of GOD/rGON-AuNP/GC electrode because the two overlapped peaks have a peak separation of over 100 mV. The peak potentials of peak III (EpIII) and peak IV (EpIV) are two overlapped peaks which can be separated by performing a simulation. The values of EpI, EpII, and EpIV are −0.434 V, −0.540 V, and −0.407 V, respectively. The first pair of redox peaks (EpI and EpIII) has a formal potential of −0.421 V with a peak separation of 24 mV. The surface coverage concentration (Γ) of GOD at GOD/rGON-AuNP/GC electrode is calculated as 4.29 × 10⁻¹⁰ mol/cm2 using the anodic peak area according to the equation of Γ = Q/nFA, where Q is the charge (5.81 × 10⁻⁶ C), n is transferred electron number (n = 2), F is the Faraday’s constant, and A is the area of GCE electrode (0.07 cm2). The surface coverage concentration of GOD on rGON-AuNP/GC is low, which provides enough space for conformation change of GOD. That is the reason why two overlapped redox peaks can be observed on the cyclic voltammograms of GOD/rGON-AuNP/GC. The two overlapped redox peaks correspond to the redox processes of GOD with two different conformational structures.
hGOD/rGON-AuNP/GC electrode was constructed by incubating the rGON-AuNP/GC electrode in a higher concentration of GOD solution (5 mg/L). One pair of redox peaks centered at 0.406 V with a peak separation of 81 mV is observed on the cyclic voltammogram of hGOD/rGON-AuNP/GC electrode (black line in Figure 4C), suggesting that the direct electron transfer of GOD can also be achieved on hGOD/rGON-AuNP/GC electrode. This pair of redox peaks is ascribed to the two-electron two-proton redox process of GOD. The Γ value of GOD at hGOD/rGON-AuNP/GC electrode is calculated to be 8.42 × 10⁻¹⁰ mol/cm2 which is almost as twice as that on GOD/rGON-AuNP/GC. The surface coverage concentration of GOD on hGOD/rGON-AuNP/GC is so high that GOD cannot adsorb onto AuNP with a different conformational structure. That is why only one pair of redox peaks is observed. To see the redox peaks more clearly, the cyclic voltammograms of GOD/rGON-AuNP/GC after subtraction of background current is shown in Figure 4B.
Free FAD, which might be presented in GOD sample from commercial source, can be adsorbed on rGON-AuNP/GC electrode too. FAD/rGON-AuNP/GC electrode was constructed to study the electrochemical behavior of free FAD adsorbed on the composite. The cyclic voltammogram of FAD/rGON-AuNP/GC electrode is presented in Figure 4C (blue line), and only one pair of redox peaks is observed. The pair of redox peaks corresponds to the two-electron two-proton redox process of FAD/FADH2. The formal potential of the pair of redox peaks is −0.405 V. We also tried to incubate the rGON-AuNP/GC electrode in FAD salt solution with the concentration ranging from 6 mM to 0.01 mM, and the overlapped redox peaks are not observed on the cyclic voltammograms of the electrodes (Figure 4D), proving that the two overlapped redox peaks results are not from the low concentration of FAD, but from the conformation changes of the proteins in GOD.
Figure 5A shows the effect of scanning rate on the cyclic voltammetric performance of GOD/rGON-AuNP/GC electrode. Figure 5B shows the plots of EpI and EpII vs. logarithm of scanning rates. It can be seen that EpI is linearly dependent on the logarithm of scanning rates in the range of 600–1000 mV/s with −2.3 RT/αnF for the slop of the regression equation. α is the charge transfer coefficient. The charge transfer coefficient is 0.54. EpII is linearly dependent on the logarithm of scanning rates in the range of 500–1000 mV/s. The charge transfer coefficient is 0.75.
The pH value effect on the electrochemical behavior of GOD at rGON-AuNP/GC electrode is shown in Figure 6A. GOD displays two overlapped redox peaks from pH 3.0 to pH 8.0, and the peak potentials of the redox peaks all shift negatively with increasing pH value. The shift of peak potentials with pH value demonstrates the proton coupled electron transfer reactions. The plots of EpI and EpII vs. pH value both exhibit linear relationships over the entire pH range. The slopes of the linear regression equations of EpI and EpII are −49 mV/pH and −55 mV/pH, respectively. Both the slope values are close to the theoretical value of −58.6 mV/pH, demonstrating the two redox processes are both two-electron together with two-proton redox processes [40,41].

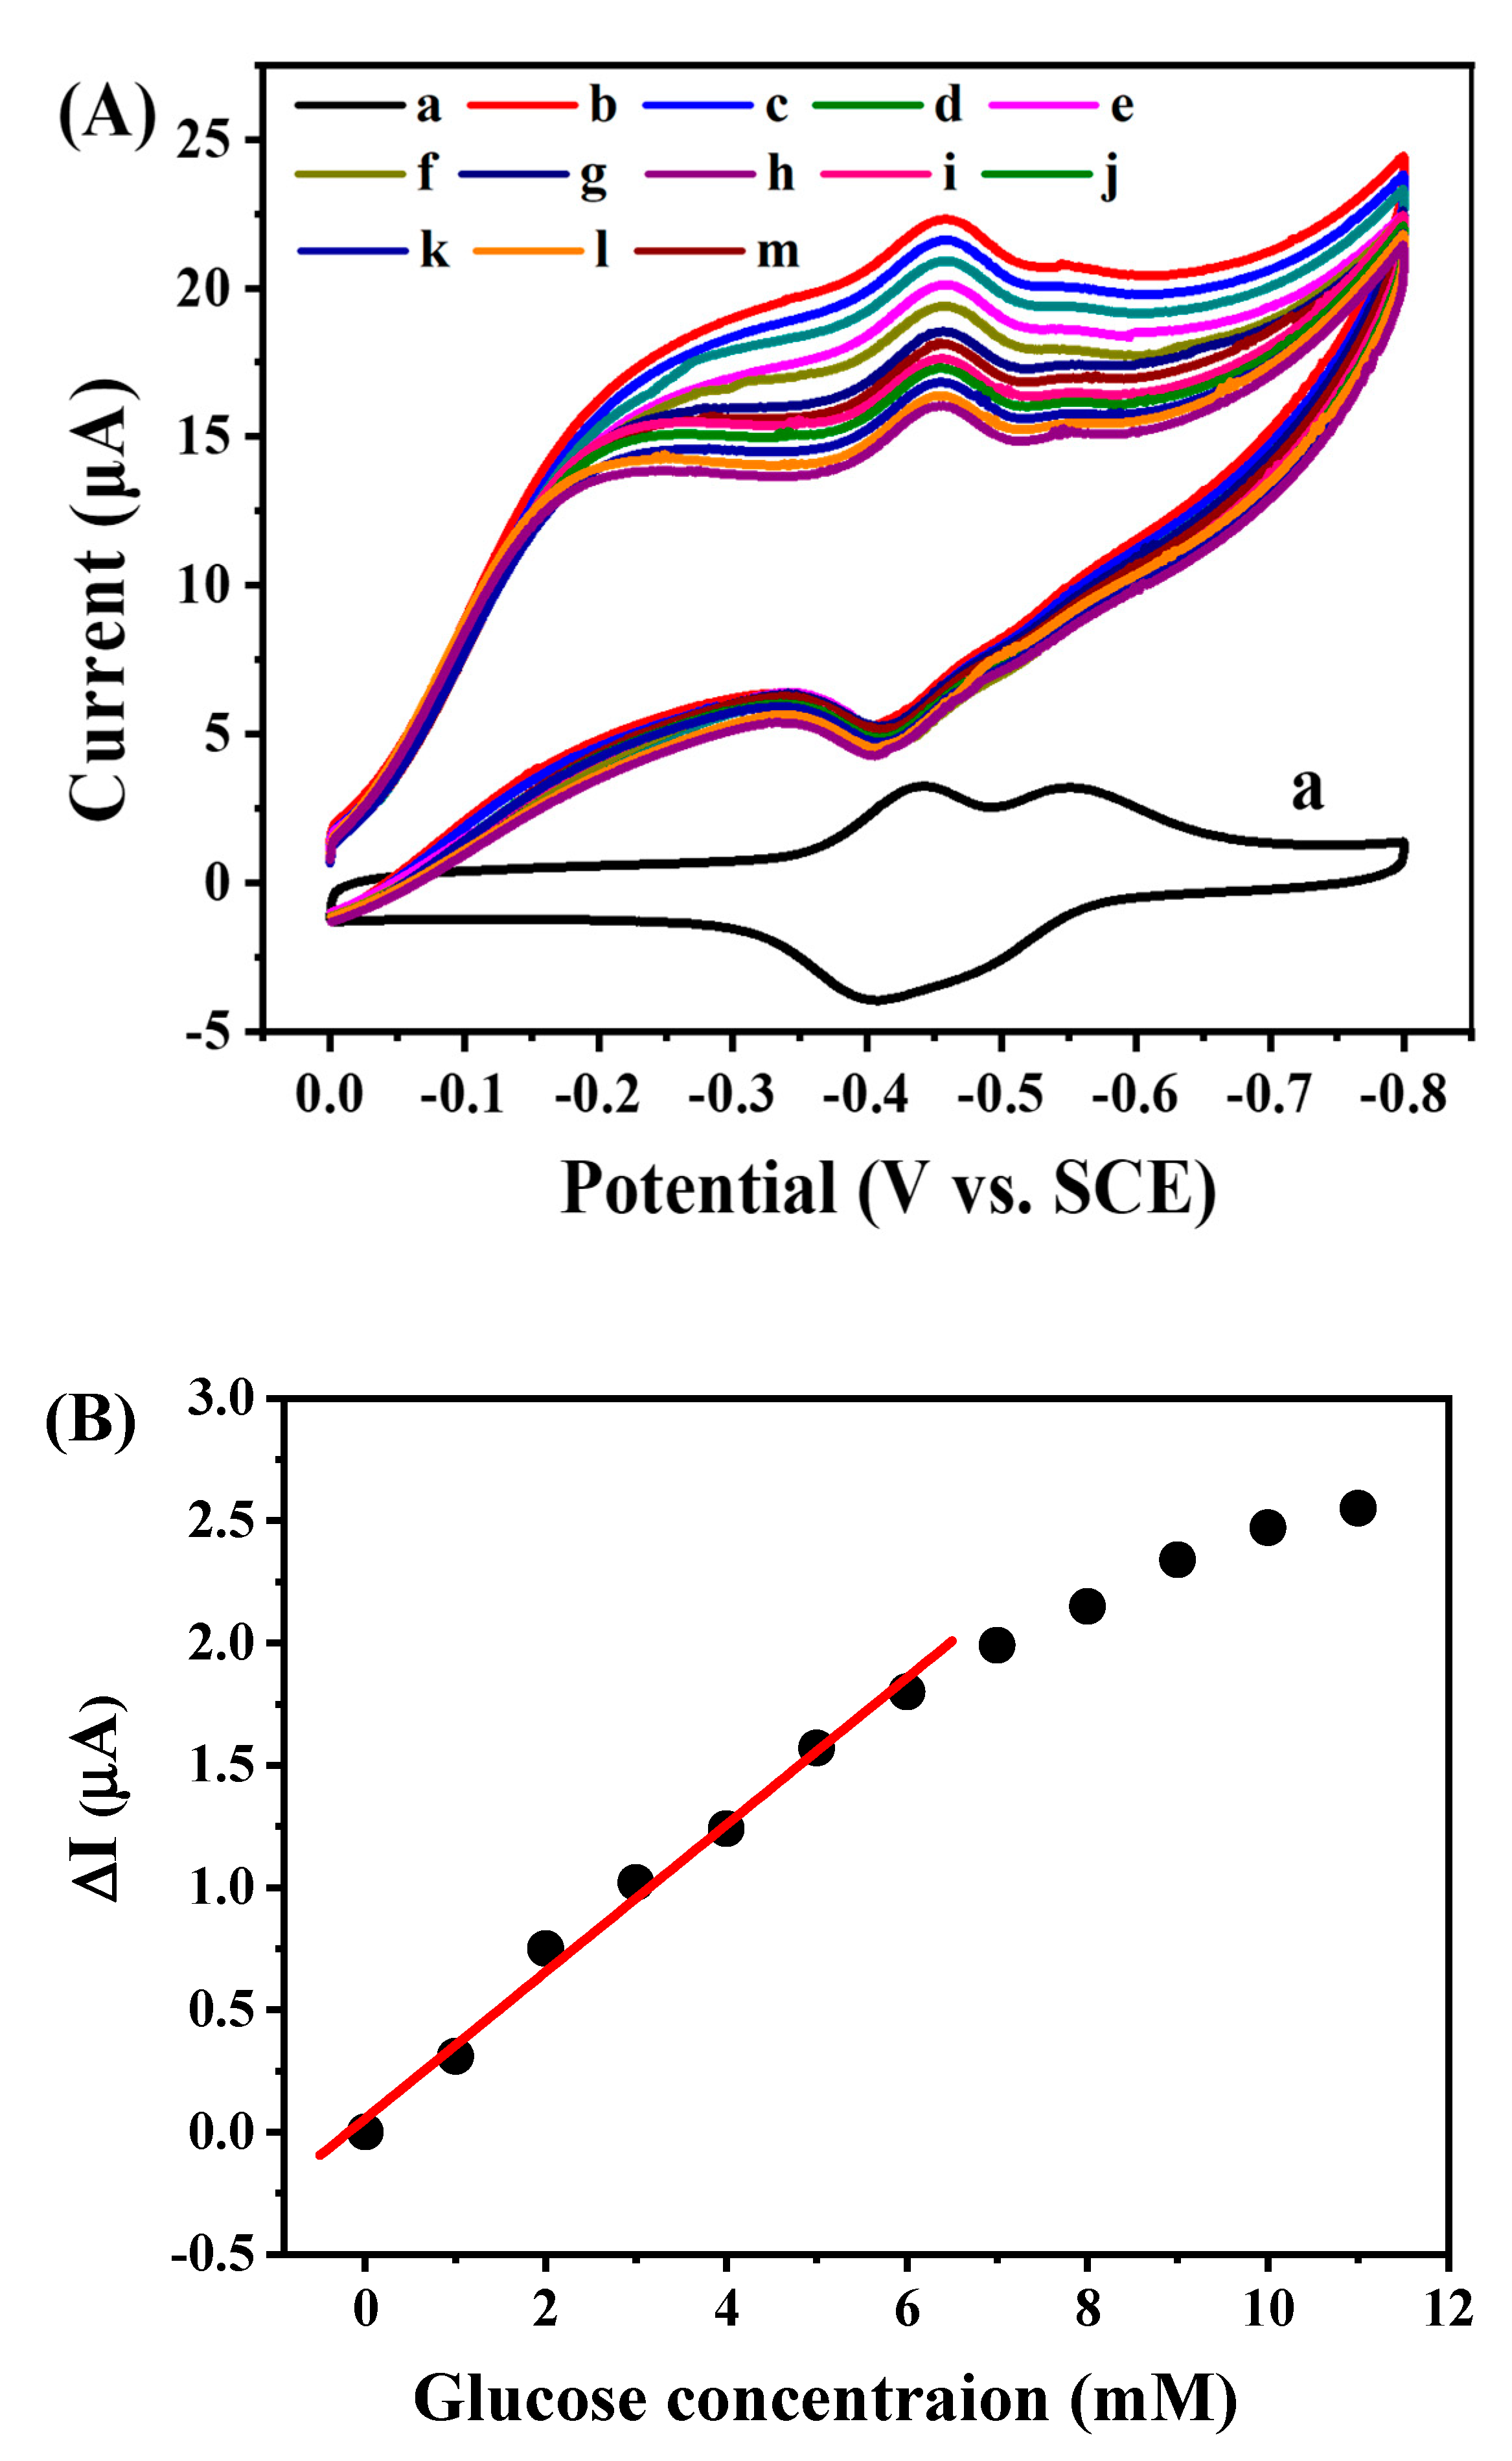
2.4. Electrocatalytic Behavior of GOD/rGON-AuNP/GC Electrode toward Glucose Oxidation

Figure 7A displays the cyclic voltammograms of GOD/rGON-AuNP/GC electrode in nitrogen-purged PBS (curve a), air-saturated PBS (curve b), and air-saturated PBS containing different concentration of glucose (from curve c to curve m). Compared to curve a, there is a significant increase in reduction peak current and decrease in oxidation peak current in curve b, which demonstrates that GOD catalyzes oxygen reduction according to Equations (1) and (2):
GOD(FAD) + 2e + 2H+ ↔ GOD(FADH2)
GOD(FADH2) + O2 ↔ GOD(FAD) + H2O2
Once glucose is added, the reduction peak current of GOD decreases because of the decrease of oxygen concentration on the electrode surface caused by enzyme catalyzed glucose oxidation (Equation (3)).
GOD(FADH2) + Glucose + O2 ↔ GOD(FAD) + Gluconolactone + H2O2
The decrease of the reduction peak current (ΔI) is proportional to the glucose concentration, suggesting GOD/rGON-AuNP/GC electrode can be applied for glucose concentration determination (Figure 7B). ΔI increases linearly with increasing the concentration of glucose up to 6 mM.
Stored in PBS (0.1 M) with pH value of 7.0 at 4 °C, the initial sensitivity of the biosensor still remains about 97% after 24 h and about 85% after 2 weeks, as displayed in Figure 8. The good stability of GOD/rGON-AuNP/GC electrode can be attributed to the strong interaction between GOD and rGON-AuNP.
The detailed electrochemical performance comparison of different electrode materials for glucose oxidase-based glucose biosensors is summarized in Table 1. Compared with the listed literature, our work has relatively wide linear detection range and high surface coverage of active GOD.

3. Experimental

3.1. Chemicals and Reagents

Graphite flake (325 mesh, 99.8%) was obtained from Nanjing XFNANO Materials Tech Co., Ltd. (Nanjing China). HAuCl4·4H2O (99%), sodium nitrate (≥99.0%), potassium permanganate (≥99.8%), and sulfuric acid (∼95–98%) were purchased from Sinopharm Chemical Reagents Co. Ltd. (Shanghai, China). Flavin adenine dinucleotide disodium salt hydrate (FAD salt, ≥95) and glucose oxidase (GOD, EC 1.1.3.4. Type II: from Aspergillusniger), (3-aminopropyl) trimethoxysilane (APTS, 97%), diethylamine (99.5%), dimethylformamide (DMF, 99.5%,), and d-(+)-glucose ( [ α ] D 20 : +52.5° to +53.0°) were purchased from Sigma (Sigma-Aldrich, St. Louis, MO, USA). A total of 1 mg/mL of GOD solution was prepared in 10 mM phosphoric butter solution (PBS) of pH 7.0. All reagents used in the experiments were of analytical grade, and were used without further purification. Distilled water was used throughout the experiments.

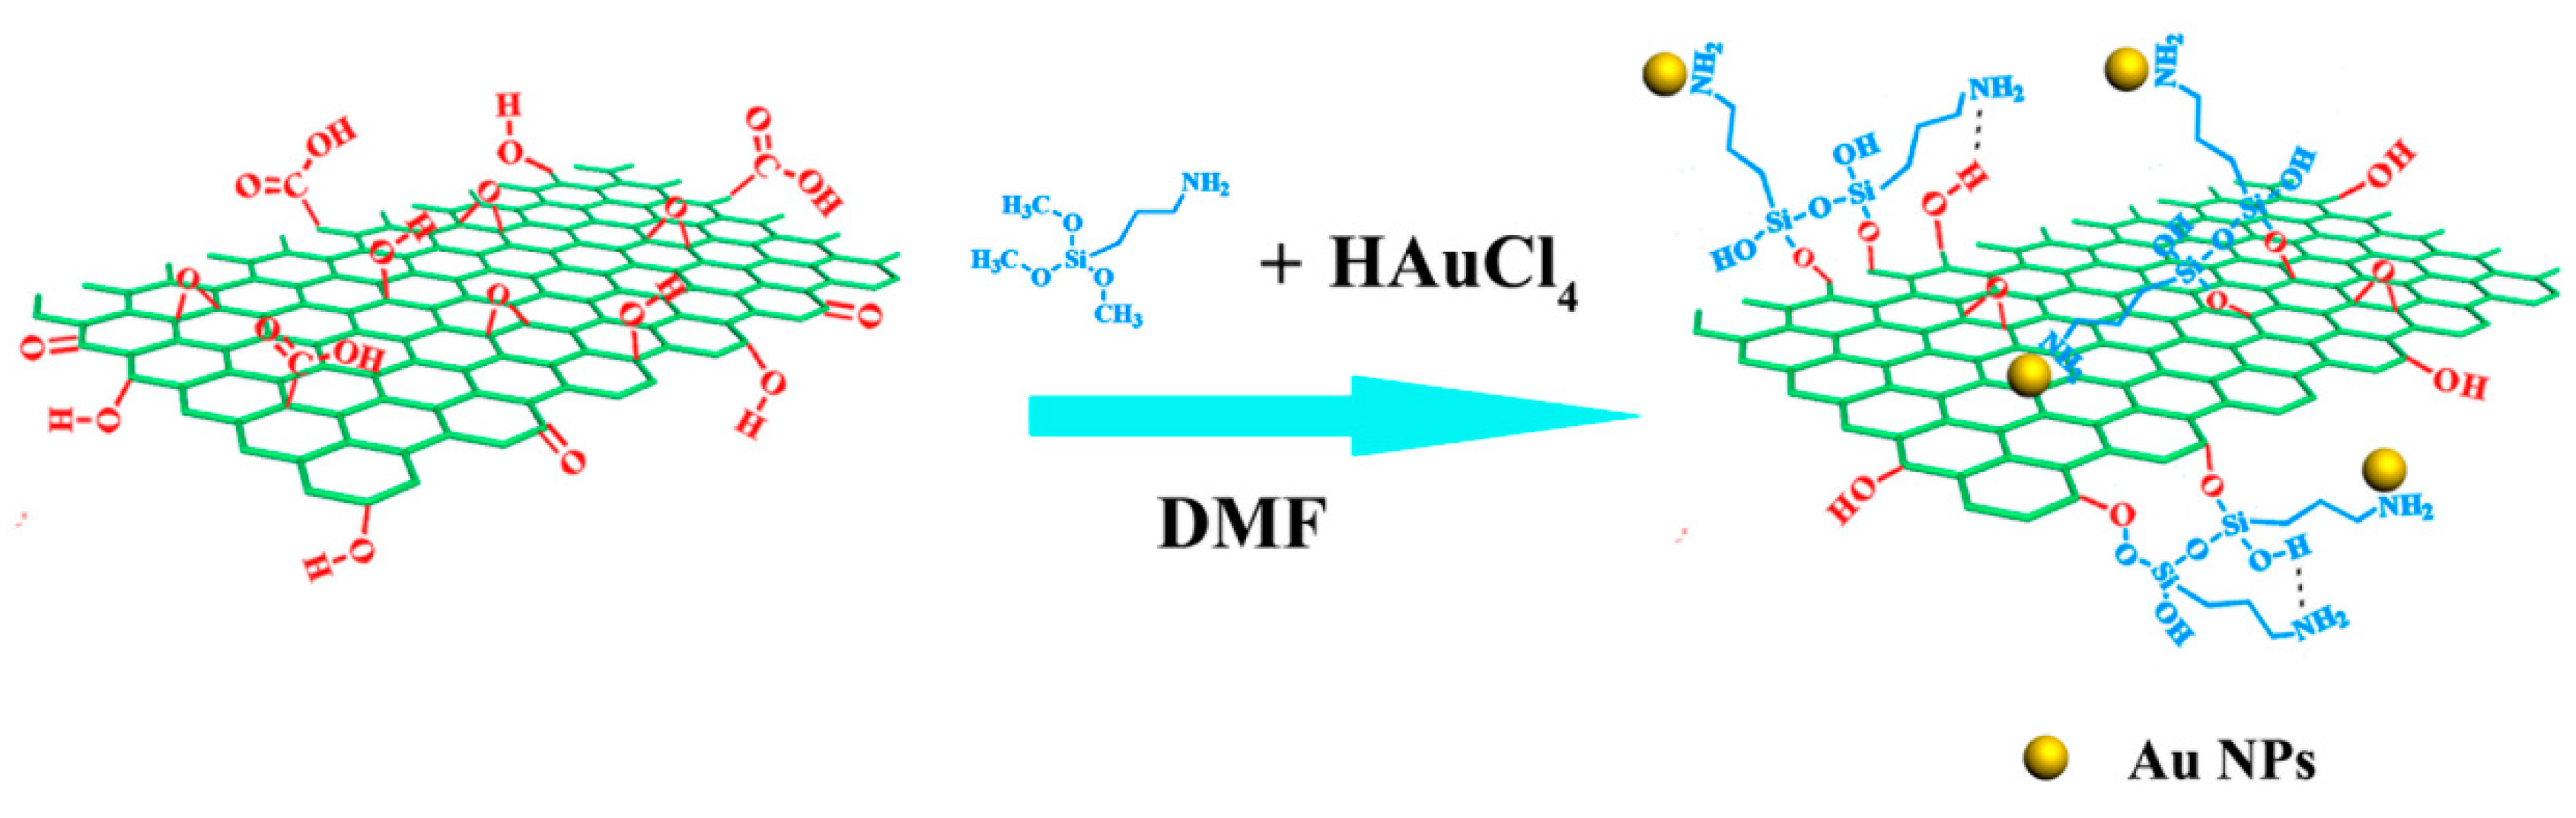
3.2. Preparation of rGON-AuNP

Graphene oxide (GO) was prepared from graphite flake according to the Hummers’ method [22]. The prepared GO was dispersed in water and exposed to dialysis for several days to remove salts and acids. GO powder was then collected by centrifugation and vacuum freeze-dried. The GON-DMF dispersion (2 mg/mL) was prepared by dispersing GO powder in anhydrous DMF through ultrasonication for 5 h using a Sonifier (KQ 100E, 100 W, Kunshan, China). HAuCl4-DMF solution (2.0 wt%) was prepared by dissolving HAuCl4 in anhydrous DMF. As shown in Scheme 1, GON-AuNP composite is prepared according to the reference with some modification [23]. In the preparation, 10 mL of GON-DMF dispersion was mixed with 2 mL HAuCl4-DMF solution to form a mixture. 272 μL APTS and 30 μL diethylamine were then added into this mixture with constant stirring for 5 h at 65 °C. The formed GON-AuNP composite was centrifuged and washed with DMF for several times, and re-dispersed in DMF before use. For comparison, GON-APTS complex was also prepared by stirring the mixture system of GON-DMF suspension with APTS and diethylamine at 65 °C for 5 h.

3.3. Construction of GOD Modified Electrodes

A glassy carbon electrode (GCE) with 3 mm diameter was polished to a mirror surface with 0.05 μm α-Al2O3 slurry, and successively ultrasonicated and washed in distilled water and acetone for several seconds. The cleaned electrode was dried with a nitrogen stream immediately prior to use. The pretreated GC electrode was cast with 1 μL GON-AuNP or GON-APTS DMF dispersion and dried in an oven at 50 °C overnight. Electrochemical reductions of GON-AuNP and GON-APTS were conducted in a traditional three-electrode electrochemical system with a computer-controlled CHI760e electrochemical workstation (Shanghai Chenhua Instrument Co., ltd., Shanghai, China) at room temperature by using a saturated calomel electrode (SCE) and a platinum wire as the reference electrode and the counter electrode, respectively. The modified GCE functioned as the working electrode. Electrochemical reductions were accomplished in nitrogen saturated 0.1 M KCl aqueous solution at −1.0 V (vs. SCE) for 1000 s. The electrochemically reduced GON-AuNP modified GC electrode was symbolized as rGON-AuNP/GC electrode, and the electrochemically reduced GON-APTS modified GC electrode was symbolized as rGON-APTS/GC electrode.
GOD modified rGON-AuNP/GC electrode (GOD/rGON-AuNP/GC) was constructed by incubating the rGON-AuNP/GC electrode in 1 mg/mL GOD solution overnight. In a higher concentration of GOD such as 5 mg/L was also prepared in the same way for comparison, and the obtained electrode was marked as hGOD/rGON-AuNP/GC. As a comparison, FAD/rGON-AuNP/GC electrode was constructed by incubating the rGON-AuNP/GC electrode in 3 mM FAD salt aqueous solution for more than 12 h. GOD/GC electrode was prepared by directly casting 5 μL 1 mg/mL GOD solution on the bare GC electrode, and then dried overnight at room temperature.

3.4. Characterization

Transmission electron microscopy (TEM) images were performed on a JEM-200CX transmission electron microscope (JEOL Ltd., Akajima, Tokyo, Japan) operated at an acceleration voltage of 120 KeV. High-resolution transmission electron microscopy (HRTEM) images were acquired by a JEM-2010F transmission electron microscope (JEOL Ltd., Akajima, Tokyo, Japan) operated at 200 kV. Scanning electron microscopy (SEM) images were acquired by using field-emission scanning electron microscope (FE-SEM, Hitachi S-4800) (Hitachi, Ltd., Chiyoda-ku, Tokyo., Japan) equipped with an energy dispersive X-ray (EDX) system which was used for the chemical elemental analysis. Fourier transform infrared spectroscopic (FTIR) tests were recorded on a Nicolet Avatar370 FTIR instrument (Thermo Nicolet, Massachusetts., USA) using KBr pellets. Powder X-ray diffraction (XRD) measurements were carried out on a 18 KW D/MAX2500 V+/PC instrument by using a graphite monochromator with Cu Kα radiation with a Ni filter (λ = 1.5406 Å). The UV-visible absorption spectra were achieved on a double beam UV-Vis spectrophotometer 760CRT.
Cyclic voltammetry was carried out in a traditional three-electrode electrochemical cell on a computer-controlled CHI760e electrochemical workstation. In the cell, a modified GC electrode was used as the working electrode. A SCE and a platinum wire were used as the reference electrode and the counter electrode, respectively. EIS measurements were performed in 1 M KCl aqueous solution containing the mixture of 2 mM K4[Fe(CN)6]/K3[Fe(CN)6] (1:1) as the redox probe. The frequency was scanned from 100 kHz to 0.01 Hz at the open-circuit voltage. The amplitude of perturbation sine voltage of 5 mV was used. The impedance Z is expressed in terms of a real (Z’’) and an imaginary (Z’) component (Nyquist plot).

4. Conclusions

A novel composite material of the reduced graphene oxide nanosheets with gold nanoparticles (rGON-AuNP) is synthesized, and its morphology, structure, and composition are characterized by SEM, HRTEM, XRD, EDX, FTIR, Raman, and UV-Vis techniques. This composite is deposited onto the glassy carbon (GC) electrode to form a working electrode of rGON-AuNP/GC for electrochemical measurements. To confirm this material’s electrochemical activity, a glucose oxidase (GOD) is chosen as the target reagent to modify the rGON-AuNP layer to form GOD/rGON-AuNP/electrode. Two pairs of overlapped redox peaks, corresponding to the redox processes of the two different conformational GOD on AuNP, are observed on the cyclic voltammograms of GOD/rGON-AuNP/GC electrode. As GOD can adsorb on to AuNP in different spatial orientations, the two pairs of redox peaks might correspond to the redox processes of two different conformational GOD on the AuNP in the composite. This GOD/rGON-AuNP/GC electrode also shows catalytic activity toward glucose oxidation and oxygen reduction reaction. Our research results help to better understand the electrochemical behavior of GOD on graphene-based composites, which is very important of the development of high performance GOD-based electrochemical energy devices, especially for enzymatic biofuel cells.

Supplementary Materials

The following are available online at https://www.mdpi.com/2073-4344/9/9/764/s1, Figure S1: (A) FTIR spectra, (B) XRD patterns, and (C) Raman spectra of GON-AuNP and rGON-AuNP. Figure S2: Cyclic voltammograms of rGON-AuNP/GC electrode in nitrogen-purged PBS (curve a), air-saturated PBS (curve b), and air-saturated PBS containing 5 mM glucose. Figure S3: Cyclic voltammograms of FAD/rGON-AuNP/GC electrode in nitrogen-purged PBS (curve a), air-saturated PBS (curve b), and air-saturated PBS containing 5 mM glucose.

Author Contributions

Methodology, L.D.; software, A.L.; investigation, W.Y. (Wenjuan Yu); resources, Q.S.; data curation, Y.L.; writing—original draft preparation, L.D. and W.Y. (Wei Yan); writing—review and editing, W.Y. (Wei Yan), M.L. and J.Z.; supervision, W.Y. (Wei Yan) and J.Z.; project administration, W.Y. (Wei Yan).

Funding

The authors acknowledge the support of the National Natural Science Foundation of China (51803116), Shanghai Sailing Program (No: 18YF1408600), the international fellowship for Ph.D. program of Shanghai University, the financial support from Leoch International, and the Xijiang talent program.

Conflicts of Interest

The authors declare no conflict of interest.

References

  1. Tian, N.; Lu, B.-A.; Yang, X.-D.; Huang, R.; Jiang, Y.-X.; Zhou, Z.-Y.; Sun, S.-G. Rational Design and Synthesis of Low-Temperature Fuel Cell Electrocatalysts. Electrochem. Energy Rev. 2018, 1, 54–83. [Google Scholar] [CrossRef] [Green Version]
  2. Khan, M.A.; Zhao, H.; Zou, W.; Chen, Z.; Cao, W.; Fang, J.; Xu, J.; Zhang, L.; Zhang, J. Recent Progresses in Electrocatalysts for Water Electrolysis. Electrochem. Energy Rev. 2018, 1, 483–530. [Google Scholar] [CrossRef] [Green Version]
  3. Zou, L.; Qiao, Y.; Li, C.M. Boosting Microbial Electrocatalytic Kinetics for High Power Density: Insights into Synthetic Biology and Advanced Nanoscience. Electrochem. Energy Rev. 2018, 1, 567–598. [Google Scholar] [CrossRef]
  4. Dou, F.; Shi, L.; Chen, G.; Zhang, D. Silicon/Carbon Composite Anode Materials for Lithium-Ion Batteries. Electrochem. Energy Rev. 2019, 2, 149–198. [Google Scholar] [CrossRef]
  5. Du, W.; Bai, Y.-L.; Xu, J.; Zhao, H.; Zhang, L.; Li, X.; Zhang, J. Advanced metal-organic frameworks (MOFs) and their derived electrode materials for supercapacitors. J. Power Sources 2018, 402, 281–295. [Google Scholar] [CrossRef]
  6. Allen, M.J.; Tung, V.C.; Kaner, R.B. Honeycomb Carbon: A Review of Graphene. Chem. Rev. 2010, 110, 132–145. [Google Scholar] [CrossRef]
  7. Ambrosi, A.; Chua, C.K.; Bonanni, A.; Pumera, M. Electrochemistry of Graphene and Related Materials. Chem. Rev. 2014, 114, 7150–7188. [Google Scholar] [CrossRef]
  8. Suvarnaphaet, P.; Pechprasarn, S. Graphene-Based Materials for Biosensors: A Review. Sensors (Basel) 2017, 17, 2161. [Google Scholar] [CrossRef]
  9. Khalil, I.; Julkapli, N.M.; Yehye, W.A.; Basirun, W.J.; Bhargava, S.K. Graphene-Gold Nanoparticles Hybrid-Synthesis, Functionalization, and Application in a Electrochemical and Surface-Enhanced Raman Scattering Biosensor. Materials (Basel) 2016, 9, 406. [Google Scholar] [CrossRef]
  10. Loh, K.P.; Bao, Q.; Ang, P.K.; Yang, J. The chemistry of graphene. J. Mater. Chem. 2010, 20, 2277–2289. [Google Scholar] [CrossRef]
  11. Luo, Z.; Somers, L.A.; Dan, Y.; Ly, T.; Kybert, N.J.; Mele, E.J.; Johnson, A.T.C. Size-Selective Nanoparticle Growth on Few-Layer Graphene Films. Nano Lett. 2010, 10, 777–781. [Google Scholar] [CrossRef] [PubMed] [Green Version]
  12. Govindhan, M.; Amiri, M.; Chen, A. Au nanoparticle/graphene nanocomposite as a platform for the sensitive detection of NADH in human urine. Biosens. Bioelectron. 2015, 66, 474–480. [Google Scholar] [CrossRef] [PubMed]
  13. Zhuo, Q.; Ma, Y.; Gao, J.; Zhang, P.; Xia, Y.; Tian, Y.; Sun, X.; Zhong, J.; Sun, X. Facile Synthesis of Graphene/Metal Nanoparticle Composites via Self-Catalysis Reduction at Room Temperature. Inorg. Chem. 2013, 52, 3141–3147. [Google Scholar] [CrossRef] [PubMed]
  14. Mecheri, B.; De Porcellinis, D.; Campana, P.T.; Rainer, A.; Trombetta, M.; Marletta, A.; Oliveira, O.N.; Licoccia, S. Tuning Structural Changes in Glucose Oxidase for Enzyme Fuel Cell Applications. ACS Appl. Mater. Interfaces 2015, 7, 28311–28318. [Google Scholar] [CrossRef] [PubMed]
  15. Yu, Y.; Chen, Z.; He, S.; Zhang, B.; Li, X.; Yao, M. Direct electron transfer of glucose oxidase and biosensing for glucose based on PDDA-capped gold nanoparticle modified graphene/multi-walled carbon nanotubes electrode. Biosens. Bioelectron. 2014, 52, 147–152. [Google Scholar] [CrossRef] [PubMed]
  16. Razmi, H.; Mohammad-Rezaei, R. Graphene quantum dots as a new substrate for immobilization and direct electrochemistry of glucose oxidase: Application to sensitive glucose determination. Biosens. Bioelectron. 2013, 41, 498–504. [Google Scholar] [CrossRef] [PubMed]
  17. Zhao, Y.; Li, W.; Pan, L.; Zhai, D.; Wang, Y.; Li, L.; Cheng, W.; Yin, W.; Wang, X.; Xu, J.-B.; et al. ZnO-nanorods/graphene heterostructure: A direct electron transfer glucose biosensor. Sci. Rep. 2016, 6, 32327. [Google Scholar] [CrossRef]
  18. Thirumalraj, B.; Palanisamy, S.; Chen, S.-M.; Yang, C.-Y.; Periakaruppan, P.; Lou, B.-S. Direct electrochemistry of glucose oxidase and sensing of glucose at a glassy carbon electrode modified with a reduced graphene oxide/fullerene-C60 composite. RSC Adv. 2015, 5, 77651–77657. [Google Scholar] [CrossRef]
  19. Terse-Thakoor, T.; Komori, K.; Ramnani, P.; Lee, I.; Mulchandani, A. Electrochemically Functionalized Seamless Three-Dimensional Graphene-Carbon Nanotube Hybrid for Direct Electron Transfer of Glucose Oxidase and Bioelectrocatalysis. Langmuir 2015, 31, 13054–13061. [Google Scholar] [CrossRef]
  20. Liang, B.; Guo, X.; Fang, L.; Hu, Y.; Yang, G.; Zhu, Q.; Wei, J.; Ye, X. Study of direct electron transfer and enzyme activity of glucose oxidase on graphene surface. Electrochem. Commun. 2015, 50, 1–5. [Google Scholar] [CrossRef]
  21. Seehuber, A.; Dahint, R. Conformation and Activity of Glucose Oxidase on Homogeneously Coated and Nanostructured Surfaces. J. Phys. Chem. B 2013, 117, 6980–6989. [Google Scholar] [CrossRef] [PubMed]
  22. Hummers, W.S.; Offeman, R.E. Preparation of Graphitic Oxide. J. Am. Chem. Soc. 1958, 80, 1339. [Google Scholar] [CrossRef]
  23. Ma, W.-S.; Li, J.; Deng, B.-J.; Zhao, X.-S. Preparation and characterization of long-chain alkyl silane-functionalized graphene film. J. Mater. Sci. 2013, 48, 156–161. [Google Scholar] [CrossRef]
  24. Liu, Z.; Duan, X.; Zhou, X.; Qian, G.; Zhou, J.; Yuan, W. Controlling and Formation Mechanism of Oxygen-Containing Groups on Graphite Oxide. Ind. Eng. Chem. Res. 2014, 53, 253–258. [Google Scholar] [CrossRef]
  25. Jeong, H.-K.; Jin, M.H.; An, K.H.; Lee, Y.H. Structural Stability and Variable Dielectric Constant in Poly Sodium 4-Styrensulfonate Intercalated Graphite Oxide. J. Phys. Chem. C 2009, 113, 13060–13064. [Google Scholar] [CrossRef]
  26. Yamaura, M.; Camilo, R.L.; Sampaio, L.C.; Macêdo, M.A.; Nakamura, M.; Toma, H.E. Preparation and characterization of (3-aminopropyl)triethoxysilane-coated magnetite nanoparticles. J. Magn. Magn. Mater. 2004, 279, 210–217. [Google Scholar] [CrossRef]
  27. White, L.D.; Tripp, C.P. Reaction of (3-Aminopropyl)dimethylethoxysilane with Amine Catalysts on Silica Surfaces. J. Colloid Interface Sci. 2000, 232, 400–407. [Google Scholar] [CrossRef] [PubMed]
  28. Georgakilas, V.; Otyepka, M.; Bourlinos, A.B.; Chandra, V.; Kim, N.; Kemp, K.C.; Hobza, P.; Zboril, R.; Kim, K.S. Functionalization of Graphene: Covalent and Non-Covalent Approaches, Derivatives and Applications. Chem. Rev. 2012, 112, 6156–6214. [Google Scholar] [CrossRef]
  29. Yan, W.; Yu, W.-J.; Wang, L.; Zhang, D.; Ge, X.-Q.; Hang, J.-Z.; Deng, W.; Shi, L.-Y. Preparation of Partially Reduced Graphene Oxide Nanosheets/Poly(Sodium 4-Styrenesulfonate) Composite with High Capacitance. Electrochim. Acta 2014, 147, 257–264. [Google Scholar] [CrossRef]
  30. Pastoriza-Santos, I.; Liz-Marzán, L.M. Formation of PVP-Protected Metal Nanoparticles in DMF. Langmuir 2002, 18, 2888–2894. [Google Scholar] [CrossRef]
  31. Jeong, H.-K.; Lee, Y.P.; Jin, M.H.; Kim, E.S.; Bae, J.J.; Lee, Y.H. Thermal stability of graphite oxide. Chem. Phys. Lett. 2009, 470, 255–258. [Google Scholar] [CrossRef]
  32. Li, P.; Wei, Z.; Wu, T.; Peng, Q.; Li, Y. Au−ZnO Hybrid Nanopyramids and Their Photocatalytic Properties. J. Am. Chem. Soc. 2011, 133, 5660–5663. [Google Scholar] [CrossRef] [PubMed]
  33. Ren, P.-G.; Yan, D.-X.; Ji, X.; Chen, T.; Li, Z.-M. Temperature dependence of graphene oxide reduced by hydrazine hydrate. Nanotechnology 2010, 22, 055705. [Google Scholar] [CrossRef] [PubMed]
  34. Yang, H.; Li, F.; Shan, C.; Han, D.; Zhang, Q.; Niu, L.; Ivaska, A. Covalent functionalization of chemically converted graphene sheets via silane and its reinforcement. J. Mater. Chem. 2009, 19, 4632–4638. [Google Scholar] [CrossRef]
  35. Bhowmik, K.; Pramanik, S.; Medda, S.K.; De, G. Covalently functionalized reduced graphene oxide by organically modified silica: A facile synthesis of electrically conducting black coatings on glass. J. Mater. Chem. 2012, 22, 24690–24697. [Google Scholar] [CrossRef]
  36. Zhang, J.; Yang, H.; Shen, G.; Cheng, P.; Zhang, J.; Guo, S. Reduction of graphene oxide vial-ascorbic acid. Chem. Commun. 2010, 46, 1112–1114. [Google Scholar] [CrossRef] [PubMed]
  37. Han, Y.; Luo, Z.; Yuwen, L.; Tian, J.; Zhu, X.; Wang, L. Synthesis of silver nanoparticles on reduced graphene oxide under microwave irradiation with starch as an ideal reductant and stabilizer. Appl. Surf. Sci. 2013, 266, 188–193. [Google Scholar] [CrossRef]
  38. Paredes, J.I.; Villar-Rodil, S.; Martínez-Alonso, A.; Tascón, J.M.D. Graphene Oxide Dispersions in Organic Solvents. Langmuir 2008, 24, 10560–10564. [Google Scholar] [CrossRef]
  39. Shi, W.; Zhu, J.; Sim, D.H.; Tay, Y.Y.; Lu, Z.; Zhang, X.; Sharma, Y.; Srinivasan, M.; Zhang, H.; Hng, H.H.; et al. Achieving high specific charge capacitances in Fe3O4/reduced graphene oxide nanocomposites. J. Mater. Chem. 2011, 21, 3422–3427. [Google Scholar] [CrossRef]
  40. Diculescu, V.C.; Militaru, A.; Shah, A.; Qureshi, R.; Tugulea, L.; Brett, A.M.O. Redox mechanism of lumazine at a glassy carbon electrode. J. Electroanal. Chem. 2010, 647, 1–7. [Google Scholar] [CrossRef]
  41. Filip, J.; Tkac, J. The pH dependence of the cathodic peak potential of the active sites in bilirubin oxidase. Bioelectrochemistry 2014, 96, 14–20. [Google Scholar] [CrossRef] [PubMed]
  42. Nasri, Z.; Shams, E. A glucose biosensor based on direct electron transfer of glucose oxidase immobilized onto glassy carbon electrode modified with nitrophenyl diazonium salt. Electrochim. Acta 2013, 112, 640–647. [Google Scholar] [CrossRef]
  43. Salimi, A.; Sharifi, E.; Noorbakhsh, A.; Soltanian, S. Immobilization of glucose oxidase on electrodeposited nickel oxide nanoparticles: Direct electron transfer and electrocatalytic activity. Biosens. Bioelectron. 2007, 22, 3146–3153. [Google Scholar] [CrossRef] [PubMed]
  44. Wu, L.; Zhang, X.; Ju, H. Amperometric glucose sensor based on catalytic reduction of dissolved oxygen at soluble carbon nanofiber. Biosens. Bioelectron. 2007, 23, 479–484. [Google Scholar] [CrossRef] [PubMed]
  45. Fu, C.; Yang, W.; Chen, X.; Evans, D.G. Direct electrochemistry of glucose oxidase on a graphite nanosheet–Nafion composite film modified electrode. Electrochem. Commun. 2009, 11, 997–1000. [Google Scholar] [CrossRef]
  46. Wang, Z.; Liu, S.; Wu, P.; Cai, C. Detection of glucose based on direct electron transfer reaction of glucose oxidase immobilized on highly ordered polyaniline nanotubes. Anal. Chem. 2009, 81, 1638–1645. [Google Scholar] [CrossRef] [PubMed]
Scheme 1. Schematic procedure for the preparation of graphene oxide nanosheets with gold nanoparticles (GON-AuNP) composite.
Catalysts 09 00764 sch001
Figure 1. (A) Transmission electron microscopy (TEM), (B) high-resolution transmission electron microscopy (HRTEM), and (C) scanning electron microscopy (SEM) images of GON-AuNP. (D) Energy dispersive X-ray (EDX) spectrum of GON-AuNP.
Catalysts 09 00764 g001
Figure 2. (A) Fourier transform infrared spectroscopic (FTIR) spectra; (B) X-ray diffraction (XRD) patterns; (C) TGA patterns and (D) Raman spectra of GON, GON-APTS, and GON-AuNP. (E) UV-vis spectra of GON-APTS and GON-AuNP DMF dispersions. The insert is the UV-vis spectrum of GON aqueous dispersion.
Catalysts 09 00764 g002aCatalysts 09 00764 g002b
Figure 3. (A) Cyclic voltammograms of GON-AuNP after potentiostatic reduction on a glassy carbon electrode after several time periods, measured in nitrogen-purged 0.1 M KCl aqueous solution at a potential scanning rate of 50 mV/s; (B) Niqust plots (-Z” vs. Z’) of GON-AuNP/GC and rGON-AuNP/GC; (C) the corresponding equivalent circuit for the electrodes.
Catalysts 09 00764 g003
Figure 4. (A) Cyclic voltammograms of GOD/GC (glucose oxidase/glassy carbon) electrode (black line), rGON-AuNP/GC electrode (blue line), GOD/rGON-APTS/GC electrode (green line), and GOD/rGON-AuNP/GC electrode (red line) in 0.1 M nitrogen-purged PBS (pH 6.0) at a scanning rate of 50 mV/s; (B) Cyclic voltammograms of GOD/rGON-AuNP/GC electrode in 0.1 M nitrogen-purged PBS (pH 6.0) at a scanning rate of 50 mV/s after subtraction of background current; (C) Cyclic voltammograms of hGOD/rGON-AuNP/GC electrode (black line), FAD/rGON-AuNP/GC (green line), and GOD/rGON-AuNP/GC (red line) in 0.1 M nitrogen-purged PBS (pH 6.0) at a scanning rate of 50 mV/s; (D) Cyclic voltammograms of rGON-AuNP/GC electrodes after being incubated overnight in 6 mM (a black), 3 mM (b red), 1 mM (c blue), 0.2 mM (d green), and 0.01 mM (e pink) FAD salt solutions, respectively.
Catalysts 09 00764 g004
Figure 5. (A) Cyclic voltammograms of GOD/rGON-AuNP/GC electrode (blue line) in 0.1 M nitrogen-purged PBS (pH 6.0) at different scanning rates (after subtraction of background current); (B) Plots of EpI and EpII vs. logarithm of scanning rates.
Catalysts 09 00764 g005
Figure 6. (A) Cyclic voltammograms of GOD/rGON-AuNP/GC electrode in 0.1 M nitrogen-purged PBS with pH values ranging from 3.0 to 8.0 at the scanning rate of 50 mV/s (after subtraction of background current); (B) Plots of EpI and EpII vs. pH value.
Catalysts 09 00764 g006
Figure 7. (A) Cyclic voltammograms of GOD/rGON-AuNP/GC electrode in 0.1 M nitrogen-purged PBS (a), and air-saturated PBS containing (b) 0, (c) 1, (d) 2, (e) 3, (f) 4, (g) 5, (h) 6, (i) 7, (j) 8, (k) 9 (l) 10 and (m) 11 mM glucose; (B) Linear relationship between reduction peak current and glucose concentration.
Catalysts 09 00764 g007
Figure 8. Cyclic voltammograms of GOD/rGON-AuNP/GC electrode (a) before and (b) after storage in 0.1 M PBS (pH7.0) at 4 °C for 2 weeks.
Catalysts 09 00764 g008
Table 1. Comparison electrochemical performance of some different GOD-based electrode materials glucose biosensors.
Electrode MaterialsSynthesis PathwayStructural PropertiesElectrochemical Sensor Behaviors (Linear Range, Low Detection Limit, Sensitivity etc.)Catalytic Activity (Active GOx Surface Coverage, Heterogeneous Electron Transfer Rate Constant (ks), Michaelis–Menten Constant (KM) of Immobilized GOx)Reference
GOx-modified GCEImmobilization of GOx onto GCE electrografted with 4-aminophenyl (AP) by diazonium chemistry 0.05–4.5 mM
10 μM
1.23 × 10⁻¹² mol cm−2
4.25 s−1
2.95 mM
[42]
GOx/NiO/GCEElectrodepositing, electrodissolution and immobilization of glucose oxidase -
24 μM
446.2 nA/mM
9.45 × 10⁻¹³ mol cm−2
25.2 ± 0.5 s−1
2.7 mM
[43]
GOx–CNFCNF carboxylation and mixing with glucose oxidase 0.01–0.35 mM
2.5 μM
36.3 μA mM−1 cm−2
-
-
[44]
Nafion–GOx–GNSsCasting GNSs-Nafion-GOD suspension onto GCEsGNSs: 0.2–2 μm in diameter, 10–50 nm in thickness0.2–1.4 mM
-
3.4 μA mM−1 cm−2
-
-
[45]
GOx-nanoPANi/PtAAO template methodnanoPANi tubes with 250−300 nm in outer diameter 0.01 to 5.5 mM-
-
97.18 ± 4.62μA mM−1 cm−2
-
1.53 ± 0.45 s−1
2.37 ± 0.5 mM
[46]
GOD/rGON-AuNP/GCWet chemical and incubating methodAuNPs of 6.2 nm in diameter0–6 mM
-
-
4.29 × 10⁻¹⁰ mol/cm2
-
This work

