Review

Vibrational Spectra of β″-Type BEDT-TTF Salts: Relationship between Conducting Property, Time-Averaged Site Charge and Inter-Molecular Distance

Graduate School of Science, Osaka University, 1-1 Machikaneyama, Toyonaka, Osaka 560-0043, Japan
Crystals 2012, 2(3), 893-934; https://doi.org/10.3390/cryst2030893
Submission received: 18 April 2012 / Revised: 20 June 2012 / Accepted: 26 June 2012 / Published: 6 July 2012
(This article belongs to the Special Issue Molecular Conductors)

Abstract

:
The relationship between the conducting behavior and the degree of charge fluctuation in the β″-type BEDT-TTF salts is reviewed from the standpoints of vibrational spectroscopy and crystal structure. A group of β″-type ET salts demonstrates the best model compounds for achieving the above relationship because the two-dimensional structure is simple and great diversity in conducting behavior is realized under ambient pressure. After describing the requirement for the model compound, the methodology for analyzing the results of the vibrational spectra is presented. Vibrational spectroscopy provides the time-averaged molecular charge, the charge distribution in the two-dimensional layer, and the inter-molecular interactions, etc. The experimental results applied to 2/3-filled and 3/4-filled β″-type ET salts are reported. These experimental results suggest that the conducting property, the difference in the time-averaged molecular charges between the ionic and neutral-like sites, the alternation in the inter-molecular distances and the energy levels in the charge distributions are relevant to one another. The difference in the time-averaged molecular charges, ∆ρ, is a useful criterion for indicating conducting behavior. All superconductors presented in this review are characterized as small but finite ∆ρ.

1. Introduction

In this review, the relationship between the conducting behavior and the degree of charge fluctuation in molecular conductors is discussed. Among the molecular superconductors, the κ-type BEDT-TTF [BEDT-TTF=bis(ethylenedithio)tetrathiafulvalene (hereafter referred to as “ET”)] salts have been studied for a quarter of a century. The crystal structures and physical properties of many κ-type ET salts are described in Reference [1]. Because the insulating state neighbored with the superconducting phase is the anti-ferromagnetic phase, the insulator-superconducting transition has been investigated from the viewpoint of the analogy with high-Tc superconductors. On the other hand, it is widely accepted that the insulator phase neighbored with the superconducting phase is not necessarily the anti-ferromagnetic phase. One of the representative materials is a group of the β"-type ET salts. The crystal structures and physical properties of many β"-type ET salts are described in [2]. This material group belongs to 2D molecular conductors and the crystal structure is shown in Figure 1. The magnetic susceptibility in the insulator state of β"-(ET)3Cl2·2H2O, β-(ET)2ReO4 and β"-(ET)Pt(CN)4·H2O exhibits non-magnetic behavior rather than anti-ferromagnetic behavior [3,4,5]. In contrast to the anti-ferromagnetic state, it is not easy to examine the electronic states in the non-magnetic state or adjacently the non-magnetic state by using magnetic techniques. Although diffraction technique is useful for the estimation of the molecular charge in the localized state, this technique is not always suitable for observation of the dynamical electron near the superconducting phase. Owing to the lack of experimental technique, few experimental studies have been carried out on the electronic state adjacent to the superconducting phase of the β-type and β"-type ET salts although the first report on superconducting transition was carried out ~30 years ago [6]. A turning point is the report of theoretical study on the pairing mechanism due to the charge fluctuation in some organic superconductors [7]. After that, the roles of charge fluctuation in organic superconductors were investigated by several theoretical groups. Nevertheless, the superconducting transition of the β"-type ET salts has been briefly touched in only a few reports [8,9]. To our best knowledge, there is no theoretical study when assuming the 2D layer of the β"-type ET salts. A number of theoretical studies have been directed to θ-type molecular conductors [10,11,12,13,14,15]. Note that there is no ambient pressure superconductor in the θ-type and α-type salts and the number of pressure-induced superconductors is very limited. Under the circumstances, it is difficult to observe the dynamics of charges around the superconducting phase, which inhibits us in comparing experimental results and theoretical results. With respect to the β"-type ET salts, on the other hand, several ambient pressure superconductors are available. For these reasons, it is necessary to establish a methodology for direct observation of the charge fluctuation near the superconducting phase. The author believes that the obtained experimental results for the β"-type ET salts will contribute in constructing new theoretical models in the field of condensed molecular materials.
Vibrational spectroscopy is the one of the best methods of capturing the dynamics of the electron around the superconducting state. For this purpose, a methodology for analyzing both charge localization and charge fluctuation has been developed from the standpoint of vibrational spectroscopy [16]. This methodology has been applied to a group of β"-type ET salts [17,18,19]. On the basis of the experimental results, the relationship between the conducting property and the degree of charge fluctuation has been established. The degree of charge fluctuation is experimentally observable as the difference in the time-averaged molecular charges between ionic and neutral-like molecules. The obtained relationship is explained from the energy level of the charge distributions in the low-dimensional structure. The energy level of the charge distributions is deduced from the inter-molecular distances, that is, the nearest neighbor Coulomb repulsion as well as the transfer integral. To the author’s best knowledge, this relationship is applicable to all β"-type ET salts whose degree of charge fluctuation has been confirmed by vibrational spectroscopy. This review is organized as follows. In Section 2, the requirement of model compounds suitable for studying charge fluctuation around the superconducting phase is discussed. Among many molecular conductors, the β"-type ET salts satisfy the requirements described in Section 2. The properties of three kinds of vibrational modes will be introduced in the first half of Section 3. In the last half of this section, the method for observing three vibrational modes is described. The author believes that the information described in Section 3 is useful for the researchers who are planning to study the vibrational spectra of molecular solids. This experimental method was applied to insulator, superconductor and metallic materials. These experimental results are presented in Section 4. In this section, the energy level of the charge distribution will be reviewed. In Section 5, we show the schematic phase diagram where the experimental results described in Section 4 are summarized. In this phase diagram, the relationship between the conducting property and degree of charge fluctuation can be observed. In the last part of this review, the author gives brief comments on the experimental results for the β"-type ET salts, reported by other groups. The author believes that the discussions in Section 2, Section 4 and Section 5 can contribute to the progress of investigations for the charge ordered state and superconductivity.
Figure 1. (top) ET molecule. (middle) and (bottom) Representative and schematic views of the crystal structure of the β″-type ET salt viewed from different angles. (middle) Side view of the conducting (=2D) layer and an anion layer. (bottom) Schematic view of the 2D layer.
Crystals 02 00893 g001

2. Requirements for the Model Compounds

It is important to select the model compounds suitable for studying the relationship between conducting behavior and the degree of charge fluctuation. In general, molecular conductors consist of partially (or fully) oxidized molecules and fully (partially) reduced molecules. The chemical composition is expressed as DnAm where D (A) denotes donor (acceptor) molecule and n and m are integers. Either D or A, or both, are the organic molecules. The ET molecule can form numerous crystalline materials with many kinds of anions. The crystals synthesized in one batch do not always show the same crystal structure even though the chemical compositions are the same. The crystal growth in the ET-containing salts often shows a packing polymorphism. The different polymorphisms are designated with the Greek letters: α, α', β, β', β", δ, θ, κ, κ', etc. Even in the same packing motif, there is a variety in the conducting property; semiconducting, superconducting and metallic behaviors. This variety is mainly attributed to the fact that the inter-molecular interaction, that is, the inter-molecular distance depends on the size of the counter anion. The methodology for changing the conducting property by changing the size of the counter anion is often called chemical pressure. It should be noted that the neither a piston cylinder nor an anvil cell is needed for inducing chemical pressure. It is obvious that estimation of the change in inter-molecular distance under ambient pressure is more accurate than estimation under physical pressure. If phase transition involving a structural change is observed under physical pressure, it is necessary to conduct an additional experiment, that is, structural analysis. However, structural analysis can not always be applied to molecular conductors under hydrostatic pressure. Therefore, study on the inter-molecular distance by using chemical pressure is superior to that based on physical pressure. In order to discuss the inter-molecular distance from the standpoint of chemical pressure, it is necessary to compare the results of the numerical compounds whose inter-molecular distance are different from one another. There are many β"-type ET salts whose inter-molecular distances are slightly different from one another [2]. From the viewpoint of chemical pressure, a β"-type ET salt is one of the best model compounds.
Let us now introduce the requirements of the model compound. The requirements are summarized as follows. (a) The mechanisms of the charge ordered state and charge fluctuation are understood from the viewpoint of the inter-molecular distance. (b) The electronic resistivity exhibits diversity without physical pressure. Among the available molecular conductors, a group of the β"-type ET salts satisfies the above requirements. The detailed requirements concerning (a) and (b) are described below.
(a) First, the requirements for the crystal structure are described in (a1) to (a3).
(a1) The molecular arrangement in the 2D layer is simple. As shown in Figure 1, there are three kinds of overlapping modes: molecular overlap along the stacking, transverse and diagonal directions. The nearest neighbor Coulomb integral, V, is the largest along the stacking direction. On the other hand, the transfer integral, t, is the smallest along the stacking direction whereas t is the largest along the transverse direction. For the quasi-1D molecular conductors, on the other hand, the direction of largest V is the same as that of largest t. Owing to such a condition, the distribution of site charges required from V is not always consistent with that from the bond alternation. Such competition can be avoided using the β"-type ET salts or [Pd(dmit)2]2 salts [2,17,18,19,20]. As for the β"-type ET salts, the direction of largest V is perpendicular to that of the largest t. With the assumption that the charge distribution in the charge ordered state (CO) depends on V, the distribution should be correlated with the inter-molecular distance along the stacking direction. Because of the perpendicular relationships mentioned above, V along the stacking direction and t along the transverse direction are treated independently in the CO state. Indeed, this assumption is confirmed from some experiments of the β"-type ET salts [17,18], which will be described in Section 3. Therefore, the molecular arrangement in the 2D layer of the β"-type ET salts is simple from the standpoint of the electronic structure. In contrast to the β"-type ET salts, the directions of largest V in the α, β and θ-type ET salts are not perpendicular to those of the largest t. In such cases, V and t are not always independent of one another, and the bond order should be taken into consideration.
As for [Pd(dmit)2]2 salts, the direction of the largest V is identical to that of the largest t. Nevertheless, the competition between V and bond alternation in the charge distribution is avoidable because of HOMO-LUMO inversion [20]. HOMO-LUMO inversion is induced by the fact that two [Pd(dmit)2] molecules form a very tight dimer [21,22]. Owing to the inversion of the energy levels of molecular orbitals, the charge distribution required from V can cooperate with the bond order required from t [20,21,22,23]. This mechanism is significantly different from the TTF-based molecular conductors and quinone-based molecular conductors. To the author’s best knowledge, however, there are only three kinds of [Pd(dmit)2]2 salts which exhibit the charge ordered (CO) transition [20,21,22,23,24]. On the other hand, a number of the β"-type ET salts exhibit CO transition. Furthermore, there are no ambient pressure superconductors in the [Pd(dmit)2]2 salts. Therefore, a β"-type ET salt is one of the best model compounds for studying the role of V in charge distribution.
(a2) β"-type ET salts have a variety in the repeat unit in the 2D layer, particularly in the inter-molecular distance along the stacking direction [2]. In most of the β"-type ET salts, the columnar structure is not uniform. Figure 2 shows the definition of the inter-molecular distance and the size of the repeat unit. The size is expressed as the ratio between ET molecules and holes in the repeat unit, M:H. Note that “M:H” is not always identical to the chemical composition, “n:m”. For example, M:H of β″-(ET)3Cl2·2H2O corresponds to 6:4 rather than 3:2. Let us consider the inter-molecular distances. As shown in Figure 2 there are two kinds of overlapping modes, whose distances are ~5 Å and ~4 Å. These inter-molecular distances are denoted as “L” and “s” (L >> s), respectively. The configuration of the inter-molecular distance of β"-(ET)2AuBr2, which belongs to M:H = 2:1, is expressed as [sLsL…]. As for e M:H = 4:2, the other kind of the inter-molecular distance “L'” and/or “s'” is allowed. However, there is no remarkable difference in the inter-molecular overlapping modes between “L” and “L'”, nor between “s” and, “s'”. The inter-molecular distances of “L' ” and “s' ” are slightly larger than those of “L” and “s”, respectively (L' > L >> s' > s). Comparing with 2:1-salts, 4:2-salts have variety in the configurations; [sLL'L], [sLsL'], [ss'sL] etc. To our best knowledge, M:H of the β"-type ET salts can take 1:0.5, 2:1, 3:2, 4:2 and 6:4.
As far as a double occupancy at the same molecule is forbidden, the number of charge distributions is expressed as MCH. When M:H = 4:2, for example, the number of the charge distribution is 6 [25,26]. When the nearest neighbor Coulomb repulsion, V, is taken into consideration, the energy levels of all charge distributions are not necessarily identical to one another. The energy levels are obtained from the configuration of the inter-molecular distances; [sLL'L], [sLsL'], [ss'sL] etc. The most stable charge distribution, assumed from the configuration of the inter-molecular distance, must be the charge distribution in the CO state. The comparison between assumed and actual distributions can be conducted from the experiment: vibrational spectroscopy, x-ray analysis, etc. In the charge fluctuated state, charge distribution is defined as the time-averaged charge distribution, which is composed of the most, secondary, tertiary, stable distributions etc. Because the life-time of the stable distribution is larger than that of the unstable distribution, the most stable distribution plays a large part in the time-averaged distribution. Assuming that the time-averaged distribution can be expressed as the linear combination between all possible distributions, the weighting coefficient is large for the stable distributions whereas the coefficient is small for the unstable distributions. The time-averaged distribution can also be examined by using vibrational spectroscopy. Since the β"-type ET salts show a variety in the configuration in the inter-molecular distance, a detailed analysis in the energy levels of the charge distributions can be conducted. Therefore, detailed relationships between the degree of charge fluctuation and the inter-molecular distances can be obtained.
Figure 2. Definition of the inter-molecular distance and a variety in the repeat unit. The number of the ET molecules in the repeat unit corresponds to M = 2, 3, 4 and 6.
Crystals 02 00893 g002
(a3) It is easy to conduct factor group analysis in the IR and Raman spectra of the β"-type ET salts. A molecular vibrational mode is often observed as a multiple peak in the molecular crystal. The number of the vibrational modes in a molecular crystal depends on the number of molecules in the repeat unit. These crystal modes obey factor group theory. The only symmetry operation applicable to the 2D layer in most of the β"-type ET salts is an inversion operation. In the insulator phases of some β"-type ET salts, even the center of the inversion symmetry is lost. In contrast to the β"-type ET salts, the other symmetry operation is applicable to the 2D-layers of the θ-type ET salts [27]. Owing to the additional symmetric operation, the polarization dependence of the crystal modes is more complicated. In order to analyze the crystal modes in the θ-type ET salts, observation of detailed polarized IR and Raman spectra is required [27]. Concerning the β"-type ET salts, on the other hand, it is not necessary to analyze the detailed polarization dependence in the Raman spectra. In principle, the essential and yet sufficient condition for analyzing the crystal symmetry is to examine the mutual exclusion rule in the IR and Raman spectra. If the center of the inversion symmetry is lost, all crystal modes should be observed in IR spectra. However, the crystal mode in the IR spectra exhibits more or less polarization dependence because both molecular structure and crystal structure are anisotropic. In order to observe all crystal modes, it is recommended to examine the polarization dependence in the IR spectra as well as to examine the mutual exclusion rule. Nevertheless, the measurement time is significantly short and the factor group analysis is simple when compared with the θ-type ET salts. The details of the experimental method are described in Section 3.4.
(b) The other requirement for the model compound is diversity in conducting behavior. The β"-type ET salts fulfills this requirement. In the following, the conducting behavior is summarized in (b1) to (b5) and Table 1.
(b1) β"-(ET)2AuBr2, β"-(ET)4[Ga(ox)3H3O]pyridine, β"-(ET)(TCNQ) are inherently metals because magnetic quantum oscillation is observed [28,29,30,31,32]. β"-(ET)2Cl(C2I2) and β"-(ET)2Br(C2I2) are thought to be metals because the electrical resistivities exhibit metallic behavior down to liquid helium temperature [33].
(b2) The electrical resistivity of β"-(ET)2SF5CH2CF2SO3 and β"-(ET)4[Ga(ox)3H3O]PhNO2 exhibits superconducting (SC) transition under ambient pressure [34,35]. The former exhibits the metal-SC transition and the latter shows the insulator-SC transition. Other ambient pressure superconductors have also also reported [36,37]. The conducting properties of β"-(ET)2SF5CH2CF2SO3 are not listed in Table 1 because the detailed the experimental results are not described in this review.
(b3) The electrical resistivity exhibits bad metallic behavior just below room temperature and shows insulating behavior at low temperature. In this review, bad metallic behavior is defined as the conducting state where the electrical resistivity does not depend on the temperature. In order to induce a superconducting transition, hydrostatic pressure is needed but a high pressure is not required. β"-(ET)4Pt(CN)4·H2O and β"-(ET)4Pd(CN)4·H2O belong to this group [5,38].
(b4) The electrical resistivity exhibits bad metallic behavior around room temperature but shows exponential increase at low temperature. A number of β"-type ET salts belong to this group.
(b5) Strictly, this group belongs to (b4). The ground state at ambient pressure is the charge ordered and insulating state. A superconducting transition is observed under high pressure. On increasing pressure further, the electrical resistivity undergoes metallic behavior at liquid-helium temperature. β″-(ET)3Cl2·2H2O belongs to this group. The pressure-temperature phase diagram is reported in reference [39,40]. This pressure dependence is thought to be the change from (b4) to (b1). Although the superconducting transition is observed above 1 GPa, this pressure region is suitable for monitoring pressure dependence of the charge sensitive vibrational mode by using a sapphire anvil cell.
As described above, the β"-type ET salts have diversity in the inter-molecular distances and conducting behavior. Therefore, we can expect that a detailed relationship between degree of charge fluctuation and conducting behavior would be obtained.
Table 1. List of the β″-type ET salts discussed in the present review. The results of temperature dependence of the electrical resistivity are shown in the second column. “M:H” denotes the ratio between molecules and holes in the repeat unit in the 2D layer. The right column denotes the references where the crystal structures or electrical resistivity are reported.
2/3-Filled Group Resistivity M:H Reference
(ET)3(ClO4)2(b4)TMI ~ 170 K3:2[41]
(ET)3(HSO4)2(b4)TMI = 127 K3:2[42]
(ET)3(ReO4)2(b4)TMI = 80 K3:2[43,44]
(ET)3Cl2·2H2O(b5)TMI = 170~100 K, 6:4 a[39,40,45]
TSC = 2-6 K (1.6-1.2 kbar)
3/4-Filled Group Resistivity M:H Reference
(ET)4Ni(CN)4·H2O(b4)TMI ~100 K4:2[38]
(ET)4Pd(CN)4·H2O(b3)TMI ~ 100 K, 4:2[5]
TSC = 1.2 K (7 kbar)
(ET)4Pt(CN)4·H2O(b3)TMI ~ 100 K, TSC = 2 K (6.5 kbar)4:2[38]
(ET)4[(H3O)Ga(C2O4)3]PhNO2(b2)TMI ~ 100 K, TSC = 7.5 K4:2 b[35]
(ET)4[(H3O)Ga(C2O4)3]Pyridine(b1)Metal4:2 b[35]
(ET)4[(H3O)Ga(C2O4)3]CH2Cl2(b1)Metal4:2 b[46]
(ET)2Cl(C2I2)(b1)Metal2:1[33]
(ET)2Br(C2I2)(b1)Metal2:1[33]
(ET)2AuBr2(b1)Metal2:1[47]
a M:H is different from the chemical composition, m:n = 3:2. b M (H) is different from the formal number of the molecules (holes) in the crystallographic repeat unit in the 2D layer. The formal numbers are defined as 8 and 4, respectively.

3. The Properties of the C=C Stretching Modes and the Methodology for Observing the C=C Stretching Modes

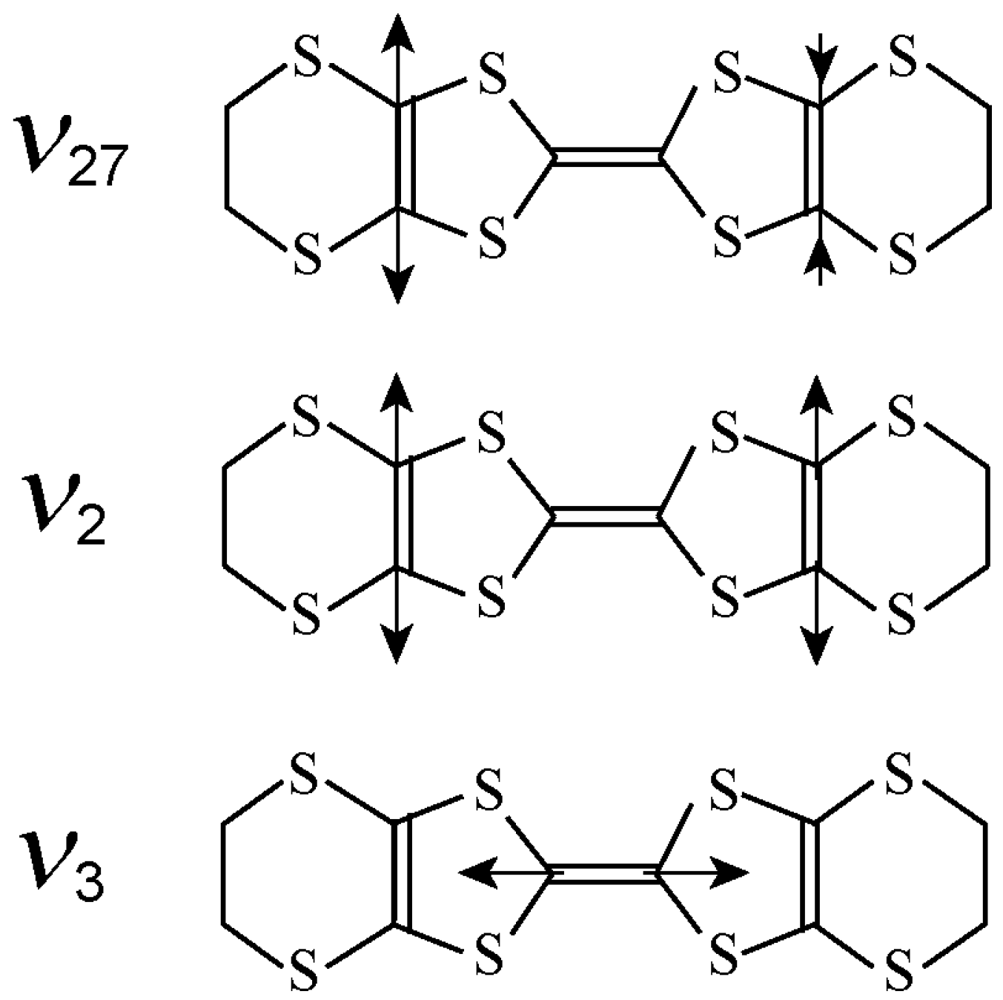
3.1. C=C Stretching Mode of Isolated Molecules

Because the number of C=C bonds in one molecule is three, the number of the C=C stretching mode is three [48,49,50,51]. Figure 3 shows three vibrational modes. When the ET molecule has a center of inversion symmetry, ν27 is IR active and ν2 and ν3 are Raman active. The frequencies of these modes show decrease from neutral to radical cations [49,50]. When the inter-molecular interaction is negligible in the crystalline material, the frequencies of each vibrational mode are unperturbed by the inter-molecular interaction.
In conducting materials, on the other hand, the inter-molecular transfer integral is non-negligible. The symmetric vibrational modes are non-degenerated when the charge transfer is induced by electron-molecular vibrational (e-mv) interaction. The frequencies of ν2 and ν3 are more or less perturbed. Let us assume the condition that the charges of all molecules in a crystal are identical to one another and that the number of molecules in the repeat unit is n (>2). The number of each vibrational mode is equal to n. The e-mv coupling constant of ν2 is small, ~0.02 eV, whereas the coupling constant of ν3 is large, ~0.1 eV, [49]. Owing to a small coupling constant in the ν2 mode, the frequencies of all ν2 modes are almost identical to one another. On the other hand, the frequencies of all ν3 modes are not always identical to one another. The frequencies of all ν27 modes are identical to one another because the out-of-phase mode is free from the e-mv interaction. Therefore, the properties of ν2 and ν27 are significantly different from that of ν3. The former are sensitive to molecular charge, the latter to a subtle change in the electronic structure.
Figure 3. Schematic views of the ν27, ν2 and ν3 modes. Strictly, the C=C stretching at the central C=C bond (wing C=C bonds) has little contribution to the ν2 (ν3) mode.
Crystals 02 00893 g003

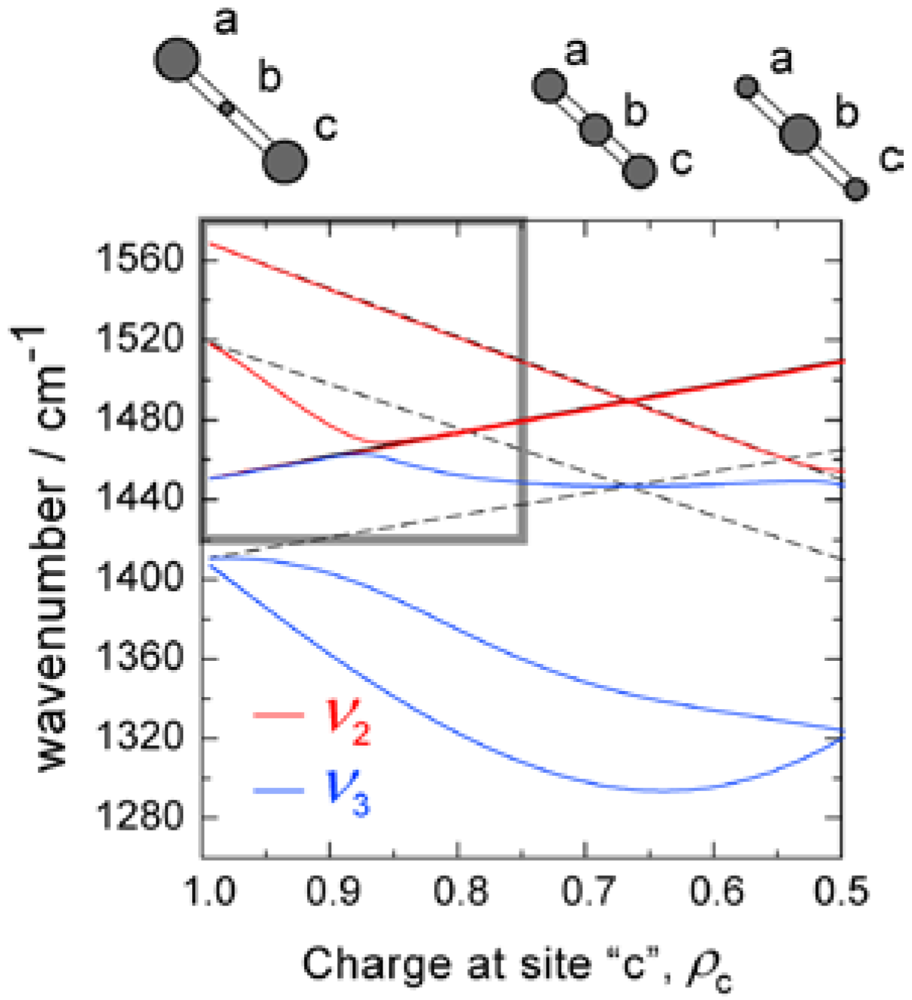
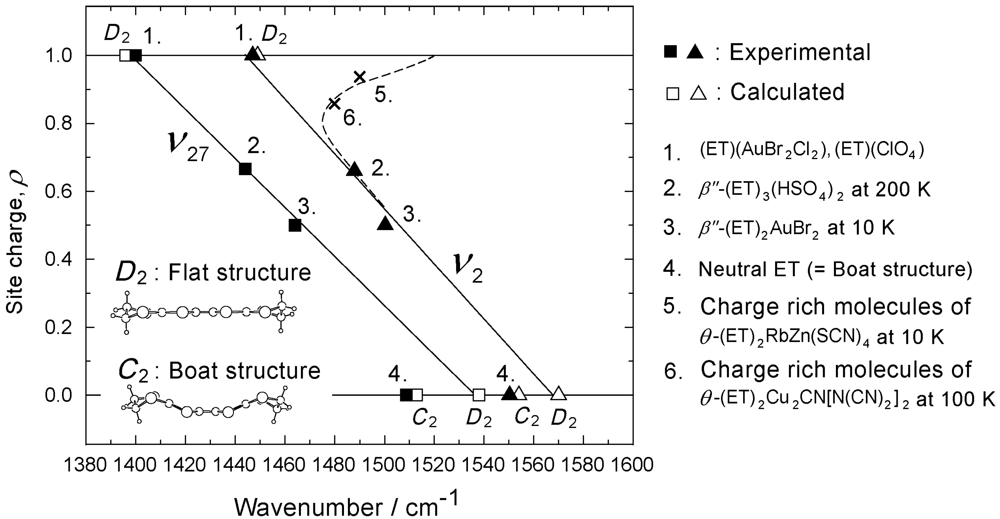
3.2. Relationship Between the Molecular Charge and the Frequency of the Charge Sensitive Mode

In this subsection, we describe the behavior of ν27 (ν2) whose frequency is not perturbed (less perturbed) by the e-mv interaction. Let us assume the symmetric trimer where the repeat unit consists of two ionic molecules and one neutral-like molecule. The number of IR (Raman) active ν27 mode is two (one), and that of Raman (IR) active ν2 mode is two (one). As for the ν2 modes, three vibrational modes are expressed as follows.
Crystals 02 00893 i001      (1)
Crystals 02 00893 i002      (2)
Crystals 02 00893 i003      (3)
“N” and “I” denote neutral-like and ionic molecules, and the notations of “a~c” are indices, the molecules in a symmetric trimer; “a” and “c” are the outer molecules and “b” is the center molecule. Similar relations are obtained for the ν27 modes, but the notations of “Raman” and “IR” in the above relations are required to be substituted by “IR” and “Raman “, respectively. Since the e-mv coupling is negligible, the coefficient “a” can be regarded as ~1. Two Raman active ν2 modes correspond to ionic and neutral-like molecules whereas one IR active ν2 mode is assigned to ionic molecules. In the same way, two IR active ν27 modes correspond to ionic and neutral-like molecules whereas one Raman active ν27 mode is assigned to ionic molecules. Indeed, the frequency of the IR active ν2 mode belonging to ionic molecules is almost identical to the corresponding ν2 mode in the Raman spectra, and the Raman active ν27 mode belonging to the ionic molecule is also identical to the corresponding ν27 mode in the IR spectra [17]. This result ensures that the frequencies of both ν27 and ν2 modes are basically reflected in the molecular charge. Therefore, the ν27 and ν2 modes are useful to estimate the site charges. However, the intensity of ν27 in the Raman spectra is weak, and ν2 in the IR spectra is also very weak [17]. Hereafter, we discuss the IR active ν27 mode and the Raman active ν2 mode, whose intensities are strong in the IR and Raman spectra, respectively.
Figure 4. The relationship between the molecular charge and the frequency of the ν27 (ν2) mode [16]. The filled squares and trianglesdenote the experimental data. The opened squares and triangles correspond to the calculated data. The calculation in the flat (boat) structure is conducted by assuming D2 (C2) symmetry. Broken line denotes the frequency of the ν2 mode when the ν2 and ν3 modes show the avoided crossing. Crosses denote the frequencies obtained from the experiments of the θ-type ET salts.
Crystals 02 00893 g004
In Figure 4, the experimentally obtained frequencies are plotted with respect to the molecular charges. Except for the neutral molecule, there is a linear relationship between the frequency and the molecular charge. However, the frequency of ν27 in the neutral molecule deviates from the linear relationship. The deviation from the linear relationship is also observed for ν2 in the neutral molecule. The deviations from the linear relationships are ascribed to the difference in the molecular structures between the neutral molecule in the neutral crystal and the molecules in the ET-salts. The neutral molecule takes a boat structure whereas the molecules in the radical cation salts take a flat structure. In order to obtain a more exact relationship between the frequency and molecular charge, the frequencies of vibrational modes in the flat and neutral molecules were calculated from the DFT (B3LYP/6-31G**) method [16]. The frequencies of the boat and neutral molecules and the frequencies of the flat and radical cations were also calculated by using the same method. The calculated frequencies of the ν27 and ν2 modes are also plotted in Figure 4. The calculated data of the flat structures are reasonably in agreement with the linear relationship obtained from experiments of the ET salts. The solid lines in Figure 4 show the upgraded relationships between the charge and frequencies. These linear relationships are obtained from the calculated frequencies in the flat and neutral molecules and the frequencies of the ET salts. These upgraded relationships are useful for quantitative estimation of the site charges. From the linear relationships, we have ν27(ρ) = 1398 + 140(1 − ρ) and ν2(ρ) = 1447 + 120(1 − ρ). However, the ν2 mode sometimes exhibits avoided crossing when the frequency of ν2 in the ionic molecule is close to the frequency of the ν3 mode, which is discussed in Section 3.3. In this sense, the estimation of the molecular charge using the ν27 mode is superior to the estimation using the ν2 mode. Nevertheless, the condition of avoided crossing is limiting. On the contrary, the ν2 mode of a neutral-like molecule is free from avoided crossing because the frequency of ν2 in a neutral-like molecule is significantly higher than that of ν3. Therefore, a quantitative discussion using ν2 mode is applicable to most of the ET-containing salts.

3.3. Factor Group Splitting in ν3 Mode

The ν3 mode couples with the charge transfer transition. The frequency is perturbed by the e-mv interaction. Let us assume the symmetric trimer and the symmetric and non-liner tetramer, where repeat units have the ratio of M:H = 4:2 or M:H = 3:2. The number of both IR and Raman modes of the tetramer is two. As shown in Equations (1,2), the number of the Raman mode for the trimer is two and that of the IR mode is one. The degrees of perturbation in the ν3 modes of tetramer and trimer are evaluated from Figure 5 and Figure 6, respectively [16,17]. The electronic states are solved by exact diagonalization and the frequencies are numerically calculated by constructing the force constant matrix from the second derivative by the normal coordinate of the vibrational mode. The detailed procedures of the calculation are based on [52,53,54,55,56,57]. The transverse axis corresponds to the molecular charge at site “c”. The highest frequency mode of all ν3 modes is the Raman active mode, where all central C=C bonds in the repeat unit show in-phase vibration. In the wide range of ρc, this frequency is almost identical to the frequency corresponding to the chemical composition, that is, the frequencies at +0.5 and +0.67 in Figure 5 and Figure 6, respectively. This mode is also insensitive to the magnitude of the transfer integral as long as the transfer integral is not small [58]. Therefore, the highest frequency mode is the most insensitive to both structural change and molecular charge.
In the highest frequency mode, the number of phase inversions in the repeat unit is zero because of in-phase vibration. On the other hand, the other crystal modes exhibit phase inversion. Charge transfer is induced, particularly between the neighboring molecules whose C=C stretching modes vibrate out-of-phase. The frequency is decreased due to e-mv interaction. The degree of perturbation depends on the magnitude of the transfer integral, the number of the phase inversion and the charge distribution [58]. As shown in Figure 5 and Figure 6, the frequencies depend on the charge distribution. The line-width and intensity of the e-mv mode are increased with decreasing frequency. Not only the frequency but also the line-width and intensity are sometimes useful for examining the degree of perturbation. Therefore, the charge distribution can be examined from the behavior of the ν3 mode. As for the ν3mode of the β"-type ET salts discussed in the present review, the number of the ν3mode is at most 2~4. Under such conditions, the frequencies of multiple ν3 modes are different from one another, which allow us to assign these modes easily. Applying the factor group analysis to the crystal mode, the charge distribution in the repeat unit can be examined. In this sense, it is important to examine the mutual exclusion rule. The polarization dependence in the IR active ν3 modes is also important in some cases.
Figure 5. Behavior of the ν3 modes in a non-linear tetramer (M:H = 4:2) as a function of the fractional charge, ρ. The frequencies of the ν2 modes are also shown in this figure. Transfer integrals are shown at the top of the panel. On-site and nearest neighbor Coulomb energies are assumed to be 0.8 and 0.33 eV, respectively. Avoided crossing is assumed in this calculation. Avoided crossing is expected to occur for both large ρc and small ρc. The areas of avoided crossing are enclosed by the squares.
Crystals 02 00893 g005
In the last part of this subsection, we describe the avoided crossing between ν2 and ν3. When the frequency of ν2 at an ionic molecule is close to that of the highest frequency mode in the ν3 modes, both modes often exhibit an avoided crossing. The avoided crossings of the tetramer and trimer are reproduced in Figure 5 and Figure 6, respectively [16]. In the present calculation, the force constant matrix contains the cress term composed of the normal coordinates of the ν2 and ν3 modes. As for the simulation of the trimer, the methodology for the calculation in reference [16] is applied to the simulation in reference [17], where avoided crossing was not introduced. When the ν2 and ν3 modes have the same parity, avoided crossing occurs. Avoided crossing is often observed in the θ-type ET salts [27,58,59]. Concerning β"-type ET salts, avoided crossing is observed in the CO state of β"-(ET)3(ReO4)2. However, this phenomenon is not always observed in the vibrational spectra of all β"-type ET salts. When the ν2 and ν3 modes exhibit avoided crossing and ρ is close to +1, the exact molecular charge of the ionic molecule cannot always be estimated from the frequency of the ν2 mode. However, the exact estimation of ρ can be conducted from the ν27 mode because this mode is free from such a problem. It should be noted that ρ of a neutral-like molecule can be estimated from the frequency of the ν2 mode because the frequency is remarkably higher than that of the ν3 mode. As far as the ratio between the ionic and neutral-like molecule is known, ρ of the ionic molecule can also be estimated from both chemical composition and ρ of the neutral-like molecule. Therefore, the molecular charge can be estimated from the vibrational spectroscopy mode even if avoided crossing is occurring.
Figure 6. Behavior of the ν3 modes in a linear trimer as a function of the fractional charge, ρ. The frequencies of the ν2 modes are also shown in this figure. Transfer integrals, on-site Coulomb energy and nearest neighbor Coulomb energy are assumed to be 300 meV, 0.8 eV and 0.2 eV, respectively. The frequencies of the unperturbed conditions are based on reference [17]. Avoided crossing is expected to be occurring for large ρc, and the area is enclosed by the square.
Crystals 02 00893 g006

3.4. Experimental Method

In this subsection, we describe the methodologies for the measurements appropriate for the ν27, ν2 and ν3 modes. In general, the sample was a small and luster single crystal, and the color of the single crystal was black. The IR spectra were observed by using a reflectance microscope. Optical conductivity was obtained from a Kramers-Kronig transformation from IR-reflectance spectra. Raman spectra were obtained from backward scattering configuration by using a reflectance microscope.
The ν27 mode is inherently IR active because of the asymmetric vibration. The transition dipole moment is parallel to the molecular long axis [60,61]. The ν27 mode is expected to be strong when the polarization direction is parallel to the molecular long axis. In most of the conducting ET salts, the molecular long axis is perpendicular or almost perpendicular to the conducting and 2D layer. Indeed, the ν27 mode is strong when the polarization direction is parallel to the inter-layer direction. Furthermore, the intensity of the e-mv mode belonging to the ν3 mode is remarkably reduced because the direction of the CT transition is perpendicular to the inter-layer direction. Therefore, this configuration is the best condition observing the ν27 mode. As is often the case with a plate-like crystal, the crystal surface perpendicular to the 2D layer corresponds to the edge of the crystal. When the thickness of a single crystal is comparable to or larger than 100 μm, reflectance spectra can be obtained from a commercially available measurement system. If the thickness is 10~100 μm, the reflectance spectra should be obtained using IR light in the synchrotron radiation [20]. The ν27 mode is sometimes observed in the Raman spectra from the requirements of factor group theory and the lowering of symmetry. However, in general, the ν27 mode in the Raman spectra is very weak as compared with ν2 and ν3 modes in the Raman spectra [17,18]. Therefore, the ν27 mode should basically be observed by using an IR spectrometer equipped with a microscope.
The ν2 mode is the symmetric mode. The frequency is less perturbed by the e-mv interaction because of the small coupling constant, 0.02 eV [49]. The frequency is straightforwardly reflected by the molecular charge unless there is an avoided crossing. The intensity of the ν2 in the Raman spectra depends on the energy of the excitation laser. As for β″-(ET)3(HSO4)2 and β″-(ET)3(ClO4)2, for example, the ν2 of the neutral-like and ionic molecules are resonated with 780 nm and 514 nm lasers, respectively. In order to observe all of the ν2 modes, those which are Raman active, it is recommended that the excitation laser dependence be examined. Otherwise, it is necessary to examine the consistency between the numbers of the Raman-active ν2 modes and the IR-active ν27 modes. In general, a good S/N ratio in the Raman spectra is obtained from the experimental configuration where the polarization direction is parallel to the inter-layer direction. In this configuration, however, the highest frequency ν3 mode is also strong. As a result, the ν2 mode is sometimes observed as a shoulder of the ν3 mode in this configuration. To avoid such circumstances, it is recommended that the ν2 mode be observed in the other configuration, where the polarized light is irradiated onto the 2D layer, that is, the polarization direction is parallel to a certain direction within the 2D layer. Anyhow, the primary choice for observing the ν2 mode is to use incident light polarized along the inter-layer direction.
The ν3 mode is significantly affected by the e-mv interaction. The highest frequency mode is inherently Raman active. This mode is strong when the polarization direction is parallel to the inter-layer direction. Nevertheless, the highest frequency mode is also observed in the Raman spectra when the polarization light is irradiated onto the 2D layer. If the repeat unit has a center of inversion symmetry, it is necessary to observe both IR and Raman spectra in order to observe all ν3 modes. When the space group is P1, on the other hand, the mutual exclusion rule cannot be applied to both IR and Raman spectra. Nevertheless, an observation of both IR and Raman spectra is recommended because we can examine whether or not a pseudo inversion center is located in the repeat unit. Such analysis is required for discussing the distribution in the site-charges and the network of the transfer integrals. As for the Raman spectra of the β″-type ET salts, the observation of any strict polarization dependence is not required, which is significantly different from the fact that polarization dependence in the θ-type ET salts is required for observing all ν3 modes. The difference between the β″-type ET salts and the θ-type ET salts is ascribed to the lack of a screw axis in the β″-type ET salts. Indeed, the Raman spectra of β″-(ET)3(ReO4)2 and β″-(ET)3(HSO4)2 do not show any remarkable polarization dependence [17,18]. On the other hand, the ν3 mode in the Raman spectra exhibits excitation energy dependence. Therefore, it is necessary to examine the excitation energy dependence, in particular, when the number of the ν3 mode tentatively observed is smaller than that estimated from factor group theory. The ν3 mode in the IR spectra often exhibits polarization dependence, but this phenomenon is not required solely from factor group theory. This polarization dependence of the ν3 mode in the IR spectra is related to the distribution of the molecular charge and the transfer integral. Therefore, it is essential to observe the ν3 mode in the IR spectra at least by using incident light polarized along the transverse and stacking axis in the 2D layer.

4. Results of Vibrational Spectra and Degree of Charge Fluctuation

In this section, the experimental results of the β″-type ET salts listed in Table 1 are described. In the first half of this section, the results of 2/3-filled salts (M:H = 3:2 and 6:4) are described. The results of 3/4-filled salts (M:H = 2:1 and 4:2) are discussed in the last half of this section. In each subsection, the relationships between the degree of charge fluctuation, the inter-molecular distance and the conducting property are discussed.

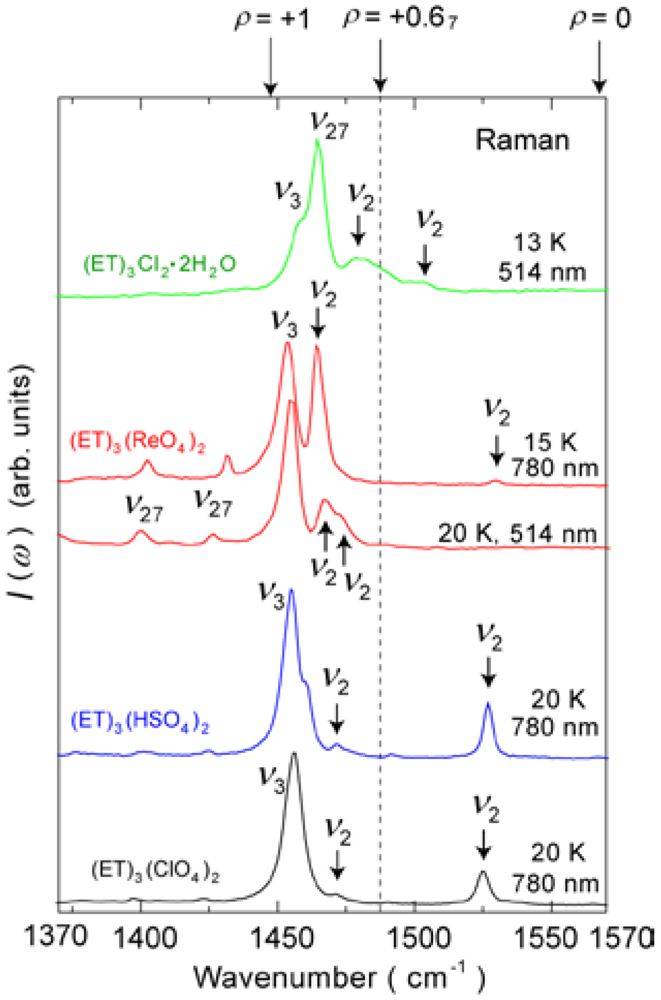
4.1. 2/3-Filled and 3:2-Salts

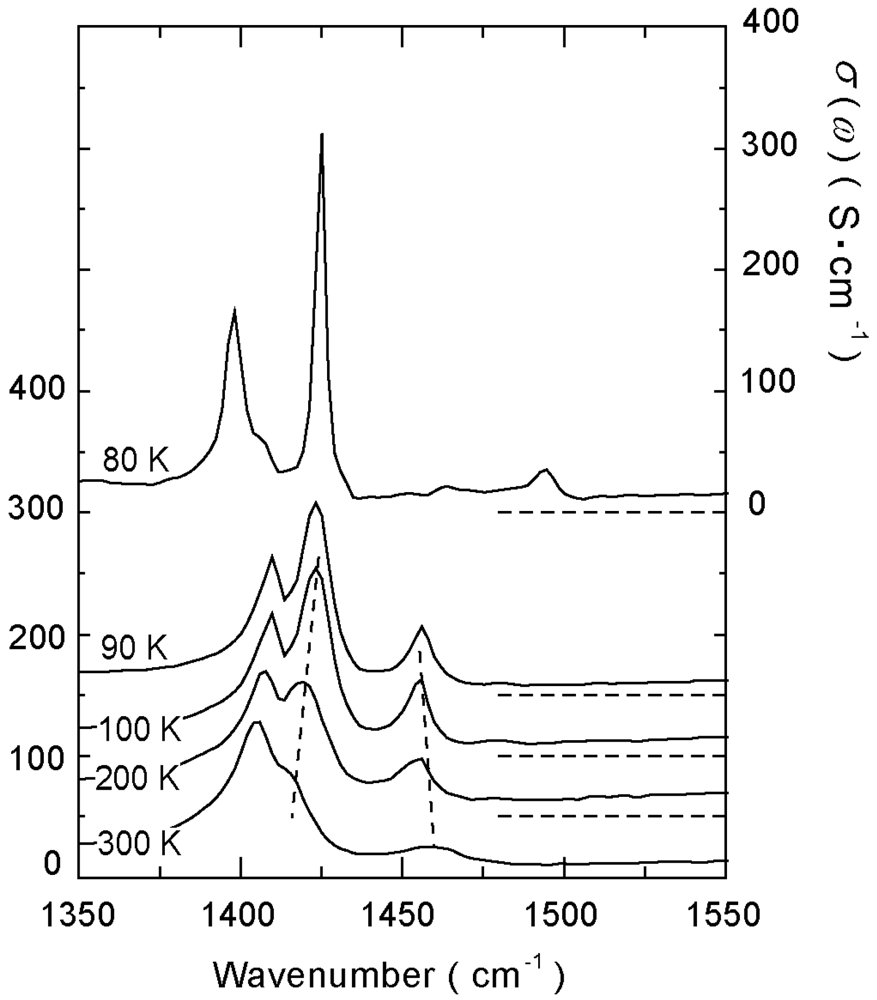
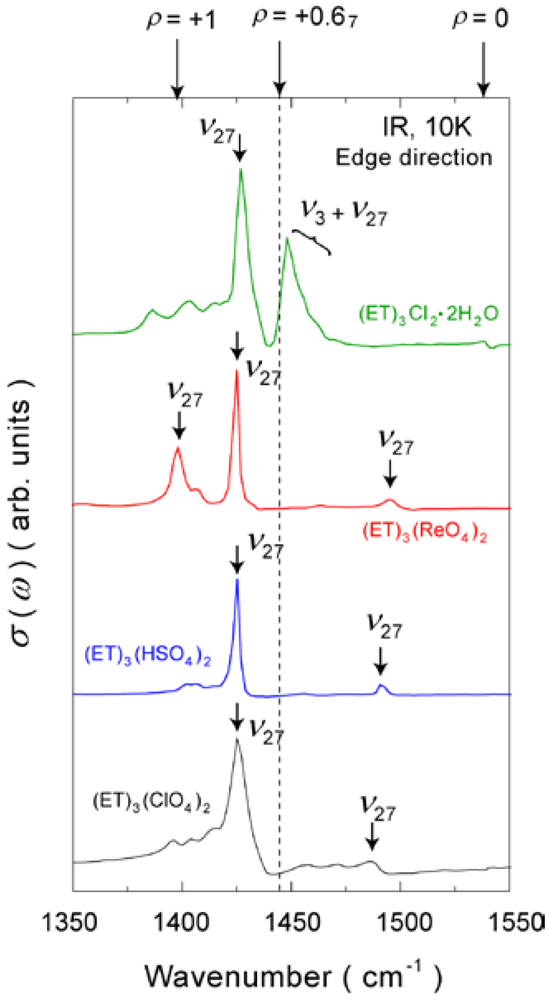
4.1.1. β″-(ET)3(ClO4)2 and β″-(ET)3(HSO4)2

The mechanism of the CO state of β″-(ET)3(ClO4)2 and β″-(ET)3(HSO4)2 is simple [18]. Figure 7 shows the temperature dependence of the ν27 mode of β″-(ET)3(ClO4)2. The ν27 mode exhibits peak separation around the temperature where the electrical resistivity increases [62]. The ν27 mode of β″-(ET)3(HSO4)2 also shows peak separation at the temperature where the magnetic susceptibility decreases and the electrical resistivity increases [42]. Figure 8 shows the ν27 mode in the IR spectra of the 2/3-filled salts. The site charges of β″-(ET)3(ClO4)2 (β″-(ET)3(HSO4)2) are estimated to be 0.81 and 0.36 (0.81 and 0.34) for the ionic and neutral-like molecules, respectively. Figure 9 shows the ν2mode in the Raman spectra of the 2/3-filled salts. The ν2 mode of β″-(ET)3(ClO4)2 and β″-(ET)3(HSO4)2 also exhibits peak separations. The estimated charges, 0.79 and 0.35 (0.79 and 0.33) are in agreement with those estimated from the ν27 mode. As shown in Figure 7, two ν27 modes at the ionic and neutral-like sites show a fused line-shape with increasing temperature above the transition temperature. However, the line-shape of the ν27 mode exhibits a very broad shape. This behavior is significantly different from the ν27 mode of a metal, whose line-width is very sharp and the frequency takes that corresponding to the chemical composition. The broad line-width in the high temperature phase indicates that the inhomogeneous site charges remain even above the CO transition temperature. However, the charges are not fully localized but exhibit dynamical fluctuation. The degree of fluctuation is defined from the line-width of the ν27 (ν2) mode or the difference in the frequencies between ν27 (ν2) modes at the ionic and neutral-like molecules. Since the frequencies of the ν27 and ν2modes are reflected in the molecular charge, the line-width and the difference in the frequency correspond to the difference in the molecular charge Δρ. When Δρ is large, the charge is localized due to charge ordering and the fluctuation is negligible. A charge fluctuation is characterized as a small but finite Δρ. When Δρ is very small, the charge is delocalized in a 2D layer or delocalized within a limited area. The former corresponds to a metal. One of the examples in the latter condition is the insulating state of κ-(ET)2Cu[N(CN)2]Cl, where one hole is delocalized in a tight dimer [63]. In the CO state of β″-(ET)3(ClO4)2 and β″-(ET)3(HSO4)2, Δρ is estimated to be 0.5, which is classified into a group of large Δρ. On the other hand, Δρ at 300 K are estimated to be 0.25 and 0.13, respectively. The difference in Δρ between β″-(ET)3(ClO4)2 and β″-(ET)3(HSO4)2 at 300 K is ascribed to the fact that the transfer integrals along the transverse direction of β″-(ET)3(ClO4)2 are smaller than those of β″-(ET)3(HSO4)2.
The number of ν3 modes is estimated to be three because M:H = 3:2. Indeed, three ν3 modes are observed in both IR and Raman spectra in the CO state. The excitation laser dependence of β″-(ET)3(ClO4)2 is almost identical to that of β″-(ET)3(HSO4)2. Furthermore, the polarization dependencies of the Raman spectra are common to each other. These observations indicate that the site charge distributions of β″-(ET)3(ClO4)2 is identical to that of β″-(ET)3(HSO4)2. As for the ν3 modes, the highest and lowest frequency modes are strong in the Raman spectra and the other mode is strong in the IR spectra, which is significantly different from the behavior in β″-(ET)3(ReO4)2. This observation indicates that the mutual exclusion rule applies to both IR and Raman spectra. In the Raman spectra of Figure 9, very weak peaks are observed at ~1425 cm1. This frequency is identical to that of the ν27 in the IR spectra. However the observation of the Raman active ν27 belonging to the ionic molecule is needed from factor group theory. This vibrational mode corresponds to the IR version of Equation (2). Therefore, we conclude that the mutual exclusion rule applies to both IR and Raman spectra. These results suggest that the repeat units in both salts have inversion centers and the distributions of the transfer integral along the transverse directions are identical to each other. Along the transverse direction, the transfer integral between ionic molecules is larger than that between ionic and neutral-like molecules. The relationship between the distribution of site charges and nearest neighbor Coulomb repulsion is examined from the inter-molecular distance along the stacking direction. As shown in Figure 2, the inter-molecular distance is defined as the distance between the centers of neighboring molecules. The relationship between the charges and distances is represented as [●s○s●L…], etc., where “s” (”L”) denotes the short (long) distance, and the ionic (neutral-like) molecule is designated as the filled (open) circle. The ratio between the short and long distances is s:L = 2:1, which is significantly different from s:L = 1:2 of β″-(ET)3(ReO4)2, which is described in the next subsection. The total number of charge distributions is ND = 3. All distributions are expressed as [●s○s●L], [●s●s○L] and [○s●s●L]. The former distribution is the most stable because this distribution satisfies the requirement that the charge-rich molecules are not adjacent to each other with a short distance. The number of stable distributions is NSD = 1. The other distributions are unstable and asymmetric whereas the most stable distribution is symmetric. Indeed, the experimental result supports the symmetric and the most stable distribution. Therefore, the CO state of β″-(ET)3(ClO4)2 and β″-(ET)3(HSO4)2 is understandable from the viewpoint of NSD = 1.
Figure 7. Temperature dependence of the ν27 modes in the IR-conductivity spectra of β″-(ET)3(ClO4)2. The conductivity spectra are obtained after Kramers-Kronig transformation of the IR-reflectance spectra. The incident light is polarized along the inter-layer direction. The broken lines are a guide for the eyes. Offsets are applied to all the spectra, except for the spectra at 300 K.
Crystals 02 00893 g007
Figure 8. The ν27 modes of some 2/3-filled salts at low temperature. The frequencies at ρ = 0 and +1 are denoted by the arrows on the top of the panel. The frequency corresponding to +0.67 is shown as the arrow and dotted line in this figure.
Crystals 02 00893 g008
Figure 9. Raman spectra of some 2/3-filled salts at low temperatures. The ν2 mode in each salt exhibits peak separation. The frequencies at ρ = 0 and +1 are denoted by the arrows on the top of the panel. The frequency corresponding to +0.67 is shown as the arrow and dotted line in this figure.
Crystals 02 00893 g009

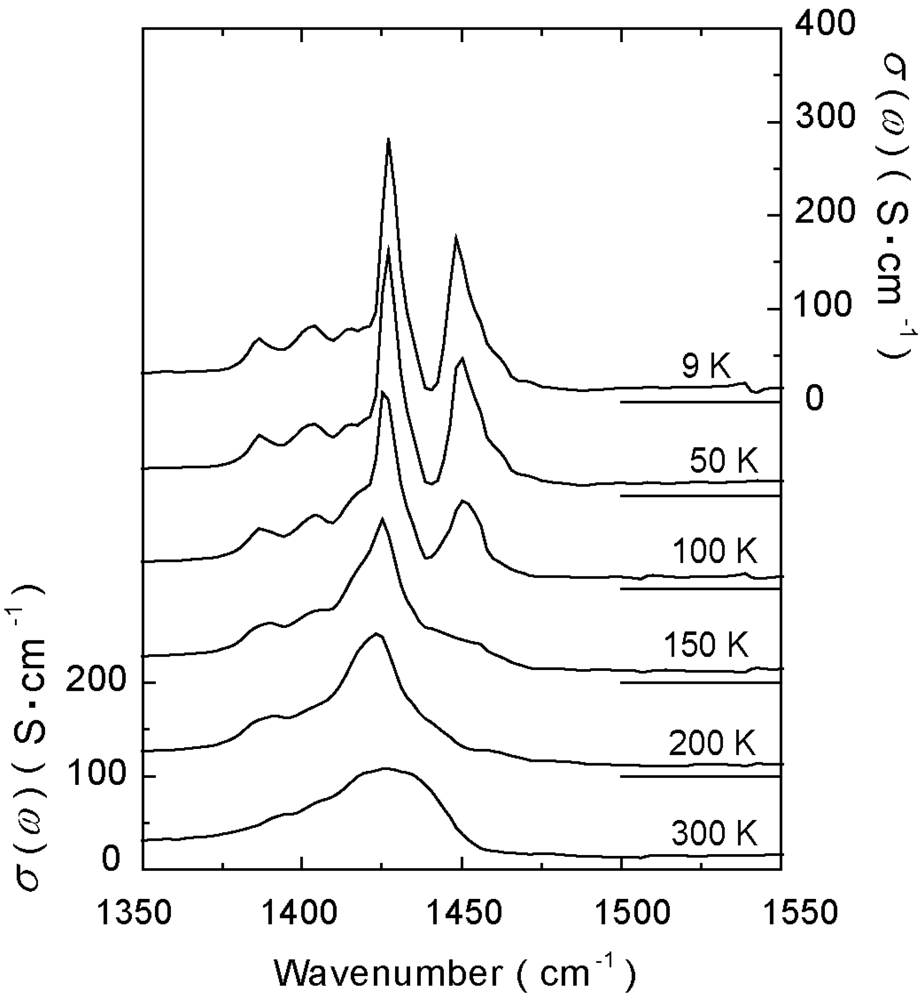
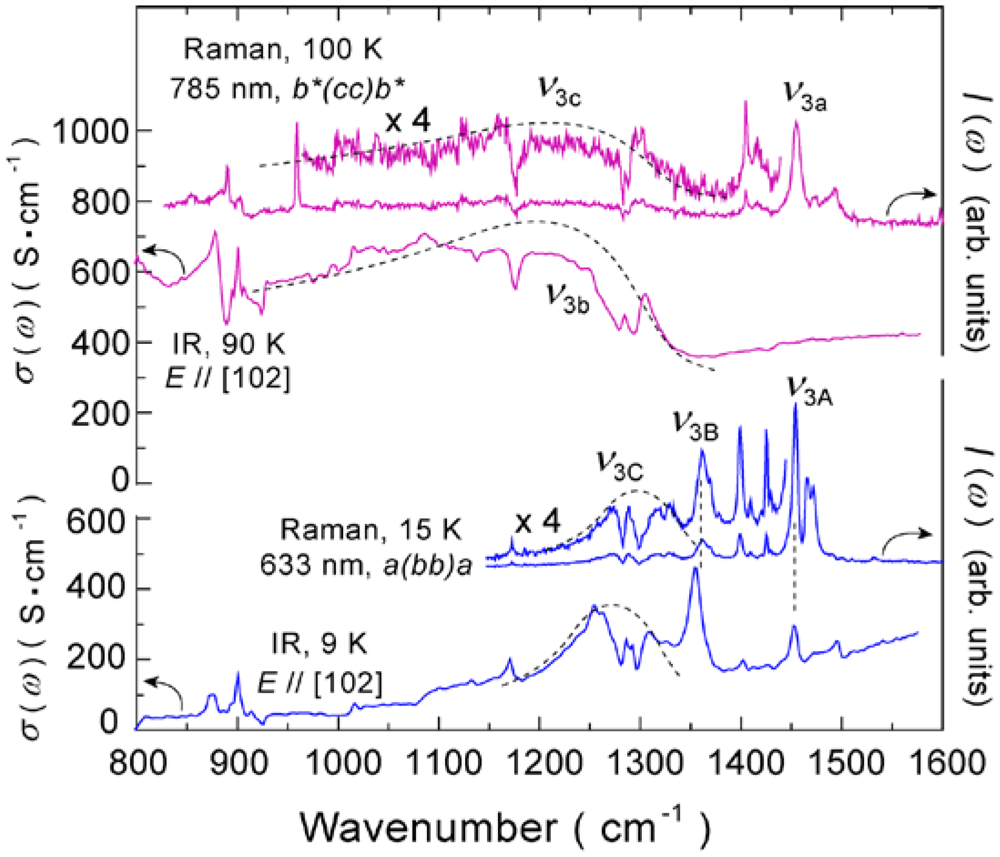
4.1.2. β″-(ET)3(ReO4)2

Let us discuss the CO transition of β″-(ET)3(ReO4)2 [17]. As shown in Figure 8, the number of the ν27in the IR spectra is three. The high frequency and weak peaks belong to the neutral-like molecule, and the others belong to the two kinds of ionic molecules. The number of ν2 modes in the Raman spectra is also three. These observations indicate that a repeat unit consists of two kinds of ionic molecules and one neutral-like molecule. The difference in the frequencies in the ν2 modes between the two kinds of ionic molecules is significantly smaller than that estimated from the ν27 modes. This inconsistency indicates that ν2 and ν3 exhibit avoided crossing. The exact molecular charges are estimated from the frequencies of the ν27 mode. The estimated molecular charges are 0.95, 0.85 and 0.2.
Figure 10 shows the behavior of the ν3 mode below and above the CO transition temperature. Concerning three ν3 modes at low temperature and in the CO state, the mutual exclusion rule does not apply to both IR and Raman spectra. This result is in agreement with the fact that the number of the ν27(ν2) in the IR (Raman) spectra is three. Let us discuss why the repeat unit is asymmetric from the viewpoint of the transfer integral and the nearest neighbor Coulomb repulsion. First we examine the transfer integral along the transverse direction. Along this direction, the relationship between the site charges and the magnitude of the transfer integral is [–●▬○=●–●▬○=●…], where “=”, “▬” and “–” denote the largest, the second largest and smallest transfer integrals. Two ionic molecules and one neutral-like molecule are designated as “●” and is “○”, respectively. Since “=” and “▬” are estimated to be 306 and 297 meV, respectively, these transfer integrals are close to each other. The “–” is estimated to be 158 meV. The repeat unit of [–●▬○=●–] can be regarded as a pseudo-symmetric trimer. The pseudo-symmetric structure is supported from the fact that the highest frequency mode is strong in the Raman spectra whereas it is weak in the IR spectra. Nevertheless, such a pseudo-symmetric structure is not consistent with the fact that the mutual exclusion rule is not applied to both IR and Raman spectra [64]. Next, we examine the nearest neighbor Coulomb repulsion along the stacking direction. In the same way as β″-(ET)3(ClO4)2 and β″-(ET)3(HSO4)2, the inter-molecular distance is defined as that between the centers of neighboring molecules. The distribution of the inter-molecular distance is [sLL′] (L < L′) below the transition temperature whereas the distribution above the transition temperature is [sLL]. The most stable and second stable distributions below the transition temperature are [s○L●L′●] and [s●L●L′○], respectively, and the distribution of [s●L○L′●] is unstable. It should be noted that the most stable and second stable distributions are asymmetric whereas the unstable distribution is pseudo-symmetric. Indeed, the most stable distribution obtained from the spectra is in agreement with the result of the X-ray structural analysis [17]. Therefore, the charge distribution is ascribed to the nearest Coulomb repulsion along the stacking direction. The CO state of β″-(ET)3(ReO4)2 is characterized as ND = 3 and NSD = 1.
Let us discuss the charge distribution in the high temperature phase. Figure 11 shows the temperature dependence of the ν27 mode. The number of ν27 modes above the transition temperature is two. The difference in the frequencies is small as compared with that between ionic and neutral-like molecules in the CO state. The Δρ at 300K is estimated to be ~0.2. The small but finite Δρ indicates that the site charges remains inhomogeneous but charges exhibit a dynamical fluctuation. As shown in Figure 10, two ν3 modes are Raman active and one ν3 mode is IR active. Contrary to the CO state, the mutual exclusion rule is applied exactly to both IR and Raman spectra. This observation indicates that not only the charge distributions but also the network of the transfer integral are symmetric, which leads to the symmetric 2D layer. The distribution of the inter-molecular distance along the stacking direction is [sLL]. The most stable distributions are [○s●L●L] and [●s○L●L], where “●” and “○” denote the ionic and neutral-like molecules, respectively. It should be noted that the energy level of [○s●L●L] is identical to that of [●s○L●L]. The unstable distribution is [●s●L○L]. NDand NSD take the conditions of ND =3 and NSD = 2, respectively. The dynamical fluctuation is ascribed to the frustration between two stable distributions. The time-averaged charge distribution is mainly composed of the most stable distributions rather than the unstable distribution, which is consistent with the peak separation in the ν27 mode. As for the ν3 modes, the mutual exclusion rule is applicable to both IR and Raman spectra. This observation is also interpreted from fluctuation because the fluctuation due to two asymmetric distributions produces the symmetric time-averaged distribution. From the viewpoint of charge distribution, CO transition is defined as the charge from NSD > 1 to NSD = 1.
Figure 10. Comparison between the IR and Raman spectra above and below the CO transition temperature. In both temperatures, the number of ν3 modes is three. The mutual exclusion rule is applicable (not applicable) to both IR and Raman spectra above (below) the transition temperature.
Crystals 02 00893 g010
Table 2. The number of all charge distributions, ND, the most stable distribution, NSD, and the allowed distribution, NAD, at low temperature. The CO state (metal) is defined as NSD = 1 (NSD = ND). Charge fluctuation occurs when the condition of 1 < NAD < ND. Δρ denotes the difference in the molecular charge between the ionic and neutral-like molecules at low temperature.
2/3-FilledM:HNDNSDNAD∆ρ
(ET)3(ClO4)23:2310.5
(ET)3(HSO4)23:2310.4
(ET)3(ReO4)23:231 a0.7
(ET)3Cl2·2H2O6:491(4) b0.25
3/4-FilledM:HNDNSDNAD∆ρ
(d8-ET)4Pt(CN)4·H2O c4:2610.6
(ET)4Ni(CN)4·H2O4:2610.3
(ET)4Pd(CN)4·H2O4:261(4) b0.3
(ET)4Pt(CN)4·H2O4:26(1) d(4) b0.15
(ET)4[(H3O)Ga(C2O4)3]PhNO24:2e 61<50.13
(ET)4[(H3O)Ga(C2O4)3]Pyridine4:2e6(1<) f5≤ f0.08
(ET)4[(H3O)Ga(C2O4)3]CH2Cl24:2e6(1<) f5≤ f0.05
(ET)2Cl(C2I2)2:1220.03
(ET)2Br(C2I2)2:1220.03
(ET)2AuBr22:122< 0.03 g
a NSD is discontinuously changing from 2 to 1 below 80 K. b NAD can be defined as under hydrostatic pressure. c All hydrogen atoms in the ethylene-dithio groups are substituted by deuterium. d The energy level of the two stable distributions are close to each other. e M (H) is different from the number of the molecules (the formal holes) in the crystallographic repeat unit in the 2D layer, those which are defined as 8 (4). f The energy levels of all distributions are close to one another. These compounds take the condition between a metal (ND = NSD) and a fluctuated state (1< NAD < ND). g The resolution of the spectrometer was set to 4 cm−1. The ν27 mode is observed as a single peak in this resolution. Therefore, ∆ρ is identical to or smaller than 0.03.
Figure 11. Temperature dependence of the ν27 modes in the IR-conductivity spectra of β″-(ET)3(ReO4)2. The conductivity spectra are obtained after Kramers-Kronig transformation of the IR-reflectance spectra. The polarization direction of the incident light is parallel to the inter-layer direction. The broken lines are a guide for the eyes. Offsets are applied to all the spectra, except for the spectra at 300 K.
Crystals 02 00893 g011
Through the experiments of the M:H = 3:2-salts, we have evidenced that the charge distribution in the ground state is ascribed to the nearest neighbor Coulomb repulsion. ND and NSD of the 3:2-salts as summarized in Table 2. In the next subsections, the distributions of the site charges in the M:H = 6:4-salt and the 3/4-filled salts are examined from the viewpoint of the inter-molecular distance along the stacking direction. In the same way as the 3:2-salts, the number of charge distributions, ND, NSD, etc., are important factors in order to understand the CO transition and the time-averaged charge distribution in the 6:4-salt and 3/4-filled salts.

4.2. 2/3-Filled and 6:4-Salt: β″-(ET)3Cl2·2H2O

Here we discuss the degree of charge fluctuation in β″-(ET)3Cl2·2H2O, where six molecules participate in the repeat unit [19]. The temperature dependence of the electrical resistivity under ambient pressure exhibits bad metallic behavior above 120 K and insulating behavior below 120 K [39]. An insulator-superconducting transition is observed under 1~1.6 GPa [39,40]. On increasing pressure further, the resistivity exhibits metallic behavior. The high pressure phase is inherently a metal phase because of the observation of quantum magnetic oscillation [40]. First, the molecular charges under ambient pressure are described. The molecular charges were previously estimated from x-ray structural analysis [45], which is roughly in agreement with the present result. In order to conduct quantitative discussions, vibrational spectroscopy is applied to the CO state of β″-(ET)3Cl2·2H2O. As shown in Figure 9, the number of ν2 modes in the low temperature phase is two, suggesting the CO state. From the frequency of the two ν2 modes, ρ of the ionic and neutral-like molecules are estimated to be 0.75 and 0.5, respectively. The difference in the site charges is estimated to be Δρ = 0.25, and the ratio between the ionic and neutral-like molecules is 2:1. As shown in Figure 8, unfortunately, an exact estimation of ρ of the neutral-like molecule cannot be conducted from the ν27 mode because the ν27 mode of the neutral-like molecule is overlapped by the ν3 mode. On the other hand, ρ of the ionic molecule is estimated from the frequency of the ν27 mode. The estimated ρ, 0.75, is in agreement with ρ estimated from the ν2 mode. The ν27 mode of the neutral-like molecule is observed in the Raman spectra shown in Figure 9. Since the frequency of the ν27 mode in the Raman spectra is ~1465 cm−1, ρ of the neutral-like molecule is estimated to be 0.5, which is also consistent with ρ estimated from the ν2 mode. The observation of the ν27 mode in the Raman spectra is ascribed to the fact that the number of neutral-like molecules in the repeat unit is two. As described above, the ν3 mode shown in Figure 8 is overlapped by the ν27 mode. Interestingly, the frequency of the ν3 mode in the IR spectra is almost identical to that in the Raman spectra. The observation of the ν3 mode in the IR spectra is also ascribed to the fact that the number of neutral-like molecules in the repeat unit is two. Therefore, the repeat unit consists of four ionic molecules and two neutral-like molecules, and ρ of each molecule are estimated to be 0.75and 0.5, respectively.
In the same way as for the 3:2-salts described above, the distribution of site charges is explained from the inter-molecular distance. A repeat unit is composed of two subunits. Each subunit consists of three molecules, which are arranged along the stacking direction. Two subunits are adjacent to each other along the transverse direction. The inter-molecular distance in one column is expressed as [sLL′] (s << L < L′), and that in the adjacent column is expressed as [L′Ls]. Hereafter, the configuration of the inter-molecular distances in a repeat unit is expressed as [sLL′]/[L′Ls]. The number of all charge distribution is ND = 9. The most stable distribution is [s○L●L′●]/[●L′●L○s]. The secondary stable distributions are [s●L●L′○]/[●L′●L○s] and [s○L●L′●]/[○L′●L●s]. The third stable distribution is [s●L●L′○]/[○L′●L●s]. Indeed, the most stable distribution is in agreement with the distribution obtained from x-ray structural analysis [45] and consistent with the behavior of the ν3 mode [19]. The CO state under the ambient pressure is attributed to NSD = 1.
Figure 12. Temperature dependence of the ν27 modes in the IR-conductivity spectra of β″-(ET)3Cl2·2H2O. The spectra are obtained after Kramers-Kronig transformation of the IR-reflectance spectra. The polarization direction of the incident light is parallel to the inter-layer direction. Offsets are applied to all the spectra, except for the spectra at 300 K.
Crystals 02 00893 g012
Figure 12 shows temperature dependence of the ν27 mode. The ν27 mode in the high temperature phase exhibits a broad line-width, suggesting that the site charges show dynamical fluctuation. The temperature dependence of the ν27 mode is continuous around the transition temperature. This behavior is consistent with that of β″-(ET)3(ClO4)2 but inconsistent with the discontinuous change in β″-(ET)3(ReO4)2. It should be noted that both β″-(ET)3Cl2·2H2O and β″-(ET)3(ClO4)2 take NSD = 1 in the whole temperature range whereas β″-(ET)3(ReO4)2 in the high temperature phase takes NSD = 2. The temperature dependence in β″-(ET)3Cl2·2H2O is explained with the following scenario. With increasing temperature above the CO transition temperature, the second, third stable distributions, etc., participate in time-averaged charge distribution. As far as NSD = 1, the most stable distribution has the largest contribution to the time-averaged distribution. Therefore, the continuous temperature dependence is ascribed to the fact that the energy levels do not show any remarkable change in the whole temperature range. Hereafter, the number of allowed charge distributions is defined as NAD. NSD, NAD and ND have the relationship of NSDNADND. When ionic molecules can not be neighbored with a short distance, the number of the allowed distribution is NAD = 4. The time-averaged distribution in the repeat unit is expressed by using the allowed distributions; a × ([s○L●L′●]/[●L′●L○s]) + b × ([s●L●L′○]/[●L′●L○s] + [s○L●L′●]/[○L′●L●s])+ c × ([s●L●L′○]/[○L′●L●s]) (1 > a > b > c > 0, a + b + c ≤ 1). With increasing temperature, b and c are close to a. As a result, the time-averaged distribution becomes [s○L●L′○]/[○L′●L○s] (○ < ●). Let us examine the time-averaged distribution from the viewpoint of the ν27 mode. The frequency of the ν27 mode of the ionic molecule is almost unchanged in the whole temperature range whereas the frequency of the neutral-like molecule shows a decrease with increasing temperature. This observation leads to the fact that the ratio between the ionic and neutral-like molecules is 1:2, which is consistent with the time-averaged distribution shown above. Therefore, the charge distribution in both CO and charge fluctuated states can be explained from the standpoint of the energy levels in the charge distributions.
Figure 13. Pressure dependence of the ν2 modes in the Raman spectra of β″-(ET)3Cl2·H2O at 10 K. The broken lines are a guide for the eyes.
Crystals 02 00893 g013
It is interesting to examine the degree of charge fluctuation in the pressure region where the electrical resistivity exhibits the SC transition. Figure 13 shows the pressure dependence of the two ν2 modes at low temperature. The difference in the frequencies decreases under pressure, which means that Δρ decreases with increasing pressure. Interestingly, Δρ at 1.3 GPa, where the electrical resistivity exhibits the insulator-SC transition, is small but finite, ~0.09. This observation indicates that the charge fluctuation survives around the phase boundary between insulator and superconducting phases. On increasing the pressure further, Δρ becomes smaller. At 2.0 GPa, where the electrical resistivity exhibits metallic behavior, Δρ is estimated to be ~0.03. Very small Δρ means that the time-averaged molecular charges at all sites are identical to one another. This condition gives the homogeneous charge distribution. Therefore, the metallic state is expressed as 1 < NSD = ND. The pressure dependence of β″-(ET)3Cl2·2H2O is interpreted as the change from 1 =NSD < ND, 1 < NAD < ND to 1 < NSD = ND. These conditions correspond to the insulator (=CO), bad metal (=charge fluctuation) and metal (homogeneous and delocalized charges), respectively. The superconducting phase is characterized as the condition of 1 < NAD < ND. The relationship between Δρ and conducting behavior is also observed in the 4:2–salts, which are described in the next section.

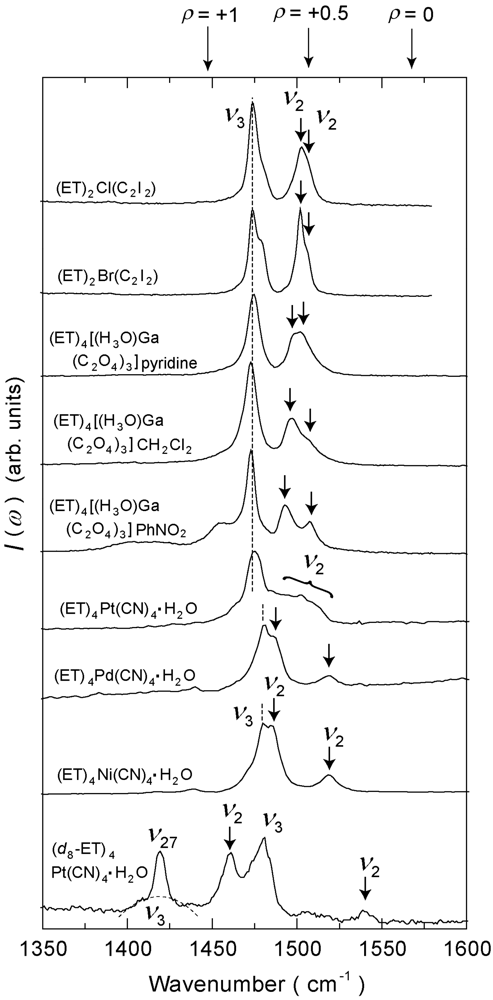
4.3. 3/4-Filled and 2:1-Salts

β″-(ET)2AuBr2, β″-(ET)2Cl(C2I2) and β″-(ET)2Br(C2I2) belong to M:H = 2:1-salts. The electrical resistivity of these salts exhibit metallic behavior down to liquid helium temperature [33,47]. The ν27 and ν2 modes of several 3/4-filled salts are shown in Figure 14 and Figure 15, respectively. As shown in Figure 14, the ν27 mode of β″-(ET)2AuBr2exhibits a single peak. The IR-conductivity spectrum exhibits metallic behavior even at room temperature [65]. The frequency of the ν27 mode of β″-(ET)2AuBr2 is almost identical to that at ρ = 0.5. No remarkable change was noted suggesting the phase transition was observed in the temperature dependence of the IR spectra [16]. These experimental results lead to the view that the number of the molecules in the repeat unit is two in the whole temperature range and the holes are delocalized in the 2D layer. As far as there is no remarkable change in the crystal structure, the configuration of the inter-molecular distances remains [sL] (s << L). Because the energy levels between [s○L●] and [s●L○] are identical to each other, the relationship of NSD = ND = 2 is established. In other words, β″-(ET)2AuBr2 satisfies the condition of a metal, 1 < NSD = ND.
Figure 14. The ν27 modes of some 3/4-filled salts at low temperature. The frequencies at ρ = 0, +0.5 and +1 are denoted by the arrows on the top of the panel.
Crystals 02 00893 g014
We have also examined the charge sensitive mode of β″-(ET)2Cl(C2I2) and β″-(ET)2Br(C2I2). As shown in Figure 15, the number of ν2 modes is two. However, Δρ estimated from the ν2 modes, 0.03, is very small and comparable to that of β″-(ET)3Cl2·2H2O in the high pressure region. Furthermore, any remarkable change in the ν3 mode was not observed in the whole temperature range below 300 K. In the same way as β″-(ET)2AuBr2, the condition of 1 < NSD = ND( = 2) remains from room temperature down to low temperature. Therefore, our observations confirm that the metallic state of the β″-type ET salts is defined as 1 < NSD = ND. This condition is in agreement with that of β″-(ET)3Cl2·2H2O in the pressure-induced metal state.
Figure 15. The ν2 modes of some 3/4-filled salts at 10 K. The frequencies at ρ = 0, +0.5 and +1 are denoted by the arrows on the top of the panel. The incident light is polarized along the inter-layer direction, except for β″-(d8-ET)4Pt(CN)4·H2O.
Crystals 02 00893 g015

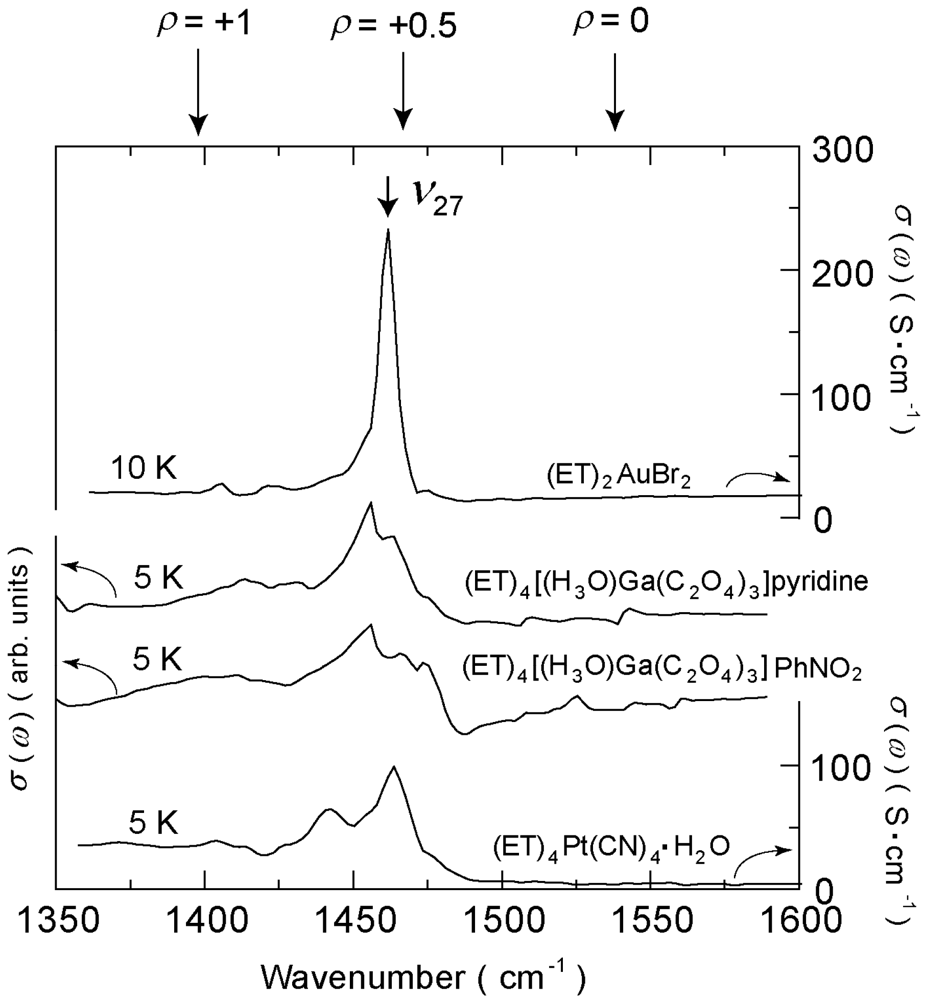
4.4. 3/4-Filled and 4:2-Salts

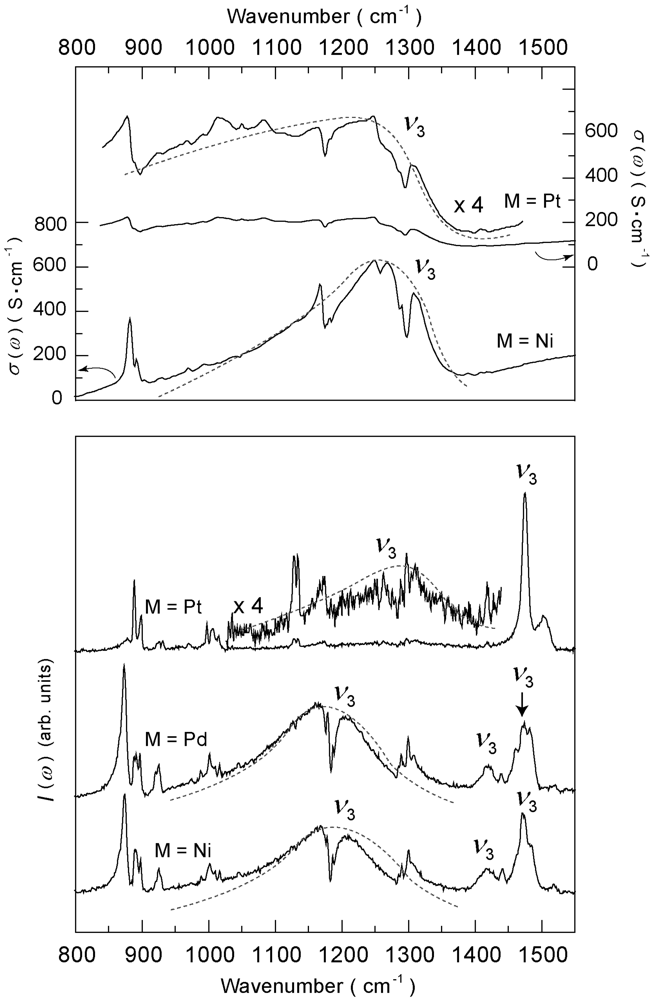
4.4.1. β″-(ET)4M(CN)4·H2O [M = Ni, Pd, Pt]

The temperature dependence of electrical resistivity in this group exhibits bad-metallic behavior and shows insulating behavior at low temperature [5,38]. An insulator-superconducting (I-SC) transition is observed in the electrical resistivity of M = Pd and Pt under hydrostatic pressure. According to x-ray structural analysis at room temperature, the configuration of the inter-molecular distance is thought to be symmetric, [sLsL′] (s << L< L′) [5,38]. The inter-molecular distances along the stacking direction is increased with increasing size of M, suggesting reduction of nearest neighbor Coulomb repulsion. In this section, we discuss the molecular charge in this material group on the basis of the results of vibrational spectroscopy under ambient pressure.
First, let us discuss the molecular charges of M = Ni and Pd. As shown in Figure 15, the ν2 mode of M = Ni and Pd exhibits peak separation, suggesting the CO state. It is unclear exactly whether or not avoided crossing has occurred between the ν2 and ν3 modes of M = Ni and Pd. Hereafter, the estimation of the molecular charge is conducted under the assumption that there is no avoided crossing. This assumption is supported from the fact that the frequency of the highest frequency ν3 mode is close to that of the ν2 mode of the ionic molecule. Owing to the closeness in the frequencies, one may mistake ν2 for ν3. Such an incorrect assignment does not have a serious influence on the estimation of the molecular charge for the following reasons, because the error of the molecular charge due to the incorrect assignment is negligibly small. In addition to this, the molecular charge at the ionic molecule can be estimated from the frequency of the ν2 mode at the neutral-like molecule and from the chemical composition. In both cases, Δρ is estimated to be 0.3. This value is a little larger than Δρ of β″-(ET)3Cl2·2H2O but smaller than Δρ in the “Horizontal CO state” of the θ−type ET salts, 0.7~0.8 [27,58,59]. In the same way as β″-(ET)3Cl2·2H2O, Δρ of M = Ni and Pd indicates that the energy level of the most stable distribution is not so far away from that of another distribution.
In Figure 16, the IR and Raman spectra of M = Ni salt at low temperature are compared with each other. The ν3 mode, which is significantly perturbed by the e-mv interaction, is observed in the IR spectra in the whole temperature range below room temperature [19]. On the other hand, the corresponding mode in the Raman spectra is not observed at room temperature although this mode is observed at low temperature [19]. Therefore, the mutual exclusion rule is not applicable to both IR and Raman spectra in the CO state. This observation indicates that the distribution of the molecular charges as well as the configuration of the inter-molecular distance is asymmetric in the CO state. Because the Raman spectra of M = Pd resembles that of M = Ni, the charge distribution in the CO state of M = Pd is also asymmetric. In this material group, the number of all charge distributions is ND = 6. If the repeat unit is symmetric, two distributions are stable: [s●L○s●L′○] and [s○L●s○L′●]. The number of both second and third stable distributions is one; [s○L○s●L′●] and [s●L●s○L′○], respectively. The distributions of [s●L○s○L′●] and [s○L●s●L○′] are unstable. However, the repeat unit is asymmetric in the low temperature phase. Owing to the asymmetric structure, one of the two stable distributions is the more stable than the other, which corresponds to the condition of the CO state, NSD = 1.
The intensity of the significantly perturbed ν3 mode in the Raman spectra decreases with increasing temperature [19]. In addition to this, the ν2 mode does not exhibit any discontinuous change in the whole temperature range below room temperature [19]. As discussed in the previous section, the continuous temperature dependence indicates the condition of NSD < NAD rather than the discontinuous change from NSD = 1 to 1 < NSD. The charge distribution in the CO state undergoes time-averaged distribution with increasing temperature. With increasing temperature, the difference in the energy levels of two stable distributions is negligible. However, this scenario corresponds to the change from NSD = 1 to 1 < NSD. In order to satisfy the condition of NSD < NAD, it is required that the time-averaged distribution consists of the second and third stable distributions as well as the two and most stable distributions. The symmetric structure obtained from x-ray structural analysis at 300 K is interpreted as the time-averaged structure. Because the significantly perturbed ν3 mode in the Raman spectra is weak at high temperature, the mutual exclusion rule is applicable to both IR and Raman spectra in the high temperature phase [19]. This phenomenon is also ascribed to symmetric time-averaged distribution. Therefore, the bad metallic state of M = Ni and Pd is attributed to the condition of NSD < NAD. The significantly perturbed ν3 mode shows remarkable temperature dependence, which is explained from the fact that the energy levels are not so far away from one another. This conclusion is also supported by the fact that Δρ of M = Ni and Pd is not so large. The closeness in the energy levels indicates that this material group is sensitive to chemical pressure and physical pressure.
Figure 16. (top panel) The IR-conductivity spectra of (ET)4M(CN)4·H2O [M=Pt and Ni], obtained from reflectance spectra at 8 K. The incident lights are irradiated onto the 2D layer, andthe polarization directions are parallel to the stacking direction. (bottom panel) Raman spectra of (ET)4M(CN)4·H2O [M=Pt, Pd and Ni]. The laser energies are 780 nm and the sample temperatures are 20 K. The incident light is also irradiated onto the 2D layer. As for M=Ni and Pd, significantly perturbed ν3 modesare also observed in the spectra obtained with the 633 nm laser.
Crystals 02 00893 g016
The behavior in the C=C stretching modes of β″-(ET)4Pt(CN)4·H2O at low temperature is different from that of M = Ni and Pd. The ν2 mode in Figure 15 exhibits a fused line-shape [66]. In order to estimate Δρ more exactly, we observed the ν27 mode. As shown in Figure 14, the ν27 mode exhibits peak separation and Δρ is estimated to be ~0.15, which is smaller than that of M = Ni and Pd, ~0.3. The small but finite Δρ indicates that the charge fluctuation remains even at low temperature. The robustness of the charge fluctuation at low temperature is supported by the behavior in the ν3 mode. As shown in Figure 16, the intensities of the significantly perturbed ν3 mode in both IR and Raman spectra are weak compared with those of M = Ni and Pd. The spectra in the low temperature phase of M = Pt resemble those of M = Pd and Ni in the high temperature phase. The weak intensity indicates that the static charge distribution is suppressed whereas the large intensity in the low temperature phase of M = Ni and Pd is characterized by the static CO state. Therefore, M = Pt salt at low temperature is close to the condition at high temperature, NSD < NAD. As far as the fact that the significantly perturbed ν3 mode is still observed in the Raman spectra, however, a more detailed discussion would be needed in order to understand the energy levels at low temperature. This is described in the next paragraph.
The suppression of static distributions and the enhancement of charge fluctuation in the M = Pt salt are explained from the viewpoint of inter-molecular distance. Since the inter-molecular distance along the stacking direction of M = Pt is larger than those of M = Ni and Pd, the magnitude of the nearest neighbor Coulomb repulsion, V, is small among this material group. Owing to the reduction of V, the energy levels of the second and third stable distributions become close to those of two stable distributions. Therefore, the static charge distribution is suppressed and the charge fluctuation remains even at low temperature. Because the significantly perturbed ν3 mode is weak, the low temperature state takes an intermediate condition between 1 = NSD(<ND) and 1 < NAD < ND. The latter condition is consistent with that of β″-(ET)3Cl2·2H2O at ~1.3 GPa, where the electrical resistivity exhibits an insulator-superconducting transition. Indeed, M = Pt is also a pressure-induced superconductor, and the pressure required for the superconducting transition is lower than that of the M=Pd salt. On the basis of the experimental results of M = Pt and β″-(ET)3Cl2·2H2O, we conclude that the low temperature phase neighbored with the superconducting phase is characterized as the condition of 1 < NAD < ND.

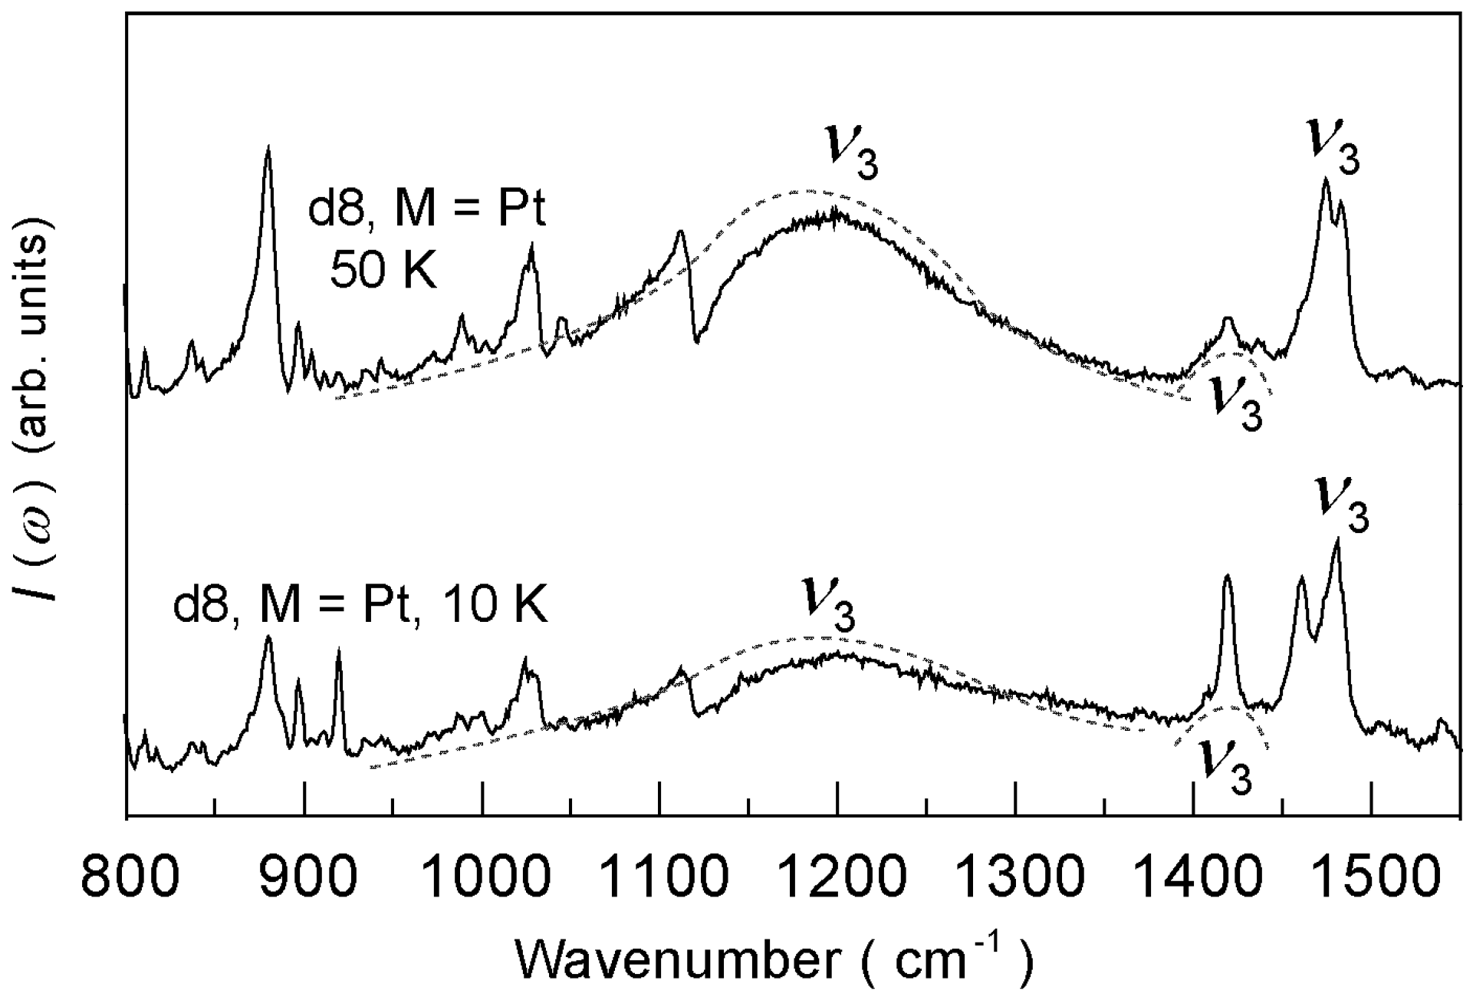
4.4.2. Deuterium Effect on the Molecular Charges in β″-(ET)4Pt(CN)4·H2O

The Raman spectra of the deuterium analogue of M = Pt is shown in Figure 17. Deuterium substitution is applied to all hydrogen atoms in the ethylene-dithio groups. The behavior of the C=C stretching modes at 50 K is almost identical to those of M = Ni and Pd rather than those of M = Pt. Interestingly, not only the frequencies of the ν2 and ν3 modes but also the intensities of the ν3 modes are almost exactly identical to those of M = Ni and Pd. The number of the stable distribution is NSD = 1. This isotope effect is comparable to the decrease in the inter-molecular distance along the stacking direction because the inter-molecular distances of M=Ni and Pd are shorter than that of the naturally abundant M = Pt. It is noteworthy to compare the isotope effect of κ-(ET)2Cu[N(CN)2]Br and the present result. In the phase diagram of the κ-type ET salts, κ-(ET)2Cu[N(CN)2]Br is located around the boundary between insulator and superconductor phases [67,68]. The physical properties of the deuterium compound are close to those of κ-(ET)2Cu[N(CN)2]Cl. It should be noted that the intra-dimer distance of κ-(ET)2Cu[N(CN)2]Cl is shorter than that of the naturally abundant κ-(ET)2Cu[N(CN)2]Br. These isotope effects indicate that the anisotropic decrease in the inter-molecular distance is induced by the deuterium substitution. Since CH2-related vibrational modes are anisotropic, the reduction of the effective molecular volume is expected to be anisotropic [69]. The decrease in the frequencies of C-H stretching modes contributes to the decrease in the effective molecular length along the molecular long axis. However, the contraction along the inter-layer direction, compared with the contraction within the 2D layer, has little contribution to the degree of charge fluctuation. The decreases in the frequencies of C-H stretching modes, CH2-bending modes, CH2-rocking modes, etc. have large contributions to the contraction of the effective molecular space perpendicular to the molecular plane. In the β″-ET salt, the anisotropic contraction of the effective molecular space induces the effective contraction of the inter-molecular distance along the stacking direction as compared with those along the transverse and diagonal direction. The anisotropic and effective decrease in the inter-molecular distance leads to the enhancement of the nearest neighbor Coulomb repulsion along the stacking direction, which contributes to the CO state. As for κ-(ET)2Cu[N(CN)2]Br, the anisotropic contraction of the effective molecular space induces the effective contraction of the intra-dimer distance rather than that of the inter-dimer distance. The effective contraction of the intra-dimer distance enhances the inter-molecular interaction within a dimer rather than that between dimers. The enhancement of the intra-dimer interaction contributes to the increase in the effective on-site Coulomb repulsion at a dimer. This scenario is consistent with the isotope effect on κ-(ET)2Cu[N(CN)2]Br and in agreement with the phase diagram of the κ-type ET salt [69]. Therefore, the deuterium effect can be interpreted from the viewpoint of the effective contraction of the molecular space perpendicular to the molecular plane. This interpretation is supported from the c-axis contraction in the partial deuterium analogue of (Me2-DCNQI)2Cu [70].
Figure 17. Raman spectra in the CO state of the deuterium analogue of (ET)4Pt(CN)4·H2O. The incident light is irradiated onto the 2D layer. The spectra at 10 K is also shown in Figure 15. The laser energy is 780 nm.
Crystals 02 00893 g017
As shown in Figure 17, the Raman spectrum at 10 K is different from that at 50 K. The prominent peak is overlapped with one of the ν3 mode at ~ 1420 cm−1. In order to examine the vibrational mode in detail, the enlarged spectrum is shown in Figure 15. Note that the experimental configuration of the deuterium analogue is different from the other spectra shown in Figure 15. The incident light for the other spectra is irradiated onto the edge of the crystal, whereas the incident light in the present spectrum is irradiated onto the 2D layer. The difference in the frequencies between the two ν2 modes is larger than those of M = Ni and Pd. From the frequencies of the two ν2 modes, ρ for ionic and neutral-like molecules are estimated to be 0.8 and 0.2, respectively, and Δρ is estimated to be 0.6, which is also shown in Table 2. It is reasonable that the prominent peak, overlapped with the ν3 mode at ~1420 cm1, can be assigned to the ν27 mode of the ionic molecule, because the peak position corresponds to the frequency of the ν27 mode at ρ = 0.8. Δρ of the present compound at 10 K is larger than not only Δρ of the natural abundant of M = Pt but also Δρ of M = Ni. This result indicates that the magnitude of V in the deuterium analogue of M = Pt is the largest of all for β″-(ET)4M(CN)4·H2O shown in Table 2. Nevertheless, there is no remarkable change in the ν3 modes between 50 K and 10 K, suggesting that the distribution of the site charge at 10 K is almost identical to that at 50 K. It is reasonable that any redistribution in site charges cannot be induced by the enhancement of V solely because the most stable distribution becomes more stable with an increase in V. The same behavior is also observed in some θ-type ET salts: Δρ of θ-(ET)2RbZn(SCN)4, θ-(ET)2TlZn(SCN)4 and θ-(ET)2Cu[N(CN)2]CN are more or less different from one another although the charge distributions of all compounds remain as “Horizontal” structures [27,58,59].

4.4.3. β″-(ET)4[Ga(ox)3H3O]X [ox = Oxalate Anion, X = PhNO2, CH2Cl2, Pyridine]

This material group is suitable for examining the degree of charge fluctuation around the boundaries among the insulator, superconducting and metal phases [19]. The temperature dependence of the electrical resistivity of X= PhNO2 is categorized as bad-metallic behavior. The temperature dependence shows a metallic behavior down to ~150 K but exhibits insulating behavior below 150 K [35]. The insulator-superconducting transition is observed at ~7.5 K at ambient pressure [35]. The resistivity around 10 K is 10 times as much as that of the resistivity minimum at ~150 K [35]. On the other hand, the electrical resistivity of X = pyridine and CH2Cl2 do not exhibit SC transition at ambient pressure [35,46]. Although the resistivity minimum is observed around 150 and 100 K, respectively, no remarkable change in the temperature dependence of the resistivity is observed down to liquid helium temperature [35,46]. The magnetic quantum oscillations of X = pyridine and X = PhNO2are observed [30,31]. Although the Fermi pocket of X= PhNO2 is very small under ambient pressure, the area of the Fermi pocket increases with increasing hydrostatic pressure [30]. X = pyridine is inherently metal and X = CH2Cl2 is thought to be metal. X = PhNO2is close to the boundary between the insulator, SC and metal phases.
The ν27 modes in the IR reflectance spectra of X = PhNO2 and X = pyridine are shown in Figure 14. Because of the small area of the crystal edge, the absolute reflectivity was not obtained. When the signal from the crystal is very weak, the saw-toothed structure due to H2O on the KBr disk is observed over the wide range of the spectral region in Figure 14. When the intensity of the H2O-related modes is comparable to that of the ν27 mode, the exact peak position of the ν27 modes could not be determined from the reflectance spectra. Because the intensity of the H2O-related modes in the region of 1500–1550 cm−1 is very weak, the contribution from the H2O-related modes around 1460 cm1 is also expected to be small. Therefore, the main components of the peak-like structures around 1460 cm−1are ν27 modes. The peak-like structure of X = PhNO2is broad as compared to that of X = pyridine. This difference suggests that X = pyridine is characterized as being more delocalized nature when compared with X = PhNO2. In order to evaluate this difference quantitatively, Δρ is estimated from the frequencies of the ν2 mode. The ν2 modes of X=PhNO2, CH2Cl2 and pyridine are shown in Figure 15. Δρ are estimated to be 0.13, 0.08 and 0.05, respectively. As for X = PhNO2, Δρ~0.13 is a little smaller than that of β″-(ET)4Pt(CN)4·H2O and comparable to that of β″-(ET)3Cl2·2H2O at 1.3 GPa. Δρ of X = CH2Cl2 and X = pyridine are smaller than Δρ of X = PhNO2. This observation leads to the fact that Δρ of the superconductor is larger than Δρ of the metal. This result is in agreement with the pressure dependence of Δρ in β″-(ET)3Cl2·2H2O.
Prior to discussing the ν3 mode, the crystal structure of this material group is described. According to X-ray structural analysis, a unit cell consists of sixteen ET molecules. Eight molecules belong to one 2D layer and the other eight molecules to another 2D layer. Each 2D layer is separated by an anion layer. Strictly, the number of molecules in a repeat unit of a 2D layer is eight. From the viewpoint of the network of the transfer integrals and the inter-molecular distances, however, the repeat unit in the 2D layer consists of four molecules rather than eight molecules. The anion layer is composed of oxalate complexes, oxonium ions and solvent molecules. The inter-molecular interactions in the 2D layer more or less depend on the size of the solvent molecule in an anion layer, X. Indeed, the averaged transfer integrals along the transverse and stacking directions of X = PhNO2are larger than those of X = pyridine, respectively [35].
Since the number of molecules in the repeat unit is four, the total number of ν3 modes is four. However, only two ν3 modes are observed in the IR and Raman spectra; one is the highest frequency mode in the Raman spectra, the other is the IR active mode [19]. The IR active mode corresponds to the most perturbed mode in the IR spectra of β″-(ET)4M(CN)4·H2O. As discussed in the previous section, the most perturbed mode in a group of β″-(ET)4M(CN)4·H2O is observed in both IR and Raman spectra because the charge distribution is asymmetric [19]. Owing to fluctuation, the most perturbed mode in the Raman spectra of M = Pt is weak compared with those of M = Ni and Pd [19]. The absence of the most perturbed mode in the Raman spectra of β″-(ET)4[Ga(ox)3H3O]X indicates that dynamical fluctuation is more enhanced compared with the fluctuation in β″-(ET)4Pt(CN)4·H2O [19]. Since the mutual exclusion rule is almost applicable to both IR and Raman spectra, the time-averaged charge distribution is symmetric. The behavior of the ν3 modes is in agreement with the fact that Δρ of this material group is smaller than Δρ of β″-(ET)4M(CN)4·H2O.
Let us examine the degree of charge fluctuation from the viewpoint of the inter-molecular distance. The configuration of the inter-molecular distance is expressed as [sLL′L] (s << L < L′). The difference between β″-(ET)4[Ga(ox)3H3O]X and β″-(ET)4M(CN)4·H2O lies in the number of the long inter-molecular distances: the former is three, the latter is two. Let us assume that there is no change in the inter-molecular distance from room temperature down to liquid helium temperature. This assumption is supported from X-ray structural analysis as well as no remarkable change in the vibrational spectra [19,35]. The number of all charge distribution is ND = 6; the most stable distributions: [s○L●L′○L●] and [s●L○L′●L○], the second stable distribution: [s○L●L′●L○], the third stable distributions: [s●L●L′○L○] and [s○L○L′●L●], and the unstable distribution: [s●L○L′○L●]. These energy levels give the condition of NSD = 2 and NAD = 5. The dynamical fluctuation under this condition leads to the symmetric distribution. Indeed, the behavior of the ν3 modes supports the fact that the time-averaged charge distribution is symmetric or close to symmetric. The more fluctuated behavior in β″-(ET)4[Ga(ox)3H3O]X than β″-(ET)4M(CN)4·H2O is attributed to the fact that NSD and NAD of β″-(ET)4[Ga(ox)3H3O]X are larger than those of β″-(ET)4M(CN)4·H2O. Therefore, the present material group satisfies the condition of the charge fluctuation, 1 < NAD < ND.
As described above, the transfer integrals of X = pyridine is larger than those of X = PhNO2. On increasing the transfer integral, the energy levels of the different charge distributions are close to one another. An increase in the transfer integrals leads to the view that NSD, NAD and ND are almost identical to one another. Because of the closeness in the energy levels, the time-averaged charge distribution becomes homogeneous. Indeed, Δρ of X = CH2Cl2 and X = pyridine is smaller than those of X = PhNO2 and β″-(ET)4Pt(CN)4·H2O. Nevertheless, Δρ of X= CH2Cl2 and X = pyridine are larger than those of β″-(ET)2AuBr2, β″-(ET)2Cl(C2I2) and β″-(ET)2Br(C2I2). These results suggest that X= CH2Cl2 and X = pyridine take up an intermediate condition between 1< NAD< ND and 1< NSD = ND.

5. Phase Diagram and Degree of Charge Fluctuation in Other β″-Type ET Salts

In the last part of this review, the experimental results are summarized by using a schematic phase diagram as shown in Figure 18 [19]. The vertical and transverse axes denote the temperature and Δρ, respectively. Δρ is decreases from left to right. Δρ decreases with increasing transfer integral or hydrostatic pressure whereas Δρ increases with an enhancement of the nearest neighbor Coulomb repulsion. The left bottom side corresponds to the localized and CO phase. The right bottom side corresponds to the delocalized state which is inherently a metal phase. Most of the area in the high temperature region is bad-metallic state, which is different from the metal phase. In the bad-metallic state, molecular charges are inhomogeneous and not fully localized. With decreasing temperature, the area of the bad-metal in the phase diagram is reduced. As for the region of large Δρ (very small Δρ), the bad-metal area takes the place of the area of the CO phase (metal phase). In the bottom area around Δρ~0.1, charge fluctuation remains at low temperature. The value of Δρ~0.1 is reasonable because the difference in the frequencies in the charge sensitive mode, ~10 cm−1, corresponds to a temperature of ~10 K. From the viewpoint of the number of charge distributions, the localization in the CO phase (the delocalization in the metal phase) is expressed as 1 = NSD (1 < NSD = ND). These are inherently ground states. When the condition of 1 < NAD < ND remains at low temperature, charge fluctuation is realized at low temperature. Our observation indicates that the charge fluctuated state is replaced by the superconducting state as an inherent ground state.
Let us discuss the difference between 1 < NAD < ND and 1 < NSD = ND and the difference between 1 = NSD and 1 < NAD < ND. In the condition of 1 < NAD < ND, the allowed charge distributions (unstable distributions) contribute (do not contribute) to the time-averaged distribution. When the energy level of the unstable distribution approaches those of the allowed distributions, the condition of 1 < NAD < ND is changed to 1 < NSD = ND. This change requires the increase or decrease in the inter-molecular distance in order to enhance t or reduce V. However, such change does not require any remarkable change in the crystal structure. Therefore, the change from 1 < NAD < ND to 1 < NSD = ND is continuous in principle. Indeed, the continuous change is confirmed by comparison of the vibrational spectra in a group of β″-(ET)4[Ga(ox)3H3O]X. On the other hand, the change from 1 = NSD to 1 < NAD < ND requires a remarkable change in the symmetry of the repeat unit (or subunit). In this sense, there is a specific phase boundary between the CO state and the SC (or charge fluctuated) states. The remarkable change in the crystal symmetry is confirmed by the comparison between the vibrational spectra of β″-(ET)4Ni(CN)4·H2O, β″-(ET)4Pt(CN)4·H2O and β″-(ET)4[Ga(ox)3H3O]PhNO2. These observations indicate a critical point between the CO phase and the SC (or charge fluctuated) phase. In order to clarify the phase boundary, it is necessary to examine why the charge sensitive mode of M = Pt exhibits a broad line-width [66]. Therefore, the phase transition from 1 = NSD to 1 < NAD < ND is more or less discontinuous whereas the change from 1 < NAD < ND to 1 < NSD = ND is continuous.
Figure 18. Schematic phase diagram of the β″-type ET salts. The vertical axisdenotes the temperature, T. The transverse axis is the difference in the molecular charge between the ionic and neutral-like sites, Δρ. Δρ is estimated from vibrational spectroscopy. Superconducting phase is designated as “SC”. The relationships among NSD, NAD and ND at low temperature are shown just above the phase diagram. At the top of this panel, some compounds discussed in this review are shown.
Crystals 02 00893 g018
It is interesting to examine the conducting property when the number of energy levels in the charge distribution is two and NSD = 1. In such a case, the condition of NSD = 1 is almost directly changed into 1 < NSD = ND with increasing t or decreasing V. This prediction is based on the fact that the condition of 1 < NAD < ND is barely allowed because the number of energy levels changed from 2 to 1 with increasing t or decreasing V. According to the temperature dependence of the electrical resistivity in β″-(ET)3(ClO4)2 under hydrostatic pressure, insulating behavior is changed into metallic behavior, and the SC transition is barely observed [71]. This compound takes 1 = NSD and ND = 3 at ambient pressure. Since the energy levels of the two unstable distributions are identical to each other, the number of the energy levels is two. As far as the repeat unit remains symmetric under hydrostatic pressure, the condition in the CO state, 1 = NSD, is directly transformed into the condition of a metal 1 < NSD = ND(=3). This experimental result also supports the fact that the SC transition of the β″-type ET salts requires the condition of charge fluctuation, 1 < NAD < ND.
Here we will give a brief comment on β″-(ET)2(SF5CH2CF2SO3), which is the other ambient pressure superconductor studied by other groups [34]. Inhomogeneous charge distribution is evidenced from x-ray structural analysis and vibrational spectroscopy [72,73]. Although the chemical composition is 2:1, the ratio between molecule and holes in the repeat unit is M:H = 4:2. The configuration of the inter-molecular distance in one column takes [sL] and the configuration in the neighboring column is [s′L′]. The configuration in the repeat unit is expressed as [sL]/[s′L′]. In this configuration, the number of all (stable) charge distributions is ND = 6 (NSD = 2) and the number of the second (third) stable distribution is 1. Therefore, the conditions of 1< NAD < ND is realized. β-(ET)2(ReO4) is the pressure induced superconductor, which was reported about 30 years ago [6]. Because this compound does not belong to M:H = 2:1 but to M:H = 4:2, the same scenario as β″-(ET)4Pt(CN)4·H2O is expected to be applied to the insulator-superconductor transition under pressure. Recently, our group have started to study the vibrational spectra of β-(ET)2(ReO4). The charge sensitive ν2 mode exhibits peak separation. The frequency of the ν2 mode at the ionic molecule is ~1526 cm-1, which corresponds to ρ ~ 0.4. The peak separations in the charge sensitive mode suggest the CO state is observed under ambient pressure [74]. From the viewpoint of the energy level in the charge distribution, for the configuration of the inter-molecular distance of Group “(b2)” it is advantageous to realize the condition of 1 < NAD < ND. Indeed, new ambient pressure superconductors reported in reference [37] satisfy the above concept. Therefore, it is of considerable importance to synthesize molecular conductors of large NAD.
The insulator-superconductor transition under hydrostatic pressure for β−(meso-DMBEDT-TTF)2PF6 has also been studied from the viewpoint of the charge fluctuation [75,76]. Although the time-averaged charge distribution around the SC phase has not been confirmed, the charge distribution in the CO state has been obtained. The inter-molecular distance between the ionic and neutral-like molecules along the stacking direction is the shortest, and the inter-molecular distance between the ionic and neutral-like molecules along the transverse direction is also short [77]. We can surmise that the charge distribution is ascribed to the nearest neighbor Coulomb interaction solely in the same way as for the β″-type ET salts. However, the transfer integral at the shortest inter-molecular distance is the largest; in other words, the 2D layer consists of a “dimer” [77]. This structural property is significantly different from the transfer integral network in the β″-type ET salts. Furthermore, the transfer integral along the transverse direction above is described as non-negligibly large [77]. These structural properties do not satisfy the requirement of “(a1)” in section 2. In order to examine the time-averaged distribution under hydrostatic pressure, bond alternation as well as the nearest neighbor Coulomb interaction, V, should be taken into consideration. Nevertheless, a β−type molecular conductor can be regarded as one of the good model compounds bridging the SC transitions between β″- and κ-type ET salts because the 2D structure is intermediate between these groups. Interestingly, the charge sensitive mode under pressure does not show the doublet but the broad peak, and the frequency of the peak center is identical to that at ρ = 0.5 [75]. This behavior is consistent with those of the κ-type ET salts rather than the behavior in the charge sensitive mode of the β″-type ET salts [78]. The observation of the broad peak indicates competition in charge distributions required between bond alternation and nearest neighbor Coulomb interaction. The author believes that it is an important task to obtain a relationship between ND, NAD and NSD based on detailed analysis of both V and the bond alternation in the dimer system. For this purpose, it is necessary to use the model compound whose V and transfer integrals around the SC phase can be analyzed experimentally. Unfortunately, the doublet of the charge sensitive mode at ambient pressure does not continuously changed into the broad peak at ρ = 0.5. This result indicates that the time-averaged distribution is significantly different from the distribution in the CO state. Prior to discussing the charge fluctuation in the β- and κ-type molecular conductors, it is necessary to use the model compound whose relationship between V and the bond alternation around the SC phase has been confirmed. As described in “(a1)” in Section 2, a group of [Pd(dmit)2] salts is one of the candidates for the model compound.
The CO state of β″-(DODHT)2PF6 undergoes SC state under high pressure (13.2 kbar) [79]. However, it should be noted that this compound has never belonged to the β″-type structure. As shown in Figure 1 in reference [79], the stacking direction is not perpendicular to the transverse direction, the transfer integral along the transverse direction is comparable to one of diagonal direction, etc. Such a transfer integral network is identical to those of the θ-type and α-type structures. The difference between the θ-type and α-type structures and this compound merely lies in whether or not the 2D layer is of a herringbone structure. Therefore, it is worth nothing that the results of β″-(DODHT)2PF6 are comparable with those of the β″-ET salts from the viewpoint of charge distribution. The charge distribution should be discussed from the viewpoint of the CO state in the θ-type and α-type salts. As for the θ-type ET salts, several kinds of charge distribution have been proposed; diagonal stripe, horizontal pattern, vertical stripe, etc. [80,81,82,83]. The charge distribution at ambient pressure is shown in reference [84]. The charge distribution of β″-(DODHT)2PF6 can be regarded as diagonal stripe, which is consistent with that of monoclinic θ-(ET)2TlZ(SCN)4 [59]. In both compounds, the bond alternation has occurred along the diagonal direction. This observation indicates that not only the nearest neighbor Coulomb interaction along the stacking direction but also bond alternation along the diagonal direction plays a non-negligible role in the charge distribution [10,11,83,85]. This result suggests that the time-averaged charge distribution around the SC phase should be carefully discussed because both V and the bond alternation contribute to the charge distribution. According to theoretical reports, indeed, the charge distribution in the herringbone structure is very sensitive to a subtle change in the inter-molecular interaction [80,81,82,83]. In this sense, the detailed observation of the degree of charge fluctuation along with the time-averaged distribution should be required. Nevertheless, the author believes that this compound is still useful for the following reasons. The rotational degree of freedom is lost in the 2D layer owing to the lack of the herringbone structure. Since the molecules cannot be rotated in the 2D layer, the inter-molecular interactions exhibit a straightforward response to the hydrostatic pressure and the uniaxial pressure. Therefore, experimental and theoretical study on β″-(DODHT)2PF6 will contribute to the interpretation in the SC transition of the θ-type ET salts.
According to the pressure-temperature phase diagrams of β−(meso-DMBEDT-TTF)2PF6 and β″-(DODHT)2PF6, the CO phase undergoes the SC phase with increasing pressure. Although these phase diagrams seem to be consistent with that of the β″-type ET salts, details of the charge fluctuated states are different from each other. In most of the β″-type ET salts, both the charge fluctuated state and the CO state are ascribed to the configuration of the inter-molecular distance. Each area in the phase diagram is specifically defined from the nearest neighbor Coulomb interaction. On the other hand, the bond alternation can not be negligible in the charge fluctuated states of β−(meso-DMBEDT-TTF)2PF6 and β″-(DODHT)2PF6. It is interesting to examine whether or not an additional sub-phase is intercalated between the CO and SC states. The experimental study on filling the gap between SC and CO states will be the task of the future in the field of molecular conductors.
In conclusion, the degree of the charge fluctuation of β″-type ET salts is defined as Δρ; the difference in the time-averaged molecular charge between ionic and neutral-like sites. The conducting behavior of the β″-type ET salts correlates with Δρ. The superconducting phase is characterized as small but finite Δρ. The degree of charge fluctuation depends on the relationship between NSD, NAD and ND. Therefore, the relationship between conducting behavior and inter-molecular interaction in the β″-type ET salts is simple when compared with other organic superconductors. This simple relationship will contribute to constructing a new pairing mechanism.

Acknowledgments

The author wishes to express the special thanks to Reizo Kato, Kyuya Yakushi and Yasuhiro Nakazawa. They have given many advises and encouragements to the author. Parts of the research are supported by many researchers and the author is also grateful to Masafumi Tamura, Mikio Uruichi, Kaoru Yamamoto, Hatsumi Mori, Enric Canadell, Junya Eda, Hiroshi Yamamoto, Naoya Tajima, Akira Miyazaki, Toshiaki Enoki, Mr. Takashi Ogura, Atsushi Kawamoto, Scott S Turner, Peter Day, Ali F. Bangura, Amalia I. Coldea, Akane-Sato Akutsu, and Hiroki Akutsu. Parts of this research are supported from JSPS (Grant No. 05J04172, 16GS0219, 13440214 and 15073223) and UK Engineering and Physical Sciences Research Council and Royal Society-JSPS collaborative research grant.

References and Notes

  1. Mori, T. Structural Genealogy of BEDT-TTF-Based Organic Conductors II. Inclined Molecules: θ, α, and κ Phases. Bull. Chem. Soc. Jpn. 1999, 72, 179–197. [Google Scholar] [CrossRef]
  2. Mori, T. Structural Genealogy of BEDT-TTF-Based Organic Conductors I. Parallel Molecules: β and β″ Phases. Bull. Chem. Soc. Jpn. 1998, 71, 2509–2526. [Google Scholar] [CrossRef]
  3. Obertelli, S.D.; Marsden, I.R.; Friend, R.H.; Kurmoo, M.; Rosseinsky, M.J.; Day, P.; Pratt, F.L.; Hayes, W. Electronic properties of (BEDT-TTF)3Cl·2H2O. Phys. Chem. Org. Supercondut. 1990, 51, 181–184. [Google Scholar]
  4. Carneiro, K.; Scott, J.C.; Engler, E.M. Comparative ESR study of three (BEDT-TTF): ReO4 salts: An organic superconductor, a peierls metal and a semiconductor. Solid State Commun. 1984, 50, 477–481. [Google Scholar] [CrossRef]
  5. Mori, T.; Kato, K.; Maruyama, Y.; Inokuchi, H.; Mori, H.; Hirabayashi, I.; Tanaka, S. Structural and physical properties of a new organic superconductor, (BEDT-TTF)4Pd(CN)4H2O. Solid State Commun. 1992, 82, 177–181. [Google Scholar] [CrossRef]
  6. Parkin, S.S.P.; Engler, E.M.; Schumaker, R.R.; Lagier, R.; Lee, V.Y.; Scott, J.C.; Greene, R.L. Superconductivity in a new family of organic conductors. Phys. Rev. Lett. 1983, 50, 270–273. [Google Scholar]
  7. Merino, J.; McKenzie, R.H. Superconductivity mediated by charge fluctuations in layered molecular crystals. Phys. Rev. Lett. 2001, 87, 237002:1–237002:4. [Google Scholar]
  8. Powell, B.J. Mixed order parameters, accidental nodes and broken time reversal symmetry in organic superconductors: a group theoretical analysis. J. Phys. Condens. Matter 2006, 18, L575–L584. [Google Scholar] [CrossRef]
  9. Greco, A.; Merino, J.; Foussats, A.; McKenzie, R.H. Spin exchange and superconductivity in a t-J-V model for two-dimensional quarter-filled systems. Phys. Rev. B 2005, 71, 144502:1–144502:8. [Google Scholar]
  10. Mazumdar, S.; Clay, R.T. Quantum critical transition from charge-ordered to superconducting state in the negative- U extended Hubbard model on a triangular lattice. Phys. Rev. B 2008, 77, 180515:1–180515:4. [Google Scholar]
  11. Kobayashi, A.; Suzumura, Y.; Higa, M.; Kondo, R.; Kagoshima, S.; Nishikawa, H. Charge ordered metal and pressure-induced superconductivity in the two-dimensional organic conductor β''-(DODHT)2PF6. J. Phys. Condens. Matter 2008, 20, 125205:1–125205:6. [Google Scholar]
  12. Watanabe, H.; Ogata, M. Novel charge order and superconductivity in two-dimensional frustrated lattice at quarter filling. J. Phys. Soc. Jpn. 2006, 75, 063702:1–063702:4. [Google Scholar]
  13. Kuroki, K. The origin of the charge ordering and its relevance to superconductivity in θ-(BEDT-TTF)2X: The effect of the Fermi surface nesting and the distant electron–electron interactions. J. Phys. Soc. Jpn. 2006, 75, 114716:1–114716:14. [Google Scholar]
  14. Tanaka, Y.; Yanase, Y.; Ogata, M. Superconductivity due to charge fluctuation in θ-type organic conductors. J. Phys. Soc. Jpn. 2004, 73, 2053–2056. [Google Scholar] [CrossRef]
  15. Note that the transfer integral network of β″–(DODHT)2PF6 in [11] belongs to those of the θ- and α-type salts. Detailed discussions are described in Section 5.
  16. Yamamoto, T.; Uruichi, M.; Yamamoto, K.; Yakushi, K.; Kawamoto, A.; Taniguchi, H. Examination of the charge-sensitive vibrational modes in Bis(ethylenedithio)tetrathiafulvalene. J. Phys. Chem. B 2005, 109, 15226–15235. [Google Scholar]
  17. Ymamoto, T.; Uruichi, M.; Yakushi, K.; Yamaura, J.I.; Tajima, H. Infrared and Raman evidence for the charge-ordering in β -(BEDT-TTF)3(ReO4)2. Phys. Rev. B 2004, 70, 125102:1–125102:11. [Google Scholar]
  18. Yamamoto, T.; Uruichi, M.; Yakushi, K.; Kawamoto, A. Charge ordering state of β-(ET)3(HSO4)2 and β-(ET)3(ClO4)2 by temperature-dependent infrared and Raman spectroscopy. Phys. Rev. B 2006, 73, 125116:1–125116:12. [Google Scholar]
  19. Yamamoto, T.; Yamamoto, H.M.; Kato, R.; Uruichi, M.; Yakushi, K.; Akutsu, H.; Sato-Akutsu, A.; Kawamoto, A.; Turner, S.S.; Day, P. Inhomogeneous site charges at the boundary between the insulating, superconducting, and metallic phases of β-type bis-ethylenedithio-tetrathiafulvalene molecular charge-transfer salts. Phys. Rev. B 2008, 77, 205120:1–12520:14. [Google Scholar]
  20. Yamamoto, T.; Nakazawa, Y.; Tamura, M.; Nakao, A.; Ikemoto, Y.; Moriwaki, T.; Fukaya, A.; Kato, R.; Yakushi, K. Intradimer Charge Disproportionation in Triclinic-EtMe3P[Pd(dmit)2]2 (dmit: 1,3-Dithiole-2-thione-4,5-dithiolate). J. Phys. Soc. Jpn. 2011, 80, 123709:1–123709:4. [Google Scholar]
  21. Canadell, E.; Rachidi, I.E.-I.; Ravy, S.; Pouget, J.-P.; Brossard, L.; Legnos, J.P. On the band electronic structure of X [M (dmit)2]2 (X = TTF, (CH3)4N ; M = Ni, Pd) molecular conductors and superconductors. J. Phys. (France) 1989, 50, 2967–2981. [Google Scholar] [CrossRef]
  22. Canadell, E.; Ravy, S.; Pouget, J.P.; Brossard, L. Concerning the band structure of D(M(dmit)2)2 (D = TTF, Cs, NMe4); M = Ni, Pd) molecular conductors and superconductors: Role of the M(dmit)2 Homo and Lumo. Solid State Commun. 1990, 75, 633–638. [Google Scholar] [CrossRef]
  23. Tamura, M.; Takenaka, K.; Takagi, H.; Sugai, S.; Tajima, A.; Kato, R. Spectroscopic evidence for the low-temperature charge-separated state of [Pd(dmit)2] salts. Chem. Phys. Lett. 2005, 411, 133–137. [Google Scholar] [CrossRef]
  24. Nakao, A.; Kato, R. Structural Study of Low Temperature Charge-Separated Phases of Pd(dmit)2-Based Molecular Conductors. J. Phys. Soc. Jpn. 2005, 74, 2754–2763. [Google Scholar] [CrossRef]
  25. M:H = 1:0.5 corresponds to the uniform columnar structure. In such case, the number of the charge distribution can be defined as 2, which is the same as that of M:H = 2:1. β″-(ET)(TCNQ) belongs to M:H=1:0.5 [26]. The homogeneous time-averaged charge distribution is confirmed in the low temperature phase [26]
  26. Uruichi, M.; Yakushi, K.; Yamamoto, H.M.; Kato, R. Infrared and Raman studies of the charge-ordering phase transition at −170 K in the quarter-filled organic conductor, β''-(ET)(TCNQ). J. Phys. Soc. Jpn. 2006, 75, 074720:1–074720:10. [Google Scholar]
  27. Yamamoto, K.; Yakushi, K.; Miyagawa, K.; Kanoda, K.; Kawamoto, A. Charge ordering in θ-(BEDT-TTF)2RbZn(SCN)4 studied by vibrational spectroscopy. Phys. Rev. B 2002, 65, 085110:1–085110:8. [Google Scholar]
  28. Pratt, F.L.; Fisher, A.J.; Hayes, W.; Singleton, J.; Spermon, S.J.R.M.; Kurmoo, M.; Day, P. Quantum oscillations and negative magnetoresistance in the organic metal β’’(BEDT-TTF)2AuBr2. Phys. Rev. Lett. 1988, 61, 2721–2724. [Google Scholar] [CrossRef]
  29. Kajita, K.; Nishio, Y.; Moriyama, S.; Sasaki, W.; Koto, R.; Kobayashi, H.; Kobayashi, A. Transport property of a newly synthesized organic conductor, β″-(BEDT-TTF)2AuBr2. Solid State Commun. 1986, 60, 811–815. [Google Scholar] [CrossRef]
  30. Bangura, A.F.; Coldea, A.I.; Singleton, J.; Ardavan, A.; Akutsu-Sato, A.; Akutsu, H.; Turner, S.S.; Day, P.; Yamamoto, T.; Yakushi, K. Robust superconducting state in the low-quasiparticle-density organic metals β-(BEDT-TTF)4[(H3O)M(C2O4)3]∙Y: Superconductivity due to proximity to a charge-ordered state. Phys. Rev. B 2005, 72, 014543:1–104543:13. [Google Scholar]
  31. Coldea, A.I.; Bangura, A.; Singleton, J.; Akutsu-Sato, A.; Akutsu, H.; Day, P. Fermi-surface topology and the effects of intrinsic disorder in a class of charge-transfer salts containing magnetic ions: β-(BEDT-TTF)4[(H3O)M(C2O4)3]Y (M=Fe, Cr, Ga; Y=C5H5N). Phys. Rev. B 2004, 69, 085112:1–085112:11. [Google Scholar]
  32. Yasuzuka, S.; Terakura, C.; Terashima, T.; Yakabe, T.; Terai, Y.; Yamamoto, H.M.; Kato, R.; Uji, S. Fermi surface and resistance anomalies in ET-TCNQ. Syn. Met. 2003, 135, 647–648. [Google Scholar] [CrossRef]
  33. Yamamoto, H.M.; Yamaura, J.; Kato, R. Structural and electrical properties of (BEDT-TTF)2X(diiodoacetylene) (X=Cl, Br): the novel self-assembly of neutral Lewis-acidic molecules and halide anions in a molecular metal. J. Mater. Chem. 1998, 8, 15–16. [Google Scholar] [CrossRef]
  34. Geiser, U.; Schlueter, J.A.; Wang, H.H.; Kini, A.N.; Willliams, J.M.; She, P.P.; Zakowicz, H.I.; VanZile, M.L.; Dudek, J.D.; Nixson, P.G.; et al. Superconductivity at 5.2 K in an Electron donor radical salt of Bis(ethylenedithio)tetrathiafulvalene (BEDT-TTF) with the novel polyfluorinated organic anion SF5CH2CF2SO3. J. Am. Chem. Soc. 1996, 118, 9996–9997. [Google Scholar]
  35. Akutsu, H.; Akutsu-Sato, A.; Turner, S.S.; Pevelen, D.L.; Day, P.; Laukhin, V.; Klehe, A.K.; Singleton, J.; Tocher, D.A.; Probert, M.R.; Howard, J.A. Effect of included guest molecules on the normal state conductivity and superconductivity of β"-(ET)4[(H3O)Ga(C2O4)3]·G (G = Pyridine, Nitrobenzene). J. Am. Chem. Soc. 2002, 124, 12430–12431. [Google Scholar]
  36. Kurmoo, M.; Graham, A.W.; Day, P.; Coles, S.J.; Hursthouse, M.B.; Caulfield, J.L.; Singleton, J.; Pratt, F.L.; Hayes, W. Superconducting and semiconducting magnetic charge transfer salts: (BEDT-TTF)4AFe(C2O4)3·C6H5CN (A = H2O, K, NH4). J. Am. Chem. Soc. 1995, 117, 12209–12217. [Google Scholar]
  37. Prokhorova, T.G.; Buravov, L.I.; Yagubskii, E.B.; Zorina, L.V.; Khasanov, S.S.; Simonov, S.V.; Shibaeva, R.P.; Korobenko, A.V.; Zverev, V.N. Effect of electrocrystallization medium on quality, structural features, and conducting properties of single crystals of the (BEDT-TTF)4AI[FeIII(C2O4)3]·G family. Cryst. Eng. Commun. 2011, 13, 537–545. [Google Scholar]
  38. Mori, H.; Hirabayashi, I.; Tanaka, S.; Mori, T.; Maruyama, Y.; Inokuchi, H. Superconductivity in (BEDT-TTF)4Pt(CN) 4H2O. Solid State Commun. 1991, 80, 411–415. [Google Scholar] [CrossRef]
  39. Mori, T.; Inokuchi, H. Superconductivity in (BEDT-TTF)3Cl2·2H2O. Solid State Commun. 1987, 64, 335–337. [Google Scholar] [CrossRef]
  40. Lubczynski, W.; Demishev, S.V.; Singleton, J.; Caulfield, J.M.; du Croo de Jongh, L.; Kepert, C.J.; Blundell, S.J.; Hayes, W.; Kurmoo, M.; Day, P. A study of the magnetoresistance of the charge-transfer salt(BEDT-TTF)3Cl2·2H2O at hydrostatic pressures of up to 20 kbar: evidence for a charge-density-wave ground state and the observation of pressure-induced superconductivity. J. Phys. Condens. Matter 1996, 8, 6005–6017. [Google Scholar]
  41. Kobayashi, H.; Kato, R.; Mori, T.; Kobayashi, A.; Sasaki, Y.; Saito, G.; Enoki, T.; Inokuchi, H. The crystal structures and electrical resistivities of (BEDT-TTF)3(ClO4)2 and (BEDT-TTF)2ClO4(C4H8O2). Chem. Lett. 1984, 1984, 179–182. [Google Scholar]
  42. Miyazaki, A.; Enoki, T.; Uekusa, H.; Ohashi, Y.; Saito, G. Phase transition of (BEDT-TTF)3(HSO4)2. Phys. Rev. B 1997, 55, 6847–6855. [Google Scholar]
  43. Parkin, S.S.P.; Engler, E.M.; Lee, V.Y.; Schumaker, R.R. The many faces of ET. Mol. Cryst. Liq. Cryst. 1985, 119, 375–387. [Google Scholar] [CrossRef]
  44. Yakushi, K.; Kanbara, H.; Tajima, H.; Kuroda, H.; Saito, G.; Mori, T. Temperature dependence of the reflectance spectra of the single crystals of Bis(ethylenedithio)tetrathiafulvalenium salts. α-(BEDT–TTF)3(ReO4)2 and α-(BEDT–TTF)2I3. Bull. Chem. Soc. Jpn 1987, 60, 4251–4257. [Google Scholar] [CrossRef]
  45. Gaultier, J.; Bracchetti, S.H.; Guionneau, P.; Kepert, C.J.; Chasseau, D.; Ducasse, L.; Barrans, Y.; Kurmoo, M.; Day, P. Structural properties of the superconducting salt (BEDT-TTF)3Cl2·(H2O)2 at low temperatures. J. Solid State Chem. 1999, 145, 496–502. [Google Scholar] [CrossRef]
  46. Akutsu-Sato, A.; Kobayashi, A.; Mori, T.; Akutsu, H.; Yamada, J.; Nakatsuji, S.; Turner, S.S.; Day, P.; Tocher, D.A.; Light, M.E.; Hursthouse, M.B. Structures and physical properties of new β"-BEDT-TTF tris-oxalato-metallate (III) salts containing chlorobenzene and halomethane guest molecules. Synth. Met. 2005, 152, 373–376. [Google Scholar] [CrossRef]
  47. Mori, T.; Sakai, F.; Saito, G.; Inokuchi, H. Crystalandband structures of an organic conductor β″-(BEDT-TTF)2AuBr2. Chem. Lett. 1986, 15, 1037–1040. [Google Scholar]
  48. Kozlov, M.E.; Pokohodnia, K.I.; Yurchenko, A.A. The assignment of fundamental vibrations of BEDT-TTF and BEDT-TTF-d8. Spectrochim. Acta Part A 1987, 43, 323–329. [Google Scholar] [CrossRef]
  49. Kozlov, M.E.; Pokohodnia, K.I.; Yurchenko, A.A. Electron molecular vibration coupling in vibrational spectra of BEDT-TTF based radical cation salts. Spectrochim. Acta Part A 1989, 45, 437–444. [Google Scholar] [CrossRef]
  50. Eldridge, J.E.; Homes, C.C.; Williams, J.M.; Kini, A.M.; Wang, H.H. The assignment of the normal modes of the BEDT-TTF electron-donor molecule using the infrared and Raman spectra of several isotopic analogs. Spectrochim. Acta Part A 1995, 51, 947–960. [Google Scholar] [CrossRef]
  51. Demiralp, E.; Dasgupta, S.; Goddard, W.A. MSX force field and vibrational frequencies for BEDT-TTF (neutral and cation). J. Phys. Chem. A 1997, 101, 1975–1981. [Google Scholar]
  52. Yartsev, V.M.; Świetlik, R. Infrared properties of quasi-one-dimensional organic semiconductors. Rev. Solid State Sci. 1990, 4, 69–117. [Google Scholar]
  53. Painelli, A.; Pecile, C.; Girlando, A. Cs2TCNQ3 revisited: A detailed description of its ground state through a reinterpretation of the optical spectra. Mol. Cryst. Liq. Cryst. 1986, 134, 1–19. [Google Scholar] [CrossRef]
  54. Bozio, R.; Feis, A.; Pedron, D.; Zanon, I.; Pelile, C. Structural properties of molecular charge-transfer conductors and semiconductors from infrared and Raman spectroscopy. In Low Dimensional Systems and Molecular Electronics; Metzger, R.M., Day, P., Papavassiliou, G.C., Eds.; Plenum Press: New York, NY, USA, 1991; pp. 23–41. [Google Scholar]
  55. Bozio, R.; Meneghetti, D.; Pedron, D.; Pelile, C. Optical studies of the interplay between electron-lattice and electron-electron interactions in organic conductors and superconductors. In Low Dimensional Systems and Molecular Electronics; Metzger, R.M., Day, P., Papavassiliou, G.C., Eds.; Plenum Press: New York, NY, USA, 1991; pp. 129–142. [Google Scholar]
  56. Yartsev, V.M. Charge transfer and electron-molecular vibration coupling in tetramerized quasi-lD semiconductors. Phys. Status Solidi B 1984, 126, 501–510. [Google Scholar] [CrossRef]
  57. Painelli, A.; Girlando, A. Electron–molecular vibration (e–mv) coupling in charge-transfer compounds and its consequences on the optical spectra: A theoretical framework. J. Chem. Phys. 1986, 84, 5655–5671. [Google Scholar] [CrossRef]
  58. Yamamoto, T.; Yakushi, K.; Shimizu, Y.; Saito, G. Infrared and Raman study of the charge-ordered state of θ-(ET)2Cu2CN[N(CN)2]2. J. Phys. Soc. Jpn. 2004, 73, 2326–2332. [Google Scholar] [CrossRef]
  59. Suzuki, K.; Yamamoto, K.; Yakushi, K. Charge-ordering transition in orthorhombic and monoclinic single-crystals of θ-(BEDT-TTF)2TlZn(SCN)4 studied by vibrational spectroscopy. Phys. Rev. B 2004, 69, 085114:1–085114:11. [Google Scholar]
  60. wietlik, R.; Kushch, N.D.; Kushch, L.A.; Yagubskii, E.B. Spectral studies of isostructural organic metals (BEDT-TTF)3(HSO4)2 and [Ni(dddt)2]3(HSO4)2. Phys. Status Solidi B 1994, 181, 499–507. [Google Scholar] [CrossRef]
  61. Świetlik, R.; Garrigou-Lagrange, C. Charge transfer coupling to B1u modes in BEDT-TTF salts. Synth. Met. 1993, 55–57, 2217–2221. [Google Scholar]
  62. Enoki, T.; Tsujikawa, K.; Suzuki, K.; Uchida, A.; Ohashi, Y.; Yamakado, H.; Yakushi, K.; Saito, G. Metal-semiconductor transition and structural change in (BEDT-TTF)3(ClO4)2. Phys. Rev. B 1994, 50, 16287–16294. [Google Scholar]
  63. The line-width of the ν2 mode in κ-(ET)2Cu[N(CN)2]Cl at 5 K is ~6 cm−1, which is significantly smaller than that of κ-(ET)2Cu[N(CN)2]Br, ~14 cm−1. This observation indicates that the difference in the line-width is ascribed to the difference in the degree of dimerization.
  64. On the other hand, the frequencies of the three ν3 modes are reproduced by assuming the pseudo-symmetric trimer. This consistency is ascribed to the fact that the frequencies depend on the molecular charge and the transfer integrals.
  65. Sugano, T.; Hayashi, H.; Kinoshita, M.; Nishikida, K. Infrared conductivity and electron–molecular-vibration coupling in the organic superconductor di[bis(ethylenedithio)tetrathiafulvalene] bis(isothiocyanato)cuprate(I), κ-(BEDT-TTF)2 [Cu(NCS)2]: Protonated and deuterated salts. Phys. Rev. B 1989, 39, 11387–11397. [Google Scholar]
  66. The fused line-shape in the charge sensitive mode suggests the spatial fluctuation along with the dynamical fluctuation. Recently, the author’s group has observed the spatial dependence in the reflectance spectra (to be published). The spatial fluctuation indicates that the domains of the CO state and the fluctuated state are coexisted in the low temperature. From the viewpoint of the number of the charge distributions, each domains correspond to the conditions of NSD = 1 and 1< NAD < ND, respectively.
  67. Kanoda, K. Electron correlation, metal-insulator transition and superconductivity in quasi-2D organic system, (ET)2X. Physica C 1997, 282–287, 299–302. [Google Scholar] [CrossRef]
  68. Kawamoto, A.; Miyagawa, K.; Kanoda, K. Deuterated κ-(BEDT-TTF)2Cu[N(CN)2]Br: A system on the borderof the superconductor–magnetic-insulator transition. Phys. Bev. B 1997, 55, 14140–14143. [Google Scholar]
  69. Schlueter, J.A.; Kini, A.N.; Ward, B.H.; Geiser, U.; Wang, H.H.; Mohtasham, J.; Winter, R.W.; Gard, G. Universal inverse deuterium isotope effect on the Tc of BEDT-TTF-based molecular superconductors. Physica C 2001, 351, 261–273. [Google Scholar] [CrossRef]
  70. Aonuma, S.; Sawa, H.; Okano, Y.; Kato, R.; Kobayashi, H. Synthesis of DMe-DCNQI-d7 and deuterium-induced metal-insulator transition of (DMe-DCNQI-d7)2Cu. Synth. Met. 1993, 58, 29–37. [Google Scholar] [CrossRef]
  71. Tajima, N.; Eda, J. RIKEN, Wakō, Japan. Private communication. 2007. [Google Scholar]
  72. Schlueter, J.A.; Ward, B.H.; Geiser, U.; Wang, H.H.; Kini, A.M.; Parakka, J.; Morales, E.; Koo, H.-J.; Whangbo, M.-H.; Winter, R.H.; Mohtasham, J.; Gard, G.L. Crystal structure, physical properties and electronic structure of a new organic conductor β″-(BEDT-TTF)2SF5CHFCF2SO3. J. Mater. Chem. 2001, 11, 2008–2013. [Google Scholar]
  73. Kaiser, S.; Dressel, M.; Sun, Y.; Greco, A.; Schlueter, J.A.; Gard, G.L.; Drichko, N. Bandwidth tuning triggers interplay of charge order and superconductivity in two-dimensional organic materials. Phys. Rev. Lett. 2010, 105, 206402:1–206402:4. [Google Scholar]
  74. Yamamoto, T.; Onishi, K.; Nakazawa, Y. Private communication. Osaka University: Toyonaka, Japan, 2012. [Google Scholar]
  75. Tanaka, M.; Yamamoto, K.; Uruichi, M.; Yamamoto, T.; Yakushi, K.; Kimura, S.; Mori, H. Infrared and Raman study of the charge-ordered state in the vicinity of the superconducting state in the organic conductor β-(meso-DMBEDT-TTF)2PF6. J. Phys. Soc. Jpn. 2008, 77, 024714:1–024714:8. [Google Scholar]
  76. Kimura, S.; Suzuki, H.; Maejima, T.; Mori, H.; Yamaura, J.; Kakiuchi, T.; Sawa, H.; Moriyama, H. Checkerboard-type charge-ordered state of a pressure-induced superconductor, β-(meso-DMBEDT-TTF)2PF6. J. Am. Chem. Soc. 2006, 128, 1456–1457. [Google Scholar]
  77. Kimura, S.; Maejima, T.; Suzuki, H.; Chiba, R.; Mori, H.; Kawamoto, T.; Mori, T.; Moriyama, H.; Nishio, Y.; Kajita, K. A new organic superconductor β-(meso-DMBEDT-TTF)2PF6. Chem. Commun. 2004, 2004, 2454–2455. [Google Scholar]
  78. Maxsimuk, M.; Yakishi, K.; Taniguchi, H.; Kanoda, K.; Kawamoto, A. The C=C stretching vibrations of κ-(BEDT–TTF)2Cu[N(CN)2]Br and its isotope analogues. J. Phys. Soc. Jpn. 2001, 70, 3728–3738. [Google Scholar] [CrossRef]
  79. Nishikawa, H.; Morimoto, T.; Kodama, T.; Ikemoto, I.; Kikuchi, K.; Yamada, J.; Yoshino, H.; Murata, K. New organic superconductors consisting of an unprecedented π-electron donor. J. Am. Chem. Soc. 2002, 124, 730–731. [Google Scholar]
  80. Mori, T. Estimaion of off-site coulomb integrals and phase diagrams of charge ordered states in the θ-phase organic conductor. Bull. Chem. Soc. Jpn. 2000, 73, 2243–2253. [Google Scholar] [CrossRef]
  81. Mori, T. Non-stripe charge order in the θ-phase organic conductors. J. Phys. Soc. Jpn. 2003, 72, 1469–1475. [Google Scholar] [CrossRef]
  82. Seo, H. Charge ordering in organic ET compounds. J. Phys. Soc. Jpn. 2000, 69, 805–820. [Google Scholar] [CrossRef]
  83. Clay, R.T.; Mazumdar, S.; Campbell, D.K. Charge ordering in θ-(BEDT-TTF)2X materials. J. Phys. Soc. Jpn. 2002, 71, 1816–1819. [Google Scholar] [CrossRef]
  84. Nishikawa, H.; Sato, Y.; Kikuchi, K.; Kodama, T.; Ikemoto, I.; Yamada, J.; Oshio, H.; Kondo, R.; Kagoshima, S. Charge ordering and pressure-induced superconductivity in β-(DODHT)2PF6. Phys. Rev. B 2005, 72, 052510:1–052510:4. [Google Scholar]
  85. Dayal, S.; Clay, R.T.; Li, H.; Mazumdar, S. Paired electron crystal: Order from frustration in the quarter-filled band. Phys. Rev. B 2011, 83, 245106:1–245106:12. [Google Scholar]

