Article

Plasmonic Photonic-Crystal Slabs: Visualization of the Bloch Surface Wave Resonance for an Ultrasensitive, Robust and Reusable Optical Biosensor

by
Alexander V. Baryshev
1,* and
Alexander M. Merzlikin
2
1
Ioffe Physical-Technical Institute, Politekhnicheskaya 26, St. Petersburg 194021, Russia
2
Institute for Theoretical and Applied Electromagnetics, Izhorskaya 13, Moscow 125412, Russia
*
Author to whom correspondence should be addressed.
Crystals 2014, 4(4), 498-508; https://doi.org/10.3390/cryst4040498
Submission received: 17 July 2014 / Revised: 10 October 2014 / Accepted: 31 October 2014 / Published: 4 December 2014
(This article belongs to the Special Issue Photonic Crystals)

Abstract

:
A one-dimensional photonic crystal (PhC) with termination by a metal film—a plasmonic photonic-crystal slab—has been theoretically analyzed for its optical response at a variation of the dielectric permittivity of an analyte and at a condition simulating the molecular binding event. Visualization of the Bloch surface wave resonance (SWR) was done with the aid of plasmon absorption in a dielectric/metal/dielectric sandwich terminating a PhC. An SWR peak in spectra of such a plasmonic photonic crystal (PPhC) slab comprising a noble or base metal layer was shown to be sensitive to a negligible variation of refractive index of a medium adjoining to the slab. As a consequence, the considered PPhC-based optical sensors exhibited an enhanced sensitivity and a good robustness in comparison with the conventional surface-plasmon and Bloch surface wave sensors. The PPhC biosensors can be of practical importance because the metal layer is protected by a capping dielectric layer from contact with analytes and, consequently, from deterioration.

1. Introduction

It is noted that highly sensitive, reliable diagnostic approaches are necessary for probing lower abundance proteins in analytes, when detecting diseases at early stages [1,2]. Today most commonly used optical biosensing techniques are the enzyme-linked immunosorbent assay (ELISA) [3,4] and the Biacore technology utilizing surface plasmon resonance (SPR) [5]. Both technologies are based on the ability of the biomolecule of interest to interact with a specific binding partner, where ELISA requires a fluorescent label for visualizing the binding event and Biacore is the label-free and real-time analysis. Comparison of the mentioned methods shows that the Biacore assay platform has a competitive advantage over ELISA when probing low-affinity interactions [6].
High sensitivity of SPR biosensors is defined by a significant variation in the surface plasmon dispersion at tiny variations in biological analytes. The later causes a change of the amplitude of the reflected light as the plasmon absorption band spectrally shifts. The SPR sensing is done by thin gold films, where plasmons are excited in the Kretschmann geometry (total internal reflection, TIR) or by means of diffraction from periodic metallic surfaces, see [7,8,9,10,11,12,13,14,15,16,17,18,19].
Another high-resolution sensing is done by use of the Bloch surface wave resonance (SWR) excited on a surface of a dielectric multilayer (one-dimensional photonic crystals, 1D PhC) in the TIR configuration [20,21,22,23,24,25,26,27,28,29,30]. It should be pointed out that SPR sensing operates with p-polarized light, whereas SWR one operates with s-polarized light as well as with p-polarized light. Sensing by SWR is of interest because the Bloch surface waves, which propagate along the interface between a PhC and an analyte, are far less absorptive in comparison with surface plasmons, and their amplitude has much more extended distribution into an analyte.
It is known that the sensitivity of SPR sensors approaches their theoretical limitation [16]; that is also conditioned by the optical constants of noble metals. Another disadvantage of the SPR sensor is the requirement of immobilizing an antibody directly on the noble metal surface for detecting a specific protein in an analyte. Affinity interactions (or binding) between molecules are well detectable only in close vicinity of the sensor surface, since the SPR-generated near field is pinned to the surface and is not extended into the analyte. That is why the best material for the above-mentioned probing scheme is Au, as it is not (or weakly) oxidized in comparison with other noble metals, such as Ag or Cu.
As for SWR-based sensors, the resonance cannot be detected in reflection spectra of non-absorbing PhCs due to TIR, and existence of a channel for attenuation of the surface wave is an essential requirement for observation of the resonance. Extinction of SWR should be done so that the quality-factor (Q-factor) of SWR is kept at a significantly higher level than that of the SPR band; this condition can provide a gain in sensitivity.
Plasmonic photonic-crystals (PPhC) with termination by gold films have been theoretically analyzed for its optical response at a variation of the dielectric permittivity of an analyte [31] and also in a situation modeling the event of biomolecular binding [32]. In these works, a sharp attenuation peak associated with SWR has been visualized in p-polarized reflection spectra due to plasmon absorption in gold (the situation where SPR and SWR are excited simultaneously). Sensing performance by the slabs is shown to be tolerant to the variation of probing conditions and the slab’s structural parameters.
A PPhC slab with the termination by a SiO2/Au/SiO2 sandwich is found to have the best robustness [31,32]. For such slabs, the Q-factor of SWR is higher and it is less dependent on the variation in the angle of incidence and structural parameters of the PPhC slabs. For an optimized slab, the distribution of the electric field amplitude in the vicinity of the terminating SiO2/Au/SiO2 sandwich is specific to a “long-range” behavior where the amplitude of the E-field tends to zero inside the Au layer and amplified at the Au/SiO2 surfaces (see Figure 5 in [31]). The considered structure of PPhC slabs with the dielectric/metal/dielectric termination can be of practical importance because the metal layer is protected from oxidation (from contact with analytes) and any other deterioration. This is why biomolecules’ immobilization can be done on the surface of dielectric capping.
In the present work, we summarize theoretical results on analysis of the Bloch surface wave excited in PPhC with termination by a single plasmonic layer of a noble or base metal. We show that high Q-factor SWRs can be visualized in p-polarized reflection spectra of such PPhCs. We illustrate optical responses of PPhCs at a variation of the dielectric permittivity of an analyte and at a condition simulating the molecular binding event. Since the dielectric capping protects metals from oxidation, for PPhC-based sensors with no lack in sensing performance, gold can be replaced by copper (or other metals). Additionally, we discuss PPhCs comprising base metals and their ability to sense a refractive index change. For comparison, sensing performances of a Biacore-like SPR sensor and non-plasmonic PhC-based sensors are also illustrated.

2. Model Calculation

A sketch of the PPhC slab under analysis together with its main elements and the schematic distribution of the resonant wave amplitude is shown in Figure 1a. For the present consideration, we have chosen a PhC with ten binary unit cells—the (Ta2O5/SiO2)10 multilayer—because it is feasible for manufacturing and is a practicable crystal for its spectroscopy. Thicknesses (and refractive indices) of dielectric layers were fixed: 148 nm (2.1) and 260 nm (1.46) for Ta2O5 and SiO2 respectively. The (Ta2O5/SiO2)10 multilayer was terminated by a metal/50-nm-thick SiO2 bilayer—the metal layer was sandwiched between SiO2. Dispersions of metals (n and k) were taken from [33,34]. Calculations of spectra and diagrams were performed by the matrix approach and 2D FDTD modeling by Comsol Multiphysics; data obtained by both approaches were in a good agreement.
For the sake of presentation simplicity, we limit our discussion by well-known noble metals of Ag, Au, Cu and base, high-reflectivity metals of Ni and Cr. The thicknesses of metals (D) were multiples of 5 nm. The analysis was done for the p and s polarizations when varying the angle of light incidence (α) and the refractive index of an analyte. As an example of analytes for testing the sensors’ performances, we have considered water with a variation of the nondispersive refractive index (n) from 1.33 to 1.331 (∆n = 1 × 10⁻³). Coupling prism had a nondispersive refractive index of 1.51 close to that of the BK7 glass in the studied spectral range of 700–1500 nm.
In general, spectra of considered PPhCs may exhibit resonances of different nature: surface plasmon resonances due to Au [19], Bloch surface wave [20,21,22,23,24,25,26,27,28,29,30,31,32] or optical Tamm state [35,36,37,38,39,40,41] due to the plasmonic element of and the periodical structure of PPhCs. Figure 1b shows spectra of the PPhCs with terminations by 10-nm- and 40-nm-thick Au layers (n = 1.33). One can see that the SPR-related light absorption in gold can indicate existence of SWR in p-polarized reflection spectra. [It worth recalling again that reflection coefficient equals unity (R = 1) through all the spectral range, if there is no any extinction element as an absorber or a waveguiding layer.] Spectra of sensors comprising an Au layer with D = 5 nm, 10 nm and 15 nm are shown in Figure 2 illustrating sensing performance of ∆Rmax = 0.69, 0.77, 0.66 at spectral shifts of SWR, respectively. Obviously, for a chosen structure of a PPhC slab, the thickness of metal is the key parameter governing the Q-factor of SWR together with the spectral shift, and, consequently, sensing performance of the PPhC slab [31].
Figure 1. (a) Geometry of analysis with a schematic distribution of the E-field for a resonant wave inside a PPhC slab; (b) curves 1–3 show p-polarized reflection spectra of (Ta2O5/SiO2)10PhC (dashed line), (Ta2O5/SiO2)10/Au/SiO2 PPhC slab comprising a 10-nm-thick Au layer (solid line) and a (Ta2O5/SiO2)10/Au/SiO2 PhC slab having a 40-nm-thick Au layer (circles). Spectra plotted in Figure 1b were calculated for the angle of incidence α = 63°.
Crystals 04 00498 g001
Figure 2. Shifts of the SWR peak in reflection spectra of PPhC-based sensors comprising an Au layer with thicknesses from D = 5 nm, 10 nm and 15 nm (from left to right): thin lines (n = 1.33) and thick lines (n + ∆n = 1.331). Spectra are calculated for α = 61.8°.
Crystals 04 00498 g002

3. Results

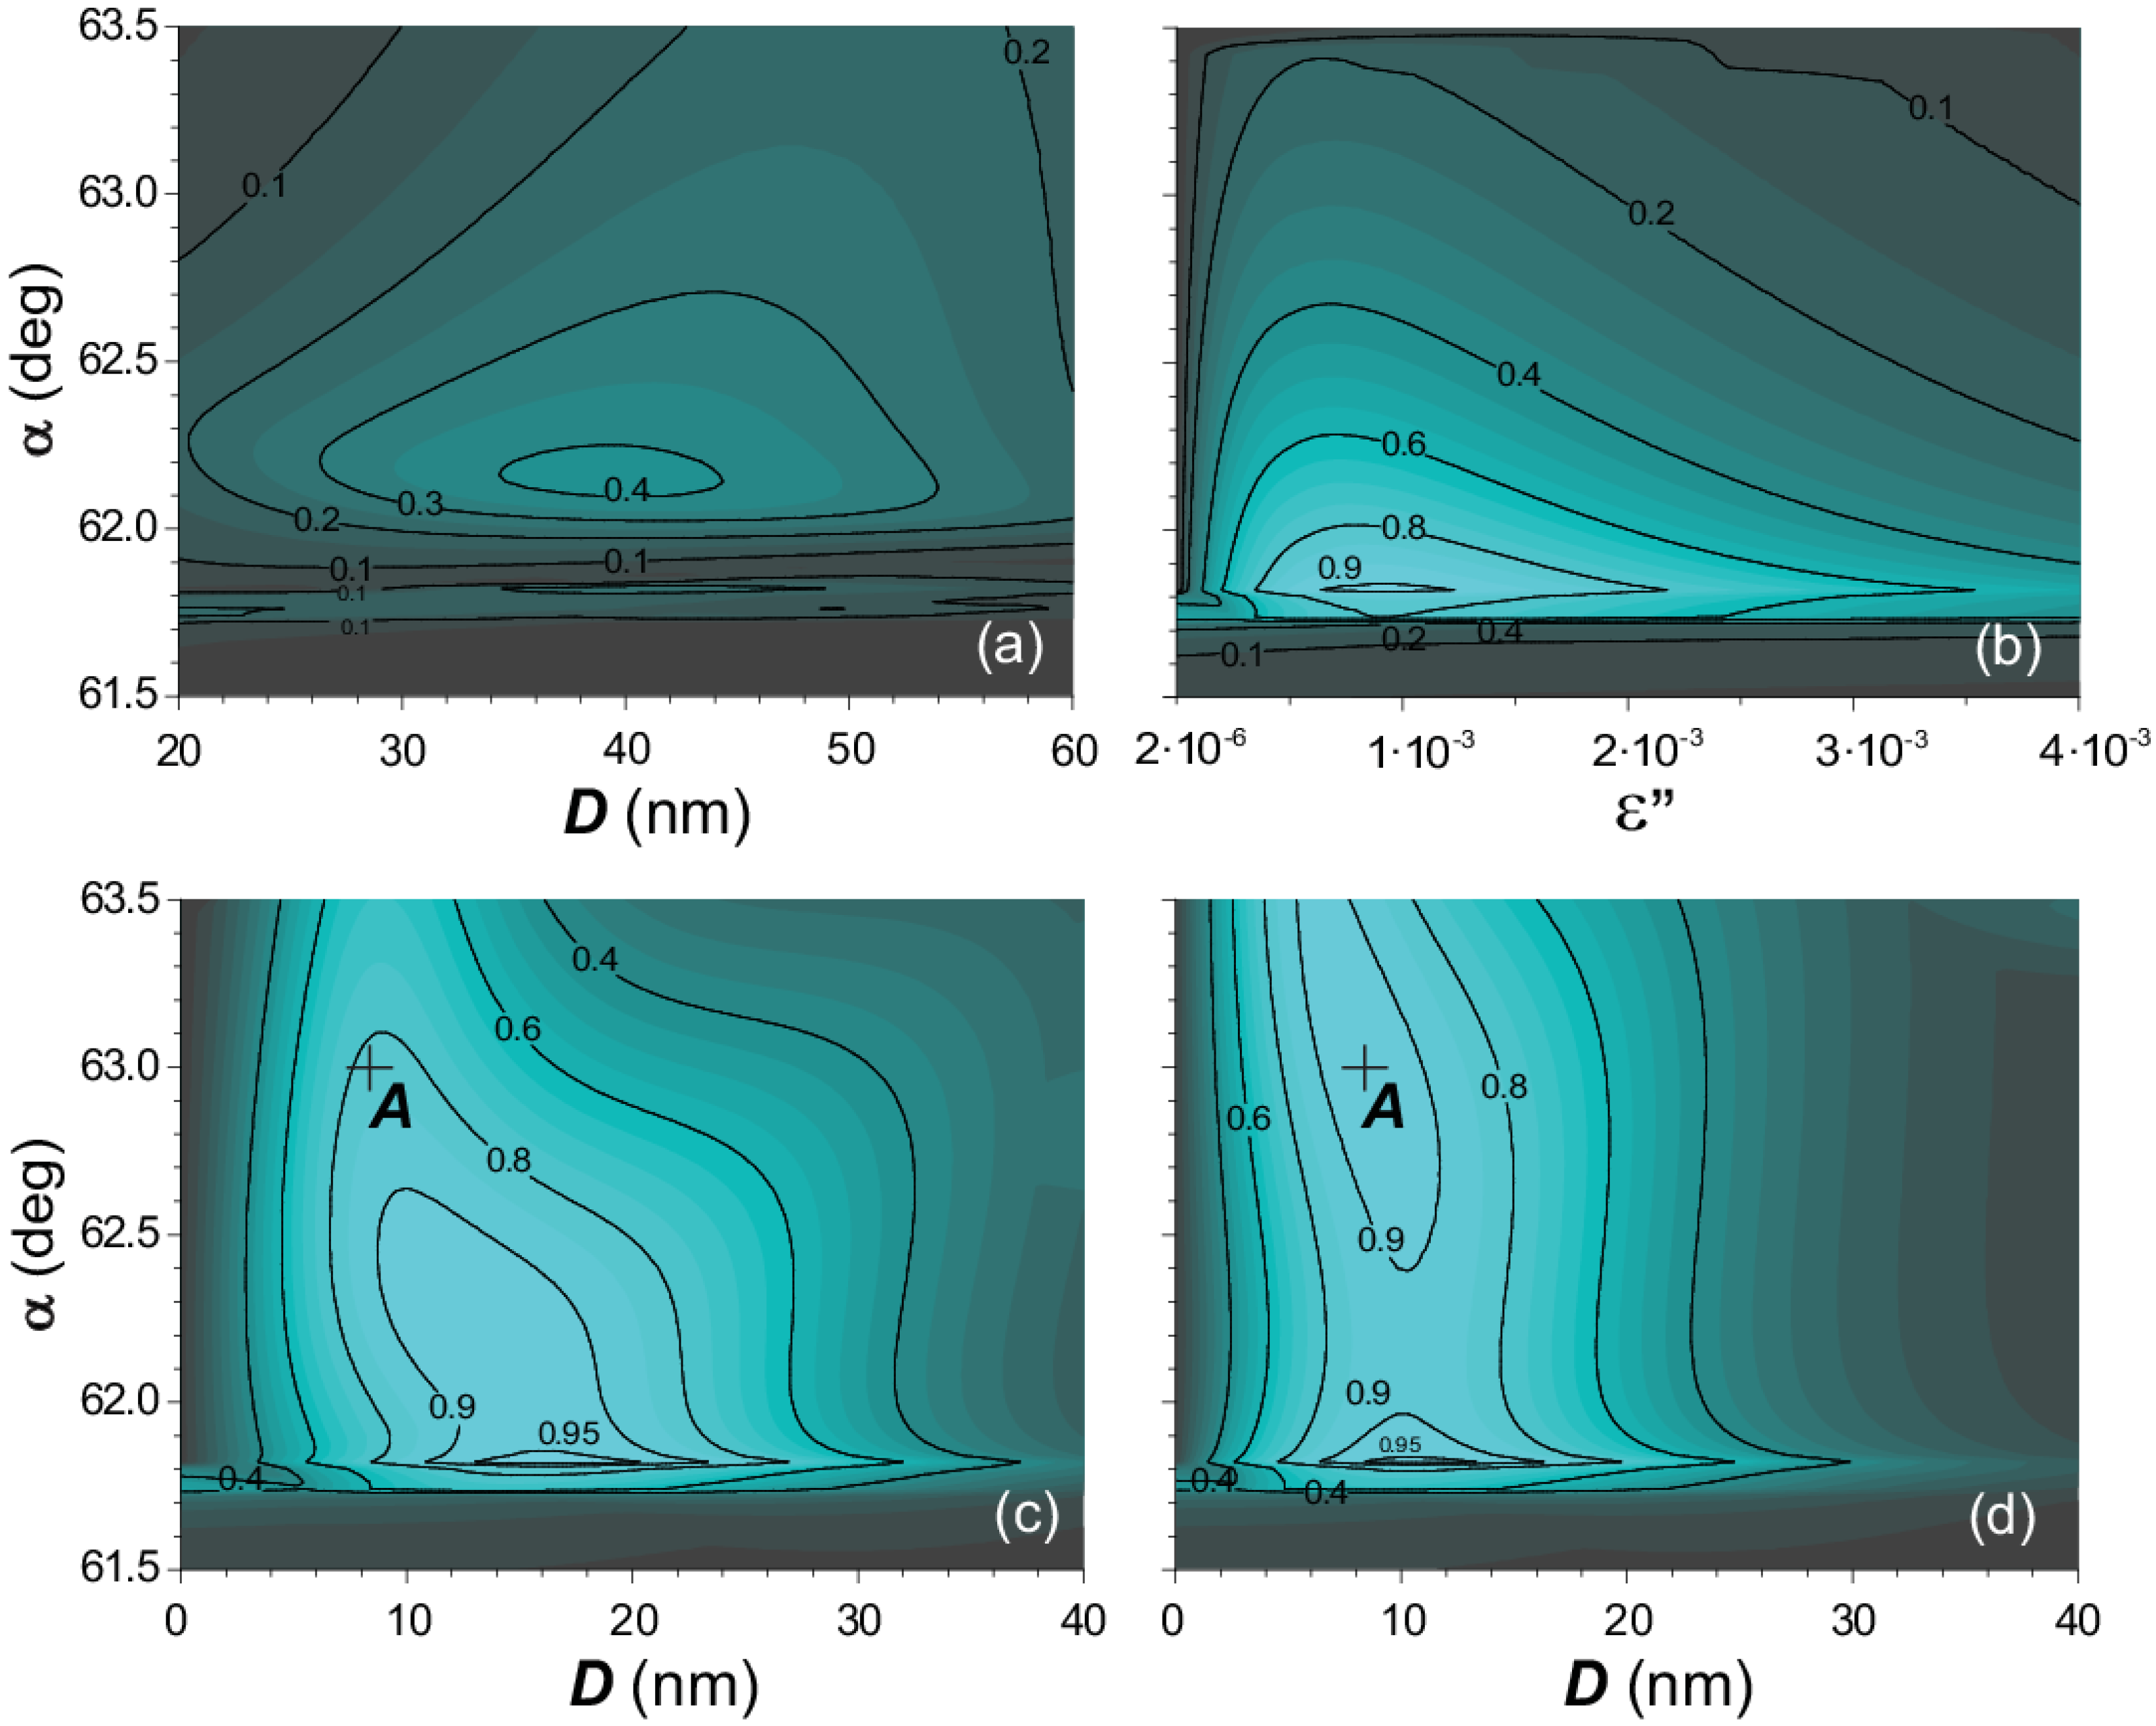
To compare performances of PPhC sensors with the SPR and conventional SWR counterparts, the maximum of reflectance ∆Rmax was evaluated when searching in a spectral range of 700–1500 nm through D, α and ε″. (Evaluation for the SPR sensor was done in a spectral range of 700–3000 nm; calculations showed that the maximum response was at λ = 2642 nm and any further increase of the calculation range is not essential.) Figure 3 summarizes data on the performance of the sensors. The SPR sensor had a response of ∆Rmax = 0.42, and the contour line corresponding to a level of ∆R = 0.3 was significantly limited by α and D. The conventional SWR sensor exhibited a TIR-limited contour line for maximal operating margins of ∆R = 0.9 and ∆α = 0.1°. It is obvious that the margins of ∆R and ∆α are kept if one scales the period of the PhC. This contour line was also considerably constrained by ε″. (It is important to recall that practical realization of a sensor with a through-structure and fine-tuned magnitude of ε" is difficult.)
Figure 3. (ad) Diagrams illustrating the performance of SPR, SWR, and two PPhC sensors, respectively. Solid contour lines show sensitivity levels (maximum ∆R in corresponding wavelength ranges) at ∆n = 1 × 10⁻³, when varying parameters of the sensors. (c,d) PPhC sensors without and with a 50-nm-thick SiO2 layer covering the Au layer, respectively.
Crystals 04 00498 g003
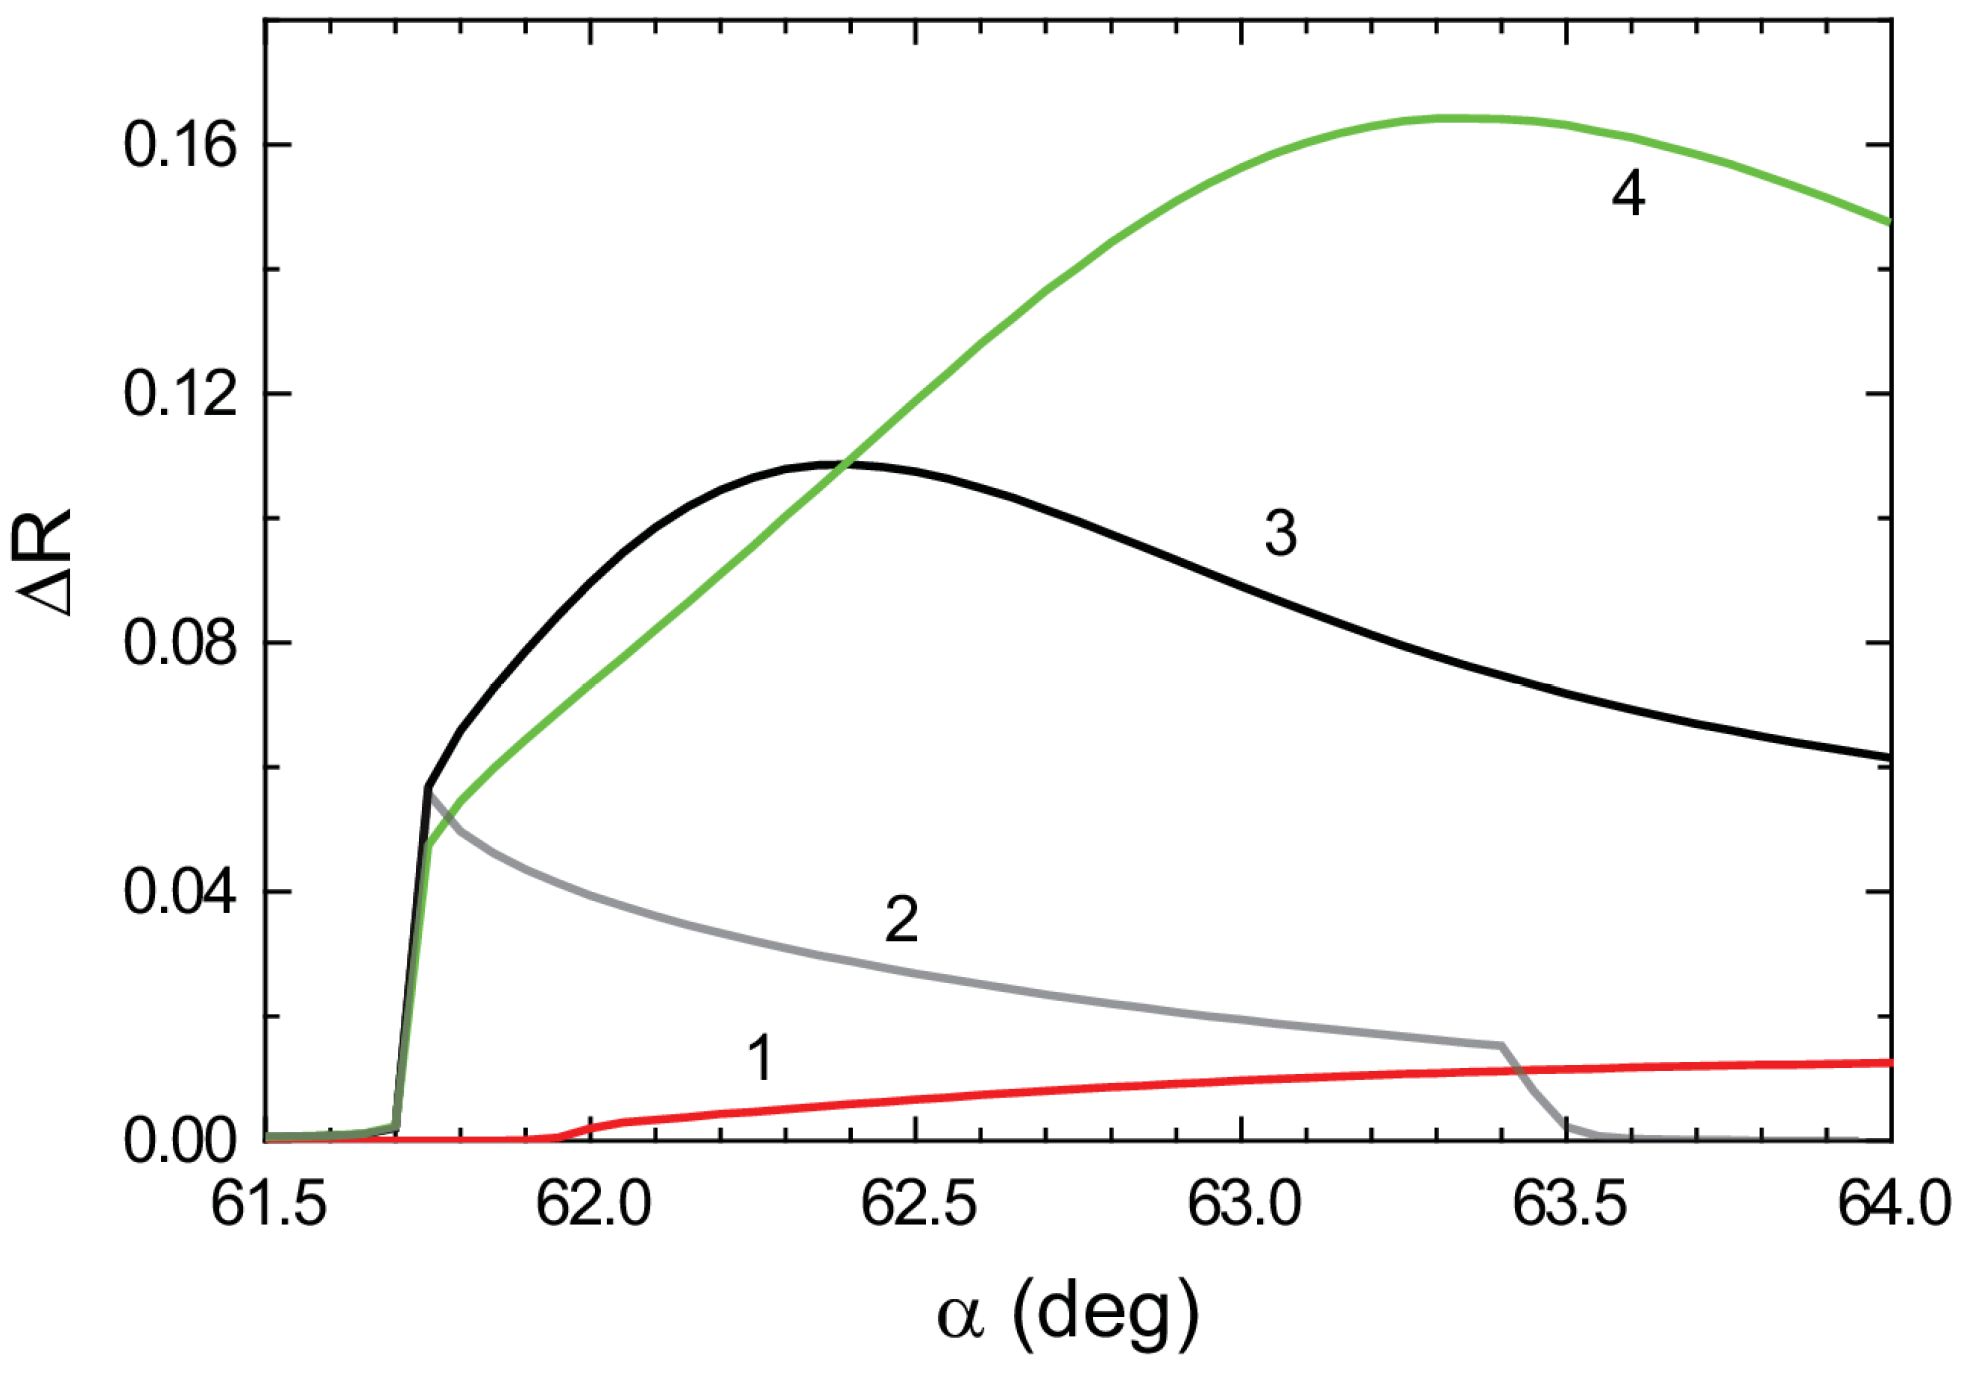
As for the PPhC sensors, high performance margins were significantly extended; see a contour line of ∆R = 0.9. This is illustrated in Figure 4 by vertical sections of Figure 3. One can see that the PPhC sensors without and with a 50-nm-thick SiO2 layer had a value of ∆α = 0.83° and ∆α = 1.69° at ∆R = 0.87; let us compare these margins with that of the conventional SWR (∆α = 0.13° at ∆R = 0.87) and SPR (∆α = 0.71° at ∆R = 0.3). Note that the scales of α and also the variations of D are fixed in Figure 3, thus giving a comparative estimation. Details on differences between calculated PPhC sensor can be found in [25].
Figure 4. Comparison of the sensors’ optical response at ∆n = 1 × 10⁻³. Lines 1–4 illustrate the vertical sections of Figure 3a–d, respectively: the sections were made for plot (a) D = 39 nm; plot (b) ε″ = 0.8 × 10⁻³; plot (c) D = 12.7 nm; and plot (d) D = 8.8 nm. Dashed lines correspond to ∆R = 0.3 and 0.87.
Crystals 04 00498 g004
Figure 5 summarizes sensing performance of several sensors–robustness (stability) of their responses ∆Rmax versus the angle of light incidence: (i) PPhC sensors comprising single layers of noble and base metals; (ii) conventional SWR sensor with absorption of k = 1 × 10⁻³ homogeneously introduced into the (Ta2O5/SiO2)10 multilayer; and (iii) the SPR sensor based on a 40-nm-thick Au film. The considered PPhC sensors containing absorbing layers of Au and Cu (and Ag, not shown) showed similar characteristics, providing a stable level of ∆Rmax. However, ∆Rmax of PPhCs comprising the 5-nm-thick layer of Ni (or Cr) dropped with rise of α. Spectral sensitivity of the discussed PPhC sensor was of a level of ∆λ/∆n ≈ 1500 nm/RIU similar to that reported for SWR sensors, for example, in [42].
If biomolecular reactions occur only in a thin layer at the surface of the sensor, what is the sensing performance of the sensors under study? This question is extremely important because a biomolecule of interest interacts with a specific binding partner, which is immobilized on the surface of the sensor. To model this, we limited the thickness of the reaction layer by 20 nm and kept the change of ∆n = 1 × 10⁻³ in this layer only (n = 1.331); the rest of the analyte had the refractive index of 1.33. Simulations of ∆Rmax were done in the same procedure as that discussed for Figure 3, when only limiting the reaction layer. Related analysis of the sensing performance ∆Rmax is illustrated in Figure 6 and Figure 7, where Figure 7 illustrates sections of Figure 6. These results are in good accordance with that discussed in Figure 3 and Figure 4.
Figure 5. Maximum response of PPhC-based sensors made of different metals versus the angle of incidence [(Ta2O5/SiO2)10/metal/SiO2]. For reference, the black line shows the response of an SPR sensor (single 40-nm-thick Au film) and the squares illustrate the response of an (Ta2O5/SiO2)10 multilayer-based SWR sensor with absorption of k = 1 × 10⁻³ homogeneously introduced into each layer.
Crystals 04 00498 g005
Figure 6. Diagrams illustrating the performance of SPR (a), SWR (b) and two PPhC (c,d) sensors, respectively. Comparison was done for the change in the refractive index of ∆n = 1 × 10⁻³ that happened in a 20-nm-thick reaction layer on the surface of the sensors. (c,d) PPhC sensors without and with a 50-nm-thick SiO2 layer covering the Au layer, respectively.
Crystals 04 00498 g006
Figure 7. Comparison of the sensors’ optical response upon the change of ∆n = 1 × 10⁻³ in a 20-nm-thick reaction layer on the surface of the sensors. Lines 1–4 illustrate the vertical sections of Figure 6a–d, respectively: the sections were made for plot (a) D = 24.6 nm; plot (b) ε″ = 0.5 × 10⁻³; plot (c) D = 11.1 nm; and plot (d) D = 6.7 nm.
Crystals 04 00498 g007

4. Conclusions

An approach to visualize the Bloch surface wave was demonstrated, where the spectrally sharp peak was seen in reflection spectra of PPhCs with the aid of plasmon absorption. An important feature of the studied PPhC sensor is that the plasmonic layer is sealed between two dielectric layers. The results show that there is a variety of metals able to replace Au, which is currently usable for optical biosensing. Since optical (plasmonic) properties of noble metals are alike in a range of 700–1500 nm, liable to oxidation metals as Ag and Cu can be used for the robust PPhC-based biosensors utilizing plasmon-visualized Bloch surface wave; for details see [43]. The PPhC comprising base metals as the plasmonic element also exhibited a good sensing performance.
The demonstrated PPhC-based biosensors overcome performance of SPR sensors. They can be low-cost reusable robust sensors because the plasmonic layer is sealed inside dielectric, which means that a thin metal layer is protected from deterioration/aging upon storage, immobilizing biomolecules and probing analytes. With their high Q-factor SWR resonances, PPhC-based sensor can have potential for detecting low-affinity interactions in analytes having a low concentration of biomolecules of interest.
The plasmonic photonic crystals comprising magneto-optical materials enable to provide even more precise sensing platform, since not only the amplitude but also the polarization state and the phase of the probe signals can be altered by switching external magnetic fields. This can provide the next level of detecting tiny variations in biological analytes if the lock-in-amplifying technique is applied.

Acknowledgments

The authors would like to thank the support by the Ministry of Education, Cultures, Sports, Science and Technology, MEXT, with “Program to Foster Young Researchers in Cutting-Edge Interdisciplinary Research”, and Grant-in-Aid for Scientific Research (С) No. 24510178 from Japan Society for the Promotion of Science (JSPS), because the significant part of the work was done while working in Toyohashi University of Technology, Japan.

Author Contributions

Alexander V. Baryshev conceived the original idea of the work. Alexander M. Merzlikin suggested an algorithm for finding optimized parameters of the plasmonic photonic crystal slabs. All authors analyzed numerical data and wrote the manuscript.

Conflicts of Interest

The authors declare no conflict of interest.

References

  1. Wulfkuhle, J.D.; Liotta, L.A.; Petricoin, E.F. Proteomic applications for the early detection of cancer. Nat. Rev. Cancer 2003, 3, 267–275. [Google Scholar] [CrossRef] [PubMed]
  2. Nestor, P.J.; Scheltens, P.; Hodges, J.R. Advances in the early detection of Alzheimer’s disease. Nat. Rev. Neurosci. 2004, 5, 34–41. [Google Scholar] [CrossRef]
  3. Taitt, C.R.; Golden, J.P.; Shubin, Y.S.; Shriver-Lake, L.C.; Sapsford, K.E.; Rasooly, A.; Ligler, F.S. A Portable Array Biosensor for Detecting Multiple Analytes in Complex Samples. Microb. Ecol. 2004, 47, 175–185. [Google Scholar] [CrossRef] [PubMed]
  4. Patton, A.; Mullenix, M.C.; Swanson, S.J.; Koren, E. An acid dissociation bridging ELISA for detection of antibodies directed against therapeutic proteins in the presence of antigen. J. Immunol. Methods 2005, 304, 189–195. [Google Scholar] [CrossRef] [PubMed]
  5. Szabo, A.; Stolz, L.; Granzow, R. Surface plasmon resonance and its use in biomolecular interaction analysis (BIA). Curr. Opin. Struct. Biol. 1995, 5, 699–705. [Google Scholar] [CrossRef] [PubMed]
  6. Lofgren, J.A.; Dhandapani, S.; Pennucci, J.J.; Abbott, C.M.; Mytych, D.T.; Kaliyaperumal, A.; Swanson, S.J.; Mullenix, M.C. Comparing ELISA and Surface Plasmon Resonance for Assessing Clinical Immunogenicity of Panitumumab. J. Immunol. 2007, 178, 7467–7472. [Google Scholar] [PubMed]
  7. Homola, J.; Piliarik, M. Surface Plasmon Resonance Based Sensors. In Springer Series on Chemical Sensors and Biosensors; Springer-Verlag: Berlin, Germany, 2006. [Google Scholar]
  8. Nenninger, G.G.; Piliarik, M.; Homola, J. Data analysis for optical sensors based on spectroscopy of surface plasmons. Meas. Sci. Technol. 2002, 13, 2038–2046. [Google Scholar] [CrossRef]
  9. Piliarik, M.; Párová, L.; Homola, J. High-throughput SPR sensor for food safety. Biosens. Bioelectron. 2009, 24, 1399–1404. [Google Scholar] [PubMed]
  10. Wu, B.M.; Pao, M.C. Sensitivity-tunable optical sensors based on surface plasmon resonance and phase detection. Opt. Express 2004, 12, 3509–3514. [Google Scholar] [CrossRef] [PubMed]
  11. Stemmler, I.; Brecht, A.; Gauglitz, G. Compact surface plasmon resonance-transducers with spectral readout for biosensing applications. Sens. Actuators B Chem. 1999, 54, 98–105. [Google Scholar] [CrossRef]
  12. Bardin, F.; Bellemain, A.; Roger, G.; Canva, M. Surface plasmon resonance spectro-imaging sensor for biomolecular surface interaction characterization. Biosens. Bioelectron. 2009, 24, 2100–2105. [Google Scholar] [CrossRef] [PubMed]
  13. Thirstrup, B.; Zong, W. Data analysis for surface plasmon resonance sensors using dynamic baseline algorithm. Sens. Actuators B Chem. 2005, 106, 796–802. [Google Scholar] [CrossRef]
  14. Chinowsky, T.M.; Quinn, J.G.; Bartholomew, D.U.; Kaiser, R.; Elkind, J.L. Performance of the Spreeta 2000 integrated surface plasmon resonance affinity sensor. Sens. Actuators B Chem. 2003, 91, 266–274. [Google Scholar] [CrossRef]
  15. Piliarik, M.; Vala, M.; Tichý, I.; Homola, J. Compact and low-cost biosensor based on novel approach to spectroscopy of surface plasmons. Biosens. Bioelectron. 2009, 24, 3430–3435. [Google Scholar] [CrossRef]
  16. Piliarik, M.; Homola, J. Surface plasmon resonance (SPR) sensors: Approaching their limits? Opt. Express 2009, 17, 16505–16517. [Google Scholar] [CrossRef]
  17. Homola, J.; Yee, S.S.; Gauglitz, G. Surface plasmon resonance sensors: Review. Sens. Actuators B 1999, 54, 3–15. [Google Scholar] [CrossRef]
  18. Robinson, G. The commercial development of planar optical biosensors. Sens. Actuators 1995, 29, 31–36. [Google Scholar]
  19. Raether, H. Surface Plasmons; Springer: Berlin, Germany, 1988. [Google Scholar]
  20. Yeh, P.; Yariv, A.; Hong, C.-S. Electromagnetic propagation in periodic stratified media. I. General theory. J. Opt. Soc. Am. 1977, 67, 423–438. [Google Scholar] [CrossRef]
  21. Yeh, P.; Yariv, A.; Cho, A.Y. Optical surface waves in periodic layered media. Appl. Phys. Lett. 1978, 32, 104–105. [Google Scholar]
  22. Robertson, W.M.; May, M.S. Surface electromagnetic waves on one-dimensional photonic band gap arrays. Appl. Phys. Lett. 1999, 74, 1800–1802. [Google Scholar] [CrossRef]
  23. Shinn, M.; Robertson, W.M. Surface plasmon-like sensor based on surface electromagnetic waves in a photonic band-gap material. Sens. Actuators B Chem. 2005, 105, 360–364. [Google Scholar] [CrossRef]
  24. Michelotti, F.; Sciacca, B.; Dominici, L.; Quaglio, M.; Descrovi, E.; Giorgis, F.; Geobaldo, F. Fast optical vapour sensing by Bloch surface waves on porous silicon membranes. Phys. Chem. Chem. Phys. 2010, 12, 502–506. [Google Scholar] [CrossRef] [PubMed]
  25. Rivolo, P.; Michelotti, F.; Frascella, F.; Digregorio, G.; Mandracci, P.; Dominici, L.; Giorgis, F.; Descrovi, E. Real time secondary antibody detection by means of silicon-based multilayers sustaining Bloch surface waves. Sens. Actuators B Chem. 2012, 161, 1046–1052. [Google Scholar] [CrossRef]
  26. Sinibaldi, A.; Danz, N.; Descrovi, E.; Munzert, P.; Schulz, U.; Sonntag, F.; Dominici, L.; Michelotti, F. Direct comparison of the performance of Bloch surface wave and surface plasmon polariton sensors. Sens. Actuators B Chem. 2012, 174, 292–298. [Google Scholar] [CrossRef]
  27. Frascella, F.; Ricciardi, S.; Rivolo, P.; Moi, V.; Giorgis, F.; Descrovi, E.; Michelotti, F.; Munzert, P.; Danz, N.; Napione, L.; et al. A Fluorescent One-Dimensional Photonic Crystal for Label-Free Biosensing Based on Bloch Surface Waves. Sensors 2013, 13, 2011–2022. [Google Scholar] [CrossRef] [PubMed]
  28. Guo, Y.; Ye, J.Y.; Divin, C.; Huang, B.; Thomas, T.P.; Baker, J.R., Jr.; Norris, T.B. Real-Time Biomolecular Binding Detection Using a Sensitive Photonic Crystal Biosensor. Anal. Chem. 2010, 82, 5211–5218. [Google Scholar]
  29. Konopsky, V.N.; Alieva, E.V. A biosensor based on photonic crystal surface waves with an independent registration of the liquid refractive index. Biosens. Bioelectron. 2010, 25, 1212–1216. [Google Scholar] [CrossRef] [PubMed]
  30. Konopsky, V.N.; Karakouz, T.; Alieva, E.V.; Vicario, C.; Sekatskii, S.K.; Dietler, G. Photonic crystal biosensor based on optical surface waves. Sensors 2013, 13, 2566–2578. [Google Scholar] [CrossRef] [PubMed]
  31. Baryshev, A.V.; Merzlikin, A.M.; Inoue, M. Efficiency of optical sensing by a plasmonic photonic-crystal slab. J. Phys. D Appl. Phys. 2013, 46, 125107:1–125107:5. [Google Scholar] [CrossRef]
  32. Baryshev, A.V.; Merzlikin, A.M.; Inoue, M. Plasmonic Photonic-Crystal Slab as An Ultrasensitive and Robust Optical Biosensor. In Proceedings of the SPIE 8632, Photonic and Phononic Properties of Engineered Nanostructures III, San Francisco, CA, USA, 21 February 2013.
  33. Palik, B.D. Handbook of Optical Constants of Solids; Academic Press: New York, NY, USA, 1991. [Google Scholar]
  34. Landolt-Bornstein Database. Available online: http://www.springermaterials.com (accessed on 14 November 2013).
  35. Goto, T.; Dorofeenko, A.V.; Merzlikin, A.M.; Baryshev, A.V.; Vinogradov, A.P.; Inoue, M.; Lisyansky, A.A.; Granovsky, A.B. Optical tamm states in one-dimensional magnetophotonic structure. Phys. Rev. Lett. 2008, 101. [Google Scholar] [CrossRef] [PubMed]
  36. Kaliteevski, M.; Iorsh, I.; Brand, S.; Abram, R.A.; Chamberlain, J.M.; Kavokin, A.V.; Shelykh, I.A. Tamm plasmon-polaritons: Possible electromagnetic states at the interface of a metal and a dielectric Bragg mirror. Phys. Rev. B 2007, 76. [Google Scholar] [CrossRef]
  37. Villa, F.; Gaspar-Armenta, J.A. Electromagnetic surface waves: Photonic crystal-photonic crystal interface. Opt. Commun. 2003, 223, 109–115. [Google Scholar]
  38. Kavokin, A.; Shelykh, I.; Malpuech, G. Lossless interface modes at the boundary between two periodic dielectric structures. Phys. Rev. B 2005, 72. [Google Scholar] [CrossRef]
  39. Namdar, A.; Shadrivov, I.V.; Kivshar, Y.S. Backward Tamm states in left-handed metamaterials. Appl. Phys. Lett. 2006, 89. [Google Scholar] [CrossRef]
  40. Baryshev, A.V.; Kawasaki, K.; Lim, P.B.; Inoue, M. Interplay of surface resonances in one-dimensional plasmonic magnetophotonic crystal slabs. Phys. Rev. B 2012, 85. [Google Scholar] [CrossRef]
  41. Afinogenov, A.I.; Bessonov, V.O.; Nikulin, A.A.; Fedyanin, A.A. Observation of hybrid state of Tamm and surface plasmon-polaritons in one-dimensional photonic crystals. Appl. Phys. Lett. 2013, 103. [Google Scholar] [CrossRef]
  42. Threm, B.; Nazirizadeh, Y.; Gerken, M. Photonic crystal biosensors towards on-chip integration. J. Biophotonics 2012, 5, 601–616. [Google Scholar] [CrossRef] [PubMed]
  43. Baryshev, A.V.; Merzlikin, A.M. Approach to visualization of and optical sensing by Bloch waves in noble or base metal-based plasmonic photonic crystal slabs. Appl. Opt. 2014, 14, 3142–3146. [Google Scholar] [CrossRef]