
Time-Varying Characteristics of Granite Microstructures after Cyclic Dynamic Disturbance Using Nuclear Magnetic Resonance

School of Resources and Safety Engineering, Central South University, Changsha 410083, China
*
Author to whom correspondence should be addressed.
Crystals 2017, 7(10), 306; https://doi.org/10.3390/cryst7100306
Submission received: 2 August 2017
/
Revised: 6 October 2017
/
Accepted: 10 October 2017
/
Published: 12 October 2017
Abstract
:To investigate the variation in the characteristics of rock microstructure after cyclic dynamic disturbances, a split Hopkinson pressure bar (SHPB) was used to carry out cyclic dynamic impact tests on granite, and the P-wave velocity was used as the characteristic parameter representing the microstructural change. Using the nuclear magnetic resonance (NMR) technique, the porosity and the T2 distribution of rock samples were obtained. The results show that, after the cyclic dynamic disturbance, the P-wave velocity within the rock specimen decreases but rebounds with time. At the elastic phase, when the axial loading increases, the P-wave velocity declines. The T2 limit is shortened, and the cyclic dynamic disturbance process promotes the formation of small pores and decreases the size and quantity of large pores. After the cyclic dynamic disturbance, the porosity of the rock samples was reduced.
1. Introduction
Rock, a natural heterogeneous material, contains a large number of holes and micro-cracks, and these microstructures have a great influence on the macro-mechanical properties of rock and the potential damage from geotechnical engineering. Currently, some achievements have been made in the study of rock microstructures. Lindqvist et al. [1] studied the effects of mineral particle size, shape, and distribution, porosity, and micro-cracks on the physical and mechanical properties of rock. Johansson et al. [2] noted that these features and the level of surface development are the most important factors affecting the mechanical properties of rock. Hatzor et al. [3] conducted a study on the relationship between the microstructure of dolomite and initial stress of crack initiation and found that the microstructure had a great influence on the ultimate rock strength. Tuğrul et al. [4] argued that the mechanical properties of a rock are a function of its mineral composition and micro-crack characteristics; the micro-crack characteristics have a significant effect on the engineering properties. By measuring the P-wave velocity of granite under uniaxial stress, Ods et al. [5] discussed the distribution of the crack shape in the rock. Yue et al. [6,7,8] combined digital image processing technology with the finite element method (FEM) to study the influence of rock material meso-structure on the internal stress distribution. Prikry et al. [9] found that the effect of particle size on the compressive strength of rock is the most important factor. Rune [10] and Fjaer [11] found that the P-wave velocity was very sensitive to the change of pore structure in rock and suggested that P-wave velocity could be used as a means to study the change in the pore structure of rock. In addition, Nafi Toksoz [12] proposed that the change of the P-wave velocity could be used to infer the shape of the cracks’ distribution. Based on this view, the crack deformation caused by the pressure was modeled, and the possibility of the existence of the shape distribution of cracks in the rock was revealed.
The above research focused on the microstructural changes of rocks under static mechanics. The authors examined a large number of studies and found no studies on changes in the microstructure of rock material after cyclic dynamic disturbances. As a result of the surrounding rock being subjected to multiple blasting disturbances during practical geotechnical engineering excavation, the nature of the exploded surrounding rock has an important influence on the roadway support. Therefore, it is worth studying the microstructure of the rock material after cyclic dynamic disturbance because the microstructure of the rock material is very important for its macroscopic physical and mechanical properties.
In this paper, a split Hopkinson pressure bar (SHPB, Center South University, Changsha, Hunan province, China) is used to impose cyclic loading on rock material under different axial pre-stresses. When the dynamic load stress is relieved, the characteristic parameters of the P-wave velocity will be used to reflect the dynamic change of rock material microstructure. Using the nuclear magnetic resonance (NMR) technique, the rock material pore volume was statistically and quantitatively analyzed to reveal the microstructural changes.
2. Materials and Methods
2.1. Materials
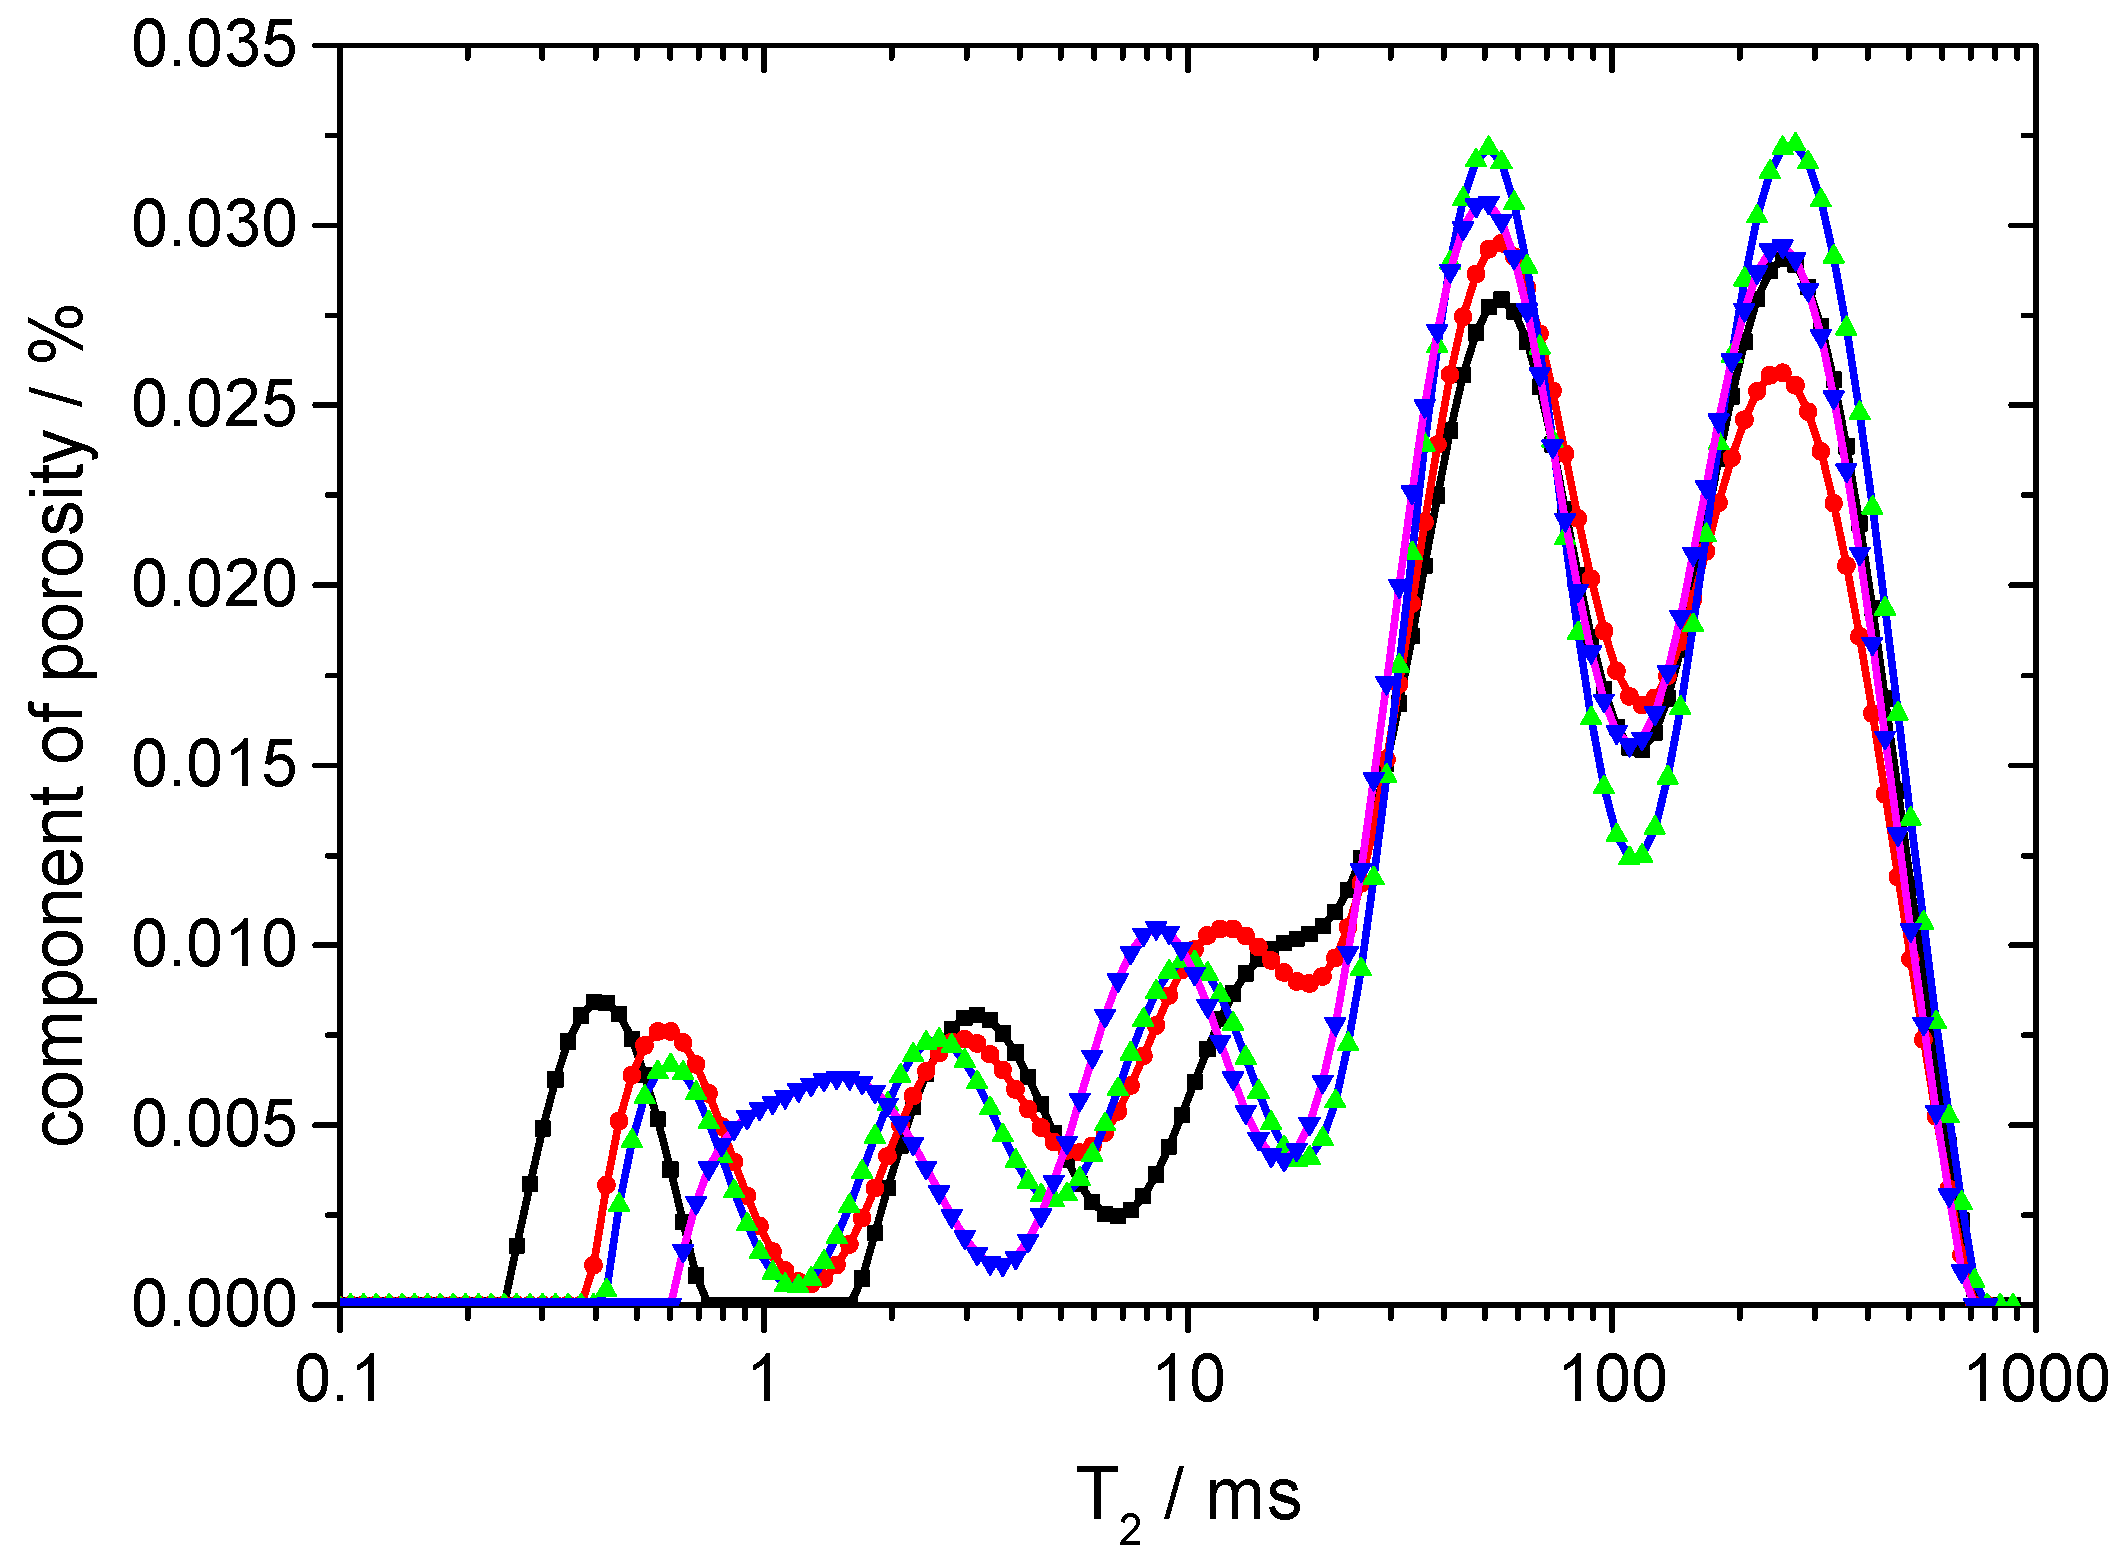
The selected rock samples are granite with medium grain size and massive structure and are relatively dense with no obvious cracks. To ensure the consistency of the tested materials, samples were taken from the same block of rock. The size of the rock specimens is 50 mm × 50 mm, and the nonperpendicularity is less than 0.02 mm. Additionally, the rock sample mass, length, diameter, and P-wave velocity are tested to exclude rocks with large discreteness. The mineralogical composition was determined using X-ray diffraction. The mineral composition is presented in Table 1. The T2 spectrum test results are shown in Figure 1. It can be seen that the trend of each group T2 spectrum is consistent, indicating that the selected rock material internal microstructures are similar.
2.2. Experimental Procedure
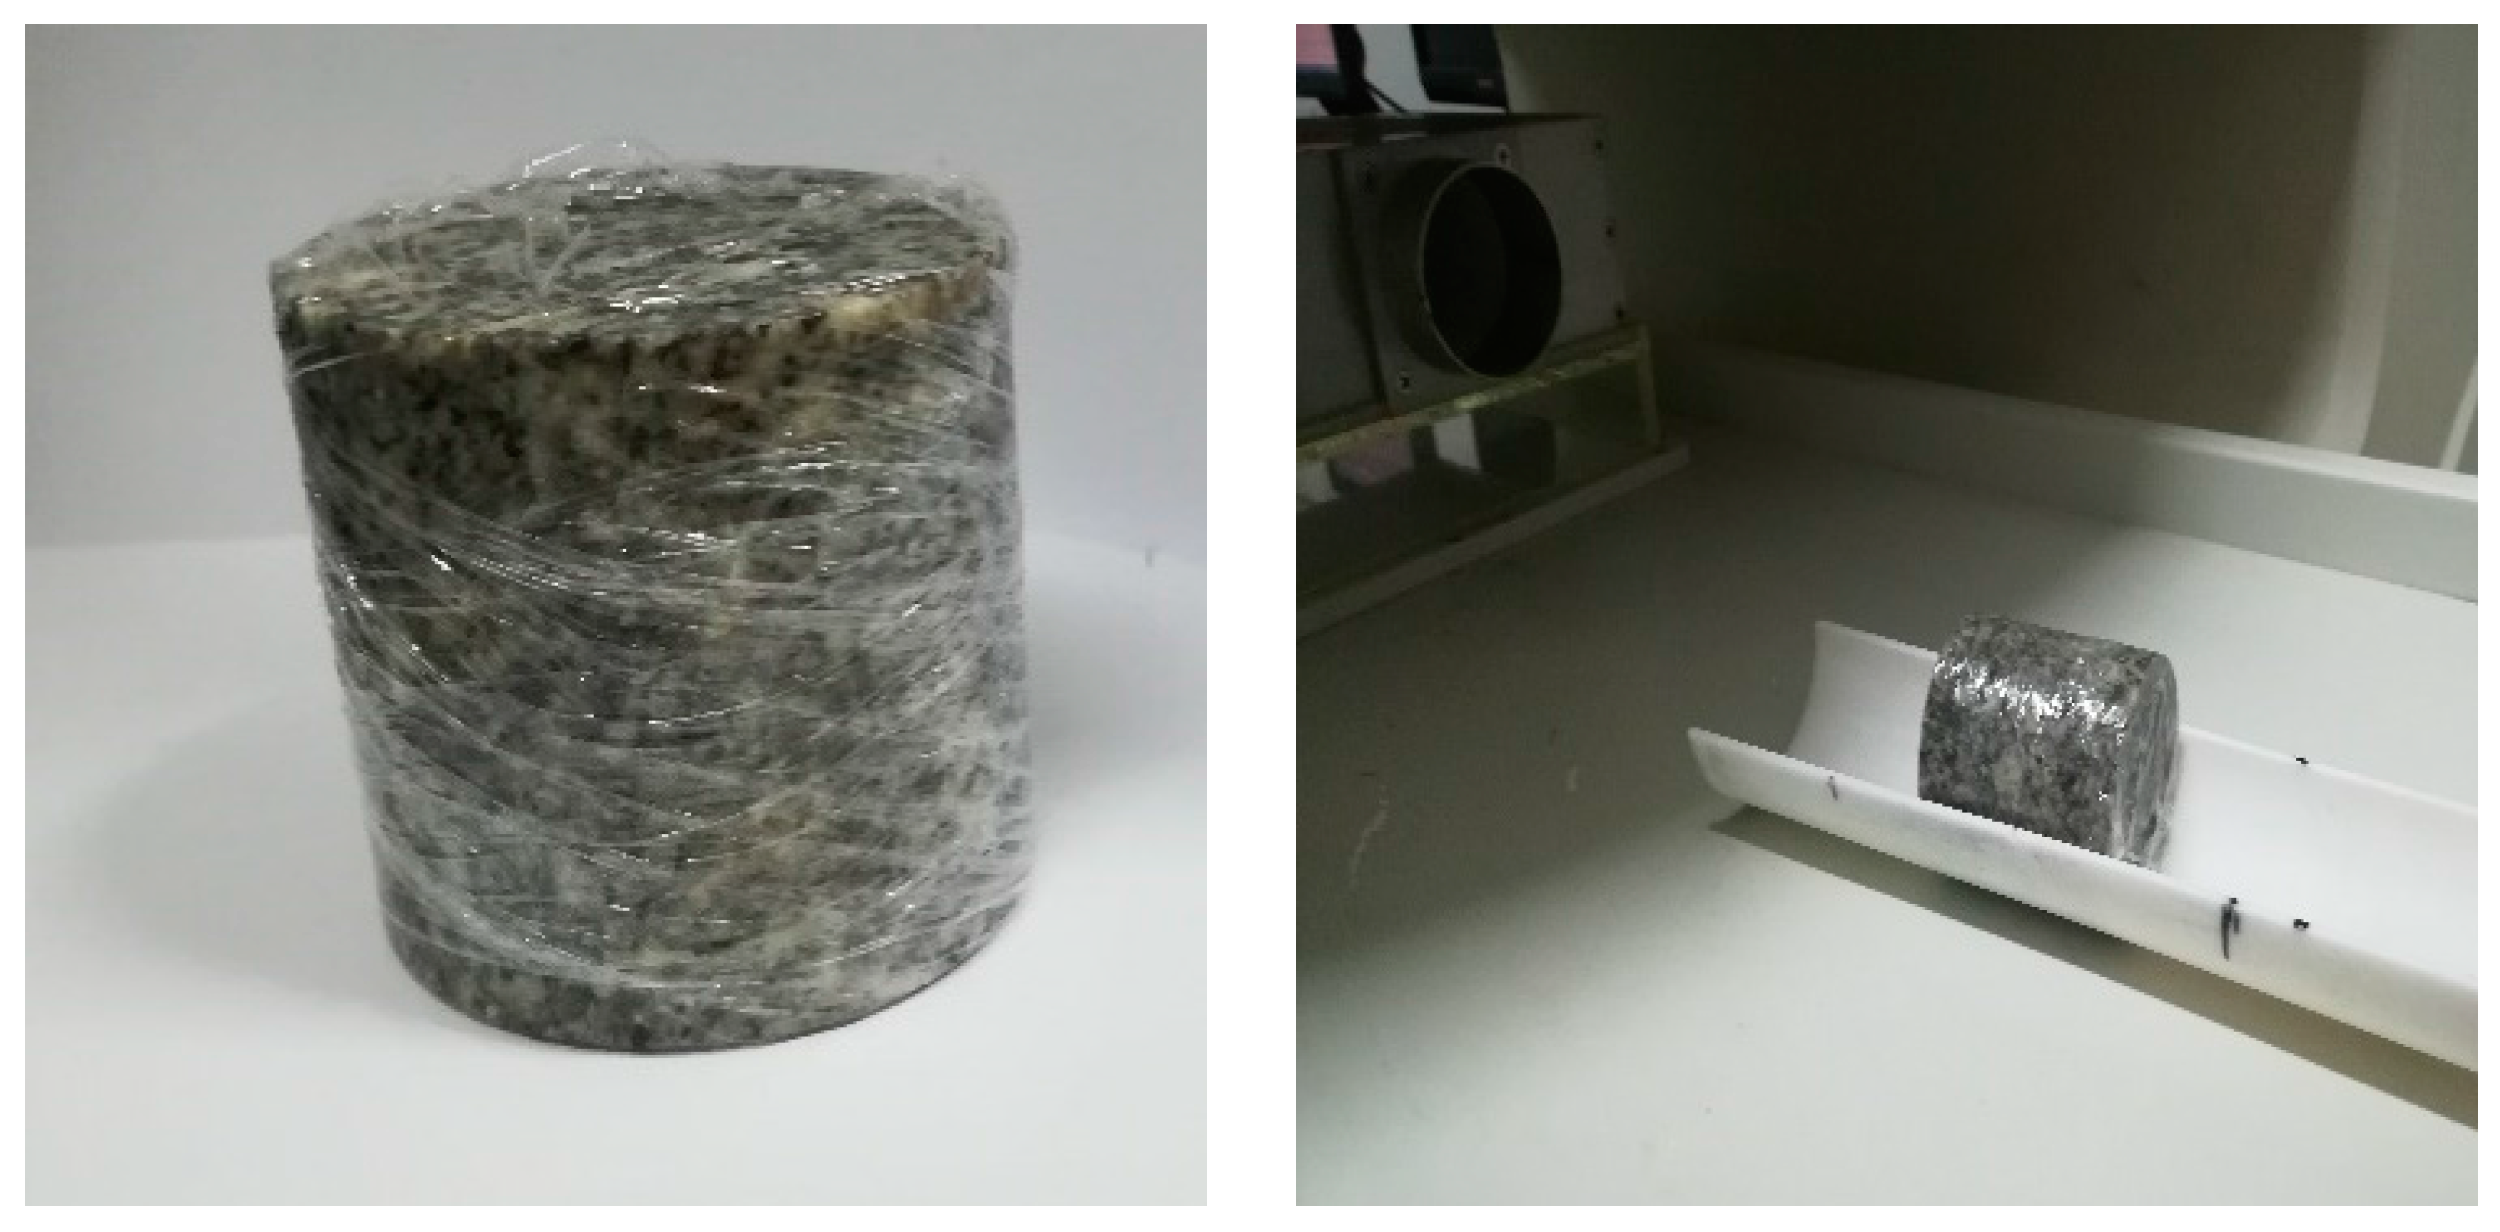
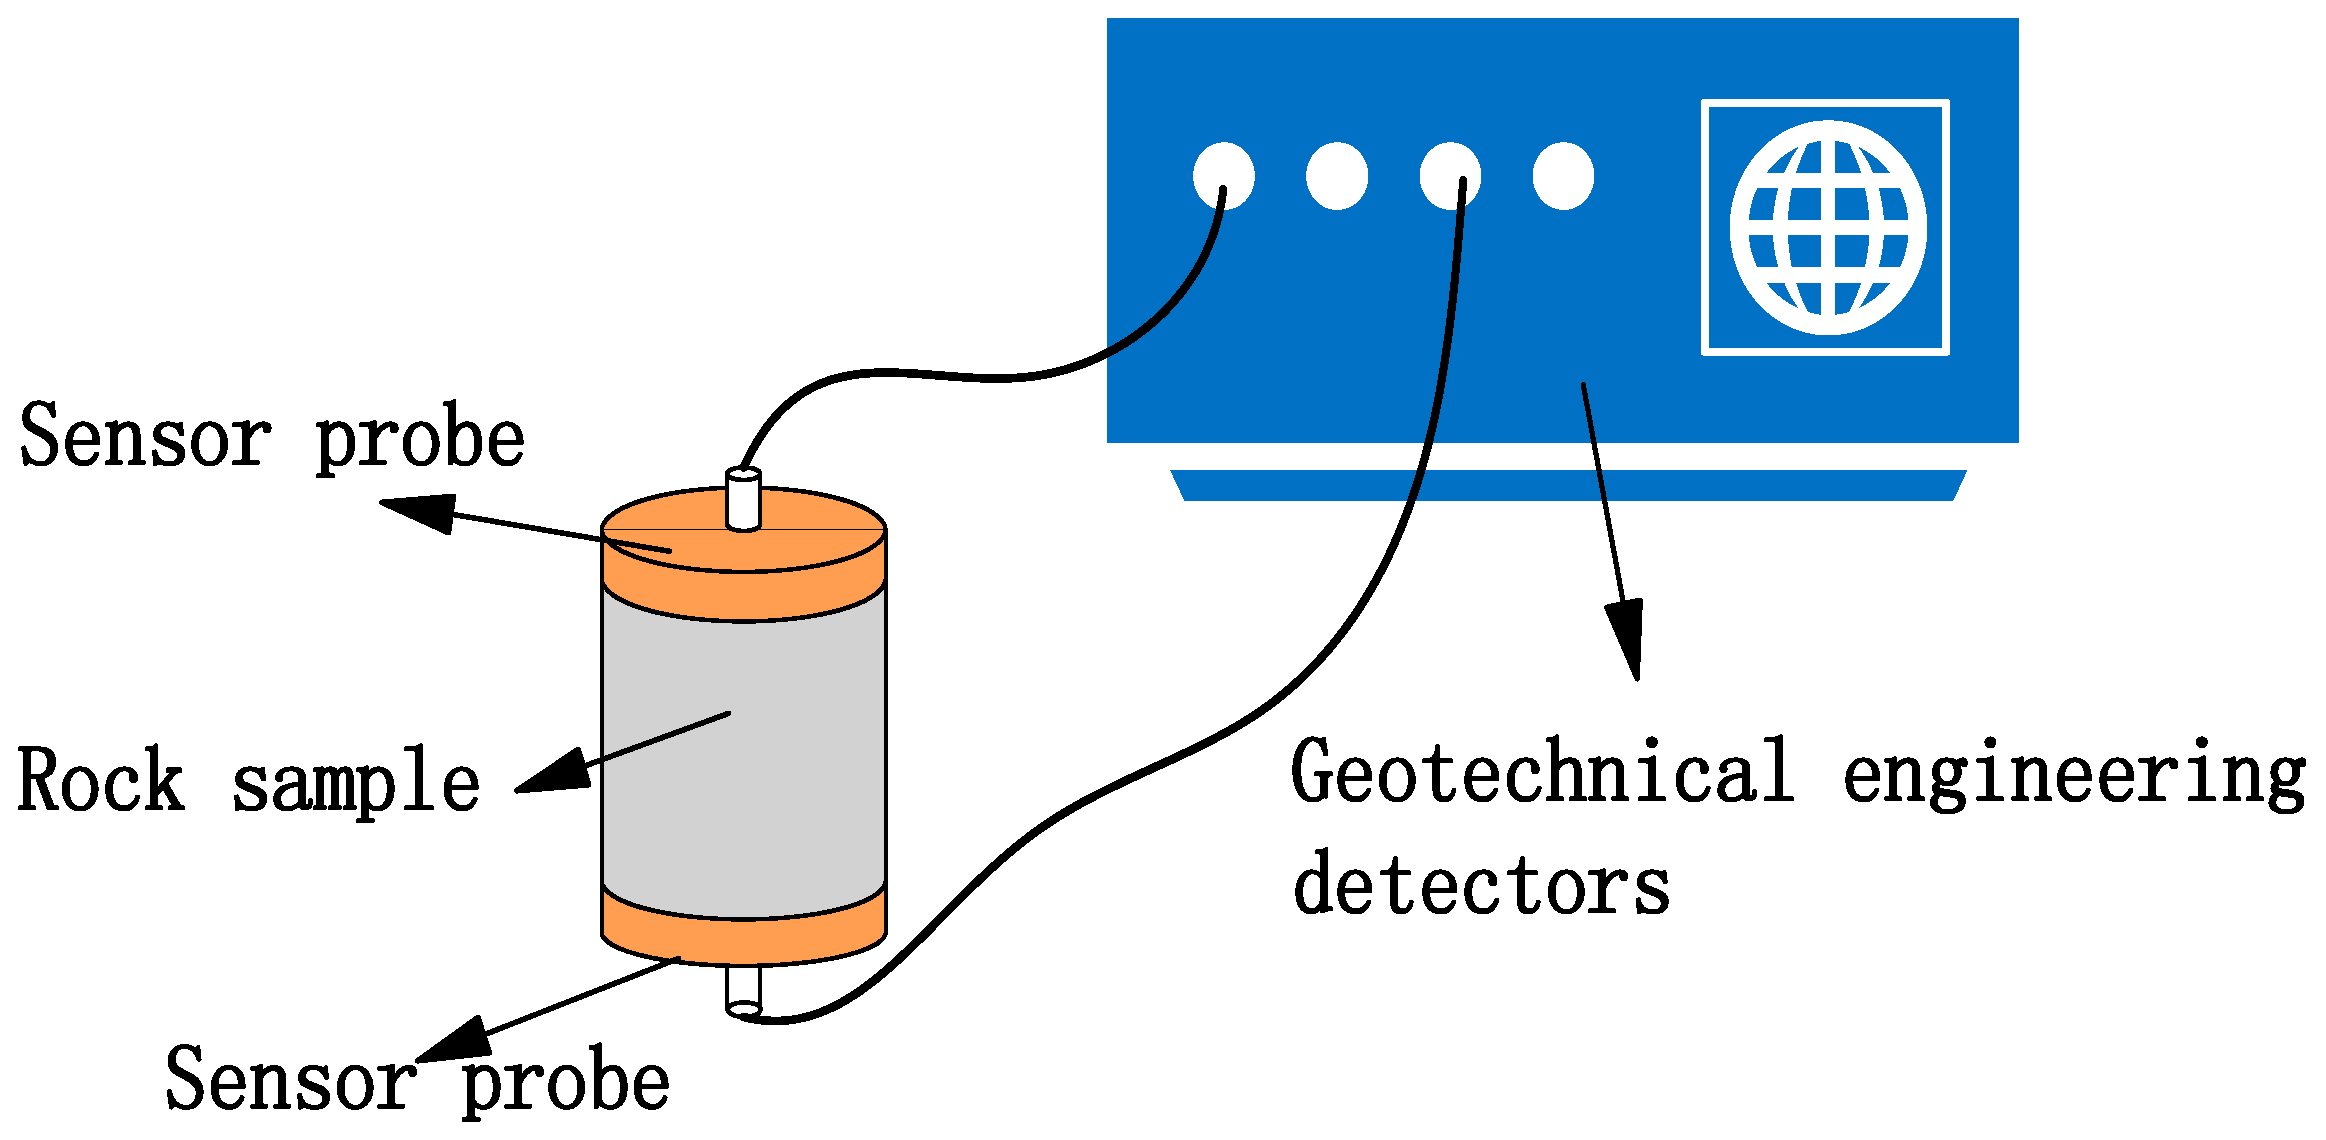
The rock samples were vacuumed and saturated for 12 h and were then soaked in water for 48 h in order to fill the rock material with water. Once a rock sample needs to be measured, it is taken out of water instantly and a wet towel is used to wipe congealed water, and rock samples are then wrapped with plastic wrap instantly to reduce the rock sample’s water vapor (Figure 2). By doing this, the rock sample is kept saturated during the NMR measurements, and this process works for pre- and post-cycling measurements. NMR was used to calculate the pore porosity along with the core’s moisture content (saturated situation) and the core’s volume. To ensure the accuracy of the pore porosity in the tests, a volumetric method was used to measure the sample’s volume to reduce the error caused by the sample’s deformation. Then, NMR tests were carried out to obtain the porosity, T2 spectrum and magnetic resonance images (MRI) of the rock samples. The samples were placed into an oven and dried at 105 °C for 48 h and were then put into a dryer to cool to room temperature. Next, geotechnical engineering detectors were used to test the P-wave velocity of the rock samples.
This was followed by a cyclic dynamic disturbance test. For this study, four different axial pre-stresses, 0 MPa, 10 MPa, 20 MPa, and 30 MPa, were applied, and cyclic dynamic impact was performed 10 times on the rock samples under each kind of axial pre-stress. The appropriate pressure impact was selected for the sample in order to achieve the predetermined number of dynamic impacts. Finally, 0.5 MPa was chosen as the determined impact pressure through repeated tests. After the dynamic disturbance was completed, the P-wave velocity was measured every 5 min until it did not change for 2 h, when it was then considered to have tended to a constant. Finally, to determine the microstructural changes of the samples after the dynamic disturbance, the NMR test was carried out again to obtain the T2 spectrum and magnetic resonance images. The samples were water saturated for the NMR analysis after the test. The loading direction of the P-wave velocity measurement is shown in Figure 3.
2.3. Test Mechanism
2.3.1. MRI Test
The MRI test was selected for the MiniMR-60 system (NIUMAG, Shanghai, China), and its main parameters are as follows: the main magnetic field is 0.51 Tesla, the proton resonance frequency is 21.7 MHz, the magnet temperature is 25–35 °C, the magnet uniformity is 12.0 MHz, and the RF power is 300 W. The pulses were used to obtain relaxation data and images for this test, as shown in Table 2.
TW is wait time, RG1 is analog gain, DRG1 is digital gain, TD is signal acquisition points, NECH is the number of echoes, TE is echo time, and NS is the number of repeated samples.
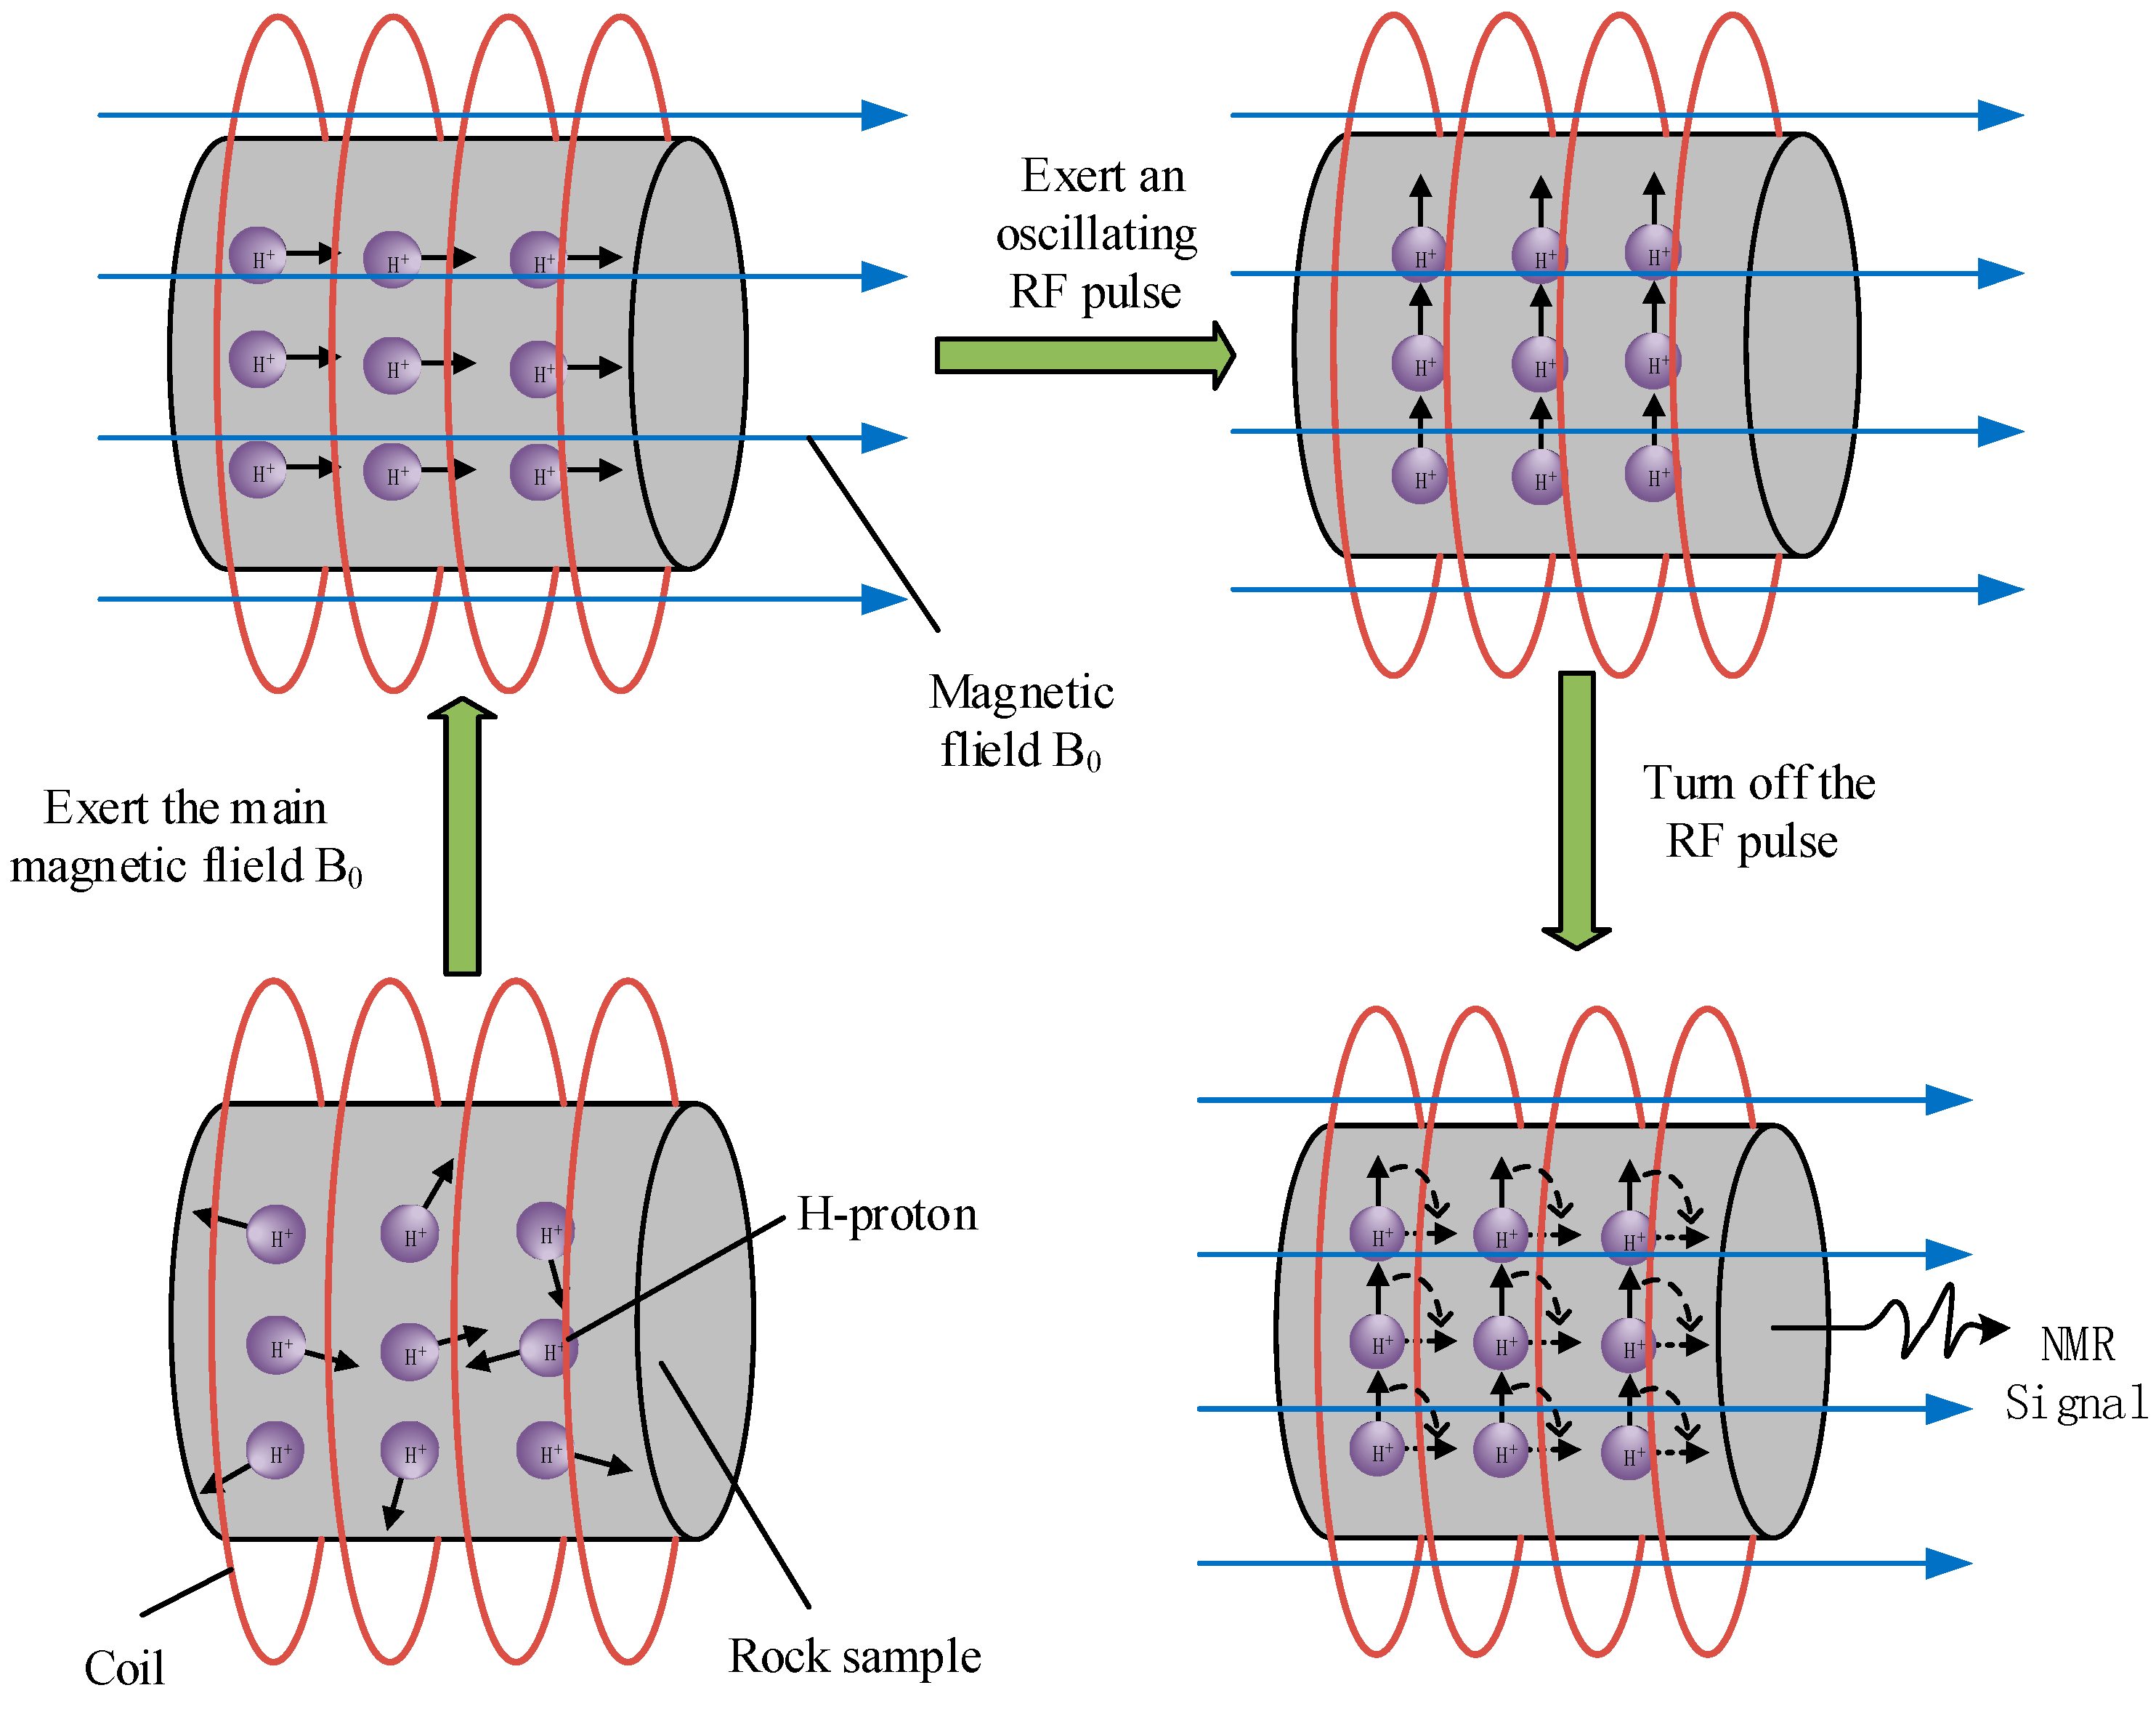
Figure 4 illustrates the MRI test mechanism: The specimen is placed within the MiniMR-60 system, at which time, no magnetic field surrounds the rock specimen, and the H-protons’ pole axes are in random directions. When the main magnetic field B0 is exerted around the rock sample, the direction of the H-proton pole is consistent with the magnetic field. Next, the NMR instrument generates a specific angle (Figure 3 is a schematic of 90°) of the oscillating radio frequency (RF) pulse temporarily, which matches the H-proton precession frequency and pushes the H-proton rollover. Finally, the RF pulse is turned off, the energy is released, and the directions of H-protons’ pole axes gradually recover to their initial state. During this process, a transient oscillating current called the NMR signal is generated and measured by a receiver. According to the received signal, the position information of the water molecule contained in the specimen can be decoded and transferred into the nuclear magnetic resonance images to obtain water distribution of the specimen, and the pore distribution information of the rock sample is then obtained.
2.3.2. T2 Spectrum Test
The T2 is a time constant describing decay of the transverse component of magnetization. According to nuclear magnetic resonance theory, the transverse relaxation rate of nuclear magnetic resonance can be expressed as the following equation [13]:
where is the relaxation time of fluid, is the transverse surface relaxation strength, is the pore surface area, is the pore volume, is the transverse surface relaxation rate, is the diffusion coefficient, is the gyromagnetic ratio, is the gradient of the magnetic field, is the echo time, and is the diffusion relaxation rate.
In this study, there is only one type of fluid (water) in the pores, and the volume relaxation is much slower than that of the area, so is neglected. When the magnetic field is even (corresponding to the magnetic field gradient G being very small) and the adopted is short, the diffusion relaxation can also be ignored. Therefore, Equation (1) can be simplified as:
From Equation (2), the rate of transverse relaxation depends on the surface-to-volume ratio of the pores. Thus, the T2 distribution reflects the pore size information: the smaller the T2 value is, the smaller the pore size, and the larger the T2 value is, the larger the pore size. Additionally, a T2 value less than 10 ms is considered to correspond to a small pore, and values larger than 10 ms can be considered to correspond to large pores [14].
2.3.3. SHPB Test
The test was conducted using an SHPB system as described by Li et al. [15,16,17]. This system is shown schematically in Figure 5. The apparatus includes three bars: an incident bar, a transmitted bar, and a momentum bar. In addition, it also contains a striker and a momentum trap. They were all composed of 40 Cr alloy steel with a density of 7810 kg/m3. A sample was sandwiched between the incident bar and the transmitted bar, and after the test setup with the sample was ready, the striker was launched by a high-speed gas gun. A longitudinal compressive pulse was induced when the striker bar impacted on the free end of the incident bar. In the sample, the incident pulse () was partly reflected () and partly transmitted (). The loading forces P1 and P2 on the two ends of the sample can be determined by the following formula:
Here, is the strain, and E and A are the Young’s modulus and the cross-sectional area of the bar, respectively.
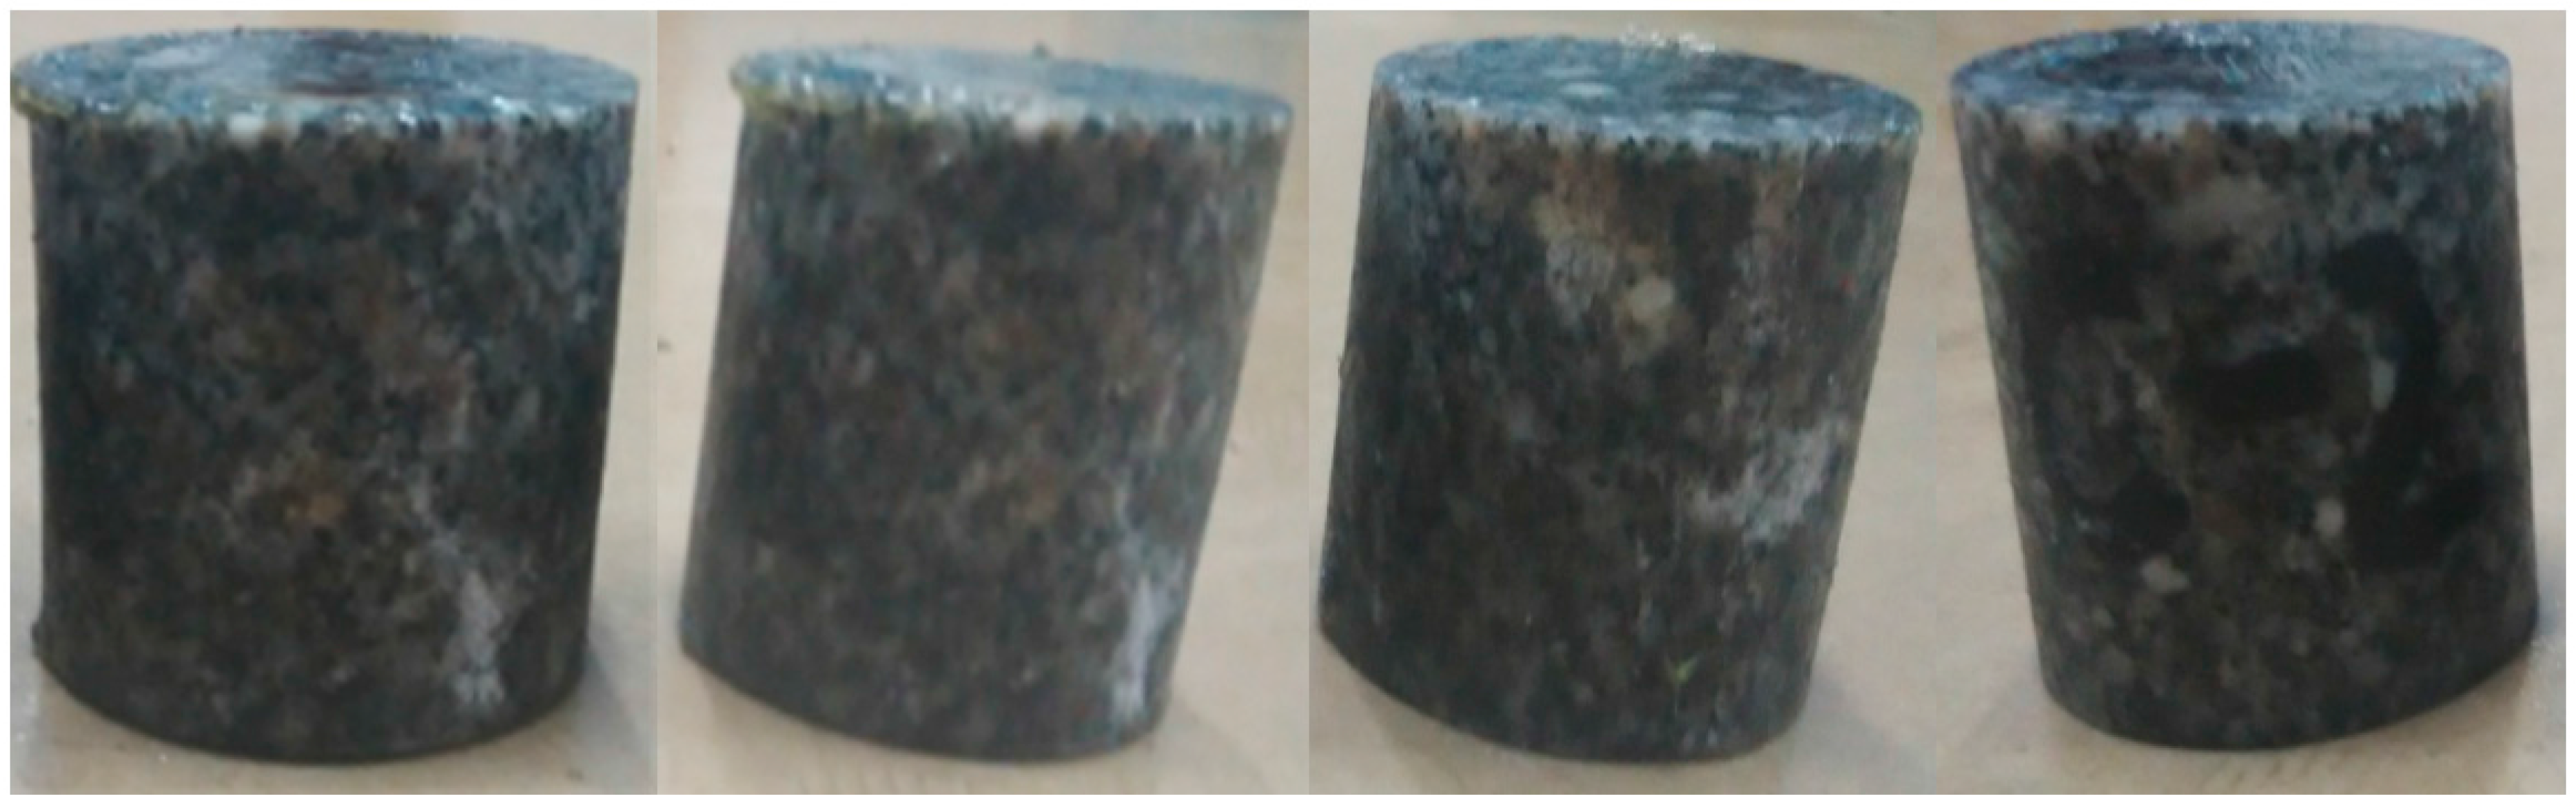
The rock samples after the cycle dynamic impact test are shown in Figure 6.
3. Results and Discussion
3.1. The P-Wave Rebound Phenomenon
The pore structure of rock is sensitive to the time when stress is released; therefore, the best time to test will be missed if the measurement is cumbersome. Combined with the above research [10,11,12], in this study, the P-wave velocity is chosen as the characteristic parameter of the pore structure because acoustic detection has the advantages of fast speed and no damage to the samples.
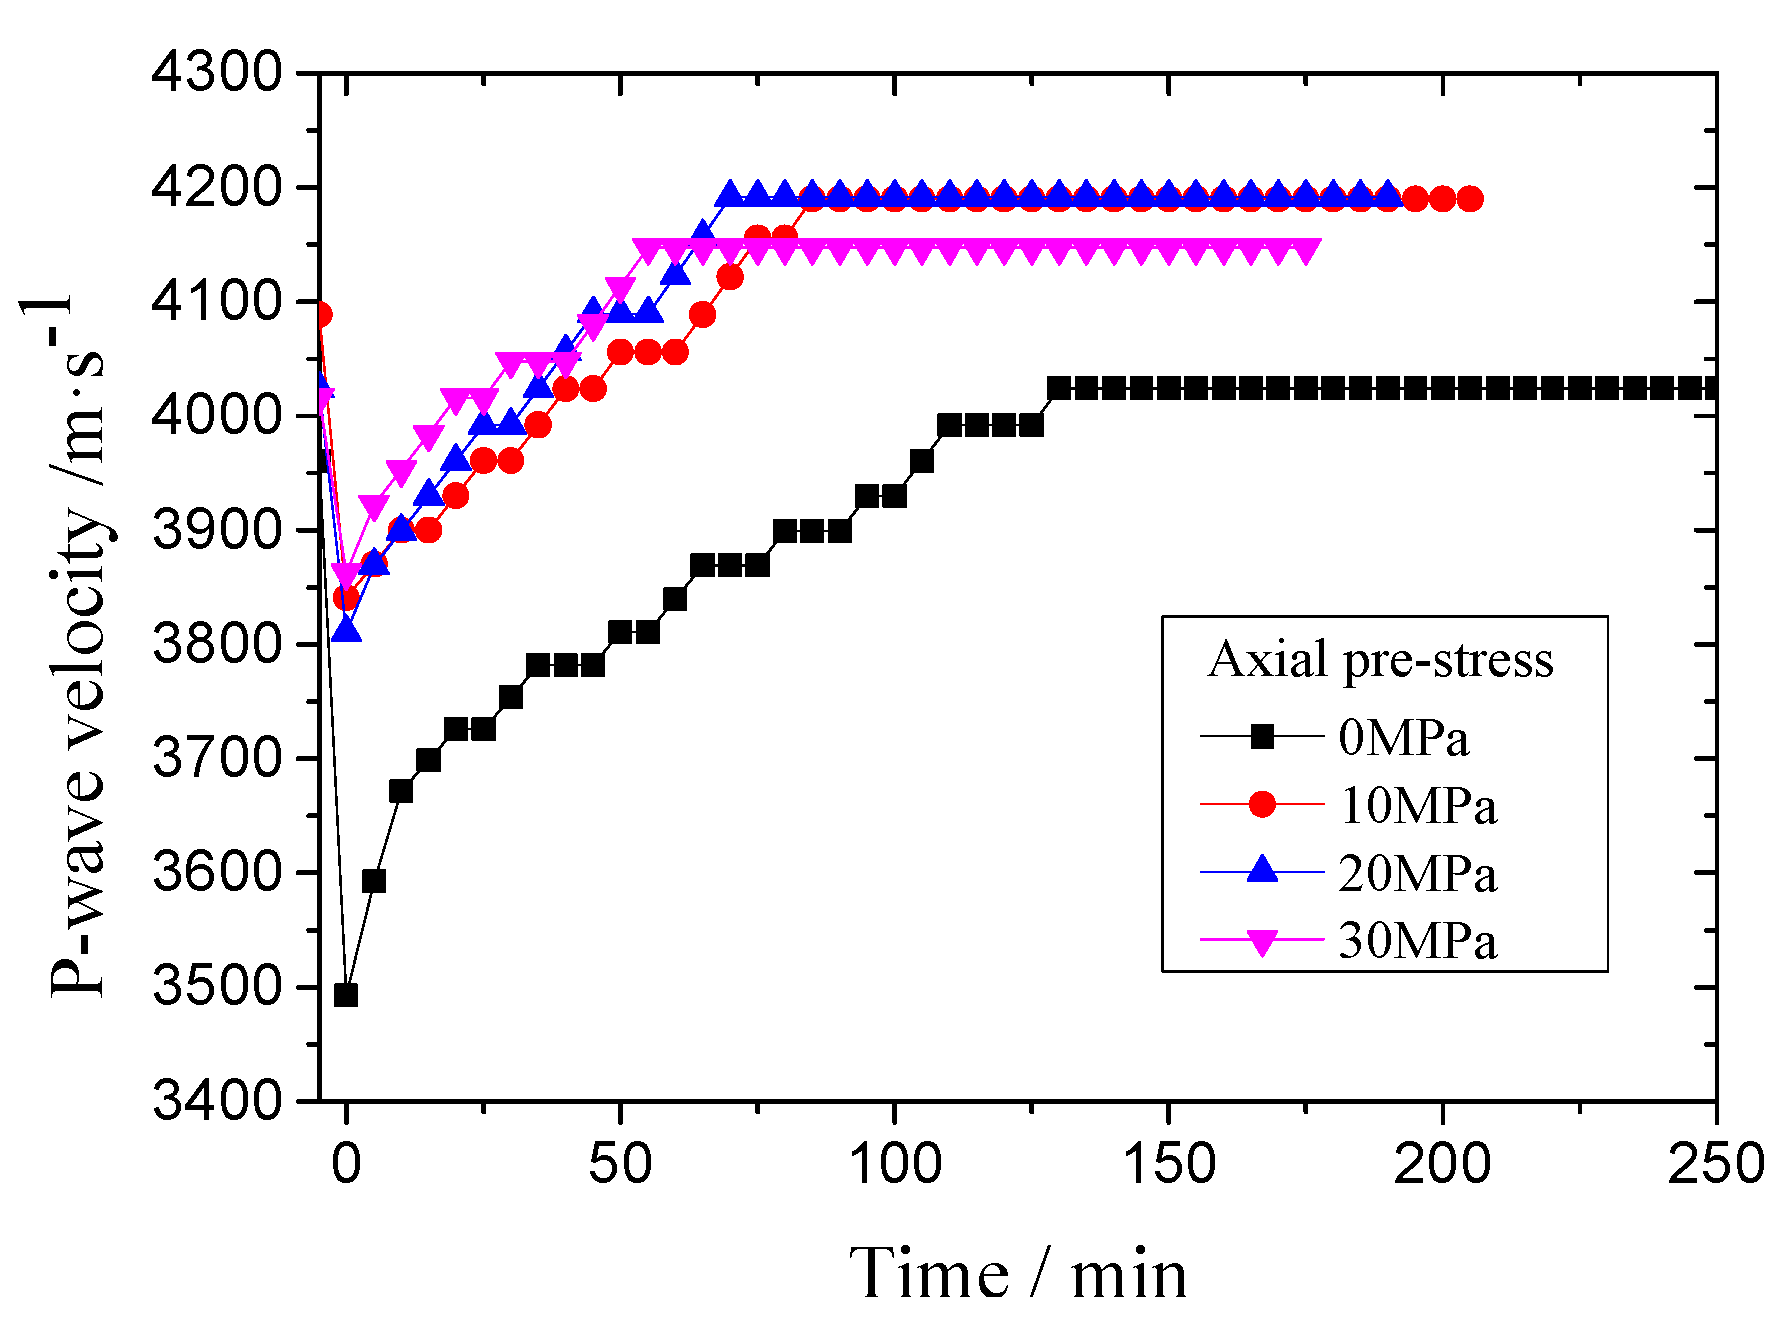
The pore structure changes with time as shown in Figure 7; three distinct characteristics are displayed, which are here described as follows:
- (a)
- The P-wave velocity first decreases and then increases with time after removing the samples from the SHPB device. In addition, the P-wave velocity is sensitive to the time effect at the initial stage of the curve.
- (b)
- When the axial pre-stress is 0 MPa, the P-wave velocity decreases by 468 m/s, the steepest declining trend is shown, and it reaches 11.8% compared to the velocity before the test. The P-wave velocities of the other samples declined by 6.1%, 5.3%, and 3.8%.
- (c)
- The P-wave velocity can rebound to the initial velocity and can even become much greater than it. The growth rates are 1.60%, 2.50%, 3.31%, and 3.28%.
Compared with the measured porosity values before and after the experiment, it can be concluded from Table 3 that the four groups of rock sample porosities are decreased and that the decline was consistent, which indicates that rock material is compacted after cyclic dynamic disturbance. However, the P-wave velocity decreases as soon as the cyclic dynamic disturbance ends. This is an interesting phenomenon that seems contrary to common sense but did occur. The reasons for this phenomenon are as follows.
First, a geological concept that should be understood is the aspect of pores. For nearly ellipsoid pores, the aspect of the pores is the ratio of the short axis and long axis. Quartz glass and ignimbrite mainly consist of nearly circular pores, while granite has nearly ellipsoid pores [18]. For the ellipsoidal structure of pores, the aspect ratio directly affects the P-wave velocity [19]. In terms of the rock material, the P-wave velocity is closely related to the porosity and the pore shape; for the specific pore shape of the rock, the P-wave velocity decreases with the increase of porosity. In addition, when the porosity is constant, the P-wave velocity decreases with the decrease in the aspect ratio, especially when the porosity is small, and the pore shape has a great influence on the aspect ratio of the pore [12,20,21].
For (a) shown above: At the end of the test, the internal rock material was compacted, the porosity was decreased, and the P-wave velocity of the rock did not increase but decreased. According to previous studies of the aspect ratio of the pore, it can be concluded that the aspect of pores changed after the test. Consequently, for the test of the dense granite, porosity is not the primary factor that influences the change of the P-wave velocity; the effect of the pore aspect ratio is greater. The following is a detailed analysis of the characteristics of (a): On the one hand, large crack closure is driven by the dynamic load, and the aspect ratio decreases. On the other hand, the stress wave will be reflected on the surface of the crack as a tensile wave, leading to the occurrence of new cracks. For the dense granite, the expansion of the new cracks are thin cracks, and the aspect ratio is relatively small [5]; thus, the P-wave velocity decreases when the test has just ended. In addition, the test load of axial pre-stress is less than 70% of the static compressive strength. For rock material, this load range is in the elastic deformation stage, and the cracks have not extended to the nucleation and aggregation stages [14], which indicates that the process is partly reversible and shows the rebound phenomenon of the P-wave velocity.
For (b) shown above: When the axial pre-stress is not applied, the dynamic load stress wave will be reflected on the surface as a tensile wave, driving crack expansion and resulting in a large number of new pores [14]. Therefore, under this condition, the aspect ratio will be reduced dramatically, and the decrease of the P-wave velocity is the largest. In the elastic deformation stage, when axial pre-stress is present, the crack gap will tend to close, and the larger the axial pressure is, the higher the degree of closure becomes. The tensile wave generated by the action of the dynamic load on the surface of the crack weakens, resulting in the decrease of the small pores. Thus, the aspect of pores decreasing the amplitude is smaller than the case without pre-axial pressures, and the decreasing amplitude of the P-wave velocity reduces gradually.
For (c) shown above: the results indicate that, as time elapses, some of the small pores slowly shrink and then close, while some of the large pores rebound. Both cause an increase in the aspect ratio, so the P-wave velocity will continue to rebound largely. During the entire test process, the porosity of rock samples is reduced and the rock is compacted, which makes the final P-wave velocity larger than that before the test.
In accordance with the above analysis, the phenomenon of P-wave velocity rebound after cyclic dynamic disturbance in this research is caused by the aspect ratio variation.
3.2. Magnetic Resonance Images (MRI)
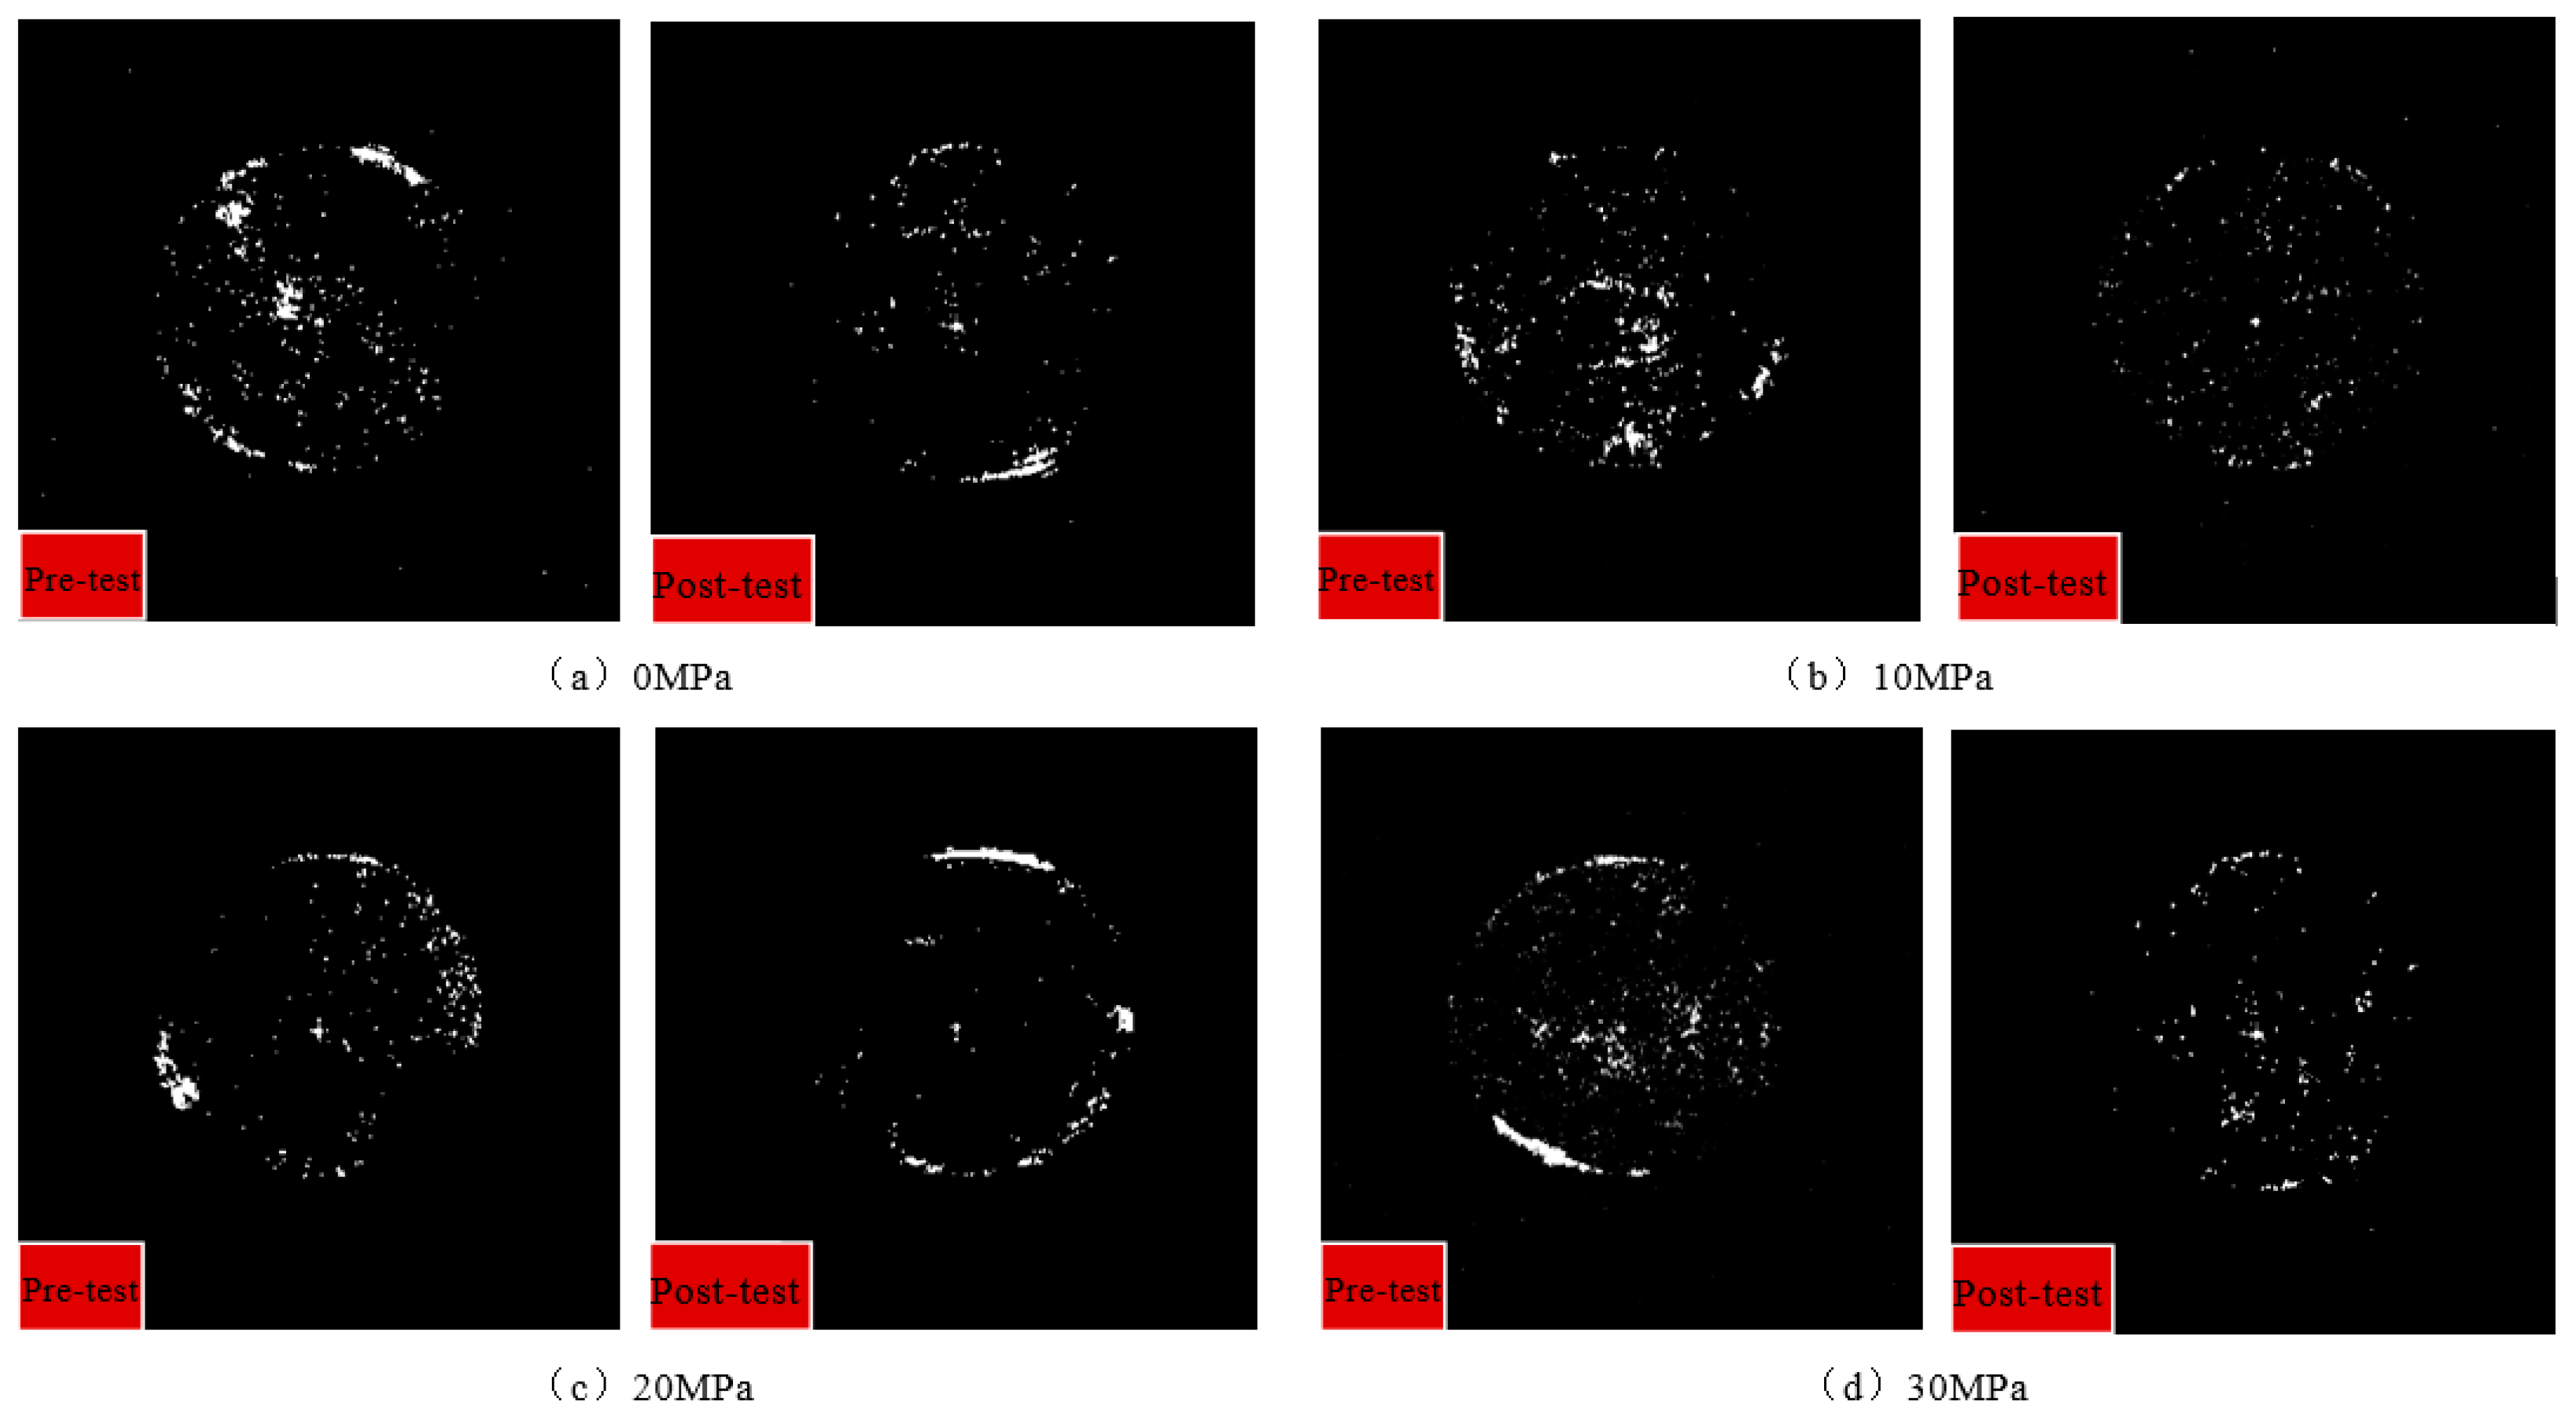
In this study, after rock samples were subjected to the cyclic impact loadings, 2D MRI images were obtained, shown in Figure 8. The locations of fluid within rocks are shown as light spots in the MRI, and the fluid content of samples is reflected by the brightness of light spots. The brighter and larger the light spots are, the higher the fluid content is, which means that the pores are more abundant and larger. It is worth noting that Figure 8 appears to show significant water saturations occurring at the edges of the core. These areas do not represent the core’s microstructure, and the reasons are as follows.
In order to ensure that the rock samples is in a saturated state during the MRI test, the saturated samples are wrapped with plastic wrap to reduce water vapor; despite these precautions, a small amount of water still evaporated, and this evaporated water condensed on the wrap. In the following MRI test, the moisture that condenses on the wrap is shown in the form of high water content rings in Figure 8.
As shown in Figure 8, the number of light spots inside core decreases and the brightness of the spots darkens. This indicates that the content of water in the rock samples is reduced, resulting in the decrease of the signal intensity, and the overall porosity of the rock sample decreases after the cyclic impact loading treatment. In addition, the four groups of specimens have the same phenomenon, indicating that, even within the elastic limit, when subjected to dynamic impact loading, the internal structural deformation of the rock materials is irreversible.
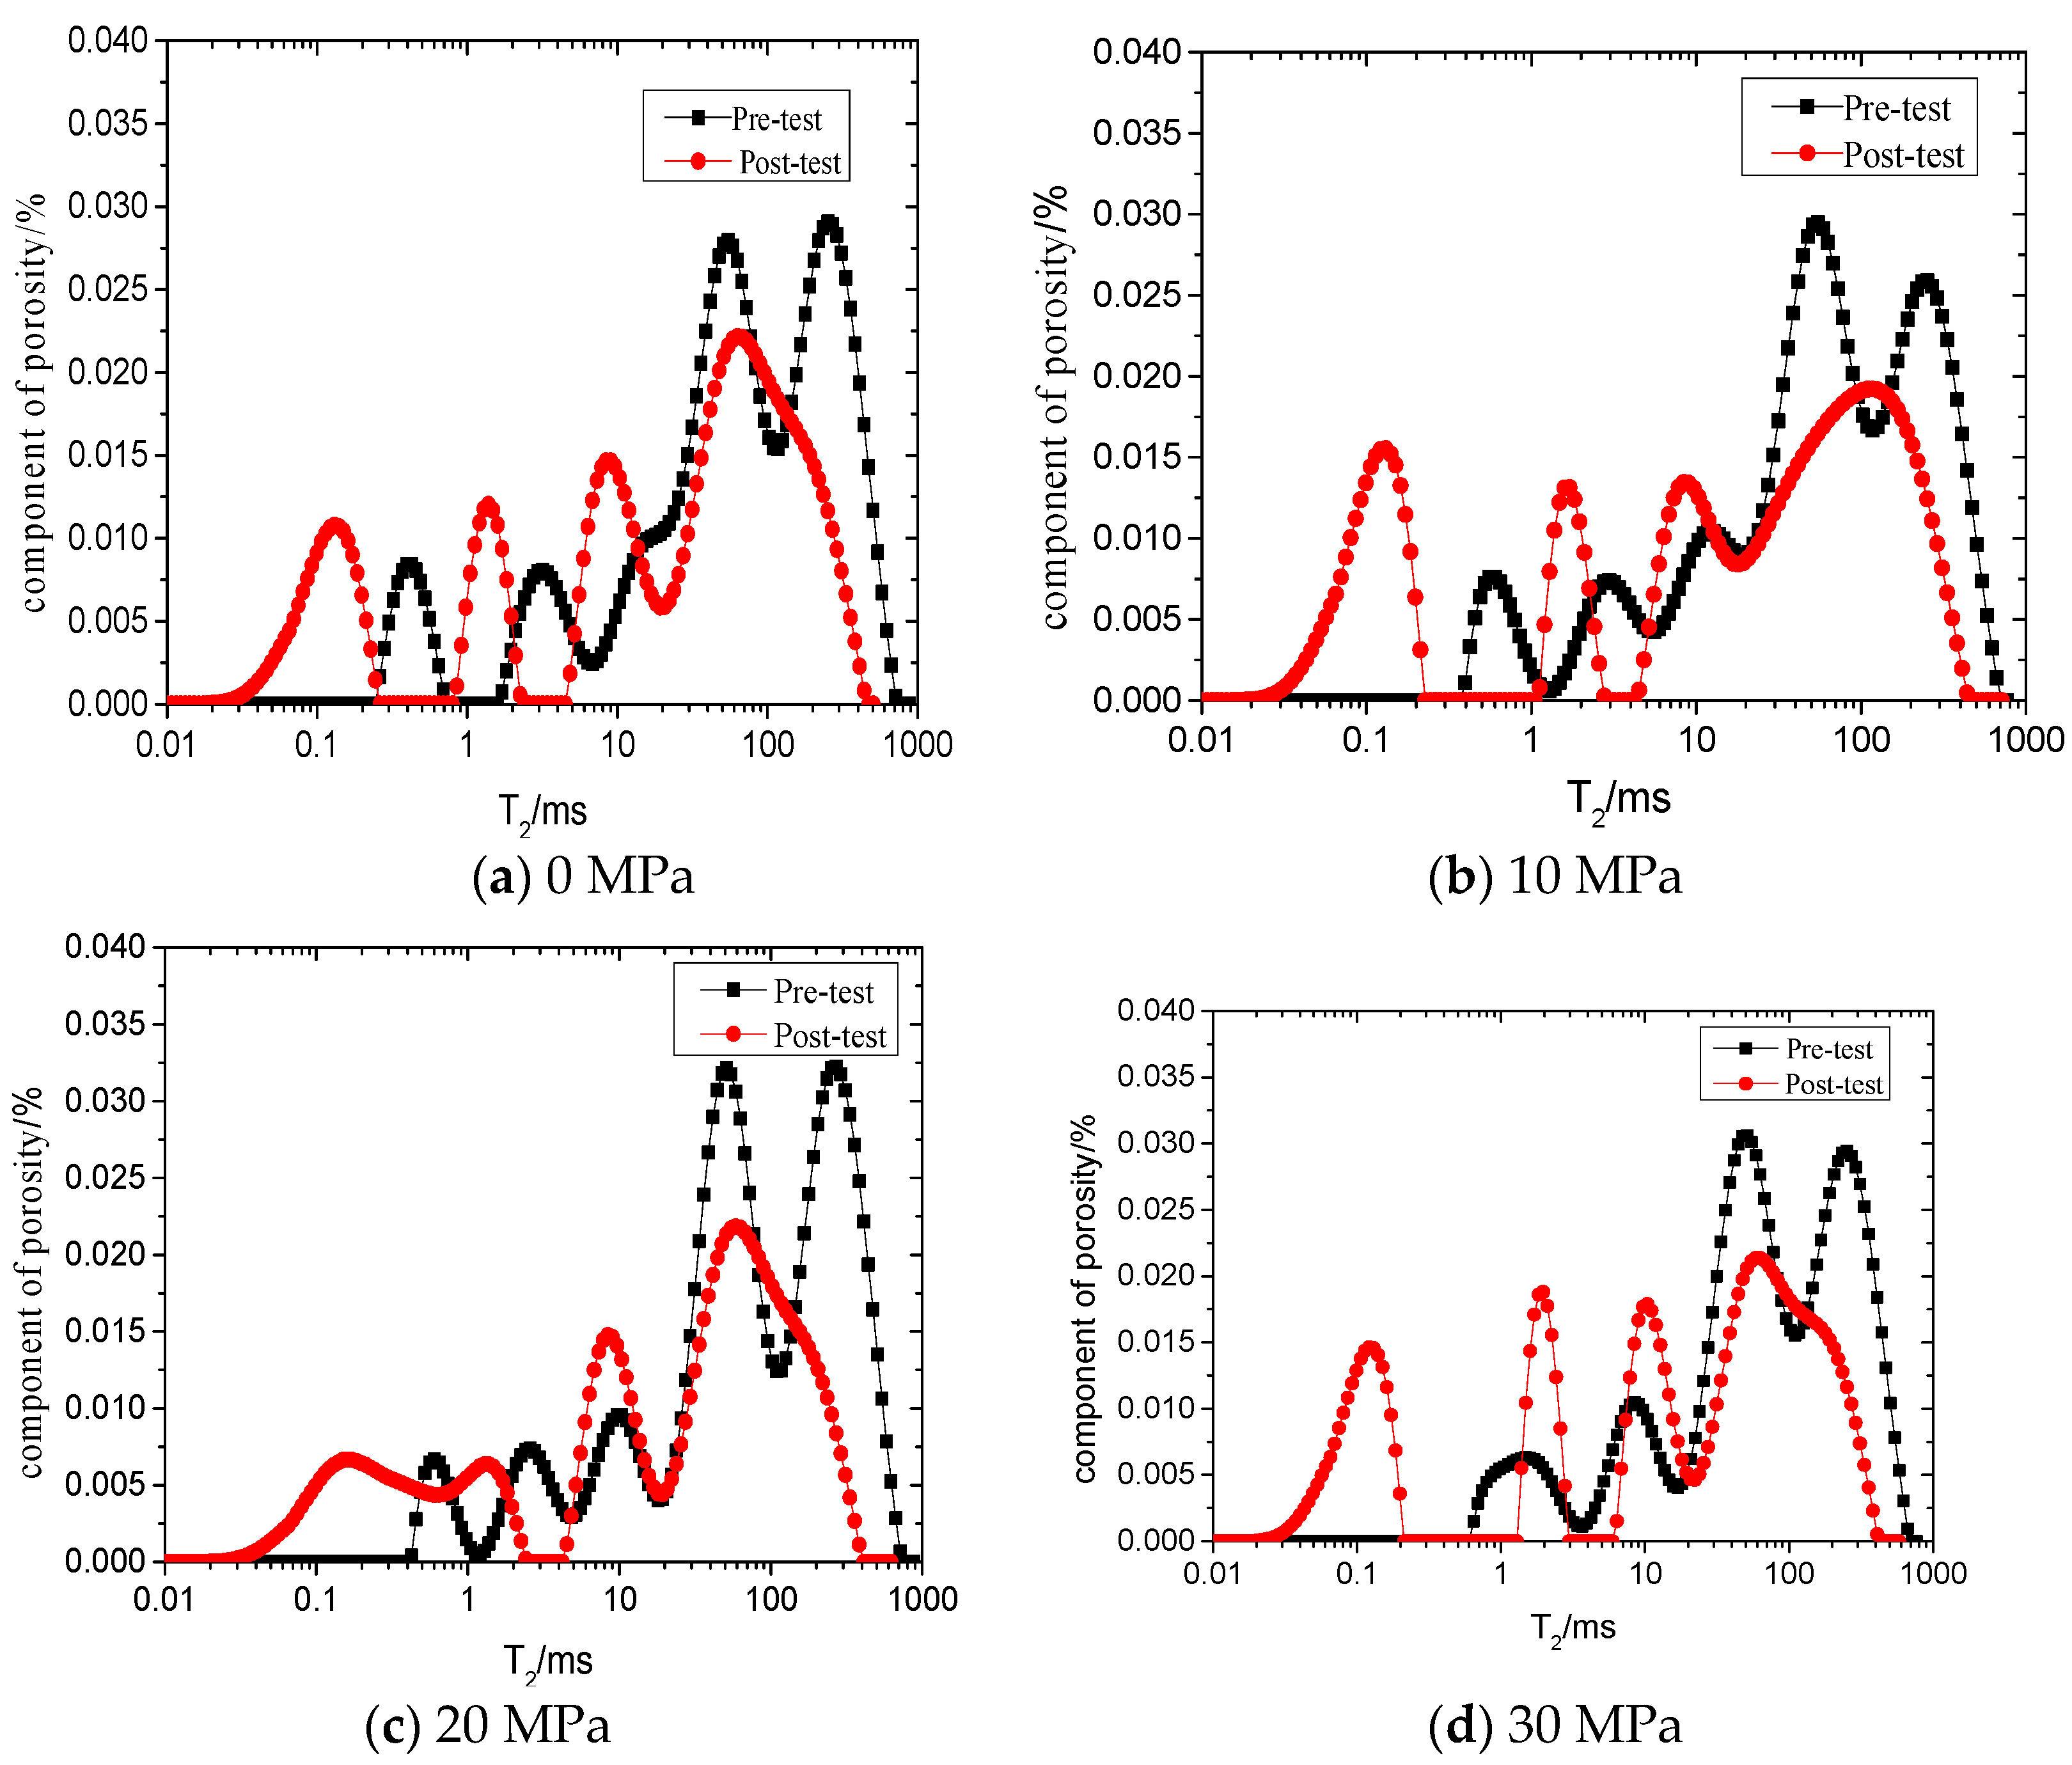
3.3. T2 Spectrum
To quantitatively study the microstructure of granite before and after the cyclic dynamic disturbance, the T2 spectrum was tested by NMR. The T2 spectrum distribution of granite under different axial pre-stresses is shown in Figure 9. There are similar changes in the microstructure of the rock samples under different axial pre-stresses before and after the experiment. First, there are two larger peaks of T2 before the test. Finally, they merged to form a peak that became small and moved to the left. This indicates that both the large pore size and quantity were reduced. In addition, the T2 value of relaxation time under different axial pre-stresses was shortened after the cyclic dynamic disturbance, which indicates that the size of small pores decreased and the quantity increased. The above analysis results are in good agreement with those obtained in the analysis of the curve in Figure 7. Thus, the reason for the increase of small pores can be explained as follows: first, larger pores under the impact effect will close or reduce. Second, when the stress wave reflects at the micro-cracked surface, a tensile wave will be produced, which causes the small pores to expand.
To analyze the change of the quantity of large pores and small pores before and after the cyclic impact, the author compiled statistics on the spectrum area of the T2 curve. Each of the large pore and small pore amounts accounting for the total pore volume ratios are shown in Table 4.
In Table 4, the small pores increased from 15–18% to 36–38%, while the larger pores decreased from 82–85% to 61–64%, which indicates that, with increasing axial pre-stress, the quantity of larger pores and small pores does not obviously change. There are two reasons for the above results. One is that the rock sample subjected to axial pre-stress is far below the static load conditions of the compressive strength of 70%, which is in the elastic stage. Additionally, the dynamic load of the rock sample is relatively small, so the impact strength of the sample does not cause large-scale and macroscopic cracks. These two factors lead to the large pores and small pores, each accounting for the total pore volume ratio rebounding to a stationary value. In addition, although the experiment did not cause the rock to produce a large macro-crack, its internal pore structure is changed and compacted, which caused internal damage of rock materials.
4. Conclusions
In this paper, with the aid of an NMR system, experimental studies of the time-varying characteristics of granite microstructures have been carried out using an SHPB. At the elastic deformation phase of the rock material, the P-wave velocity rebounds with time after the rock material suffers from cyclic dynamic disturbance. Through analysis, it is found that the change of the aspect ratio of pores led to this phenomenon. Additionally, when the dynamic load is released, the P-wave velocity of the rock material decreases. The reason for this phenomenon is that the rock material was compacted and that the porosity and pore aspect ratio both decreased, rather than the porosity increasing after cyclic dynamic disturbance. After the time-varying effect was terminated, the microstructure in the rock interior significantly changed. The number and size of large pores decreased, and the number and size of small pores increased. This kind of change cannot be fully recovered even in the elastic deformation stage of the rock material.
Acknowledgments
The present work was funded by the National Science Foundation of China (51474252), the National Natural Science Foundation of China Youth Fund (41502327), and the Special Funds for Basic Research of Central South University (2017zzts190, 2016zzts095, 2015zzts080). This support is gratefully acknowledged. The authors are grateful to the reviewers for the discerning comments on this paper.
Author Contributions
Chuanju Liu and Hongwei Deng conceived and designed the experiments; Yuan Wang and Yun Lin and performed the experiments; Hongwei Deng and Chuanju Liu analyzed the data; Huatao Zhao provided materials; Chuanju Liu wrote the paper; Hongwei Deng revised the paper.
Conflicts of Interest
The authors declare no conflict of interest.
References
- Lindqvist, J.E.; Åkesson, U.; Malaga, K. Microstructure and functional properties of rock materials. Mater. Charact. 2007, 58, 1183–1188. [Google Scholar] [CrossRef]
- Johansson, E. Technological Properties of Rock Aggregates. Ph.D. Thesis, Luleå University of Technology, Luleå, Sweden, 2011. [Google Scholar]
- Hztzor, Y.H.; Zur, A.; Mimran, Y. Microstructure effects on microcracking and brittle failure of dolomites. Tectonophysics 1997, 281, 141–161. [Google Scholar] [CrossRef]
- Tuğrul, A.; Zarif, I.H. Correlation of mineralogical and textural characteristics with engineering properties of selected granitic rocks from Turkey. Eng. Geol. 1999, 51, 303–317. [Google Scholar] [CrossRef]
- Ods, S.; Li, S.G. The shape distribution of the cracks produced in the rock under uniaxial compressive stress. Glob. Geol. 1989, 4, 177–180. [Google Scholar]
- Yue, Z.Q.; Chen, S.; Zheng, H.; Tham, L.G. Digital image proceeding based on finite element method for geomaterials. Chin. J. Rock Mech. Eng. 2004, 23, 889–897. [Google Scholar]
- Chen, S.; Yue, Z.Q.; Tan, G.H. Digital image based numerical modeling method for heterogeneous geomaterial. Chin. J. Geotech. Eng. 2005, 27, 956–964. [Google Scholar]
- Yue, Z.Q.; Chen, S.; Thaml, L.G. Finite element modeling of geomaterials using digital image processing. Comput. Geotech. 2003, 30, 375–397. [Google Scholar] [CrossRef]
- Prikryl, R. Some microstructure aspects of strength variation in rocks. Int. J. Rock Mech. Min. 2001, 38, 671–682. [Google Scholar] [CrossRef]
- Rune, M.H. Petrophysics Under Stress. In Proceedings of the 6th Nordic Symposium on Petrophysics, Trondheim, Norway, 15–16 May 2001. [Google Scholar]
- Fjaer, E.; Holt, R.M. Stress and Stress Release Effects on Acoustic Velocities from Cores, Logs and Seismics. In Proceedings of the SPWLA 40th Annual Logging Symposium, Oslo, Norway, 30 May–3 June 1999; Society of Petrophysicists and Well-Log Analysts: Houston, TX, USA, 1999. [Google Scholar]
- Nafi Toksoz, M.; Cheng, C.H.; Timur, A. Velocities of seismic waves in porous rocks. Soc. Explor. Geophys. 1976, 41, 621–645. [Google Scholar]
- Coates, G.R.; Xiao, L.; Prammer, M.G. NMR Logging Principles and Application; Meng, F.Y., Ed.; Petroleum Industry Press: Beijing, China, 2007; pp. 36–39. [Google Scholar]
- Zhou, K.; Hu, Z.; Li, J.; Gao, F.; Wang, M. Study of marble damage evolution laws under unloading conditions based on nuclear magnetic resonance technique. Chin. J. Rock Mech. Eng. 2014, 33, 3523–3530. [Google Scholar]
- Li, X.; Zhou, Z.; Ye, Z.; Ma, C.; Zhao, F.; Zuo, Y.; Hong, L. Study of rock mechanical characteristics under coupled static and dynamic loads. Chin. J. Rock Mech. Eng. 2008, 27, 1387–1395. [Google Scholar]
- Li, X.; Zhou, Z.; Lok, T.S.; Hong, L.; Yin, T. Innovative testing technique of rock subjected to coupled static and dynamic loads. Int. J. Rock Mech. Min. Sci. 2008, 45, 739–748. [Google Scholar] [CrossRef]
- Li, X.B.; Zhou, Z.L.; Hong, L.; Yin, T.B. Large diameter SHPB tests with a special shaped striker. ISRM News J. 2009, 12, 76–79. [Google Scholar]
- Ge, H.K.; Chen, Y.; Lin, Y.S. Microscopic mechanism of difference between static and dynamic elastic parameters of rock. J. Univ. Petrol. 2001, 25, 34–36. [Google Scholar]
- Zhou, W.; Yang, H.X. Effects of fractures of rock on elastic property of rock and velocity-porosity relation. Oil Geophys. Prospect. 2005, 40, 334–338. [Google Scholar]
- Kuster, G.T.; Nafi Toksoz, M. Velocity and attenuation of seismic waves in two-phase media: Part I. & Part II. Geophysics 1974, 39, 587–618. [Google Scholar]
- Cheng, C.H.; Nafi Toksoz, M. Inversion of seismic velocities for the pore aspect ratio spectrum of a rock. J. Goephys. Res. 1979, 84, 7533–7543. [Google Scholar] [CrossRef]
Figure 1.
Curves of spectrum distributions of transverse relaxation time T2 for the granite specimens.
Figure 1.
Curves of spectrum distributions of transverse relaxation time T2 for the granite specimens.

Figure 2.
Preparation of rock samples before testing.

Figure 3.
Schematic diagram of the P-wave velocity test.

Figure 4.
Schematic diagram of the magnetic resonance image (MRI) test mechanism.

Figure 5.
Schematic of the split Hopkinson pressure bar system.
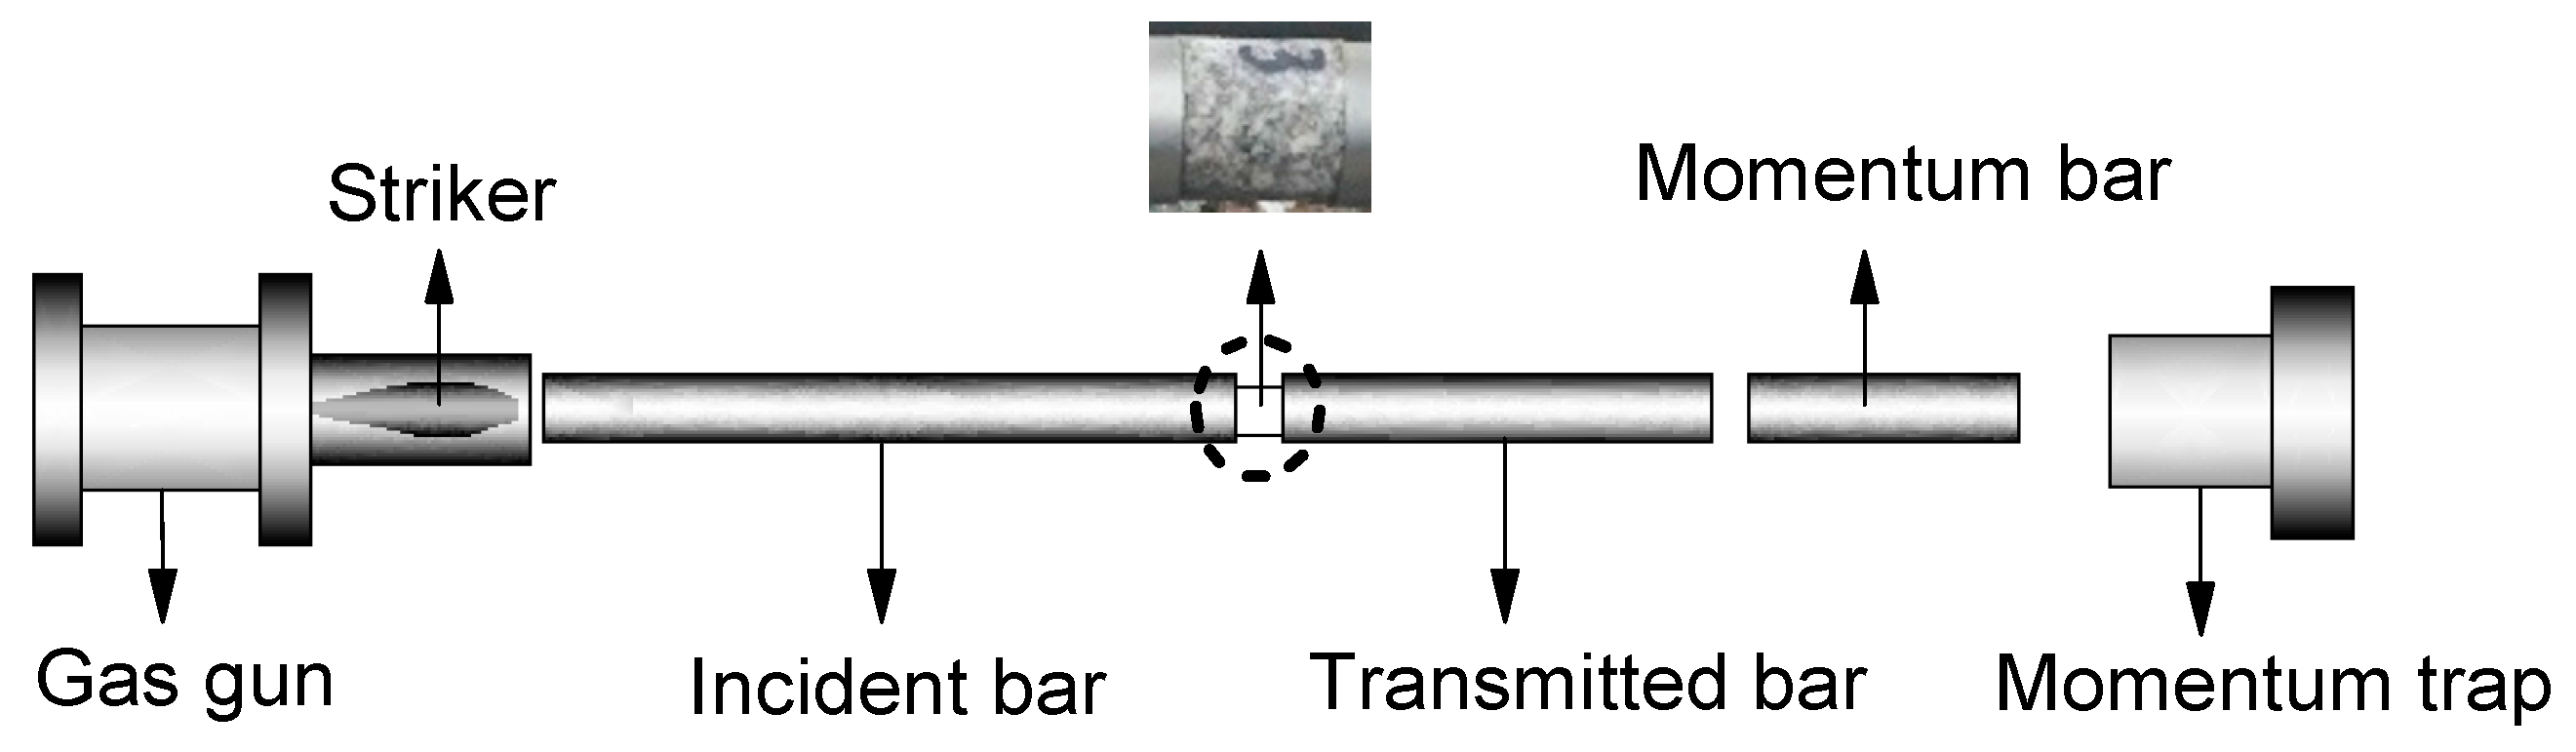
Figure 6.
Rock samples after the cycle dynamic impact test.

Figure 7.
Time variation curve of wave velocity.

Figure 8.
Nuclear magnetic resonance (NMR) images of rock samples uder different axial pre-stresses (a) 0 MPa, (b) 10 MPa, (c) 10 MPa and (d) 30 MPa.
Figure 8.
Nuclear magnetic resonance (NMR) images of rock samples uder different axial pre-stresses (a) 0 MPa, (b) 10 MPa, (c) 10 MPa and (d) 30 MPa.

Figure 9.
T2 distribution of of rock samples uder different axial pre-stresses (a) 0 MPa, (b) 10 MPa, (c) 10 MPa and (d) 30 MPa.
Figure 9.
T2 distribution of of rock samples uder different axial pre-stresses (a) 0 MPa, (b) 10 MPa, (c) 10 MPa and (d) 30 MPa.

Table 1.
The mineral composition of the granite used in this study.
| Composition | SiO2 | Al2O3 | K2O | Fe2O3 | CaO | TiO2 |
|---|---|---|---|---|---|---|
| Content/% | 77.04 | 15.58 | 4.01 | 1.73 | 1.18 | 0.27 |
Table 2.
Carr-Purcell Meiboom-Gill.
| TW/ms | RG1/db | DRG1 | TD | NECH | TE/ms | NS |
|---|---|---|---|---|---|---|
| 1500 | 20 | 3 | 109572 | 2048 | 0.22ms | 64 |
Table 3.
The porosity variation before and after the test.
| Axial Pre-Stress (MPa) | Pre-Test Porosity (%) | Post-Test Porosity (%) | Variation (%) |
|---|---|---|---|
| 0 | 1.47 | 1.15 | –21.8 |
| 10 | 1.43 | 1.15 | –19.6 |
| 20 | 1.40 | 1.11 | –20.7 |
| 30 | 1.46 | 1.16 | –20.5 |
Table 4.
The proportion of large pores before and after the test.
| Axial Pre-Stress (MPa) | The Proportion of Small Pores Before the Test (%) | The Proportion of Small Pores After the Test (%) | Variation (%) |
|---|---|---|---|
| 0 | 16.58 | 36.32 | 19.74 |
| 10 | 17.36 | 38.81 | 21.45 |
| 20 | 16.25 | 37.41 | 21.16 |
| 30 | 15.85 | 37.54 | 21.69 |
© 2017 by the authors. Licensee MDPI, Basel, Switzerland. This article is an open access article distributed under the terms and conditions of the Creative Commons Attribution (CC BY) license (http://creativecommons.org/licenses/by/4.0/).
Share and Cite
MDPI and ACS Style
Liu, C.; Deng, H.; Wang, Y.; Lin, Y.; Zhao, H. Time-Varying Characteristics of Granite Microstructures after Cyclic Dynamic Disturbance Using Nuclear Magnetic Resonance. Crystals 2017, 7, 306. https://doi.org/10.3390/cryst7100306
AMA Style
Liu C, Deng H, Wang Y, Lin Y, Zhao H. Time-Varying Characteristics of Granite Microstructures after Cyclic Dynamic Disturbance Using Nuclear Magnetic Resonance. Crystals. 2017; 7(10):306. https://doi.org/10.3390/cryst7100306
Chicago/Turabian StyleLiu, Chuanju, Hongwei Deng, Yuan Wang, Yun Lin, and Huatao Zhao. 2017. "Time-Varying Characteristics of Granite Microstructures after Cyclic Dynamic Disturbance Using Nuclear Magnetic Resonance" Crystals 7, no. 10: 306. https://doi.org/10.3390/cryst7100306
Note that from the first issue of 2016, this journal uses article numbers instead of page numbers. See further details here.