
Challenges of Handling, Processing, and Studying Liquid and Supercooled Materials at Temperatures above 3000 K with Electrostatic Levitation


1
Japan Aerospace Exploration Agency, Tsukuba Space Center, Tsukuba, Ibaraki 305-8505, Japan
2
SOKEN-DAI (The Graduate University for Advanced Studies), Sagamihara 252-5210, Japan
3
INO, Remote Sensing Group, 2740 Einstein, Québec City, QC G1P 4S4, Canada
*
Author to whom correspondence should be addressed.
Crystals 2017, 7(10), 309; https://doi.org/10.3390/cryst7100309
Submission received: 13 July 2017
/
Revised: 13 September 2017
/
Accepted: 12 October 2017
/
Published: 15 October 2017
(This article belongs to the Special Issue Crystal Formation from Metastable Liquids)
Abstract
:Over the last 20 years, great progress has been made in techniques for electrostatic levitation, with innovations such as containerless thermophysical property measurements and combination of levitators with synchrotron radiation source and neutron beams, to name but a few. This review focuses on the technological developments necessary for handling materials whose melting temperatures are above 3000 K. Although the original electrostatic levitator designed by Rhim et al. allowed the handling, processing, and study of most metals with melting points below 2500 K, several issues appeared, in addition to the risk of contamination, when metals such as Os, Re, and W were processed. This paper describes the procedures and the innovations that made successful levitation and the study of refractory metals at extreme temperatures (>3000 K) possible; namely, sample handling, electrode design (shape and material), levitation initiation, laser heating configuration, and UV range imaging. Typical results are also presented, putting emphasis on the measurements of density, surface tension, and viscosity of refractory materials in their liquid and supercooled phases. The data obtained are exemplified by tungsten, which has the highest melting temperature among metals (and is second only to carbon in the periodic table), rhenium and osmium. The remaining technical difficulties such as temperature measurement and evaporation are discussed.
1. Introduction
Containerless techniques offer many technological and scientific advantages for material processing. The absence of a crucible allows the handling of chemically reactive materials, such as molten refractory metals, alloys, or semiconductors. It also eliminates the risk of sample contamination in their liquid phase above or under their melting temperature (overheated and supercooled regions). This offers excellent opportunities to characterize the structure of materials and to determine accurately their thermophysical properties. Containerless conditions also suppress heterogeneous nucleation induced by the container walls, and increases the possibility of producing new materials such as metallic glasses.
Since the pioneering work of Rhim et al., in which they investigated levitating and melting materials at high temperatures [1], the development of electrostatic levitation has made great strides. Developments include thermophysical property measurements (density [2], surface tension [3], viscosity [3], heat capacity [4], electrical resistivity [5,6]) of high-temperature melts, and the combination of levitation with either synchrotron radiation sources [7] or neutron sources [8,9] to unveil the structure of high temperature melts. These activities and the obtained scientific results have been summarized in a few review papers [10,11]. This paper focuses exclusively on the technological development of handling materials whose melting temperatures are above 3000 K.
To enable materials science experiments in the reduced-gravity environment offered by the International Space Station, the Japan Aerospace Exploration Agency (JAXA) carried out fundamental ground-based R&D on electrostatic levitation [12,13]. The technological objectives focused on improving sample-positioning control and implementing diagnostic techniques. For these objectives, refractory metals were suitable target materials, and the thermophysical properties of refractory metals whose melting temperatures were around 2000 K were systematically obtained throughout the development. Gradually, the target shifted towards much higher-temperature materials.
Among the materials, the most refractory metals (e.g., W (Tm = 3687 K), Re (Tm = 3458 K), and Os (Tm = 3306 K) [14] (p.4-117)) were of particular interest. Their ability to withstand some degree of ductility and high tensile strength at high temperatures made them very attractive for synthesizing hard, multifunction alloys for a host of applications in the aerospace industry, as well as in electronics, particularly as filaments for mass spectrometers (electron guns) and light bulbs.
This paper first discusses the challenges inherent to the handling and processing of materials at extreme temperatures (˃3000 K). It reviews the procedures and the technological innovations necessary for dealing with these refractory metals. The paper then presents typical results for the thermophysical properties of W, Re, and Os in their liquid equilibrium and non-equilibrium (supercooled) states, as well as the remaining technical challenges.
2. New Procedures and Technological Innovations
2.1. Electrostatic Levitaiton Furnace
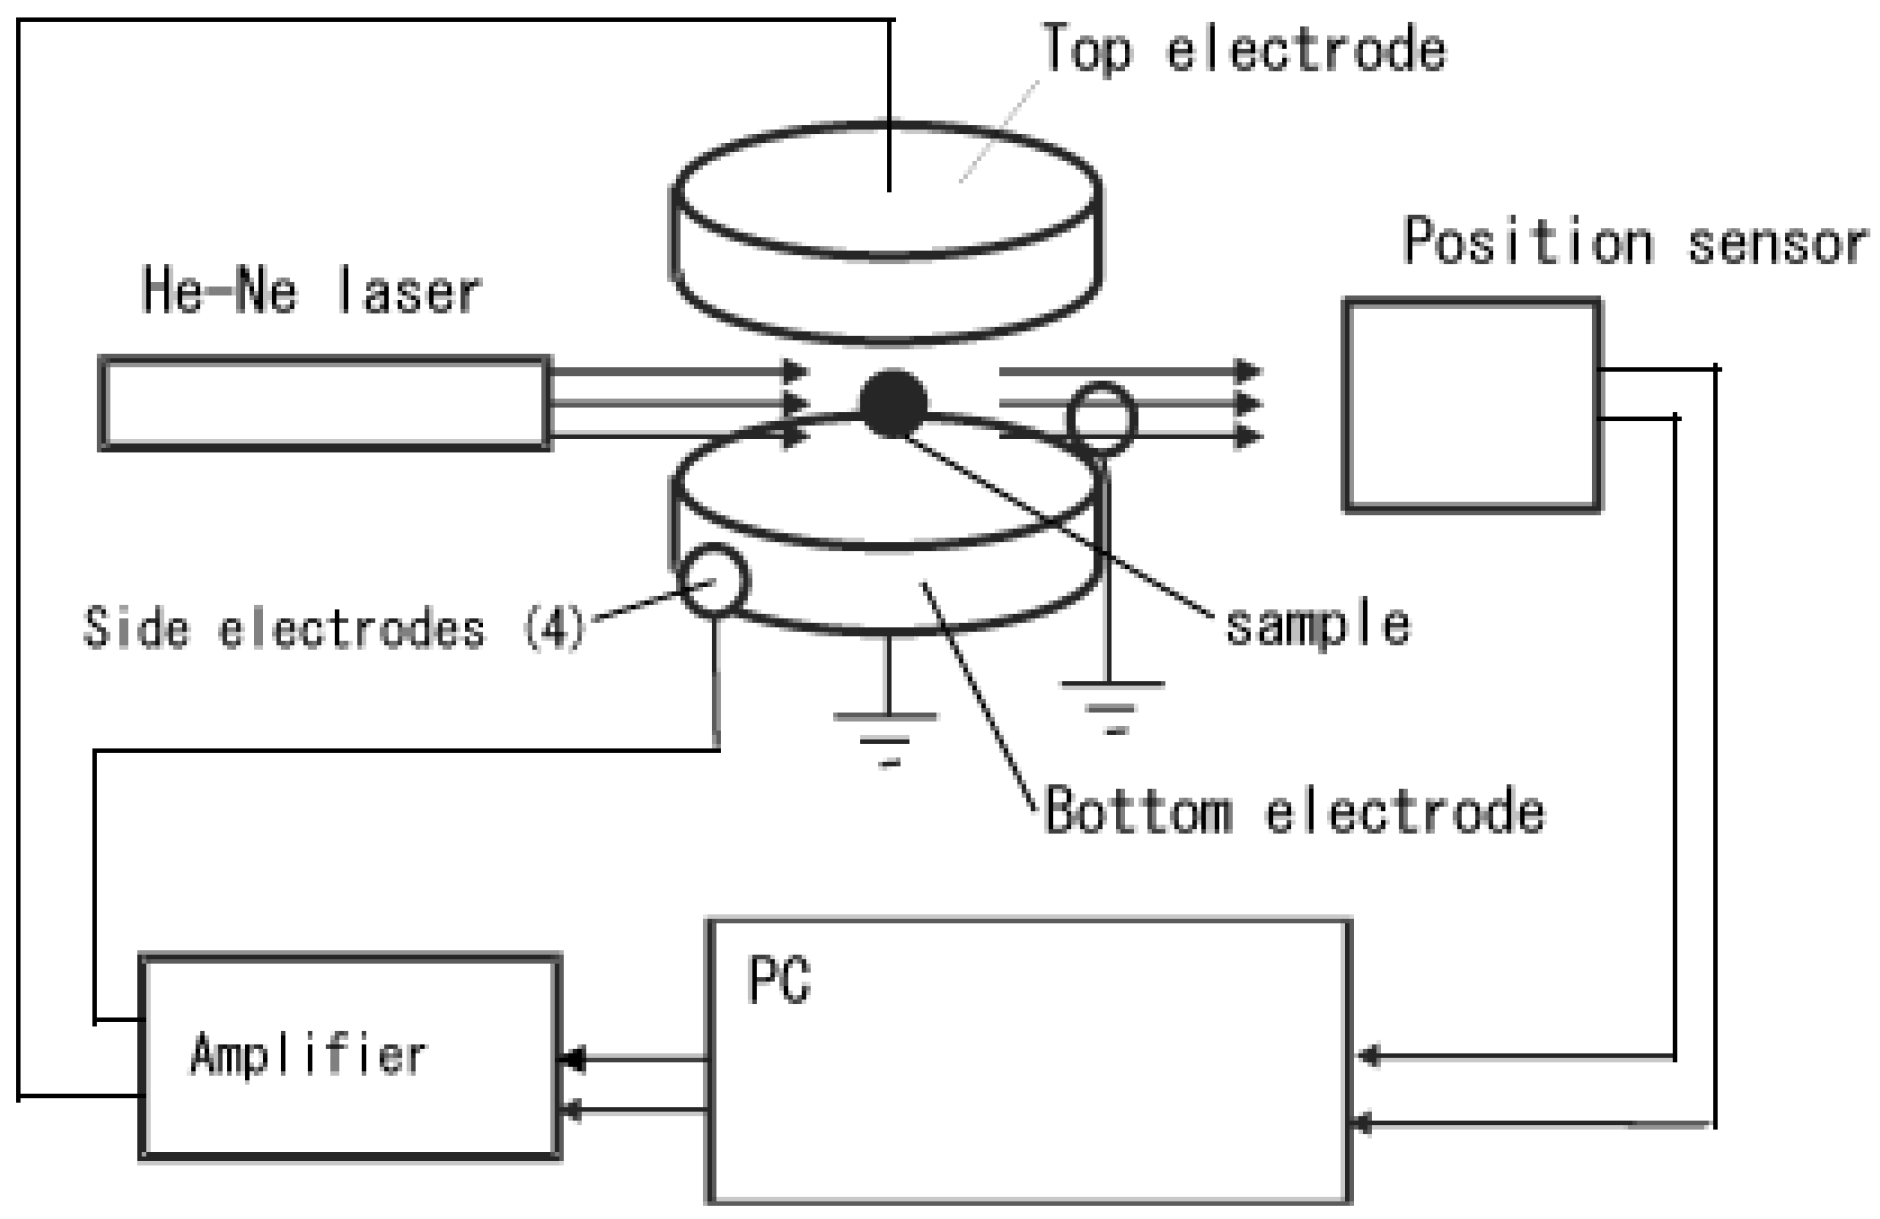
Before entering into details of the necessary improvements needed to cope with high-temperature melts above 3000 K, fundamental information on the electrostatic levitator is described below for completeness. Electrostatic levitation methods use Coulomb force between charged sample and surrounding electrodes to levitate the sample against gravity. Figure 1 provides a schematic depiction of the apparatus. The charged sample is levitated between parallel disk electrodes (top and bottom) with typical sizes of 25 to 30 mm in diameter, separated by around 8 to 10 mm. Since a potential minimum does not exist along the vertical direction, high-speed feedback position control is necessary. A collimated laser beam projects a shadow of the sample onto a position sensor, where vertical and horizontal positions are measured. Two position sensors are orthogonally placed, and measure the tridimensional sample position. The position signals are sent to a computer where the position control voltages are calculated using a PID (Proportional-Ingegral-Differential) control algorithm. Four small electrodes around the bottom electrode are used for horizontal position control. These electrodes are placed under high vacuum (10−4 to 10−5 Pa) to prevent electric discharge between electrodes, and to prevent oxidization on the surface of the metal sample. The levitated sample is heated either by a lamp or by high-power lasers. The sample temperature is monitored by pyrometers, and the sample shape is monitored by CCD cameras. More detailed explanations of specific facilities are found elsewhere [10,11].
2.2. Handling of Samples with Smaller Diameter
The handling, processing, and study of most metals with low melting temperatures (e.g., below 2500 K) was possible using the electrostatic levitator designed by Rhim et al. [1]. However, the hardware showed limitations for handling W, Re and Os, due to their extremely high melting temperature and high density. Table 1 shows the typical sample size (diameter and mass) and applied voltage between the top and bottom electrode (10 mm apart) for levitating the samples against gravity. The data for zirconium, which became a reference, and is the most commonly used sample for electrostatic levitators [15,16], are also listed, for comparison.
Compared with zirconium, sample masses of these metals are higher, while the sample sizes are smaller. Furthermore, small sample sizes are required to allow their extremely high melting temperatures to be reached, due to the limited laser power. Therefore, the sample size was usually less than 2 mm in diameter for these metals.
Small samples tend to cause mechanical problems before and after the levitation experiment inside the vacuum chamber. Figure 2 illustrates the specimen-handling mechanism of our vacuum levitator. A single sliding cartridge comprised 10 distinct pedestals [17], which minimized sample jamming problems. Since these pedestals are easy to replace, those made of refractory metals were used for the W, Re and Os. A distinct pedestal system was also beneficial in preventing cross-contamination between samples. The top and bottom electrodes were made of tungsten, and were also easy to replace.
2.3. Laser Heating and Electrode Configuration
In order to bring the levitated samples to extreme temperatures, high-power heating lasers are necessary. However, the high-power laser beams induced disturbance on sample positioning, as well as rotation [18], and introduced severe temperature gradient. Therefore, proper geometry was required for sample heating. Additionally, the positioning force must be strong enough to withstand the laser-induced disturbance. Figure 3 shows the geometry of the heating lasers used in our facility [19]. CO2 laser beams (200 W total) were beamed towards the levitated sample from three positions, separated by 120 degrees. These three beams were powerful enough to melt samples up to niobium, whose melting temperature is around 2750 K. For samples with melting temperatures higher than that of niobium, a Nd:YAG laser directed through a hole in the top electrode was used. Full power (500 W) was necessary to melt the tungsten samples. Although the parallel disk electrodes (top and bottom) were able to generate a strong force along the vertical direction to levitate the sample against gravity, the high-power Nd:YAG laser beam made the sample positioning in the horizontal direction unstable, such that the four small electrodes were unable to overcome. This problem was solved by reducing the size of the top electrode from 25 mm to 10 mm. Figure 4 shows the numerical analysis results of the electric field between the electrodes when the diameter of the top electrode was diminished [20]. The electrical field conical distribution generated by this arrangement yielded a horizontal field component and, therefore, a natural restoring force towards the middle. With this flattened tetrahedral heating configuration and the improved electrode configuration, W samples were stably levitated and melted.
2.4. Levitation Initiation (Hot Launch)
Since the levitated samples tend to easily lose their positive charge during heating, the time required to bring samples from room temperature to their liquid state can take up to several hours if only photoelectric effect charging by shining UV light is used. To bypass this issue, a procedure dubbed “hot launch” was innovated [21]. Figure 5 depicts the operation. A sample on the pedestal was heated with one CO2 laser beam while two other beams converged at the location at which the sample was going to be levitated during the measurements (Figure 5a). After the sample temperature reached around 1500 K, the thermionic emission process was intense enough to charge the sample. Then, the high voltage between the top and bottom electrodes was applied, and the feedback position control was activated. Within seconds, the sample was launched into its nominal position, and the pre-heating laser beam was steered towards the sample to provide position stability (Figure 5b). Using this technique, the liquid phase could be reached within a few minutes. This technique was very effective when processing samples of material with melting temperature above 3300 K (e.g., W, Re, and Os). Thanks to this technique, several samples could be processed in a single day, whereas only one or two could have been processed using the previous method.
2.5. UV Imaging
For the image analysis for density measurement [2], a constant sample/background contrast is important. The imaging technique with white back light led to erroneous data when applied to molten refractory materials due to the large blackbody output variation in the optical region. Because the blackbody output from the sample in the ultraviolet range is relatively small, a CCD video camera, equipped with an UV-pass filter (450 nm) in conjunction with a high intensity UV background light, was used [21]. The filter also cut off spectral interferences arising from the Nd:YAG pumping lamp (Kr) and from the He-Ne position-control lasers. Figure 6 illustrates a Zr sample at different temperatures (300 K, 1500 K, 2500 K from left to right) for a white back light (Figure 6a–c), no back light (Figure 6d–f), and a UV background illumination (Figure 6g–i). As depicted in the figure, the UV illumination provided a background virtually independent of the sample temperature.
Figure 7 shows magnified images of the samples of W, Re and Os. Above 3000 K, as the emission from the UV domain becomes larger, the contrast between the background and the sample becomes smaller. However, the minimum contrast necessary for image analysis was maintained, even at the melting temperature of W.
3. Typical Experimental Results
Due to their high melting temperature and the risk of contamination at elevated temperatures, it is very challenging to determine the thermophysical properties of refractory metals in their liquid phase using levitation techniques, and extremely difficult with conventional methods. This explains why density and surface tension data are so rare, and often given only for the melting temperature, and why there are no viscosity values in the literature for metals with melting points above 2500 K (except hafnium). With the new procedures and technological innovations detailed in the previous section, numerous measurements were able to be systematically carried out, thus filling the void for this important class of materials. In this paper, measurements of physical properties such as density, surface tension, and viscosity are exemplified by W, Re, and Os for both their equilibrium and non-equilibrium liquid states.
3.1. Density
The density was measured using a photogrammetric technique described elsewhere [2]. In short, the temperature and images of a spherical sample were simultaneously recorded. By closing the shutters of all heating laser beams, the sample cooled and data acquisition was performed over a wide temperature span. The sample volume was extracted from each digitized video image through image analysis, and matched to the temperature data. For calibration, a sphere of precisely known diameter was levitated under identical conditions. Sinusoidal AC currents were induced to the four coils below the bottom electrode (Figure 2), which created a rotating magnetic field [5]. The levitated sample gained a torque, and rotated along the vertical axis. Spin-stabilization was beneficial to fixing the rotation axis and to maintaining the axi-symmetry of the sample. When the sample was axi-symmetric, its volume could be calculated from the image analysis. Then, since its mass was known, the density could be obtained for each temperature from the ratio of mass to the volume.
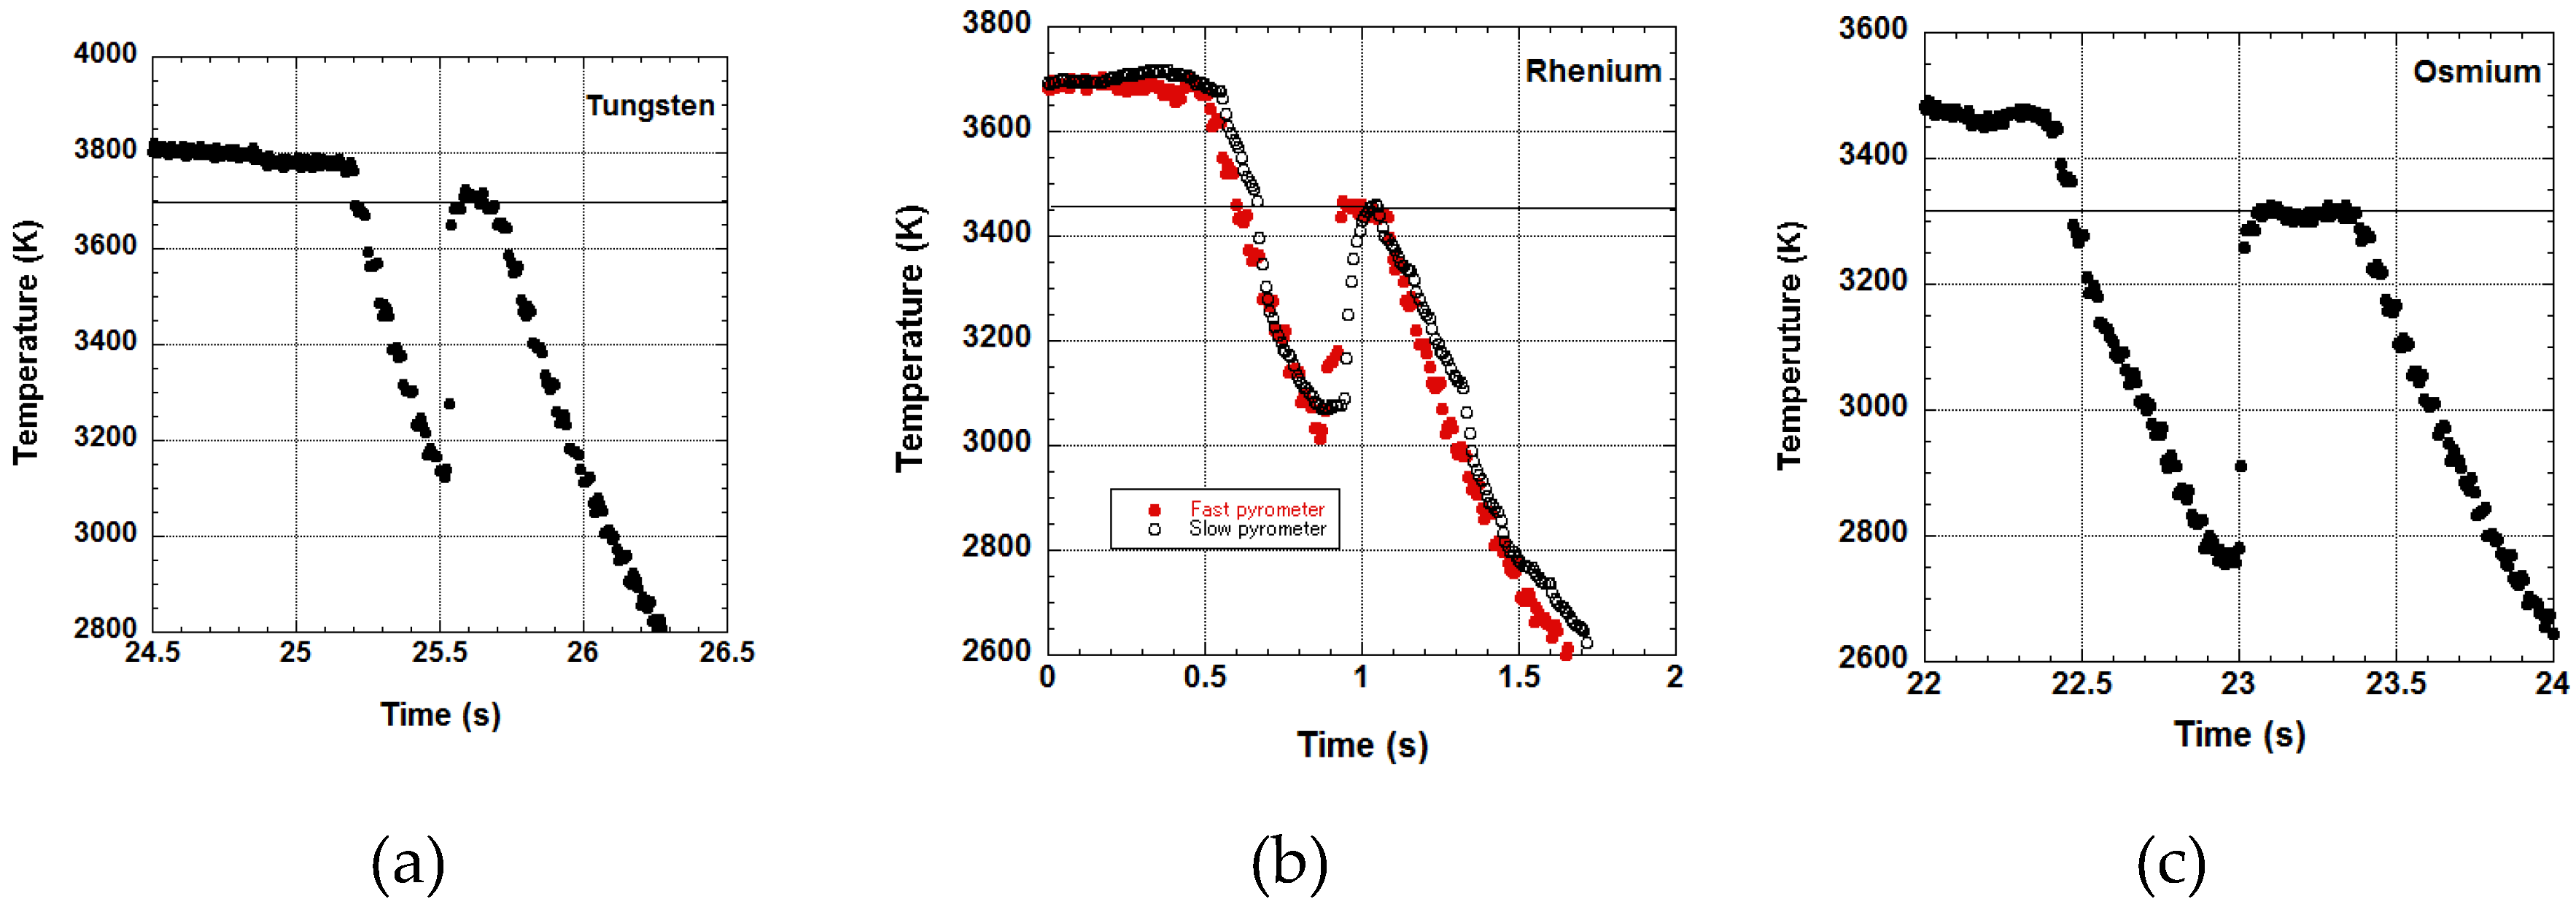
The calculated density data were matched with the temperature to obtain the temperature dependence of density. Figure 8 shows the typical cooling curves (time-temperature plots) of W, Re, and Os. Commercial pyrometers with Si detectors operating at 0.9 μm (with 200 nm full width at half maximum) were used, and the temperature data were sampled at 120 Hz. Since their melting temperatures are so high, the sample temperature decreased rapidly, as illustrated in Figure 8b, and the temperature measurement with a slow pyrometer (whose response time is around 100 ms) could not follow the cooling nor the abrupt temperature rise referred to as recalescence. Employing a faster pyrometer (<10 ms response time) enabled the measurement of the temperature during sample cooling. Measurements with a fast polarimeter revealed that the spectral (normal) emissivity of the liquid phase was not necessarily constant and dependent on temperature [22]. Unfortunately, since we had no means of measuring the temperature dependence of the spectral emissivity, we measured the temperature of the molten samples assuming a constant emissivity. Temperature measurement is one of the technical issues needing to be upgraded to achieve more precise measurements.
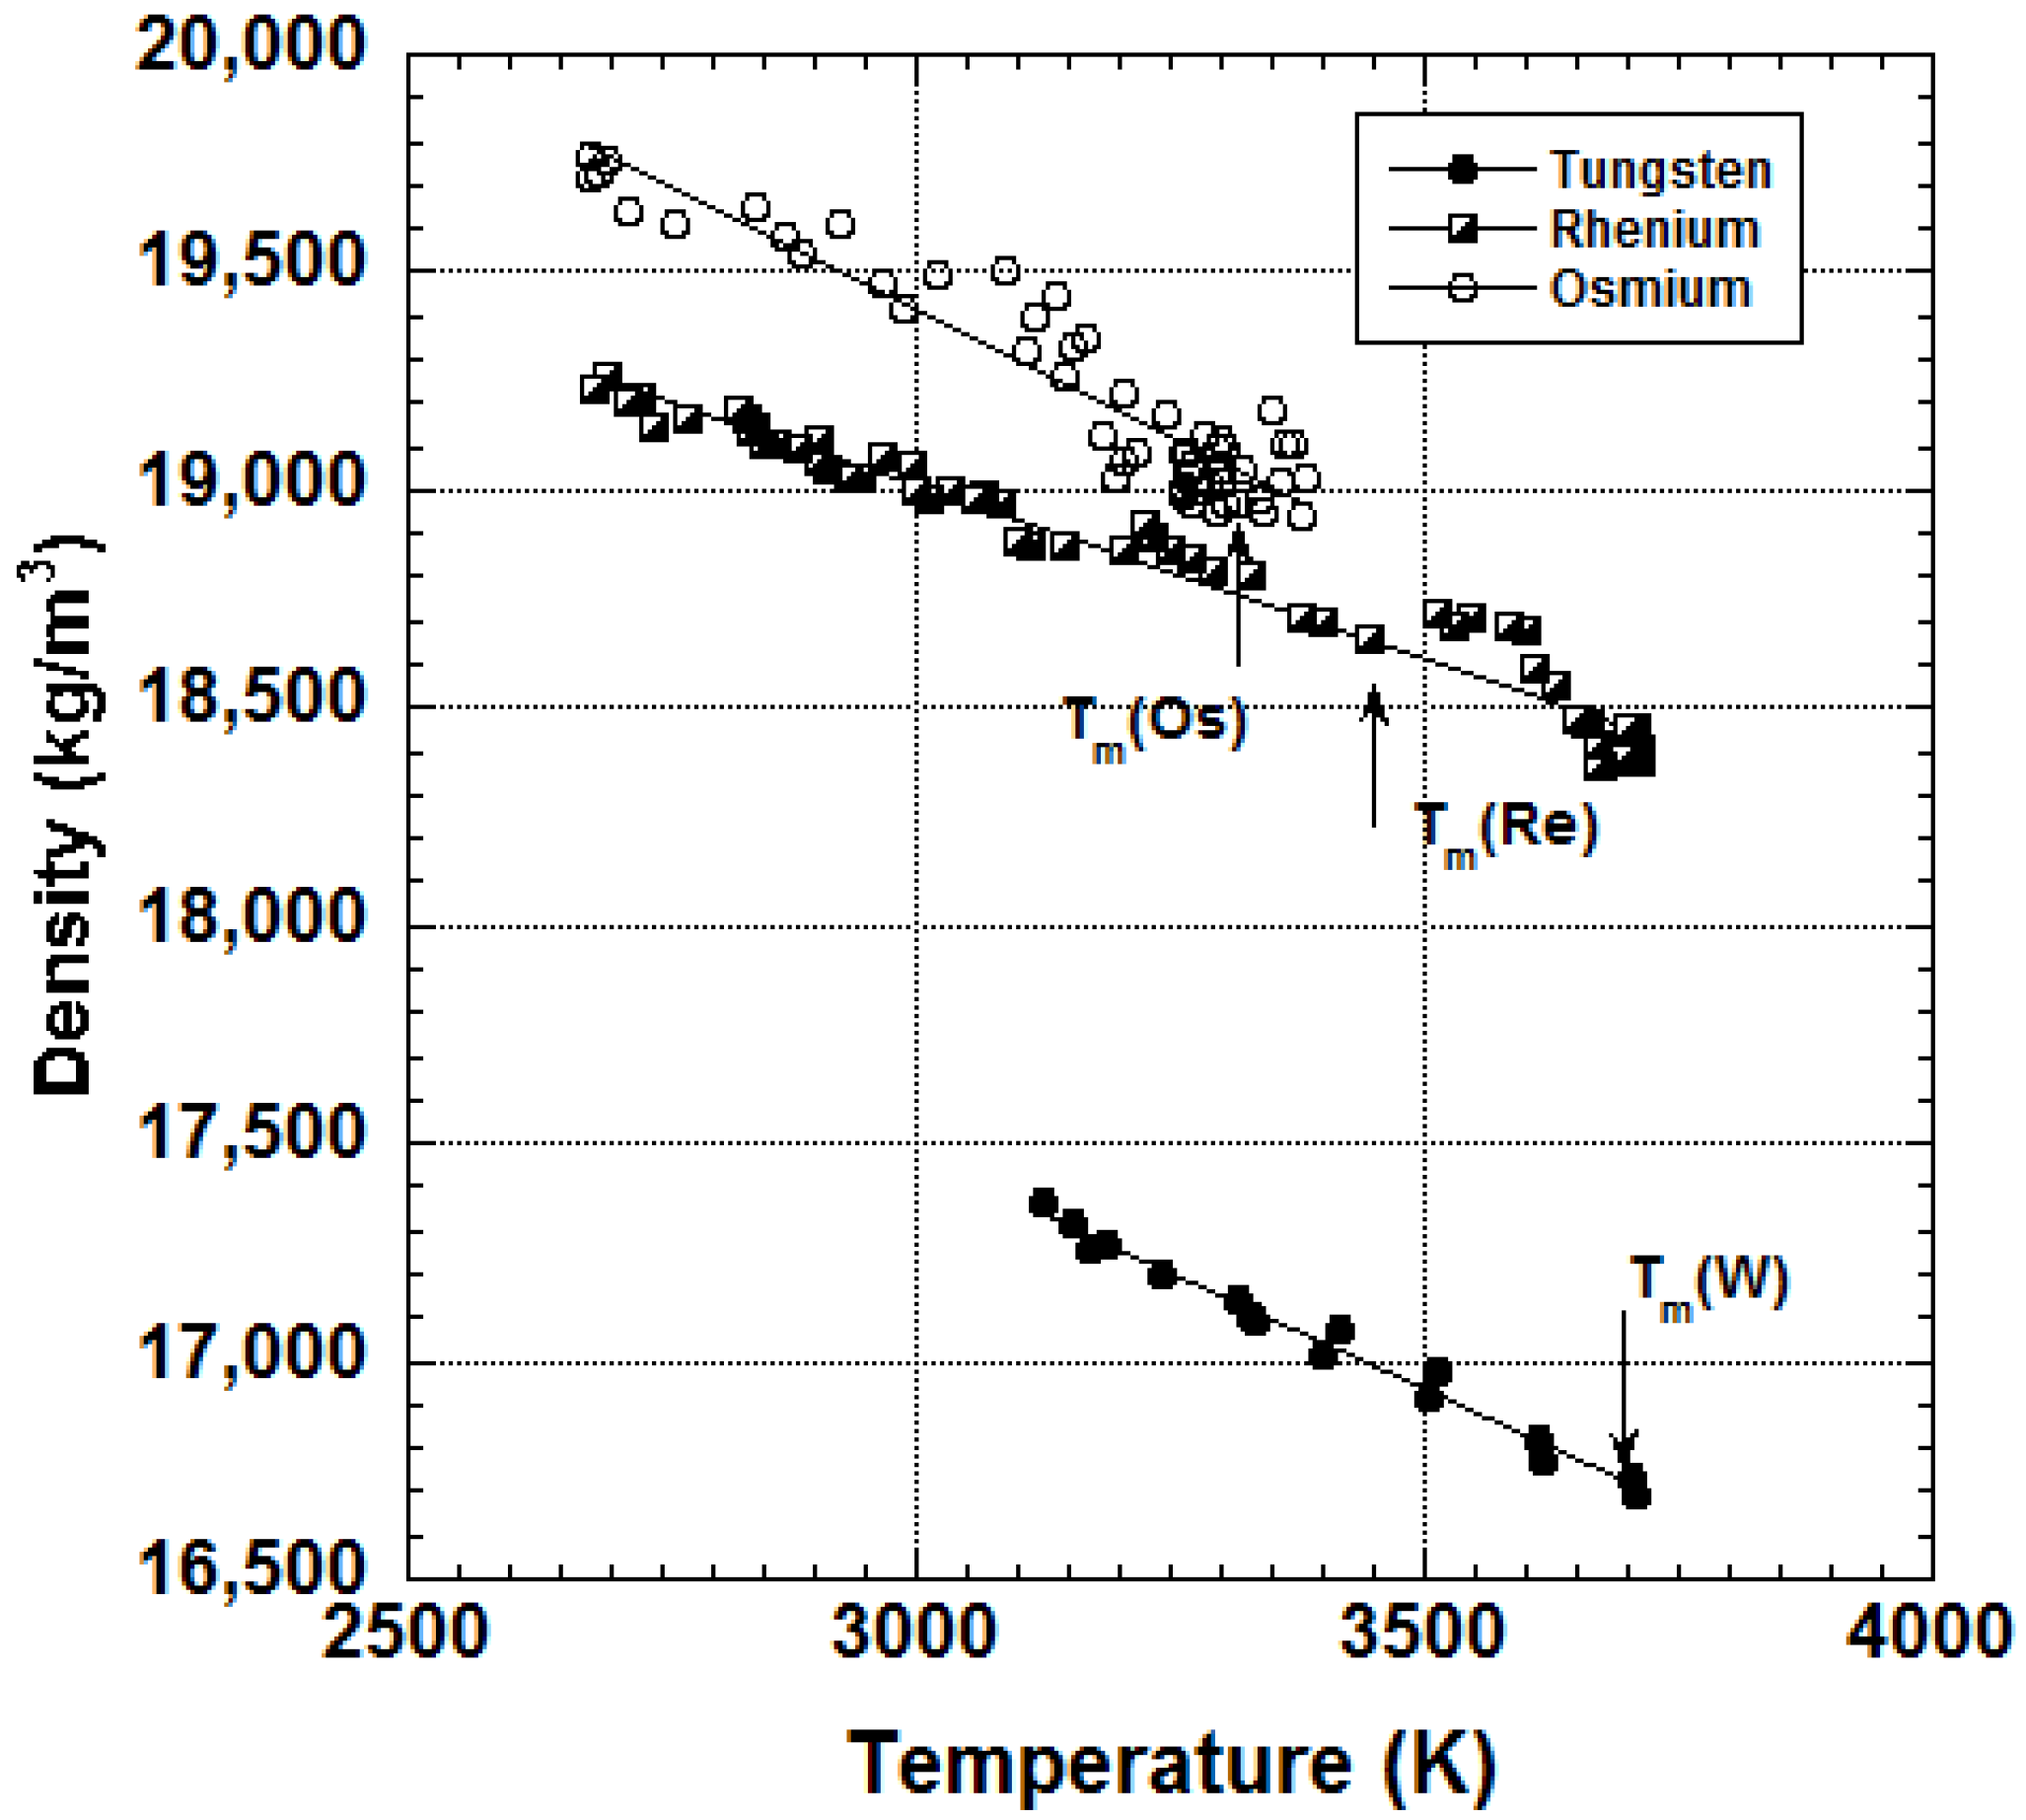
Typical measured data of density are presented in Figure 9 [19,23,24]. Table 2 summarizes literature values. Densities of these refractory metals were necessary for determining the surface tension by the pendant-drop/drop-weight method, and were calculated using solid density data at room temperature before the pulse-heating methods were available. As for W, while calculated density values were around 17.5 kg·m−3, the measured values by pulse-heating methods were around 16.3 kg·m−3. Our density value is closer to those of the pulse-heating method. In the case of Re, our density value shows better agreements with the calculated values than those measured by the pulse-heating method. There are more experimental reports measuring the volume changes of W and Re [25]. However, to obtain the density value from these data, the density value at a given temperature is needed. Since the selection of this density affects the calculated values, the table lists only the literature where density values were available. Both the pulse-heating method and electrostatic levitation cover very wide temperature ranges, with some overlap at and above the melting point. The merit of the pulse-heating method is that it covers wide temperature ranges from the melting point to temperatures well above the melting point, whereas electrostatic levitation covers deep supercooled regions with excursion above the melting temperature. There is no density value of Os measured with the pulse-heating technique. This could be attributable to the difficulties of making wires with Os.
Since the cooling speed is very high, while data acquisition of temperature and image are slow, the number of data is very small, especially for W. Using a pyrometer with a higher acquisition rate and a high-speed camera for image acquisition would increase the amount of data.
3.2. Surface Tension and Viscosity
The surface tension and the viscosity were measured using drop oscillation [6,33]. In this method, a sample was sequentially heated, melted, and maintained at a given temperature. A small sinusoidal electric field was then superimposed on the levitation field to induce a P2 (cosθ)-mode drop oscillation on the sample. The transient signal that followed the termination of the excitation field was recorded and analyzed. This was carried out a few times at a given temperature, and repeated at deep supercooled temperatures until the sample solidified. The surface tension (γ) can then be obtained using the characteristic oscillation frequency (ωc) of the signal, while viscosity (η) can be obtained from the decay time (τ) of the same signal from the following equations [34,35];
and
where ρ is the density, and r0 is the sample radius. To limit ill-effects of sample evaporation on the measured properties, r0 is obtained from the recorded sample image (just before the onset of oscillation), while ρ is determined by the density measurements described in Section 3.1.
The surface tension and viscosity data were measured over wide temperature spans. Measured surface tension data for W [20], Re [36], and Os [19] are presented in Figure 10, and literature values are listed in Table 3. Surface tension data measured by the pendant-drop/drop-weight methods were reported. Due to the limitation of the heating laser power, data of W was obtained mainly in the supercooled region. The surface tension exhibited a linear behavior as a function of temperature. At the melting point, our values show a remarkable agreement with most published values, and those calculated by Allen [28]. Moreover, using our density data at the melting point, the Tm/Vm2/3 factor (Vm2/3 being the quotient of the molecular weight over density) could be calculated and, together with our surface tension value at the melting point (γm), show good agreement with the empirical relation [37].
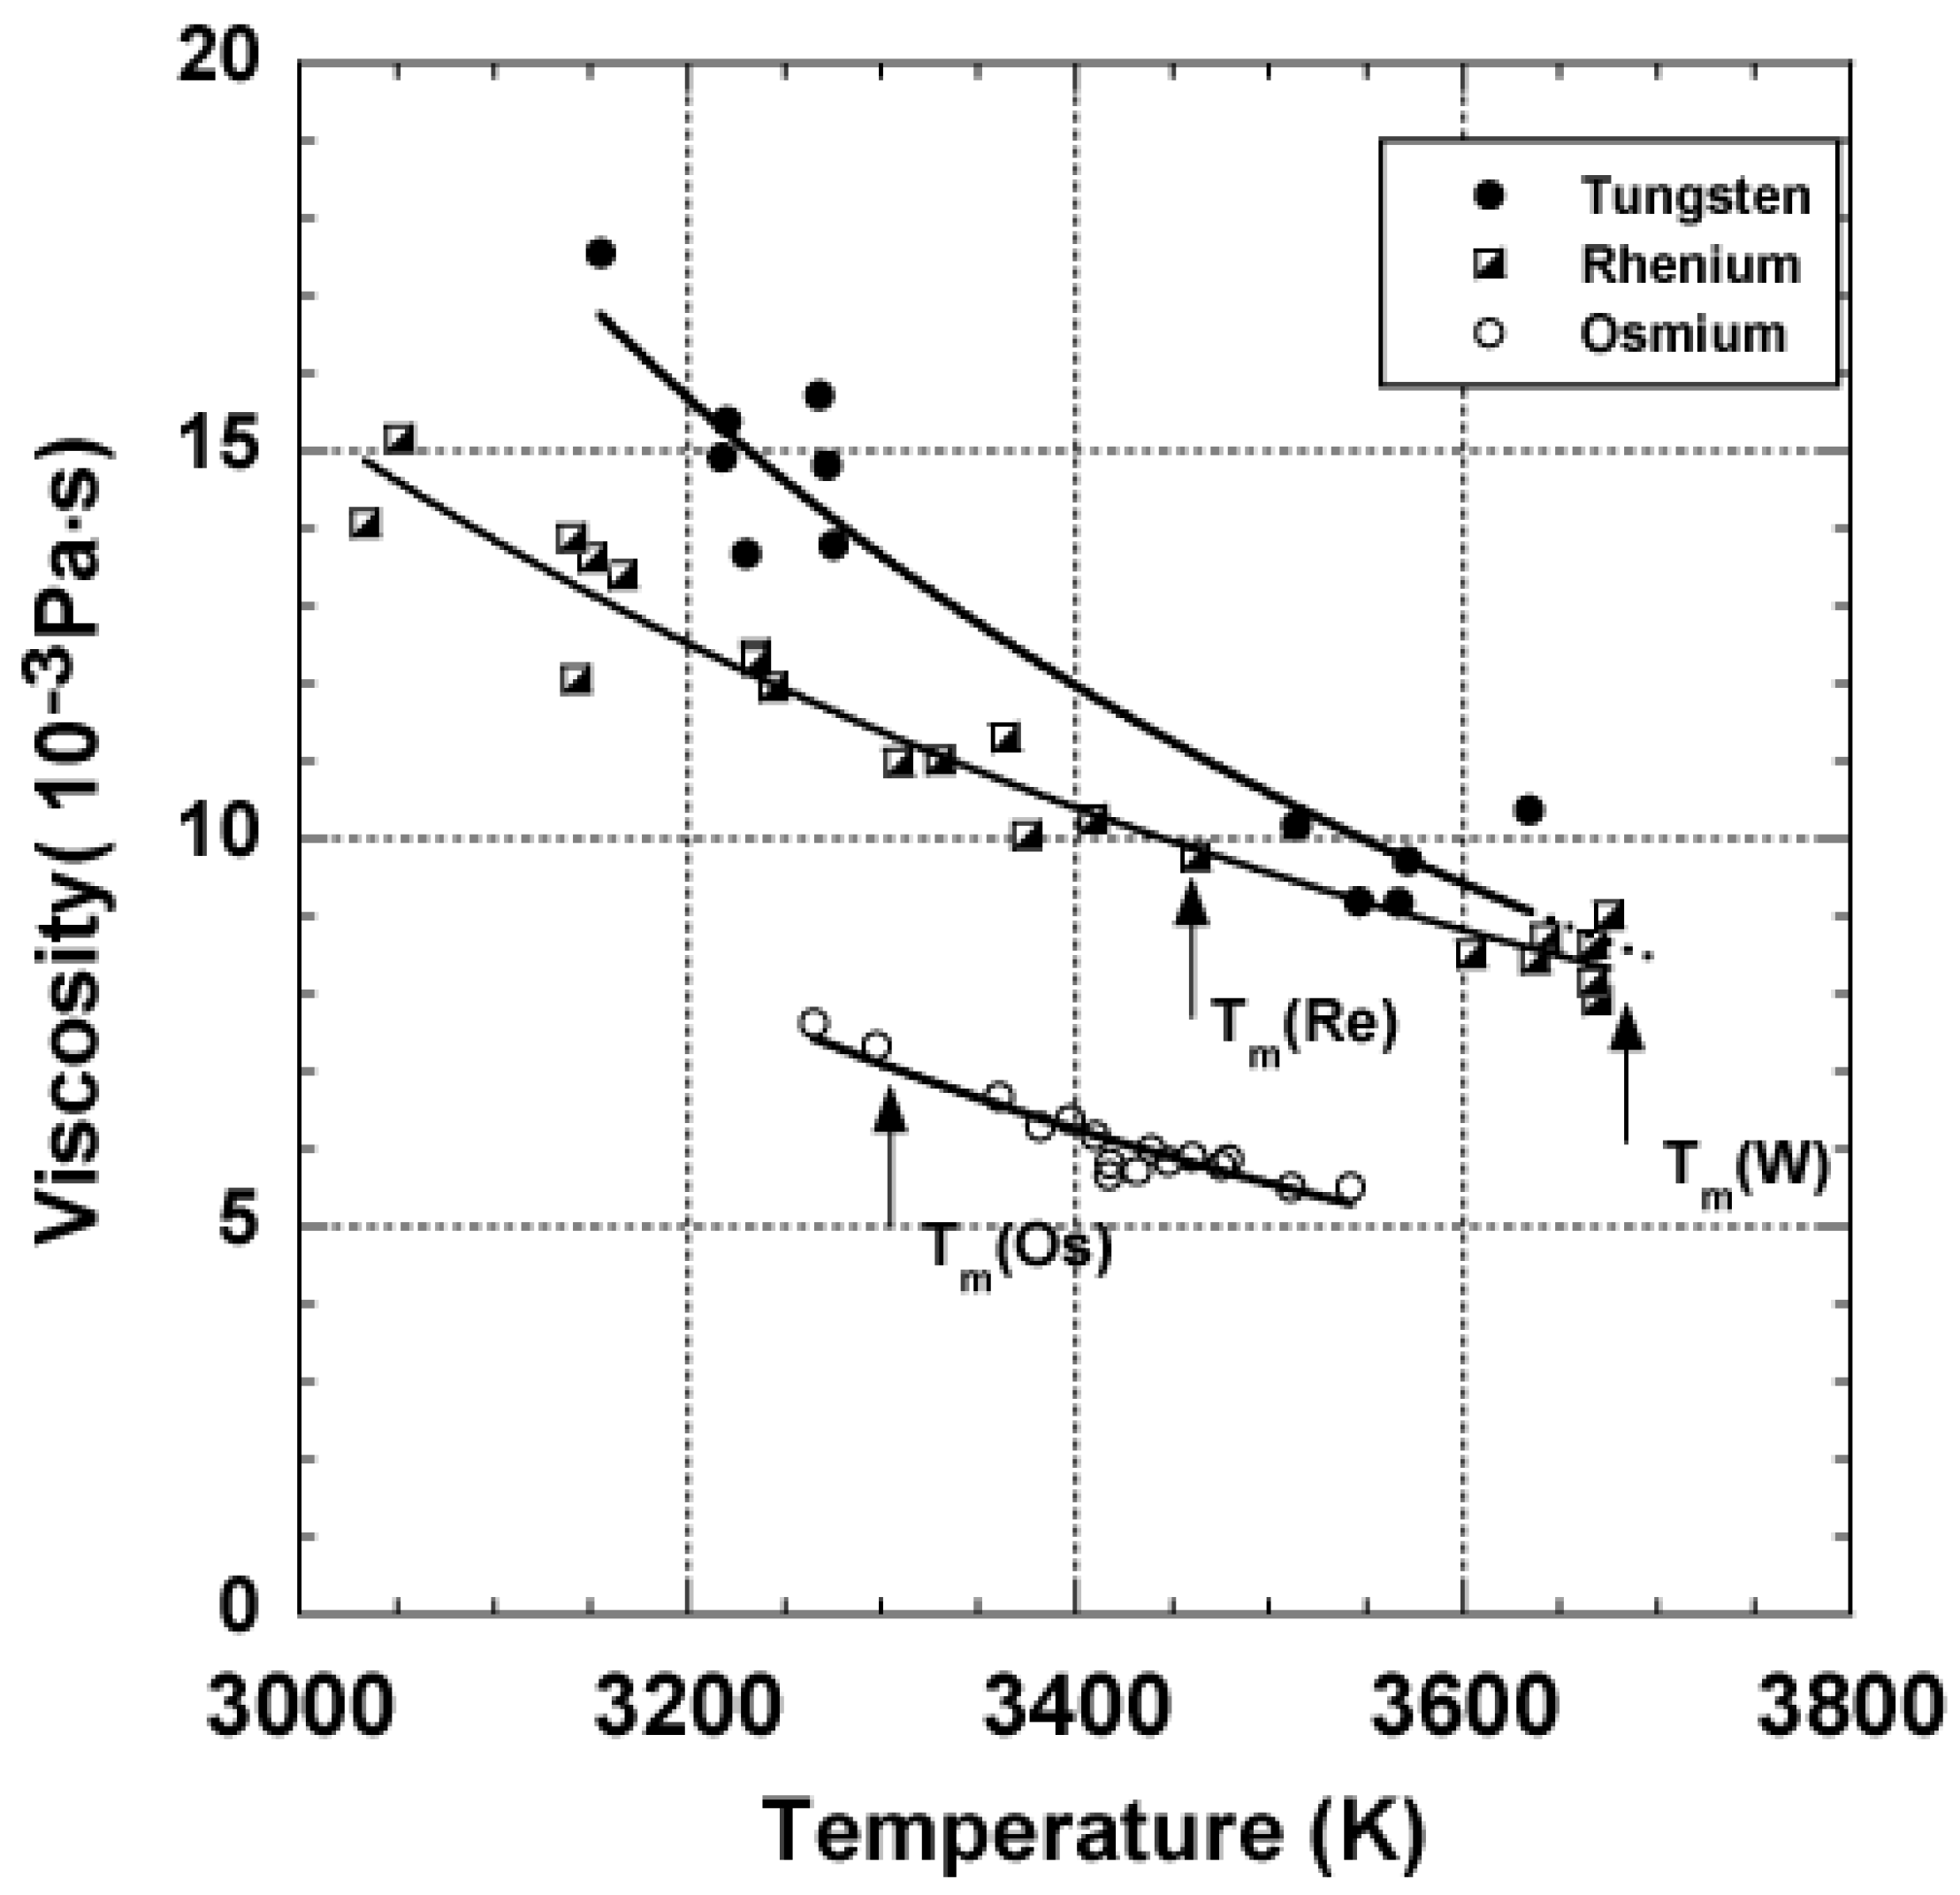
The viscosity data for W, Re, and Os are very limited, and no data are available in the literature. Our data [40] at Tm generally agree well with the calculated values by Andrade [41]. The temperature dependence of viscosity displayed an Arrhenius trend for W, Re, and Os (Figure 11), and is shown in Table 4.
3.3. Uncertainty
The experimental uncertainty of density measurements is derived from the measurements of mass and volume of samples. Because the uncertainty in mass measurement is 0.1 mg, while the typical sample mass is 50 mg, the uncertainty of mass measurement can be estimated at around 0.2%. The effect of sample evaporation during the experiment, which will be discussed in the next section in detail, is negligibly small. As described in [2], the uncertainty of volume (ΔV/V) can be calculated by
where Δr0 is the uncertainty in the radius measurement by the image analysis. In our experiment, the average value of Δr0 is around 1 pixel, while r0 is 160 pixels. Then, ΔV/V can be estimated around 1.9%, and the overall uncertainty of density measurement (Δρ/ρ) is estimated to be around 2%. Bradshaw et al. have improved the image analysis system and reported better uncertainty [42]. Unfortunately, this improvement has not been employed in our system, and the uncertainty of density measurement remains around 2%. More detailed uncertainty analysis on the density measurement with electrostatic levitation was done by Yoo et al. [43].
The uncertainty in surface tension measurement is mainly determined by the uncertainties of ρ, ρ0, and ωc. As described in the uncertainty of density measurements, uncertainty of ρ and r0 is 2% and 0.65%, respectively. The uncertainty of ωc induced by the FFT analysis is negligibly small (0.4%), when considering the transformation error (less than 1 Hz) and typical characteristic oscillation frequency (around 240Hz). However, a 1.5% uncertainty on ωc is induced by the sample rotation [44]. As a result, the uncertainty of surface tension measurements (Δγ/γ) can be estimated to be around 3.2% by the following equation:
Similarly, using Equation (2), the uncertainty of the viscosity measurement can be estimated by the uncertainties of ρ, ρ0, and τ. The uncertainty of the decay time Δτ is estimated to be around 10%, which is mainly introduced by the sample movement with respect to the oscillation detector during drop oscillation, and this uncertainty determines the overall uncertainty of viscosity, which is as high as 10%.
3.4. Evaporation
Sample evaporation is one of the biggest issues remaining on the electrostatic levitator in high-vacuum conditions. In the case of alloys, it is very difficult to maintain stoichiometry of the sample if evaporation rate of the sample is high. In case of pure metals, the samples lose their mass during experiments, introducing errors in thermophysical property measurements. Since the loss of mass is reflected by a change of sample size, it can be estimated by monitoring and analyzing the sample images. During the surface tension and viscosity measurement described in Section 3.2, the sample mass was continuously reducing. Evaporation rate of W, Re, and Os, was estimated using experimental records of surface tension and viscosity measurements for these metals. Table 5 summarizes the records and estimated evaporation rates of these metals.
The evaporation rate of Os is the highest among the three elements. As for W, the evaporation rate for Run #3 is smaller than those for Run #1 and #2 because Run #3 was conducted 100 K below the melting temperature. From the evaporation rate and cooling curve (in Figure 8c), the mass lost during rapid cooling can be estimated by 0.075 (mg/s) × 0.6 (s) = 0.045 mg, at maximum. The 0.6 s represents the duration from the onset of rapid cooling to the onset of solidification. The evaporation of solid samples is neglected. Since the minimum sample mass of Os used in the density measurement was around 30 mg, the uncertainty induced by evaporation is 0.15%, which is negligibly smaller than those from image analysis.
4. Conclusions
The new procedures and technological innovations implemented by JAXA in their electrostatic levitation made possible the processing of refractory metals at temperatures above 3000 K, and permitted the measurements of the density, surface tension, and viscosity. Using an independent method recently developed and implemented on the JAXA levitator as well, the hemispherical total emissivity of W, Re, and Os will be able to be measured in the near future. By using spectrometers, light intensity from the levitated sample can be measured as a function of wavelength, at a given temperature. By comparing the light intensities of the sample and those of the blackbody wavelength by wavelength, the spectral hemispherical emissivity of the sample can be obtained over wide spectral range. Then, the total hemispherical emissivity can be calculated by integrating the spectral hemispherical emissivity. The detailed procedures and the experimental set up can be found in [16].
Because the electrostatic approach does not heat the sample (as the electromagnetic approach does), a molten sample in vacuum experiences pure radiative cooling when the laser beams are turned off. Therefore, because the energy equation governing the cooling is simplified, and with the emissivity measurements, the isobaric heat capacity was able to be found from the ratio of constant pressure heat capacity and hemispherical total emissivity [4].
In terms of processing, electrostatic levitators have been used mostly with metals and a fundamental understanding of the charging mechanisms is paramount to ease levitation of refractory oxides and nitrides on the ground. Meanwhile, JAXA has recently commissioned an electrostatic levitator on the International Space Station [45] to circumvent the difficulties faced on the ground when handling oxides due to insufficient charges before reaching the melting point. The reduced-gravity conditions offered by the orbiting laboratory would allow positioning of these materials or larger samples, while offering a quiet environment. This would make the synthesis of new materials easier, would allow the solidification studies of oxides, as well as permitting the property measurements of materials.
Acknowledgments
The authors are grateful to Dr. Won-Kyu Rhim (retired, California Institute of Technology) and to Dr. Richard Weber (Materials Development Inc.) for several fruitful discussions over the years. Our thanks are extended to Dr. Geun Woo Lee (KRISS, Korea) for numerous challenging talks, notably in the fields of solidification and crystallization processes. The authors would also like to thank Mr. Yuki Watanabe (Advanced Engineering Services) for help in some experiments.
Author Contributions
Takehiko Ishikawa and Paul-François Paradis developed the facility. Especially, Paul-François Paradis contributed to the optical system. Both Takehiko Ishikawa and Paul-François Paradis conducted experiments. Takehiko Ishikawa mainly analyzed data and while Paul-François Paradis wrote the manuscript.
Conflicts of Interest
The authors declare no conflict of interest.
References
- Rhim, W.-K.; Chung, S.-K.; Barber, D.; Man, K.-F.; Gutt, G.; Rulison, A.; Spjut, R.E. An electrostatic levitator for high-temperature containerless materilas processing in 1-g. Rev. Sci. Instrum. 1993, 64, 2961–2970. [Google Scholar]
- Chung, S.-K.; Thiessen, D.B.; Rhim, W.-K. A noncontact measurement technique for the density and thermal expansion coefficient of solid and liquid metals. Rev. Sci. Instrum. 1996, 67, 3175–3181. [Google Scholar] [CrossRef]
- Rhim, W.-K.; Ohsaka, K.; Paradis, P.-F.; Spjut, R.E. Noncontact technique for measuring surface tension and viscosity of molten materials using high temperature electrostatic levitation. Rev. Sci. Instrum. 1999, 70, 2796–2801. [Google Scholar] [CrossRef]
- Rulison, A.A.; Rhim, W.-K. A noncontact measurement technique for the specific heat and total hemispherical emissivity of undercooled refractory materials. Rev. Sci. Instrum. 1994, 65, 695–700. [Google Scholar] [CrossRef]
- Rhim, W.-K.; Ishikawa, T. Noncontact electrical resistivity measurement technique for molten metals. Rev. Sci. Instrum. 1998, 69, 3628–3633. [Google Scholar] [CrossRef]
- Rustan, G.E.; Spyrison, N.S.; Kreyssig, A.; Prozorov, R.; Goldman, A.I. Noncontact technique for measuring the electrical resistivity and magnetic susceptibility of electrostatically levitated materials. Rev. Sci. Instrum. 2012, 83, 103907. [Google Scholar] [CrossRef] [PubMed]
- Gangopadhyay, A.K.; Lee, G.W.; Kelton, K.F.; Rogers, J.R.; Goldman, A.I.; Robinson, D.S.; Rathz, T.J.; Hyers, R.W. Beamline electrostatic levitator for in situ high energy x-ray diffraction studies of levitated solids and liquids. Rev. Sci. Instrum. 2005, 76, 073901. [Google Scholar] [CrossRef]
- Kordel, D.; Holland-Moritz, D.; Yang, F.; Peters, J.; Unruh, T.; Hansen, T.; Meyer, A. Neutron scattering experiments on liquid droplets using electrostatic levitation. Phys. Rev. B 2011, 83, 104205. [Google Scholar] [CrossRef]
- Aoki, H.; Paradis, P.-F.; Ishikawa, T.; Aoyama, T.; Masaki, T.; Yoda, S. Development of an electrostatic levitator for neutron diffraction structure analysis. Rev. Sci. Instrum. 2003, 74, 1147–1149. [Google Scholar] [CrossRef]
- Hyers, R.W.; Rogers, J.R. A review of electrostatic levitation for materials research. High Temp. Mater. Process. 2008, 27, 461–474. [Google Scholar] [CrossRef]
- Paradis, P.-F.; Ishikawa, T.; Lee, G.W.; Holland-Moritz, D.; Brillo, J.; Rhim, W.-K.; Okada, J.T. Materials properties measurements and particle beam interactions studies using electrostatic levitation. Mater. Sci. Eng. R 2014, 76, 1–53. [Google Scholar] [CrossRef]
- Ishikawa, T.; Paradis, P.-F. Development of Ground-based Electrostatic Levitation Furnace (in Japanese). J. Jpn. Soc. Microg. Appl. 2001, 18, 106–115. [Google Scholar]
- Paradis, P.-F.; Ishikawa, T.; Yoda, S. Development of an electrostatic levitation furnace for the ISS: Status of its ground-based thermophysical and structural properties determination capabilities. In Proceedings of the First International Symposium on Microgravity Research & Applications in Physical Sciences & Biotechnology, Sorrento, Italy, 10–15 September 2000. [Google Scholar]
- Melting, boiling, triple, and critical points of the elements. In CRC Handbook of Chemistry and Physics, 97th ed.; Haynes, W.M. (Ed.) CRC Press: Boca Raton, FL, USA, 2016–2017; pp. 4–116, 117. [Google Scholar]
- Klein, S.; Holland-Moritz, D.; Herlach, D.M. Crystal nucleation in undercooled liquid zirconium. Phys. Rev. B 2009, 80, 212202. [Google Scholar] [CrossRef]
- Ishikawa, T.; Ito, Y.; Okada, J.T.; Paradis, P.-F.; Watanabe, Y.; Masaki, T. Spectral emissivity measurements of liquid refractory metals by spectrometers combined with an electrostatic levitator. Meas. Sci. Tech. 2012, 23, 125602. [Google Scholar] [CrossRef]
- Paradis, P.-F.; Ishikawa, T.; Yoda, S. Electrostatic levitation research and development at JAXA: Past and present activities in thermophysics. Inter. J. Thermophys. 2005, 26, 1031–1049. [Google Scholar] [CrossRef]
- Rhim, W.-K.; Paradis, P.-F. Laser-induced rotation of a levitated sample in vacuum. Rev. Sci. Instrum. 1999, 70, 4652–4655. [Google Scholar] [CrossRef]
- Paradis, P.-F.; Ishikawa, T.; Koike, N. Physical properties of equilibrium and non-equilibrium liquid osmium measured by levitation techniques. J. Appl. Phys. 2006, 100, 103523. [Google Scholar] [CrossRef]
- Paradis, P.-F.; Ishikawa, T.; Fujii, R.; Yoda, S. Thermophysical properties of molten tungsten measured with an electrostatic levitator. Heat Transf. Asian Res. 2006, 35, 152–164. [Google Scholar] [CrossRef]
- Ishikawa, T.; Paradis, P.-F.; Yoda, S. New sample levitation initiation and imaging techniques for the processing of refractory metals with an electrostatic levitator furnace. Rev. Sci. Instrum. 2001, 72, 2490–2495. [Google Scholar] [CrossRef]
- Cagran, C.; Brunner, C.; Seifter, A.; Pottlacher, G. Liquid-phase behaviour of normal spectral emissivity at 684.5 nm of some selected metals. High Temp. High Press 2002, 34, 669–679. [Google Scholar] [CrossRef]
- Paradis, P.-F.; Ishikawa, T.; Fujii, R.; Yoda, S. Physical properties of liquid and undercooled tungsten by levitation techniques. Appl. Phys. Lett. 2005, 86, 041901. [Google Scholar] [CrossRef]
- Ishikawa, T.; Okada, J.T.; Paradis, P.-F.; Watanabe, Y. Thermophysical property measurements of high temperature melts using an electrostatic levitation method. JJAP 2011, 50, 11RD03. [Google Scholar]
- Pottlacher, G. High Temperature Thermophysical Properties of 22 Pure metals; Edition Keiper: Graz, Austria, 2010; ISBN 978–3-9502761–6-9. [Google Scholar]
- Calverley, A. A determination of the surface tension of liquid tungsten by the drop-weight method. Proc. Phys. Soc. 1957, 70, 1040. [Google Scholar] [CrossRef]
- Lang, G. Density of liquid elements. In CRC Handbook of Chemistry and Physics, 72nd ed.; Lide, D.R., Ed.; CRC Press: Boca Raton, FL, USA, 1991–1992; pp. 4–124. [Google Scholar]
- Allen, B.C. The surface tension of liquid transition metals at their melting points. Trans. AIME 1963, 277, 1175–1183. [Google Scholar]
- Shaner, J.W.; Gathers, G.R.; Minichino, C. A new apparatus for thermophysical measurements above 2500K. High Temp. High Press 1976, 8, 425–429. [Google Scholar]
- Seydel, U.; Kitzel, W. Thermal volume expansion of liquid Ti, V, Mo, Pd and W. J. Phys. F Metal Phys. 1979, 9, L153–L160. [Google Scholar] [CrossRef]
- Berhault, A.; Arles, L.; Matricon, J. High-pressure, high temperature thermophysical measurements on tantalum and tungsten. Int. J. Thermophys. 1986, 7, 167–179. [Google Scholar] [CrossRef]
- Steinberg, D.J. A simple relationship between temperature dependence of the density of liquid metals and their boiling temperatures. Met. Trans. 1974, 5, 1341–1343. [Google Scholar] [CrossRef]
- Sauerland, S.; Lohofer, G.; Egry, I. Surface tension measurement on levitated liquid metal drops. J. Non Cryst. Solids 1993, 156–158, 833. [Google Scholar] [CrossRef]
- Lord Rayleigh, J.S.W. On the capillary phenomena of jets. Proc. R. Soc. 1879, 29, 71–97. [Google Scholar] [CrossRef]
- Lamb, H. Hydrodynamics, 6th ed.; Cambridge University Press: Cambridge, UK, 1932; pp. 473–639. [Google Scholar]
- Ishikawa, T.; Paradis, P.-F.; Yoda, S. Noncontact surface tension and viscosity measurements of rhenium in the liquid and undercooled states. Appl. Phys. Lett. 2004, 85, 5866–5868. [Google Scholar] [CrossRef]
- Iida, T.; Guthrie, R.I. The Physical Properties of Liquid Metals; Claredon Press: Oxford, UK, 1988; p. 129. [Google Scholar]
- Keene, B.J. Review of data for the surface tension of pure metals. Int. Mat. Rev. 1993, 38, 157–192. [Google Scholar] [CrossRef]
- Vinet, B.; Magnusson, L.; Fredriksson, H.; Desre, P.J. Correlations between surface and interface energies with respect to crystal nucleation. J. Colloid Interface Sci. 2002, 255, 363–374. [Google Scholar] [CrossRef]
- Ishikawa, T.; Paradis, P.-F.; Okada, J.; Kumar, M.V.; Watanabe, Y. Viscosity of molten Mo, Ta, Os, Re, and W measured by electrostatic levitation. J. Chem. Thermodyn. 2013, 65, 1–6. [Google Scholar] [CrossRef]
- Andrade, E.N.da C. A theory of the viscosity of liquids. —Part II. Philos. Mag. 1934, 17, 698. [Google Scholar] [CrossRef]
- Bradshaw, R.C.; Schmidt, D.P.; Rogers, J.R.; Kelton, K.F.; Hyers, R.W. Machine vision for high-precision volume measurement applied to levitated containerless material processing. Rev. Sci. Instrum. 2005, 76, 125108. [Google Scholar] [CrossRef]
- Yoo, H.; Park, C.; Jeon, S.; Lee, S.; Lee, G.W. Uncertainty evaluation for density measurements of molten Ni, Zr, Nb and Hf by using a containerless method. Metrologia 2015, 52, 677–684. [Google Scholar] [CrossRef]
- Ishikawa, T.; Paradis, P.-F.; Fujii, R.; Saita, Y.; Yoda, S. Thermophysical Property Measurements of Liquid and Supercooled Iridium by Containerless Methods. Int. J. Thermophys. 2005, 26, 893–904. [Google Scholar] [CrossRef]
- Ishikawa, T.; Okada, J.T.; Murakami, K.; Ogawa, S.; Koshikawa, N.; Shibasaki, K.; Yamaura, Y.; Takada, T. Development of the electrostatic levitation furnace (ELF) for the International Space Station (ISS). J. Jpn. Soc. Microg. Appl. 2010, 27, 199–204. (In Japanese) [Google Scholar]
Figure 1.
Conceptual drawing of the electrostatic levitation method.

Figure 2.
Illustration showing the electrodes and sample-handling system of the JAXA vacuum levitator [17].
Figure 2.
Illustration showing the electrodes and sample-handling system of the JAXA vacuum levitator [17].
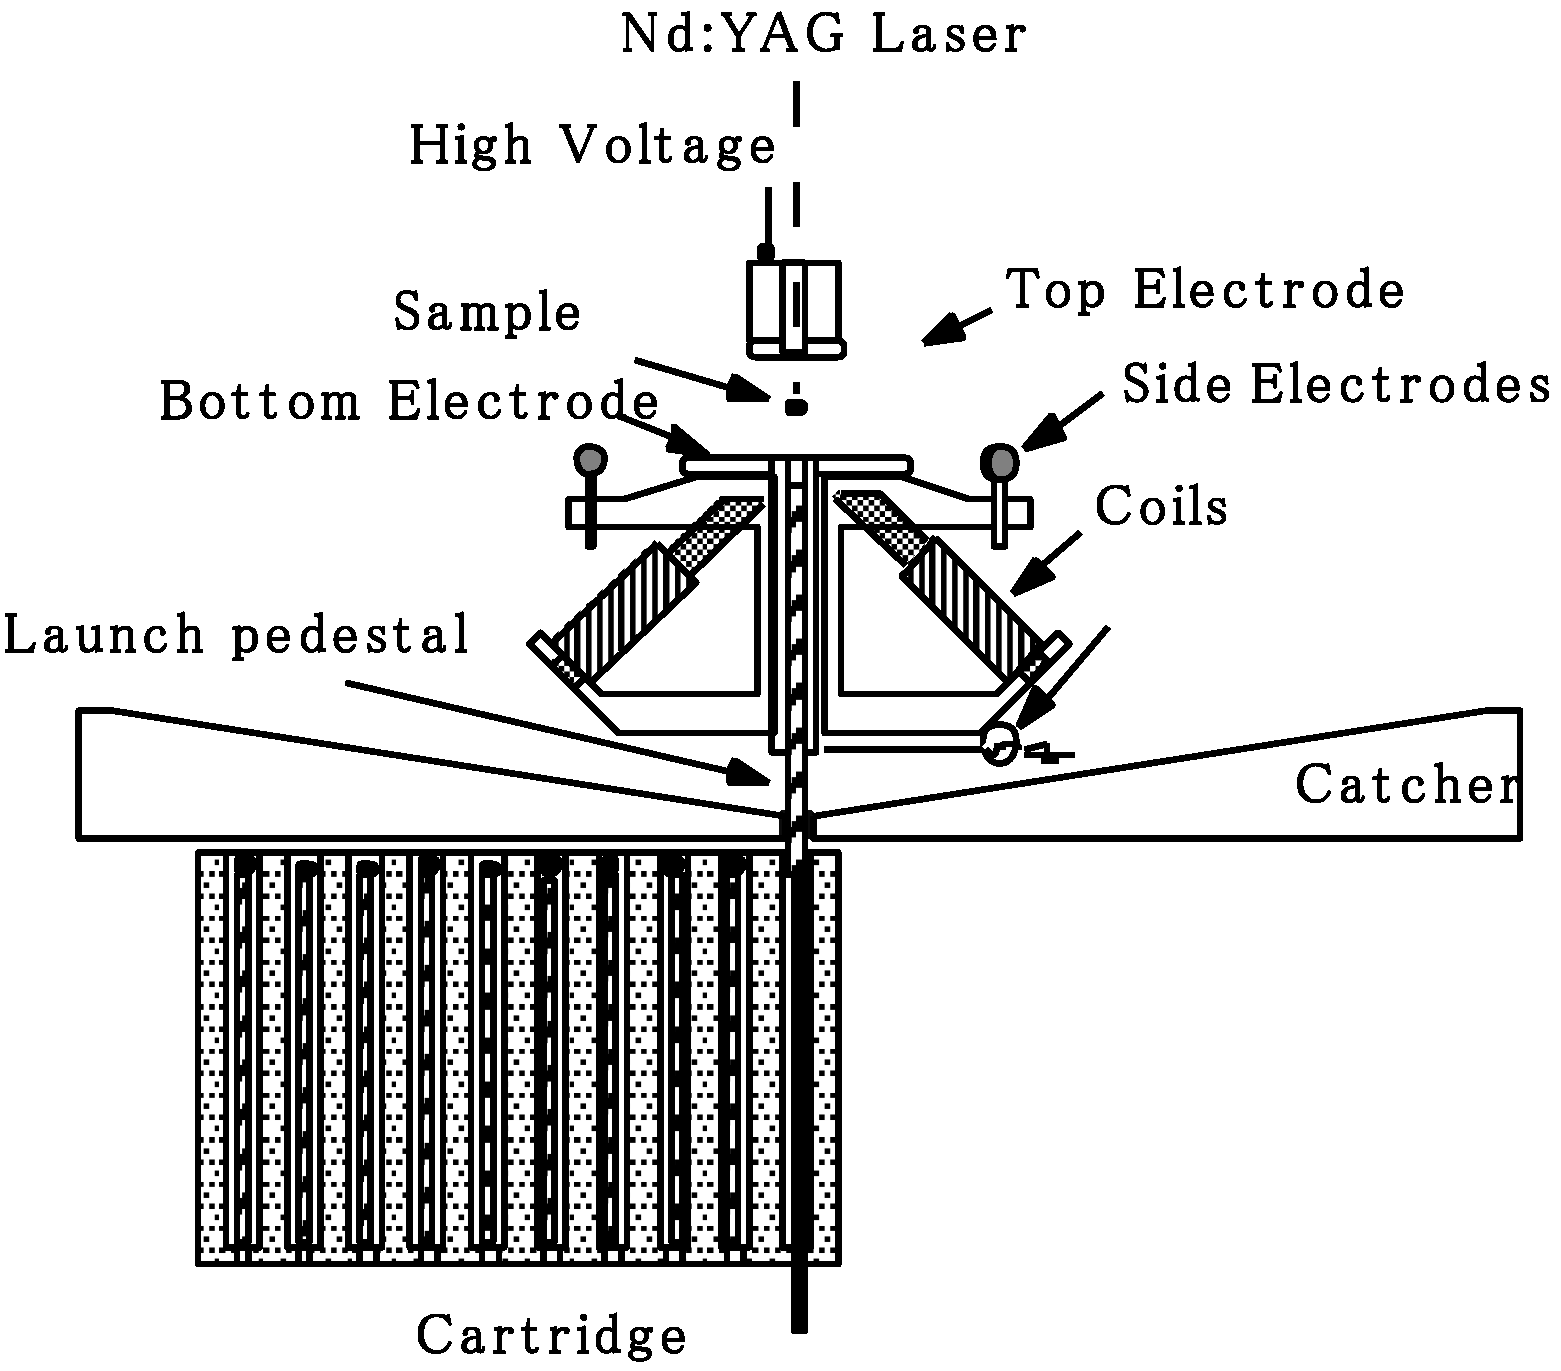
Figure 3.
Isometric view of the levitation furnace, highlighting the flattened tetrahedral laser heating configuration [19].
Figure 3.
Isometric view of the levitation furnace, highlighting the flattened tetrahedral laser heating configuration [19].
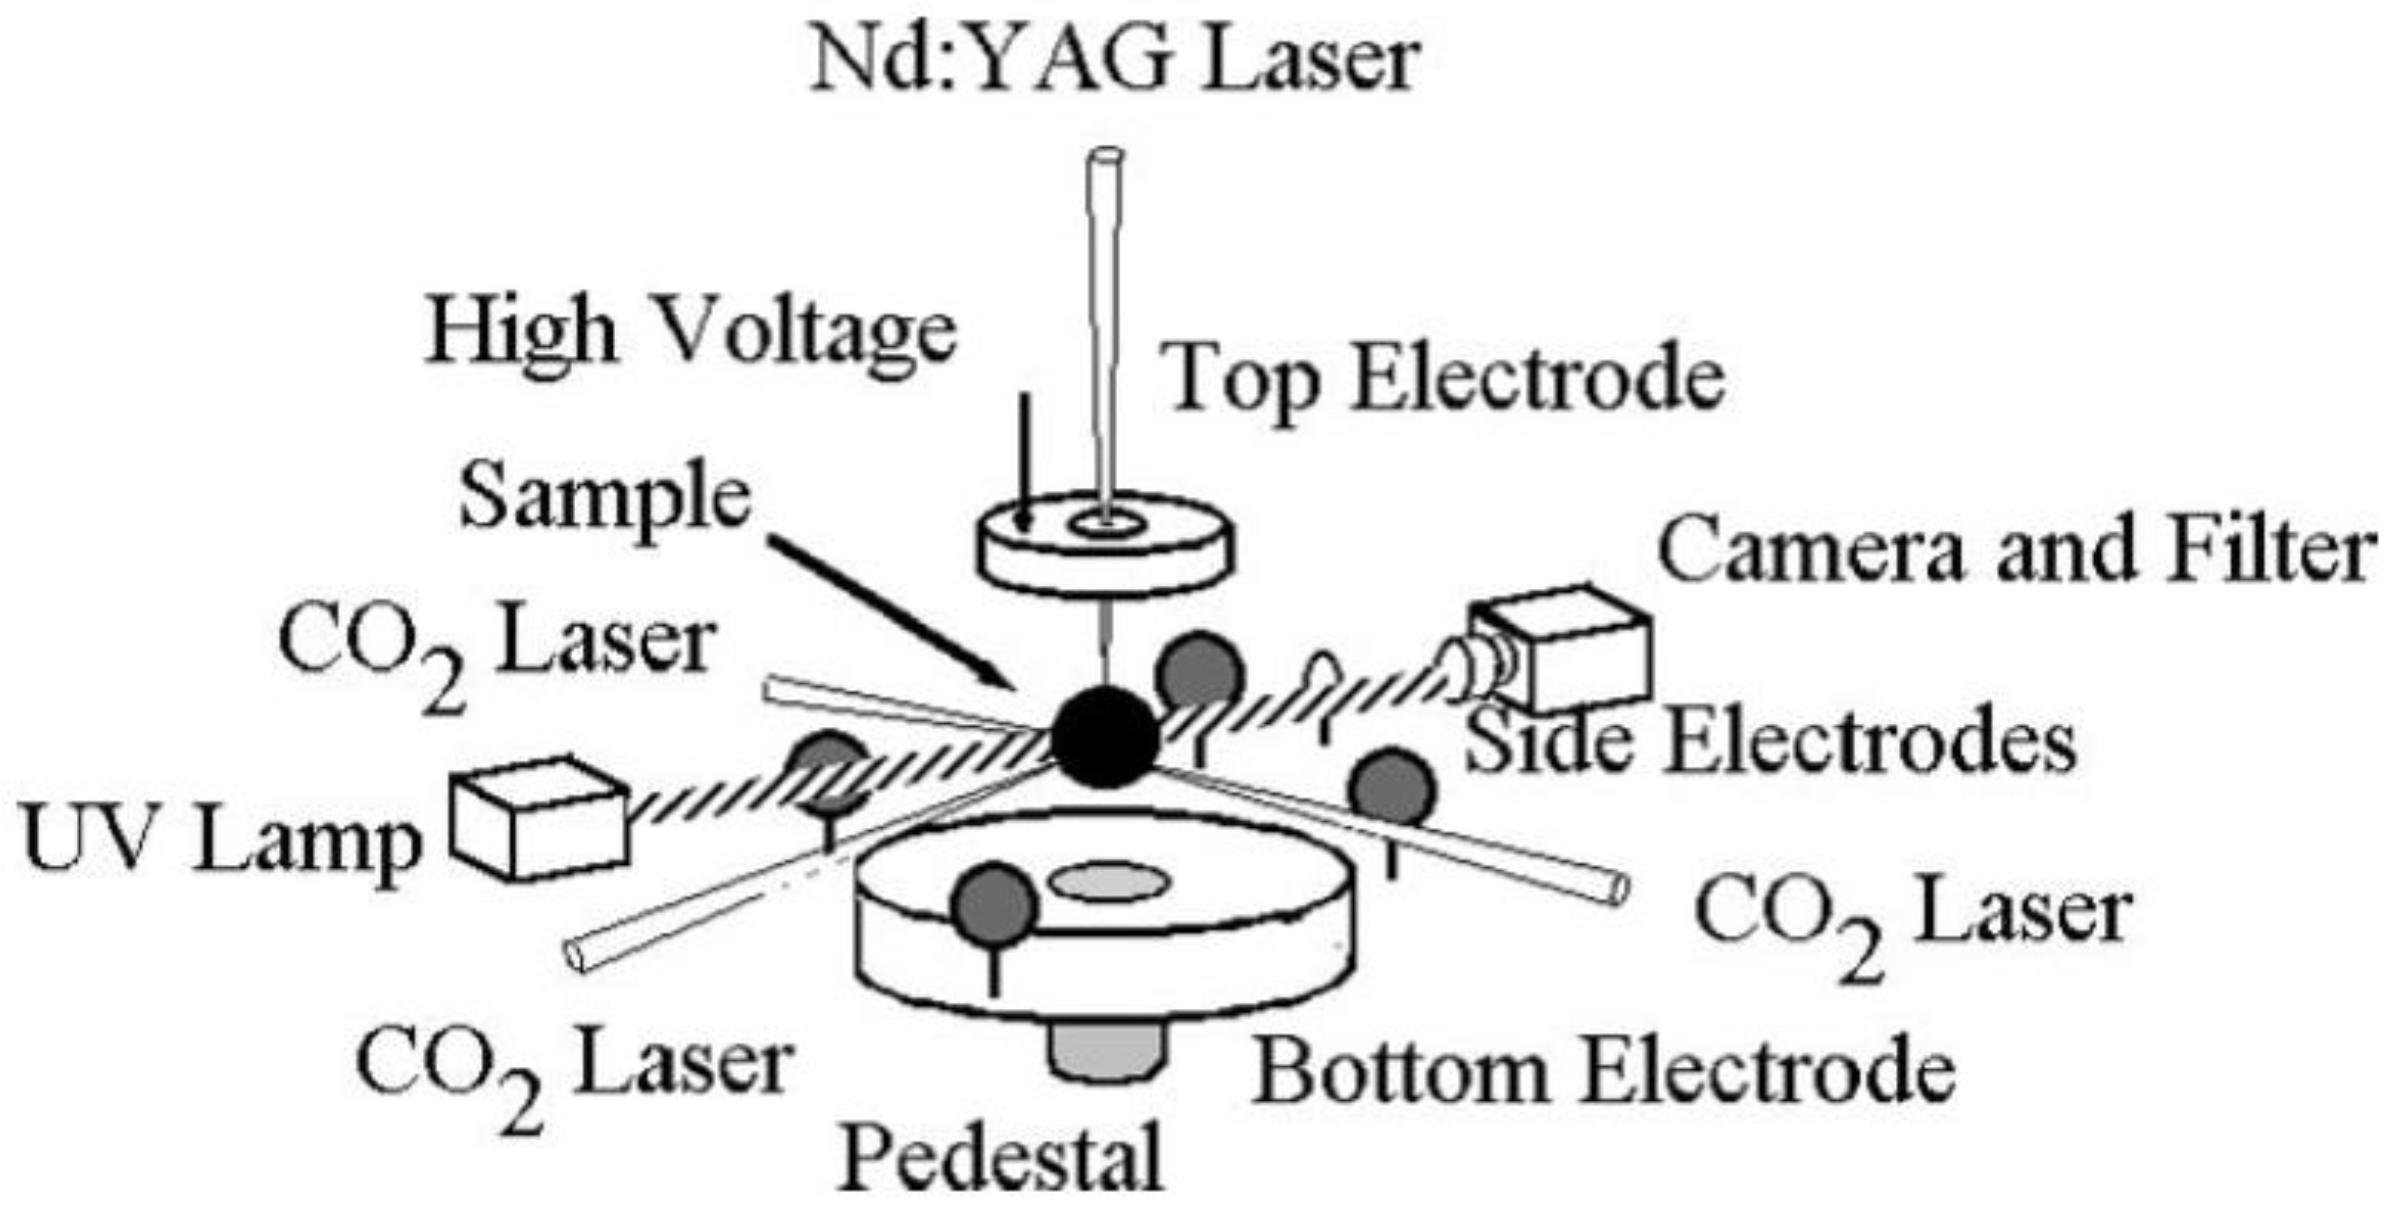
Figure 4.
Electric field between the top and bottom electrodes obtained by a numerical analysis. The diameter of the top electrode was decreased from 25 mm (left) to 10 mm (right) [20].
Figure 4.
Electric field between the top and bottom electrodes obtained by a numerical analysis. The diameter of the top electrode was decreased from 25 mm (left) to 10 mm (right) [20].
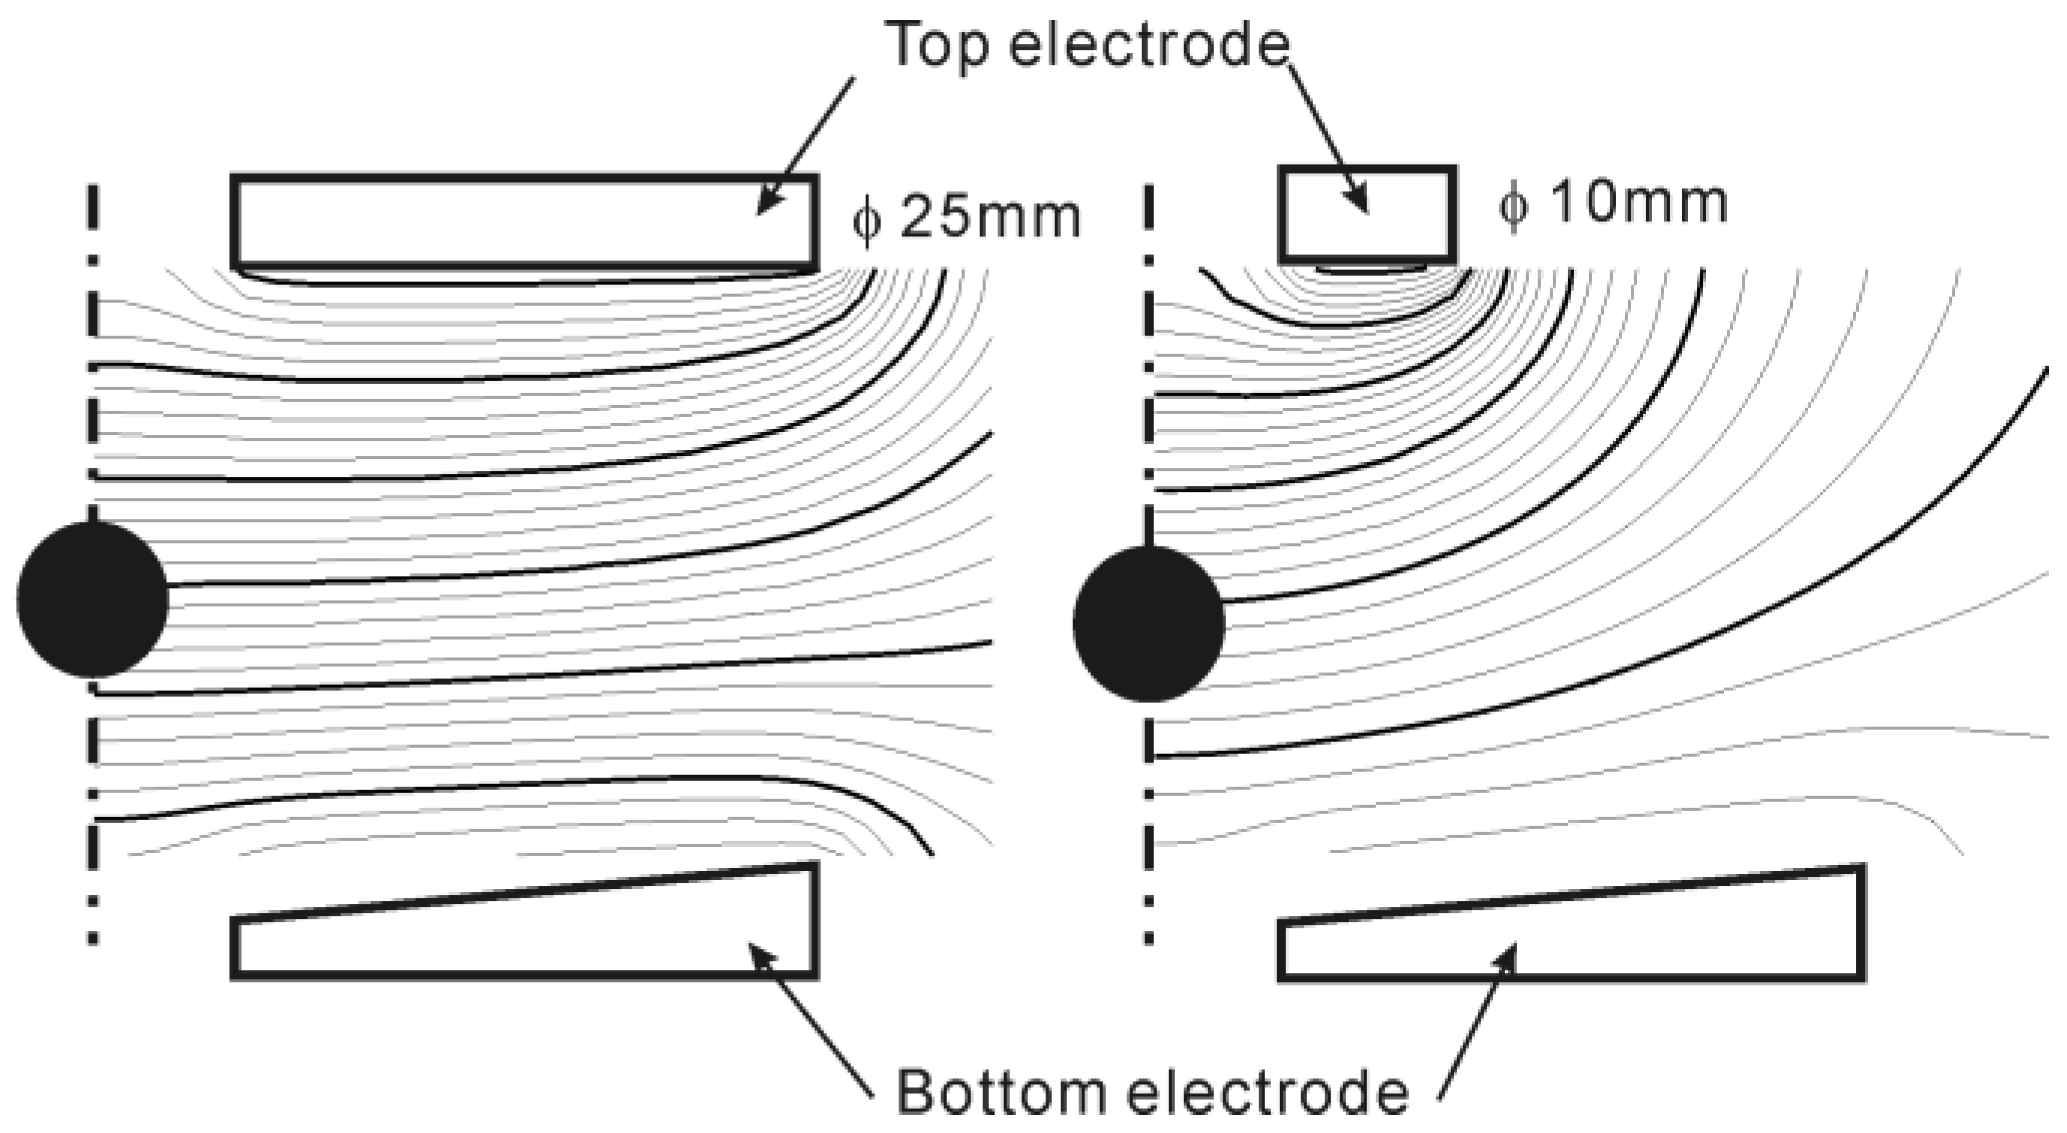
Figure 5.
Schematic diagram of the launch initiation technique depicting the laser beam directions: (a) prior launching (b) during levitation [21].
Figure 5.
Schematic diagram of the launch initiation technique depicting the laser beam directions: (a) prior launching (b) during levitation [21].
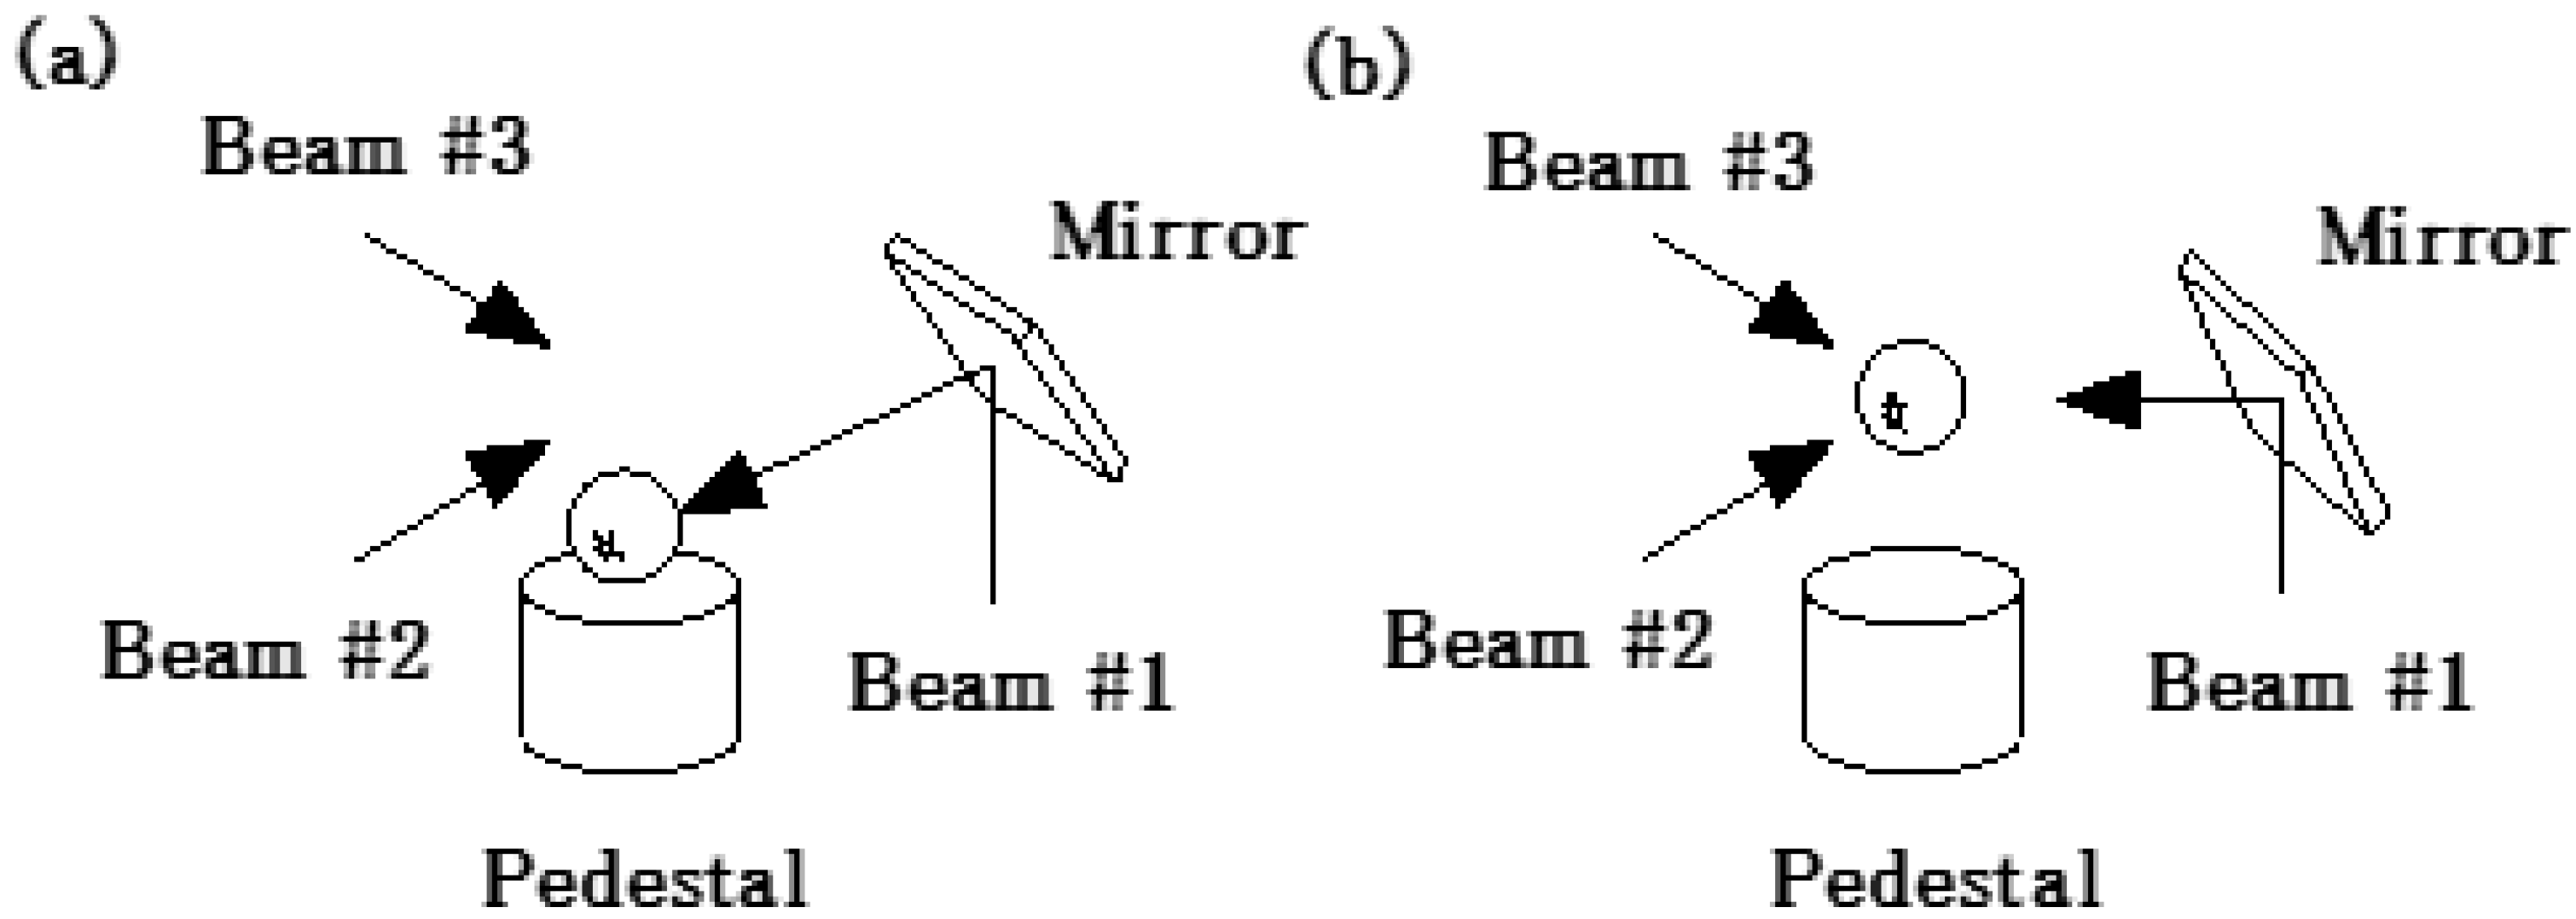
Figure 6.
Effects of the background on the sharpness of a sample at several temperatures [21]. A Zr sample at different temperatures (300 K, 1500 K, 2500 K from left to right) for a white back light (a–c), no back light (d–f), and a UV background illumination (g–i).
Figure 6.
Effects of the background on the sharpness of a sample at several temperatures [21]. A Zr sample at different temperatures (300 K, 1500 K, 2500 K from left to right) for a white back light (a–c), no back light (d–f), and a UV background illumination (g–i).
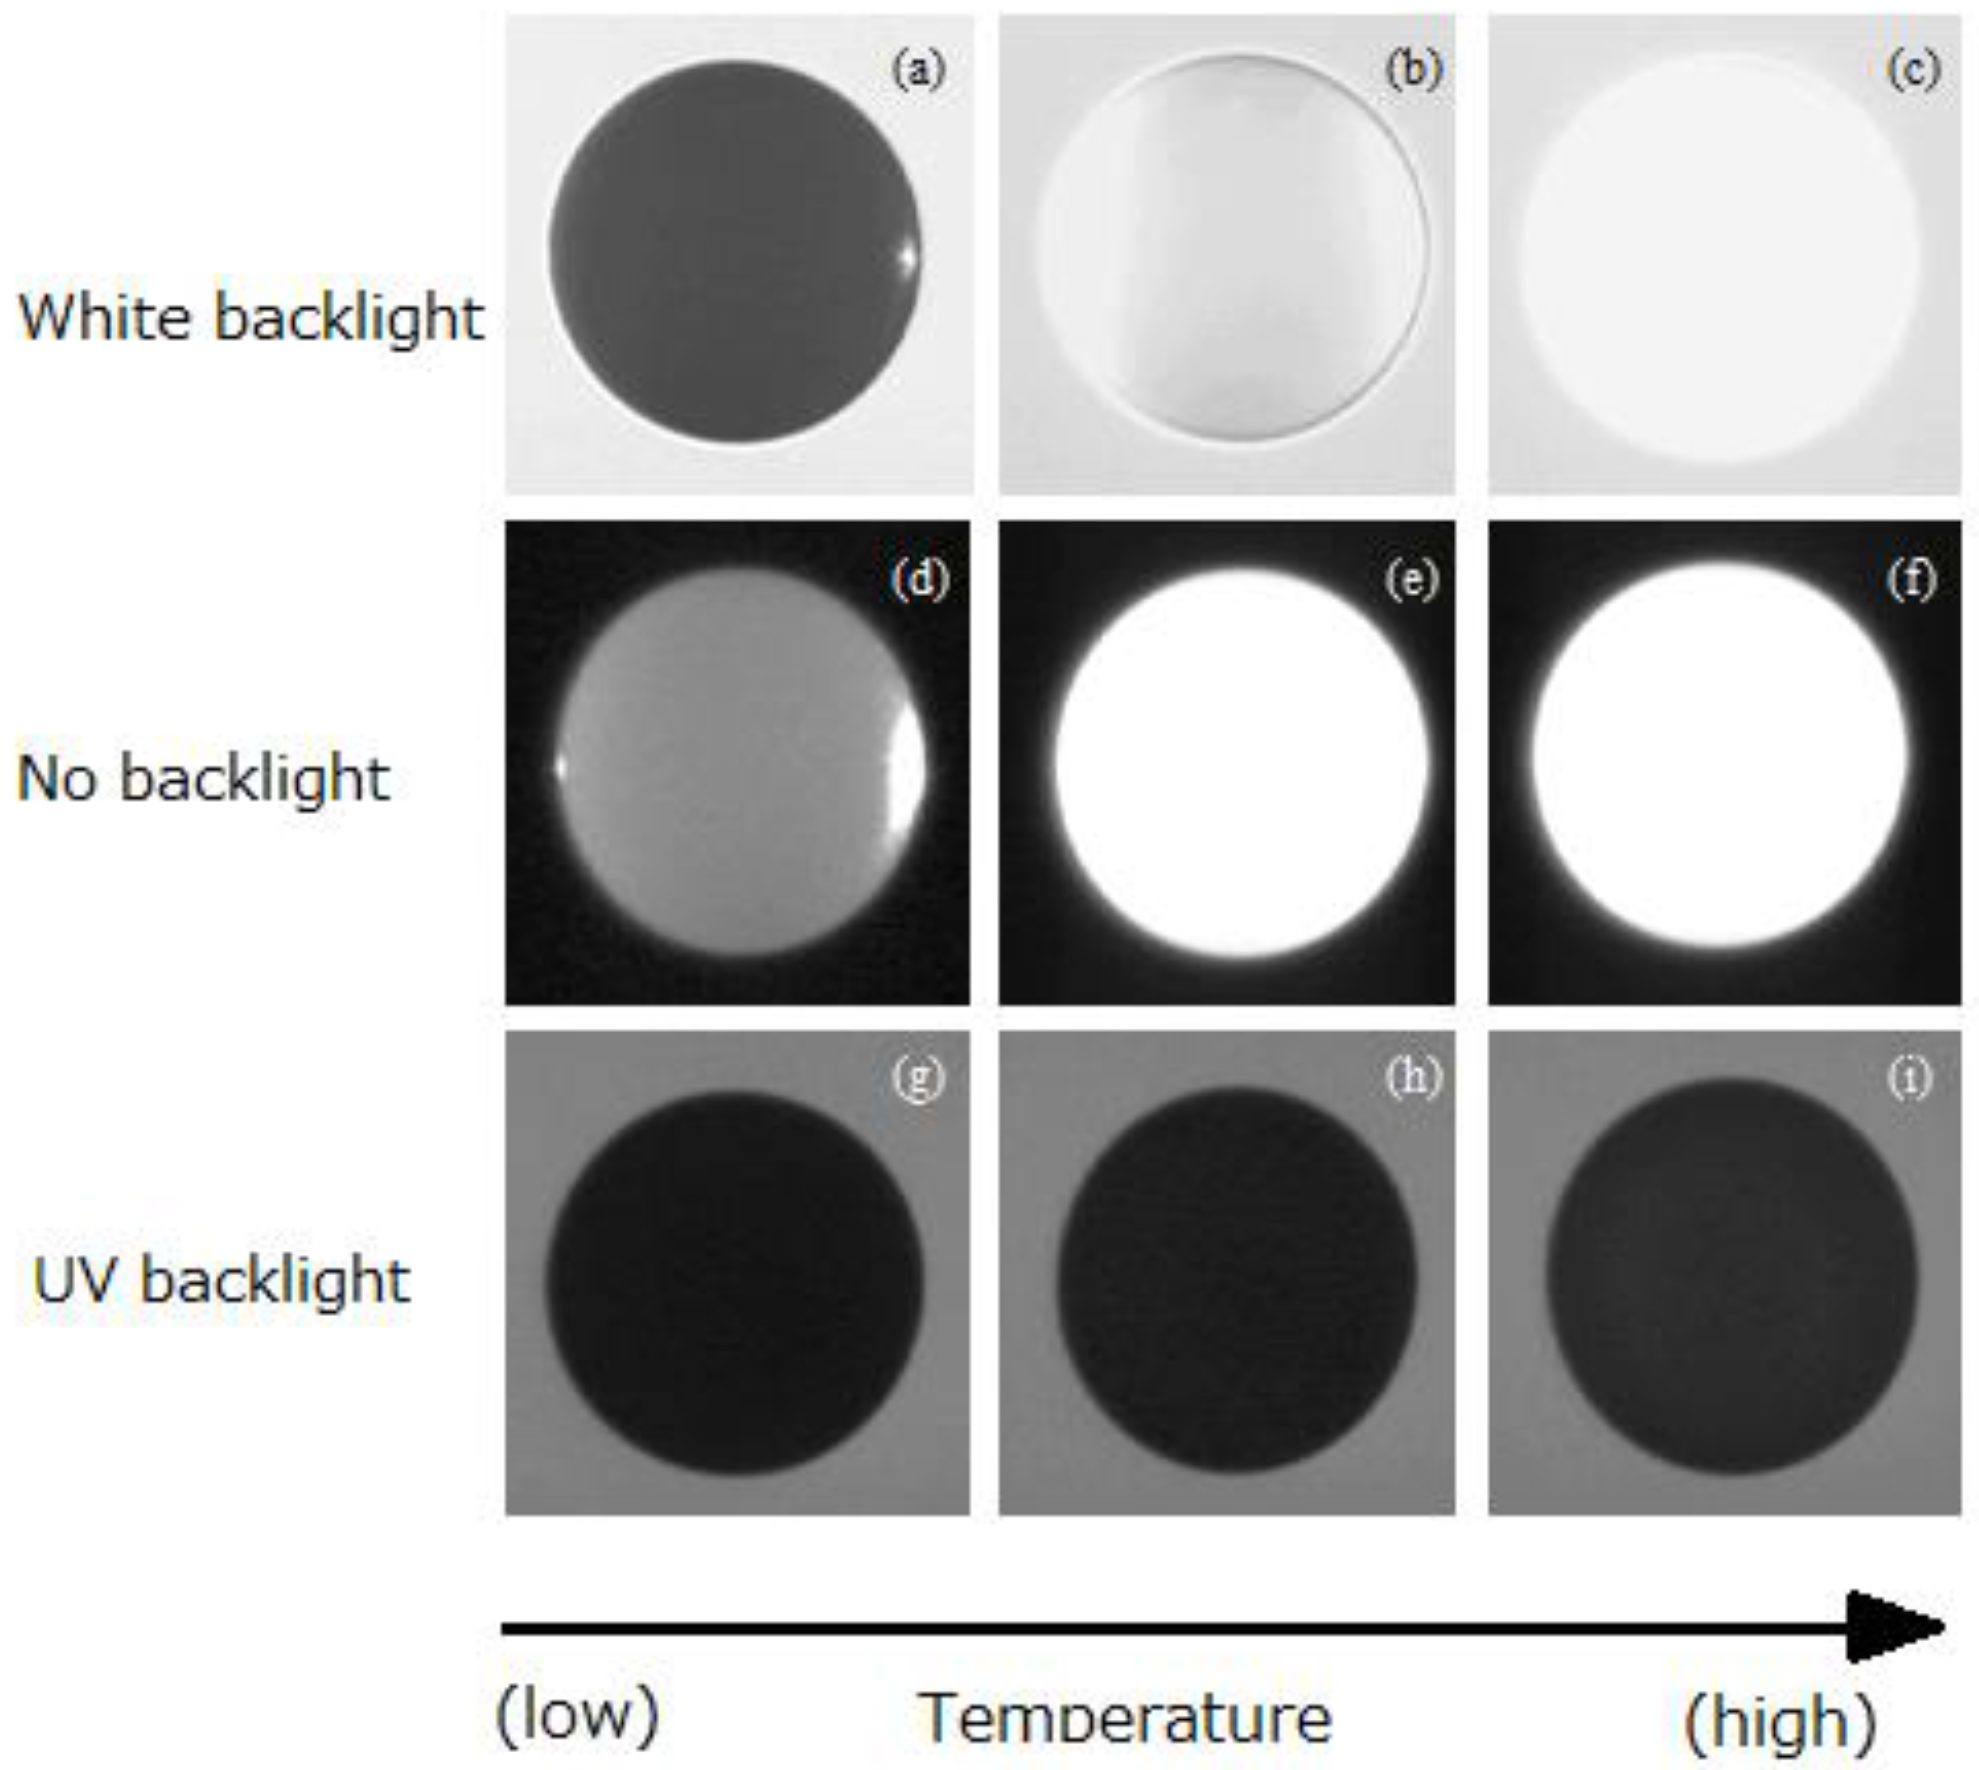
Figure 7.
Sample images of (a) W, (b) Re, and (c) Os at their melting temperature.
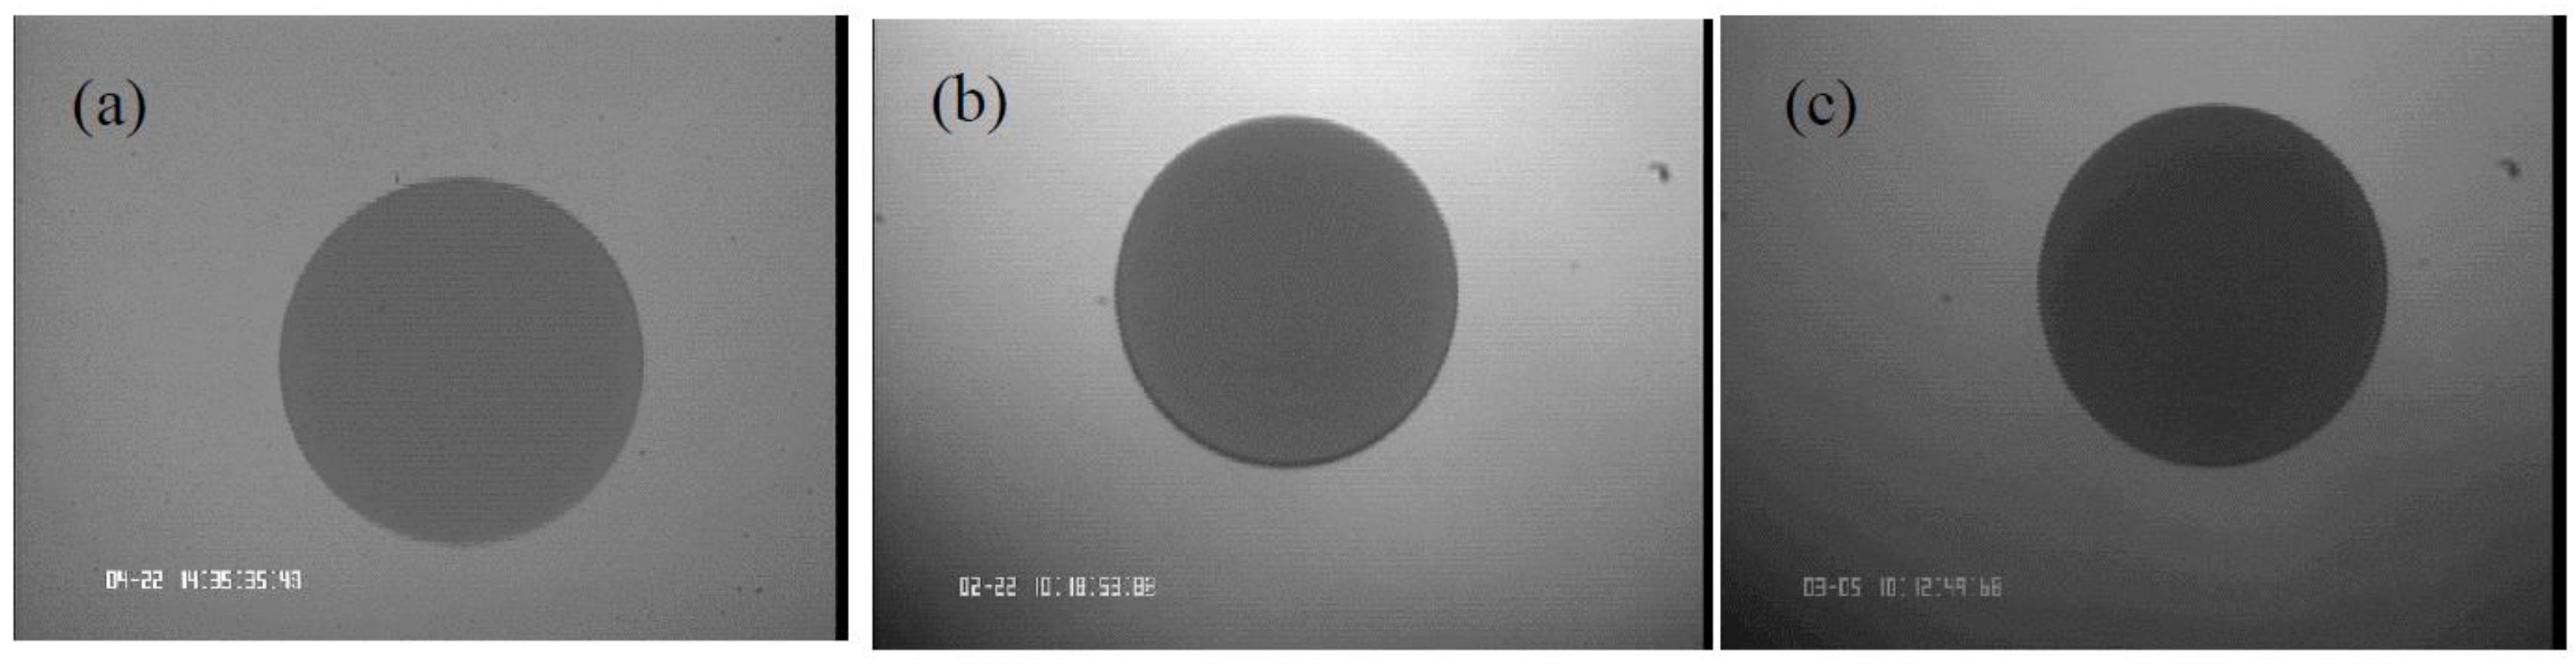
Figure 8.
Temperature history of melted and radiatively cooled samples samples showing supercooling and recalescence; (a) W, (b) Re, and (c) Os. In the case of Re, the temperature data obtained with a slow pyrometer are also plotted.
Figure 8.
Temperature history of melted and radiatively cooled samples samples showing supercooling and recalescence; (a) W, (b) Re, and (c) Os. In the case of Re, the temperature data obtained with a slow pyrometer are also plotted.


Figure 10.
Surface tension of W, Re, and Os versus temperature.
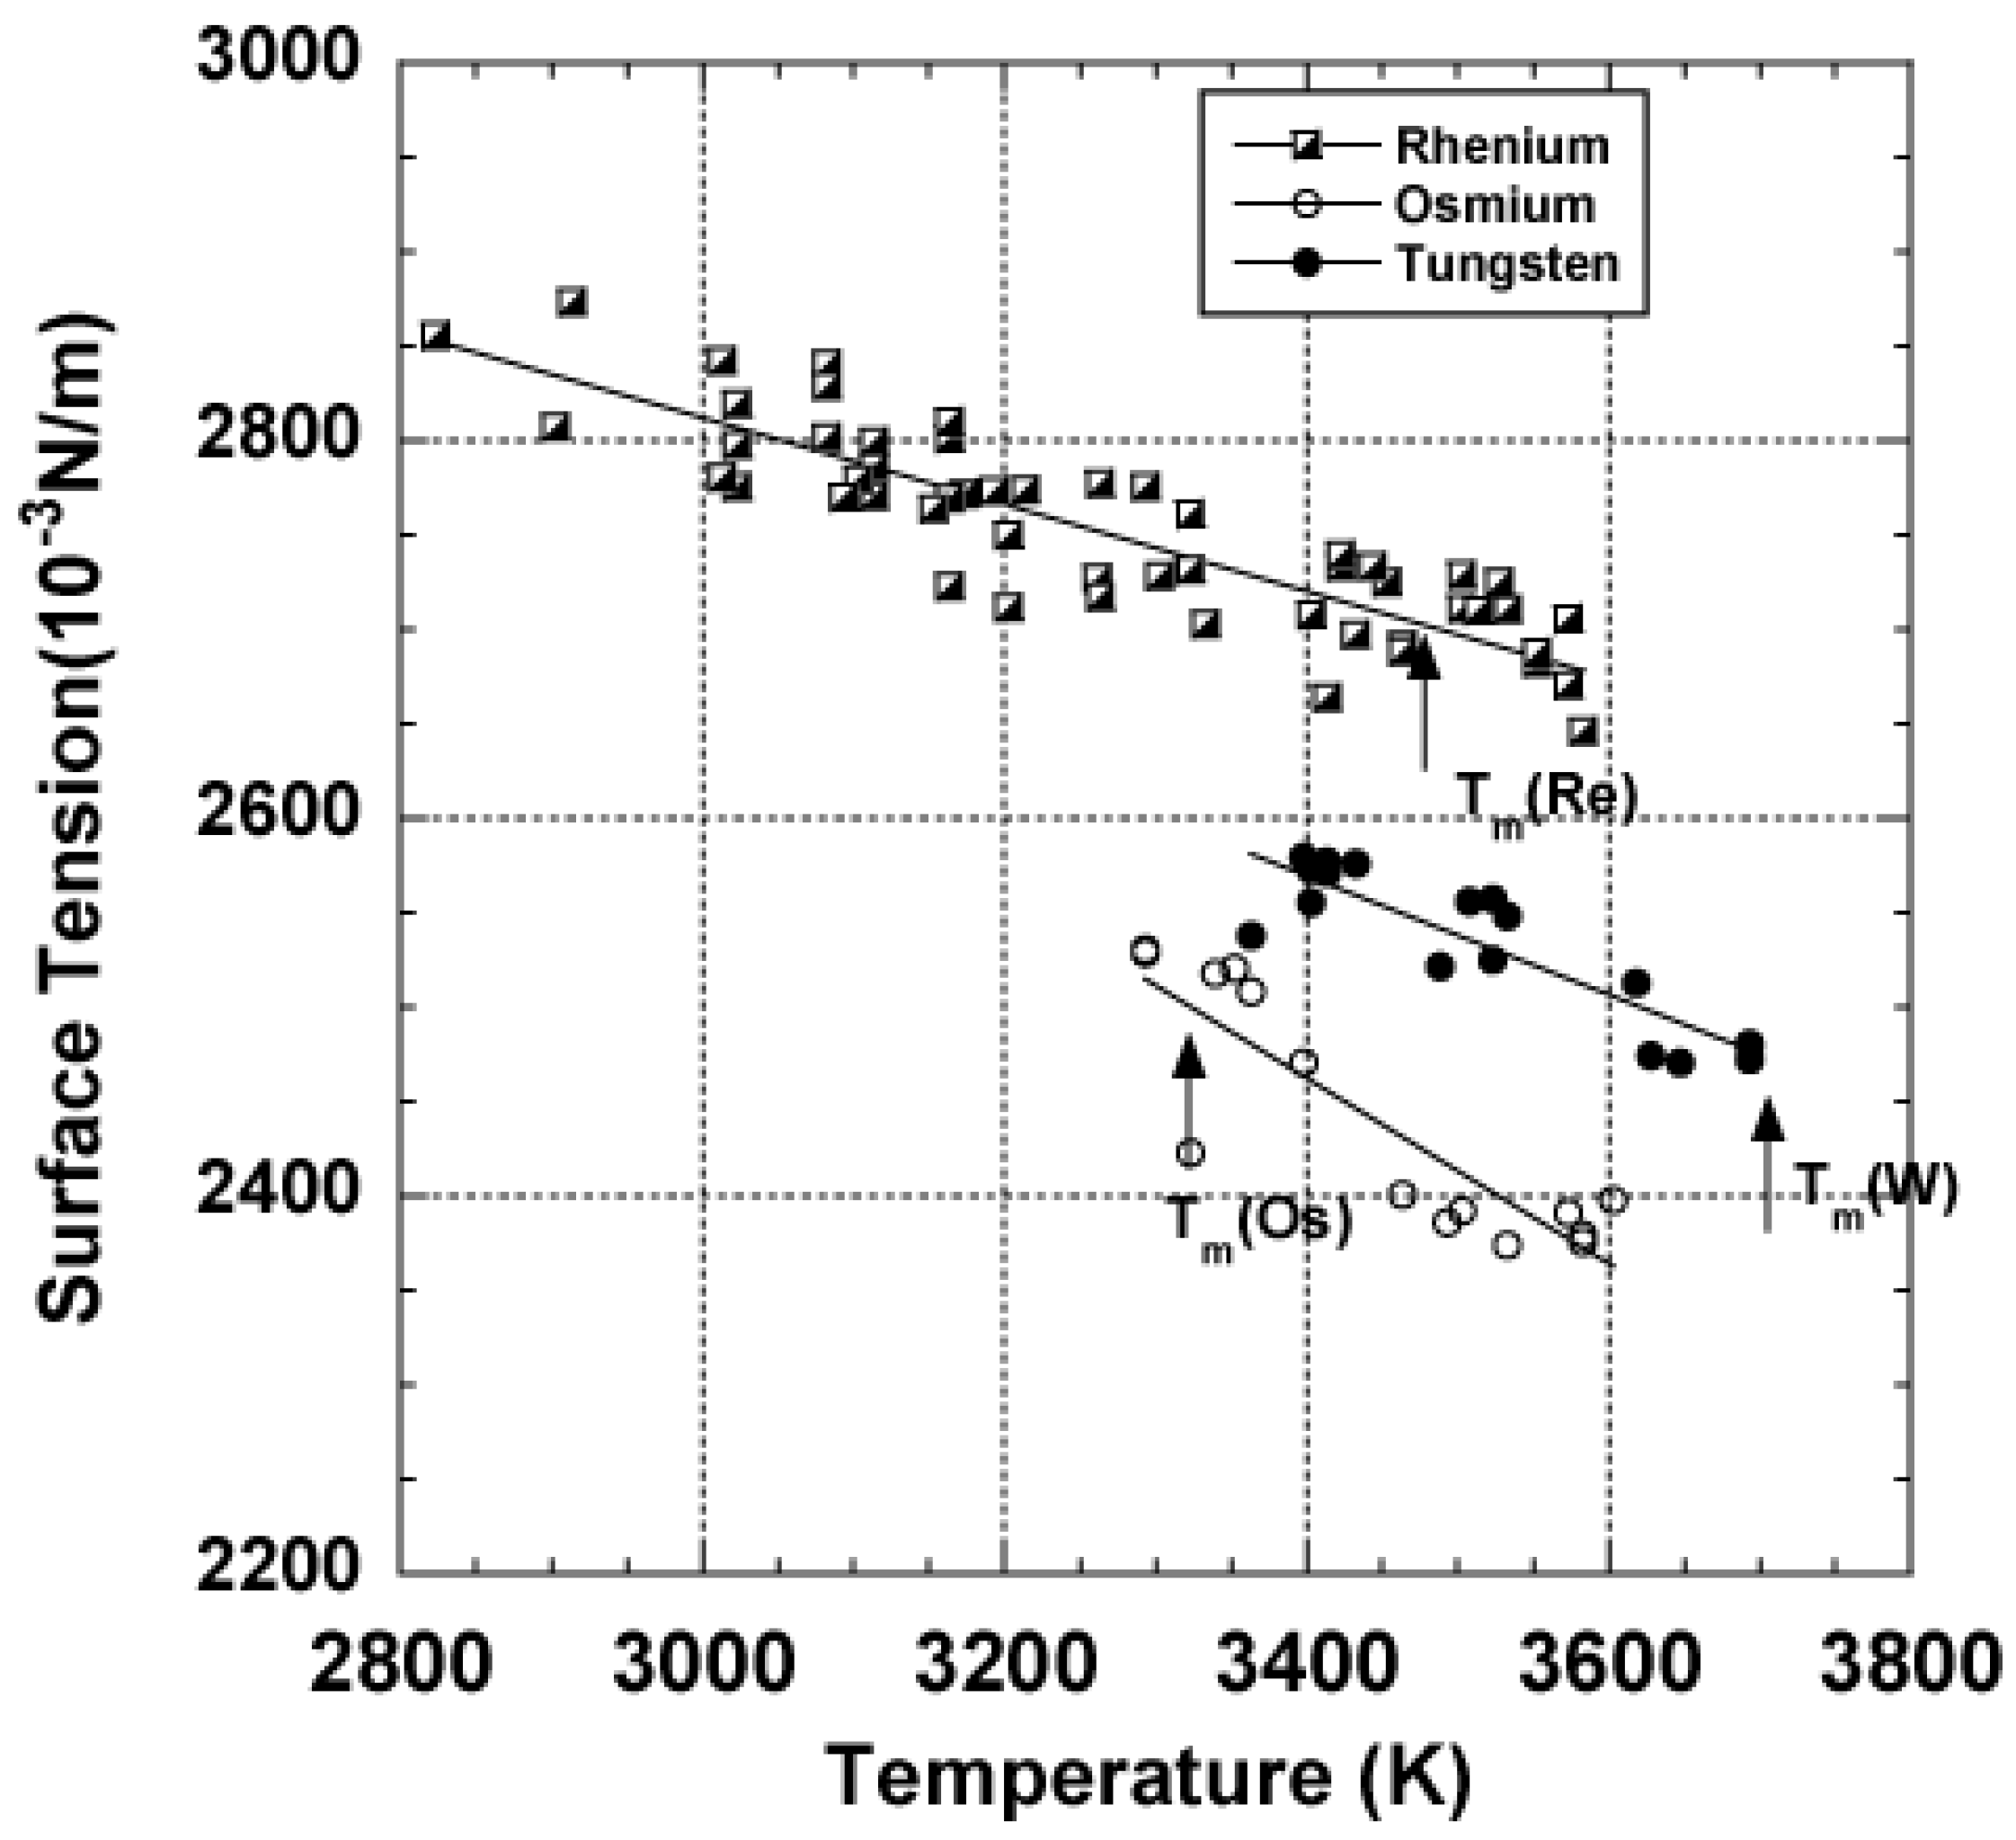
Figure 11.
Viscosity of W, Re, and Os versus temperature.


Table 1.
Typical sample size and applied voltage for levitation.
| Sample Mass (mg) | Sample Diameter (mm) | Voltage (kV) | Melting Temperature (K) | |
|---|---|---|---|---|
| W | 30–50 | 1.5–1.6 | 20–21 | 3687 |
| Re | 45–85 | 1.6–2.0 | 13–17 | 3458 |
| Os | 30–60 | 1.5–1.8 | 20–22 | 3306 |
| Zr | 16–34 | 1.7–2.2 | 8.5–11.5 | 2127 |
Table 2.
Measured density data of W, Re and Os.
| Density @Tm (×103 kg·m−3) | Temperature Coefficient (kg·m−3·K−1) | Method | Author | |
|---|---|---|---|---|
| W | 16.7 | −1.08 | Levitation | Present work [23] |
| 17.6 | – | Calculation | Calverey [26] | |
| 17.7 | – | – | Pekarev [27] | |
| 17.5 | – | Calculation | Allen [28] | |
| 16.26 | – | Pulse heating | Shaner et al. [29] | |
| 16.37 | – | Pulse heating | Seydel and Kitzel [30] | |
| 16.2 | – | Pulse heating | Berhault et al. [31] | |
| – | −0.79 | Calculation | Steinberg [32] | |
| Re | 18.65 | −0.79 | Levitation | Present work [24] |
| 18.9 | – | – | Pekarev [27] | |
| 18.7 | – | Calculation | Allen [28] | |
| 18.0 | – | Isobaric expansion | Thevenin [29] | |
| – | −0.82 | Calculation | Steinberg [32] | |
| Os | 19.1 | −1.16 | Levitation | Present work [19] |
| 19.2 | – | Calculation | Allen [28] |
Table 3.
Measured surface tension of W, Re, and Os.
| Surface tension @Tm (×10−3 N·m−1) | Temperature Coefficient (N·m−1·K−1) | Method | Author | |
|---|---|---|---|---|
| W | 2477 | −0.31 | Levitation | Present work [20] |
| 2330 | – | Pendant drop/Drop weight | Calverley [26] | |
| 2500 | – | Pendant drop/Drop weight | Allen [28] | |
| 2220 | – | Pendant drop/Drop weight | Pekarev [38] | |
| 2316 | – | Pendant drop/Drop weight | Martsenyuk [38] | |
| 2300 | – | Pendant drop/Drop weight | Agaev [38] | |
| 2310 (@3680 K) | – | Pendant drop/Drop weight | Vinet [9] | |
| Re | 2710 | −0.23 | Levitation | Present work [36] |
| 2610 | – | Pendant drop/Drop weight | Pekarev [38] | |
| 2700 | – | Pendant drop/Drop weight | Allen [28] | |
| 2520 (@ 3440 K) | – | Pendant drop/Drop weight | Vinet [39] | |
| Os | 2480 | −0.34 | Levitation | Present work [19] |
| 2500 | – | Pendant drop/Drop weight | Allen [28] |
Table 4.
Measured viscosity data of W, Re, and Os.
| Viscosity @Tm (×10−3·Pa·s) | η = η0exp(E/RT) | Method | Author | ||
|---|---|---|---|---|---|
| η0 (×10−3 Pa·s) | E (J·mol−1) | ||||
| W | 8.5 | 0.16 | 122 | Levitation | Present work [40] |
| Re | 9.9 | 0.54 | 83.7 | Levitation | Present work [40] |
| Os | 7.0 | 0.098 | 111.5 | Levitation | Present work [40] |
Table 5.
Estimation of evaporation rate using loss of mass during surface tension/ viscosity measurements.
Table 5.
Estimation of evaporation rate using loss of mass during surface tension/ viscosity measurements.
| Temperature Range (K) | Duration of Experiment (s) | Loss of Mass (mg) | Evaporation Rate (mg/s) | ||
|---|---|---|---|---|---|
| W | Run#1 | 3363–3693 | 445 | 12.2 (44.2 to 32.0) | 0.027 |
| Run#2 | 3693 | 30 | 0.9 (43.0 to 42.1) | 0.03 | |
| Run#3 | 3398–3573 | 168 | 2.8 (50.8 to 48.0) | 0.016 | |
| Re | Run#1 | 2903–3463 | 413 | 4.2 (47.6 to 43.4) | 0.010 |
| Run#2 | 2823–3467 | 516 | 6.9 (85.5 to 78.6) | 0.013 | |
| Os | Run#1 | 3418–3511 | 203 | 15.2 (60.9 to 45.7) | 0.075 |
| Run#2 | 3323–3603 | 213 | 15.7 (47.0 to 31.3) | 0.074 |
© 2017 by the authors. Licensee MDPI, Basel, Switzerland. This article is an open access article distributed under the terms and conditions of the Creative Commons Attribution (CC BY) license (http://creativecommons.org/licenses/by/4.0/).
Share and Cite
MDPI and ACS Style
Ishikawa, T.; Paradis, P.-F. Challenges of Handling, Processing, and Studying Liquid and Supercooled Materials at Temperatures above 3000 K with Electrostatic Levitation. Crystals 2017, 7, 309. https://doi.org/10.3390/cryst7100309
AMA Style
Ishikawa T, Paradis P-F. Challenges of Handling, Processing, and Studying Liquid and Supercooled Materials at Temperatures above 3000 K with Electrostatic Levitation. Crystals. 2017; 7(10):309. https://doi.org/10.3390/cryst7100309
Chicago/Turabian StyleIshikawa, Takehiko, and Paul-François Paradis. 2017. "Challenges of Handling, Processing, and Studying Liquid and Supercooled Materials at Temperatures above 3000 K with Electrostatic Levitation" Crystals 7, no. 10: 309. https://doi.org/10.3390/cryst7100309
Note that from the first issue of 2016, this journal uses article numbers instead of page numbers. See further details here.