
Preparation of Potassium Dichromate Crystals from the Chromite Concentrate by Microwave Assisted Leaching
by
Hua Liu
1,2,3,4, 
Shenghui Guo
1,2,3,4,*,
Jinhui Peng
1,2,3,
Duan Yu
1,2,3,4,
Libo Zhang
1,2,3,4 and
Linqing Dai
1,2,3,* 1
State Key Laboratory of Complex Nonferrous Metal Resources Clean Utilization, Kunming University of Science and Technology, Kunming 650093, China
2
Faculty of Metallurgical and Energy Engineering, Kunming University of Science and Technology, Kunming 650093, China
3
Key Laboratory of Unconventional Metallurgy, Ministry of Education, Kunming 650093, China
4
National Local Joint Laboratory of Engineering Application of Microwave Energy and Equipment Technology, Kunming 650093, China
*
Authors to whom correspondence should be addressed.
Crystals 2017, 7(10), 312; https://doi.org/10.3390/cryst7100312
Submission received: 28 August 2017
/
Revised: 10 October 2017
/
Accepted: 11 October 2017
/
Published: 18 October 2017
(This article belongs to the Section Crystalline Materials)
Abstract
:In the present investigation, the oxidizing roasting process of chromite with sodium carbonate to prepare potassium dichromate crystals was studied in the microwave field with air, by heating the chromite and sodium carbonate. The chromite and sodium carbonate heated separately at 1000 °C in the microwave oven (frequency: 2.45 GHz; power 1.5 kW) in order to study the microwave absorption properties. The dielectric constant and dielectric loss factor of the chromite and sodium carbonate examined. Then, chromite with sodium carbonate taken in (1:2) ratio and heated at 750 °C. Thus obtained samples were characterized using various techniques includes Powder-XRD (XRD), Scanning Electron Microscopy (SEM), and X-ray fluorescence (XRF). The XRD pattern reveals the existence of Fe3O4, Fe2O3, NaAlO2, and Na2CrO4. The iron and aluminum were leached out as Fe2O3 and Al(OH)3 respectively. The resulting sample treated with the KCl to prepare potassium dichromate crystals. Finally, potassium dichromate crystals formed.
1. Introduction
The application of microwave heating in metallurgy has been developed in recent years. Some of the world’s developed countries such as United States, United Kingdom, Japan, and Canada have given the great importance to this new technology. China has started the research work in this field from 1980s. Tiny although the application of microwave heating in metallurgy is still in the development stage [1,2], many attractive research results have been obtained, and microwave heating has been used in the pretreatment of the ore crushing, refractory gold ore, and the recovery of gold from tailings, extraction of rare metals from ores and heavy metals [3,4,5,6].
The microwave is an electromagnetic wave, with the frequency of 0.3–300 GHz (wavelength in 1–1000 mm), and located in the electromagnetic spectrum of red between the external radiation and radio wave. The heating effects of microwave are characterized as follows: (1) the powder material can be heated quickly, and the heating effect can shorten reaction time; (2) can selectively heat the powdery material to make the ore mine and the gangue minerals produce thermal dissociation; (3) can be used without contact with thermal powder material to avoid the external pollution of the material; (4) with molecular ruler degree of stirring, can create a strong solid-solid state reduction kinetics, microwave energy is a new type of heating energy, which has obvious advantages.
It is possible to realize that the rapid and selective heating of powder material [7,8,9]. In order to avoid the traditional heating method, it is required to bring the powder material heat and mass transfer to the phenomenon of uneven, using microwave heating method, which can effectively heat material [10].
Potassium dichromate crystals are orange-red monoclinic crystal plate-shaped crystals [11]. The main raw material mainly used for the production of chromate products such as Cr2O3 etc. [12]. In the chemical industry, it is used as an oxidizing agent to make a match head. Manufacture of enamel powder used for enamel, enamel to green. The glass industry as a colorant. Printing and dyeing industry as a mordant. In the spice industry it is used as an oxidizing agent. In addition, it is one of the important reagents to test the Chemical Oxygen Demand (COD) of the water body. The acid water solution can detect the ethanol, and the ethanol can quickly generate the blue and green trivalent Cr ion [13,14], and the solution becomes green. Acidification of potassium dichromate can be ethanol oxidation and discoloration, to test whether the driver drunk driving [15].
In nature, it is easy to form a symbiosis with iron Chromium Picotite (Cr2O3·FeO), this type of symbiotic ore is commensurate with the chromium iron ore (chromite) [16,17]. Chromite is China’s shortage of mineral resources, reserves accounted for only 15% of the world, and the size of deposit is small, scattered and ore grade is low [18,19,20], the dependence on the import of chrome ore is high up to about 95% in our country.
Chromite easily forms a symbiosis with picotite [(Mg, Fe)Cr2O4] in nature, this type of symbiotic ore is commensurate with the chromite [21,22]. The Chromite is the main raw material for the production of chromium compounds, which is the main component of FeO·Cr2O3, in general, chromite content is about 40%. It is commonly used in the chromite preparation of potassium dichromate in Laboratory [23]. But the conventional heating and extraction are slow in this process. Importantly, the conversion rate of Cr is not very high. Ultrasonic extraction can accelerate the conversion rate and shorten the extraction time and strengthen the effect of extraction and also can improve the conversion rate of some elements [24,25,26,27,28].
In this paper, mainly research using chromite to prepare potassium dichromate crystals in the field of the microwave is reasonable and by microwave heating and ultrasonic extraction can get a high purity of potassium dichromate crystals.
2. Experimental Work
2.1. Materials and Characterization
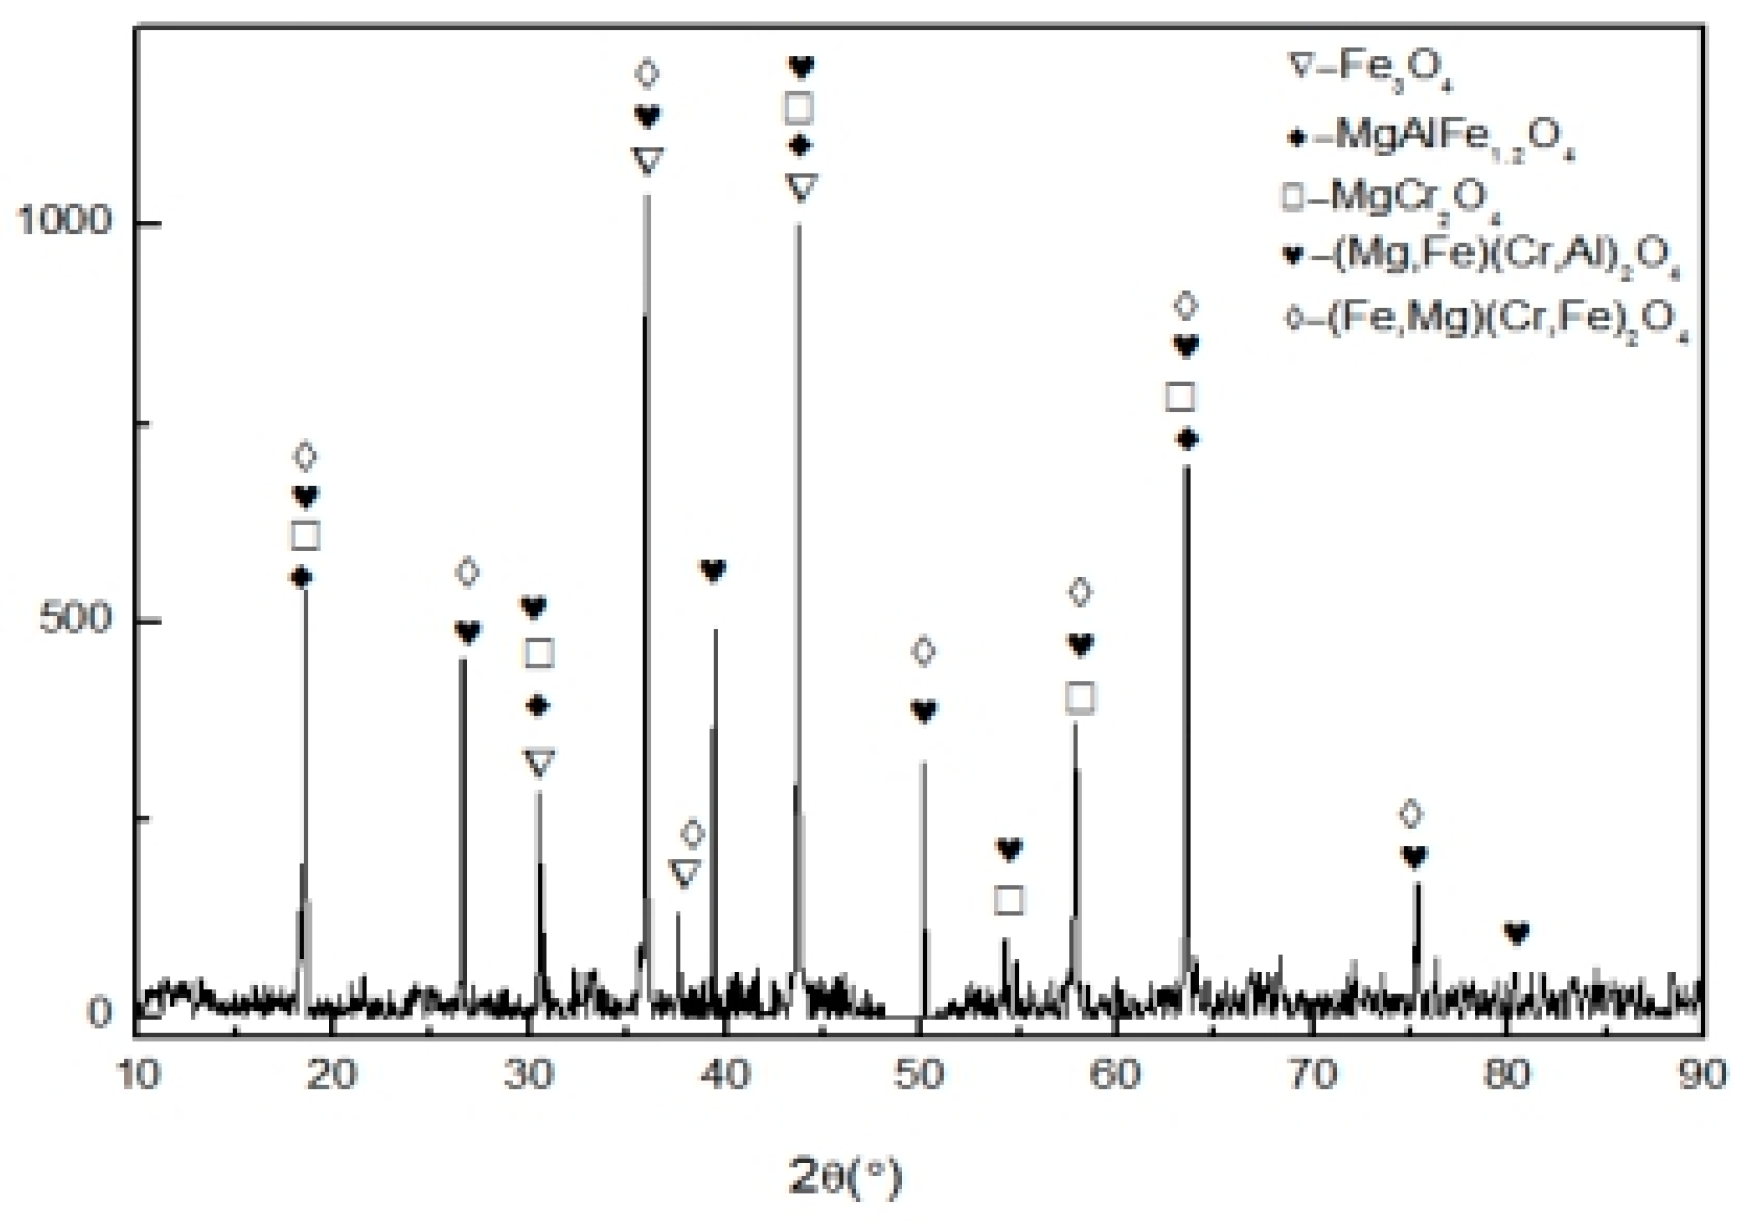
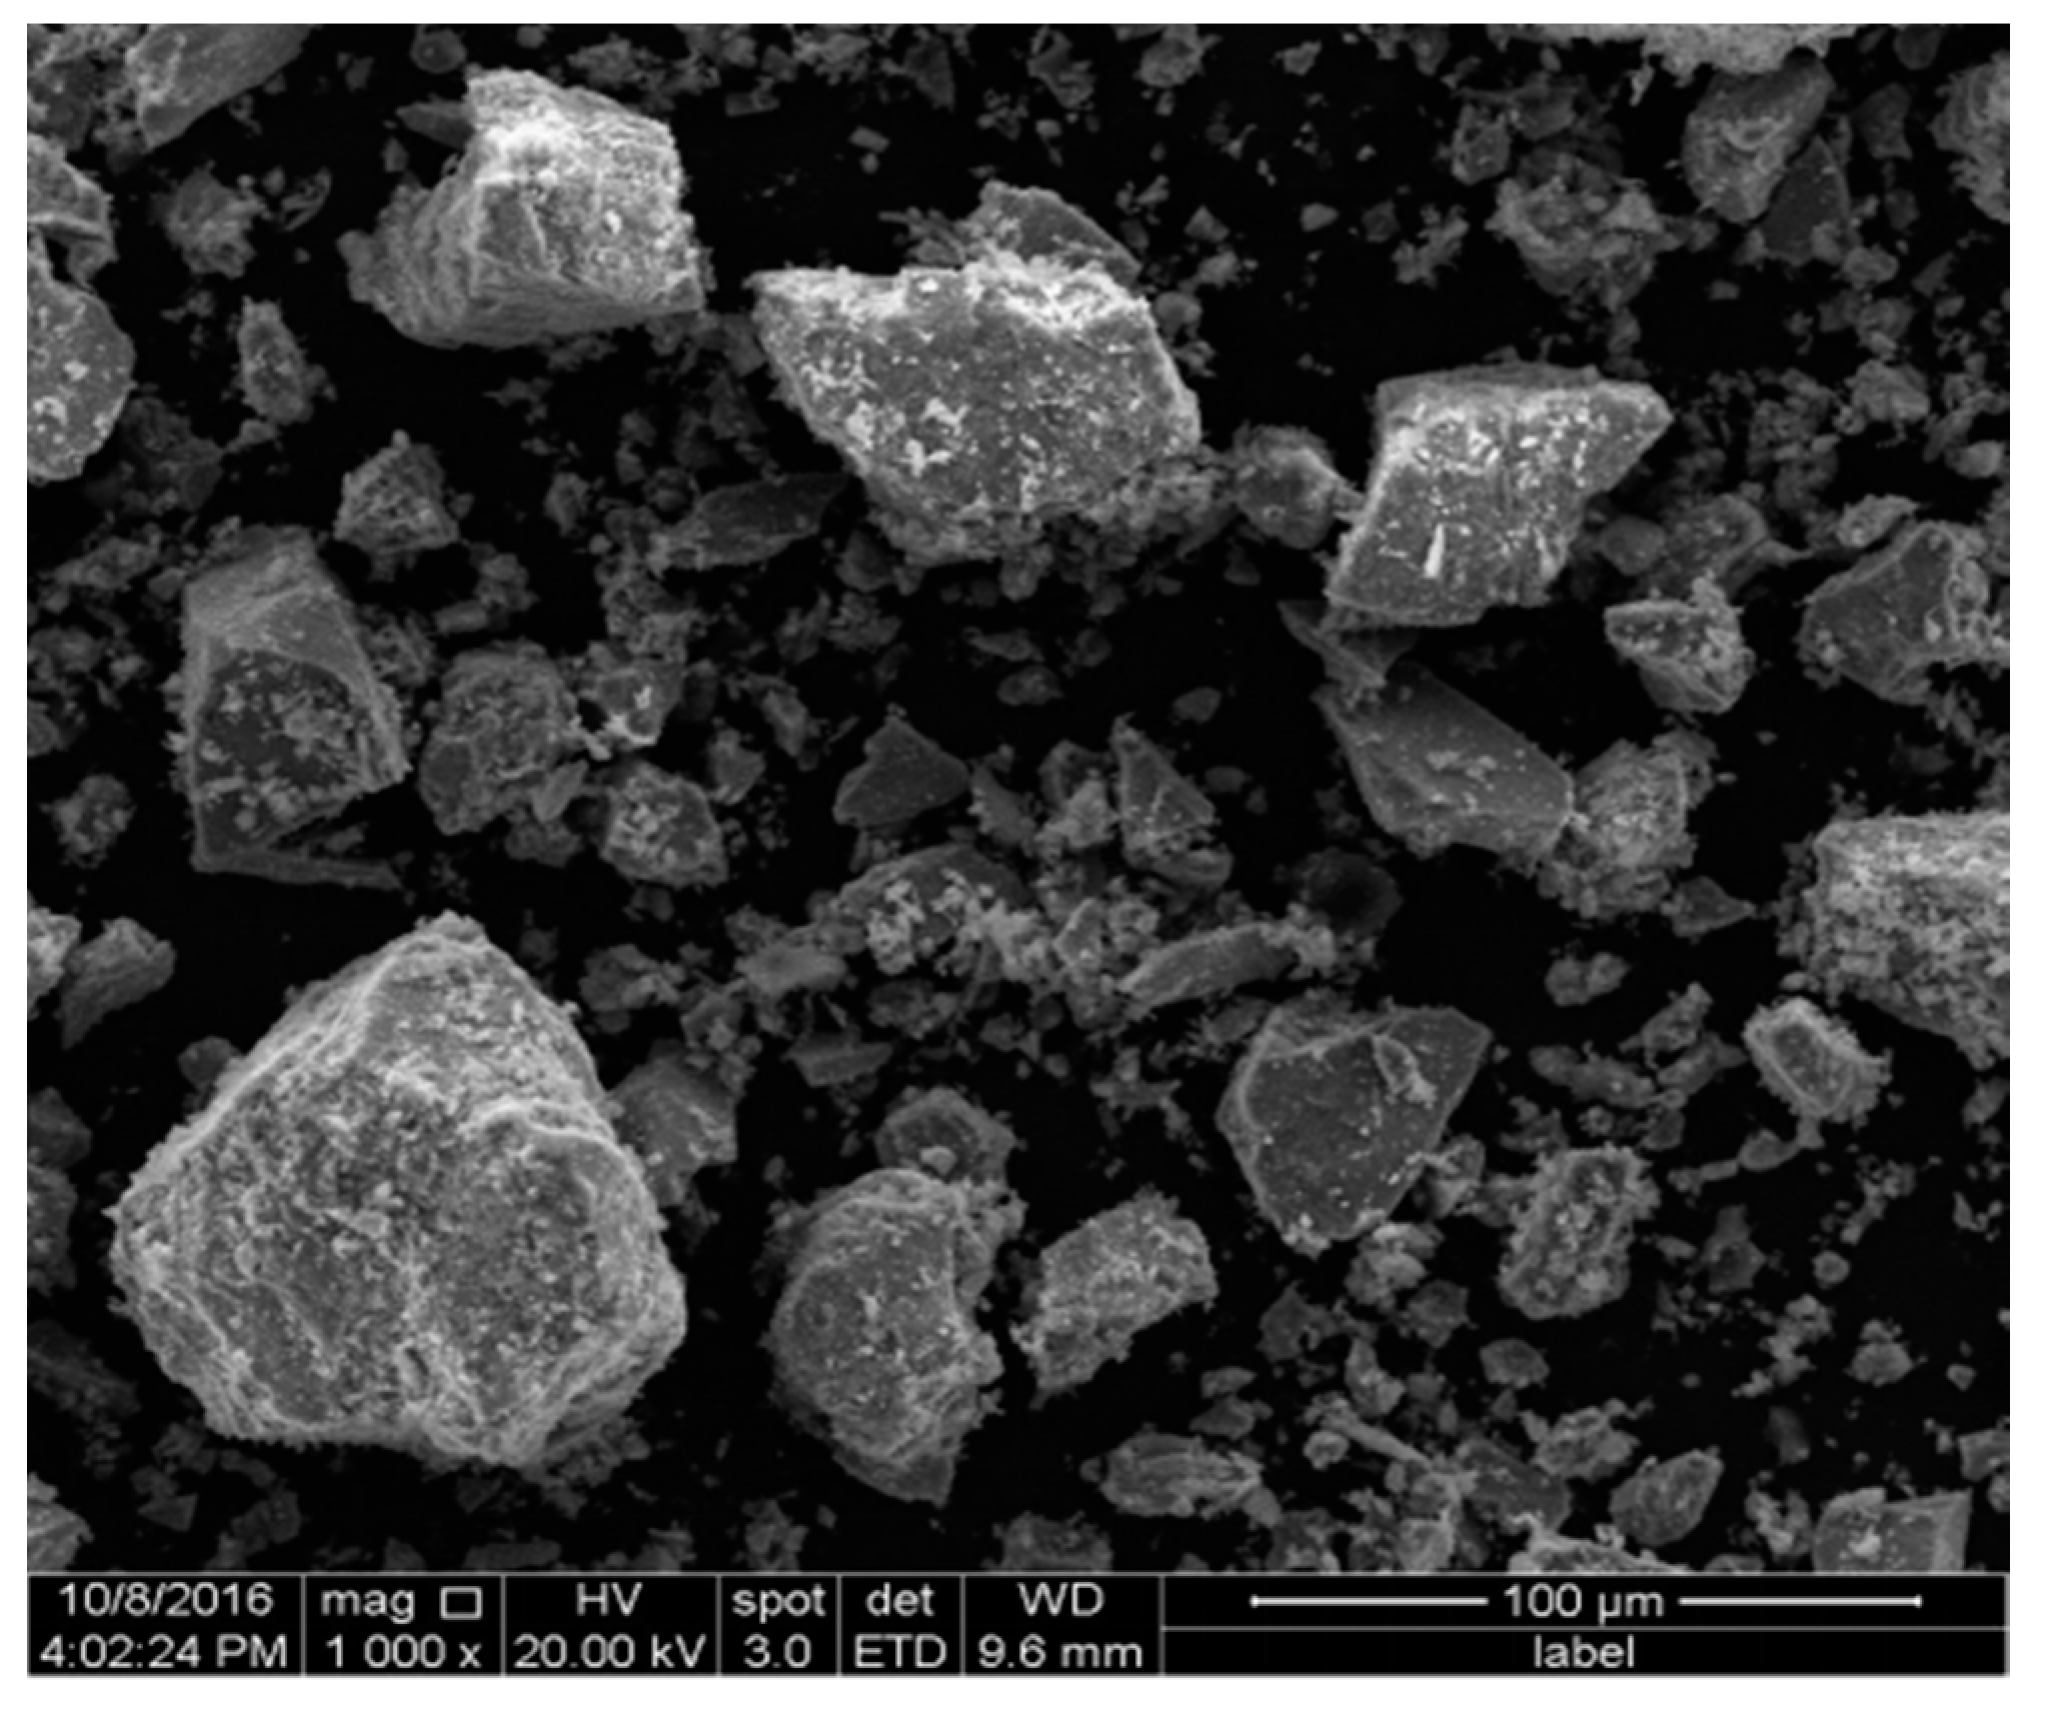
The chromite concentrate sample originated from South Africa and provided by Jinzhou Company in Liaoning Province, China. The brief chemical components of chromite analyzed by inductively coupled plasma optical emission spectrometry (ICP-OES) and the results listed in Table 1. Phase analysis of the chromite concentrate was performed with the XRD (Bruker, Billerica, MA, USA; CuKα, wavelength: 1.5405980) and the patterns were shown in Figure 1. The SEM images of the chromite concentrate were recorded using JSM-35CF SEM equipment (JAPAN Electron Optics Laboratory Co, Ltd., Tokyo, Japan) and shown in Figure 2. The particle size distribution was measured using particle size analyzer (LS230, Beckman Coulter, Brea, CA, USA).
2.2. Dielectric Property Measurement System
The microwave absorbing property of the material is an important physical indicator in the field of microwave chemistry. In this work, a hybrid experimental/computational permittivity measuring system developed by the Institute of Applied Electromagnetics at Sichuan University used to determine the complex permittivity of the chromite and sodium carbonate at different sample temperature. First, the quartz tube without measuring material calibrated to get the resonant frequency and the quality factor of empty cylindrical cavity, then the sample was placed in the calibration, which has already completed with the diameter of 4 mm quartz tube. At the beginning of the experiment, the quartz tube kept into the test chamber for calibration, the calibration is completed. Sample materials kept into quartz tube measured at the start 2.45 GHz electromagnetic wave propagation along the waveguide section. When it encountered the material of the quartz tube, the energy of the wave absorption, transmission, and reflection, change the microwave output frequency and quality factor of the material observed before and after the entry of the quartz tube, which can calculate the absorbing ability of the size of the quartz tube material. The structure of dielectric constant measurement device shown in Figure 3.
2.3. Experimental Setup and Procedure
All experiments were carried out in a microwave oven, which was developed by Kunming University and it has a good performance. Its adjustable power range was 0–6 kW, microwave frequency was 2.45 GHz; with a tungsten-rhenium thermocouple (measuring temperature range: 0–1800 °C). The particle size of chromite was 74 μm and it was measured using particle size analyzer. The chromite powder (50 g) and sodium carbonate (50 g) separately heated in microwave heating furnace (frequency 2.45 GHz, power 1.5 kW) using silicon carbide crucible. Similarly, chromite and sodium carbonate mixed (weight ratio of 1:2) and roasted using a microwave oven for 30 min at 750 °C. Thus, the obtained sample contains Fe3O4, Fe2O3, NaAlO2, and Na2CrO4. The sample was ground, water added and ultrasonic extraction carried to remove Iron particles. Then the iron-free sample was neutralized (pH: 7 to 8) using glacial acetic acid to leach out the aluminum particles. Further, glacial acetic acid was added (pH: 5) in order to convert CrO42− into Cr2O72−. Then the KCl solution added and heated. When crystals precipitation appeared, the heating stopped and crystals washed to remove KCl in a hot environment. Afterwards, the filtrate cooled and transferred into the ice bath. Then a large amount of K2Cr2O7 formed [29]. It washed with ice water, at this time because K2Cr2O7 has a relatively large solubility and retained in the filtrate. Finally, the orange-red crystals obtained (Figure 4).
The waste liquid must be recycled because Cr is poisonous. The conversion rate of chromite calculated according to the following formula [30]:
where [Cr]r, Vr and m0 denotes the Cr concentration (g/L) in the leach liquor, the volume (L) of the leach liquor, and the Cr mass (g) in the chromite concentrate, respectively.
%η(Cr) = [Cr]r·Vr/m0 × 100
2.4. Determination of Purity of the Resultant Product
2.5 g (msample) of K2Cr2O7 weighed, dissolved in 250 mL volumetric flask (VK2Cr2O7), and transferred 25 mL solution to an iodine flask (V1K2Cr2O7). Then, put 10 mL (2 mol/L) H2SO4 solution and 2 g KI solid mixture for 5 min in the dark and added to 100 mL of distilled water, the solution changed to yellow-green with the prepared standard 0.1 mol/L Na2S2O3(CNa2S2O3) solution. Then, starch 3 mL (density 1.5 g/cm3) added and continued titration solution until the blue faded presenting a bright green, according to Na2S2O3 standard the concentration and use of the volume (VNa2S2O3) to calculate the conversion rate of the product. The main reactions involved in this process as follows:
3. Results and Discussion
According to the previous reports, in the microwave field, the process of material heating mainly decided by the dielectric loss in the electromagnetic field. The dielectric properties characterized by two parameters (1) dielectric constant and (2) dielectric loss factor. The numerical value reflects the interaction between the reduced material and the electromagnetic field. When the reducing material placed in the microwave field, the dielectric polarization will occur due to the presence of a series of different particle reduction materials, namely the dielectric polarization when the particles were not the same, polarization and elimination time was not the same. The dielectric constant and dielectric loss factor of the material calculated theoretically to explain the strength of the material wave absorbing property [31,32,33,34,35,36,37].
During the microwave heating process, the FeO·Cr2O3 was oxidized to Na2CrO4 in the presence of O2 and Na2CO3. At the same time, the components of Al2O3, Fe2O3, and SiO2 all transformed into the corresponding soluble salts NaAlO2, NaFeO2 and Na2SiO3, all of them dissolve easily in water. Action equations of the main reactions are as follows:
Thus formed NaFeO2 is leached in the form of Fe(OH)3 the main reaction equation is as follows:
Controlling the pH in the process helps in the leaching of NaAlO2 and Na2SiO3 by precipitation of Al(OH)3 and H2SiO3, while Na2CrO4 converted to Na2Cr2O7. The reaction equations of the main reactions are as follows:
The Na2Cr2O7 react with KCl and forms the K2Cr2O7 as fellows [38]:
3.1. The Absorption Properties of Raw Materials
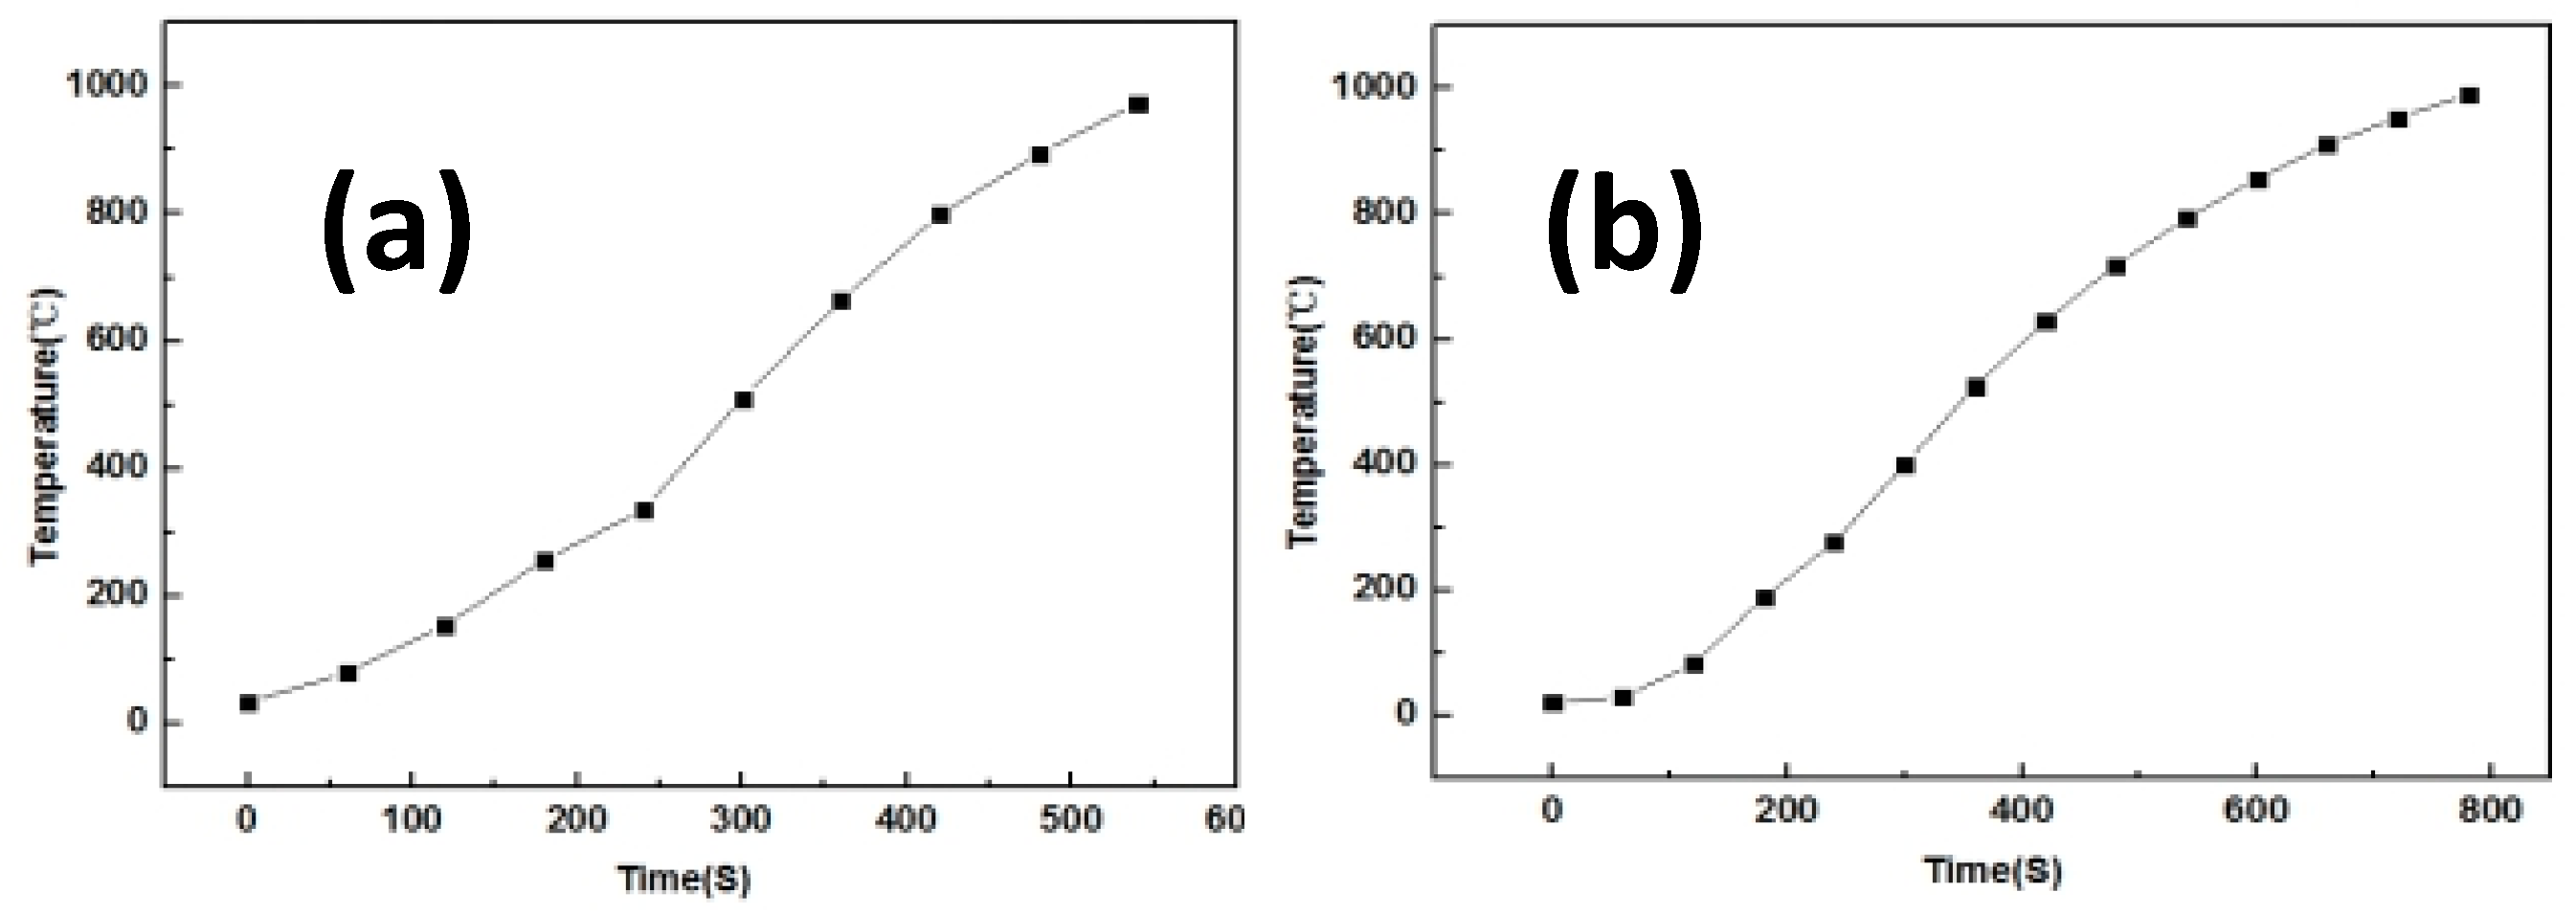
Figure 5 shows the temperature rise characteristic curves of the chromite and the solid sodium carbonate respectively in the microwave field. Chromite concentrate heated to 1000 °C in 6 min and the heating rate was 167 °C/min, then the solid sodium carbonate was raised 1000 °C in 13 min and the heating rate was 77 °C/min. From the temperature rise curves, chromite and solid sodium carbonate have good wave absorbing properties.
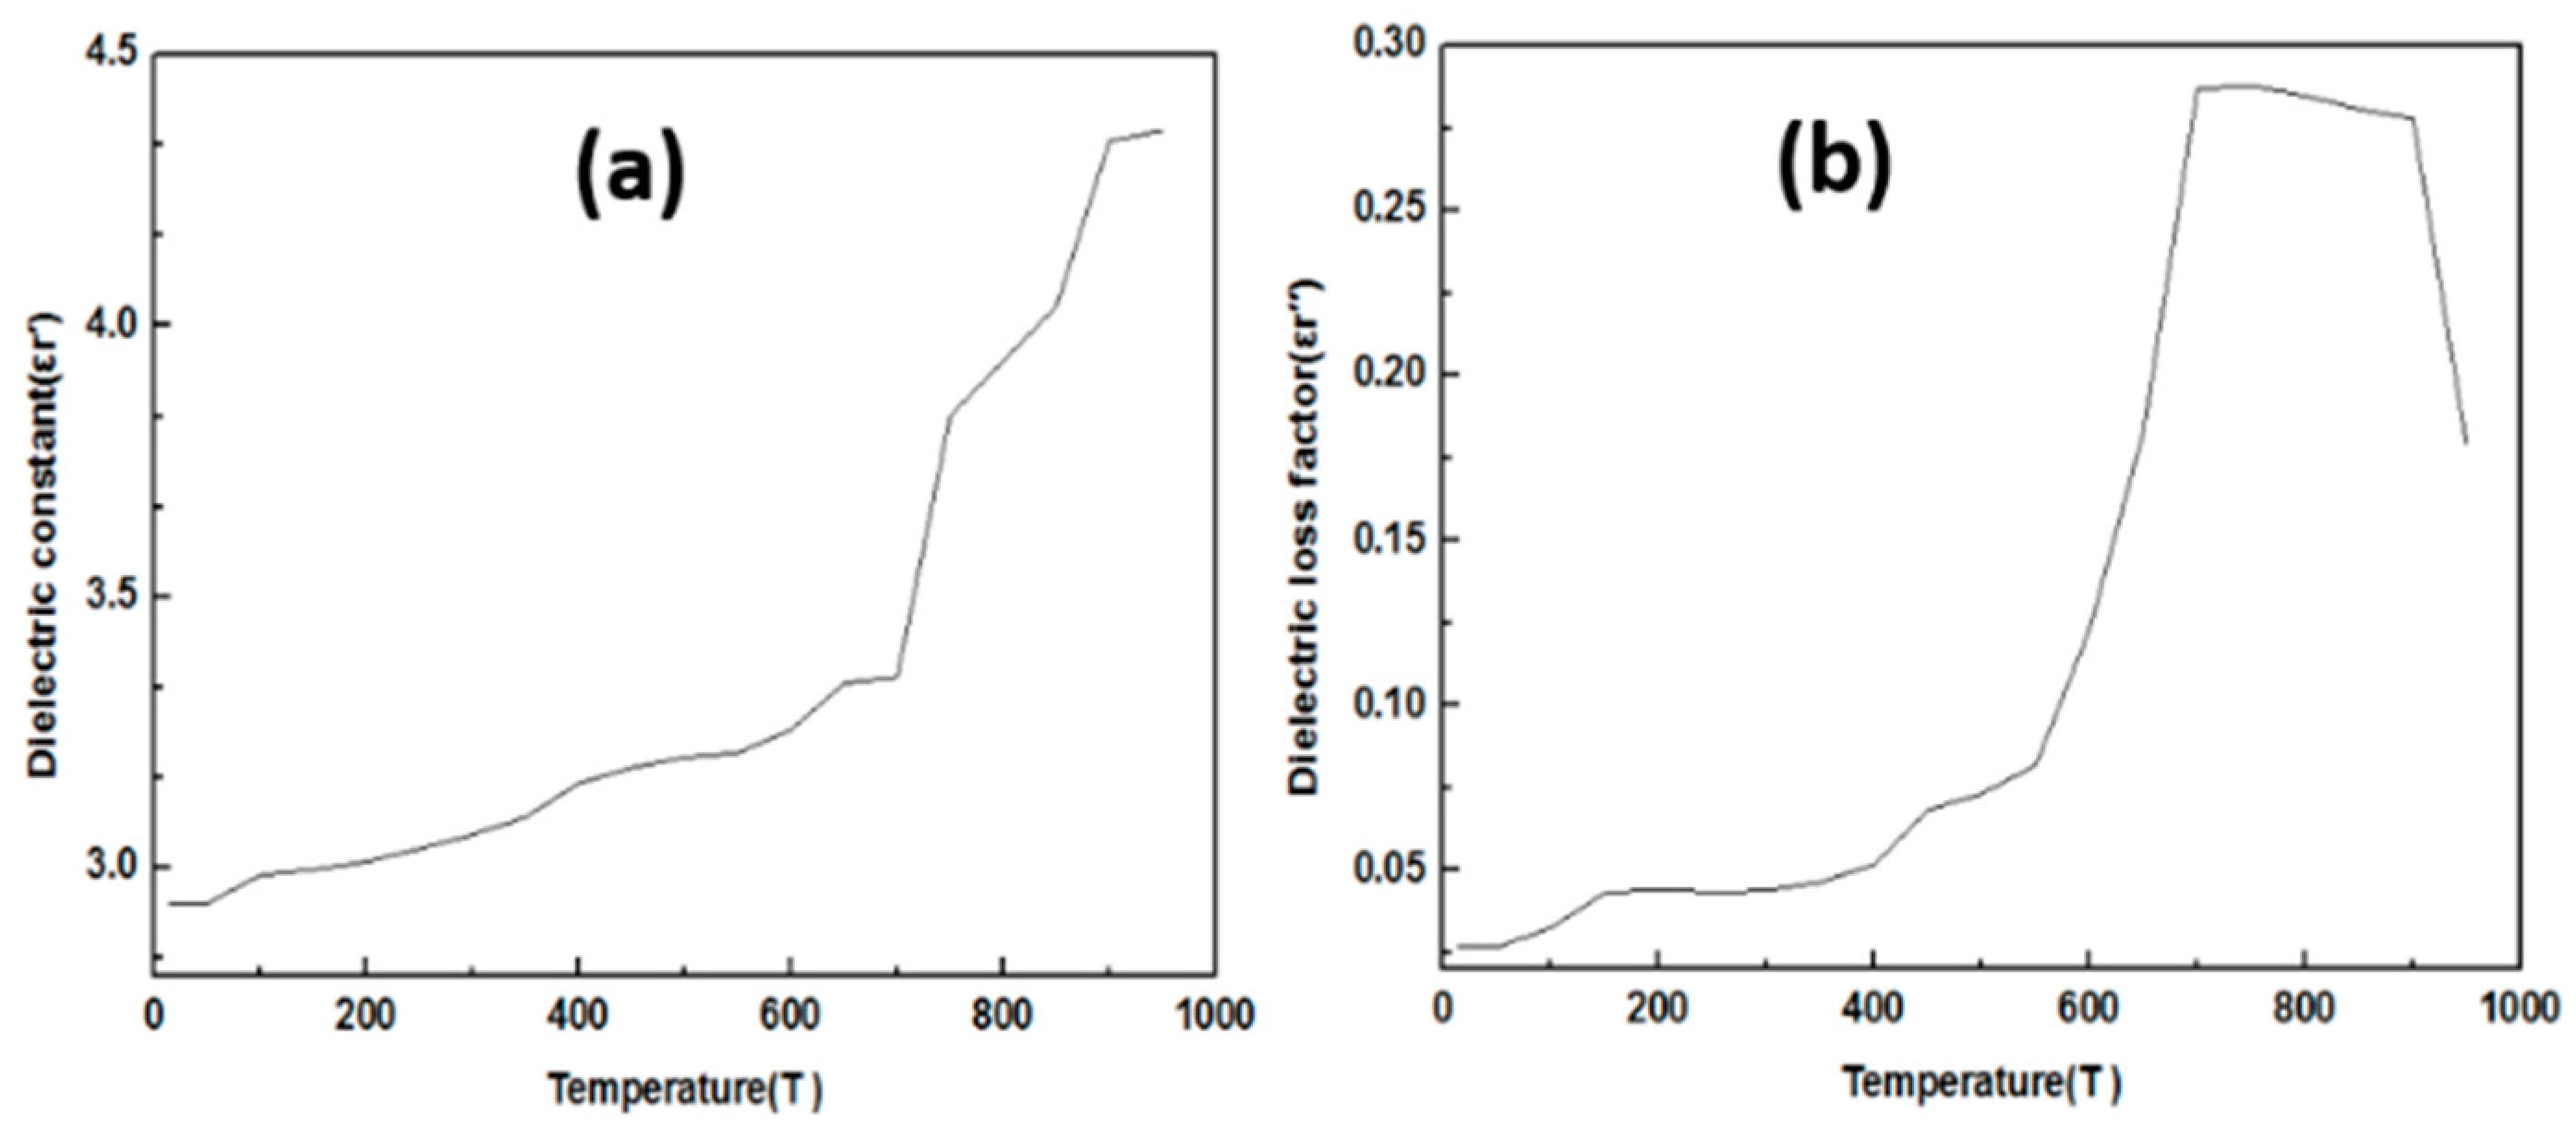
3.2. The Study Dielectric Constant and Dielectric Loss Factor of Raw Material
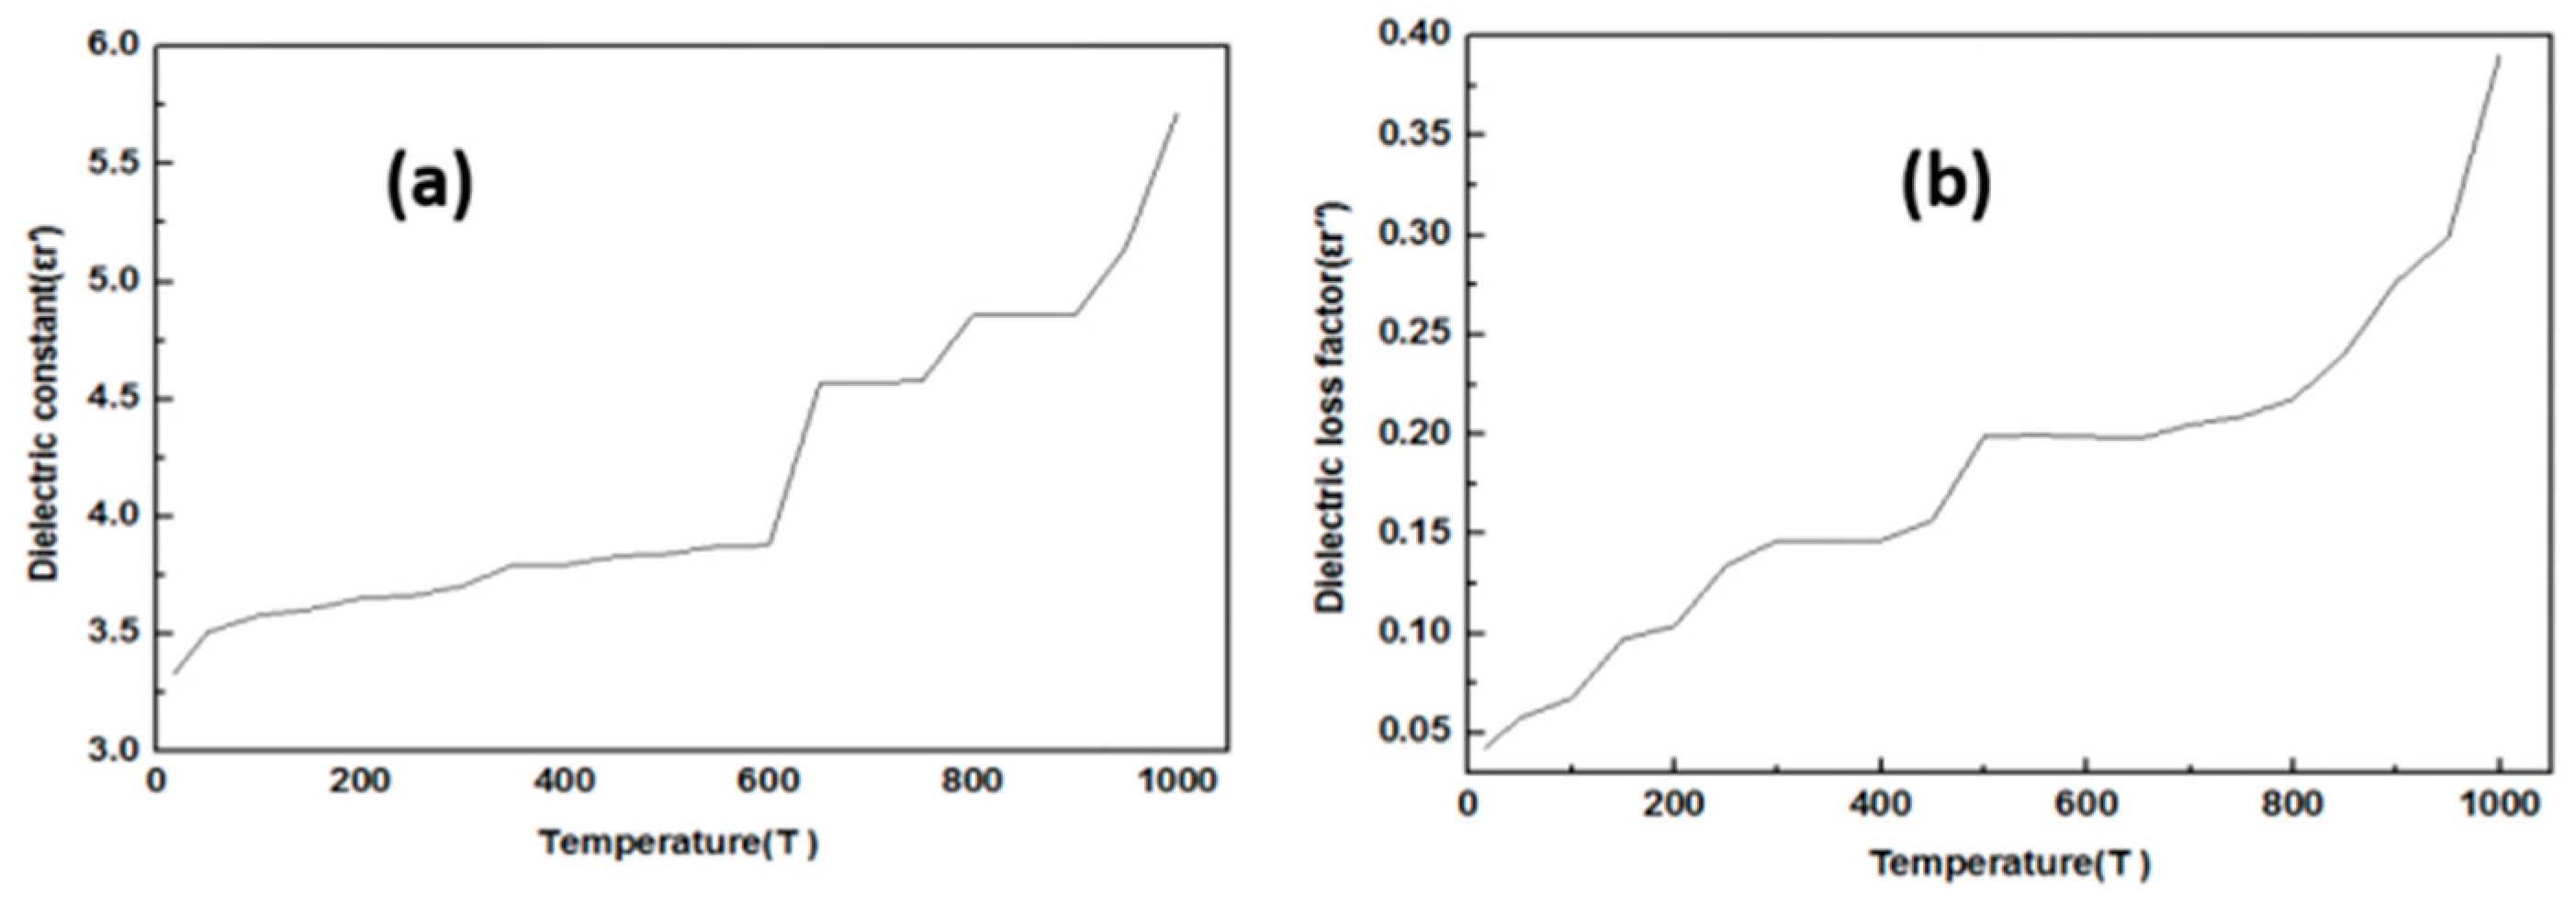
Figure 6 and Figure 7 show the dielectric constant and dielectric loss factor of the chromite and sodium carbonate respectively. The increasing trend of dielectric loss and dielectric loss factor with the temperature, indicates the chromite concentrate and sodium carbonate have good wave absorbing properties.
3.3. Characterization of the Roasted Material
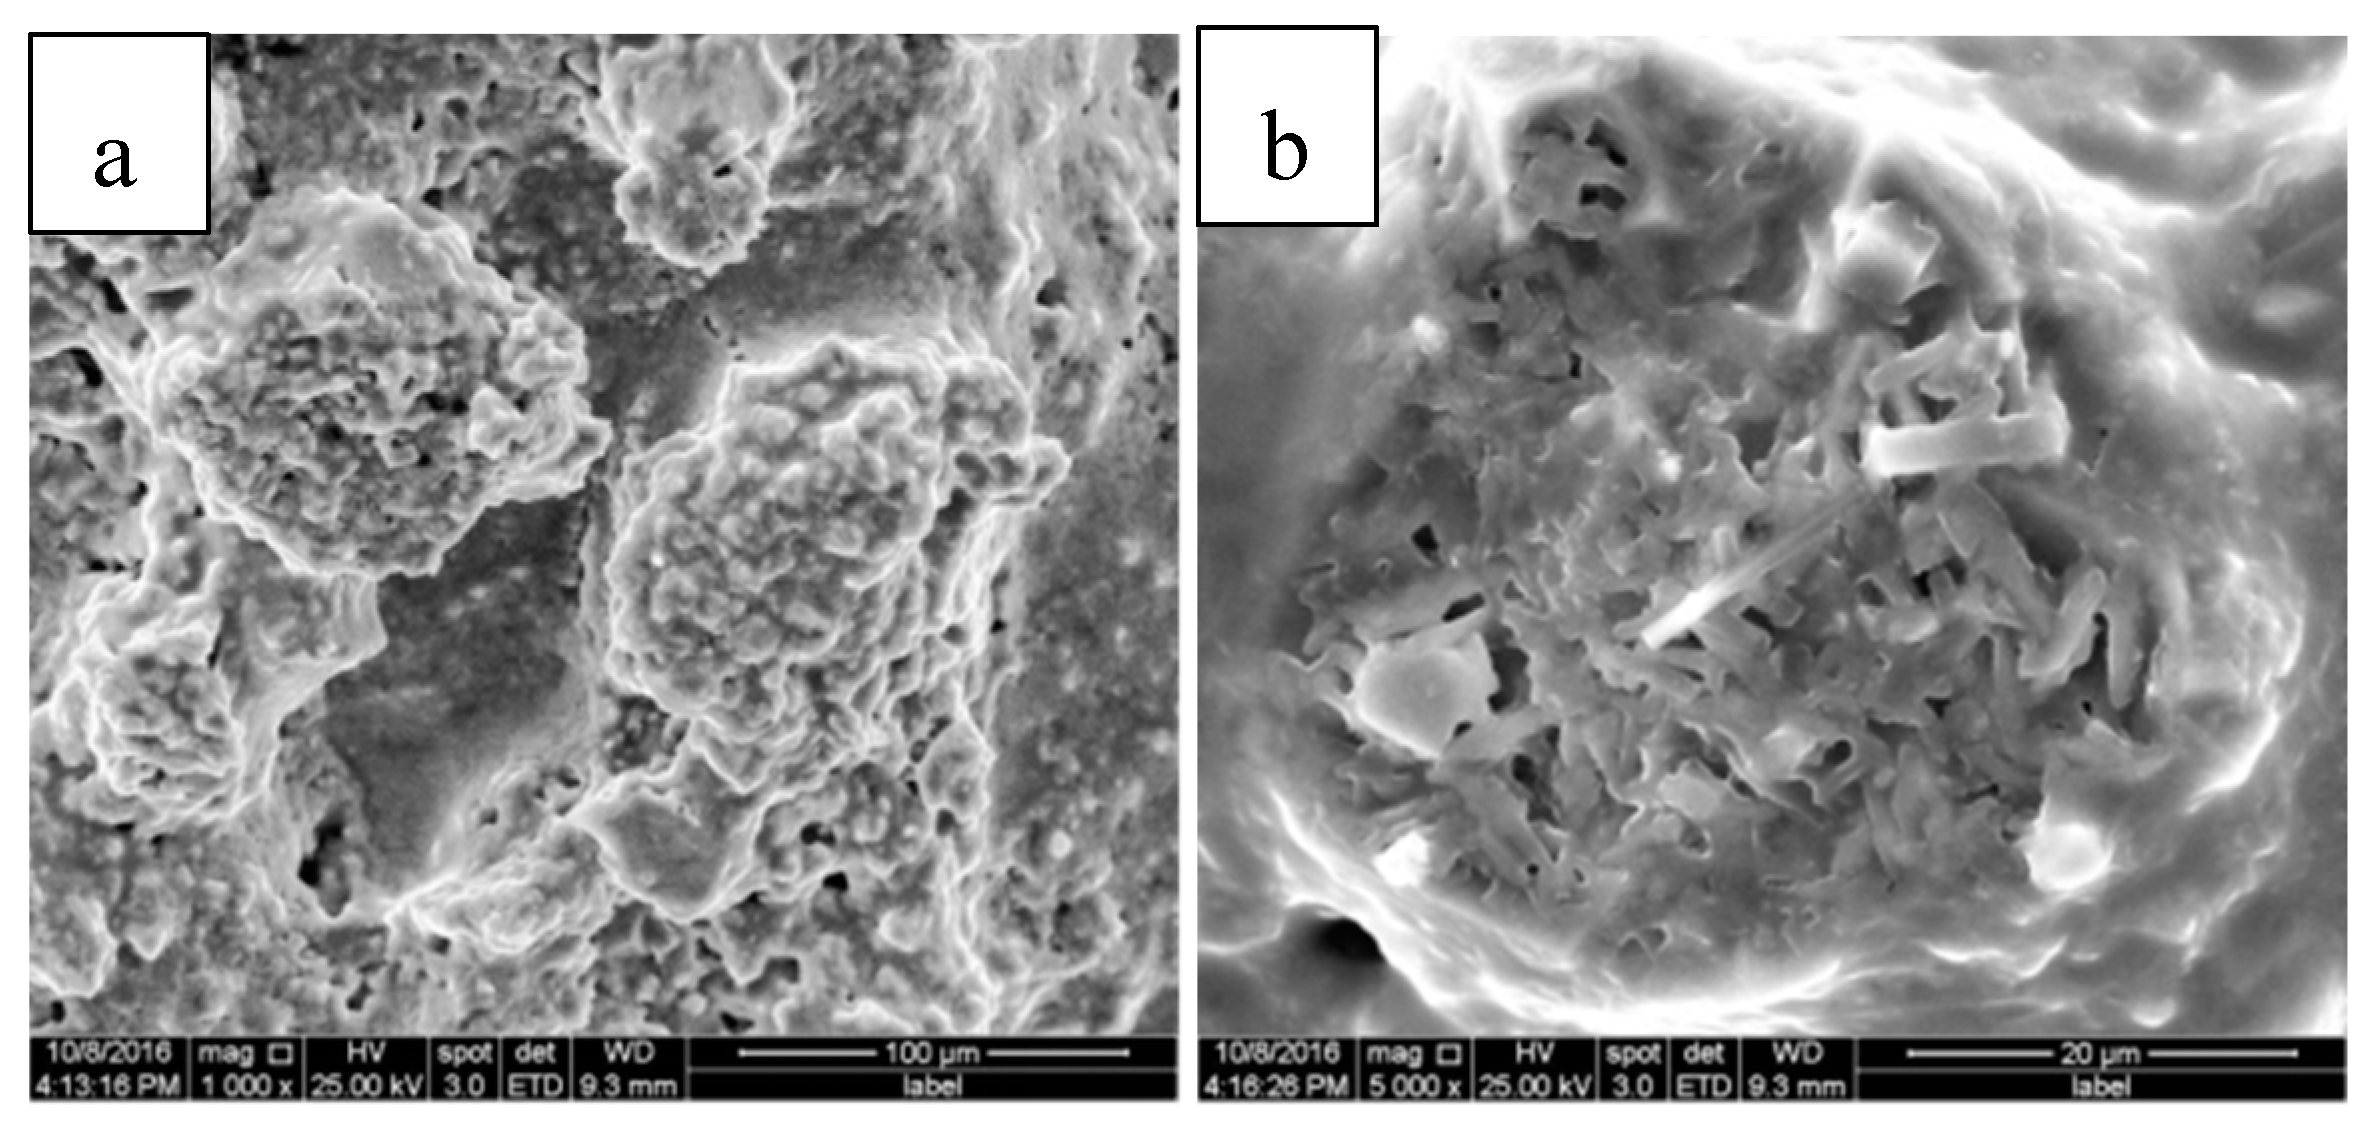
3.3.1. SEM Analysis
Figure 8 represents the SEM image of the roasted products. It clearly shows that the surface of roasted products covered by a moderate quantity of melt after roasted. It can also be observed that the micro thermal fragmentation of the particles in the mixture of sodium carbonate and chromite. The SEM images show the aggregation of the particles with some pores.
3.3.2. XRD Analysis
Figure 9 shows the XRD pattern of the product after microwave roasted. The FeO·Cr2O3 and Na2CO3 reacted chemically producing Na2CrO4. Additionally, Al2O3 and Na2CO3 reacted to generate NaAlO2. At the same time, Fe2O3 also existed.
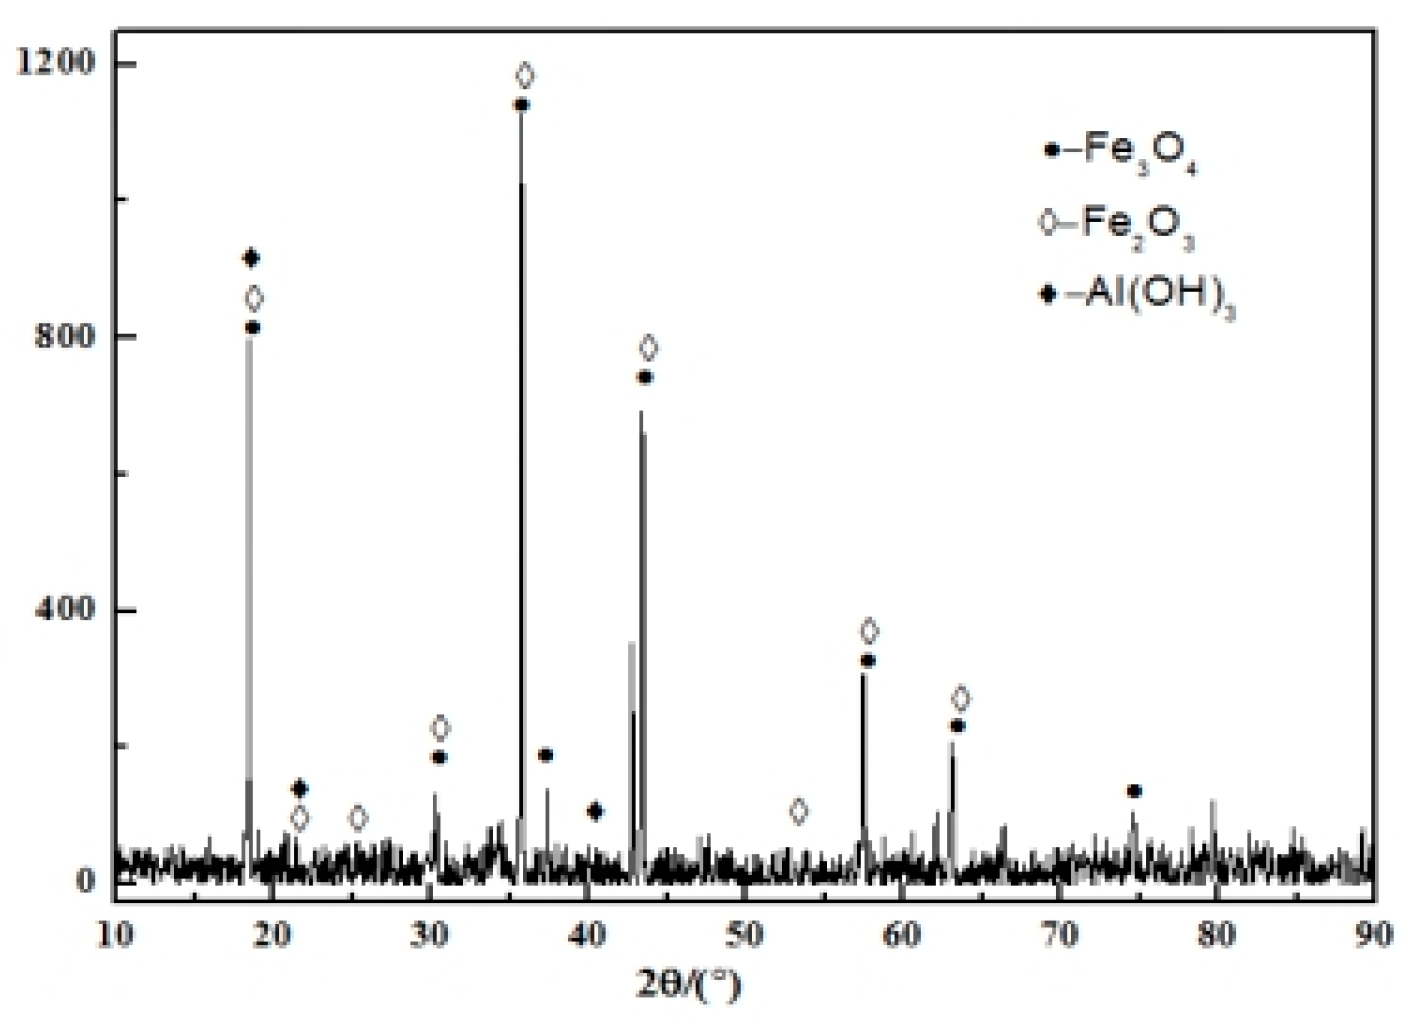
Figure 10 shows the XRD pattern of slag after ultrasonic extraction, which shows the existence of Fe2O3, Fe3O4 and Al(OH)3. Compared to the XRD patterns of chromite concentrate before microwave roasted and ultrasonic extraction, only Fe2O3 and Fe3O4 are existing. Other components removed.
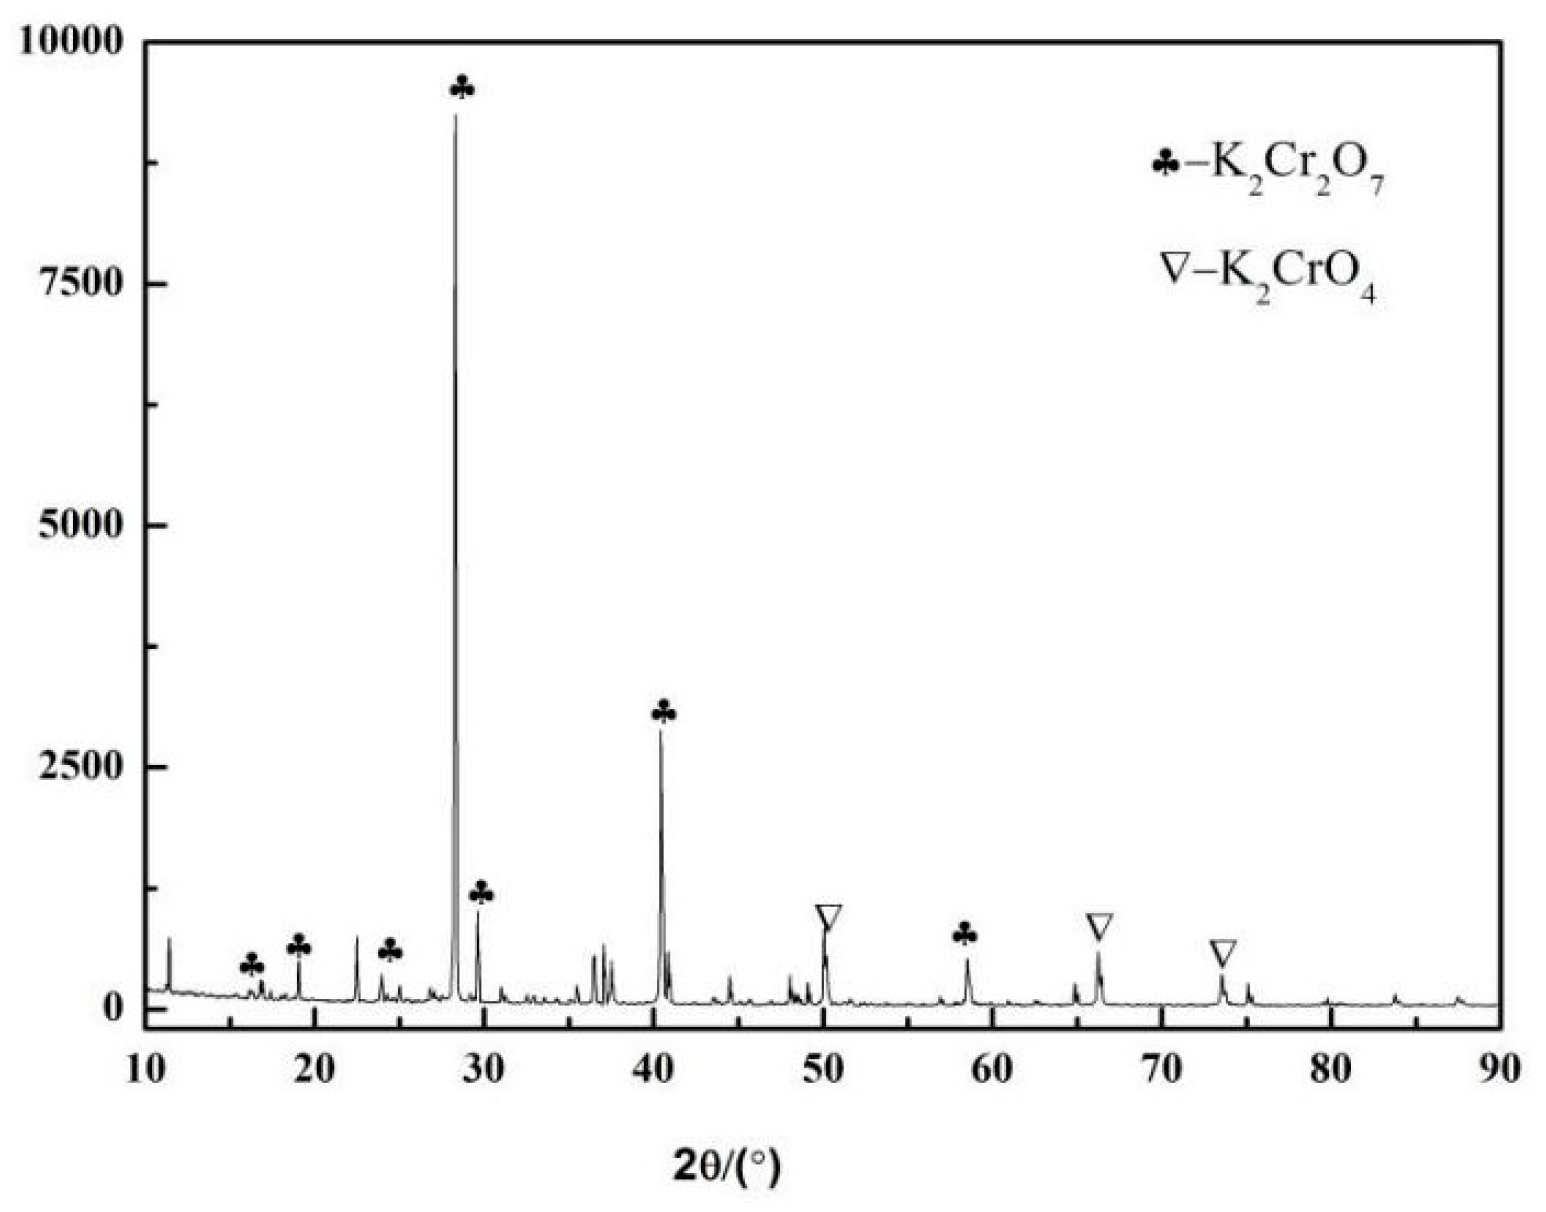
Figure 11 illustrates the XRD pattern of the final product. The XRD pattern clearly suggests the formation of K2Cr2O7. The synthesized potassium dichromate crystals existed in monoclinic crystal system. However, the existence of the small amount of K2CrO4 indicates that the pH not controlled well; therefore, Na2CrO4 not completely transformed into Na2Cr2O7. From the determination, the purity of the resultant product, the potassium dichromate crystals purity is 67.4%.
3.3.3. XRF Analysis
Table 2 represents the brief chemical component of products after microwave roasted and Table 3 represents brief chemical components of slag after ultrasonic extraction. After microwave roasted O, Cr, Na elements are present in large quantities. Comparison of both tables indicates that after ultrasonic extraction other elements such as Fe, Mg, Al, Si and Ca are all more than roasted, which shows in the process of ultrasonic extraction is beneficial. However, in this process, Cr has not been completely converted. By XRF analysis, a high conversion rate of Cr is 94.57%, which is reasonable and after ultrasonic extraction, the conversion rate of Cr is 82.72%, this is an acceptable number to be optimistic.
3.4. The Purity of the Product
According to the formula of (2)–(4), the purity of final K2Cr2O7 product was calculated. After microwave roasted and ultrasonic extraction, the purity of the product is up to 67.4%, compared with the conversion rate of Cr after microwave roasted that is a little bit down. Since the acidity has not been controlled ideally, the Na2CrO4 having not been completely transformed into Na2Cr2O7. Therefore, the final product K2Cr2O7 includes small amount of K2CrO4.
4. Conclusions
Using chromite and sodium carbonate for the preparation of potassium dichromate crystals in the microwave field is reasonable because chromite and sodium carbonate having good wave absorbing properties, and it takes only ten minutes in the heating process. The conversion rate of Cr is 94.57% after microwave roasted. The Ultrasonic extraction can strengthen the extraction efficiency and has a good effect on the conversion rate of Cr. Finally, the product obtained shows that the purity of product is up to 67.7% of microwave heating and ultrasonic extraction. The present work suggests that the microwave field is ideal for the preparation of potassium dichromate crystals. However, controlling the reaction parameters such as pH influence the final product purity.
Acknowledgments
The financial support from the National Natural Science Foundation of China (No.51504114) and Kunming University of Science and Technology Foundation for analysis and testing (No.2016M20152128005). This support is gratefully acknowledged. The authors are grateful to the reviewers for the discerning comments on this paper.
Author Contributions
Linqing Dai and Shenghui Guo conceived and designed the experiments; Hua Liu performed the experiments and wrote the paper; Yu Duan analyzed the data; Jinhui Peng and Libo Zhang contributed reagents and materials and analysis tools.
Conflicts of Interest
The authors declare no conflict of interest.
References
- Yu, W. Research progress in the field of metallurgy of vanadium titanium magnetite by microwave heating. Iron Steel Vanadium Titan. 2011, 32, 87–96. [Google Scholar]
- Tong, Z.; Bi, S.; Yang, Y. Present situation of study on microwave beating application in metallurgy. J. Mater. Metall. 2004, 3, 117–120. [Google Scholar]
- Zhang, S.; Peng, J.; Huang, M.; Sun, Y.; Zhang, L.; Fan, X.; Guo, S. Preparation of primary titanium materials from self-reduced pellet of titanium concentrate by microwave reduction. Chin. J. Rare Met. 2006, 30, 78–81. [Google Scholar]
- Gu, J.; Ao, N.; Liu, Y. The application and progress of microwave technology in mineral processing process. Min. Metall. 2002, 11, 139–146. [Google Scholar]
- Liu, Q.; Xiong, Y. Research on application mechanism of iron ore grinding by microwave. Metallurgy 1997, 3, 25–28. [Google Scholar]
- Zhou, X. Structure and microwave dielectric properties of Kunming ilmentite. Chem. Ind. 1992, 3, 7–8. [Google Scholar]
- Chen, J.; Li, N.; Wang, S. The heating performance of carbon containing chromite fines in microwave field. J. Beijing Univ. Sci. Technol. 2007, 29, 880–906. [Google Scholar]
- Chen, J. Application of Microwave Heating Reduction of Carbon Containing Pellet Melting; Iron & Steel Research Institute: Beijing, China, 2003; Volume 6, pp. 8–13. [Google Scholar]
- Jia, Z. Study on ore chromite pellet smelting high carbon ferrochrome. Zhejiang Metall. 1996, 2, 17–22. [Google Scholar]
- Bai, X.Y.; Wu, S.; Zhang, S.C. A new microwave heating system for processing ceramic materials. J. Microw. 1999, 2, 114. [Google Scholar]
- Alybakov, A.A.; Gubanova, V.A.; Kudabaev, K.; Tojchiev, N. Paramagnetic centres created by a thermal treatment in potassium dichromate crystals. Cryst. Res. Technol. 2010, 18, 68–70. [Google Scholar] [CrossRef]
- Dai, W.; Shu, L. Iron Alloy Metallurgy Engineering; Metallurgical Industry Press: Beijing, China, 1999. [Google Scholar]
- Shi, F.; Kongjin, Z.; Yalin, Q. New progress in mineral processing of chromium iron ore. In Proceedings of the China Mineral Processing Technology Exchange Meeting, Haikou, China, 13–17 November 2006. [Google Scholar]
- Liu, J. Mineral processing of low grade chrome ore. In Proceedings of the China Iron and Steel Annual Meeting, Beijing, China, 28–30 October 2005. [Google Scholar]
- Shi, F. Chromite mine of China and Volgadansk. Geo Exp. 1998, 2, 16–18. [Google Scholar]
- Medina-Campos, O.N.; Barrera, D.; Segoviano-Murillo, S.; Rocha, D.; Maldonado, P.D.; Mendoza-Patiño, N.; Pedraza-Chaverri, J. S-allylcysteine scavenges singlet oxygen and hypochlorous acid and protects LLC-PK1 cells of potassium dichromate-induced toxicity. Food Chem. Toxicol. 2007, 45, 2030–2039. [Google Scholar] [CrossRef] [PubMed]
- Lushchak, O.V.; Kubrak, O.I.; Nykorak, M.Z.; Storey, K.B.; Lushchak, V.I. The effect of potassium dichromate on free radical processes in goldfish: Possible protective role of glutathione. Aquat. Toxicol. 2008, 87, 108–114. [Google Scholar] [CrossRef] [PubMed]
- Reedijk, M.F.; Arsic, J.; Kaminski, D.; Van Enckevort, W.J.P.; Vlieg, E. Surface structure of potassium dichromate (KBC) crystals. Surf. Sci. 2003, 526, 133–140. [Google Scholar] [CrossRef]
- Thilak, T.; Basheer Ahamed, M.; Vinitha, G. Third order nonlinear optical properties of potassium dichromate single crystals by Z-scan technique. Optik 2013, 124, 4716–4720. [Google Scholar] [CrossRef]
- Andre, N.; Paut, O.; Arditti, J.; Fabre, P.; Bremond, V.; Alhmana, T.; Bellus, J.F.; Jouglard, J.; Camboulives, J. Intoxication grave au dichromate de potassium apres introduction nasale accidentelle. Arch. Pédiatrie 1998, 5, 145–148. [Google Scholar] [CrossRef]
- Qi, T.G.; Liu, N.; Li, X.B.; Peng, Z.H.; Liu, G.H.; Zhou, Q.S. Thermodynamics of chromite ore oxidative roasting process. J. Cent. Univ. Technol. 2011, 18, 83–88. [Google Scholar] [CrossRef]
- Li, J. Study on solid alkali prepared by the oxidation of potassium dichromate experimental. Chifeng Univ. 2005, 5, 25. [Google Scholar]
- Li, J. Effect of ultrasonic wave on leaching process. Metallurgy 2001, 30, 28–30. [Google Scholar]
- Xu, S.; Zhang, C.; Zhao, T. Application of ultrasonic in extraction process. HN Nonferrous Met. 1994, 11, 350–353. [Google Scholar]
- Timothy, M. Sonochemistry: Theory, Applications and Uses of Ultrasound in Chemistry; Ellis Horwood: New York, NY, USA, 1988. [Google Scholar]
- Mason, T.J. Advances in Sonochemistry; JAI Press Ltd.: London, UK, 1996; Volume 5. [Google Scholar]
- Vinatoru, M. An overview of the ultrasonically assisted extraction of bioactive principles from herbs. Ultrason. Sonochem. 2001, 8, 303–313. [Google Scholar] [CrossRef]
- Chen, D.; Lázaro, F.; de Castro, L.D.; Valcárel, M. Direct spectrophotometric determination of total boron in soils with ultrasonic leaching in automatic flow systems. Anal. Chim. Acta 1989, 226, 221–227. [Google Scholar] [CrossRef]
- Yanan, L.; Kui, L.; Xiurong, S. Study on Producing Dichromate—Potassium by Chromium Containing Wastewaters. Chem. Ind. Guangzhou 2010, 38, 140–141. [Google Scholar]
- Zhang, H.; Xu, H.B.; Zhang, X.; Zhang, Y.; Zhang, Y. Pressure oxidative leaching of Indian chromite ore in concentrated NaOH solution. Hydrometallurgy 2014, 142, 47–55. [Google Scholar] [CrossRef]
- Looyenga, H. Dielectric constants of heterogeneous mixtures. Physica 1965, 31, 401–406. [Google Scholar] [CrossRef]
- Dick, B.G., Jr.; Overhauser, A.W. Theory of the Dielectric Constants of Alkali Halide Crystals. Phys. Rev. 1958, 112, 90–103. [Google Scholar] [CrossRef]
- Akerlof, G. Dielectric Constants of Some Organic Solvent-Water Mixtures at Various Temperatures. J. Am. Chem. Soc. 1932, 11, 4125–4139. [Google Scholar] [CrossRef]
- Dwyer, J.J.; Gittis, A.G.; Karp, D.A.; Lattman, E.E.; Spencer, D.S.; Stites, W.E.; Bertrand, G.-M.E. High Apparent Dielectric Constants in the Interior of a Protein Reflect Water Penetration. Biophys. J. 2000, 79, 1610–1620. [Google Scholar] [CrossRef]
- Uchino, K.; Nomura, S. Critical exponents of the dielectric constants in diffused-phase-transition crystals. Ferroelectrics 1982, 44, 55–61. [Google Scholar] [CrossRef]
- Ghodgaonkar, D.K.; Varadan, V.V. A free-space method for measurement of dielectric constants and loss tangents at microwave frequencies. IEEE Trans. Instrum. Meas. 2002, 38, 789–793. [Google Scholar] [CrossRef]
- Liu, C.; Zhang, L.; Peng, J.; Qu, W.; Liu, B.; Xia, H. Dielectric Properties and Microwave Heating Characteristics of Sodium Chloride at 2.45 GHz. High Temp. Mater. Process. 2013, 32, 587–596. [Google Scholar] [CrossRef]
- Huang, H.; Min, L. Study on chromite preparation of chromium oxide instead of potassium dichromate experimental. Shangrao Normal Univ. 2015, 35, 60–62. [Google Scholar]
Figure 1.
XRD pattern of chromite concentrate.

Figure 2.
SEM images of chromite concentrate.

Figure 3.
The structure diagram of dielectric constant measurement device (1-water cooling system, 2-reaction system, 3-control system, 4-microwave network analyzer, 5-PC collection system).
Figure 3.
The structure diagram of dielectric constant measurement device (1-water cooling system, 2-reaction system, 3-control system, 4-microwave network analyzer, 5-PC collection system).
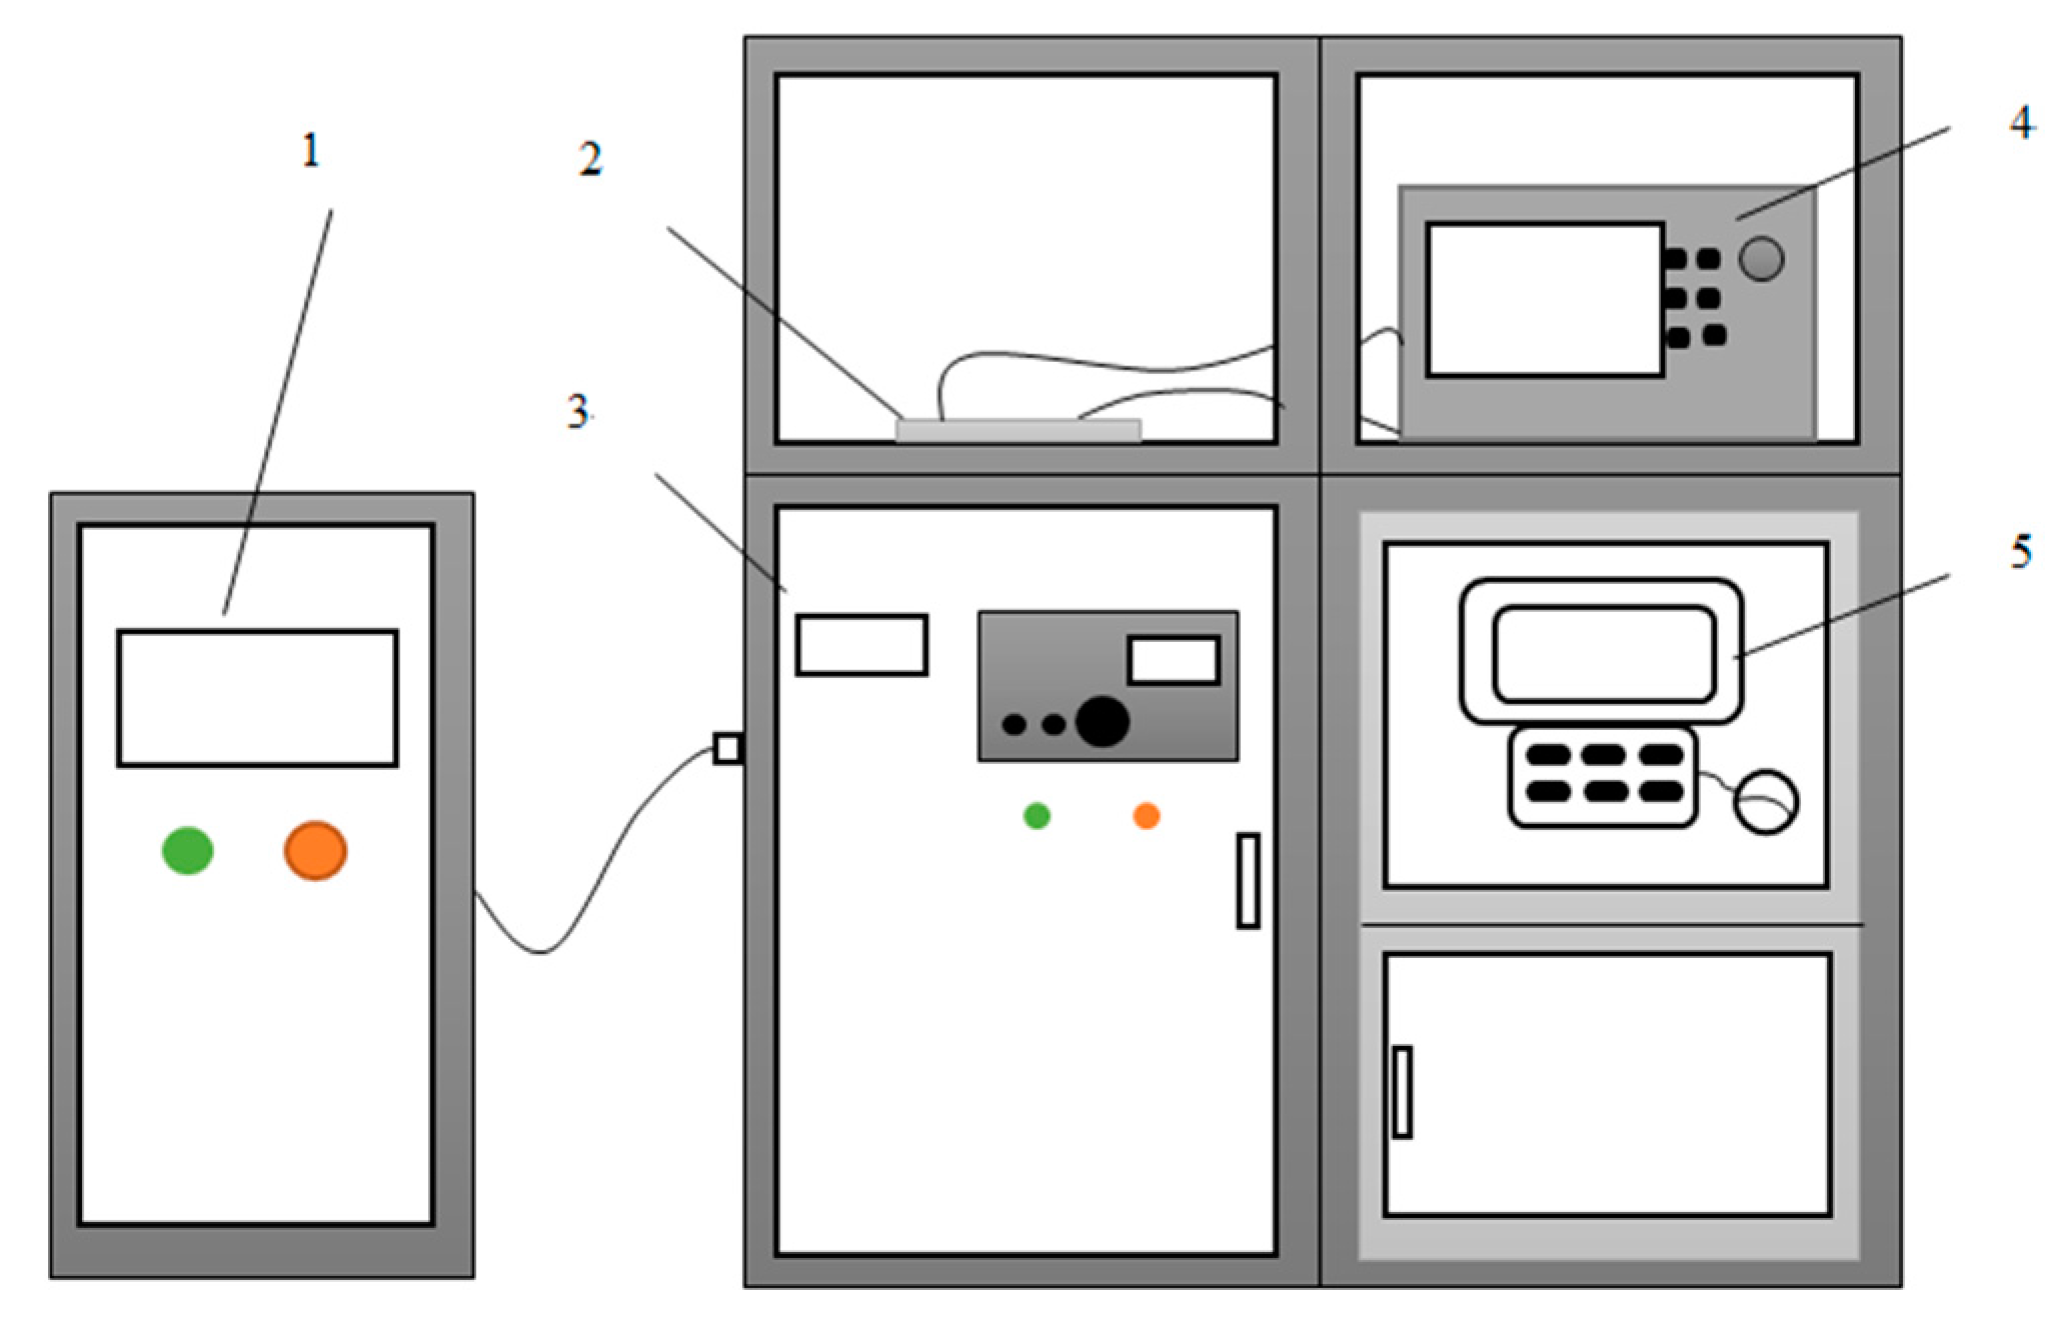
Figure 4.
Flowchart for the preparation of K2Cr2O7 from chromite concentrate with Na2CO3.
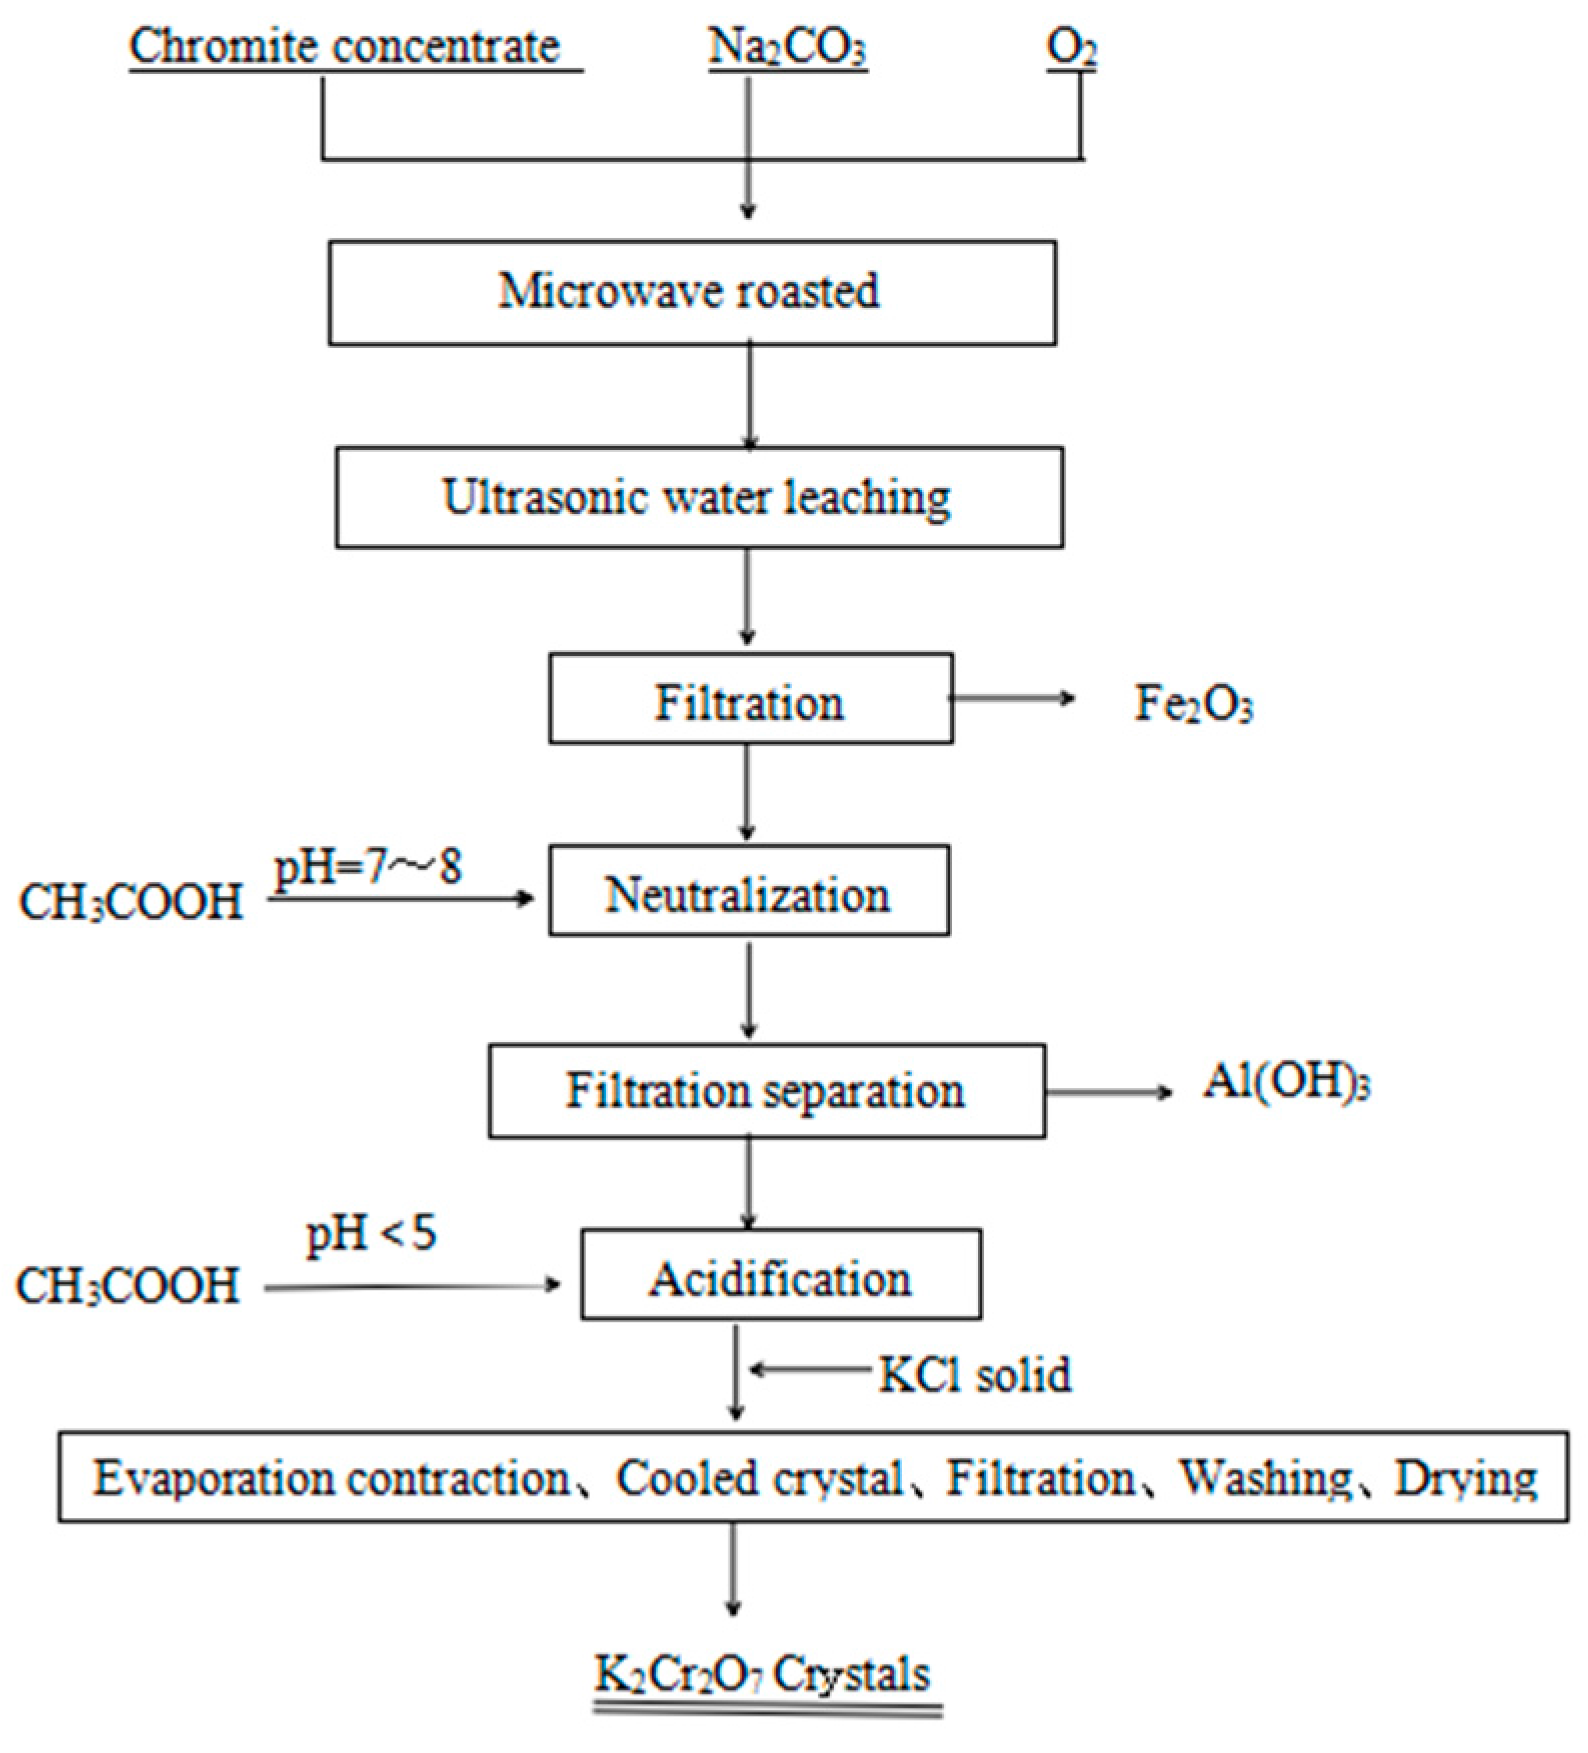
Figure 5.
Temperature rise characteristic curves in the microwave field of chromite (a) and Na2CO3 (b).
Figure 5.
Temperature rise characteristic curves in the microwave field of chromite (a) and Na2CO3 (b).

Figure 6.
Dielectric constant (a) and loss factor (b) of chromite with temperature.

Figure 7.
Dielectric constant (a) and loss factor (b) of Na2CO3 with temperature.

Figure 8.
SEM images (a,b)of microwave roasted reaction products.

Figure 9.
XRD pattern of microwave roasted product.
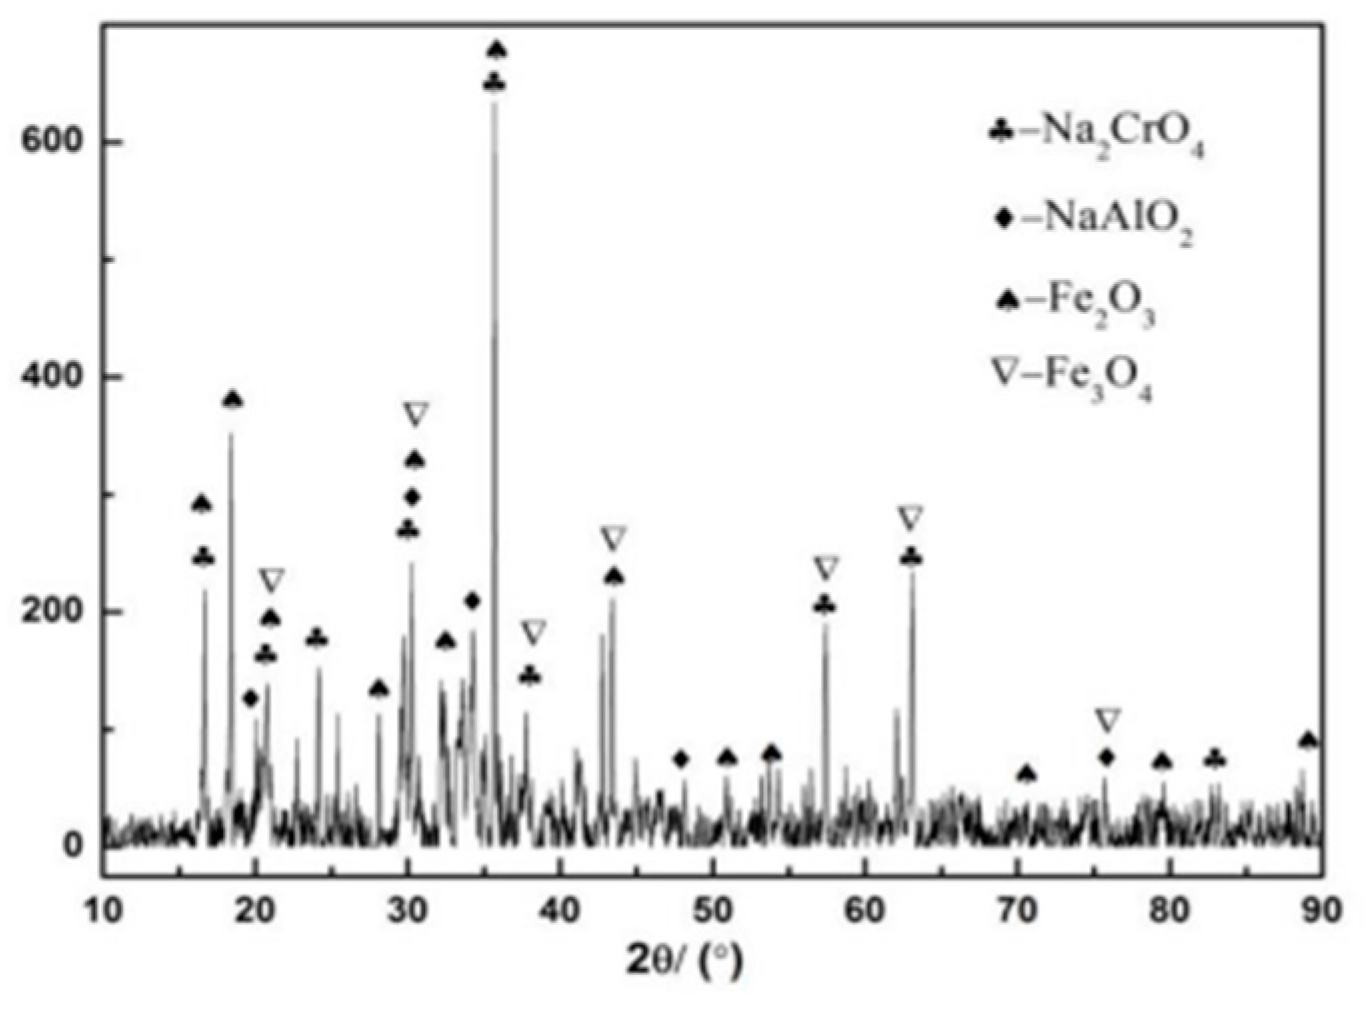
Figure 10.
XRD pattern of slag after ultrasonic extraction.

Figure 11.
XRD pattern of the final product.

Table 1.
Brief chemical components of chromite concentrate (wt. %).
| Cr2O3 | Fe | Al2O3 | MgO | H2O | SiO2 | CaO | P | S |
|---|---|---|---|---|---|---|---|---|
| 51.44 | 13.56 | 11.11 | 10.44 | 10.44 | 3.95 | 1.45 | 0.05 | 0.05 |
Table 2.
Brief chemical components of the products after microwave roasted.
| O | Cr | Na | Fe | C | Mg | Al | Si | Ca |
|---|---|---|---|---|---|---|---|---|
| 65.71 | 33.27 | 45.95 | 6.20 | 5.11 | 2.42 | 1.89 | 0.83 | 0.29 |
Table 3.
Brief chemical components of the slag after ultrasonic extraction.
| O | Cr | Na | Fe | C | Mg | Al | Si | Ca |
|---|---|---|---|---|---|---|---|---|
| 46.48 | 11.18 | 9.52 | 17.67 | 2.82 | 7.04 | 4.12 | 3.11 | 0.74 |
© 2017 by the authors. Licensee MDPI, Basel, Switzerland. This article is an open access article distributed under the terms and conditions of the Creative Commons Attribution (CC BY) license (http://creativecommons.org/licenses/by/4.0/).
Share and Cite
MDPI and ACS Style
Liu, H.; Guo, S.; Peng, J.; Yu, D.; Zhang, L.; Dai, L. Preparation of Potassium Dichromate Crystals from the Chromite Concentrate by Microwave Assisted Leaching. Crystals 2017, 7, 312. https://doi.org/10.3390/cryst7100312
AMA Style
Liu H, Guo S, Peng J, Yu D, Zhang L, Dai L. Preparation of Potassium Dichromate Crystals from the Chromite Concentrate by Microwave Assisted Leaching. Crystals. 2017; 7(10):312. https://doi.org/10.3390/cryst7100312
Chicago/Turabian StyleLiu, Hua, Shenghui Guo, Jinhui Peng, Duan Yu, Libo Zhang, and Linqing Dai. 2017. "Preparation of Potassium Dichromate Crystals from the Chromite Concentrate by Microwave Assisted Leaching" Crystals 7, no. 10: 312. https://doi.org/10.3390/cryst7100312
Note that from the first issue of 2016, this journal uses article numbers instead of page numbers. See further details here.