Article

The Use of Size Exclusion Chromatography to Monitor Protein Self-Assembly

Department of Drug Design, Structural Biology Unit, Groningen Research Institute of Pharmacy, University of Groningen, 9713AJ Groningen, The Netherlands
*
Author to whom correspondence should be addressed.
Current address: HRTEM laboratory, Scientific and Technical Services, University of Oviedo-CINN, 33006 Oviedo, Spain.
Crystals 2017, 7(11), 331; https://doi.org/10.3390/cryst7110331
Submission received: 6 September 2017 / Revised: 20 October 2017 / Accepted: 23 October 2017 / Published: 31 October 2017
(This article belongs to the Special Issue Recent Advances in Protein Crystallography)

Abstract

:
High resolution size exclusion chromatography (SEC) coupled with static light scattering (SLS) analyses were conducted to study the effect of the mobile phase ionic strength and protein concentration on the output of SEC experiments. The results highlight the effect of small changes in the mobile phase composition on the estimation of molar masses estimated from retention time-based calibration curve compared with those obtained from SLS analysis. By comparing the SLS data with the SEC chromatograms, we show that SEC can provide helpful information on the protein aggregation state as macromolecules approach known precipitation points in their phase diagrams. This suggests the potential use of SEC as an easily accessible lab-based scanning methodology to monitor protein self-assembly prior to nucleation and crystallization. Implications for the use of SEC to study protein phase diagrams are discussed.

Graphical Abstract

1. Introduction

There is no structural biology laboratory that can be functional without a chromatography system which is used for the purposes of purifying macromolecules [1,2,3,4]. One of the major purification methods used is size exclusion chromatography (SEC) which is based on the shape and size (hydrodynamic radius; Rh) of the eluted macromolecules, such that during a SEC experiment larger macromolecules (larger hydrodynamic radius) are eluted faster than the small ones which are retarded within the stationary hydrophilic resins [5]. Common wisdom is to calibrate gel filtration columns using a standard mobile phase (such as phosphate buffered saline) and use several standard proteins of known molar masses in order to create a calibration diagram (Log molar mass vs. elution time/volume) [6,7]. These diagrams are then used to retrieve information about macromolecules under investigation; including estimates of their molar masses, degree of oligomerization, and stability [8]. However, many factors other than the Rh and molar mass of macromolecules can affect the elution time. Solution pH and the ionic strength of the mobile phase can greatly affect the time at which macromolecules are eluted [9,10,11,12,13]. While it has long been known that solution properties can influence the elution time of a macromolecule under SEC, it unfortunately remains commonplace not to account for these solution properties before consulting a calibration curve—with many laboratories performing a single calibration curve that is applied to all subsequent buffers used. This can result in errors in estimated molar masses that may lead to the incorrect assignment of oligomeric state or other macromolecular solution properties [14,15]. This can be overcome through the use of static light scattering (SLS) measurements in-line with SEC experiments that can provide a direct measurement of solution molecular mass, without recourse to a calibration curve [16]. In addition to the molar mass, SLS analysis also provides important information on the behavior of a macromolecule in solution. As macromolecules typically have well predictable molecular weights, deviations from quanta of these molecular weights can be interpreted as information on the aggregation state of the molecule [17]. Previous researchers have used static light scattering (SLS) measurements to assess deviations from a known molecular mass and have interpreted the results as an estimation of the second virial coefficient (B2 or A22), which is a concentration independent term in the Taylor expansion approximation of the universal gas equation as applied to molecules in solution (Equation (1)) [18]
PV = nRT + c[A22]
where the pressure (P) and volume (V) of a solution are related to the number density of molecules (n), the universal gas constant (R), thermodynamic temperature (T), the macromolecule concentration (c), and the second virial coefficient (A22).
For protein solutions, there is a correlation between the value of their osmotic second virial coefficient with solution conditions conducive to crystallization. The osmotic second virial coefficient, B22, is defined by the osmotic virial expansion (Equation 2) [19]
Π = R T cp (1/Mw + B22 cp + ……)
where Π is the osmotic pressure, cp the protein concentration (in mass units), R the gas constant, T the absolute temperature, and Mw the protein molecular weight.
A key implication of this is that conditions that promote macromolecular self-assembly may be the conditions that also support nucleation—the initial self-assembly of macromolecules that is essential for the growth of protein crystals. This has been previously demonstrated using dynamic and static light scattering (DLS and SLS) data that show crystallization of macromolecules occurs within a narrow (slightly negative) range of A22 values corresponding to a weakly attractive solution regime [20], although it was also shown later that mildly positive values of A22 can also be conducive to crystallization [21].
Here, we report our study of the effect of the mobile phase ionic strength and sample concentration on the output of SEC analyses. We observed that the use of SEC alone can provide information on the protein aggregation state as molecules approached known precipitation points in their phase diagrams, which is confirmed by the associated in-line SLS measurements. Although chromatographic analyses are nowadays implemented into different characterization methodologies [22,23,24,25,26] and at different beamline facilities [27,28,29,30,31], facilitating the determination of precise information for protein samples at the preparatory stage would certainly improve the efficiency of the results obtained through subsequent characterization methodologies.
Our experiments serve as a proof-of-principle and theoretical background for the potential use of SEC as an easily accessible lab-based scanning methodology to monitor protein precipitation or nucleation prior to crystallization. These experiments also serve as a reminder that solution conditions can play a major role in molecular mass estimates from SEC experiments using calibration curves.

2. Results and Discussion

Size exclusion chromatograms obtained were initially characterized by the peak elution point of sample and the presence of any detectable aggregation in the sample. As shown in Figure 1, laser light scattering signal from the SLS measurements is more sensitive to the presence of these aggregates than the absorbance signal at 280 nm of the NGC. Since the two proteins used in this study have well-defined molecular weights and the measured molecular masses are volume averaged, we have interpreted deviations in the measured molecular masses to represent the degree of assembly in the mobile phase under examination (i.e., the A22 value of Equation (1) or B22 value of Equation (2)). Such an interpretation is in line with previous DLS and SLS based studies on A22 values [19]. As shown below, the molar masses as measured by SLS correlate well with the elution position of the sample. For example, Figure 1 demonstrates that under high salt (2 M NaCl in 0.1 M NaoAc pH 4.5) the protein hen egg-white lysozyme (HEWL) forms large aggregates (eluted at ~1.8 mL) and a major monomeric fraction (eluted at ~3.4 mL). Under low salt conditions (0 M NaCl in 0.1 M NaoAc pH 4.5), no aggregation of HEWL can be seen, but the sample elutes at ~3 mL.
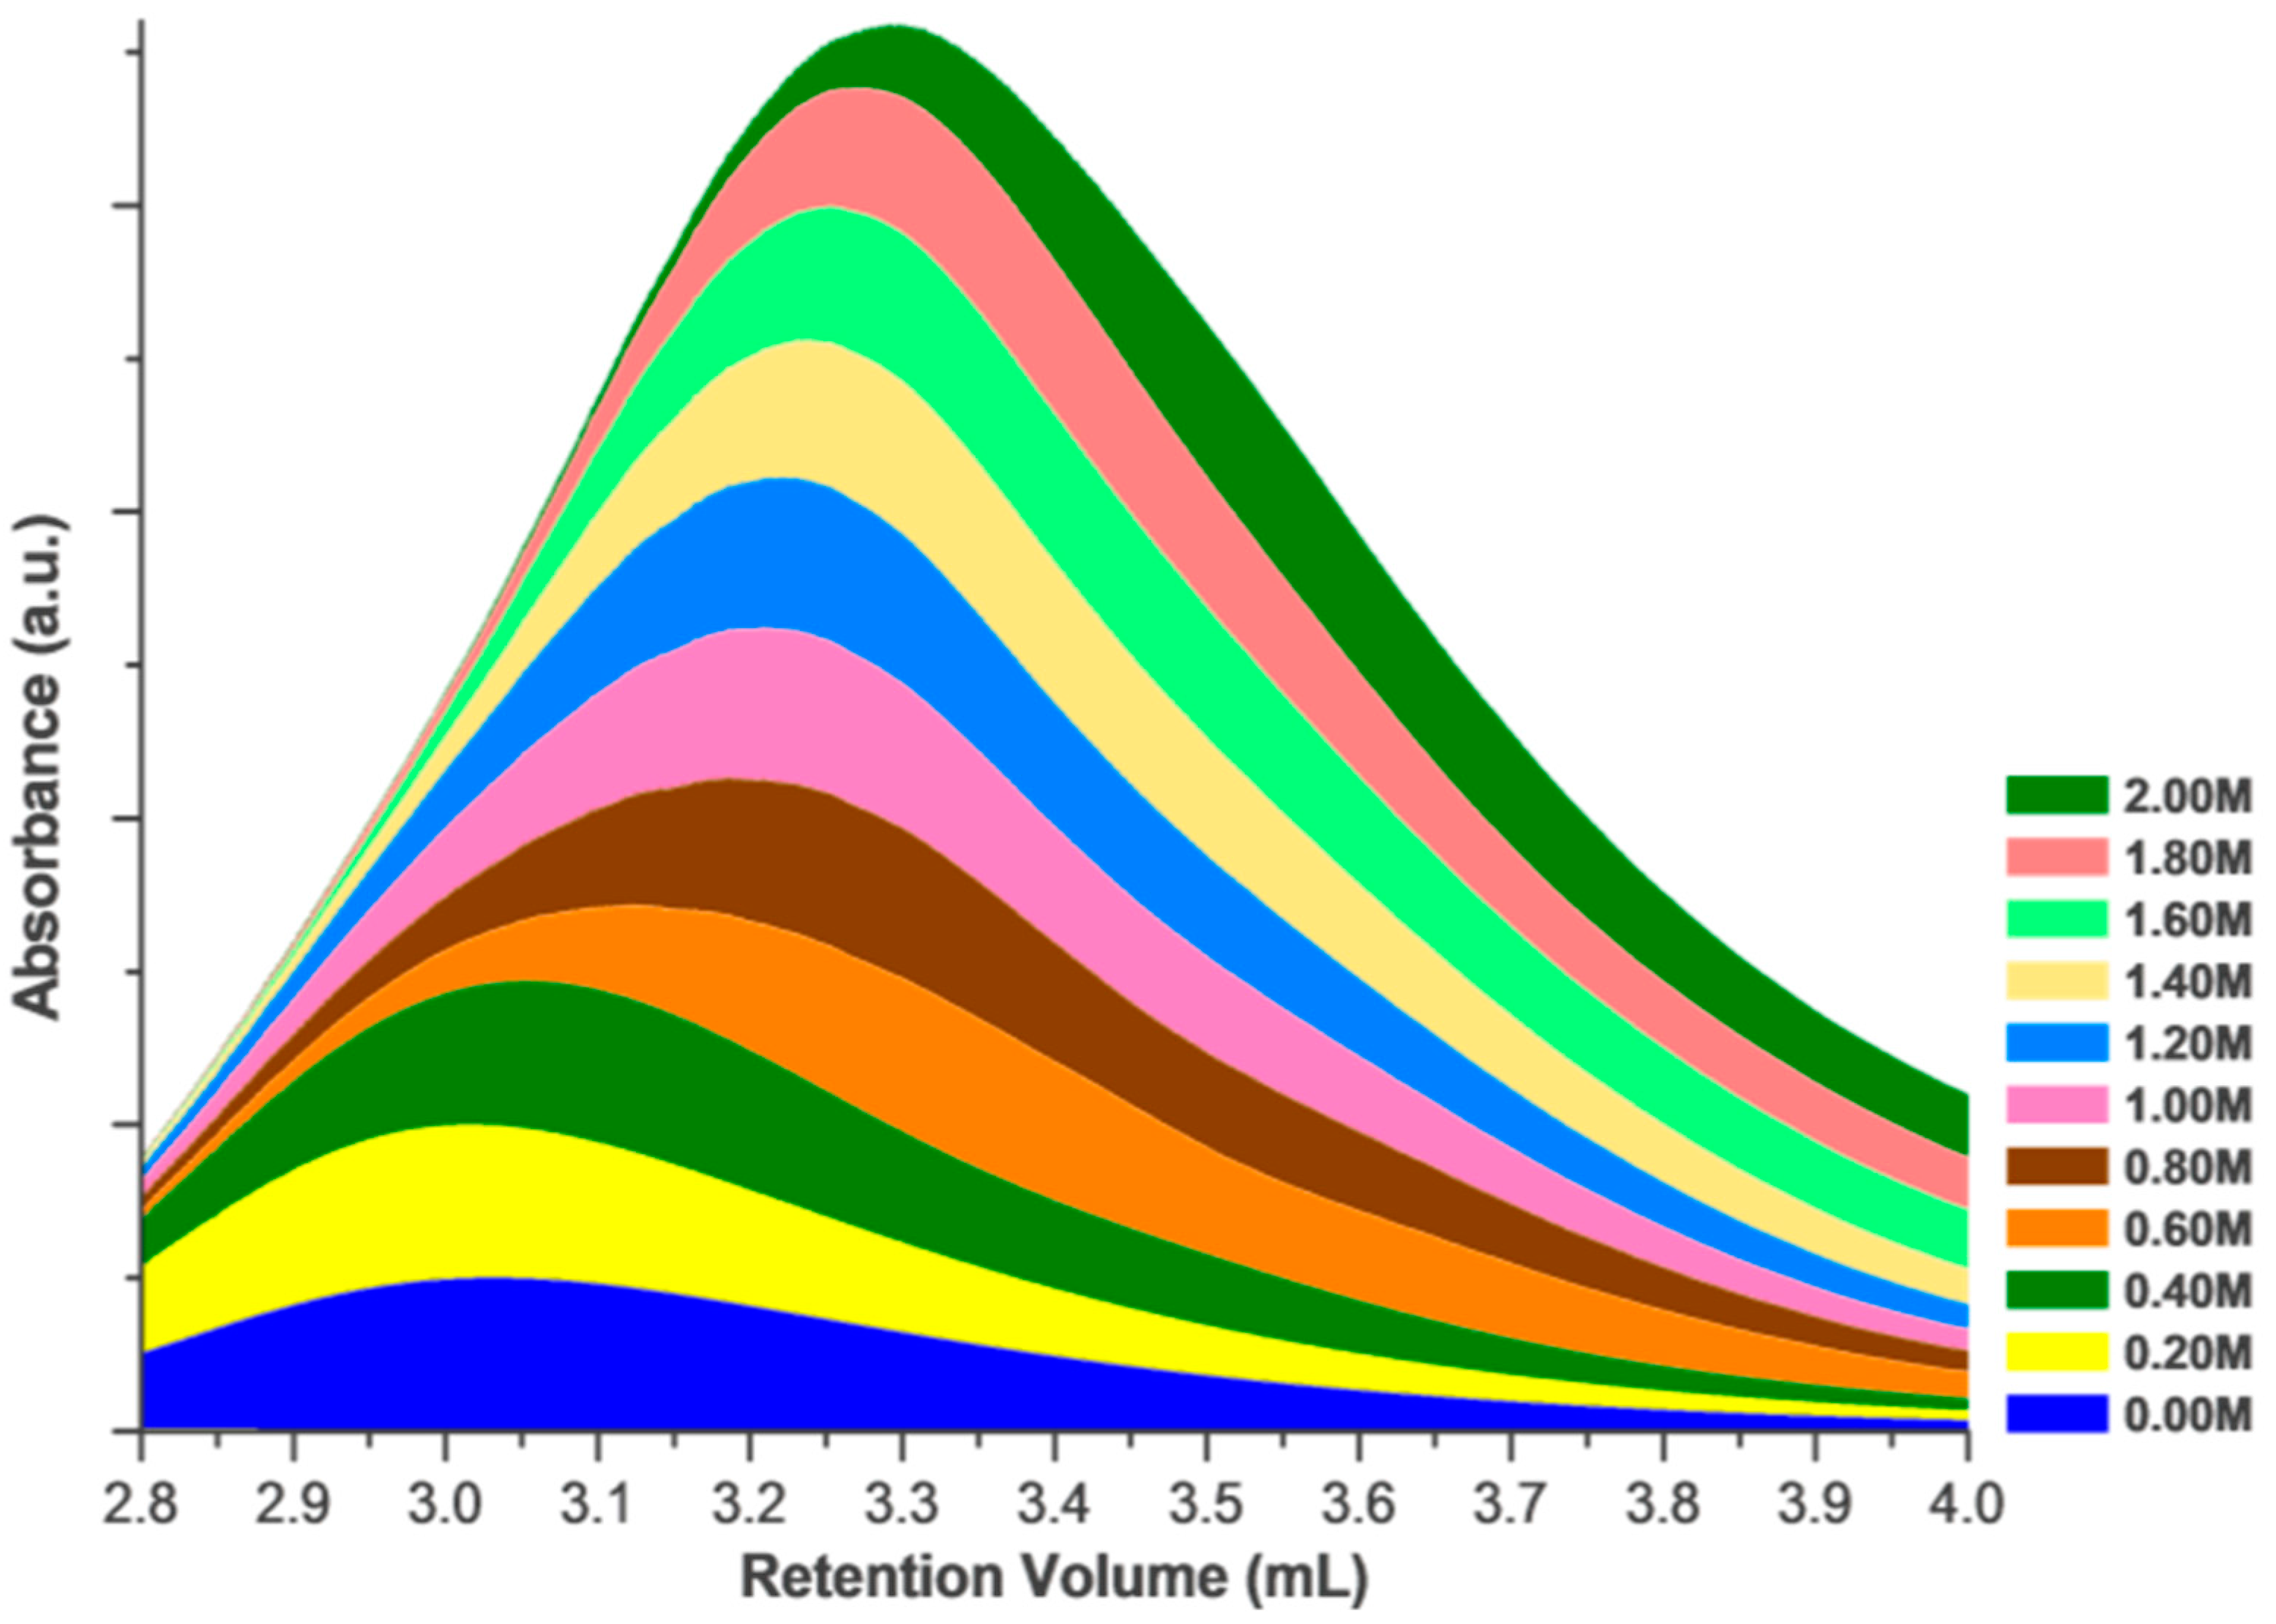
To further examine this behavior, we screened the concentration of NaCl in the mobile phase during SEC to determine the effects on the elution time/volume as shifts in the position of the non-aggregated HEWL absorbance peaks on the chromatograms (i.e., neglecting the peak position of the highly-aggregated sample). As displayed in Figure 2, these shifts were associated with changes in the SLS measured molar masses and sample polydispersity. Below, we detail our analysis, demonstrating features of protein behavior that have been well documented (salting-in/out), and demonstrating that SEC can be used to identify changes in protein aggregation state that (to our understanding) have not been previously demonstrated using SEC. We could find comparable studies using small angle X-ray and neutron scattering [32] and DLS [17] that support our results.

Effects of Ionic Strength on Elution (Salting in)

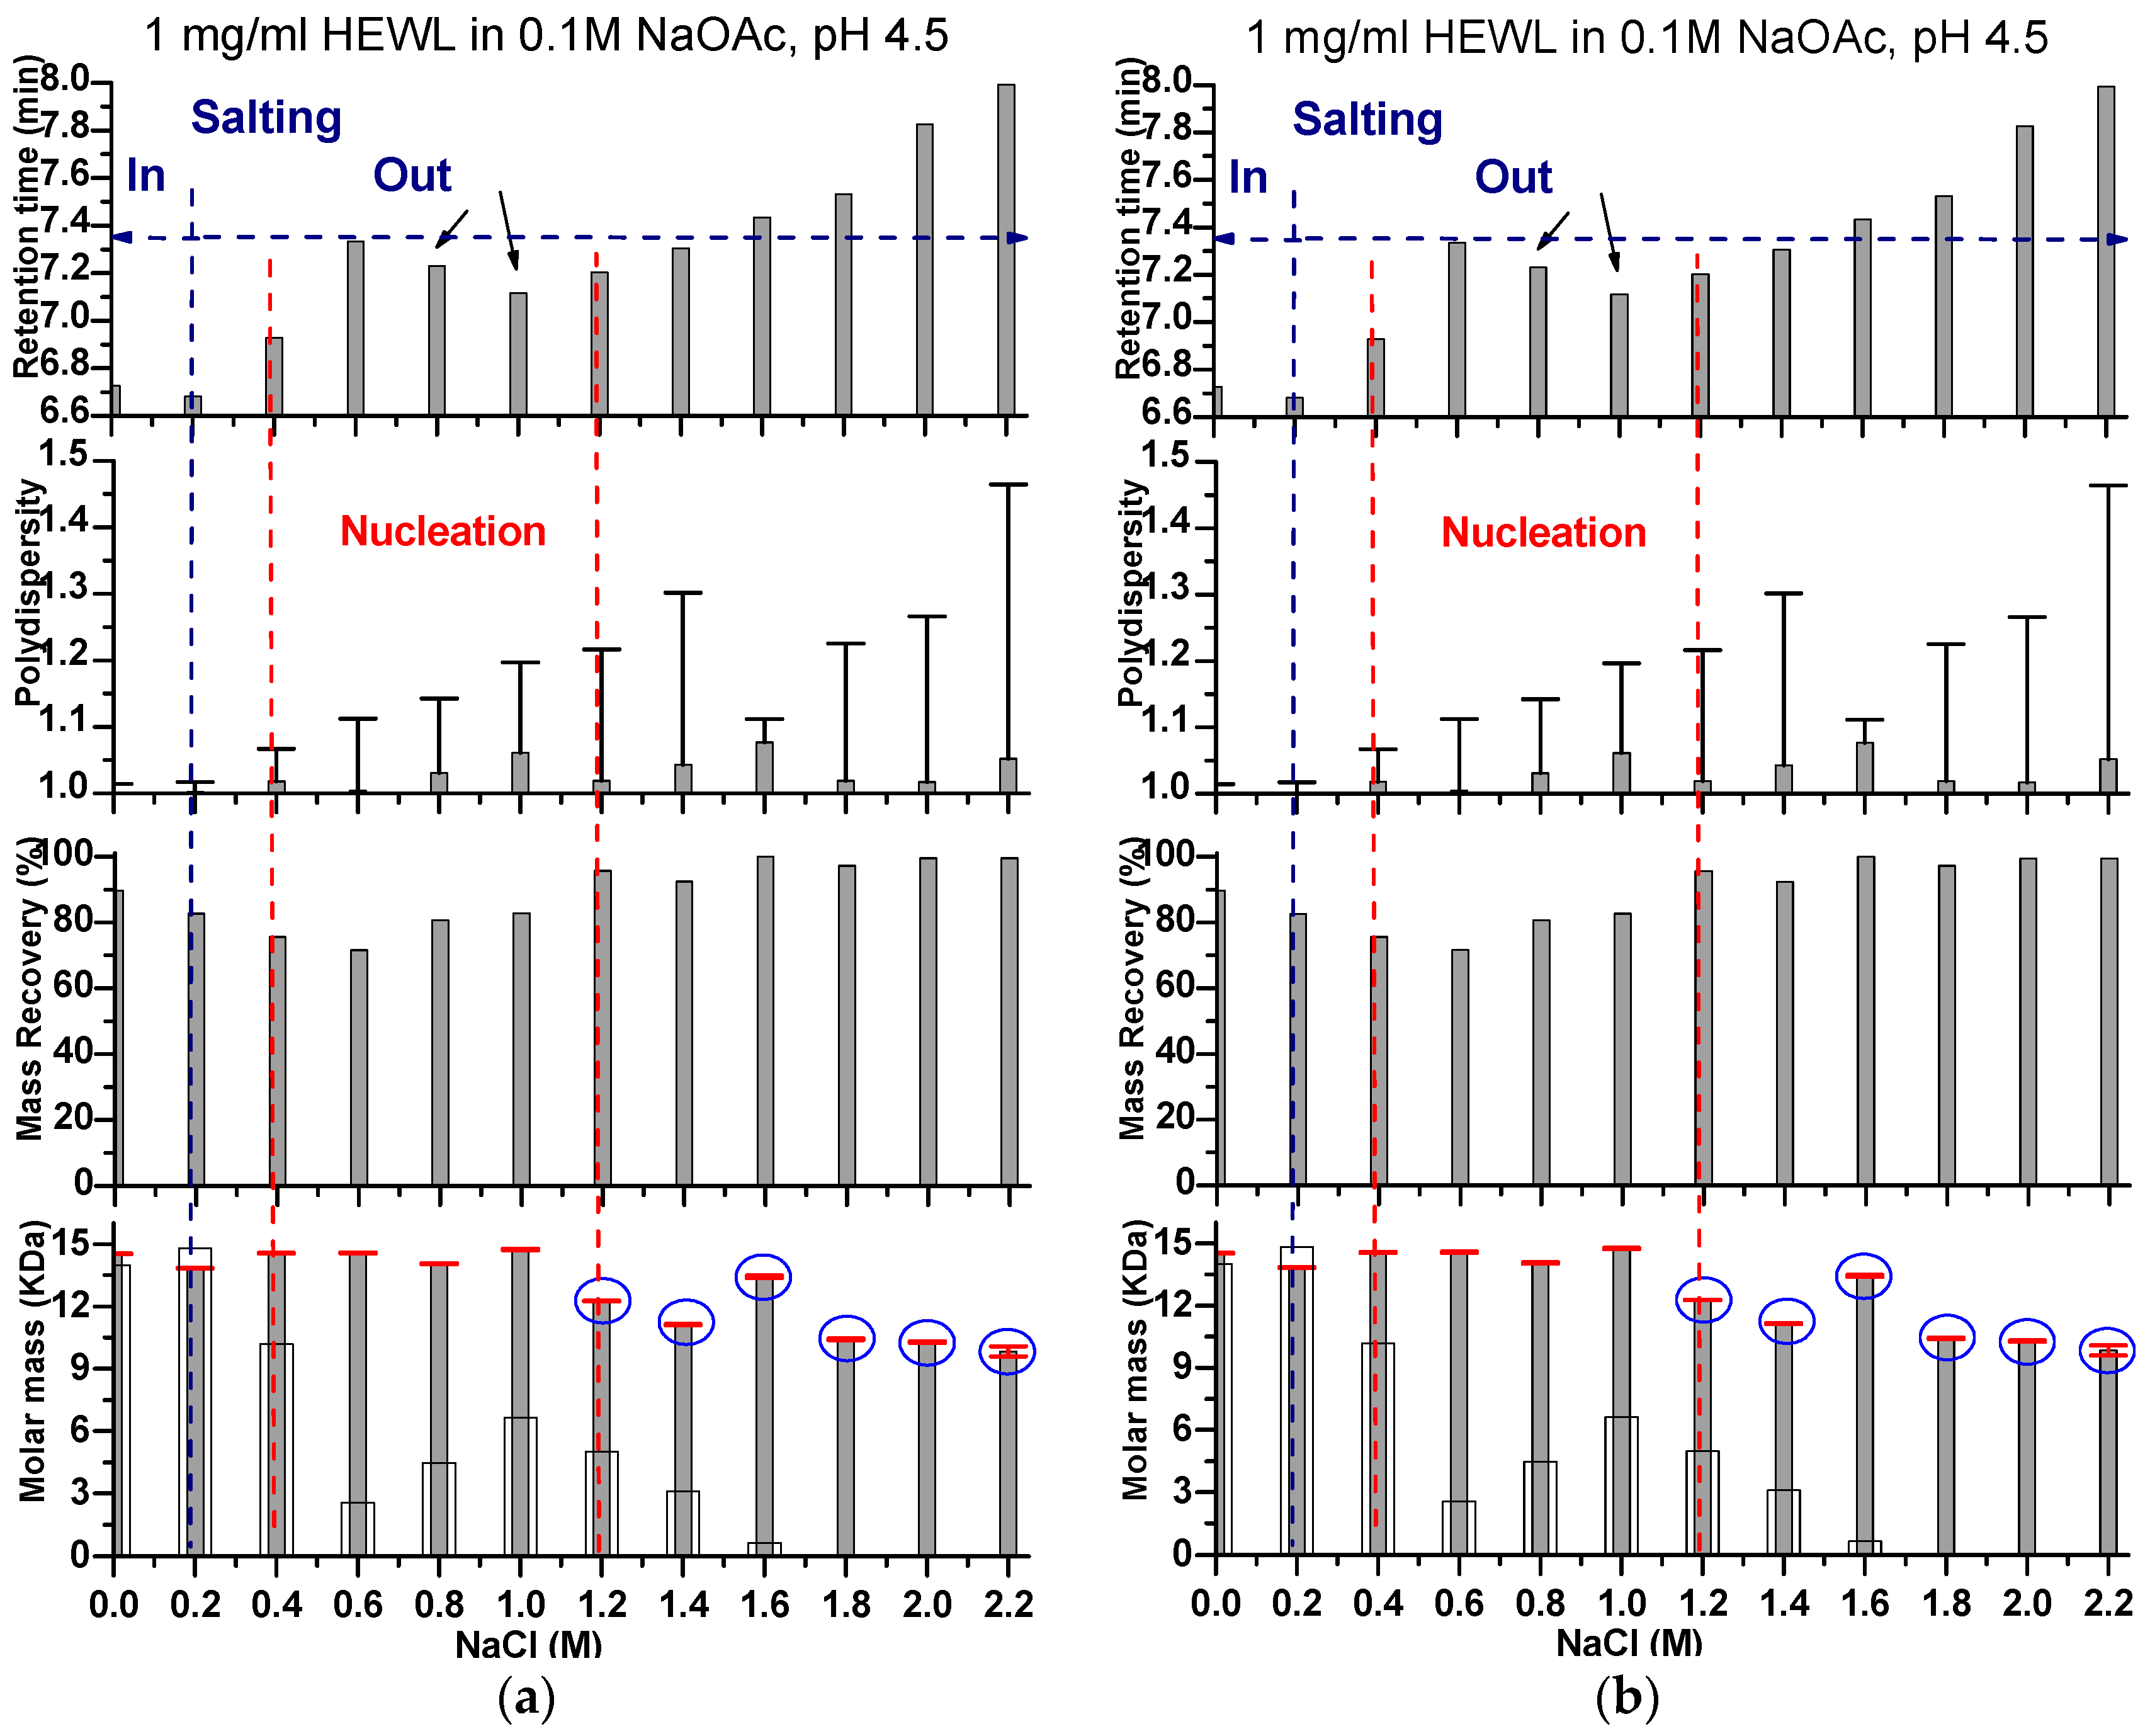
As shown in Figure 2, the addition of low amounts of NaCl to the mobile phase triggered HEWL to elute faster than it did when the mobile phase was NaCL-free. The measured molar mass was also lower, as displayed in Figure 3 at NaCl ≤ 0.2 M. This clearly demonstrates the known salting in effect by which proteins become more soluble (less prone to aggregation/self-assembly) and thus are eluted faster from the size exclusion column [33,34]. The volume-averaged masses measured by SLS confirm that this is accompanied by a lowering of the tendency of the molecules to self-assemble (i.e., large negative values of A22). A NaCl concentration of 0.4 M provides a mobile phase in which 1 mg/mL HEWL shows the lowest degree of self-association (i.e., high negative values of A22), whereas 0 M NaCl shows a significantly higher degree of self-association (i.e., large positive values of A22). As can be observed in Figure 2, at increasing NaCl concentration (>0.4 M for 1 mg/mL HEWL and 0.2 M for 2 mg/mL HEWL), the monomer peaks again begin to shift further to the right of the chromatograms, displaying increasing retention times. This observation has been earlier reported to be due to the relatively high content of the charged ions in the aqueous media that are expected to compete with the bound proteins for the charged resin [35]. This should decrease the proteins’ electrostatic interactions with the resin and promotes their intrinsic hydrophobic interactions. Therefore, the protein becomes structurally disconnected from the aqueous mobile phase and is retained longer in the column. Here, we have neglected the change in the viscosity of the mobile phase in this analysis as, within the range of concentrations used, it should be very minor compared to the solubility effect. [36].
Despite the delaying retention volumes at increasing NaCl concentrations, the results correlate well with the ‘salting out’ effect that is shown in Figure 3 as a general tendency for an increase in measured molecular mass accompanied by an increase in the sample polydispersity, indicative of a broadening of the population assembly distribution. We also observed that at certain NaCl concentration ranges of the mobile phase (0.6–1.1 M NaCl for 1 mg/mL HEWL and 0.4–0.7 M NaCl for 2 mg/mL HEWL, shown in Figure 2 and Figure 3, respectively), there were peak shifts to the left (faster elution) that also correlated with an increase in the molar masses as determined using SLS. These reversed shifts (i.e., against the ionic strength effect of the mobile phase) imply chances of nucleation, because the mobile phase used in this case is known to easily crystallize the protein under test. However, the amount of injected protein per trial (100–200 µg HEWL) that should have also encountered a sort of dilution in the column is not expected to really lead to the growth of even a critical nucleus. While only subtle increases in the molar masses were recorded, the change in elution position correlates well with the SLS measured masses and the changes in the measured masses are significantly above the errors of the measurement, as displayed in Figure 3. Beyond 0.7 and 1.2 M NaCl in the mobile phase of 1 and 2 mg/mL HEWL, respectively, the samples were prone to the formation of aggregates, shown as light scattering peak preceding the main analyzed peak as shown in Figure 1 and Figure 3.
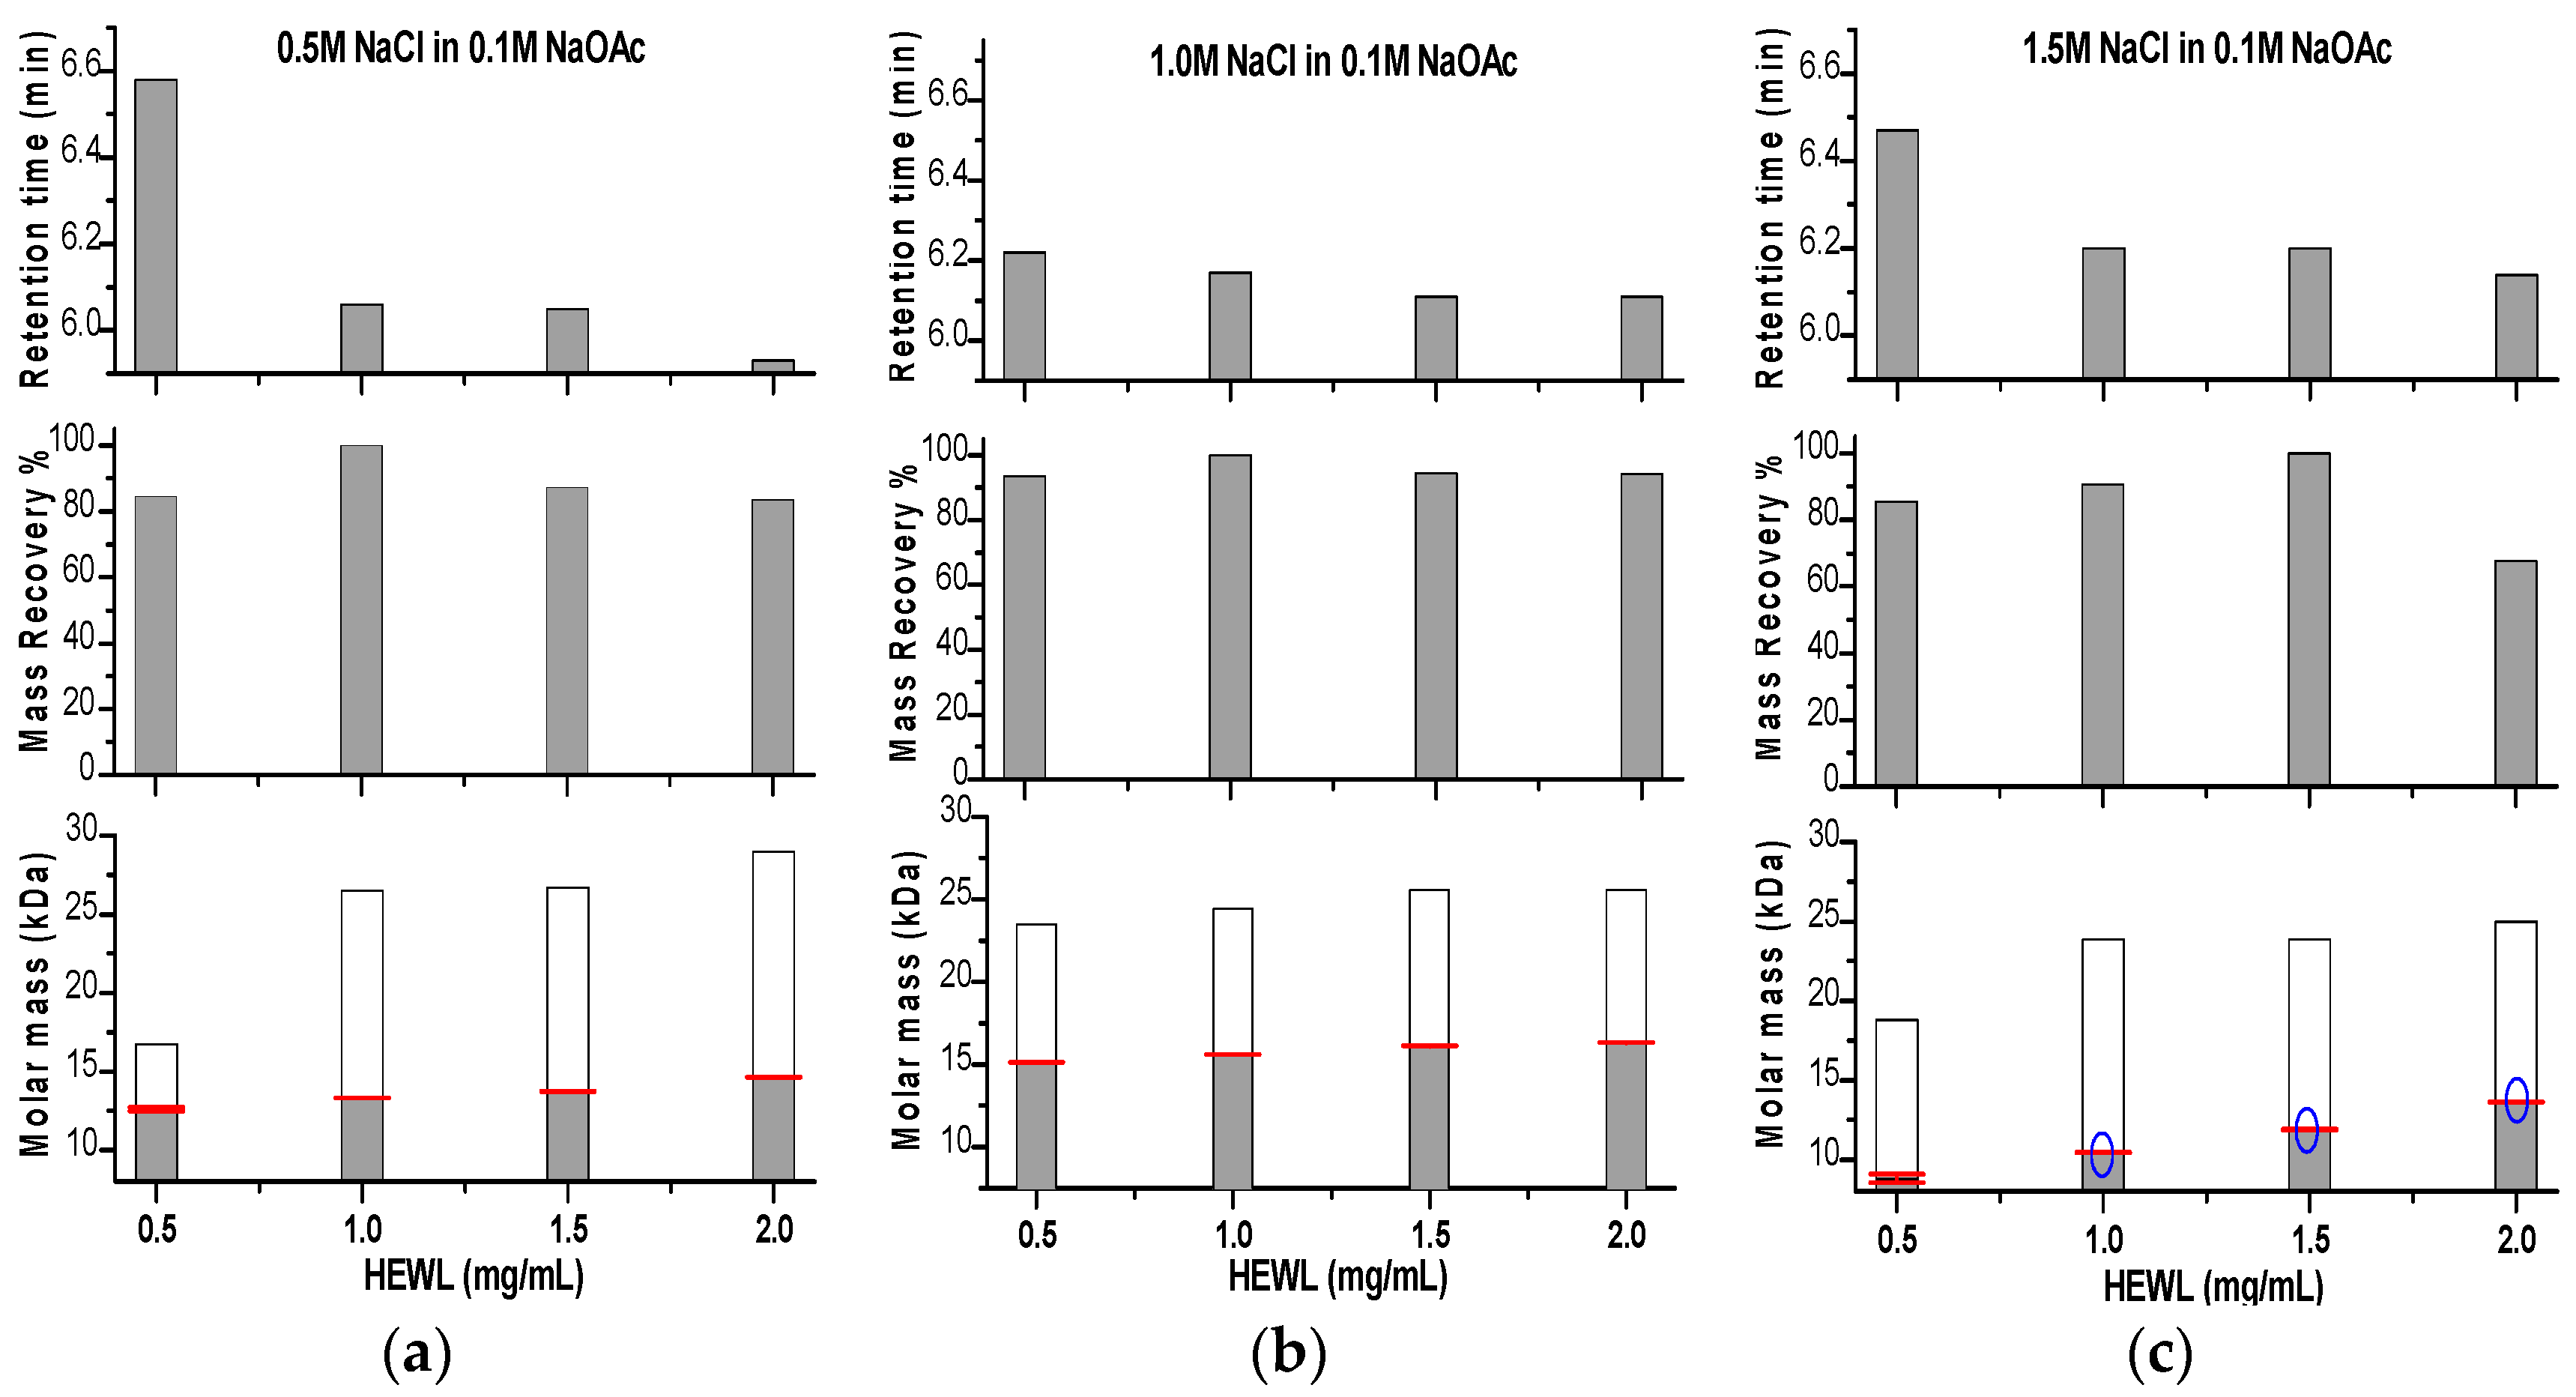
The complementary experiment, monitoring the protein assembly by injecting increasing concentrations of the protein under test when the mobile phase concentration was kept constant, was more straightforward. In this case, the mobile phase ionic strength will not interfere with the peak position–molecular size/mass relationship as the ionic strength is kept constant. Increasing the concentration of injected HEWL to the mobile phase that contains a crystallizing agent (NaCl) resulted in peak shifts to the left as shown in Figure 4. These shifts again coincided with an increase in the molar mass as measured by SLS. This again clearly indicates the possibility of monitoring protein inter-molecular interactions that might be indicative for assembly by observing peak shifts on SEC chromatograms. At low salt concentration in the mobile phase (0.5 and 1.0 M NaCl), one population was detected as displayed in Figure 4a,b. However, at high salt concentration (1.5 M NaCl), protein assembly was also associated with protein aggregation as can be seen in Figure 4c.
In summary, the SEC elution point of HEWL correlated with SLS determined molecular masses of the samples, demonstrating that SEC alone can provide data on the self-assembly of macromolecules. It should be stressed that at no point were masses indicative of dimers or higher order oligomers. SLS measures a volume averaged molar mass, meaning that changes in the recorded mass indicate a small subset of the sample being present as higher order assemblies, allowing an estimate of A22 to be made. Our data suggest that the same A22 estimate may also be made directly from SEC chromatograms in the absence of SLS data.
Since the effect of NaCl on most proteins is an increased solubility, we selected another precipitant, (NH4)2SO4, that is known to have the same salting out effect on a different model protein: bovine trypsin [37]. We followed the same two systematic studies we conducted for HEWL; with increasing (NH4)2SO4 concentration at constant trypsin concentration and vice versa. It was difficult to follow the variations with increasing trypsin concentrations, due to the early appearance of aggregates. However, increasing the (NH4)2SO4 concentrations led to similar variations as shown in Table 1. Trypsin eluted earlier when (NH4)2SO4 was added to the mobile phase and this coincided with an increase in molar mass and polydispersity. The protein showed higher solubility (lower molar mass and polydispersity) at (NH4)2SO4 concentrations higher than 1 M and eluted later from the column (salting in). However, trypsin showed an increasing degree of assembly at higher (NH4)2SO4 concentrations (salting out). Using a mobile phase of 1.5 M (NH4)2SO4, trypsin displayed two peaks on the chromatogram—one corresponding to a trimeric assembly and a second monomeric peak. It is notable that two distinctly different degrees of assemblies in cases of using 0 and 1.5 M (NH4)2SO4 in the mobile phase eluted at similar volumes (Table 1). In addition, the larger trimeric assembly of trypsin eluted in 1.5 M (NH4)2SO4 eluted later than the monomeric assembly eluted in 0.5 M (NH4)2SO4. These observations are consistent with our observations above for HEWL in increasing NaCl concentrations.

3. Discussion

The conventional application of SEC in structural biology laboratories is to fractionate a given biological sample, for instance by separating monomers from aggregates and perform a molecular weight distribution analysis as well as facilitating protein storage by changing the mobile phase composition. In the general knowledge regarding SEC, it is assumed that, while the sample concentration can interfere with the resolution of sample fractionation, elution points on chromatograms are largely independent of the components of the mobile phase. In contrast, we show here that variations in the composition of the mobile phase can have a large impact on the retention time/volume. Not only can these variations affect the subsequent evaluation of the eluted macromolecules, but also can result in detectable changes in their state (e.g., self-assembly, aggregation or precipitation). This variation on the mobile phase components could be highly problematic for experiments performed with the intention of fractionating or purifying an injected macromolecular sample. Therefore, precise calibration curves specific for every mobile phase should be plotted. In addition, careful choice of the mobile phase may provide a mechanism to further enhance separation of proteins of interest from contaminants using SEC approaches.
Furthermore, we believe this to be the first demonstration that SEC can be used to study changes in molecular mass that we propose are due to variations of A22 values across a phase diagram. Our observations are confirmed by measurable changes in the molecular masses retrieved from our inline SLS measurements. Similar variations in measured solution molecular mass have been reported by both DLS and X-ray/neutron scattering and have been accepted to represent the effects of changes in A22 with solution composition. SEC experiments using recently available microcolumns hold the potential for a similar scanning of solution behavior and may yet provide an alternative route to the prediction of crystallization conditions. We are currently developing an experimental setting that will make it possible to test mobile phase conditions for proteins that have not been previously crystallized.

4. Materials and Methods

4.1. Solution Conditions

Hen egg-white lysozyme (HEWL) and bovine trypsin were purchased from Sigma-Aldrich Darmstadt, Germany (Cat. No. L4919) and Amresco LLC, Ohio, USA (Lot 2555C052), respectively and used without further purification. Per the product information the material was ~98% pure monomer. All other chemicals were reagent grade. HEWL was dissolved in 0.1M sodium acetate (NaOAc) that was adjusted to pH 4.5 using acetic acid. The mobile phases were prepared from a range of sodium chloride (NaCl) concentrations buffered with 0.1 M NaOAc, pH 4.5, because this combination is known to facilitate the crystallization of HEWL in two polymorphic forms: tetragonal and orthorhombic crystals [38,39,40]. Similarly, trypsin was dissolved in water with adequate amount of calcium chloride and benzamidine HCl to prevent self-cleavage. The mobile phases for trypsin were prepared from a range of ammonium sulfate (NH4)2SO4 that was adjusted to pH 8.5 using 0.1 M Tris buffer. This combination is known to lead to the growth of orthorhombic trypsin crystals [41]. Before every SEC experiment a freshly prepared mobile phase was degassed and filtered through a 0.22 µm membrane. Relying on the known phase diagram and solubility values of HEWL, we performed our scans in two ways to study both the effect of mobile phase ionic strength and sample concentration [42,43]. First, we scanned a defined HEWL concentration at increasing precipitant concentrations in the mobile phase. For this, we selected two HEWL concentrations (1 & 2 mg/mL) against a wide range of NaCl concentrations (0.1–2 M) in the mobile phase. The second approach was to scan increasing HEWL concentrations (0.5–2 mg/mL) at discrete constant mobile phase concentrations (0.5, 1.0 and 1.5 M NaCl). Scanning increasing Trypsin concentrations against relatively low (NH4)2SO4 concentrations (0.5M) lead to aggregation on the column. Therefore, we focused on performing SEC at low trypsin concentration (2.0 mg/mL) with increasing (NH4)2SO4 concentrations (0–2 M).

4.2. Experimental Setups

A brand new microcolumn (Superdex 75 5/150 GL) mounted on an NGC (Next Generation Chromatography) chromatography system, (BioRad, Berkeley, CA, USA) operated at a flow rate of 0.35 mL/min was used for the whole set of SEC experiments. The system was equilibrated using the selected NaCl concentration using the buffer blending module, ensuring a minimization of random errors in the preparation of the mobile phase. For every chromatographic run, equal volumes of the required HEWL or trypsin concentration were dissolved in their respective buffer (water in case of trypsin) and manually injected into the NGC system. The selected injected volume to total column volume ratio facilitated a high-resolution fractionation regime. The sample molar mass, mass recovery, and polydispersity were monitored by using static light scattering (SLS) measurements provided by an in-line miniDAWN TREOS, (Wyatt, Santa Barbara, CA, USA) and its associated Astra 6.1 software (Wyatt, Santa Barbara, CA, USA).

Acknowledgments

We would like to thank Daiichi Sankyo Company Ltd. for funding this project through their TaNeDS program.

Conflicts of Interest

The authors declare no conflict of interest.

References

  1. Hefti, F. High-performance size-exclusion chromatography: A buffer for the reliable determination of molecular weights of proteins. Anal. Biochem. 1982, 121, 378–381. [Google Scholar] [CrossRef]
  2. Lodish, H.; Berk, A.; Zipursky, S.L.; Matsudaira, P.; Baltimore, D.; Darnell, J. Section 3.5, Purifying, Detecting, and Characterizing Proteins. In Molecular Cell Biology; W. H. Freeman: New York, NY, USA, 2000. [Google Scholar]
  3. Irvine, G.B. High-performance size-exclusion chromatography of peptides. J. Biochem. Biophys. Methods 2003, 56, 233–242. [Google Scholar] [CrossRef]
  4. Janson, J.-C. Protein Purification: Principles, High Resolution Methods, and Applications; John Wiley & Sons: Hoboken, NJ, USA, 2012. [Google Scholar]
  5. Mori, S.; Barth, H.G. Size Exclusion Chromatography; Springer Science & Business Media: Berlin, Germany, 2013. [Google Scholar]
  6. Sigma-Aldrich1. Molecular Weight Markers for Gel Filtration Chromatography. Available online: http://www.sigmaaldrich.com/life-science/proteomics/protein-chromatography/mw-markers.html (accessed on 6 September 2017).
  7. Sigma-Aldrich2. Gel Filtration Chromatography. Available online: http://www.sigmaaldrich.com/life-science/proteomics/protein-chromatography/gel-filtration-chromatography.html (accessed on 6 September 2017).
  8. Grubisic, Z.; Rempp, P.; Benoit, H. A universal calibration for gel permeation chromatography. J. Polym. Sci. B Polym. Lett. 1967, 5, 753–759. [Google Scholar] [CrossRef]
  9. Ricker, R.; Sandoval, L. Fast, reproducible size-exclusion chromatography of biological macromolecules. J. Chromatogr. A 1996, 743, 43–50. [Google Scholar] [CrossRef]
  10. Kopaciewicz, W.; Regnier, F. Nonideal size-exclusion chromatography of proteins: Effects of pH at low ionic strength. Anal. Biochem. 1982, 126, 8–16. [Google Scholar] [CrossRef]
  11. Kamberi, M.; Chung, P.; DeVas, R.; Li, L.; Li, Z.; Ma, X.; Fields, S.; Riley, C.M. Analysis of non-covalent aggregation of synthetic hPTH (1–34) by size-exclusion chromatography and the importance of suppression of non-specific interactions for a precise quantitation. J. Chromatogr. B 2004, 810, 151–155. [Google Scholar] [CrossRef]
  12. Roumeliotis, P.; Unger, K. Assessment and optimization of system parameters in size exclusion separation of proteins on diol-modified silica columns. J. Chromatogr. A 1981, 218, 535–546. [Google Scholar] [CrossRef]
  13. Fekete, S.; Beck, A.; Veuthey, J.-L.; Guillarme, D. Theory and practice of size exclusion chromatography for the analysis of protein aggregates. J. Pharm. Biomed. Anal. 2014, 101, 161–173. [Google Scholar] [CrossRef] [PubMed]
  14. Tu, C.J.; Peterson, E.C.; Henry, R.; Hoffman, N.E. The L18 domain of light-harvesting chlorophyll proteins binds to chloroplast signal recognition particle. J. Biol. Chem. 2000, 275, 13187–13190. [Google Scholar] [CrossRef] [PubMed]
  15. Groves, M.R.; Mant, A.; Kuhn, A.; Koch, J.; Dübel, S.; Robinson, C.; Sinning, I. Functional characterization of recombinant chloroplast signal recognition particle. J. Biol. Chem. 2001, 276, 27778–27786. [Google Scholar] [CrossRef] [PubMed]
  16. Attri, A.K.; Minton, A.P. New methods for measuring macromolecular interactions in solution via static light scattering: Basic methodology and application to non-associating and self-associating proteins. Anal. Biochem. 2005, 337, 103–110. [Google Scholar] [CrossRef] [PubMed]
  17. George, A.; Wilson, W.W. Predicting protein crystallization from a dilute solution property. Acta Crystallogr. D 1994, 50, 361–365. [Google Scholar] [CrossRef] [PubMed]
  18. Wilson, W.W. Monitoring crystallization experiments using dynamic light scattering: Assaying and monitoring protein crystallization in solution. Methods 1990, 1, 110–117. [Google Scholar] [CrossRef]
  19. Neal, B.L.; Asthagiri, D.; Velev, O.D.; Lenhoff, A.M.; Kaler, E.W. Why is the osmotic second virial coefficient related to protein crystallization? J. Cryst. Growth 1999, 196, 377–387. [Google Scholar] [CrossRef]
  20. Wilson, W.W. Light scattering as a diagnostic for protein crystal growth—A practical approach. J. Struct. Biol. 2003, 142, 56–65. [Google Scholar] [CrossRef]
  21. Sleutel, M.; Lutsko, J.; Van Driessche, A.E.S.; Durán-Olivencia, M.A.; Maes, D. Observing classical nucleation theory at work by monitoring phase transitions with molecular precision. Nat. Commun. 2014, 5, 5598. [Google Scholar] [CrossRef] [PubMed]
  22. Nettleship, J.E.; Brown, J.; Groves, M.R.; Geerlof, A. Methods for protein characterization by mass spectrometry, thermal shift (ThermoFluor) assay, and multiangle or static light scattering. In Structural Proteomics: High-throughput Methods; Springer: Berlin, Germany, 2008; Volume 426, pp. 299–318. [Google Scholar]
  23. Ye, H. Simultaneous determination of protein aggregation, degradation, and absolute molecular weight by size exclusion chromatography–multiangle laser light scattering. Anal. Biochem. 2006, 356, 76–85. [Google Scholar] [CrossRef] [PubMed]
  24. Mogridge, J. Using light scattering to determine the stoichiometry of protein complexes. In Protein-Protein Interactions: Methods and Applications; Springer: Berlin, Germany, 2004; Volume 1278, pp. 113–118. [Google Scholar]
  25. Sahin, E.; Roberts, C.J. Size-exclusion chromatography with multi-angle light scattering for elucidating protein aggregation mechanisms. In Therapeutic Proteins: Methods and Protocols; Springer: Berlin, Germany, 2012; pp. 403–423. [Google Scholar]
  26. Ahrer, K.; Buchacher, A.; Iberer, G.; Josic, D.; Jungbauer, A. Analysis of aggregates of human immunoglobulin G using size-exclusion chromatography, static and dynamic light scattering. J. Chromatogr. A 2003, 1009, 89–96. [Google Scholar] [CrossRef]
  27. Mathew, E.; Mirza, A.; Menhart, N. Liquid-chromatography-coupled SAXS for accurate sizing of aggregating proteins. J. Synchr. Rad. 2004, 11, 314–318. [Google Scholar] [CrossRef] [PubMed]
  28. Watanabe, Y.; Inoko, Y. Size-exclusion chromatography combined with small-angle X-ray scattering optics. J. Chromatogr. A 2009, 1216, 7461–7465. [Google Scholar] [CrossRef] [PubMed]
  29. David, G.; Pérez, J. Combined sampler robot and high-performance liquid chromatography: A fully automated system for biological small-angle X-ray scattering experiments at the Synchrotron SOLEIL SWING beamline. J. Appl. Crystallogr. 2009, 42, 892–900. [Google Scholar] [CrossRef]
  30. Graewert, M.A.; Franke, D.; Jeffries, C.M.; Blanchet, C.E.; Ruskule, D.; Kuhle, K.; Flieger, A.; Schäfer, B.; Tartsch, B.; Meijers, R.; et al. Automated pipeline for purification, biophysical and X-ray analysis of biomacromolecular solutions. Sci. Rep. 2015, 5, 10734. [Google Scholar] [CrossRef] [PubMed]
  31. Hutin, S.; Brennich, M.; Maillot, B.; Round, A. Online ion-exchange chromatography for small-angle X-ray scattering. Acta Crystallogr. D 2016, 72, 1090–1099. [Google Scholar] [CrossRef] [PubMed]
  32. Stradner, A.; Sedgwick, H.; Cardinaux, F.; Poon, W.C.K.; Egelhaaf, S.U.; Schurtenberger, P. Equilibrium cluster formation in concentrated protein solutions and colloids. Nature 2004, 432, 492–495. [Google Scholar] [CrossRef] [PubMed]
  33. Leberman, R. The Hofmeister series and ionic strength. FEBS Lett. 1991, 284, 293–294. [Google Scholar] [CrossRef]
  34. Arakawa, T.; Timasheff, S.N. Mechanism of protein salting in and salting out by divalent cation salts: Balance between hydration and salt binding. Biochemistry 1984, 23, 5912–5923. [Google Scholar] [CrossRef] [PubMed]
  35. Wilson, K.; Walker, J. Principles and Techniques of Biochemistry and Molecular Biology; Cambridge University Press: Cambridge, UK, 2010. [Google Scholar]
  36. Ozbek, H.; JoAo, F.; Phillips, S.L. Viscosity of Aqueous Sodium Chloride Solutions from 0–150 °C. No. LBL-5931; Ernest Orlando Lawrence Berkeley National Laboratory: Berkeley, CA, USA, 1977.
  37. Dumetz, A.C.; Snellinger-O’Brien, A.M.; Kaler, E.W.; Lenhoff, A.M. Patterns of protein–protein interactions in salt solutions and implications for protein crystallization. Protein Sci. 2007, 16, 1867–1877. [Google Scholar] [CrossRef] [PubMed]
  38. Ewing, F.; Forsythe, E.; Pusey, M. Orthorhombic lysozyme solubility. Acta Crystallogr. D 1994, 50, 424–428. [Google Scholar] [CrossRef] [PubMed]
  39. Ataka, M.; Asai, M. Systematic studies on the crystallization of lysozyme: Determination and use of phase diagrams. J. Cryst. Growth 1988, 90, 86–93. [Google Scholar] [CrossRef]
  40. Ataka, M.; Tanaka, S. The growth of large single crystals of lysozyme. Biopolymers 1986, 25, 337–350. [Google Scholar] [CrossRef] [PubMed]
  41. Adawy, A.; Corbeek, W.; de Ronde, E.; van Enckevort, W.J.; de Grip, W.J.; Vlieg, E. A practical kit for micro-scale application of the ceiling crystallisation method. CrystEngComm 2015, 17, 2602–2605. [Google Scholar] [CrossRef]
  42. Asherie, N. Protein crystallization and phase diagrams. Methods 2004, 34, 266–272. [Google Scholar] [CrossRef] [PubMed]
  43. Howard, S.B.; Twigg, P.J.; Baird, J.K.; Meehan, E.J. The solubility of hen egg-white lysozyme. J. Cryst. Growth 1988, 90, 94–104. [Google Scholar] [CrossRef]
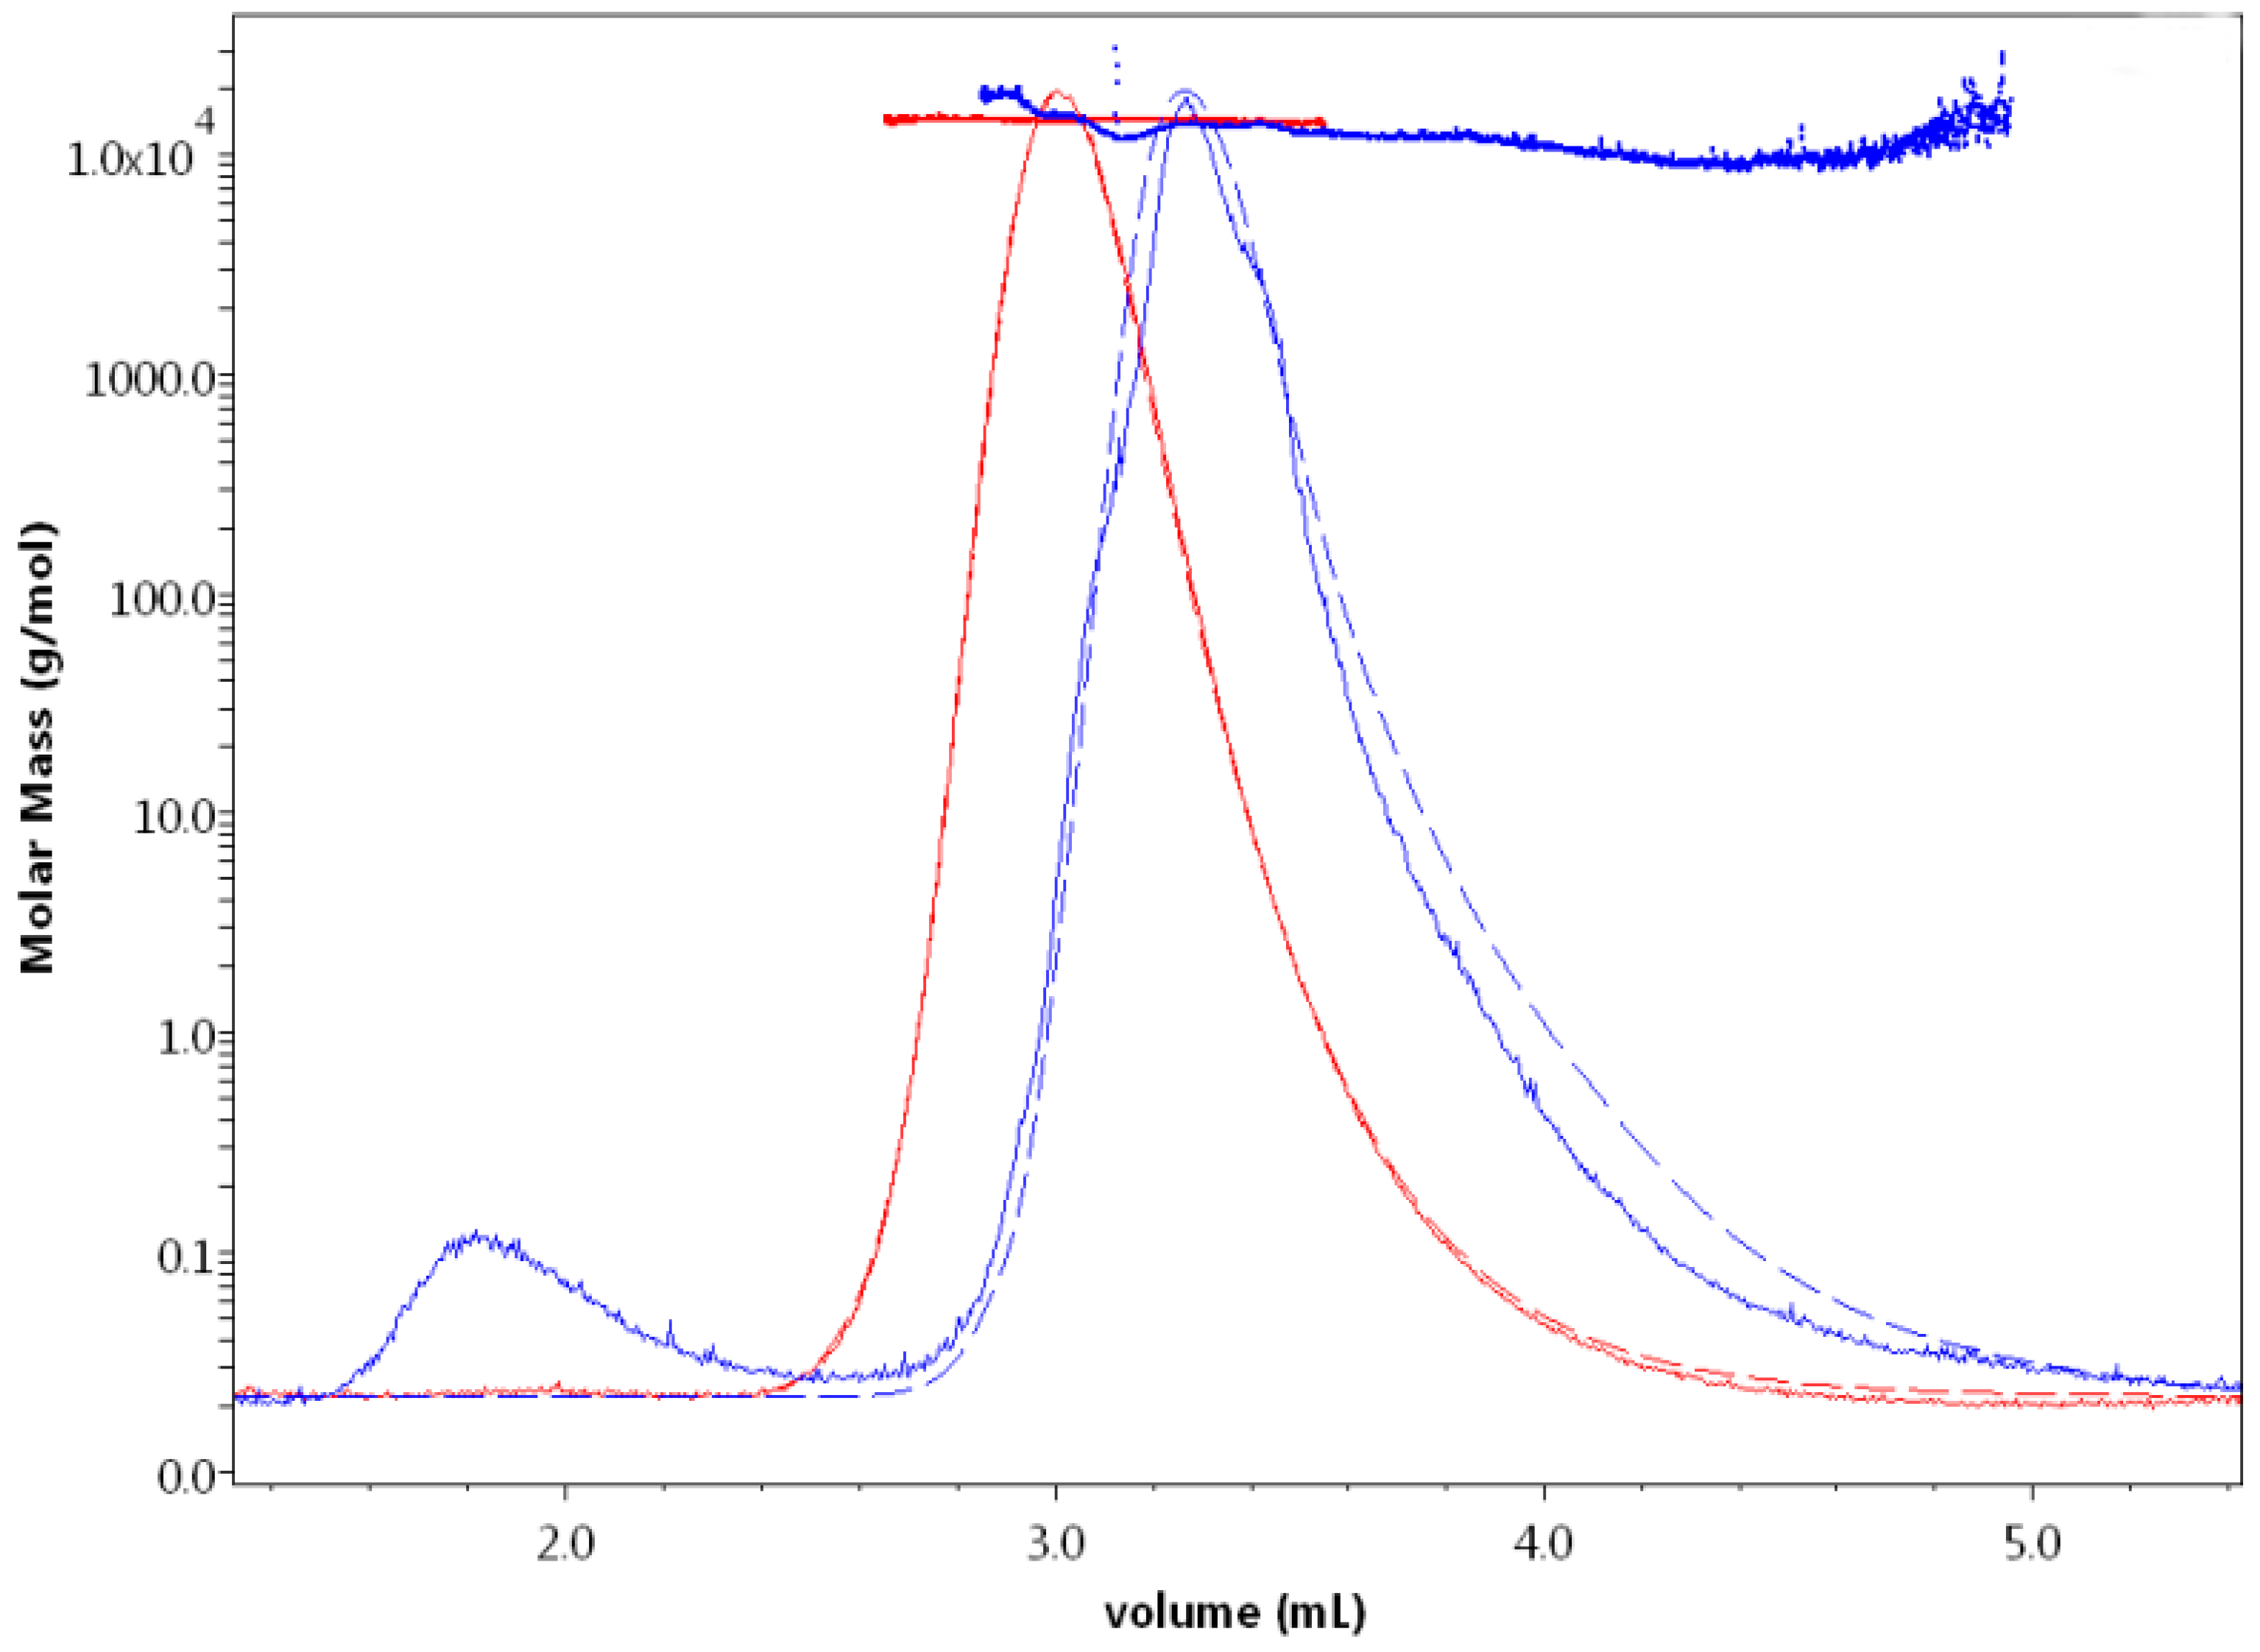
Figure 1. Light scattering curves with the corresponding calculated molar masses obtained for HEWL eluted in 0.1 M NaOAc buffer containing 0 M (red) and 2 M (blue) NaCl. At 2 M NaCl, HEWL displayed a significant delay in its elution from the column and aggregates were first eluted and were shown by the light scattering signal (solid line) as a small peak (eluted around 1.8 mL) preceding the main peak (eluted around 3.4 mL). The absorbance curves (dashed) demonstrate the same elution volume behavior and are very much aligned with the LS curve of HEWL eluted with 0 M NaCl. This is not the case for HEWL eluted with 2 M NaCl, which does not show any information about higher molecular weight protein aggregation.
Crystals 07 00331 g001
Figure 2. The change in the retention volume of 1 mg/mL HEWL at increasing concentrations of NaCl in the mobile phase. The retention volume of identical injection volumes at identical concentrations shows a marked dependence upon the mobile phase in SEC. This stacked area plot focuses on the non-aggregated region of the chromatogram (right peak in Figure 1), with retention volumes associated with aggregated fraction not shown.
Crystals 07 00331 g002
Figure 3. Graphical representation for the change in retention time obtained from SEC. Also given are the polydispersity, mass recovery, and molar mass obtained from in line SLS data analysis (horizontal red line on which are the error bars). In the molar mass panel, the molar masses calculated from the standard calibration curve of the gel filtration column are shown in white columns. Figure 3a,b indicate the data for HEWL eluted using a mobile phase containing a wide range of NaCl concentrations at a protein concentration of 1 and 2 mg/mL, respectively. The retention time increases with increasing NaCl concentration in the mobile phase. At two supersaturation levels, the retention time showed a slight drop before it continued again its increase. One drop was detected at the interface between the salting in (when the protein became more soluble by the first addition of sodium chloride) and salting out (when the protein became less soluble at increasing NaCl concentrations). On the graphs, the dashed blue line shows the limit between the salting in and the salting out as per our observations. The second drop (indicated by the black arrow) occurred at the supersaturation level that is most probably coinciding with nucleation (the area between the two dashed red lines), as was shown by the drop of mass recovery and subtle increase in the molar mass. At higher supersaturation levels, additional bands for aggregates preceding the bands under study appeared on LS graphs (shown on the graph as blue circles), which coincided with a drop in molar masses of the main protein peaks and increase in their polydispersity.
Crystals 07 00331 g003
Figure 4. Graphical representation for the change in retention time obtained from SEC, mass recovery and molar mass obtained from SLS data analysis for HEWL prepared at four concentrations (0.5–2.0 mg/mL) eluted through NaCl buffered with 0.1 M NaOAc pH 4.5 at three concentrations (0.5 (a), 1.0 (b) and 1.5M (c)). In the molar mass panels, the molar masses calculated from the standard calibration curve of the gel filtration column are shown in white columns. Blue circles in the molar mass panel indicate where small aggregates appeared on LS graphs.
Crystals 07 00331 g004
Table 1. The variations of bovine trypsin retention volume, molar mass, and polydispersity with increasing concentrations of (NH4)2SO4 in 0.1 M TRIS buffer pH 8.5.
(NH4)2SO4 (M)Retention Volume (mL)Measured Molar Mass (kDa)Polydispersity
0.02.7328.688 (±0.846)1.002 (0.042)
0.52.5537.571 (±6.305)1.042 (0.248)
1.02.9125.673 (±2.765)1.033 (0.143)
1.52.7385.202 (±7.919)1.061 (0.177)
2.9626.516 (±7.972)1.014 (0.387)
2.01.211232.341 (±88.439)1.019 (0.099)
1.461119.304 (±28.018)1.018 (0.035)