1. Introduction
Oxide crystals are typically brittle at low temperatures because of their predominant ionic and/or covalent bonding. It is known that slip systems that can be activated in ionic crystals are limited by electrostatic interactions between ions [
1], whereas slip system activation in covalent crystals is affected by strongly localized and directional bonds that share electrons [
2]. In addition, oxide crystals have large unit cells, leading to large lattice constants, since an oxide is a compound between one or more metallic elements and oxygen atoms. As a result, oxide crystals have large Burgers vectors, which represent the magnitude and direction of dislocations that produce plastic deformation. The larger Burgers vectors make it more difficult to move dislocations. Since the stresses required for dislocation motion are often larger than stresses required for crack propagation, oxide crystals are typically brittle by nature.
The mechanical properties of strontium titanate (SrTiO
3) crystals have received growing interest due to the fact that they can exhibit a large degree of plasticity even at low temperatures [
3,
4,
5,
6,
7,
8,
9,
10,
11]. SrTiO
3 is an oxide with a cubic perovskite structure belonging to the
Pmm space group. It has been reported that SrTiO
3 crystals can plastically deform in temperature ranges from 78 K to 1050 K [
3,
4]. In addition, SrTiO
3 crystals can deform up to and over 10% if they deform at a slow strain rate of 10
−4 (s
−1) [
6,
7]. Recently, the deformation behavior and dislocation structure have been reported to be temperature dependent [
9]. In addition, Kondo et al. demonstrated using in-situ observation in transmission electron microscopy (TEM) that dislocation glide can take place in SrTiO
3 crystals even at room temperature [
10,
11]. Thus, SrTiO
3 crystals are believed to exhibit plasticity even at low temperatures due to mobility of dislocations belonging to the {110}<110> slip systems. However, there is still little known about any key factor providing the high dislocation mobility of SrTiO
3.
In the present study, SrTiO
3 single crystals grown from powders with varying
Sr/
Ti ratios were deformed at room temperature. This is believed to be due to the fact that a variety of point defects can be formed in SrTiO
3 crystals depending on the specific chemical composition and/or chemical environments around the crystals [
12,
13]. It is well known that point defects in a crystal can interact strongly with dislocations. In general, point defects act as barriers to dislocation motion and result in work hardening of materials followed by nucleation and growth of cracks, leading to brittle fracture. In fact, both Sr and O vacancies have been reported to be present around dislocations in SrTiO
3 [
14,
15,
16], forming a Cottrell atmosphere [
1]. However, the influence of point defects on the dislocation mobility in SrTiO
3 has not been examined.
2. Experimental
SrTiO
3 single crystals, grown by the Verneuil method from high purity SrTiO
3 powder (99.9 wt % and
Sr/
Ti = 1.002) and high purity SrCO
3 powder (99.99 wt %), were used for the present deformation experiments. Typically, Sr deficiency is induced during crystal growth of SrTiO
3 crystals due to the evaporation of Sr ahead of the solidification front [
17]. In addition, Sr vacancies are easily formed in SrTiO
3 because of the low formation energy [
12,
13]. For this reason, single crystals grown with a non-stoichiometric starting powder having excess Sr (
Sr/
Ti > 1) would result in fewer Sr vacancies in the resultant SrTiO
3 crystal. Thus, single crystals grown using starting powders with two composition ratios,
Sr/
Ti = 1.00 and
Sr/
Ti = 1.04, respectively, were selected to be used in this study. As the starting powder of
Sr/
Ti = 1.00, 1000.00 g of the high purity SrTiO
3 powder was employed as it was. On the other hand, a mixed powder of 1000.00 g high purity SrTiO
3 powder and 32.18 g high purity SrCO
3 powder was employed as the starting powder of
Sr/
Ti = 1.04. The growing of all single crystals was performed using a Verneuil furnace at Shinkosha Co., Ltd. (Yokohama, Japan). Here, we note that, considering the evaporation loss of Sr, excess Sr does not necessarily exist even in the crystals grown from the powder with
Sr/
Ti = 1.04. Meanwhile, it is difficult to display the real atomic ratios of
Sr/
Ti in the grown crystals because a slight change in the ratios is buried in a mass of Sr and Ti atoms. The grown crystals from
Sr/
Ti = 1.04 should have fewer Sr vacancies than those from
Sr/
Ti = 1.00.
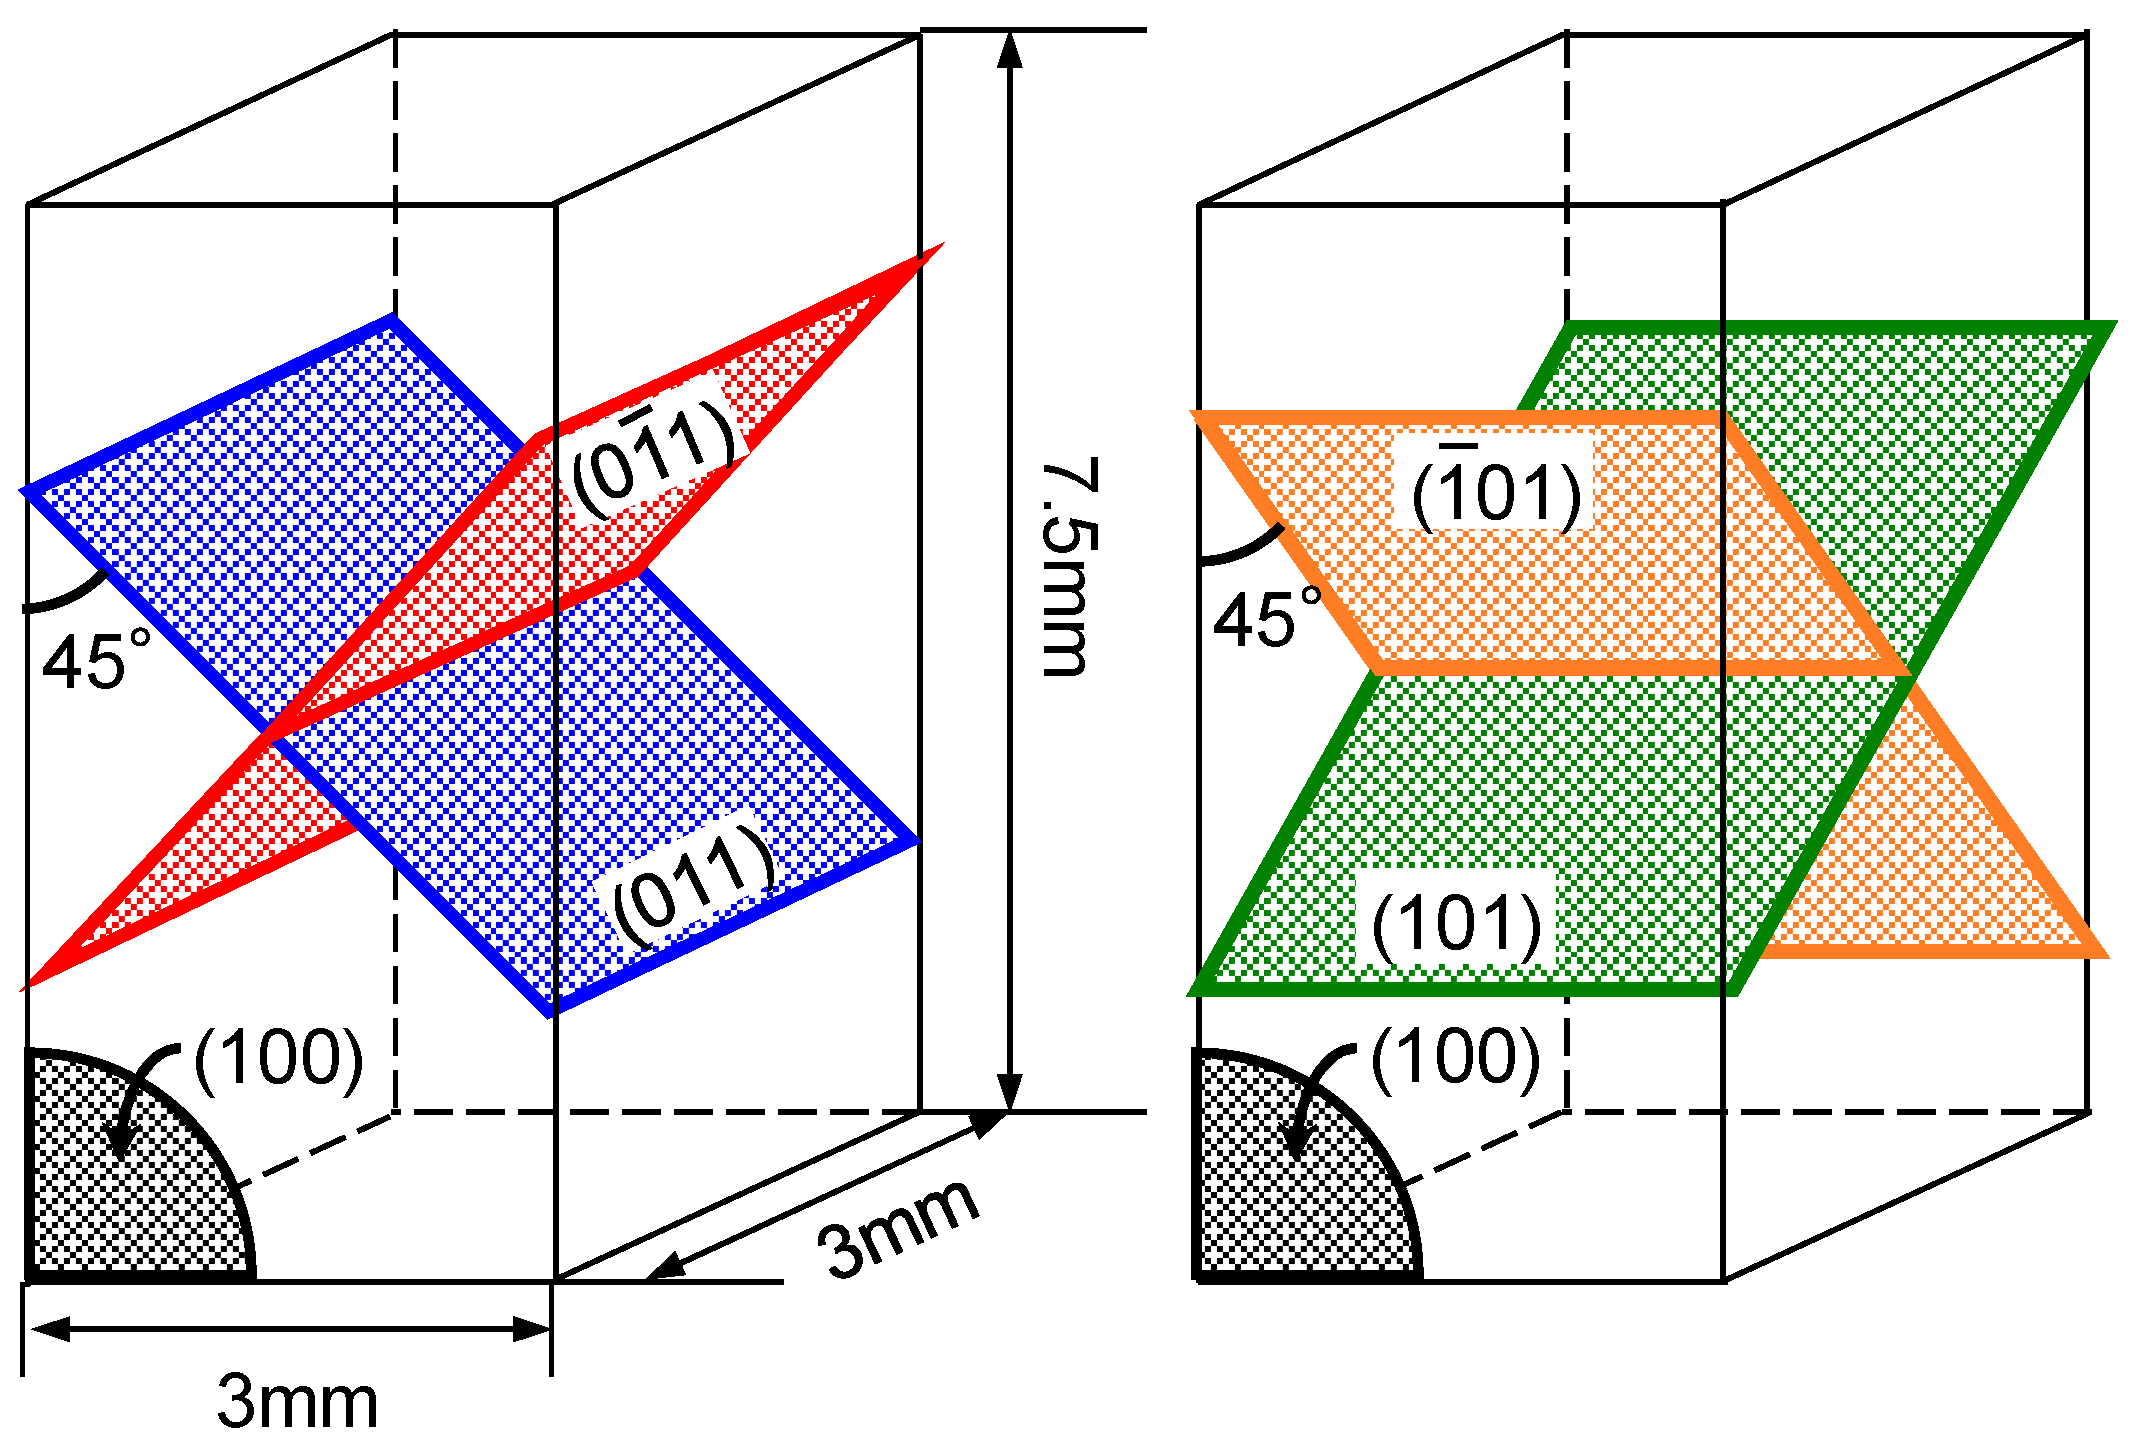
Figure 1 shows the shapes and crystallographic orientation of the specimens for deformation tests. Specimens were deformed by compression along [001] at strain rates of
= 1.0 × 10
−5 (s
−1) and
= 1.0 × 10
−1 (s
−1) in air at 297 K. Note that
= 1.0 × 10
−1 (s
−1) is a high strain rate because specimens must change their length by 10% every second. In the case of the deformation along [001], four equivalent slip systems ((011)[0
1], (0
1)[011], (101)[
01], and (
01)[101], respectively, which are illustrated in
Figure 1) are expected to be primary slip systems because they all have a Schmid factor equal to 0.5. During plastic deformation, the specimen’s length and shape were recorded using a high-speed optical camera in order to confirm slip lines formed on their polished surfaces. The deformed crystals were examined by TEM (Hitachi H-800, 200 kV) to identify the density and type of dislocations that were introduced during the plastic deformation. Thin foils for TEM observations were prepared by a standard technique. That is, the specimens for deformation were mechanically sliced and ground to a thickness of about 60 μm and then attached with a stainless steel single hole mesh for reinforcement. The center of the foils was milled by an Ar ion beam using an ion polishing system (Gatan PIPS II) to obtain electron transparency.
3. Results and Discussion
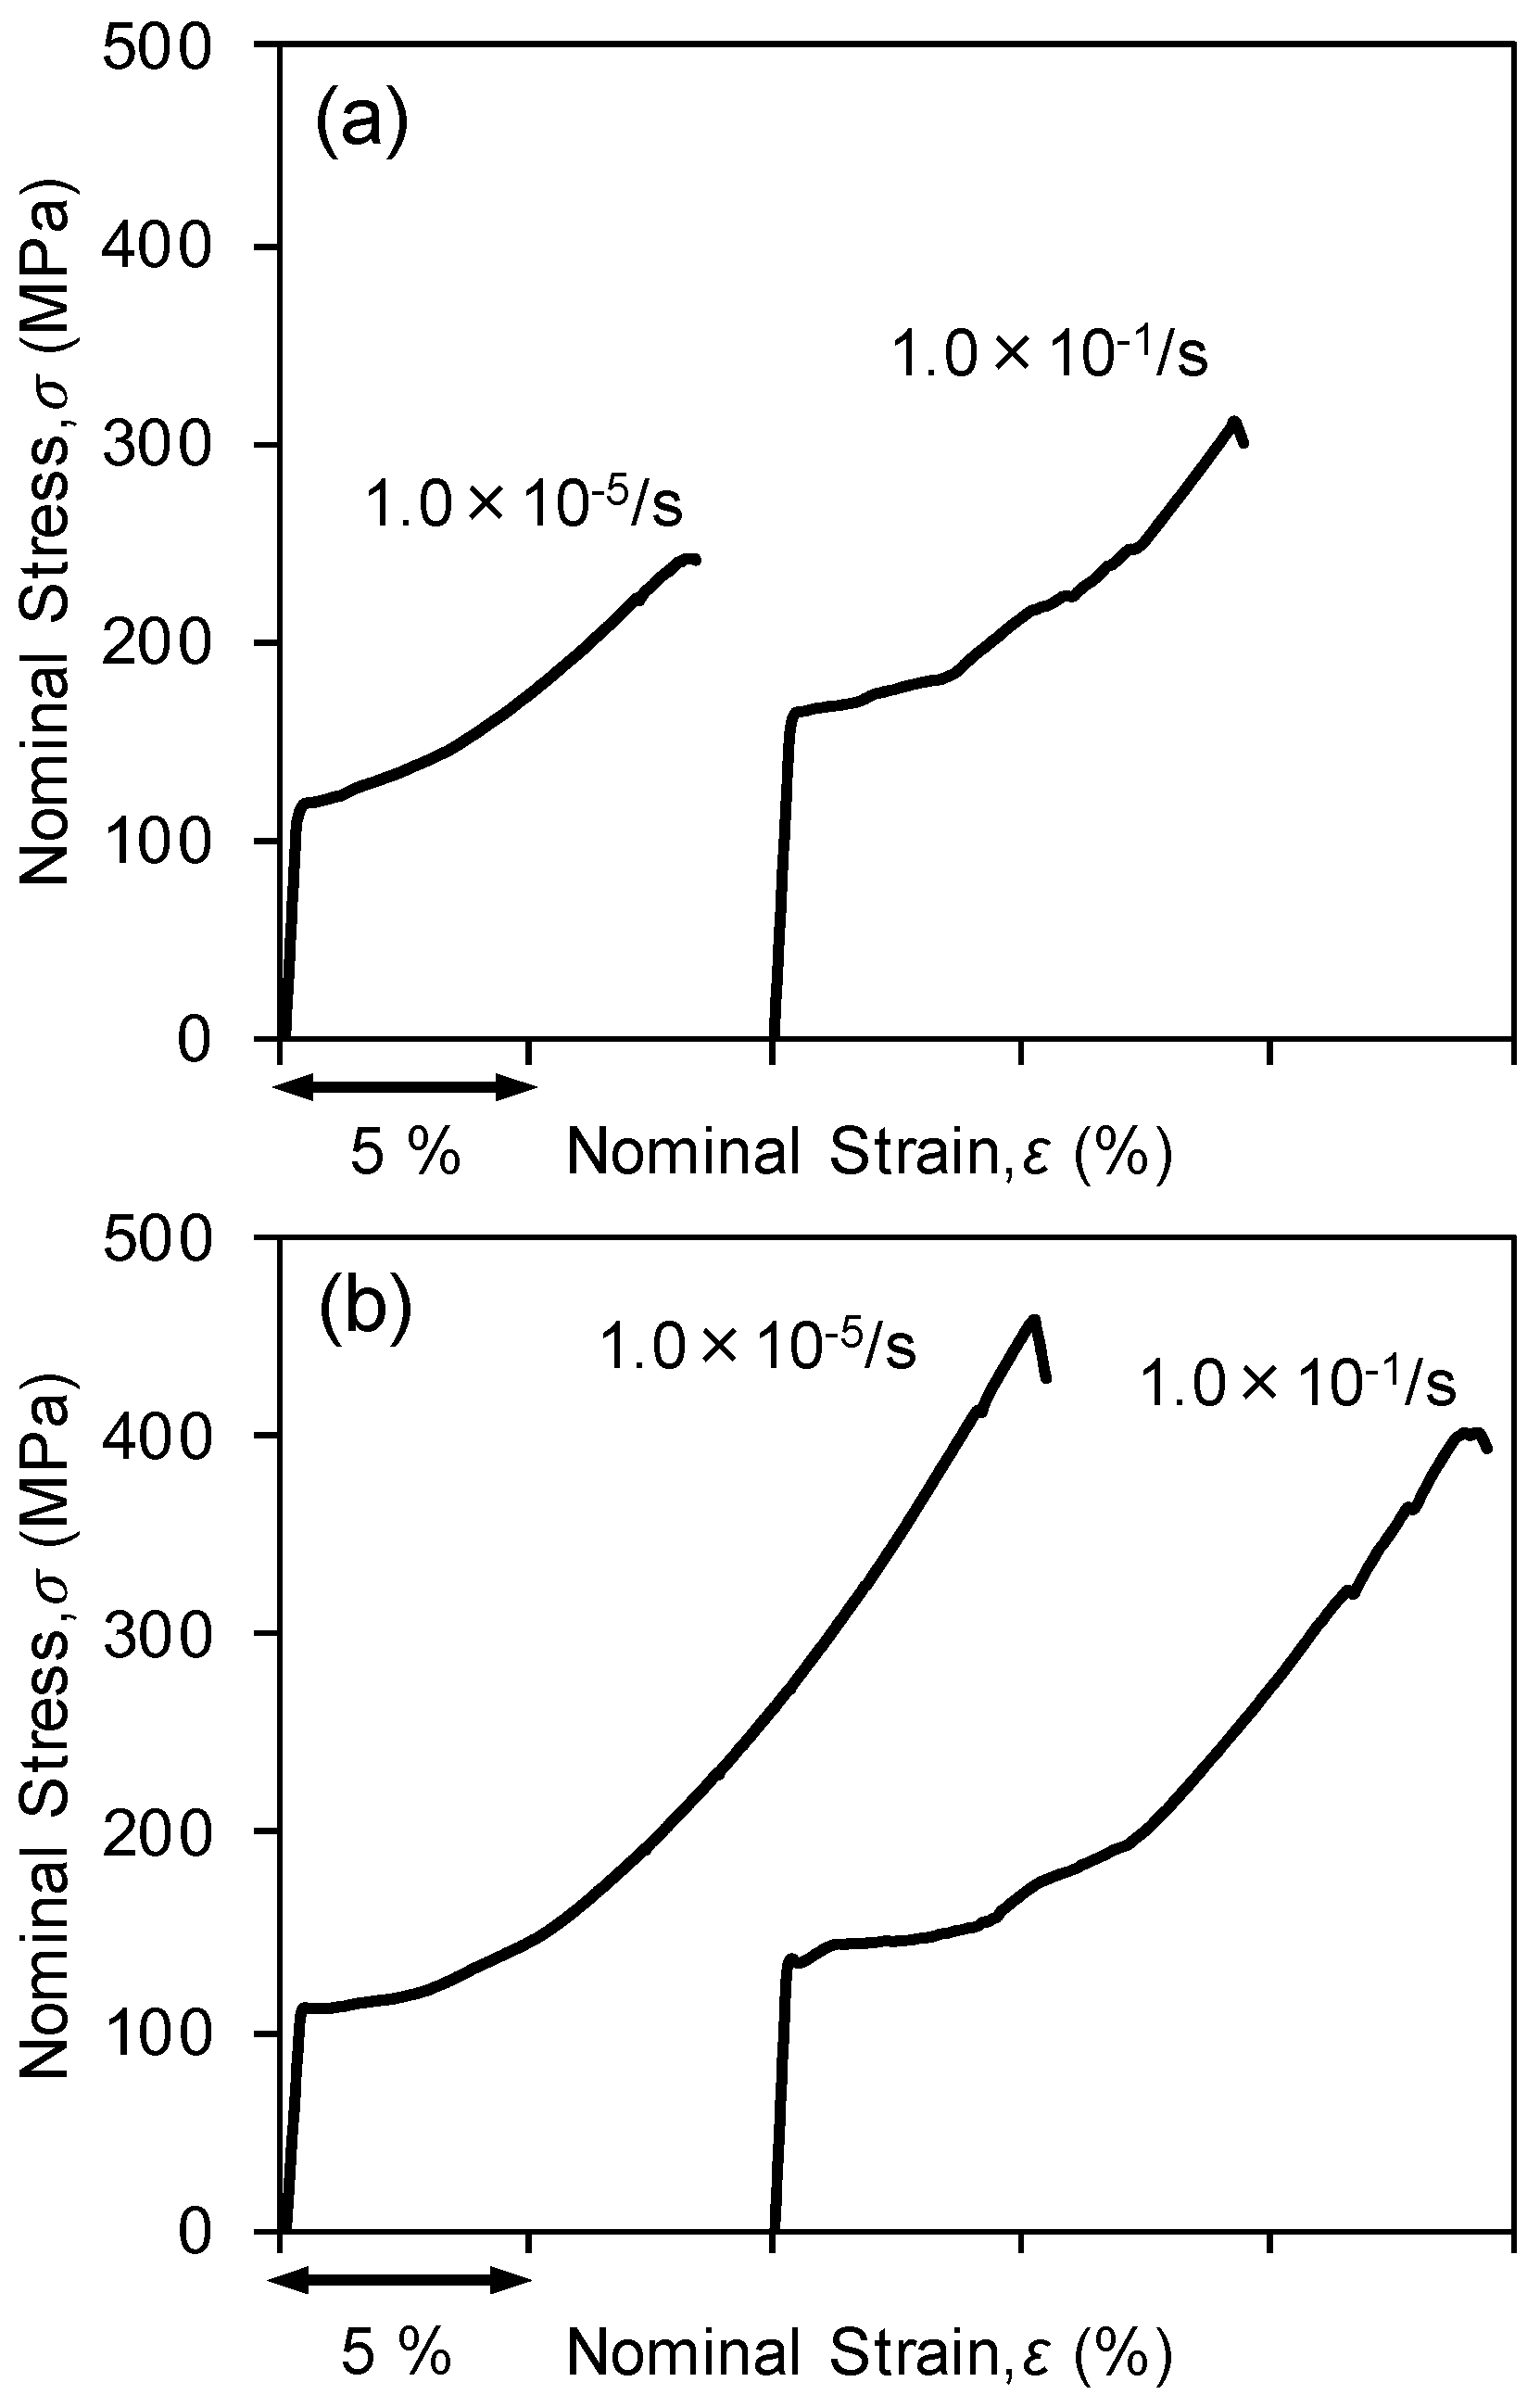
Figure 2a,b show the stress–strain curves that were obtained for the specimens with the two different chemical compositions of
Sr/
Ti = 1.00 (
Figure 2a) and
Sr/
Ti = 1.04 (
Figure 2b) as starting powders, respectively. It can be seen that stresses in all the curves gradually increase with increasing strain after yielding, and the deformed specimens give rise to brittle failure after a significant amount of work hardening. It was found that the
Sr/
Ti = 1.04 specimens exhibit lower yield and flow stresses as well as larger fracture strain, compared with the
Sr/
Ti = 1.00 specimens. The yield stresses, flow stresses (at a plastic strain of
= 3%), and fracture strains of each specimen are shown in
Table 1. As can be seen from the flow stresses at
= 3%, the stress for
Sr/
Ti = 1.04 at
= 1.0 × 10
−1 (s
−1) is higher by only 20% compared with the specimen deformed at
= 1.0 × 10
−5 (s
−1), in spite of the fact that the strain rate is 10
4 times higher. In contrast, the stress for
Sr/
Ti = 1.00 increases by 31% with respect to the higher strain rate. The fracture stresses for the
Sr/
Ti = 1.04 specimens are significantly higher than those for the
Sr/
Ti = 1.00 specimens.
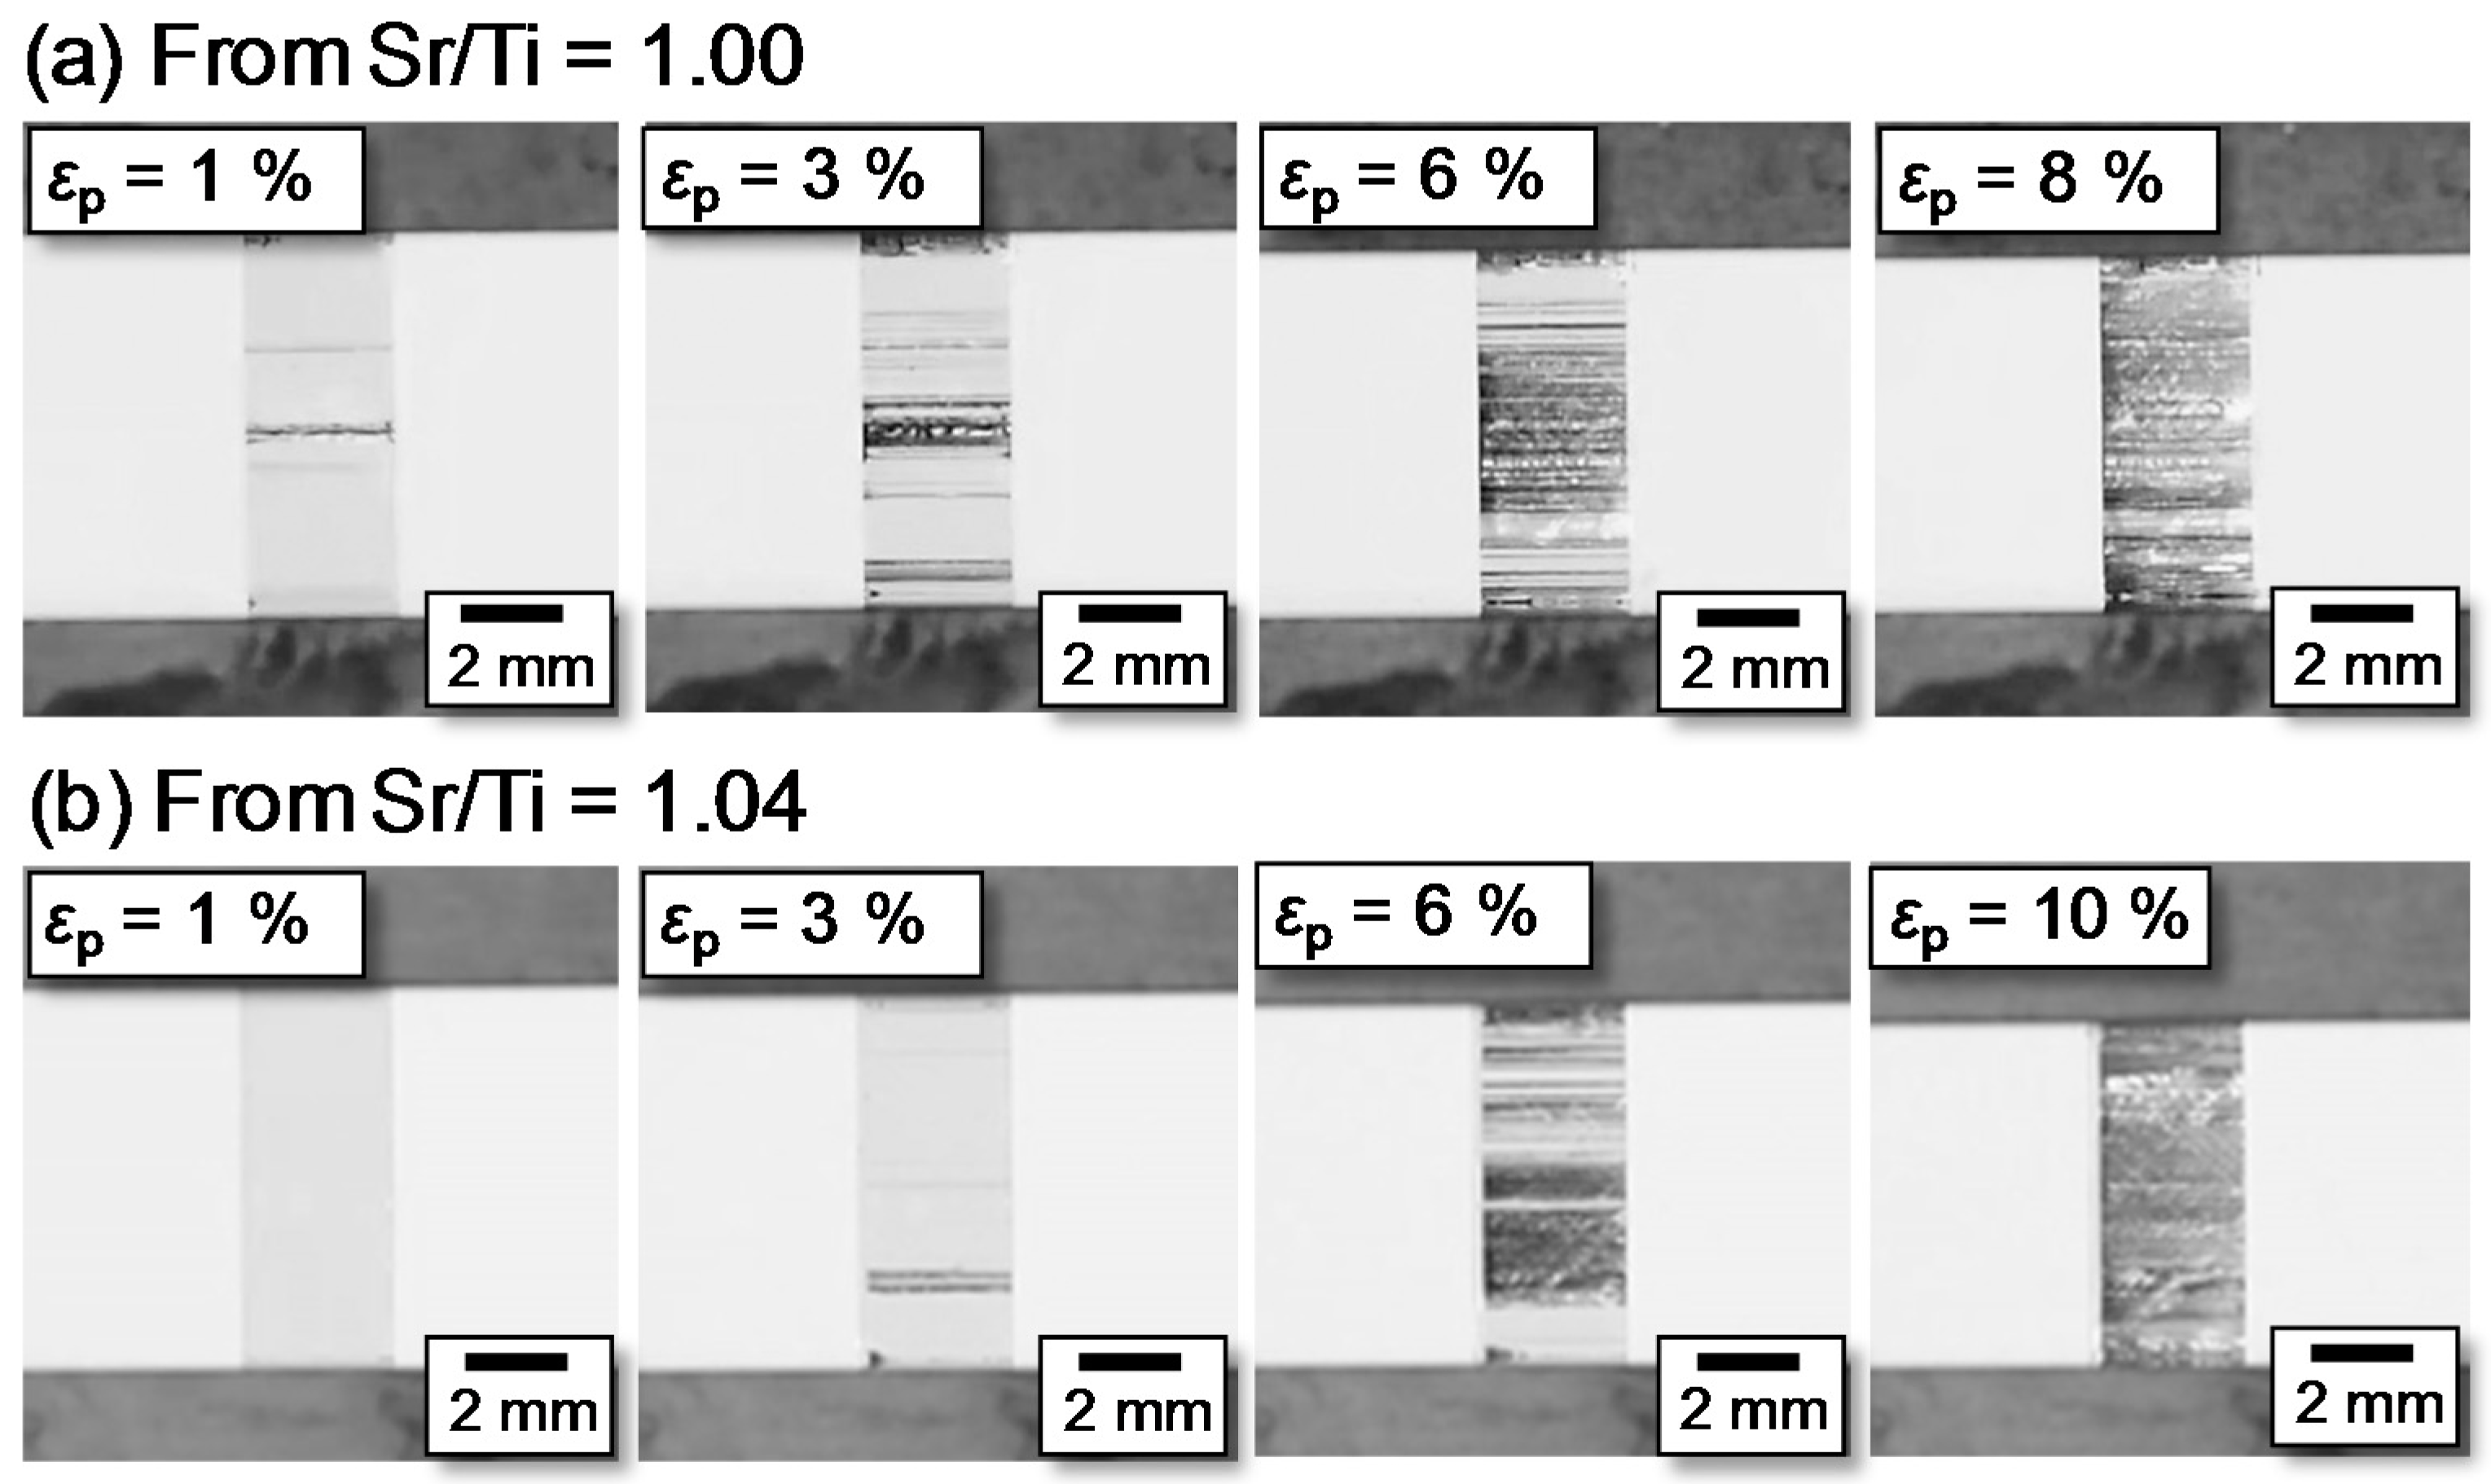
Figure 3a,b show shapes and surface morphologies of the
Sr/
Ti = 1.00 and
Sr/
Ti = 1.04 specimens deformed at
= 1.0 × 10
−1 (s
−1), respectively. In both specimen types, slip lines become evident at around
= 3% and continue to be generated until failure. Thus, it is evident that slip lines are formed even at the high strain rate of
= 1.0 × 10
−1 (s
−1), indicating prominent multiplication and glide motion of dislocations, although the
Sr/
Ti = 1.00 specimen fails at an earlier stage of deformation. These results are similar to those observed in ordinary single crystals deformed at a slower strain rate. It should be mentioned that the formed slip lines originate from two particular primary slip systems, namely, the two systems of (011)[0
1] and (0
1)[011] or the two systems of (101)[
01] and (
01)[101], although the Schmid factors for all four of the slip systems are equal. This means that either the two systems of (011)[0
1] and (0
1)[011] or the two systems of (101)[
01] and (
01)[101] are preferentially activated during plastic deformation. As a result, only the horizontal slip lines were observed on a side surface of deformed specimens, as shown in
Figure 3. This tendency is consistent with the previous reports [
6,
9] of plastic deformation of SrTiO
3 crystals.
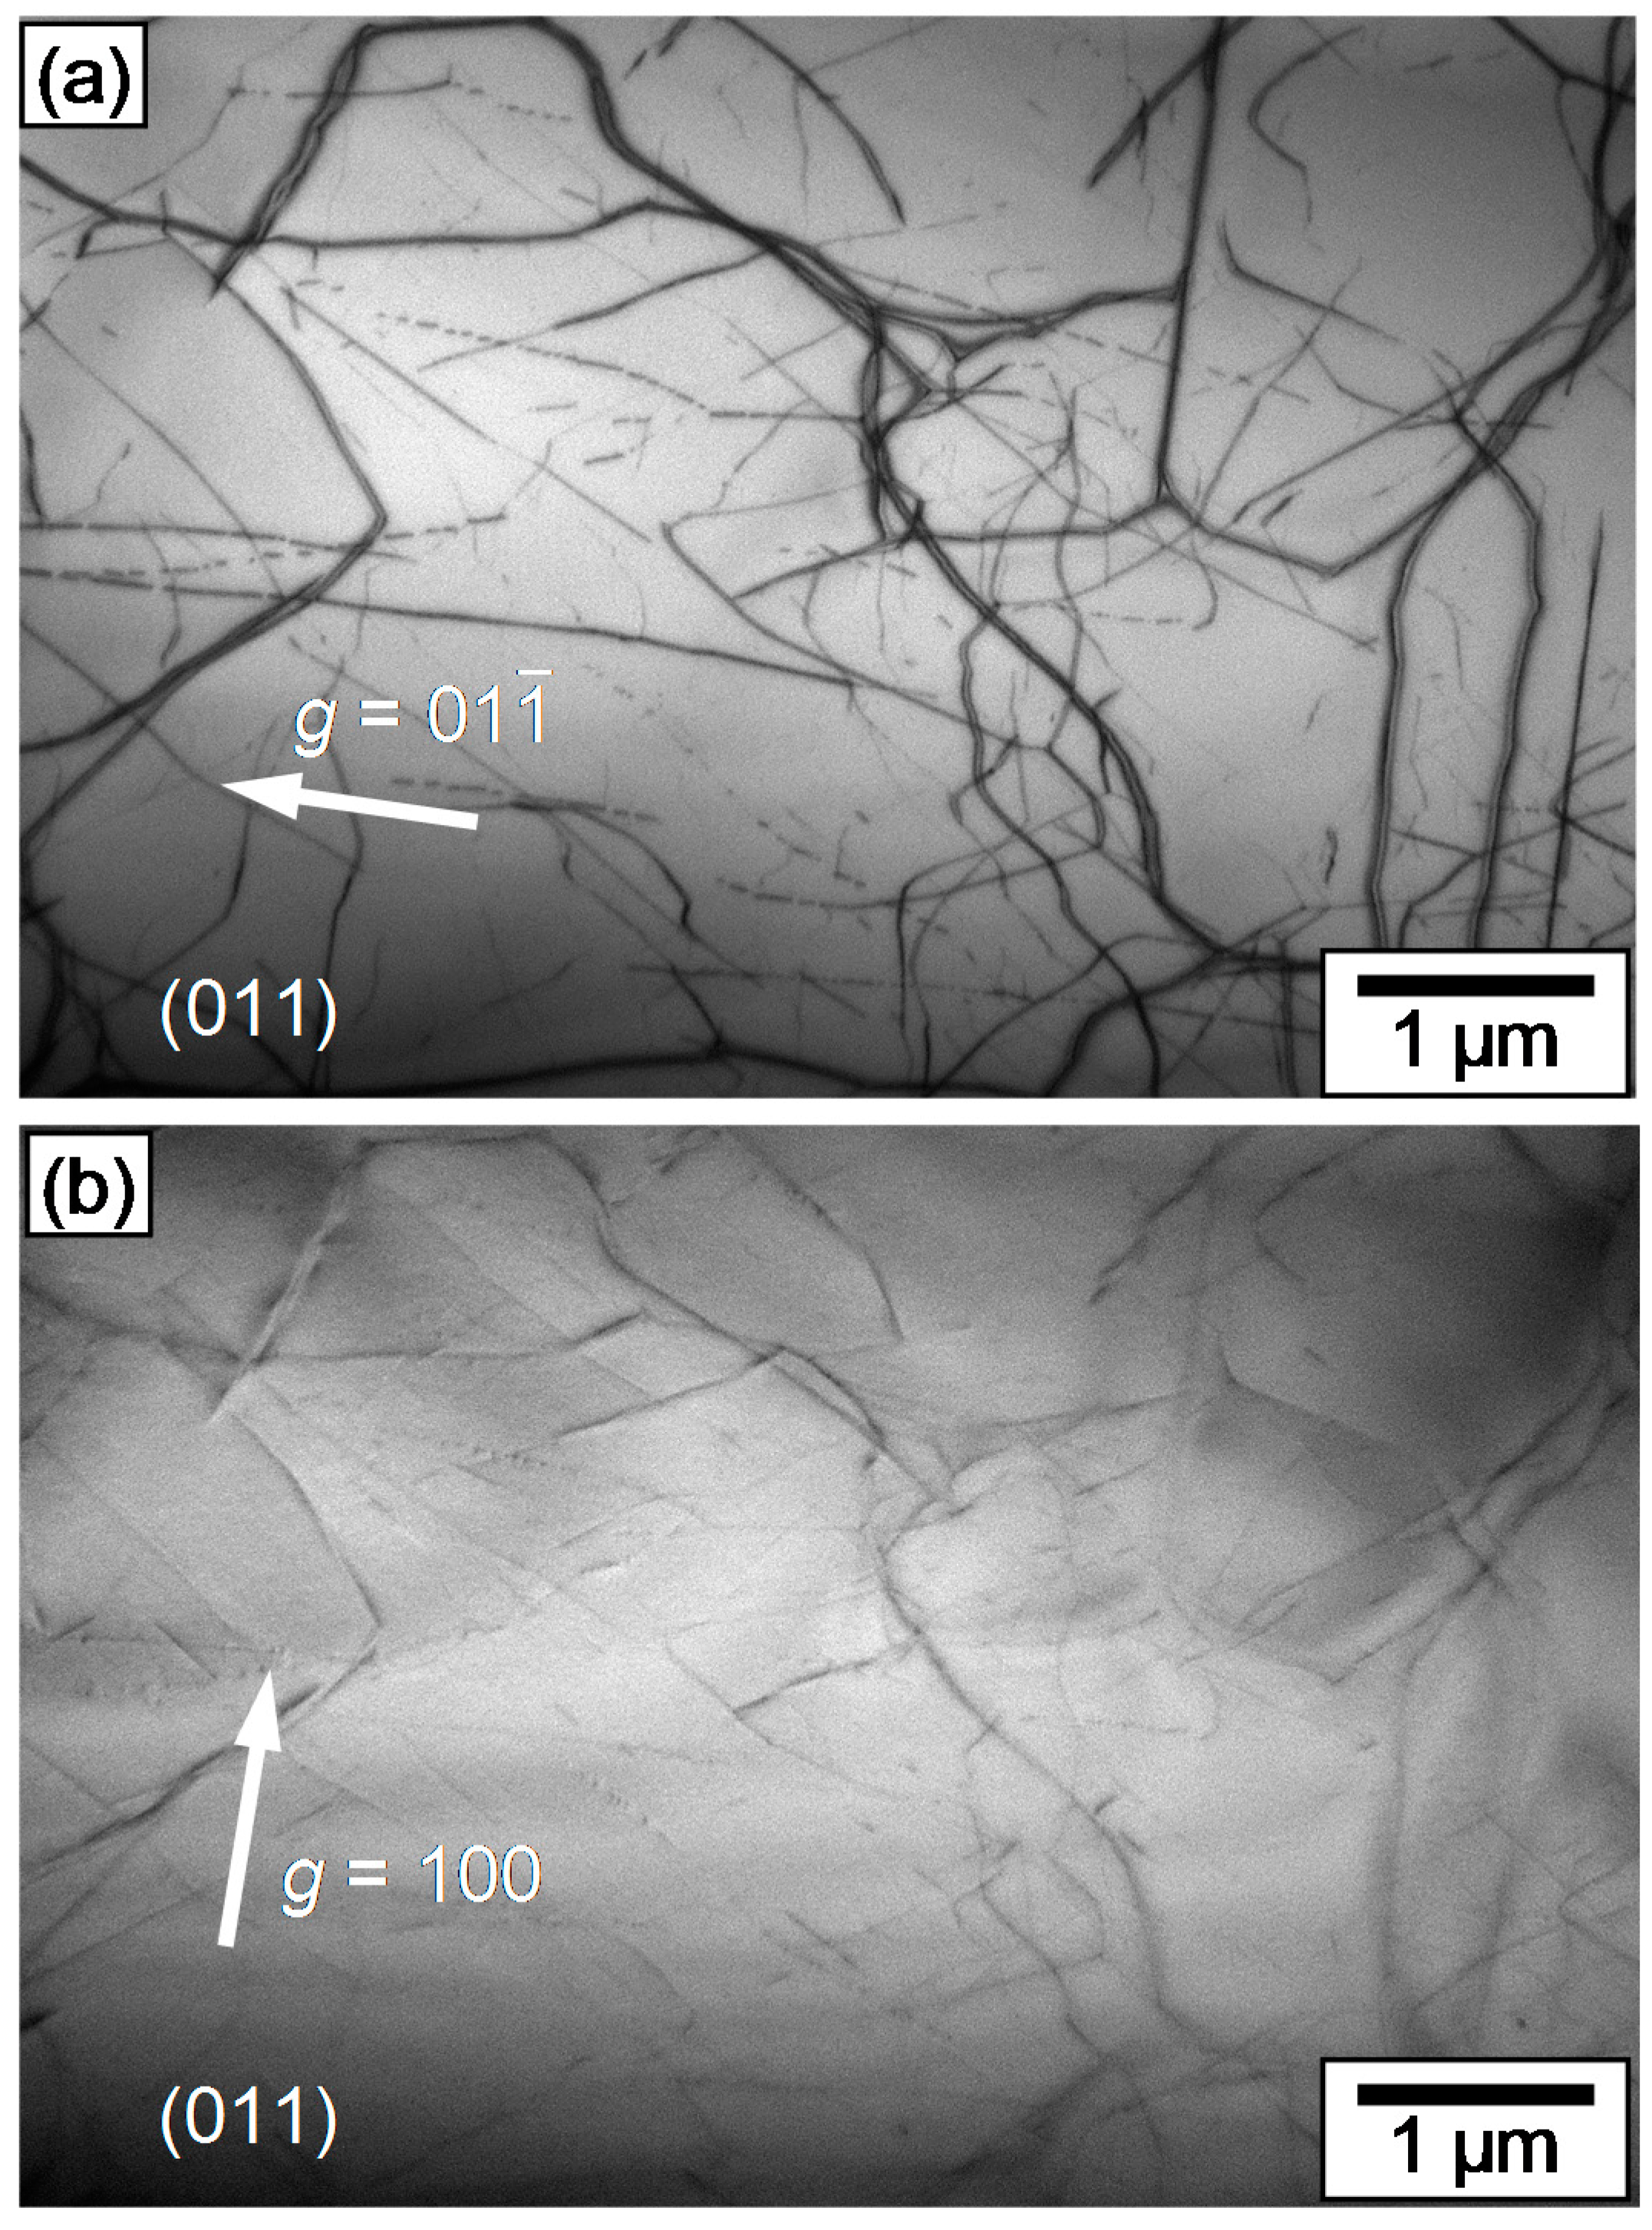
Figure 4a,b show typical TEM bright field images taken from a
Sr/
Ti = 1.04 specimen deformed at
= 1.0 × 10
−1 (s
−1) up to
= 3%. The incident beam direction is normal to the (011) primary slip plane, where the observed foil for TEM was prepared parallel to the slip lines formed by a primary slip system of (011)[0
1]. It can be seen that many dislocations are introduced by the deformation, and most of the dislocations are present parallel to the (011) primary slip plane. Since glide dislocations in SrTiO
3 have Burgers vectors of the 1/2<011> type, the Burgers vectors of the dislocations in deformed specimens should be ±1/2[0
1] according to activation of the (011)[0
1] slip system. The image in
Figure 4b is obtained from the same field as
Figure 4a by using a different diffraction vector of
g = 100. It can be seen that contrasts from almost all dislocations disappear under the diffraction vector of
g = 100. This is because the ±1/2[0
1] dislocations originating from the (011)[0
1] slip system should lose contrasts according to the
g·
b = 0 condition [
18]. Thus, the dislocation substructure formed by a deformation test is believed to be mainly formed due to the activation of a primary slip system.
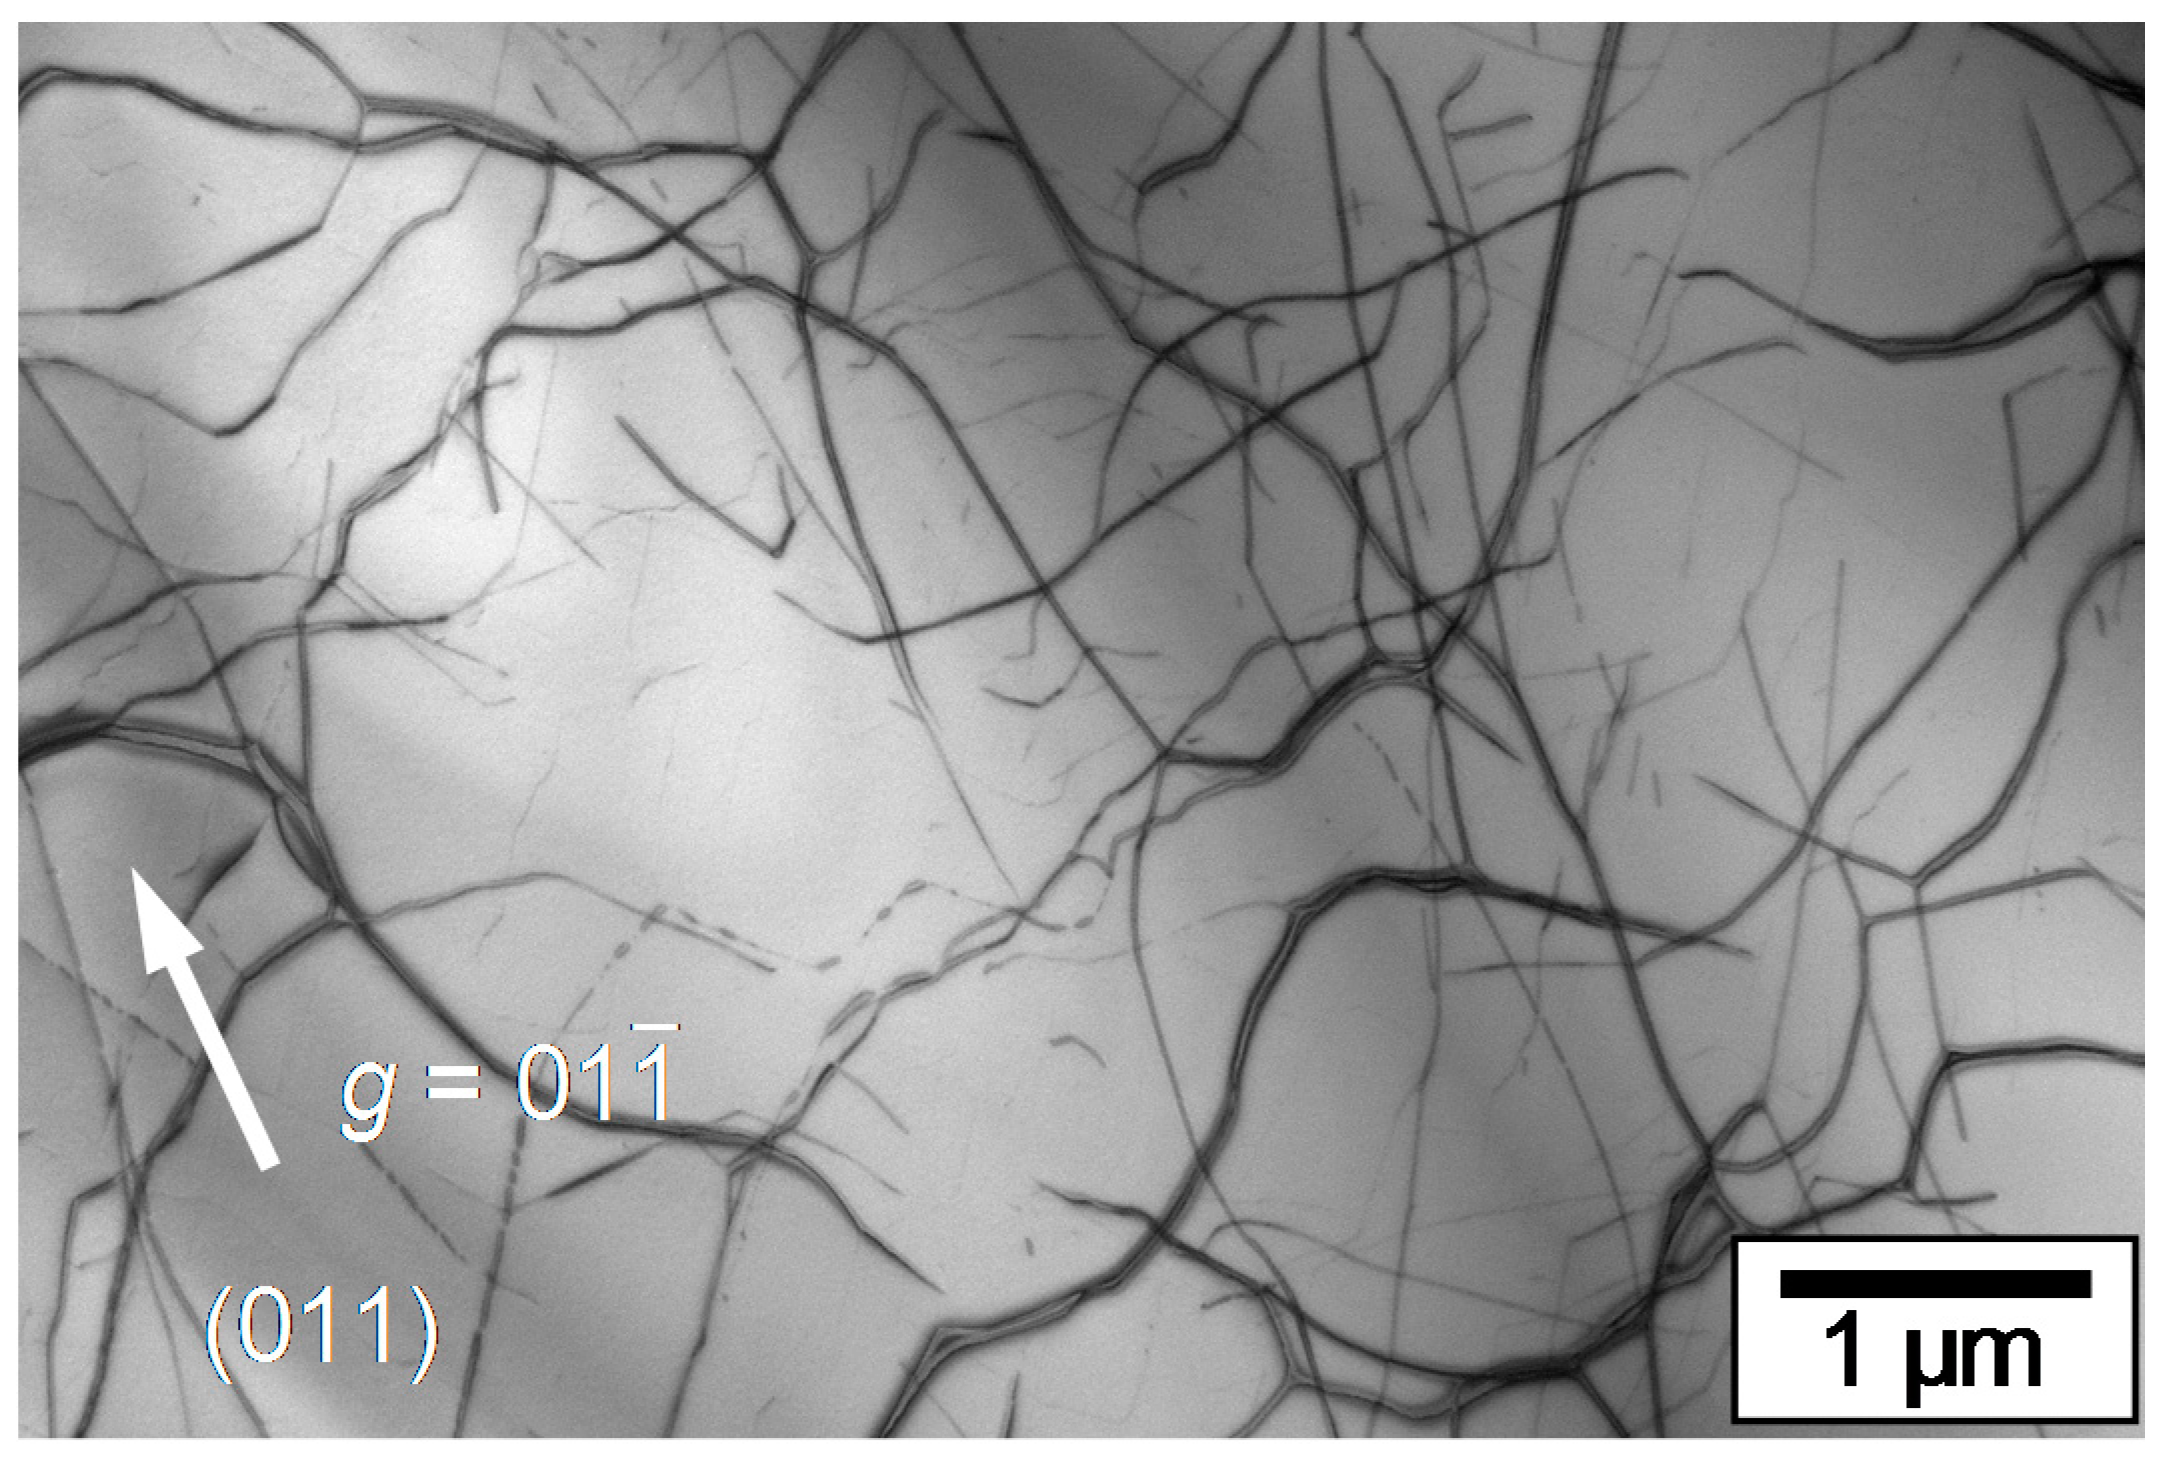
Figure 5 represents the dislocation substructure of a
Sr/
Ti = 1.04 specimen deformed at
= 1.0 × 10
−5 (s
−1), which is also observed normally to the (011) primary slip plane. It can be also seen from the images that the density and type of introduced dislocations are almost same as those in the specimen deformed at
= 1.0 × 10
−1 (s
−1). It should be noticed from comparison of the dislocation substructures that the density and type of introduced dislocations are very similar in spite of the great difference in the given strain rates. Additionally, dislocation densities of the specimens deformed up to
= 3% were about 1 × 10
13/m
2, estimated using the Keh method [
19] from the TEM images, regardless of given strain rates. The obtained dislocation densities are consistent with the values in earlier research [
9], where the densities of dislocations in the un-deformed specimen and the specimen deformed up to 1% plastic strain at 25 °C were reported to be 3.7 × 10
12/m
2 and 7.9 × 10
12/m
2, respectively. In fact, since the difference in flow stresses is not great, as can be seen from the stresses at
= 3% in
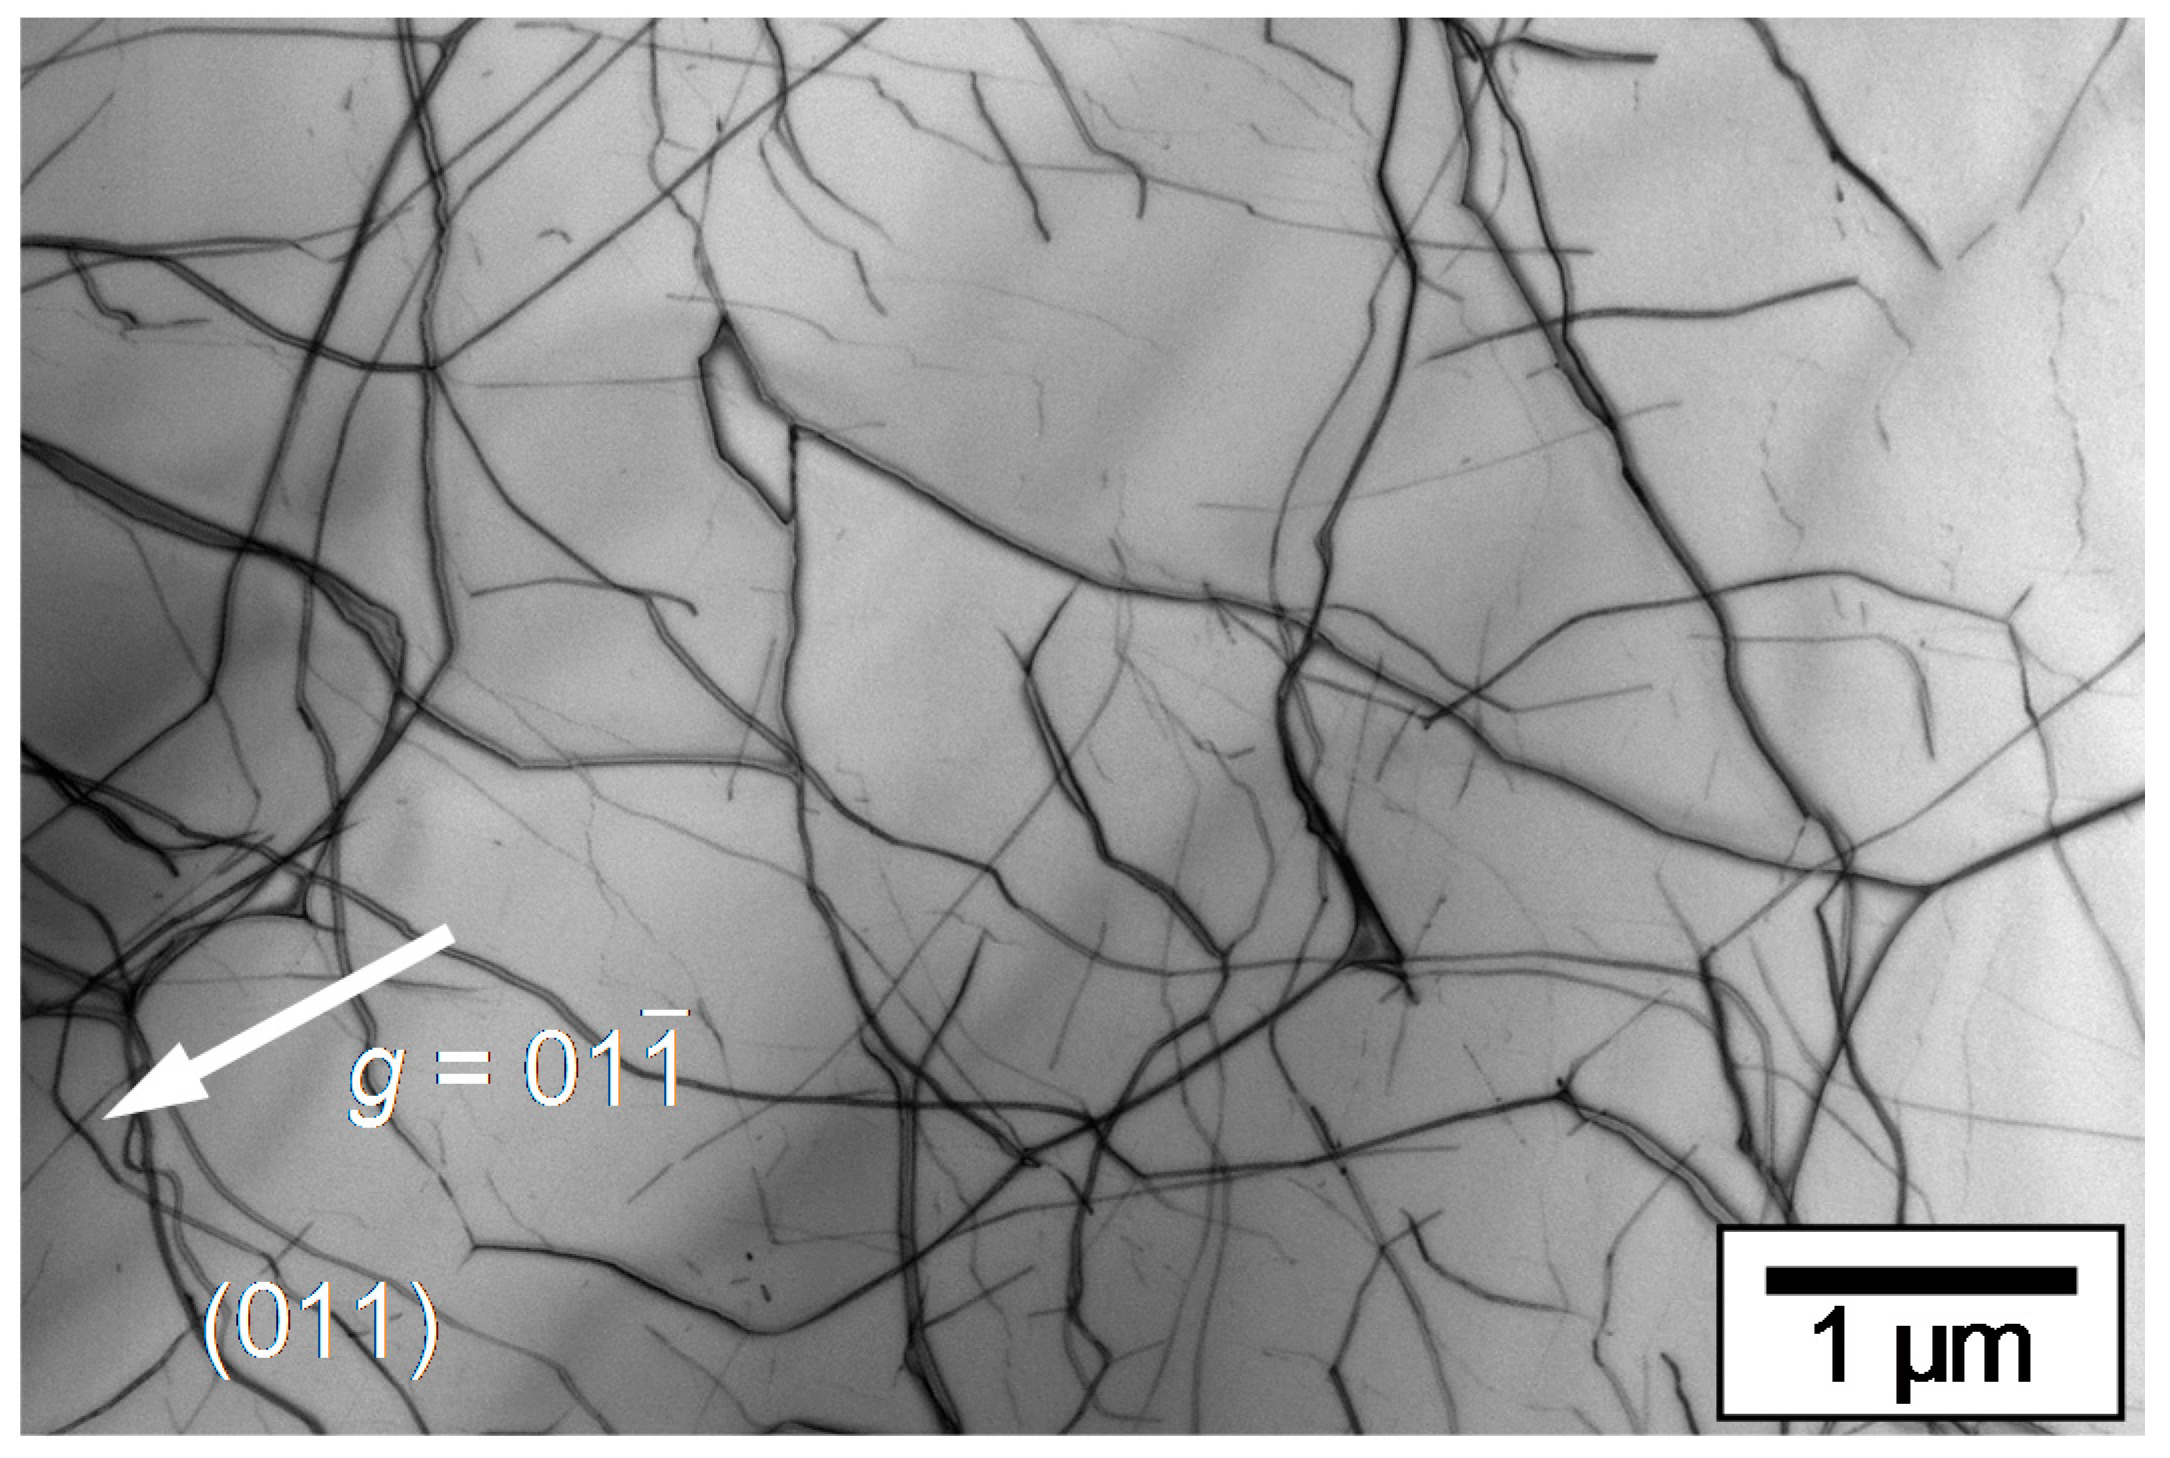
Table 1, then it would be reasonable to conclude that dislocation densities were almost independent of given strain rates. Meanwhile, the image in
Figure 6 shows the dislocation substructure of a
Sr/
Ti = 1.00 specimen deformed at
= 1.0 × 10
−5 (s
−1). The density and type of introduced dislocations are also similar, regardless of the difference in chemical compositions as starting powders. Consequently, it can be said that the ratio of
Sr/
Ti does not strongly affect the dislocation substructure.
From the above discussion, it has been shown that the yield and flow stresses become lower in the Sr/Ti = 1.04 specimens without changing the character of the dislocation substructures. The Sr/Ti = 1.00 specimens are believed to have more point defects, such as Sr vacancies and Ti anti-sites that substitute for Sr, since Sr deficiency should be induced through Sr evaporation during crystal growth. Conversely, it is plausible that the Sr/Ti = 1.04 specimens have a composition that is closer to the stoichiometric composition in a grown crystal. A more stoichiometric composition in the grown crystal will give rise to fewer point defects, resulting in less interaction with moving dislocations. This may be the reason why the Sr/Ti = 1.04 specimens exhibit lower yield and flow stresses.
It is interesting to note that strain-rate dependency of the deformation stress is small for both the
Sr/
Ti = 1.00 and
Sr/
Ti = 1.04 specimens, although the degree is more prominent in the case of
Sr/
Ti = 1.04. In order to evaluate the strain-rate dependency with respect to dislocation velocity in these specimens, an analysis will be done based on the Orowan relationship [
1],
where
is the shear strain rate,
is the density of mobile dislocations,
b is the magnitude of the Burgers vector of the mobile dislocations, and
is the average motion speed of the mobile dislocations. In addition, the relation between
and deformation stress is given by
where
is the shear stress and
m is the stress exponent [
20,
21]. As can be seen from TEM images at
= 3% in
Figure 4 and
Figure 5, the dislocation densities of deformed specimens are similar even after increasing the strain rate by a factor of 10
4. Here, we note that dislocations that are observable in the TEM include both mobile and immobile dislocations, and most of the observable dislocations in some cases can be immobile [
22]. Accordingly, the densities of mobile dislocations in deforming specimens are still unknown. First of all, we assume that the density of mobile dislocations should be independent of the strain rate as the dislocation substructures introduced by the deformation tests are very similar in spite of great difference in the given strain rates. In this assumption, the dislocation velocity of the mobile dislocations—
in Equation (1)—must increase by a factor of 10
4 in the case of the high strain rate of
= 1.0 × 10
−1 (s
−1) since the strain rate,
, should be proportional to the dislocation velocity,
. Moreover, since the flow stresses at
= 3% have been determined (see
Figure 1 and
Table 1) for both cases of
= 1.0 × 10
−5 (s
−1) and
= 1.0 × 10
−1 (s
−1), the stress exponent
m for SrTiO
3 crystals with a particular chemical composition can be estimated by using Equation (2). The values of
m in this assumption are calculated to be 35 and 49 for the
Sr/
Ti = 1.00 and
Sr/
Ti = 1.04 specimens, respectively. Next, we assume that the density of mobile dislocations depends on the strain rate. Two hypotheses were considered: (i) there are ten times as many mobile dislocations, and (ii) there are one-tenth as many mobile dislocations in the case of the high strain rate of 1.0 × 10
−1 (s
−1). Even in these hypothetical situations, the value of
m can be estimated by using Equations (1) and (2). The values of
m derived from (i) i.e., the hypothesis of ten times as many mobile dislocations, can be calculated to be 26 and 37 for the
Sr/
Ti = 1.00 and
Sr/
Ti = 1.04 specimens, respectively. Meanwhile, the values of
m derived from (ii) i.e., the hypothesis of one-tenth as many mobile dislocations can be calculated to be 43 and 62 for the
Sr/
Ti = 1.00 and
Sr/
Ti = 1.04 specimens, respectively. Although the
m in Equation (2) mainly depends on deformation flow stresses, the obtained values of
m still have a dependency on the densities of mobile dislocations for each of the strain rates. Nevertheless, it is worth pointing out the fact that the stress exponent
m for most crystalline materials, including metals, is less than 10 [
21]. The
m for SrTiO
3 would have definitely high values although there is still room for argument about the densities of mobile dislocations. Regardless, it can be said that the dislocation dynamics in SrTiO
3 single crystals are remarkable and interesting. We note that a higher value of stress exponent corresponds to smaller strain-rate dependency of deformation flow stresses. In addition, it can be seen from Equation (2) that a larger value of the stress exponent,
m, results in a higher value of the dislocation velocity of the mobile dislocations,
, for the same stress level,
. That is, the dislocations in the
Sr/
Ti = 1.04 specimens would have higher mobility as compared with the dislocations in the
Sr/
Ti = 1.00 specimens. This is believed to be due to fewer point defects for a SrTiO
3 crystal made from a starting powder with
Sr/
Ti = 1.04.
Finally, the larger fracture stresses for crystals made from a starting powder with
Sr/
Ti = 1.04 will be considered. As seen from
Figure 2, fracture stresses for the
Sr/
Ti = 1.04 specimens are significantly larger than those for the
Sr/
Ti = 1.00 specimens. As mentioned previously, the mobility of dislocations for the
Sr/
Ti = 1.04 specimens is significantly higher than that for the
Sr/
Ti = 1.00 specimens. The higher dislocation mobility can reduce stress concentrations during plastic deforming since the dislocations can accommodate the applied stress. The larger fracture stresses for the
Sr/
Ti = 1.04 specimens would arise from the higher dislocation mobility. In contrast, the
Sr/
Ti = 1.00 specimens fail at lower stresses. This can be explained by the relatively lower dislocation mobility, which has a potential to induce higher stress concentrations during plastic deformation.


 ,
, 

