
Stuck in Our Teeth? Crystal Structure of a New Copper Amalgam, Cu3Hg

Department Chemie, LMU München, Butenandtstraße 5-13(D), D-81377 München, Germany
*
Author to whom correspondence should be addressed.
Crystals 2017, 7(12), 352; https://doi.org/10.3390/cryst7120352
Submission received: 23 October 2017
/
Revised: 20 November 2017
/
Accepted: 22 November 2017
/
Published: 24 November 2017
(This article belongs to the Special Issue Crystal Chemistry of Zinc, Cadmium and Mercury)
Abstract
:We have synthesized a new Cu amalgam, the Cu-rich phase CuHg. It crystallizes with the NiSn structure type with a hexagonal unit cell (space group P6/mmc , a = 5.408(4) Å, c = 4.390(3) Å) and shows some mixed occupancy of Cu on the Hg site, resulting in a refined composition of CuHg. This is the first example of an amalgam with the NiSn structure type where Hg is located mainly on the Sn site. CuHg might be one of the phases constituting dental amalgams and therefore has major relevance, as well as the only Cu amalgam phase described so far, CuHg with the -brass structure. It occurs as a biphase in our samples. Thermal decomposition of Cu amalgam samples in a dynamic vacuum yields nanostructured copper networks, possibly suitable for catalytic applications.
1. Introduction
Modern dental amalgams consist of Hg, Ag, Sn, Cu and minor metallic additives. In order to prepare a typical amalgam filling, liquid mercury is mixed with powders or shavings of an alloy containing Ag, Sn and Cu in the suitable composition: 40–70 weight % Ag, 12–30% Sn and 12–24% Cu. Additives can be Zn, In or Pd up to ca. 4% [1,2,3]. The alloy is mixed with an equal weight amount of Hg to form the plastic amalgam, solidifying within minutes to hours. The solidification goes along with the formation of a number of intermetallic phases. The most important in the resulting metal matrix composite are AgHg [4] as the major matrix phase, AgSn [4,5] as the mechanically strongest phase, SnHg [6] as the most corrosive phase, AgSn [7], CuSn and CuSn [8,9,10], amongst others [11,12]. The 2-phase SnHg is posing a major problem as it is relatively corrosive and leads to degradation of the filling over the years, especially at the tooth-amalgam interface. Today, so-called 2-free amalgams are in use, which are higher in Cu content [13,14]. As the reaction takes place at physiological temperatures, the resulting alloy may not be a thermodynamically stable system. Other combinations of the metal atoms may also be considered: Cu amalgams and Ag-Cu solid solutions, as well as ternary and quaternary phases may also come into play at equilibrium conditions.
First reports on the employment of amalgams in dental fillings date back to 659 during the Tang dynasty in ancient China [15]; in European medical history, the first evidence of amalgam fillings adopting the Chinese recipe dates back to the end of the 16th century [16]. Despite the slow, but constant replacement of amalgams by other dental filling materials [17], many people still rely on amalgam fillings as they are resistive for a very long time, and the mechanical removal of existing amalgam fillings harbors the risk of unnecessary Hg release. With respect to the vast employment of dental amalgams, it is very surprising that new binary Cu-Hg phases can be found. It becomes even close to improbable when taking into account that both mercury and copper have been important materials since prehistoric times: the combination of both is employed, e.g., in the centuries-old fire gilding process where a copper surface is amalgamated by submerging in a Hg nitrate solution prior to applying gold amalgam and subsequent distillation of the Hg. Despite the widespread and longtime preparation of Cu-Hg phases, knowledge hereon is scarce. The published phase diagram [18] shows only one phase, CuHg, and even for this phase, there exist concurring structure descriptions, some of them expressing reasonable doubt about the others [19,20,21,22]. Details on the behavior of the liquidus curve or thermodynamic stability ranges also remain unclear.
The problem with identifying amalgam phases often lies in their low thermal stability. As Hg has a very low melting point, the liquidus curve in most phase diagrams shows a steep run in the Hg-rich region, and the Hg-richest phases normally show low peritectic decomposition temperatures (see Table 1). Standard solid state preparation techniques usually are not suitable to prepare those delicate phases. Thermoanalytical methods can show the presence of low-decomposing phases; however, if accompanying structural elucidations are impeded, their exact compositions remain unclear. In addition, thermoanalytical studies can be hampered by kinetic effects, which are much more pronounced at low than at high temperatures (seed formation, phase transformations and the like). Problems with structural analyses of crystalline amalgams with high Hg content are caused by their high X-ray absorption coefficients. A special case is given for the widely-employed Au amalgams, which show an especially inconvenient combination of high absorption and especially low X-ray contrast, leading to only very few structurally-sufficiently described phases and a rudimentary phase diagram [18].
It now becomes clear that with all the named complications, a number of new amalgams can be expected to be found even in systems that have been employed technically for a very long time. Both synthesis and structural analysis require non-standard techniques and diligence.
2. Results
Single crystals of CuHg were found together with crystals of CuHg on the surface of an amalgamated copper spoon after 12 days at 90 C. Both phases form crystals of bronze color when Hg-free and of bright silver luster when a thin film of Hg covers the surface. CuHg forms prismatic crystals, whereas CuHg forms platelets. Both amalgams are air-stable at room temperature at least over several weeks. A rod-shaped crystal of CuHg was selected under a binocular and glued on top of a glass fiber. Data were carefully corrected for considerable absorption effects on the basis of indexed crystal faces. Metric and extinction conditions pointed towards the NiSn structure type (space group P6/mmc), and structure solution and refinement showed this to be correct. Crystallographic details and results of the single-crystal structure refinement are compiled in Table 2, Table 3, Table 4 and Table 5.
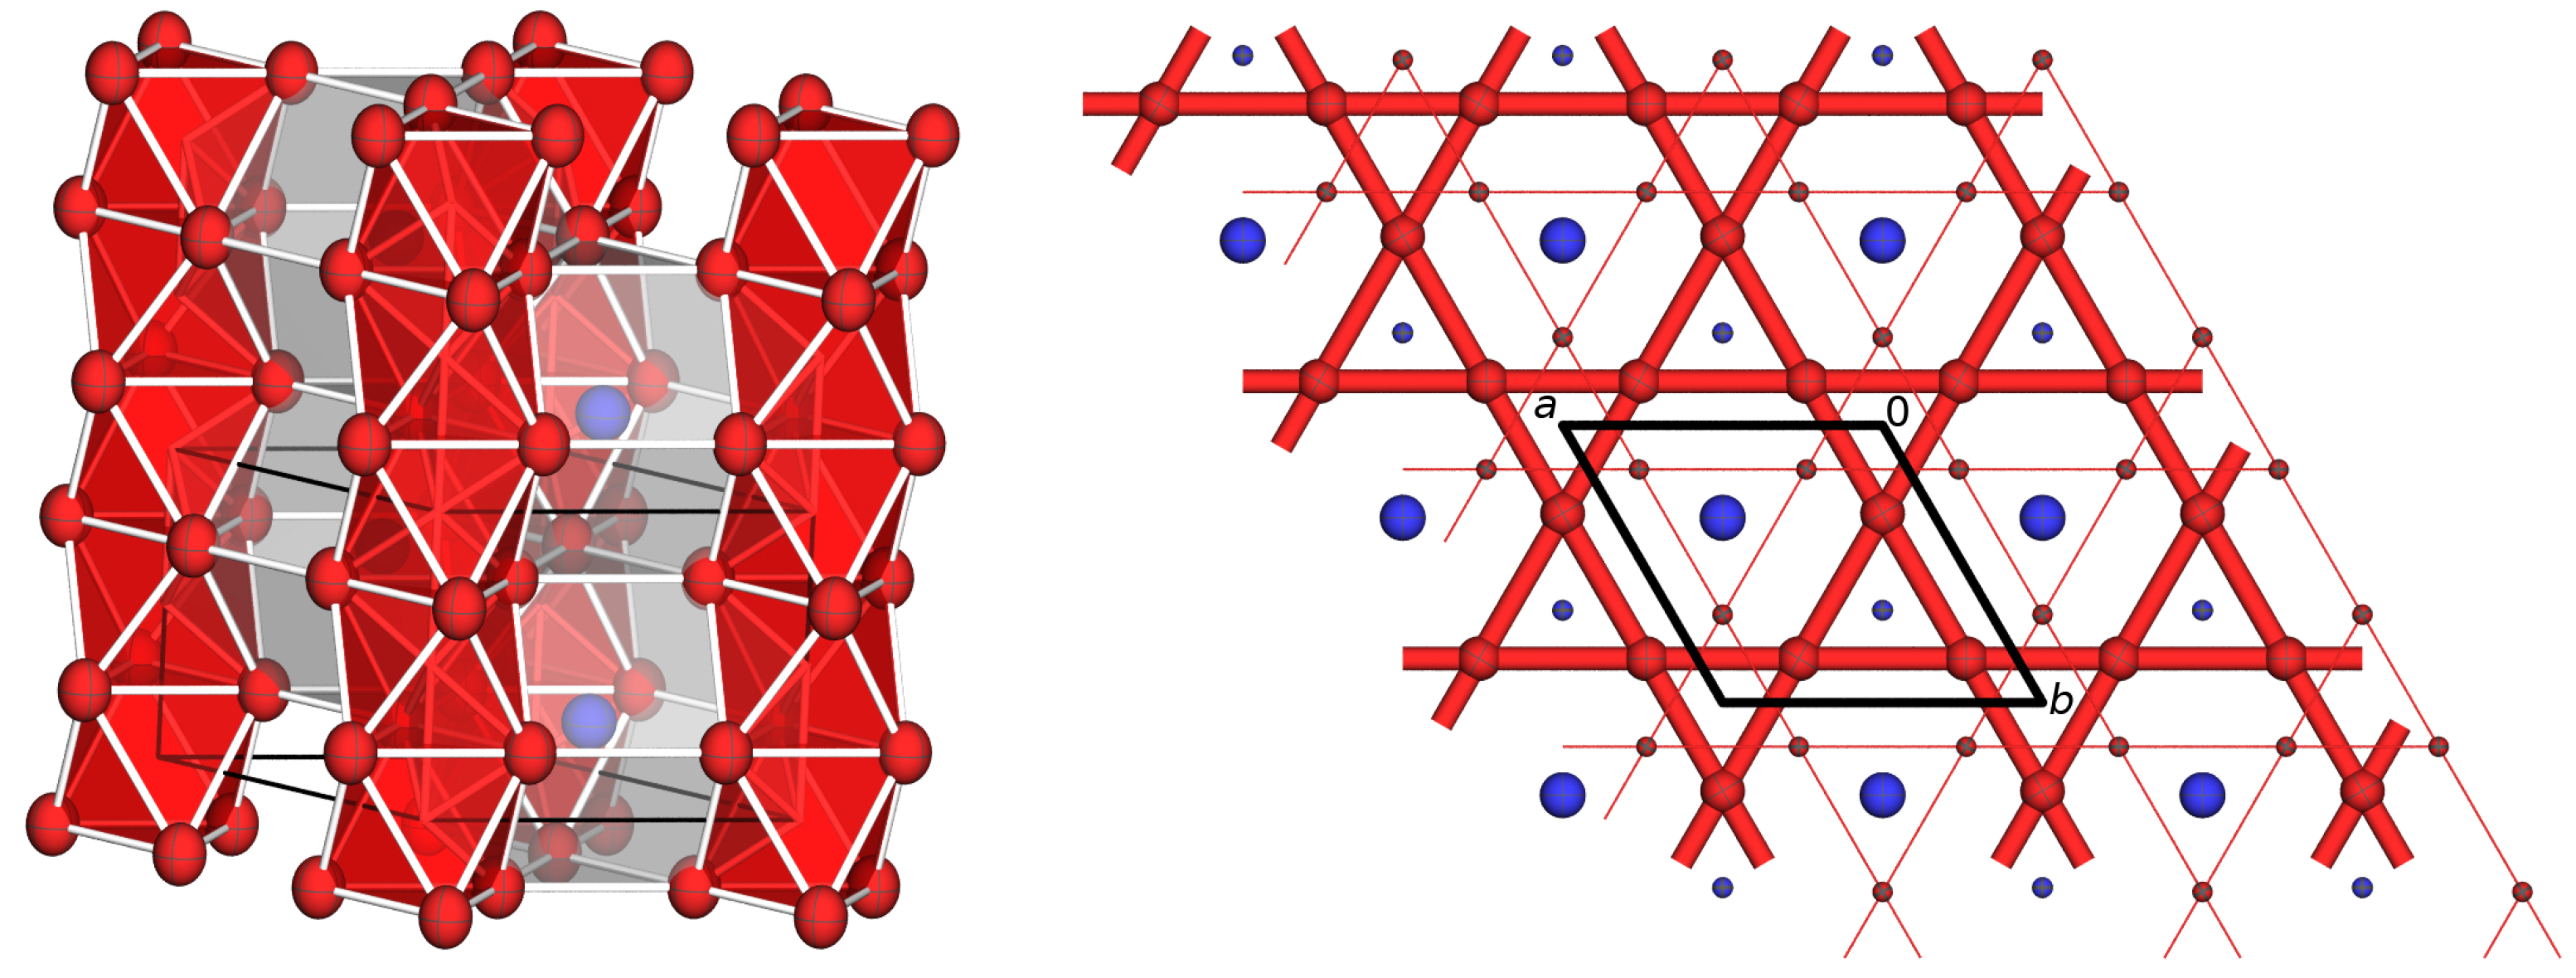
CuHg crystallizes with the NiSn structure type. The lattice parameter a of the NiSn structure type is doubled with respect to simple hcp by creating two crystallographic sites with non-equal Wyckoff numbers for Sn (Hg) on 2d and Ni (Cu) on 6h while retaining the original space group type P6/mmc. This shows the NiSn structure type to be a coloring variant of hcp as the hcp topology is retained in an ordered packing of two different spheres. By the coloring, Hg atoms are only coordinated by 12 Cu atoms forming [HgCu] anticuboctahedra. Cu atoms form streaks of trans-face-sharing [Cu] octahedra (see Figure 1). In an alternative picture, the crystal structure can be visualized with plane hexagonal nets at heights z = 1/4 and 3/4, which are stacked along c with ...ABAB... periodicity, where A and B are shifted by (1/3, 2/3, 1/2) with respect to each other.
During structure refinement, unusual residual electron densities and weight factors pointed towards possible mixed occupation on the two crystallographic sites. This was tested by independently refining mixed occupations with retaining an overall full occupation of the two sites. The Cu2 site on 6h shows no sign of mixed occupation by Hg, whereas there is significant Cu content on the Hg/Cu1 site on 2d (see Table 3). Refinement of the mixed occupation according to the denotation Cu(HgCu) leads to x = 0.11(4) and the overall refined composition CuHg.
Figure 2 shows a crystal of CuHg under an optical microscope (left) and the specimen used for X-ray data collection after EDX measurements (right). The severe degradation of CuHg in an electron beam under high vacuum becomes evident. The sensitivity of the amalgam towards decomposition in a vacuum hampers detailed EDX analyses; still, we managed to record spectra at three different points of the crystal. The recorded spectra show the absence of further metal atoms and a composition similar to the single-crystal refinement results, but slightly lower in Cu content. The mean measured composition is CuHg (see Table 6), calculated: CuHg. This is somehow surprising as decomposition in a high vacuum of the electron microscope can clearly be seen in the crystal picture, which would mean evaporation of Hg and therefore a higher Cu content with respect to the results from single-crystal refinement. A reason for this deviation could be the formation of a Hg surface layer after decomposition and prior to evaporation of the Hg in the vacuum. As EDX primarily is a surface-sensitive method, Hg may thus be overrepresented in the results.
In order to further explore the phase width of CuHg and to gather knowledge about thermal stability and phase relations of both Cu amalgams CuHg and CuHg, thermochemical investigations are in progress.
3. Discussion
All amalgams adopting the NiSn structure type [38,39,40,41] are compiled in Table 7. Always, the minority component A is coordinated only by Hg atoms in an anticuboctahedral environment, and all known examples have the Hg-rich composition MHg. This can be seen as an expression of some Coulombic contributions A[Hg] and the formation of coordination spheres of negatively polarized Hg atoms around the cationic species A. This is corroborated by the fact that this class of amalgams is only formed by explicitly electropositive A metals.
The NiSn structure type is a favored sphere packing in amalgams where the atomic radii of A do not differ much from the one of Hg (151 pm, [42]). Differences according to Table 7 seem only favorable if the A metal is larger than Hg. The largest difference can be found for Sr with an atomic radius 42% larger than the one of Hg. No amalgams are known with A atoms smaller than Hg so far. In addition, it can be stated that all known amalgams of this type show a ratio of the lattice parameters c/a smaller than its ideal value for a packing of incompressible spheres of equal size with all spheres in contact. The ab plane is widened with respect to the stacking of the planes. This distortion cannot be due to only geometrical reasons because the larger A atoms should distort the packing equally in all directions, not only the ab plane. The anticuboctahedral coordination polyhedra [AHg] thus are oblate with the six equatorial Hg atoms having larger distances than the other six. The variation of the c/a ratio does not follow the quotient of the atomic radii: c/a is largest (and therefore closest to the ideal geometric ratio) for LiHg (0.768) and for YbHg (0.761), while Li and Hg have almost identical atomic radii, and Yb is 17% larger than Hg. The smallest c/a ratios are found for LaHg (0.729, La being 24% larger than Hg), CeHg (0.731, 21%), Th (0.730, 19%) and U (0.735, 3%). Geometric, as well as electronic reasons may contribute to the structural distortion, and heteroatomic interactions seem to have higher bonding contributions than homoatomic ones, as suggested by studies on the electronic structure of NiSn [39]. In the amalgam cases, Coulombic contributions may be the underlying reason; however, the degree of interplay of different contributions still remains speculative. One could assume bonding Hg-Hg interactions to cause a contraction of the [AHg] anticuboctahedra along the [001] direction, as Hg formally behaves like an early p group metal [43] and tends to form Hg-Hg bonding.
A similar case of deviation from ideal sphere packing geometry is known for elemental mercury. Rhombohedral -Hg crystallizes in a distortion variant of fcc where the individual hexagonal sphere planes are widened with respect to their stacking along the {111} directions of the cubic fcc cell, leading to a rhombohedral metric with = 70.44(6) [44] instead of 60 for an ideal fcc packing. Band structure calculations show differences in bond strengths for - and -type interactions between the Hg(p) orbitals within and between the hexagonal layers, resulting in the structural distortion of the sphere packing [45,46].
Most interesting within this context is CuHg as the first amalgam in this structure type with a reversed composition. In comparison to the other amalgams, CuHg may be seen as the anti-NiSn-type, as it is the only amalgam where the A element constitutes the majority component, and Hg is coordinated in an anticuboctahedron of Cu atoms. The structural deviation from ideal geometry leads to a c/a ratio of 0.812, which is much closer to the ideal value of 0.8167 than for all amalgams with AHg composition. Here, the bonding situation is obviously quite different. Obviously, Coulombic interactions cannot play a major role here, as Cu is not a very electropositive metal. This would explain the absence of bonding Hg-Hg contributions and therefore no contraction along c.
While the details of chemical bonding still remain unclear, the inversed composition may also be explained by geometrical reasons. If the NiHg structure type demands a structural necessity for the minority component to be the bigger atom, then Cu with atomic radius of 128 pm [42] favors the formation of CuHg with a quotient r/r = 1.18 over the formation of CuHg with a quotient of r/r = 0.878. If the atomic radii really play a decisive role in the formation of amalgams of the NiSn structure type with a composition AHg, then the respective amalgams should also be found for A = Cr (r = 128 pm), Mn (r = 127 pm), Fe (r = 126 pm), Co (r = 125 pm) and Ni (r = 124 pm). As from these elements only Mn and Ni are known to form amalgams and as from these no amalgam with composition AHg is known so far, we consider it worthwhile to have a closer look at the respective binary phase diagrams in the near future.
4. Materials and Methods
4.1. Synthesis of Copper Amalgams
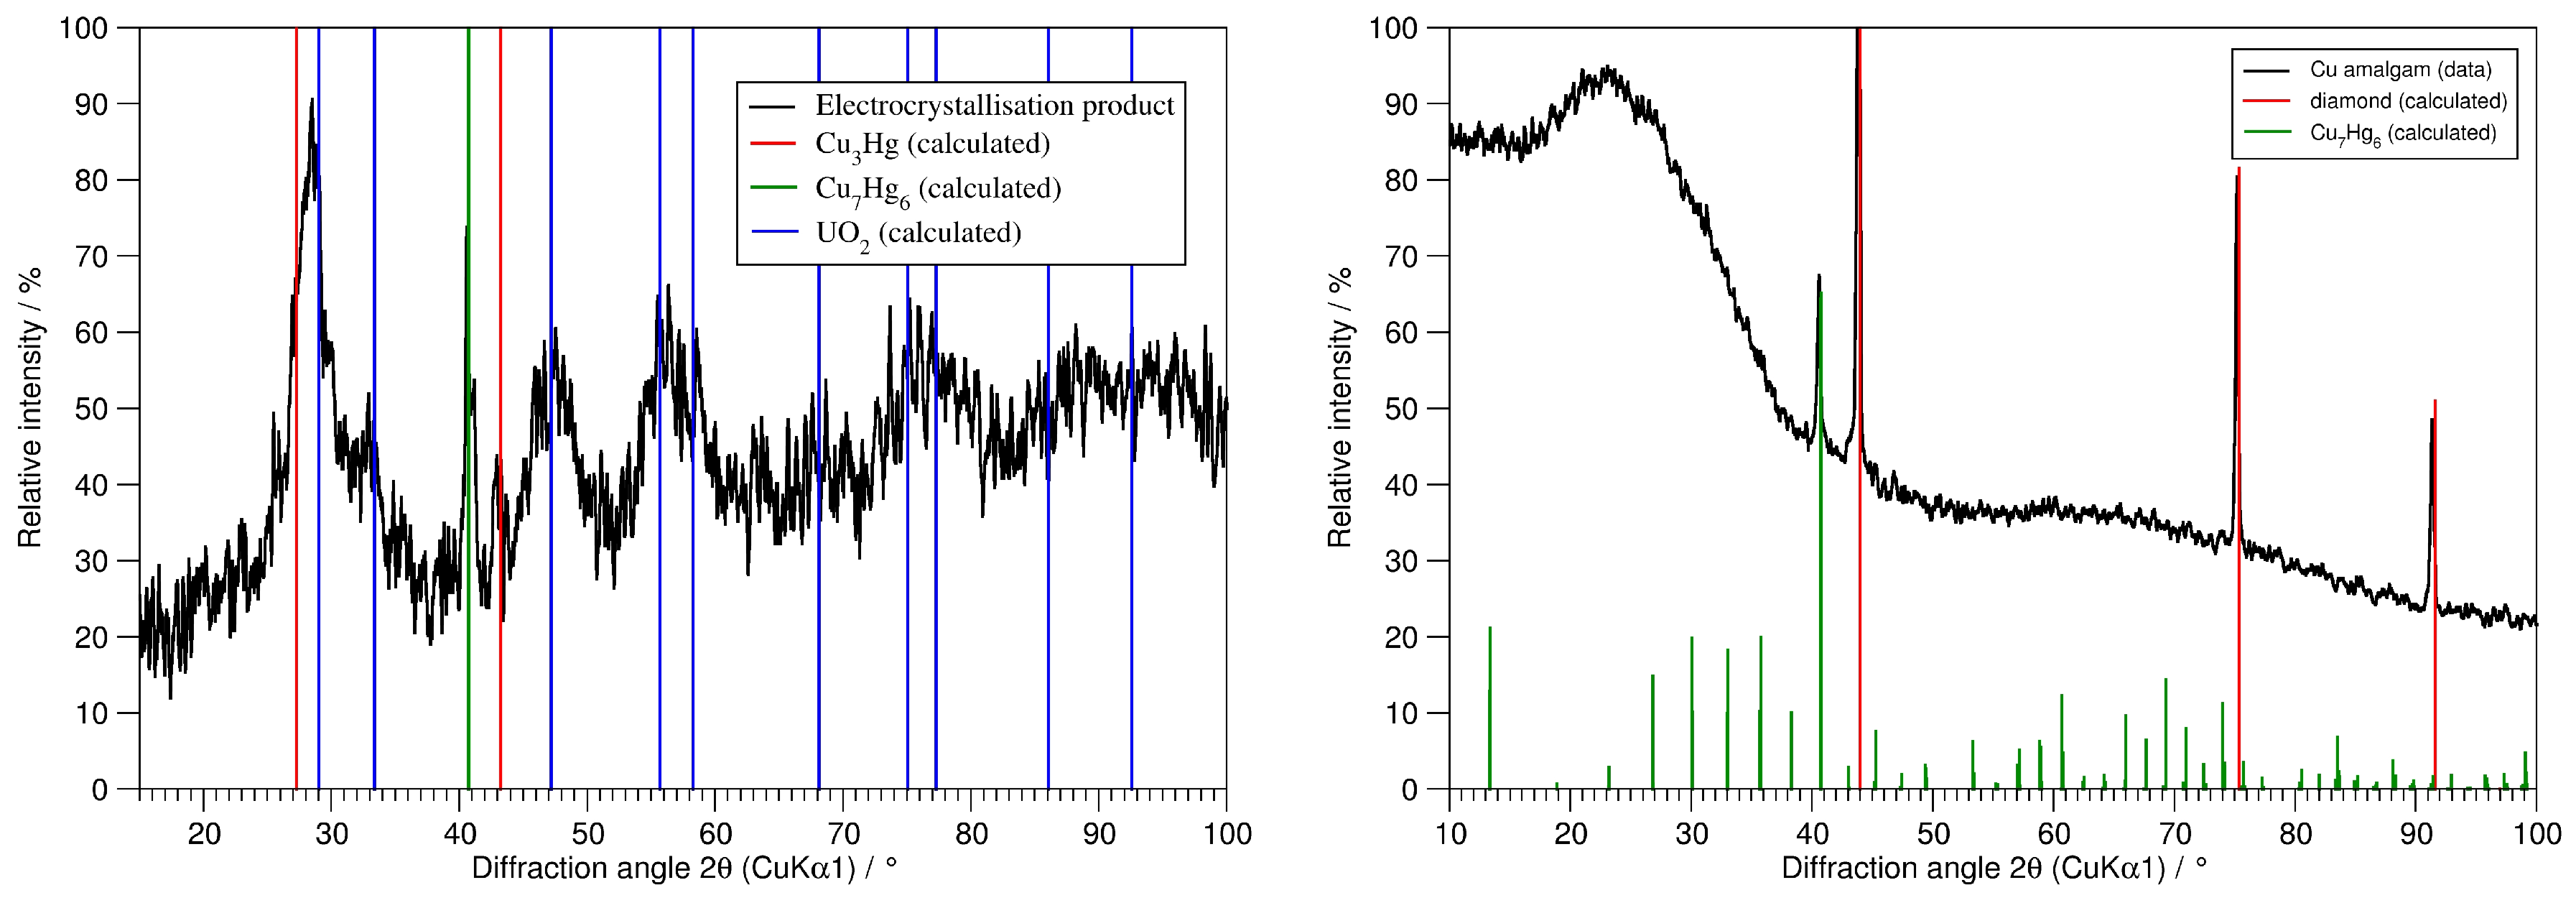
We did not intend to prepare copper amalgams. Crystals of CuHg and CuHg were the serendipitous results of the attempt to synthesize Hg-rich uranium amalgams by electro-crystallization, starting from a solution of UI in N,N-dimethylformamide (DMF) and a reactive cathode consisting of a Hg drop suspended in an amalgamated Cu spoon. The preparative approach to temperature-sensitive Hg-rich amalgams via electro-crystallization had proven very convenient in previous cases [23,32,33,56,57]. Electro-crystallization was performed at 90 C for two weeks and resulted in the formation of nanocrystalline UO (see Figure 3, left), while the Hg drop formed the copper amalgams CuHg and CuHg over the reaction time of two weeks. The reason for the unsuccessful U amalgam synthesis is that UI dissolves in molecular form in DMF and does not form ionic complexes [U(DMF)] as other metal iodides do. This has been shown by recording UV-Vis spectra of the solutions and comparison with the literature.
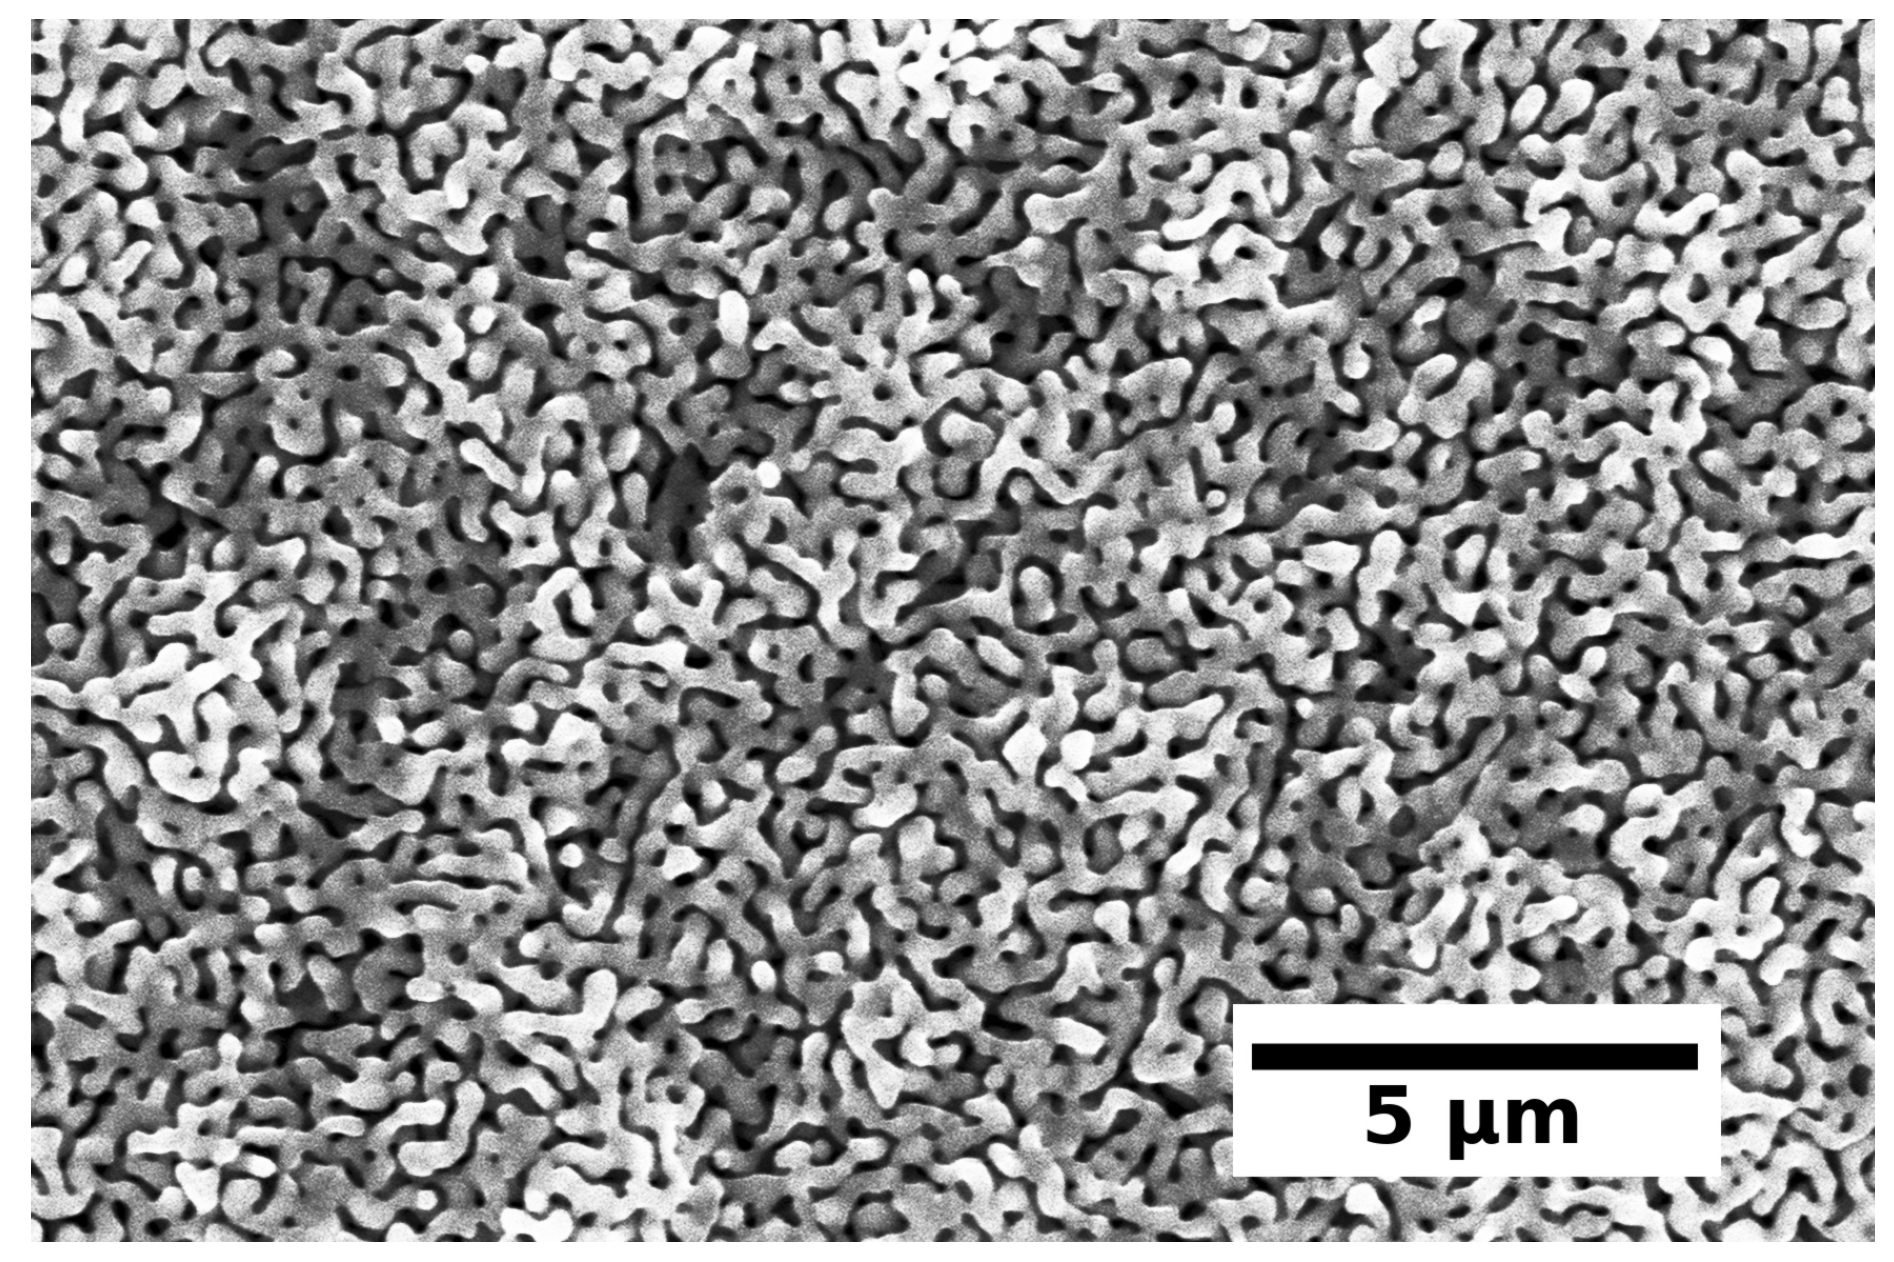
The reaction of a copper foil with mercury at 105 C was repeated outside of the electro-crystallization chamber and also resulted in the formation of the Cu amalgams CuHg and CuHg directly from the elements; see Figure 3. Both amalgams decompose at temperatures between 110 and 200 C. By heating the amalgamated copper foil in a dynamic vacuum to 200 C, the released mercury is distilled off, and a homogeneous copper network with interpenetrating nano-scaled copper rod structures is formed (see Figure 4). This copper network with high porosity might be interesting for utilization in heterogeneous catalysis reactions due to its simple and straightforward preparation.
4.2. Single Crystal Investigations
Single crystals of the copper amalgams were selected under binoculars, and specimens with well-shaped faces (see Figure 2, left) were glued on top of a glass fiber with cyanoacrylate glue. They were centered on the one-circle goniometer of a diffractometer system IPDS 1 (Stoe & Cie., Darmstadt, Germany) equipped with graphite-monochromatized Ag-K radiation (fine-focus X-ray tube) and an imaging plate detector After checking crystal quality and crystal metrics, data collection was performed in scans; data of the accessible part of an entire Ewald sphere were collected. Data were corrected for Lorentz and polarization effects with the diffractometer software package [58]. Absorption corrections were performed carefully on the basis of optimized indexed crystal faces [34,35,58]. Structure solution for CuHg was performed with direct methods [36] in space group P6/mmc as indicated by extinction conditions together with statistics on E−1 (E being the normalized structure factor). Structure refinement was performed with full-matrix least-squares cycles [36] on F (F being the structure factor). Both atoms were treated with anisotropic displacement tensors. Further information can be obtained from Fachinformationszentrum Karlsruhe, 76344 Eggenstein-Leopoldshafen, Germany (fax +49 (0)7247 808 666; e-mail: [email protected]; http://www.fiz-informationsdienste.de/en/DB/icsd/depot_anforderung.html), on quoting the deposition number CSD-433425.
4.3. Powder Diffractometry
For powder diffraction, the amalgam samples were prepared by grinding together with diamond powder for both optical dilution due to high absorption coefficients and mechanical reasons as the amalgams are rather ductile. The powders were sealed in glass capillaries (⌀ = 0.3 mm), and data collection was performed on a diffractometer system STADI P (Stoe & Cie., Darmstadt, Germany) equipped with Ge-monochromatized MoK1 radiation and a Mythen 2K detector in parafocusing Debye–Scherrer geometry. For better comparison of the recorded diffraction patterns with calculated patterns based on single-crystal data from literature, they were converted to Cu-K1 wavelength.
4.4. EDX Spectroscopy
EDX spectra were collected on an electron microscope system JSM-6500F (Jeol, Freising, Germany) with a field emission source and EDX detector at 25 kV.
Acknowledgments
We thank Wolfgang Schnick from Ludwig-Maximilians-Universität München for generous funding. We also thank Christian Minke from LMU München for EDX measurements and SEM imaging. Florian Kraus from Philipps-Universität Marburg kindly provided samples of UI for the electro-crystallization experiments.
Author Contributions
C.H. conceptualized the studies and wrote the manuscript. J.S. supervised the practical work, prepared the single-crystal samples and performed all analyses. R.F. performed the syntheses.
Conflicts of Interest
The authors declare no conflict of interest.
References
- Bharti, R.; Wadhwani, K.K.; Tikku, A.P.; Chandra, A. Dental amalgam: An update. J. Conserv. Dent. 2010, 13, 204–208. [Google Scholar] [CrossRef] [PubMed]
- Sakaguchi, R.L.; Powers, J.M. Craig’s Restorative Dental Materials, 13rd ed.; Mosby: St. Louis, MI, USA, 2011; ISBN 978-0323081085. [Google Scholar]
- Bonsor, S.; Pearson, G. A Clinical Guide to Applied Dental Materials, 1st ed.; Churchill Livingstone: London, UK, 2012; ISBN 978-0702031588. [Google Scholar]
- Fairhurst, C.W.; Cohen, J.B. The crystal structures of two compounds found in dental amalgam: Ag2Hg3 and Ag3Sn. Acta Crystallogr. 1972, B28, 371–378. [Google Scholar] [CrossRef]
- Rossi, P.J.; Zotov, N.; Mittemeijer, E.J. Redetermination of the crystal structure of the Ag3Sn intermetallic compound. Z. Kristallogr. 2016, 231, 1–9. [Google Scholar] [CrossRef]
- Che, G.C.; Ellner, M.; Schubert, K. The hP1-type phases in alloys of cadmium, mercury, and indium with tin. J. Mater. Sci. 1991, 26, 2417–2420. [Google Scholar] [CrossRef]
- King, H.W.; Massalski, T.B. Lattice spacing relationships and the electronic structure of h.c.p. ζ-phases based on silver. Philos. Mag. 1961, 6, 669–682. [Google Scholar] [CrossRef]
- Larsson, A.K.; Stenberg, L.; Lidin, S. The superstructure of the domain-twinned η’-Cu6Sn5. Acta Crystallogr. 1994, B50, 636–643. [Google Scholar] [CrossRef]
- Watanabe, Y.; Fujinaga, Y.; Iwasaki, H. Lattice modulation in the long-period superstructure of Cu3Sn. Acta Crystallogr. 1983, B39, 306–311. [Google Scholar] [CrossRef]
- Xiahan, S.; Kui, D.; Hengqiang, Y. An ordered structure of Cu3Sn in Cu-Sn alloy investigated by transmission electron microscopy. J. Alloys Compd. 2009, 469, 129–136. [Google Scholar] [CrossRef]
- Mitchell, R.J.; Okabe, T. Setting reactions in dental amalgam. Part 1: Phases and microstructures between one hour and one week. Crit. Rev. Oral Biol. Med. 1996, 7, 12–22. [Google Scholar] [CrossRef] [PubMed]
- Mitchell, R.J.; Okabe, T. Setting reactions in dental amalgam. Part 2: The kinetics of amalgamation. Crit. Rev. Oral Biol. Med. 1996, 7, 23–25. [Google Scholar] [CrossRef]
- Beech, D.R. High copper alloys for dental amalgam. Int. Dent. J. 1982, 32, 240–251. [Google Scholar] [PubMed]
- Städtler, P. Dental amalgam. I: Conventional and non-gamma-2 amalgams. Int. J. Clin. Pharmacol. Ther. Toxicol. 1991, 29, 161–163. [Google Scholar] [PubMed]
- Chu, H.-T. The use of amalgam as filling material in dentistry in ancient china. Chin. Med. J. 1958, 76, 553–555. [Google Scholar] [PubMed]
- Czarnetzki, A.; Ehrhardt, S. Re-dating the chinese amalgam filling of teeth in Europe. Int. J. Anthropol. 1990, 5, 325–332. [Google Scholar]
- Newman, S.M. Amalgam alternatives: What can compete? J. Am. Dent. Assoc. 1991, 122, 67–71. [Google Scholar] [CrossRef] [PubMed]
- Massalski, T.B.; Okamoto, H.; Subramanian, P.R. Binary Alloy Phase Diagrams; ASM International: Materials Park, OH, USA, 1990; ISBN 978-0871704030. [Google Scholar]
- Lindahl, T.; Westman, S. The structure of the rhombohedral gamma brass like phase in the copper-mercury system. Acta Chem. Scand. 1969, 23, 1181–1190. [Google Scholar] [CrossRef]
- Bernhardt, H.J.; Schmetzer, K. Belendorffite, a new copper amalgam dimorphous with kolymite. Neues Jahrb. Mineral. Monatsh. 1992, 1992, 18–21. [Google Scholar]
- Markova, E.A.; Chernitsova, N.M.; Borodaev, N.M.; Yu, S.; Dubakina, L.S.; Yushko-Zakharova, O.E. The new mineral kolymite, Cu7Hg6. Int. Geol. Rev. 1982, 24, 233–237. [Google Scholar] [CrossRef]
- Carnasciali, M.M.; Costa, G.A. CuxHgy: A puzzling compound. J. Alloys Compd. 2001, 317–318, 491–496. [Google Scholar] [CrossRef]
- Hoch, C.; Simon, A. Cs2Hg27, the mercury-richest amalgam with close relationship to the Bergman phases. Z. Anorg. Allg. Chem. 2008, 634, 853–856. [Google Scholar] [CrossRef]
- Biehl, E.; Deiseroth, H.J. Darstellung, Strukturchemie und Magnetismus der Amalgame MHg11 (M: K, Rb, Ba, Sr). Z. Anorg. Allg. Chem. 1999, 625, 1073–1080. [Google Scholar] [CrossRef]
- Hoch, C.; Simon, A. Tetramethylammoniumamalgam [N(CH3)4]Hg8. Z. Anorg. Allg. Chem. 2006, 632, 2288–2294. [Google Scholar] [CrossRef]
- Tambornino, F.; Hoch, C. Bad metal behaviour in the new Hg-rich amalgam KHg6 with polar metallic bonding. J. Alloys Compd. 2015, 818, 299–304. [Google Scholar] [CrossRef]
- Lahiri, S.K.; Angilello, J.; Natan, M. Precise lattice parameter determination of PtHg4. J. Appl. Crystallogr. 1982, 15, 100–101. [Google Scholar] [CrossRef]
- Biehl, E.; Deiseroth, H.J. K2Hg7 und Rb2Hg7, zwei Vertreter eines neuen Strukturtyps binärer intermetallischer Verbindungen. Z. Anorg. Allg. Chem. 1999, 625, 1337–1342. [Google Scholar] [CrossRef]
- Tambornino, F. Electrolytic Synthesis and Structural Chemistry of Intermetallic Phases with Polar Metal-Metal Bonding. Ph.D. Thesis, LMU, München, Germany, 2016. [Google Scholar]
- Merlo, F.; Fornasini, M.L. Crystal structure of the R11Hg45 compounds (R = La, Ce, Pr, Nd, Sm, Gd, U). J. Less-Common Met. 1976, 44, 259–265. [Google Scholar] [CrossRef]
- Iandelli, A.; Palenzona, A. Su alcuni composti intermetallici dell’europio con zinco, cadmio e mercurio. Atti Accad. Nazl. Lincei Rend. Cl. Sci. Fis. Mater. Nat. 1964, 37, 165–168. [Google Scholar]
- Hoch, C.; Simon, A. Na11Hg52: Komplexität in einem polaren Metall. Angew. Chem. 2012, 124, 3316–3319. [Google Scholar] [CrossRef]
- Hoch, C.; Simon, A. Na11Hg52: Complexity in a polar metal. Angew. Chem. Int. Ed. 2012, 51, 3262–3265. [Google Scholar] [CrossRef] [PubMed]
- Stoe & Cie. X-SHAPE v. 2.07; Stoe & Cie: Darmstadt, Germany, 2005. [Google Scholar]
- Stoe & Cie. X-RED v. 1.31; Stoe & Cie: Darmstadt, Germany, 2005. [Google Scholar]
- Sheldrick, G.M. A short history of SHELX. Acta Crystallogr. 2008, A64, 112–122. [Google Scholar] [CrossRef] [PubMed]
- Gelato, L.M.; Parthé, E. Structure Tidy—A computer program to standardize crystal structure data. J. Appl. Crystallogr. 1987, 20, 139–143. [Google Scholar] [CrossRef]
- Rahlfs, P. Die Kristallstruktur des Ni3Sn (Mg3Cd-Typ = Überstruktur der hexagonal dichtesten Kugelpackung). Metallwirtschaft 1937, 16, 343–345. [Google Scholar]
- Lyubimtsev, A.L.; Baranov, A.I.; Fischer, A.; Kloo, L.; Popovkin, B.A. The structures and bonding of Ni3Sn. J. Alloys Compd. 2002, 340, 167–172. [Google Scholar] [CrossRef]
- Lihl, F.; Krinbauer, H. Untersuchung binärer metallischer Systeme mit Hilfe des Amalgamverfahrens. Das System Nickel-Zinn. Monatsh. Chem. 1955, 86, 745–751. [Google Scholar] [CrossRef]
- Watanabe, Y.; Murakumi, Y.; Kachi, S. Martensitic and massive transformations and phase diagram in Ni3−xMxSn (M = Cu, Mn) alloys. J. Jpn. Inst. Met. 1981, 45, 551–558. [Google Scholar] [CrossRef]
- Mantina, M.; Chamberlin, A.C.; Valero, R.; Cramer, C.J.; Truhlar, D.G. Consistent van der Waals radii for the whole main group. J. Phys. Chem. 2009, 113, 5806–5812. [Google Scholar] [CrossRef] [PubMed]
- Köhler, J.; Whangbo, M.-H. Late transition metal anions acting as p-metal elements. Solid State Sci. 2008, 10, 444–449. [Google Scholar] [CrossRef]
- Barrett, C.S. The structure of mercury at low temperature. Acta Crystallogr. 1957, 10, 58–60. [Google Scholar] [CrossRef]
- Deng, S.; Simon, A.; Köhler, J. Supraleitung und chemische Bindung in Quecksilber. Angew. Chem. 1998, 110, 664–666. [Google Scholar] [CrossRef]
- Deng, S.; Simon, A.; Köhler, J. Superconductivity and chemical bonding in mercury. Angew. Chem. Int. Ed. 1998, 37, 640–643. [Google Scholar] [CrossRef]
- Zintl, E.; Schneider, A. Röntgenanalyse der Lithium-Amalgame. Z. Elektrochem. Angew. Phys. Chem. 1935, 41, 771–774. [Google Scholar] [CrossRef]
- Bruzzone, G.; Merlo, F. The strontium-mercury system. J. Less-Common Met. 1974, 35, 153–157. [Google Scholar] [CrossRef]
- Bruzzone, G.; Ruggiero, A.F. Struttura di alcuni composti intermetallici dell’ittrio—I. Composti con Cu, Ag, Au, Zn, Cd, Hg. Atti Accad. Nazl. Lincei Rend. Cl. Sci. Fis. Mater. Nat. 1962, 33, 312–314. [Google Scholar]
- Laube, E.; Nowotny, H.N. Die Kristallstrukturen von ScHg, ScHg3, YCd, YHg und YHg3. Monatsh. Chem. 1963, 94, 851–858. [Google Scholar] [CrossRef]
- Bruzzone, G.; Merlo, F. The lanthanum-mercury system. J. Less-Common Met. 1976, 44, 259–265. [Google Scholar] [CrossRef]
- Olcese, G.L. Sul comportamento magnetico del cerio nei composti intermetallici. II. I sistemi Ce-Zn, Ce-Cd Ce-Hg. Atti Accad. Nazl. Lincei Rend. Cl. Sci. Fis. Mater. Nat. 1963, 35, 48–52. [Google Scholar]
- Palenzona, A. MX3 intermetallic phase of the rare earths with Hg, In, Tl, Pb. J. Less-Common Met. 1966, 10, 290–292. [Google Scholar] [CrossRef]
- Ferro, R. The crystal structures of ThHg3, ThIn3, ThTl3, ThSn3 and ThPb3. Acta Crystallogr. 1958, 11, 737–738. [Google Scholar] [CrossRef]
- Rundle, R.E.; Wilson, A.S. The structures of some metal compounds of uranium. Acta Crystallogr. 1949, 2, 148–150. [Google Scholar] [CrossRef]
- Tambornino, F.; Hoch, C. The Hg-richest europium amalgam, Eu10Hg55. Z. Anorg. Allg. Chem. 2015, 641, 537–542. [Google Scholar] [CrossRef]
- Tambornino, F.; Sappl, J.; Pultar, F.; Cong, T.M.; Hübner, S.; Giftthaler, T.; Hoch, C. Electrocrystallization—A synthetic method for intermetallic phases with polar metal-metal bonding. Inorg. Chem. 2016, 55, 11551–11559. [Google Scholar] [CrossRef] [PubMed]
- Stoe & Cie. X-AREA v. 1.39; Stoe & Cie: Darmstadt, Germany, 2006. [Google Scholar]
Figure 1.
Crystal structure of CuHg with NiSn structure type. Left: Polyhedra packing with blue Hg atoms centering light grey [HgCu] anticuboctahedra and red Cu atoms forming empty trans-face-sharing [Cu] octahedra, c pointing upwards. Right: Net representation in the ab plane at height z = 1/4 (fat bonds, large atoms) and z = 3/4 (thin bonds, small atoms) with the unit cell given in black. Stacking of the nets follows periodicity ...ABAB... along c while shifting B versus A by (1/3, 2/3, 1/2) as shown. Ellipsoids are drawn at a probability level of 99% for Cu (red) and Hg (blue).

Figure 2.
Left: Photograph of a CuHg single crystal under an optical microscope (size of the crystal: 87 × 13 m) showing well-shaped faces, the typical prismatic habitus and bronze luster. Right: Scanning electron micrograph of a CuHg crystal after EDX measurements. Deterioration effects due to high vacuum and electron beam are clearly visible.
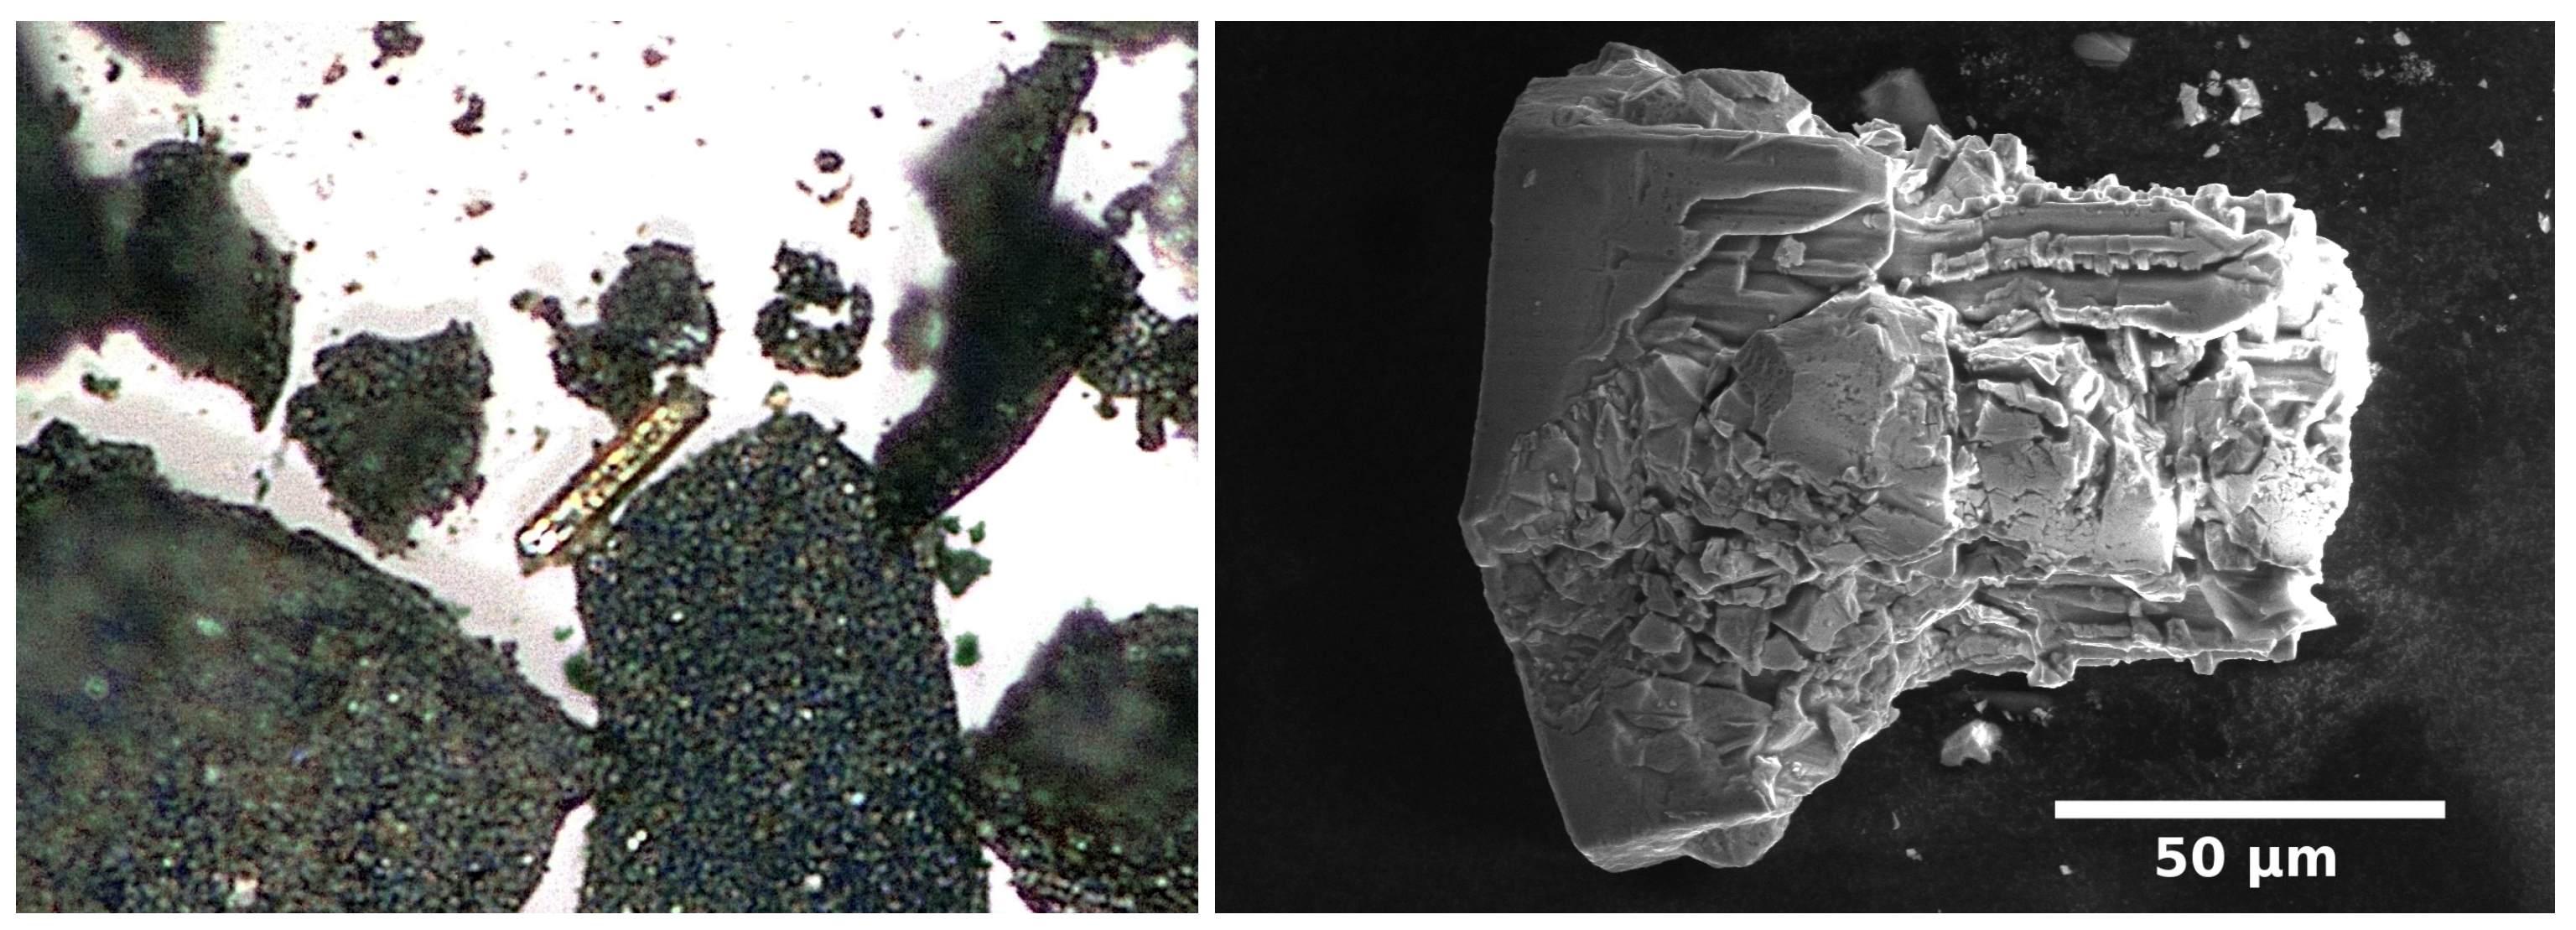
Figure 3.
Left: Powder diffraction pattern of the electro-crystallization product. The broad maxima originate from nano-scaled UO; the sharp maxima belong to both Cu amalgams CuHg and CuHg. Right: Powder diffraction pattern of a sample of Cu amalgams. Data collection was performed in parafocusing Debye–Scherrer transmission geometry on a capillary sample diluted with diamond powder.

Figure 4.
Scanning electron micrograph of nano-scaled metallic copper structures, prepared by thermolysis of Cu amalgams at 200 C in a vacuum.
Figure 4.
Scanning electron micrograph of nano-scaled metallic copper structures, prepared by thermolysis of Cu amalgams at 200 C in a vacuum.

Table 1.
Decomposition temperatures or melting points of Hg-rich amalgams AHg with x > 3 and with A = non-Hg metal. Values are taken from [18] if not given otherwise. Congruent melting temperatures are given in italic numbers.
Table 1.
Decomposition temperatures or melting points of Hg-rich amalgams AHg with x > 3 and with A = non-Hg metal. Values are taken from [18] if not given otherwise. Congruent melting temperatures are given in italic numbers.
| Composition | Hg/A Ratio x | Decomposition Temperature (C) |
|---|---|---|
| CsHg | 13.5 | 12 [23] |
| KHg | 11.0 | 70 [24] |
| RbHg | 11.0 | 70 [24] |
| CaHg | 11.0 | 84 |
| SrHg | 11.0 | 63 [24] |
| BaHg | 11.0 | 162 [24] |
| (N(CH))Hg | 8.0 | 9 [25] |
| RbHg | 6.67 | 132 |
| CsHg | 6.67 | 158 |
| KHg | 6.0 | 170 [26] |
| BaHg | 6.0 | 410 |
| BaHg | 5.15 | 505 |
| KHg | 4.43 | 187 |
| RbHg | 4.43 | 162 |
| AHg | 4.09 | 145–720 |
| PtHg | 4.0 | ≥200 [27] |
| RbHg | 3.8 | 193 |
| CsHg | 3.8 | 164 |
| KHg | 3.67 | 195 |
| AHg | 3.64 | 157–480 |
| KHg | 3.5 | 202 [28] |
| RbHg | 3.5 | 197 [28] |
Amalgams with the SmCd structure type show compositional ranges between x = 3.79 (La, T = 720 C) and 4.09 (Gd, T = 145 C) and have been reported for A = La, Ce, Pr, Nd, Sm, Gd and U [29,30]. Amalgams with variants of the GdAg structure type show compositional ranges between x = 4.63 (Na, T = 157 C) and 5.44 (Sr, T = 480 C) and have been described for A = Na, Ca, Sr, Eu and Yb [29,31,32,33].
Table 2.
Crystallographic data and details on single crystal data collection, structure solution and refinement for CuHg. Data collection was performed at room temperature. All standard deviations are given in parentheses in units of the last digit.
Table 2.
Crystallographic data and details on single crystal data collection, structure solution and refinement for CuHg. Data collection was performed at room temperature. All standard deviations are given in parentheses in units of the last digit.
| Composition | CuHg |
| Crystal system | hexagonal |
| Space group | P/mmc, (No. 194) |
| Lattice parameters, a, c (Å) | 5.408(4), 4.390(3) |
| Unit cell volume, V (Å) | 111.18(13) |
| No. of formula units, Z | 2 |
| Density (X-ray), (g cm) | 11.235 |
| Diffractometer | STOE IPDS 1, Ag radiation |
| Data collection temperature, T (K) | 295(2) |
| Absorption coefficient, (mm) | 48.62 |
| Diffraction angle range, () | 5.02–23.53 |
| Index range | −7 ≤ h, k ≤ 7, −6 ≤ l ≤ 6 |
| No. of collected reflections | 2154 |
| No. of independent reflections | 72 |
| No. of independent reflections (I ≥ 2(I)) | 71 |
| 0.2198 | |
| 0.0485 | |
| Structure factor, F(000) | 322.8 |
| Corrections | Lorentz, polarization, absorption effects |
| Absorption correction | numerical [34,35] |
| Structure solution | direct methods [36] |
| Structure refinement | full-matrix least-squares on [36] |
| No. of lest-squares parameters | 9 |
| GooF | 1.180 |
| R values (I ≥ 2(I)) | R1 = 0.0345, wR2 = 0.0757 |
| R values (all data) | R1 = 0.0368, wR2 = 0.0773 |
| Residual (e) max/min (eÅ) | +1.698/−1.419 |
| Extinction coefficient | 0.047(4) |
Table 3.
Standardized fractional atomic coordinates [37] and equivalent isotropic displacement parameters (Å) for CuHg. The equivalent isotropic displacement parameter is defined as 1/3 of the trace of the anisotropic displacement tensor. All standard deviations are given in parentheses in units of the last digit.
| Atom | Occupation Factor | Wyckoff Letter | x | y | z | |
|---|---|---|---|---|---|---|
| Hg1 | 0.89(5) | 2d | 0.0160(7) | |||
| Cu1 | 0.11(5) | 2d | 0.0160(7) | |||
| Cu2 | 1 | 6h | 0.1589(3) | 2x | 0.0201(18) |
Table 4.
Coefficients U of the anisotropic displacement tensor (Å) for CuHg. U is defined as U = exp{}. All standard deviations are given in parentheses in units of the last digit.
Table 4.
Coefficients U of the anisotropic displacement tensor (Å) for CuHg. U is defined as U = exp{}. All standard deviations are given in parentheses in units of the last digit.
| Atom | ||||||
|---|---|---|---|---|---|---|
| Hg1 | 0.0156(7) | =U | 0.0168(8) | 0 | 0 | 0.0078(4) |
| Cu1 | 0.0156(7) | =U | 0.0168(8) | 0 | 0 | 0.0078(4) |
| Cu2 | 0.0195(19) | 0.024(2) | 0.019(2) | 0 | 0 | 0.0118(10) |
Table 5.
Selected interatomic distances and their frequencies in CuHg in Å. All standard deviations are given in parentheses in units of the last digit.
Table 5.
Selected interatomic distances and their frequencies in CuHg in Å. All standard deviations are given in parentheses in units of the last digit.
| Atom 1 | Atom 2 | Distance |
|---|---|---|
| Hg1 | Cu2 | 2.7048(19) (6×) |
| Cu2 | 2.736(2) (6×) | |
| Cu2 | Cu2 | 2.578(5) (2×) |
| Cu2 | 2.6521(19) (4×) |
Table 6.
Results of EDX spectroscopic measurements on the CuHg crystal shown in Figure 2 (right). The values are averaged over three measurements on different spots. The largest deviations from the mean value are given in parentheses. Expected values are calculated for the composition CuHg.
Table 6.
Results of EDX spectroscopic measurements on the CuHg crystal shown in Figure 2 (right). The values are averaged over three measurements on different spots. The largest deviations from the mean value are given in parentheses. Expected values are calculated for the composition CuHg.
| Atom | Atom-% Detected | Atom-% Calculated |
|---|---|---|
| Cu | 73.6(2) | 77.7 |
| Hg | 26.4(2) | 22.3 |
Table 7.
Amalgams AHg (A = non-Hg metal) adopting the NiHg structure type. Hg has an atomic radius of 151 pm [42]. The ideal c/a ratio for hcp is 1.633. Due to a doubling of a, the ideal c/a ratio in the NiSn structure type is 0.8167. In NiSn (r = 124 pm, r = 132 pm, ratio r/r = 1.06), the c/a ratio is 0.802 [40].
| Phase AHg | r [pm] | r/r | c/a |
|---|---|---|---|
| LiHg [29,47] | 152 | 1.01 | 0.768 |
| CaHg [31] | 197 | 1.30 | 0.757 |
| SrHg [31,48] | 215 | 1.42 | 0.741 |
| ScHg [29,49] | 160 | 1.06 | 0.748 |
| YHg [29,49,50] | 181 | 1.20 | 0.744 |
| LaHg [29,51] | 187 | 1.24 | 0.729 |
| CeHg [52] | 182 | 1.21 | 0.731 |
| EuHg [31] | 180 | 1.19 | 0.747 |
| GdHg [29,53] | 180 | 1.19 | 0.742 |
| TbHg [53] | 177 | 1.17 | 0.748 |
| DyHg [29,53] | 178 | 1.18 | 0.746 |
| HoHg [29,53] | 176 | 1.17 | 0.747 |
| ErHg [29,53] | 176 | 1.17 | 0.748 |
| TmHg [29,53] | 176 | 1.17 | 0.748 |
| YbHg [53] | 176 | 1.17 | 0.761 |
| LuHg [29,53] | 174 | 1.15 | 0.750 |
| ThHg [54] | 179 | 1.19 | 0.730 |
| UHg [55] | 156 | 1.03 | 0.735 |
© 2017 by the authors. Licensee MDPI, Basel, Switzerland. This article is an open access article distributed under the terms and conditions of the Creative Commons Attribution (CC BY) license (http://creativecommons.org/licenses/by/4.0/).
Share and Cite
MDPI and ACS Style
Sappl, J.; Freund, R.; Hoch, C. Stuck in Our Teeth? Crystal Structure of a New Copper Amalgam, Cu3Hg. Crystals 2017, 7, 352. https://doi.org/10.3390/cryst7120352
AMA Style
Sappl J, Freund R, Hoch C. Stuck in Our Teeth? Crystal Structure of a New Copper Amalgam, Cu3Hg. Crystals. 2017; 7(12):352. https://doi.org/10.3390/cryst7120352
Chicago/Turabian StyleSappl, Jonathan, Ralph Freund, and Constantin Hoch. 2017. "Stuck in Our Teeth? Crystal Structure of a New Copper Amalgam, Cu3Hg" Crystals 7, no. 12: 352. https://doi.org/10.3390/cryst7120352
Note that from the first issue of 2016, this journal uses article numbers instead of page numbers. See further details here.