
Growth of Calcite in Confinement


Condensed Matter Section and Physics of Geological Processes, Department of Physics, University of Oslo, P. O. Box 1048 Blindern, 0316 Oslo, Norway
*
Author to whom correspondence should be addressed.
Crystals 2017, 7(12), 361; https://doi.org/10.3390/cryst7120361
Submission received: 7 July 2017
/
Revised: 27 November 2017
/
Accepted: 30 November 2017
/
Published: 6 December 2017
(This article belongs to the Special Issue Effects of Confinement and Topography on Crystallization)
Abstract
:Slow growth of calcite in confinement is abundant in Nature and man-made materials. There is ample evidence that such confined growth may create forces that fracture solids. The thermodynamic limits are well known, but since confined crystal growth is transport limited and difficult to control in experiments, we have almost no information on the mechanisms or limits of these processes. We present a novel approach to the in situ study of confined crystal growth using microfluidics for accurate control of the saturation state of the fluid and interferometric measurement of the topography of the growing confined crystal surface. We observe and quantify diffusion-limited confined growth rims and explain them with a mass balance model. We have quantified and modeled crystals “floating” on a fluid film of 25–50 nm in thickness due to the disjoining pressure. We find that there are two end-member nanoconfined growth behaviors: (1) smooth and (2) rough intermittent growth, the latter being faster than the former. The intermittent growth rims have regions of load- bearing contacts that move around the rim causing the crystal to “wobble” its way upwards. We present strong evidence that the transition from smooth to rough is a generic confinement-induced instability not limited to calcite.
1. Introduction
A number of marine organisms mineralize calcium carbonate [1]. The biomineralization processes are of great interest in themselves, and confinement in cellular compartments is thought to be important in the process of controlling biological mineral growth [2]. The organisms with calcium carbonate skeletons sediment to the sea floor, and the sediments undergo compaction where dissolution and recrystallization of calcite occur in confinement to form limestone [3]. Some such carbonate rocks are buried deeper and undergo recrystallization in confinement once more and emerge as marble. Both limestone and marble are used for construction and sculptures that deteriorate due to confined salt crystallization in the pore space [4]. In Portland cement, CO is slowly adsorbed, and calcite is crystallized in confinement [5]. Confined recrystallization of calcite in other environments has also been shown to create forces that break other mineral grains [6] and lift rock overburden [7].
The above examples show that carbonate rocks, where the pore fluid becomes supersaturated in calcium carbonate, behave in two completely different manners: sometimes, the calcite crystallizes in the pore space and around grain contacts and cements and strengthens the rock [3], and sometimes, calcite crystallizes in the grain contacts and breaks the surrounding rock [6,7]. Except for a general equilibrium thermodynamic argument for the limit to the force of crystallization [8,9,10], there exists no experimental data or theoretical models to understand the transition from crystallization force to cementation [11]. The general question “when does crystallization in confinement lead to stress buildup and damage, and when does crystallization cease due to confinement?” is also central to understanding salt damage of building materials like limestone and concrete and monuments [4,12,13]. Knowledge about the limits to crystallization pressure is also at the core of the ongoing debate on the effects of stress on metamorphism in the Earth’s crust [14,15].
There are three main types of experiments that have been performed to study the stresses generated by crystallization: high temperature, high pressure experiments with mineral transformations where the degree of growth of secondary minerals is studied ex situ [15], salt crystallization in porous rocks where dilation, damage and fracturing is studied [13] and, finally, studies on single crystals growing against a known force [9,11,16,17]. Only a limited number of successful such experiments have been performed since Becker and Day studied potassium alum [16]. Becker and Day [16] documented that the contact area between the growing crystal and the support was much smaller than the apparent surface area and went to great lengths to determine this area because the force on the crystal divided by the contact area equals the contact pressure, which is the relevant thermodynamic variable. Taber [17] studied potassium alum, chrome alum, potassium sulphate and copper sulphate and found that the existence of other crystals in the crystallization chamber stopped the crystallization doing work against an external force. Correns performed a series of experiments on potassium alum, sodium carbonate and calcium chloride published between 1926 and 1949 culminating in a seminal paper with data on the maximum pressure at which there is crystallization doing work and provided a thermodynamic expression for the relation between stress and supersaturation [9]. Curiously, the thermodynamic expression has an excellent fit with the experimental data, but is wrong by a factor of four [18], and despite his knowledge of the work of Becker and Day, he does not comment on the area of contact between the crystal and the glass support. The first carefully-controlled single-crystal crystallization pressure experiment since Correns was performed by Røyne and Dysthe on sodium chlorate [11,19].
Whereas the transport of material to a nanoconfined growth surface from melt (for instance, ice or metals) is dominated by viscous flow, transport during growth from solution is dominated by diffusion through the solution to the growing surface. If there is some force pressing the growing crystal against an impermeable solid, there may still be a confined fluid film between the two solid surfaces supporting the load, as long as the applied contact pressure does not exceed the maximum disjoining pressure [20,21].
The rate of crystal growth increases with supersaturation, and supersaturation decreases in the direction of diffusion (that is, driven by a concentration gradient). Therefore, there will be a negative feedback between growth and transport in the confined fluid. If the fluid supports sufficient stress, continuum theory predicts a smooth growth rim of well-defined, pressure-dependent width to appear at the confined growing surface [10]. Experiments documenting such growth rims during crystal growth confined by a glass plate and creating a force have been performed on potassium alum [16] and NaClO [11]. These experiments show, however, that the confined growth surface is much more complex than the smooth rims predicted by continuum theory: the rims are rough, and their width does not depend on the load on the crystal in a systematic manner. This signifies that there are other, positive feedback mechanisms at work.
The present study of the growth of single crystals of calcite targets some of the many open questions from these earlier studies [9,10,11,16]: What is the area of contact between a crystal lifting a load and the base that it rests on? What are the characteristics of the interface topography? What is the contact stress? What are the processes controlling the interface topography and the contact area? Are these processes independent of solubility and growth rate?
Here, we report confined crystal growth experiments that differ from previous experiments in two respects: (1) instead of highly soluble crystals, we use calcite, which has a solubility of about four orders of magnitude smaller, and the growth rate is 3–4 orders smaller than NaClO; (2) we study the evolution of the growing confined crystal surface in situ. We measure the distance from the confining surface to the crystal surface while it evolves and can thereby demonstrate positive and negative transport-growth feedback mechanisms due to nanoconfinement.
2. Experimental Section
The experiments reported here are designed to have a very high degree of control of the growth conditions and high resolution measurement of the topography of the confined crystal surface while it grows.
2.1. Microfluidic Growth Control
The microfluidic network and flow control system, which has been described in detail in [22], is designed to:
- nucleate calcium carbonate crystals in a limited area that permits imaging access;
- remove other polymorphs than calcite (polymorphs are determined by the crystal shape);
- control stable saturation conditions at the growing crystal surface;
- permit slow growth of rhombohedral crystals from the nuclei;
- avoid clogging of the microfluidic device due to crystal growth elsewhere in the device.
The main idea of the experiment is sketched in Figure 1. CaCl solution and NaCO solution at equal concentrations and flow rates are introduced in two inlets, and in the third inlet, distilled water is introduced to control the total concentration c of CaCO in the main channel. The growth rate of the crystal (green in Figure 1) depends on the supersaturation , where is the equilibrium concentration, which is measured in situ as the concentration where the crystal neither grows nor dissolves, mM.
The channel networks are designed in Adobe Illustrator, saved as pdfs, and the photomask was printed on film substrate by Selba S.A (www.selba.ch). SU-8 GM1070 photoresist from Gersteltec (Pully, Switzerland) was spun on silicon wafers, UV radiated with UV-KUB2 (Montpellier, France) and developed with PGMEA from Sigma Aldrich (CAS no. 108-65-6, Darmstadt, Germany) according to the producer’s data sheet. Channel networks were cast in PDMS (Sylgard 184 elastomer kit purchased through VWR, Brooklyn, NY, USA) in a 1:10 ratio of elastomer to curing agent, with 1.5 mm-diameter holes punched for inlets and outlets, and the PDMS and glass (VWR collection 24 mm × 24 mm cover glass No. 1) were plasma treated (Zepto BD-20V, from Diener Electronic GMBH, Bielefeld, Germany) before assembly. Flow rate was controlled using a syringe pump (Legato 180 from Kd Scientific, Holliston, MA, USA) with glass syringes (Halmiton 1000 syringe series, Bonaduz, Switzerland) and a fluid flow control system (OB1 mk3 from Elveflow, Paris, France). The channels most used in this study were 120 m wide and 45 m high; the distance from the inlet to the imaging site was 10–50 mm; and flow rates during growth in the range 0.2–1 L/min.
2.2. Topography Measurements
The crystal growth on the confined interface facing the glass is measured by reflection interference contrast microscopy (RICM). The basic principle of RICM is illustrated in Figure 1. The incident LED light from the microscope is reflected both from the crystal-water interface and from the glass-water interface. Thus, a part:
of the total intensity reaching the detector is given by the interference of these two reflected parts of the incident light, where is the electromagnetic wave amplitude of the light reflected at the glass-water interface, is the electromagnetic wave amplitude of the light reflected at the crystal-water interface, is the wavelength of the light, h is the distance between the glass and the crystal and is the refractive index of water. denotes the part of the light reaching the detector by scattering at other interfaces of the system. Here, the light is represented by its central beam. The effects of the finite aperture of the imaging systems are not considered.
The reflected interference contrast can be achieved with almost any microscope using reflected light illumination. The contrast () can be augmented by using specialized objectives with a retarder [23], but in this study, we have used ordinary objectives (UPLanFLN 100×/1.30 and UPLanFI 40×/0.75 from Olympus www.olympus-lifescience.com) mounted on an Olympus GX71 inverted microscope with a green LED light source with a wavelength of 550 nm (from ThorLabs www.thorlabs.com). Images are recorded with a monochromatic CCD camera with resolution (Grasshopper3, GS3-U3-91S6M-C from Pointgrey www.ptgrey.com) and saved as 8-bit TIFF files. The image sequences are analyzed by in-house-developed scripts in MATLAB (www.mathworks.com) and ImageJ (imagej.nih.gov/ij/).
3. Results
We present in situ images of how the crystal surfaces confined by the glass surface evolve during stable growth conditions. We quantify and summarize the common behavior and display the variations in growth habit that may help us and the reader to interpret the reasons for the variability in quantifiable parameters. To our knowledge, no one has observed such confined crystal growth in situ before, and we therefore also document and quantify behavior that we cannot explain in detail. We focus on two crystals, but more examples of other crystals are documented in the Supplementary Materials, Figures S1–S5 and to videos, CrystalA.avi and CrystalB.avi.
3.1. Interpretation and Quantification of In Situ Image Data
The series of images in Figure 2A shows the growth outwards and upwards of Crystal A at mM (). Dark areas along the rim of the crystal signify areas of contact between the crystal and the glass. The distance h between the crystal and the glass in the contact region varies in the range –50 nm. The area outside the crystal is much brighter on the left and upper side of the crystal than on the lower and right side due to reflections from the different sides of the rhombohedral crystal. This difference in intensity can be used to determine the orientation of the crystal.
Figure 2B shows Crystal A after 26 h with all the former inner boundaries of contact rims drawn in. In the video CrystalA.avi, we drew a line every time the outer rim contact developed a new rim with lower intensity. We observe that the topography of steps at the confined crystal surface are relics of dynamic changes in step flow growth.
The plot of the inner, , and outer, , radius of the crystal as a function of time in Figure 2D (top) shows that the outer surfaces of the crystal grow at a constant rate ( nm/h), while the inner radius of the growth rim, (radius of cavity), moves stepwise. The rim width versus time shown in Figure 2D (middle) therefore repeatedly grows to a maximum of 4–5 m and suddenly jumps to a minimum of 1–2 m. The distance between the crystal growth rim and the glass, h, calculated using Equation (1) is found to increase linearly with rim width, w (Figure 2D, bottom) [24].
Assuming equal growth rate on the top and outer surfaces of the crystal, the distance r from the center of the bottom surface to the outer sides and to the top are approximately equal. The volume of the crystal is therefore approximately . The weight of the crystal resting on the contact areas of the growth rim is therefore , where the crystal density is kg/m and the solution density is kg/m. During the 26 h shown in Figure 2, r grows linearly in time from 9–17 m, and the rim width w fluctuates between approximately one and five micrometers. The contact area is , and the average pressure at the contact surface is , ranging between 0.14 and 2.42 Pa.
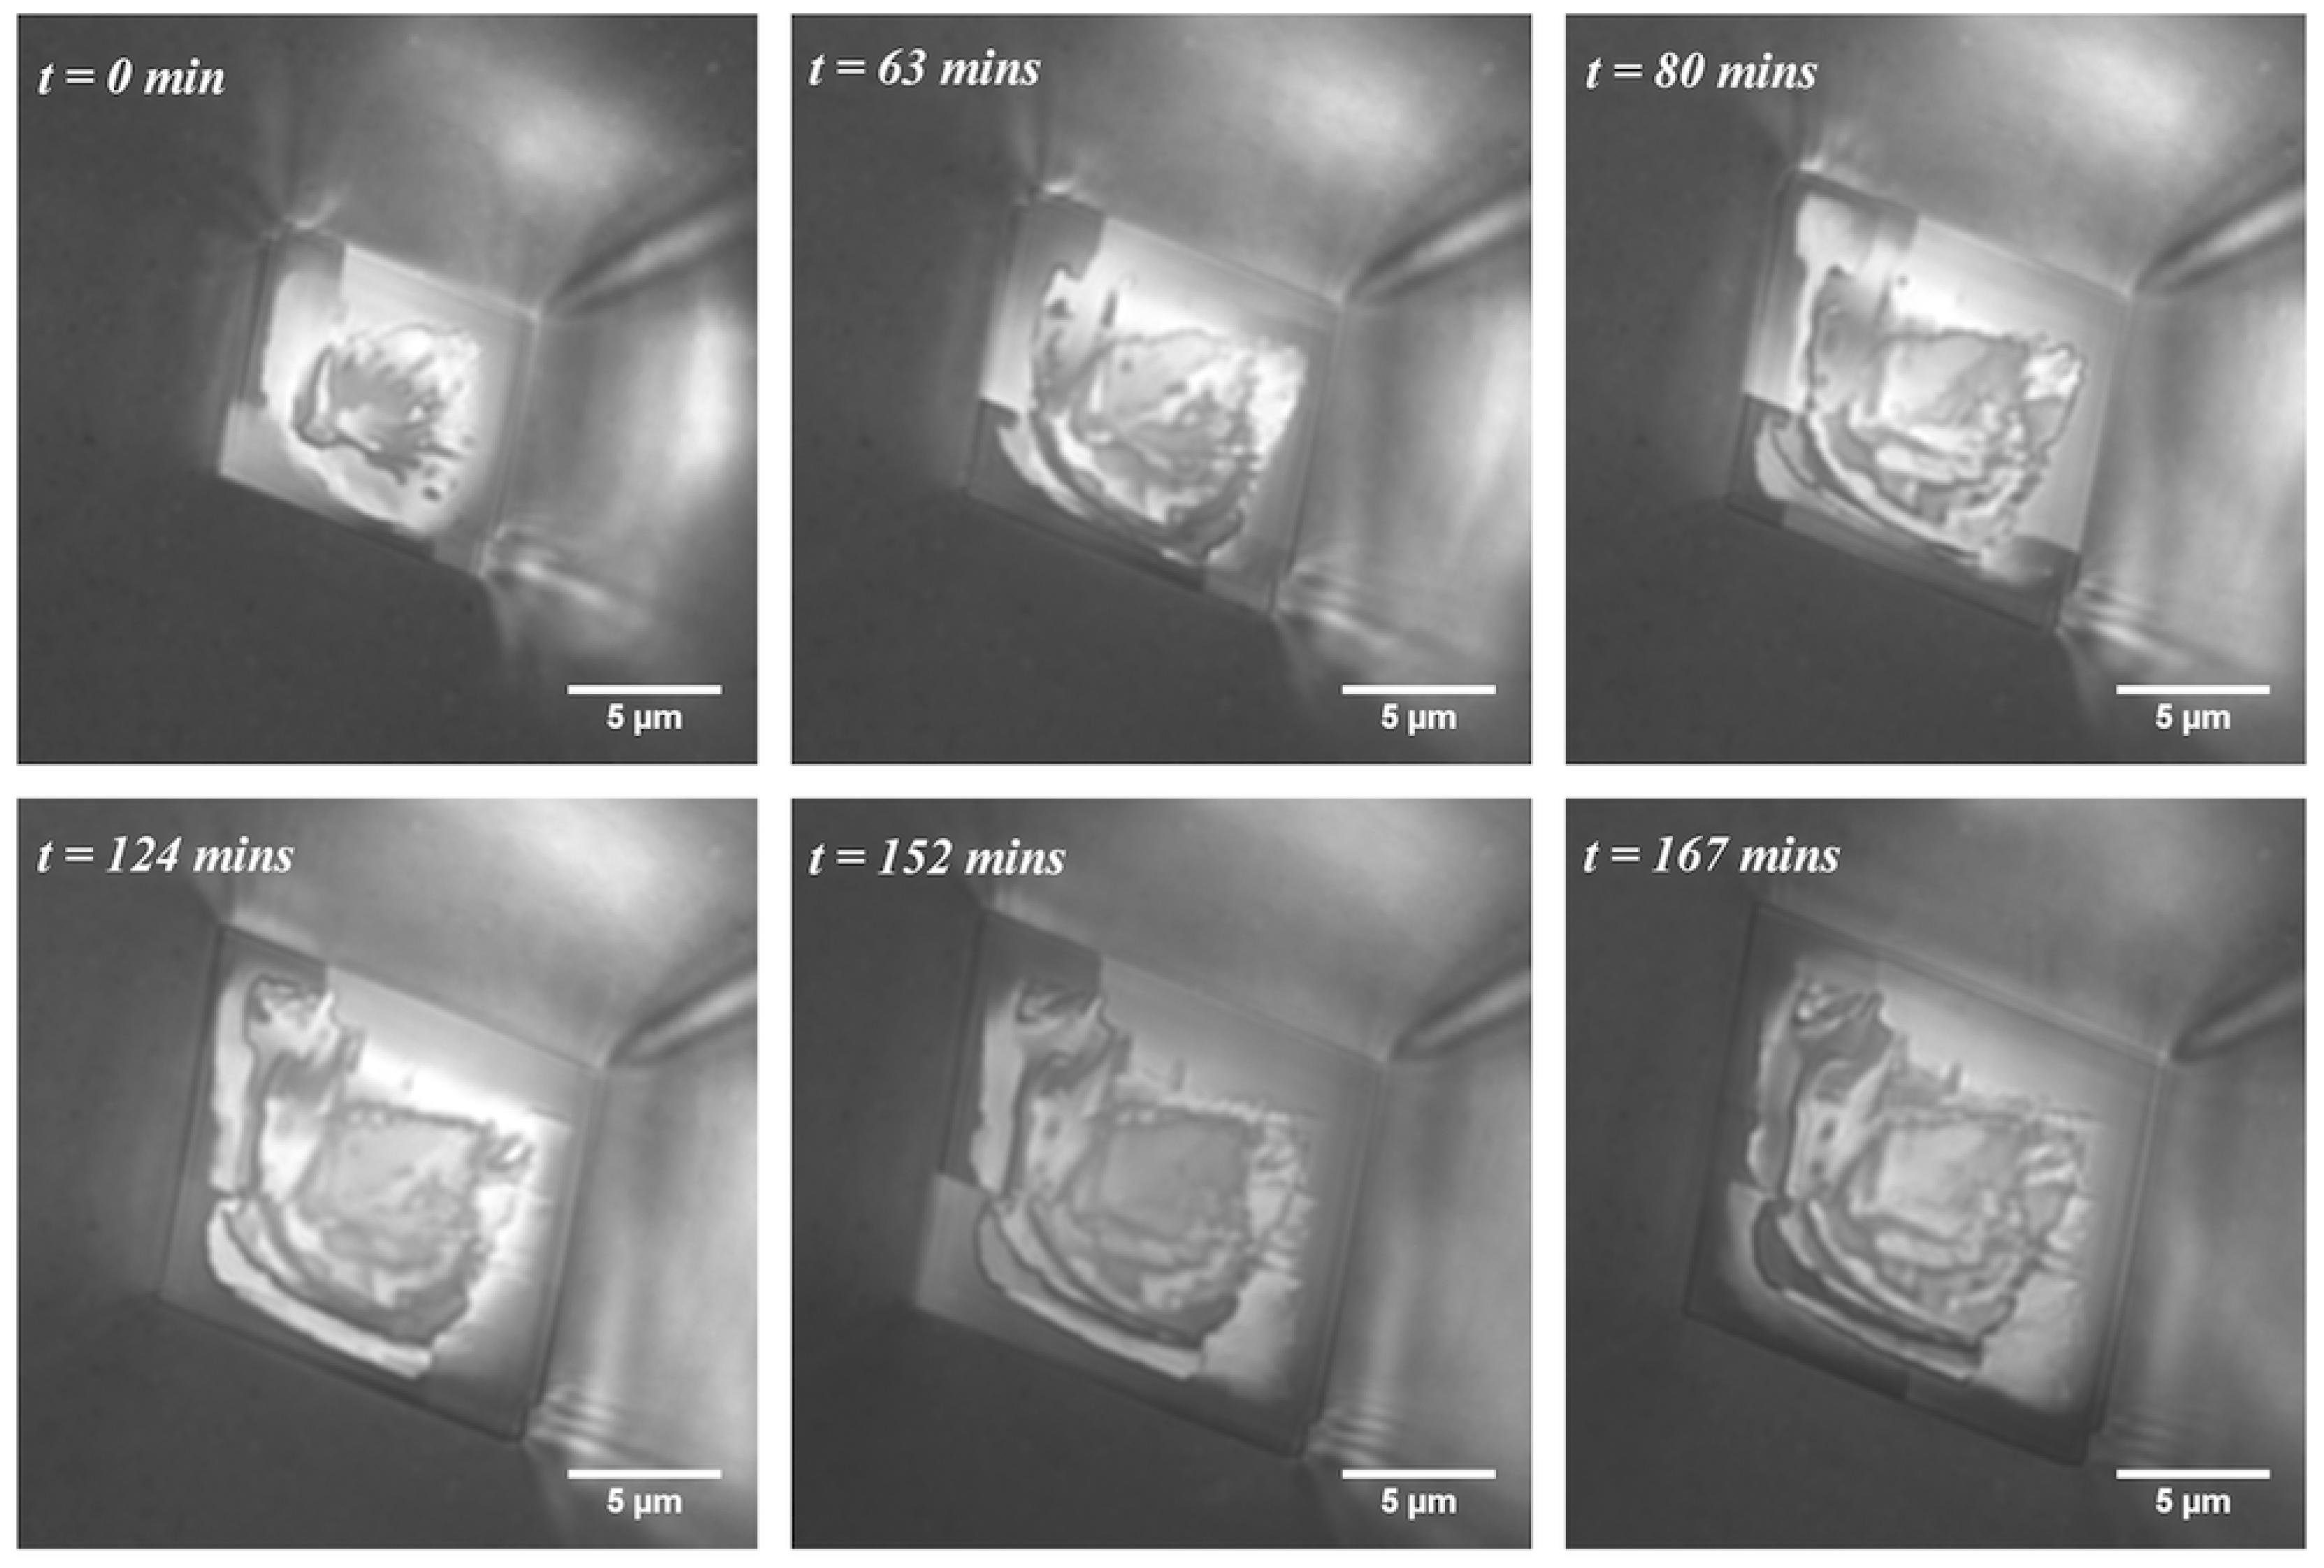
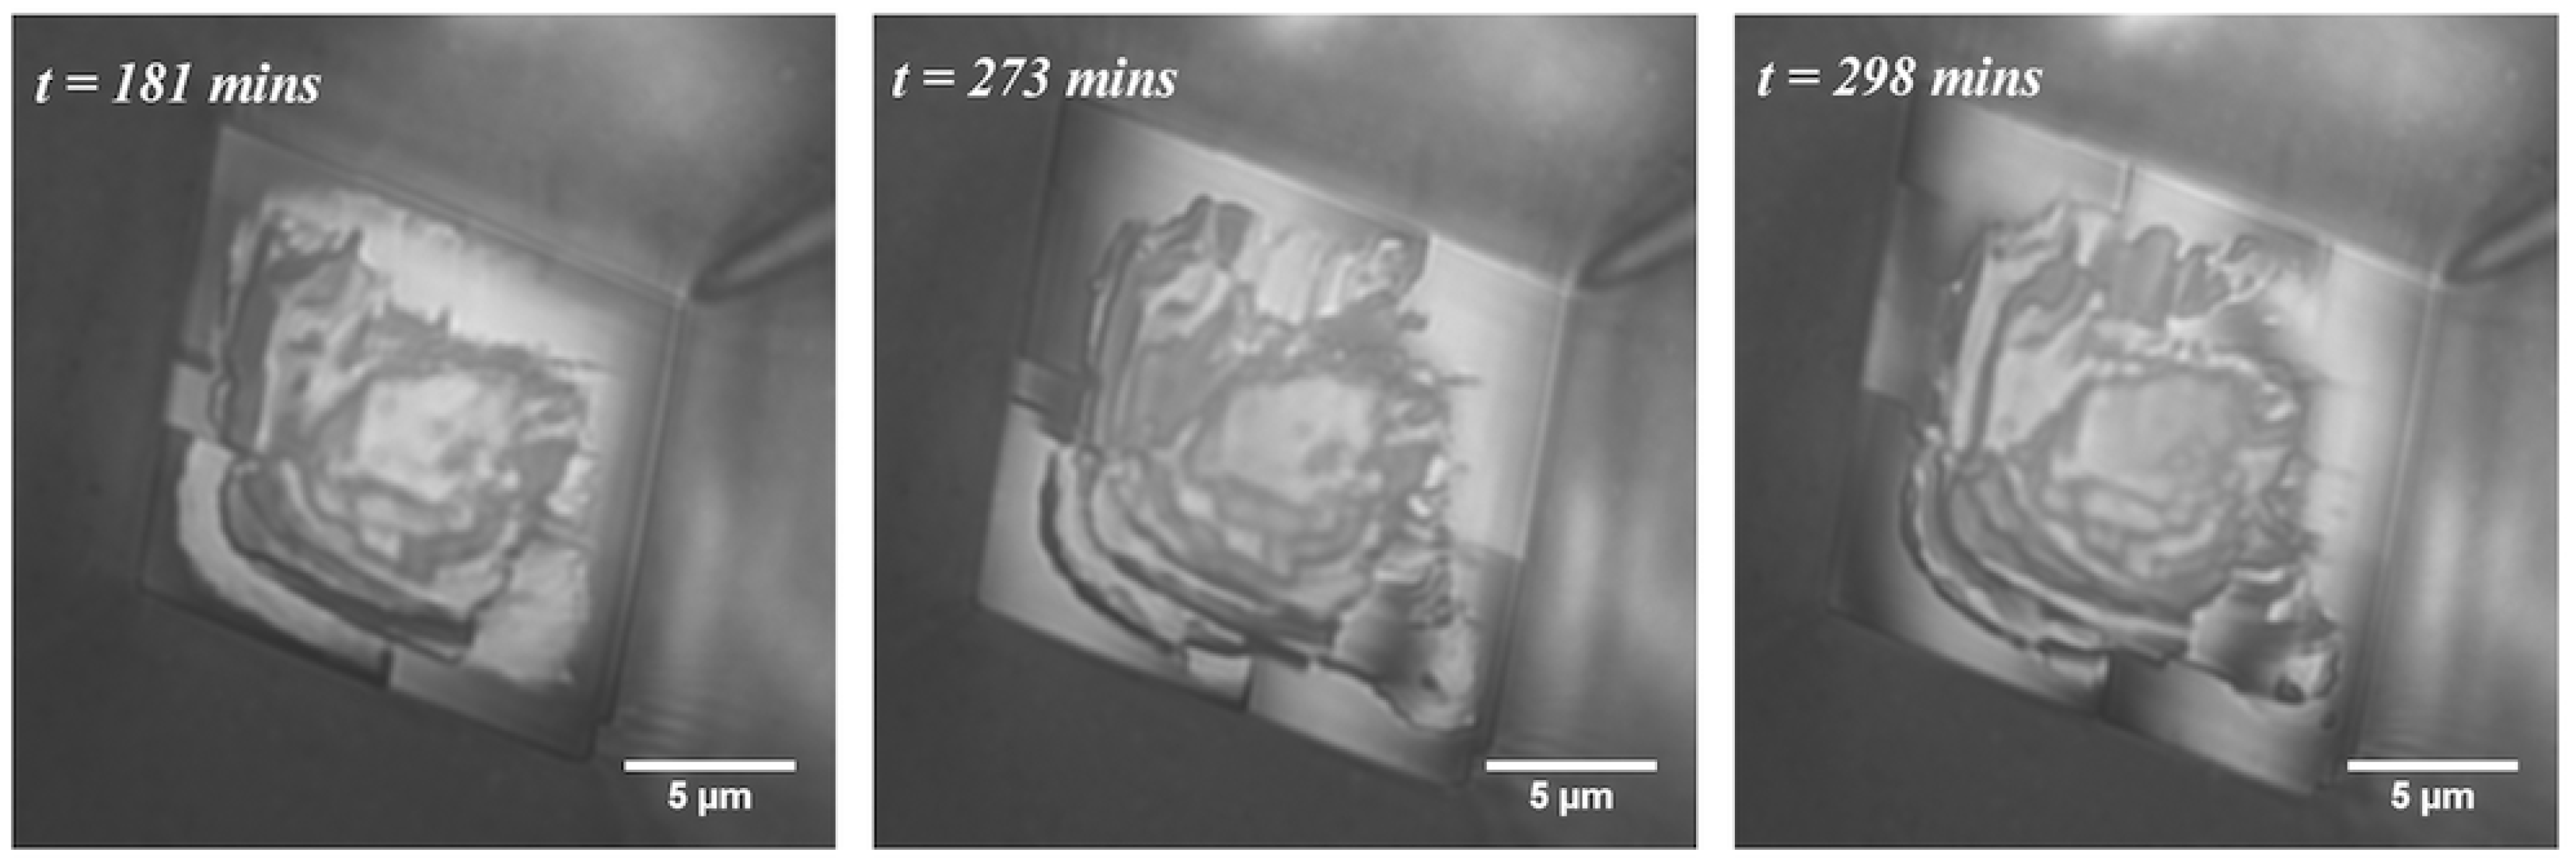
Figure 3 shows in situ images of the confined 104 surface of Crystal B at mM () with a contact rim evolution that is very distinct from Crystal A. Crystals A and B may be considered representatives of two different families of behavior that we have observed in 20–30 crystal growth experiments: smooth rim growth and intermittent rim growth, both with rims actively lifting the crystal. Both rough and smooth rim evolutions occur in the same range of supersaturations 0.4–0.6}.
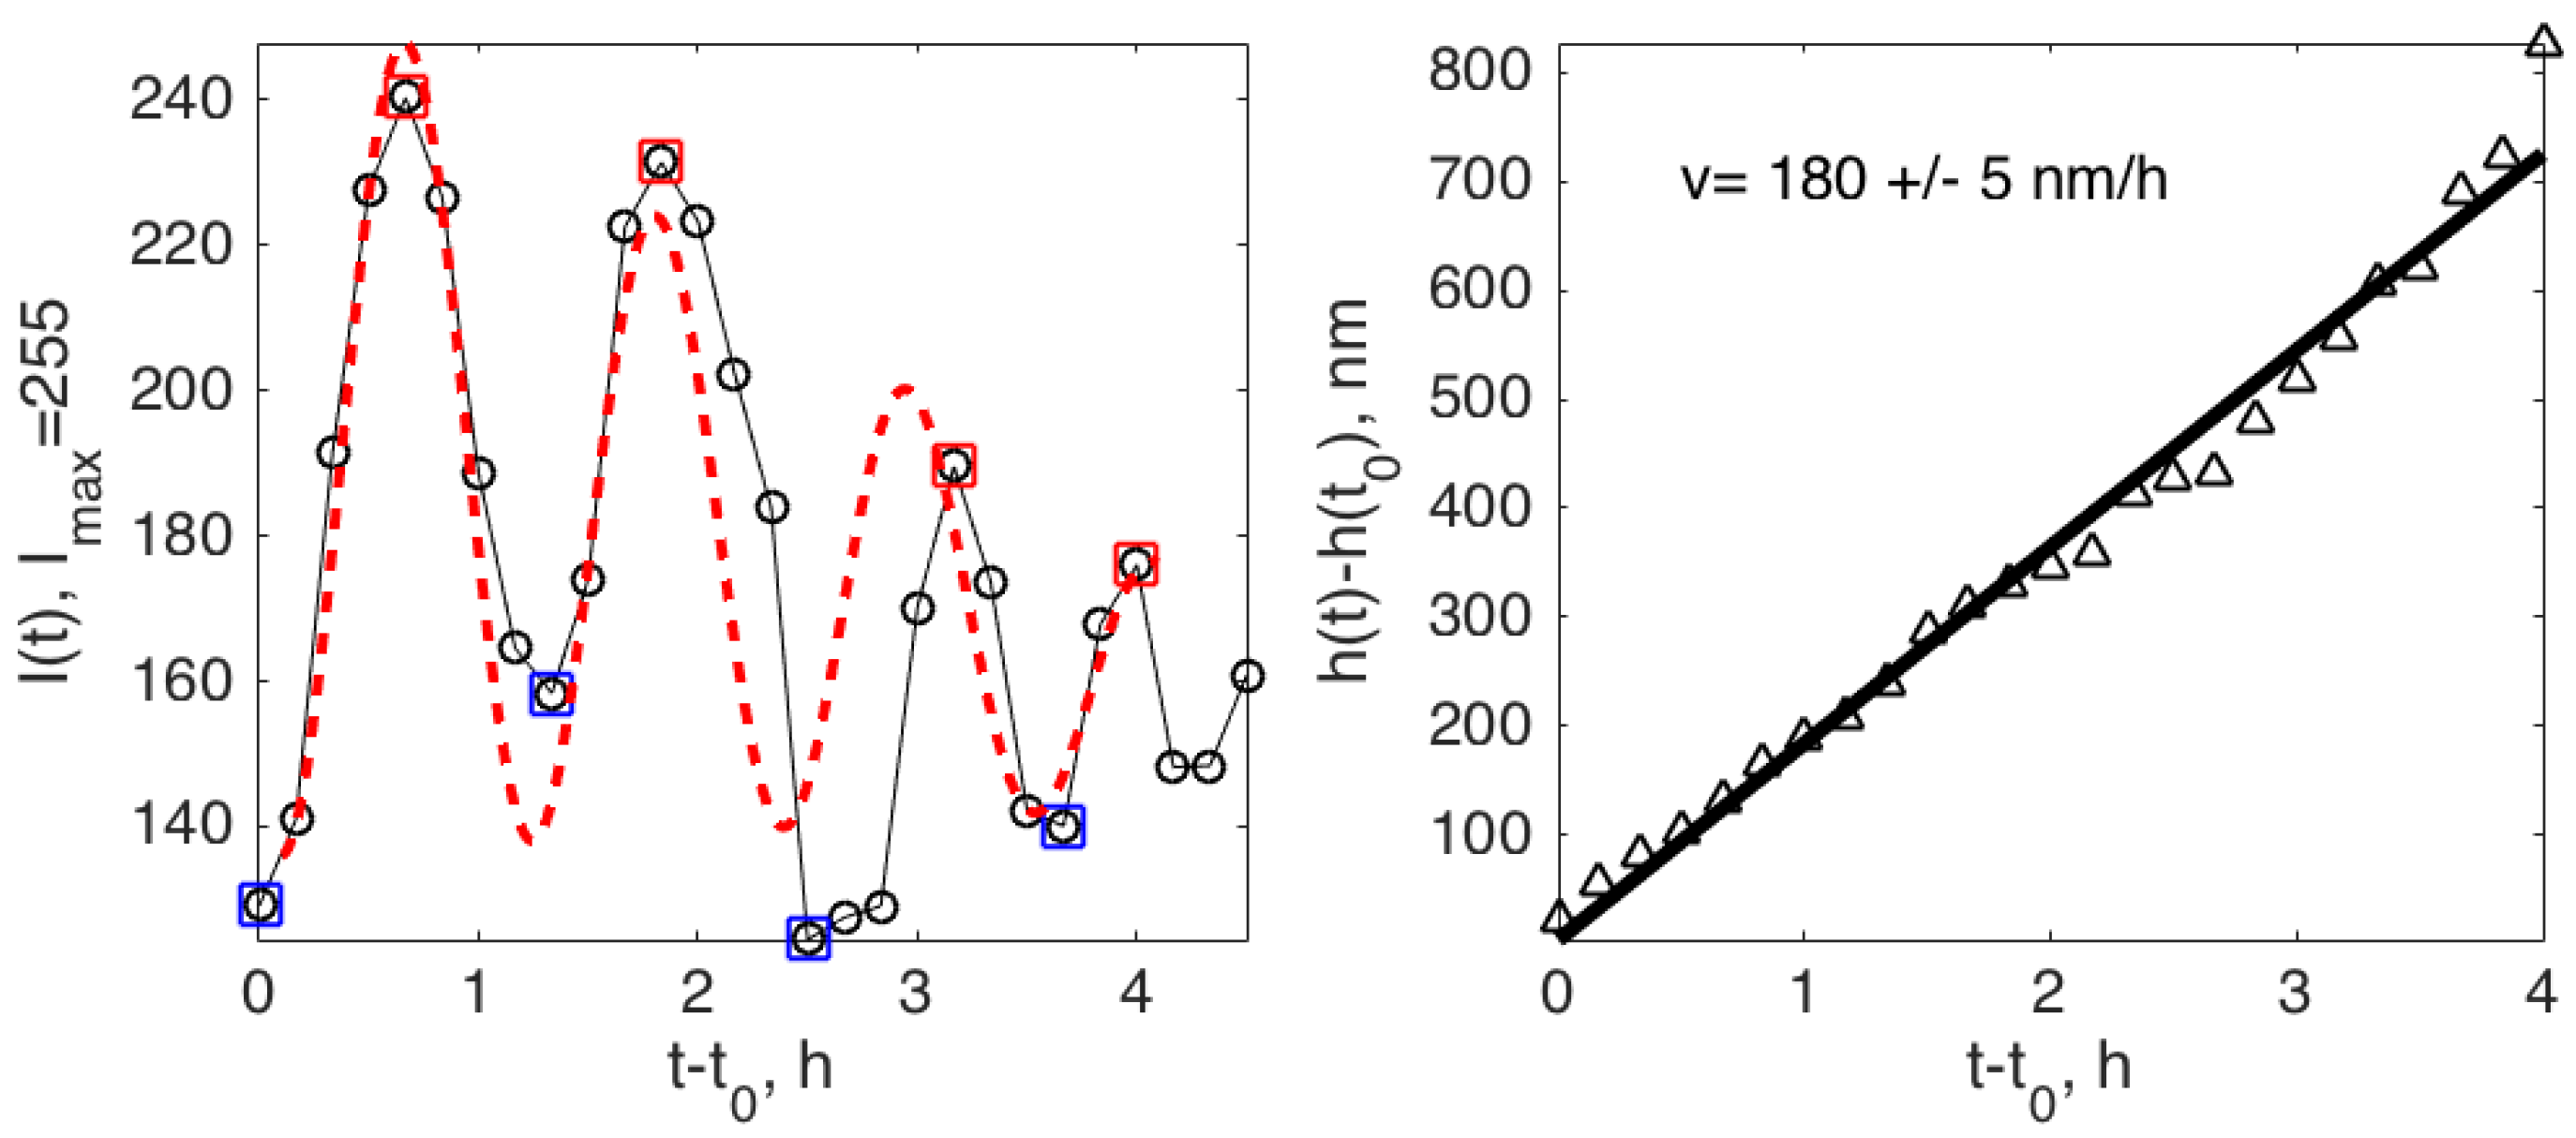
In the image sequences of all crystals (here and in the Supplementary Material), one may observe that crystal surface topography inside the “cavity” is conserved. The fact that the crystal surface inside the cavity does not change indicates that the solution inside the cavity must be at equilibrium with the crystal surface. We can therefore use the vertical motion of the crystal surface inside the cavity (red arrow in Figure 2C) as a measure of the growth rate at the confined crystal surface. In this analysis, we neglect the 10 nm up and down change in crystal-glass distance shown in Figure 2D. We can therefore measure the growth rate of the crystal at the rim by measuring the change of intensity inside the cavity with time. Figure 4 shows intensity data from the middle of Crystal B’s (see Figure 3) surface with time. The minima (blue squares) and maxima (red squares) are used to rescale all intensity data points in between the range : . Using an approximation for low numerical aperture objectives, the distance h between crystal and glass is:
where m is an integer counting the number of periods and the phase shift corresponding to the distance . The right-hand panel of Figure 4 shows the change in height, , calculated using the intensity data shown in the left-hand panel. The least squares fit yields the vertical growth rate with the standard deviation. This value of v is used with a smooth amplitude function to produce the fit (red dashed line) to the original data in the left panel of Figure 4.
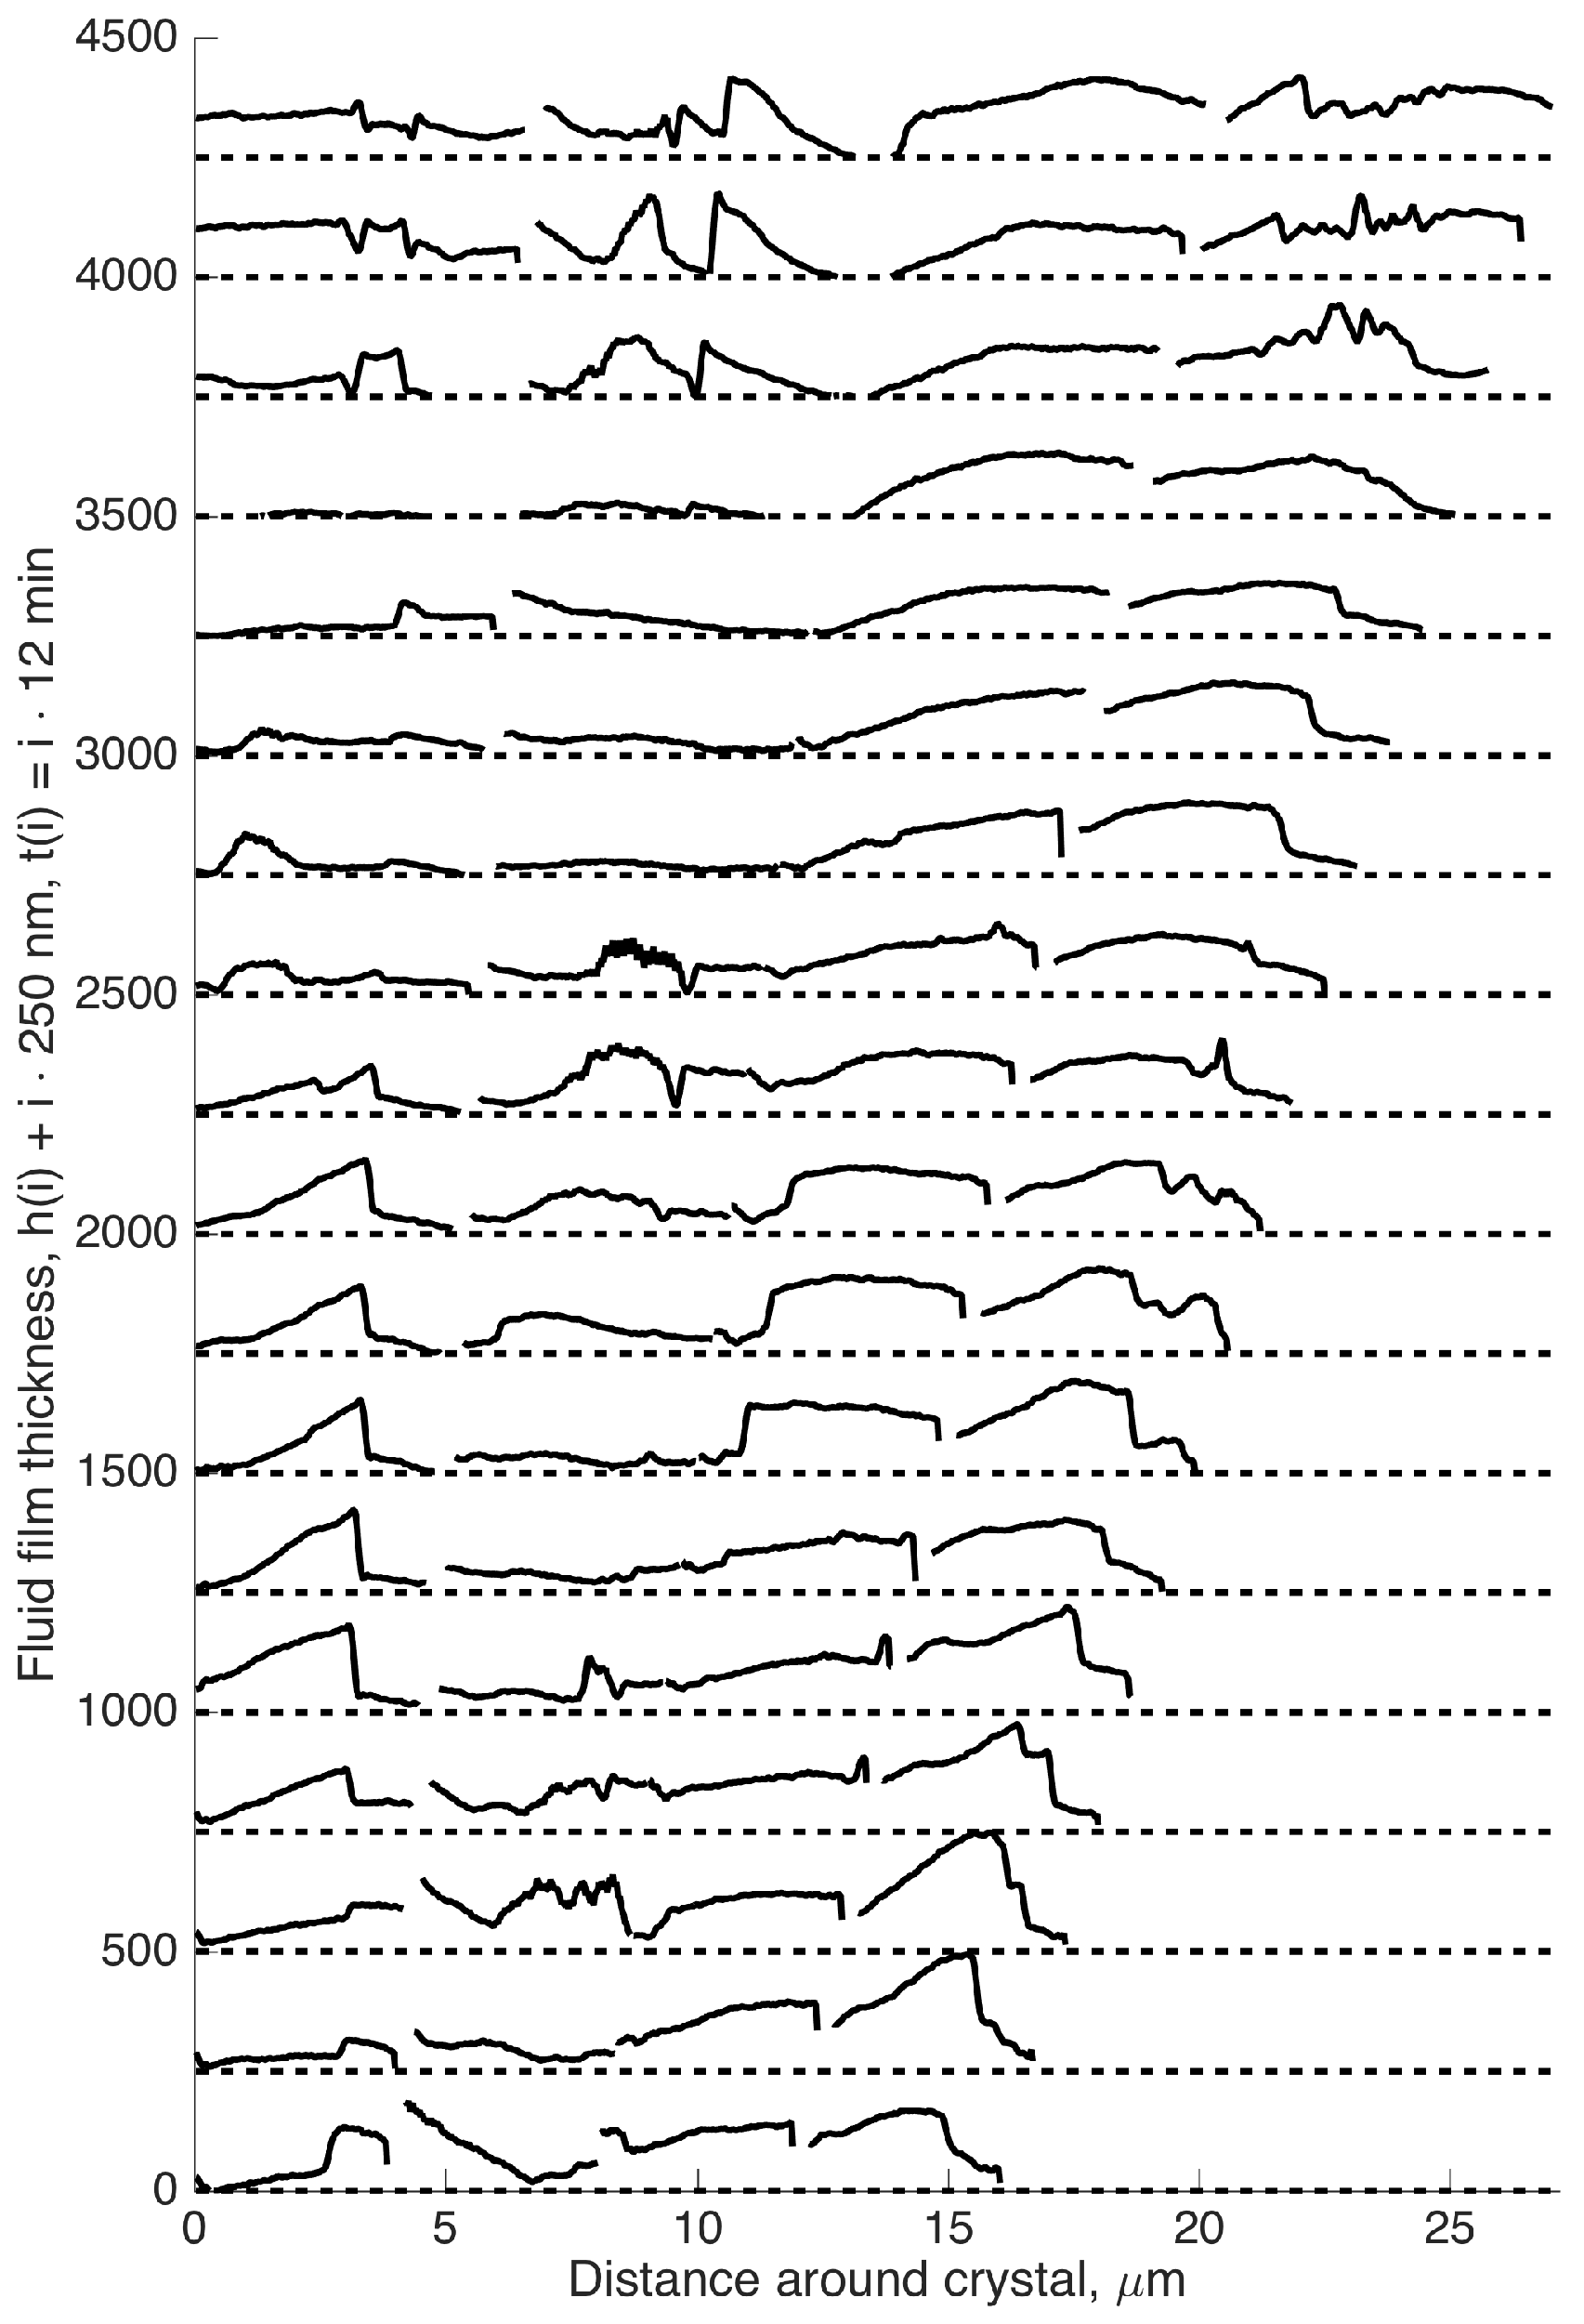
While Crystal A displays a stable, smooth growth rim, confining a fluid film with a uniform thickness of 40–50 nm, the growth rim of Crystal B is rough, with contact areas that move about on the crystal rim and fluid film thicknesses that vary in space and time. The dynamics is illustrated in Figure 5. This complex dynamics of moving contact points and large fluid film thicknesses causes the crystal to tilt and wobble.
The distribution of fluid film thicknesses along the outer crystal rim during 4 h of growth is shown in Figure 6. This distribution shows one peak around 25 nm and another around 90 nm. We consider these height values to have no more than 20% accuracy due to the difficulty of calibrating the height for varying background light conditions at the different edges. The two distinct peaks of the fluid film thickness distribution are robust.
All crystals we have observed have either smooth or rough growth rims. Figure 7 shows that a smooth growth rim can become unstable and roughen. We have only observed this transition from smooth to rough, not from rough to smooth. Thus, in the concentration (supersaturation) interval [0.7, 0.8] ([0.4, 0.6]), both smooth and rough growth rims occur. Rough surfaces change dynamically, “mountains” and “valleys” appearing and disappearing with time. Smooth surfaces may be destabilized to roughen, but this has been observed only for small (<10 m) crystals; larger smooth crystals stay smooth. Thus, the available evidence suggests that below a certain size, a growing crystal may evolve into one of two states, and that state persists.
3.2. Summary of Growth Rates
Table 1 summarizes the growth rates of all the crystals presented in this paper. There is a large variation in growth rates both vertically and outwards at nominally identical conditions. The ratio of the vertical to the outwards growth rates shows that the confined surfaces of crystals that grow in an intermittent fashion grow consistently faster than the smooth contacts (100 % for intermittent and from 7% down to 0% for smooth contacts). Smooth contacts also tend to slow down or stop growing upwards after a certain time. In a recent, similar study, we find, for NaClO, to be about 16% on average [25].
4. Discussion
4.1. Disjoining Pressure: The Hovering Crystal
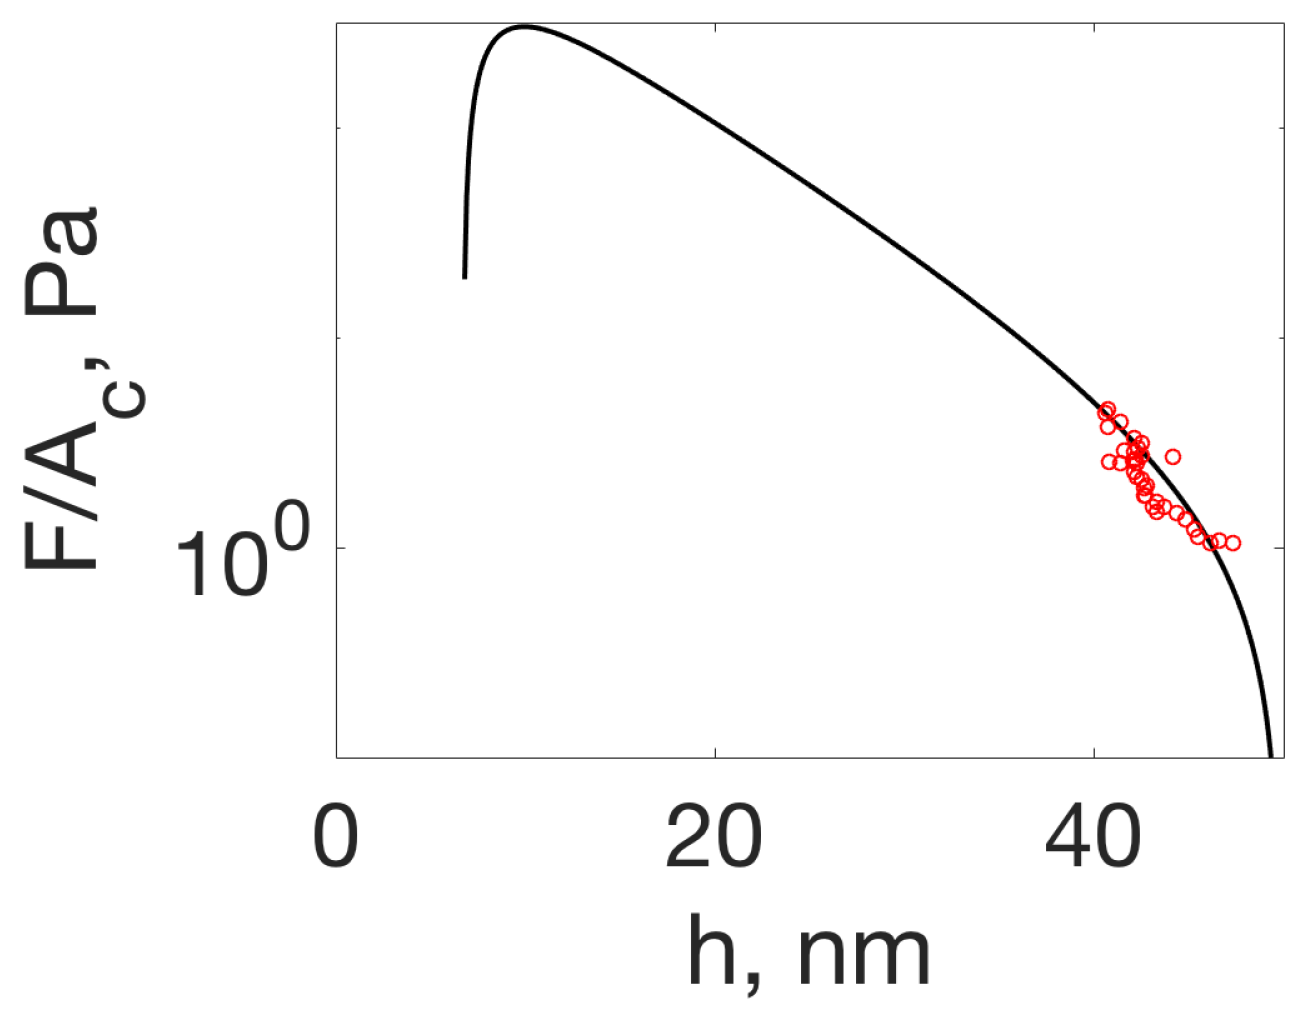
For Crystal A, we calculated the stress at the contact . Using this calculation for the widths shown in Figure 2D and using Equation (1) and the corresponding intensities, we may calculate the disjoining pressure versus fluid film thickness, h. As mentioned, the absolute value of the calculated fluid film thickness has an uncertainty of about nm due to the uncertainty of determining the minimum intensity of the closest contact.
In order to check whether this range of pressures (0.14–2.42 Pa) can be sustained by the disjoining pressure of a fluid film, we have calculated disjoining pressures using the DLVO theory for silica-calcite. We have used Equation (S4) from Diao and Espinosa-Marzal [26] and their parameters for a saturated CaCO solution (0.51 mM Ca) (Tables S1 and S3 in [26]), as well as the Hamaker constant computed by their Equation (S3). The resulting curve in Figure 8 shows the disjoining pressure for silica (calcite together with the pressure) distance data from our experiment. This shows that our stress-distance measurements coincide surprisingly well with the disjoining pressures from DLVO theory. This signifies that as the the width of the growth rim changes (as shown in Figure 2), the change in area of contact and corresponding contact pressure causes the crystal to hover up and down as the fluid film thickness adjusts to where the disjoining pressure balances the contact pressure.
4.2. Smooth and Rough Contacts
The distribution of fluid film thicknesses in Figure 6 is quite remarkable when compared to the disjoining pressure and fluid film thicknesses of Crystal A shown in Figure 8. Over time, about 1/3 of the growth rim of Crystal B has a fluid film thickness, h, less than 50 nm and therefore experiences a non-negligible disjoining pressure. Two thirds of the growth rim are not affected by disjoining pressure and have a larger “gap” to allow more diffusion of ions to the growth rim surface spreading over a larger width w. There is a peak in the distribution at around 25 nm where the disjoining pressure is about 10-times larger than the disjoining pressure that keeps Crystal A (with a smooth rim) hovering above the glass surface. It is easily understandable that a smaller surface carrying the same load needs to sustain a larger pressure.
The rough profiles of the growth rim that we observe in Figure 5 are very similar to the profiles of growth rims measured ex situ by Røyne and Dysthe [11] on NaClO crystals (see Figures 3 and 4 in [11]). These crystals were typically 100-times larger than the CaCO crystals in this study, and the differences in height along the growth rim were up to 10 m, which is 50-times larger than on Crystal B.
What is the cause of some crystals developing a rough contact?
- Dislocations? In some cases, there seems to be growth resembling (atomic) step spirals emanating from larger steps on the surface. However, the fact that the macroscopic steps on the growth rim move around does not match with a screw dislocation normal to the surface.
- Local poisoning of growth by “dirt”, asperities on the glass surface or organic molecules from the PDMS? We have no evidence that the solutions or the PDMS are different in the experiments of smooth vs. rough growth rims. Sometimes, we have observed smooth and rough growth rims on crystals adjacent to each other in the same experiment like Crystals E and F (see the images in the Supplementary Materials). If a surface active contamination adheres to the growing surface, it is likely to be incorporated in the crystal when it continues growing. Then, there would have to be a continuous addition of contamination for rough crystals to keep them rough and no contamination for smooth crystals. If the “contamination” adheres to the glass surface, it would be a constant source of “disturbance” at a fix point in space.
- An inherent transport–growth instability induced by nanoconfinement? The fact that similar roughness is found on growth rims of otherwise perfectly faceted crystals of sodium chlorate [11], potassium alum [16] and calcite (this study) suggests that this is a general nonlinearity/transport–growth feedback mechanism in confinement that arises from random perturbations, be they local contamination, roughness of the support or something else. We have yet to pinpoint the nature of the feedback mechanism and formulate a mathematical model for it.
4.3. Rim Widths of Smooth Rims
In the special case of smooth rims, we may use a simple mass balance argument for the width of the growth rim. Outside the crystal, the ion concentration, c, is held constant. Since there is no growth inside the growth rim, we assume that the concentration there as well is constant, . In order to maintain these conditions, the diffusive current of ions from the solution into the confined fluid film must equal the current of ions to the surface due to growth of the growth rim:
where D is the diffusion coefficient of the ions in the confined fluid, w is the width of the growth rim, h is the thickness of the fluid film and v is the vertical growth rate of the rim. This leads to a relation for the width of a growth rim:
where the first fraction comprises the experimental observables, the second fraction (diffusion coefficient and ratio of solid and liquid densities) is specific to the crystal and is the dimensionless imposed supersaturation. Crystals A, D and G are examples of smooth crystals with vertical growth rates of 20–25 nm/h before the fluid film diminishes and the vertical growth stops. The ratio :
equals one for the theoretical prediction. If we use numbers for Crystal A ( m/s, , m/s and 2000–4000 m), the ratio 5–8. Recent experiments on the ionic crystal NaClO, which has a solubility more than 1000-times larger than CaCO, show that the ratio 1–2 depending on the diffusion coefficient used [25]. This means that although the growth rates are a factor 1000 different and w is around 100 m for NaClO and 4 m for CaCO, the ratio between the expected rim-widths is only 4–5. This means that the mass balance argument for predicting rim widths is reasonable even when solubilities and growth rates vary by many orders of magnitude. It should be noted that we have used the bulk diffusion coefficients. We know that diffusion slows down as the fluid film gets thinner, but this does not give significant reduction in the diffusion coefficient for fluid film thicknesses larger than 10 nm [21,27]. A smaller diffusion coefficient in the fluid film will give a smaller .
4.4. Rim Widths of Rough Rims
As a comparison, we may also calculate for Crystal B using the fluid film thickness in contact, nm, growth rim width, 0.5–2 m, and vertical growth rate, nm/h, yielding 2.5–10. This result, that the ratio is the same for CaCO independent of growth mode, may be a hint of where to find the explanation for the different growth modes. only tells us there should be a balance of fluxes relating h, w and v, but it says nothing about which w (or which h) the crystal should choose. The force on the confined interface at any time is given and is related to the contact area and pressure in the contact: , where is the contact width and is the length of the contact area. The disjoining pressure in the range nm can be simplified to , where Pa and nm. Combining these two expressions, we get a relation for the mechanical stability of the contact relating w and h:
Combining this with Equation (4) gives a relation between the growth rate and the fluid film thickness:
which has a maximum for nm. This is inside the first peak in the fluid film width distribution in Figure 8. This is a surprising result, because intuition tells us that the vertical growth should increase with fluid film thickness h because there is more room for diffusion of ions into the contact. The positive feedback yielding a maximum is due to the fact that the ions diffusing in a thinner film distribute over a narrower contact width.
There is no fundamental reason why a system should choose the highest growth velocity. In fact, we see two types of development: smooth contacts where the vertical growth stops and smooth contacts where some perturbation in the form of a dislocation changes the growth dynamics locally. Any such perturbation leading to a film thickness h closer to will tend to make this part of the crystal grow faster vertically. The contact area growing at maximum speed will outpace the rest of the crystal rim. The next question is then: why are these areas of contact not stable in the sense that they persist at growing faster than the rest of the crystal? Probably, the lower growth rate at nm prevents the closest contacts from “running away” from the rest of the growth rim.
The much faster vertical growth rate of Crystal B (see Figure 3) may thus be explained by the smaller distance h between the contact part of the growth rim and the glass. The observation we have not yet accounted for is why the contact regions move around (see Figure 5) and the crystal tilts this way and that causing the crystal to “wobble” its way up at a remarkably steady pace (see Figure 4).
5. Conclusions
5.1. Summary of Main Results
By combining high stability flow microfluidics and quantitative reflection interference contrast microscopy (RICM), we have been able to grow calcite crystals in a defined region permitting high resolution microscopy, obtaining a high degree of control of solution supersaturation, to measure the growth rates on the free surfaces and at the confined surface of the crystal, to measure quantitatively the topography of the confined crystal surface, to measure the thickness of the fluid film confined between the crystal and the glass support and to quantify a number of novel aspects of confined crystal growth.
Confinement of crystals growing from solution induces transport limitations on the mass flux to the growing crystal surface. The first result of this limitation is the appearance of a cavity where no growth occurs, and an outer rim where growth occurs, causing the crystal to be pushed away from the confining surface.
The growth at the confined growth rim depends on the existence and thickness of a fluid film confined between the crystal and the glass support. The thickness of this fluid film is shown to change with pressure as predicted by the DLVO theory.
We have observed and quantified in situ two main growth modes of confined crystal growth for CaCO that have also been observed ex situ for NaClO: smooth growth rims and rough, intermittently growing growth rims. The smooth rims are flat compared to the vertical resolution of our measurement technique (a few nm). The vertical growth rate of smooth rims tends to slow down with time and crystal size.
Our measurements of the growth rim width and area of contact for smooth rims are consistent with a mathematical model and with the width of growth rims of NaClO crystals that are 10,000-times more soluble than CaCO.
The rough rims have small regions of load bearing contact and larger regions of larger fluid film thickness. The regions of load bearing contacts move around the growth rim, and the growth velocity at any point on the rim is intermittent. This causes a “wobbling” vertical motion of the crystal. The vertical speed is much higher than that of the crystals with smooth growth rims. The instability causing the transition from smooth to rough is not yet understood.
5.2. Outlook
This study shows that confined crystals grow at the outer rim and that this growth rim may be smooth as predicted by Weyl [10] and by a simple model or it may become rough, dynamic, intermittently growing and with an area of contact that is not easily measured. The contact stresses for both the smooth and rough rims agree with disjoining pressure from the DLVO theory. Both smooth rim widths and rough rim topography agree with results for sodium chlorate [11]. This signifies that the phenomena presented here are general for crystal growth in nanoconfinement and not limited to calcite. We have presented strong evidence that the transition from smooth to rough is a generic confinement-induced instability. The results presented here should be a good base for formulating and testing mathematical models of this instability. Such a mathematical model is necessary to understand how crystals of different sizes grow when confined by different surfaces. We need to understand the instability documented here if we are to answer the general question “when does crystallization in confinement lead to stress buildup and damage, and when does crystallization cease due to confinement?” Experiments revealing interface topography at much higher stresses, approaching the thermodynamic limit, will also be necessary to answer this question.
Supplementary Materials
The following are available online at www.mdpi.com/2073-4352/7/12/361/s1: Videos CrystalA.avi and CrystalB.avi and a file with images of the other crystals for which we have presented results. Figure S1: Thirteen hours of growth of Crystal C. The Ca concentration here was 0.8 mM. Flow direction from bottom to top; Figure S2: Sixteen hours of growth of Crystal D. The Ca concentration here was 0.7 mM. Flow direction from bottom to top; Figure S3: Nineteen hours of growth of Crystals E and F. The Ca concentration here was 0.7 mM. This experiment shows the two classes of confined crystal contacts at the same time: intermittent (top) and smooth (bottom). Flow direction from bottom to top; Figure S4: Twenty five hours of growth of Crystal G. The Ca concentration here was 0.7 mM. Flow direction from left to right. The confined contact surface is not a 104 surface; Figure S5: Four hours of growth of Crystal H. The Ca concentration here was 0.7 mM. The crystal seems initially smooth and flat. After 1 h, it develops a “defect” and continues to grow two separate flat surfaces at different heights, and the crystal surface tilts with respect to the glass surface. Flow direction from bottom to top.
Acknowledgments
This project has received funding from the European Union’s Horizon 2020 research and innovation program under the Marie Sklodowska-Curie Grant Agreement No. 642976 (ITN NanoHeal) and from the Norwegian Research Council Grant No. 222386.
Author Contributions
Lei Li designed and performed the experiments, analyzed the data and contributed to writing the paper. Dag Kristian Dysthe conceived of and designed the experiments, analyzed the data and wrote the paper. Anja Røyne and Felix Kohler contributed to the analysis of the data and writing the paper.
Conflicts of Interest
The authors declare no conflict of interest.
Abbreviations
The following abbreviations are used in this manuscript:
| RICM | Reflection interference contrast microscopy |
| PDMS | Polydimethylsiloxane |
| PGMEA | Propylene glycol methyl ether acetate |
| LED | Light-emitting diode |
References and Notes
- Wilkinson, B.H. Biomineralization, paleoceanography, and the evolution of calcareous marine organisms. Geology 1979, 7, 524–527. [Google Scholar] [CrossRef]
- Stephens, C.J.; Ladden, S.F.; Meldrum, F.C.; Christenson, H.K. Amorphous Calcium Carbonate is Stabilized in Confinement. Adv. Funct. Mater. 2010, 20, 2108–2115. [Google Scholar] [CrossRef]
- Gratier, J.-P.; Dysthe, D.K.; Renard, F. The role of pressure solution creep in the ductility of the Earth’s upper crust. Adv. Geophys. 2013, 54, 47–179. [Google Scholar]
- Flatt, R.J.; Caruso, F.; Sanchez, A.M.A.; Scherer, G.W. Chemo-mechanics of salt damage in stone. Nat. Commun. 2014, 5, 4823. [Google Scholar] [CrossRef] [PubMed]
- Chang, C.F.; Chen, J.W. The experimental investigation of concrete carbonation depth. Cem. Concr. Res. 2006, 36, 1760–1767. [Google Scholar] [CrossRef]
- Rothrock, E.P. On the force of crystallization of calcite. J. Geol. 1925, 33, 80–83. [Google Scholar] [CrossRef]
- Gratier, J.P.; Frery, E.; Deschamps, P.; Røyne, A.; Renard, F.; Dysthe, D.; Ellouz-Zimmerman, N.; Hamelin, B. How travertine veins grow from top to bottom and lift the rocks above them: The effect of crystallization force. Geology 2012, 40, 1015–1018. [Google Scholar] [CrossRef]
- Gibbs, J.W. Scientific Papers of J. Willard Gibbs, Volume 1: Thermodynamics; Longmans, Green and co.: Harlow, UK, 1906. [Google Scholar]
- Correns, C.W. Growth and dissolution of crystals under linear pressure. Discuss. Faraday Soc. 1949, 5, 267–271. [Google Scholar] [CrossRef]
- Weyl, P.K. Pressure solution and the force of crystallization: A phenomenological theory. J. Geophys. Res. 1959, 64, 2001–2025. [Google Scholar] [CrossRef]
- Røyne, A.; Dysthe, D.K. Rim formation on crystal faces growing in confinement. J. Cryst. Growth 2012, 346, 89–100. [Google Scholar] [CrossRef]
- Espinosa-Marzal, R.M.; Scherer, G.W. Advances in understanding damage by salt crystallization. Acc. Chem. Res. 2010, 43, 897–905. [Google Scholar] [CrossRef] [PubMed]
- Noiriel, C.; Renard, F.; Doan, M.L.; Gratier, J.P. Intense fracturing and fracture sealing induced by mineral growth in porous rocks. Chem. Geol. 2010, 269, 197–209. [Google Scholar] [CrossRef]
- Wheeler, J. Dramatic effects of stress on metamorphic reactions. Geology 2014, 42, 647–650. [Google Scholar] [CrossRef]
- Schmalholz, S.M.; Podladchikov, Y. Metamorphism under stress: The problem of relating minerals to depth. Geology 2014, 42, 733–734. [Google Scholar] [CrossRef]
- Becker, G.F.; Day, A.L. The linerar force of growing crystals. Proc. Wash. Acad. Sci. 1905, 7, 283–288. [Google Scholar]
- Taber, S. The growth of crystals under external pressure. Am. J. Sci. 1916, 41, 532–556. [Google Scholar] [CrossRef]
- Flatt, R.J.; Steiger, M.; Scherer, G.W. A commented translation of the paper by C.W. Correns and W. Steinborn on crystallization pressure. Environ. Geol. 2007, 52, 221–237. [Google Scholar] [CrossRef]
- It should be noted that Correns stated that sodium chlorate did not crystallize in confinement to produce work, whereas Røyne and Dysthe [11] did measure such work, although the rates of growth were very small. It is also worth noting that all studies before Røyne and Dysthe [11] were performed using hydrated salts, while sodium chlorate, as calcite in this study, does not consist of hydrated salts.
- Israelachvili, J.N. Intermolecular and Surface Forces; Academic Press: Cambridge, MA, USA, 2011; p. 674. [Google Scholar]
- Dysthe, D.K.; Renard, F.; Porcheron, F.; Rousseau, B. Fluid in mineral interfaces—Molecular simulations of structure and diffusion. Geophys. Res. Lett. 2002, 29, 13–14. [Google Scholar] [CrossRef]
- Li, L.; Sanchez, J.R.; Kohler, F.; Røyne, A.; Dysthe, D.K. Microfluidic control of nucleation and growth of calcite. arXiv, 2017; arXiv:1708.06299. [Google Scholar]
- Ploem, J.S. Reflection-contrast microscopy as a tool for investigation of the attachment of living cells to a glass surface. In Mononuclear Phagocytes in Immunity, Infection and Pathology; Furth, R.V., Ed.; Blackwell Scientific Publications: Oxford, UK, 1975; pp. 405–421. [Google Scholar]
- The value of h depends on an estimate of the minimum intensity attainable in the contact and the maximum value recorded for the constructive interference, and we consider the accuracy to be about ±10 nm. The dependence of h on intensity is more accurate because the total intensity range has an accuracy better than 10%. This means that the height data in Figure 2 is accurate to ±10 nm, and the slope that these points form (dP/dh in Figure 2) is accurate to 10%.
- Kohler, F.; Dysthe, D.K.; Gagliardi, L.; Pierre-Louis, O. Cavity formation in confined growing crystals. Phys. Rev. Lett. 2017. under review. [Google Scholar]
- Diao, Y.; Espinosa-Marzal, R.M. Molecular insight into the nanoconfined calcite-solution interface. Proc. Natl. Acad. Sci. USA 2016, 113, 12047–12052. [Google Scholar] [CrossRef] [PubMed]
- Using the data in Dysthe et al. [21], the diffusion coefficient in a confined fluid film of thickness h is D(h) = D(h = ∞)(1 − e−h/h0), where h0 = 5.6 nm.
Figure 1.
Controlled growth of calcite crystals in a microfluidic device studied by reflection interference contrast microscopy (RICM). (Left) Top view of the microfluidic channel showing how fluids are introduced and mixed to ensure stable supersaturation at the crystal surfaces. The microfluidic device rests on an inverted microscope to allow high resolution imaging of the crystal in situ during growth. The crystal grows on all surfaces, but the surface studied here is confined by the glass surface on which the crystal rests. (Right) Principle of RICM. The crystal is illuminated from the bottom, which is illustrated here by the electric field, , of the incident light. Due to the interference of the light reflected by the crystal-water interface, , with the light reflected by the glass-water interface, , the detected intensity, , depends on the distance, h, between the two interfaces and on the wavelength of the light, . Exemplary RICM images of a calcite crystal using a blue LED (left half) and a green LED (right half) are shown at the bottom. The fringes align at the outer part (rim) of the crystal, but differ for larger distances h towards the central part of the confined interface.
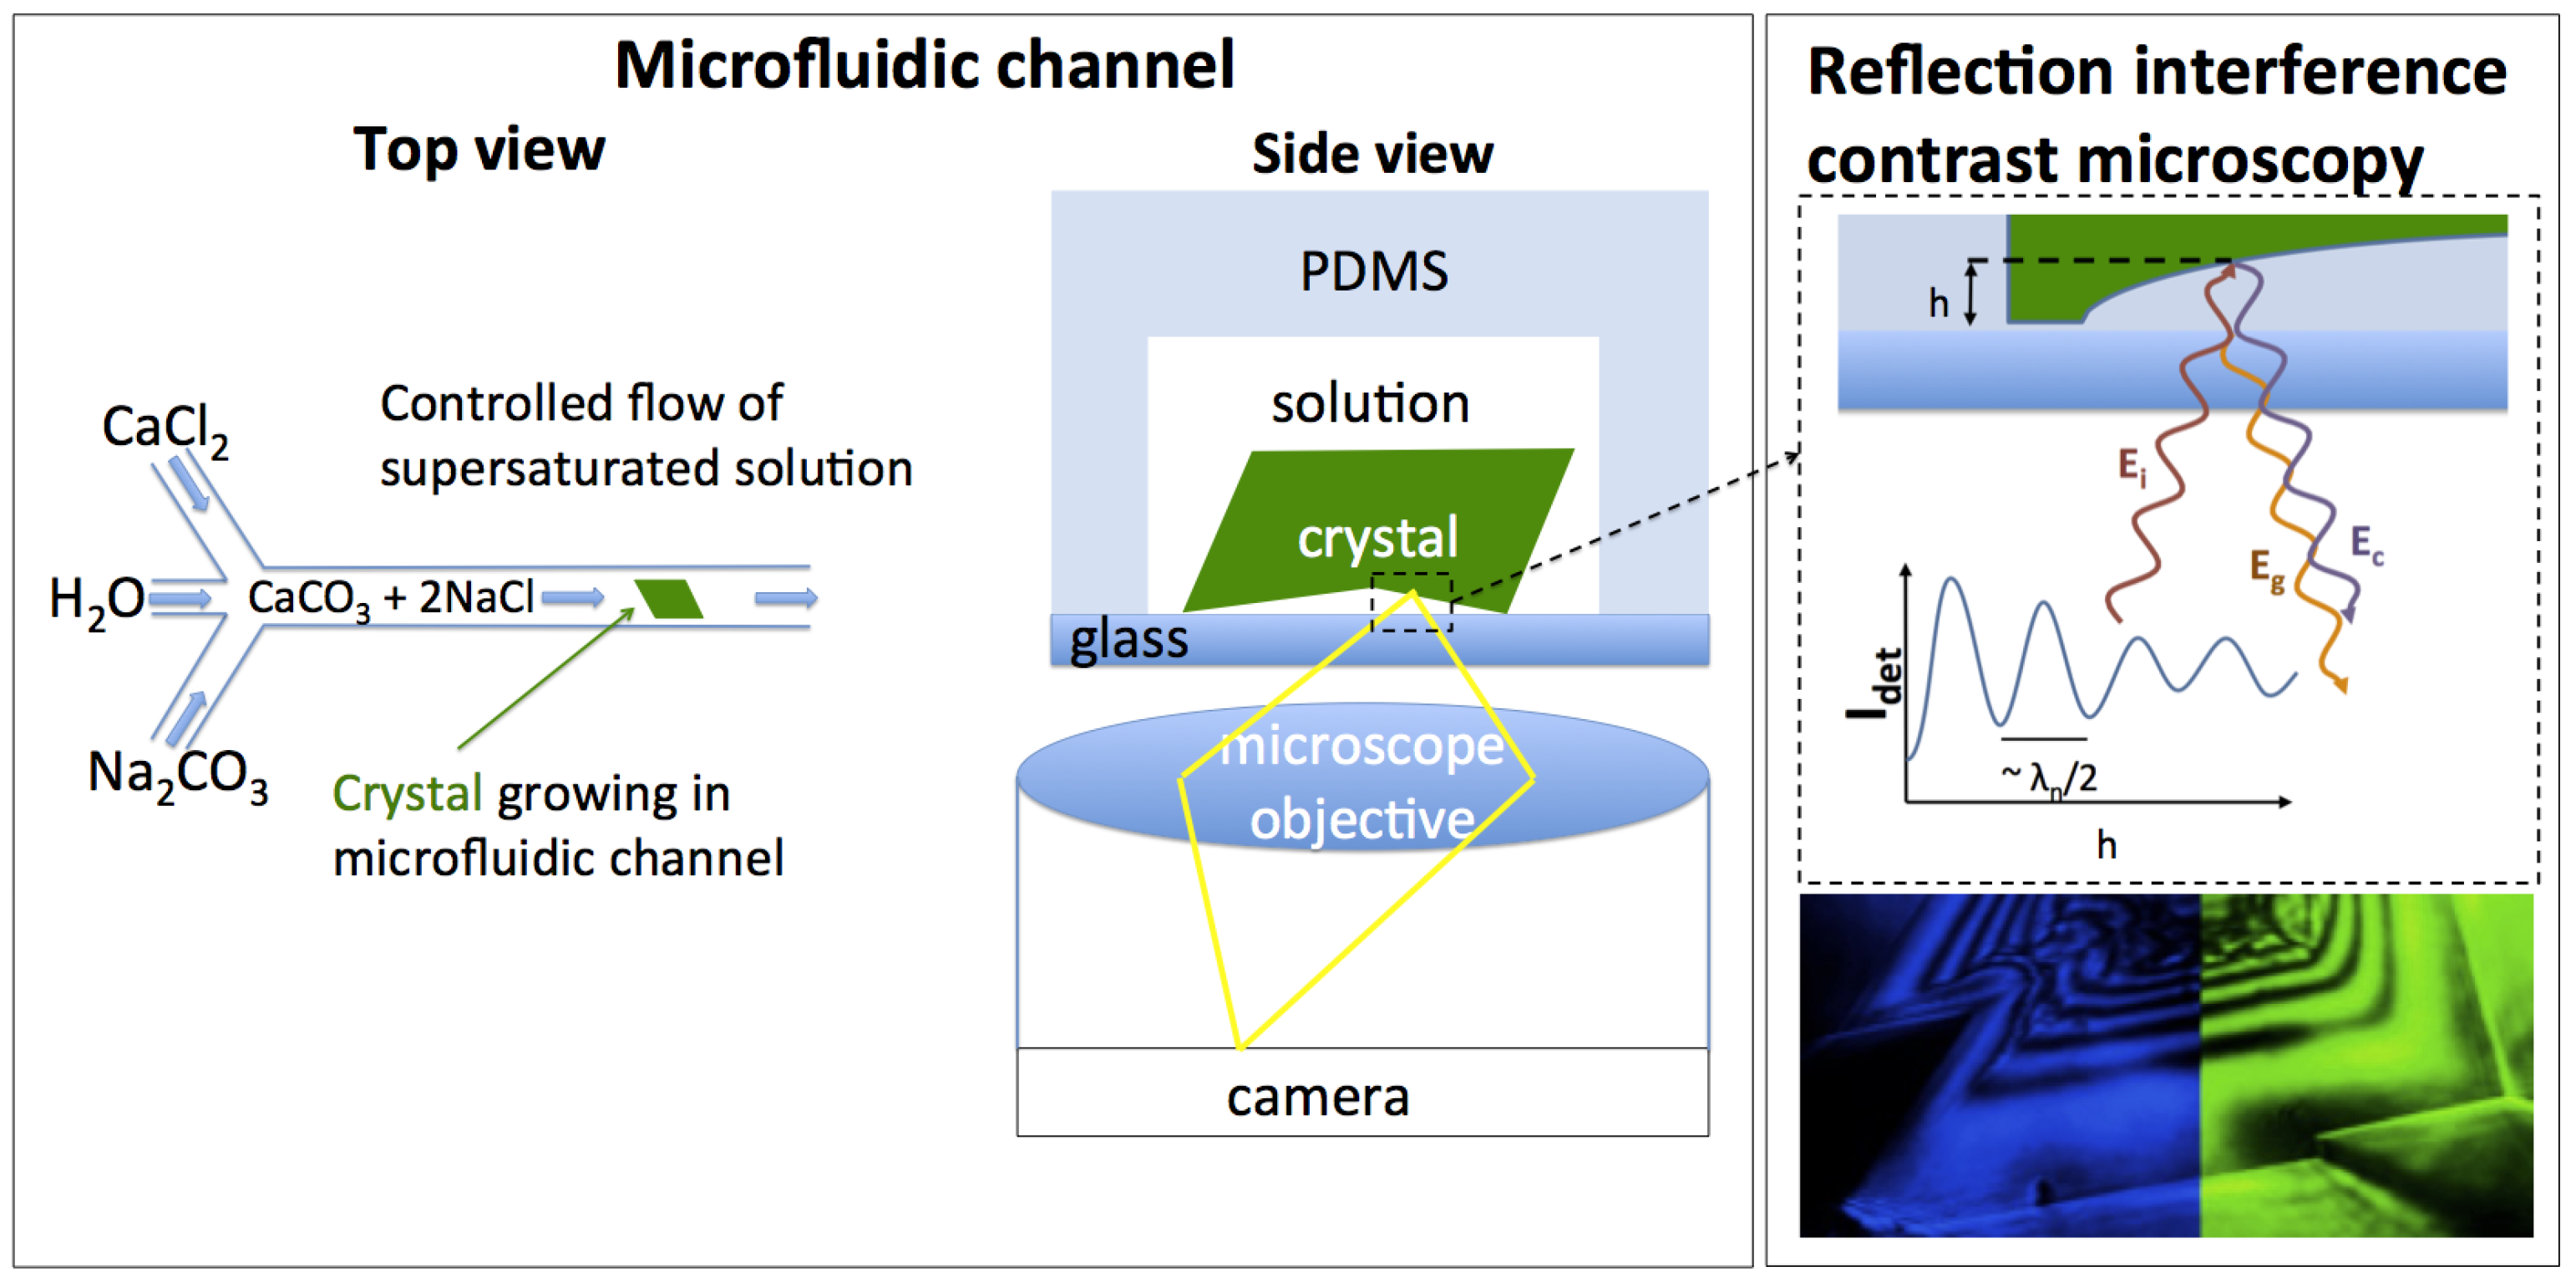
Figure 2.
In situ imaging of 26 h of growth of Crystal A, raw data and interpretations: , flow direction bottom to top. (A) In situ images of the growing 104 calcite crystal surface confined by glass, imaged from below (see Figure 1). For a full time-lapse movie of the same crystal, see the movie CrystalA.avi. The crystal outline is marked by a dashed line. Dark areas along the rim of the crystal (between the dashed line and whole drawn line in the image at 4 h) signify areas of contact between crystal and glass. The bright, diffuse areas to the left and above the crystal are reflections from the two rhombohedral crystal sides that “overhang” the contact. The time is an arbitrary reference time. (B) Top: Lines of the inner rim edge position of Crystal A at different times are drawn on the final crystal surface. Middle: Intensity in the image along the green line. Bottom: A sketch of a cut through the crystal along the green line showing the profile of the confined crystal surface. Vertical lines are drawn connecting the image, the intensity plot and the interpreted profile. (C) Interpretation of the image sequence in (A). The crystal grows (black arrows) freely on the top and outer surfaces, as well as on the lower surface confined by the glass, causing the crystal to be lifted upwards (red arrow). There is no growth of the crystal in the cavity that forms inside the rim; (D) Top: Inner, , and outer, , radius the of crystal as a function of time. Middle: Rim width, , versus time. Bottom: Rim width versus distance to glass surface, h.

Figure 3.
Six hours of growth of Crystal B at = 0.4. Dark areas along the rim of the crystal signify areas of contact between crystal and glass. One observes that for Crystal B, these contact areas move intermittently from place to place along the rim with time.
Figure 3.
Six hours of growth of Crystal B at = 0.4. Dark areas along the rim of the crystal signify areas of contact between crystal and glass. One observes that for Crystal B, these contact areas move intermittently from place to place along the rim with time.


Figure 4.
(Left) Intensity in the middle of Crystal B’s (see Figure 3) surface with time. Circles denote data from images; blue and red squares are data points used to rescale the amplitude before applying arcsine. The red dashed line shows the fit to data. (Right) Triangles’ height is calculated from intensity data as a function of time, and the black line is the least squares fit.

Figure 5.
Profiles of the crystal: glass distance (fluid film thickness), h, around the rim of Crystal B at different times. Each new profile is shifted 250 nm up to separate them.
Figure 5.
Profiles of the crystal: glass distance (fluid film thickness), h, around the rim of Crystal B at different times. Each new profile is shifted 250 nm up to separate them.

Figure 6.
Probability distribution of fluid film thicknesses along the rim of Crystal B.
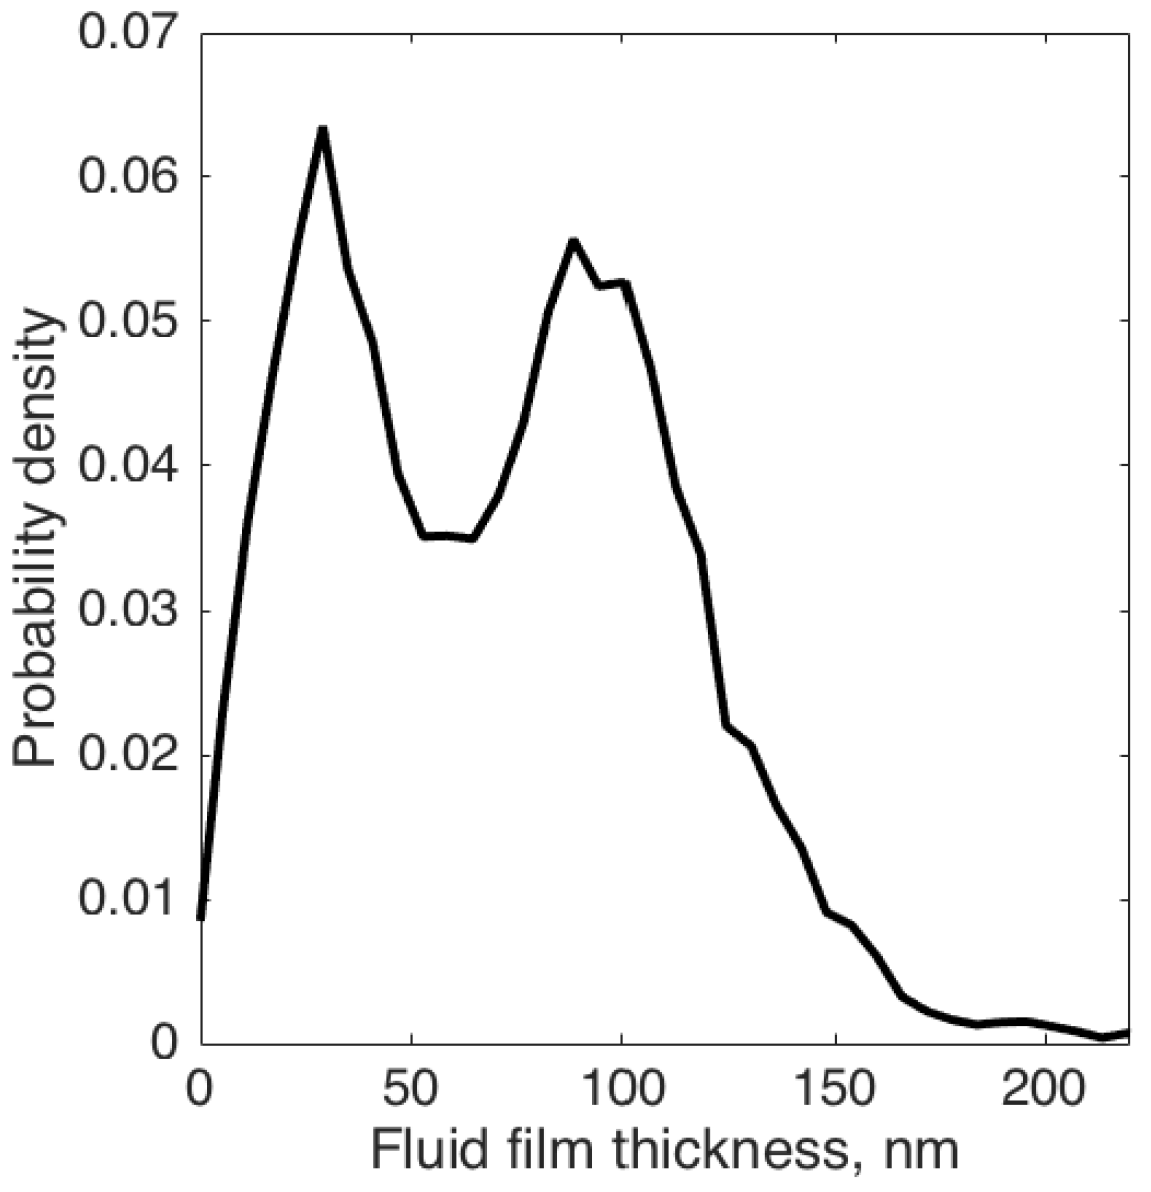
Figure 7.
Evolution from smooth to rough growth rim for Crystal H at = 0.6. The images are m, and the time between images is 6 min. The figure shows height profiles along the white line in the images demonstrating how the initially smooth, flat surface develops a “protrusion” pushing the crystal up and tilting it.
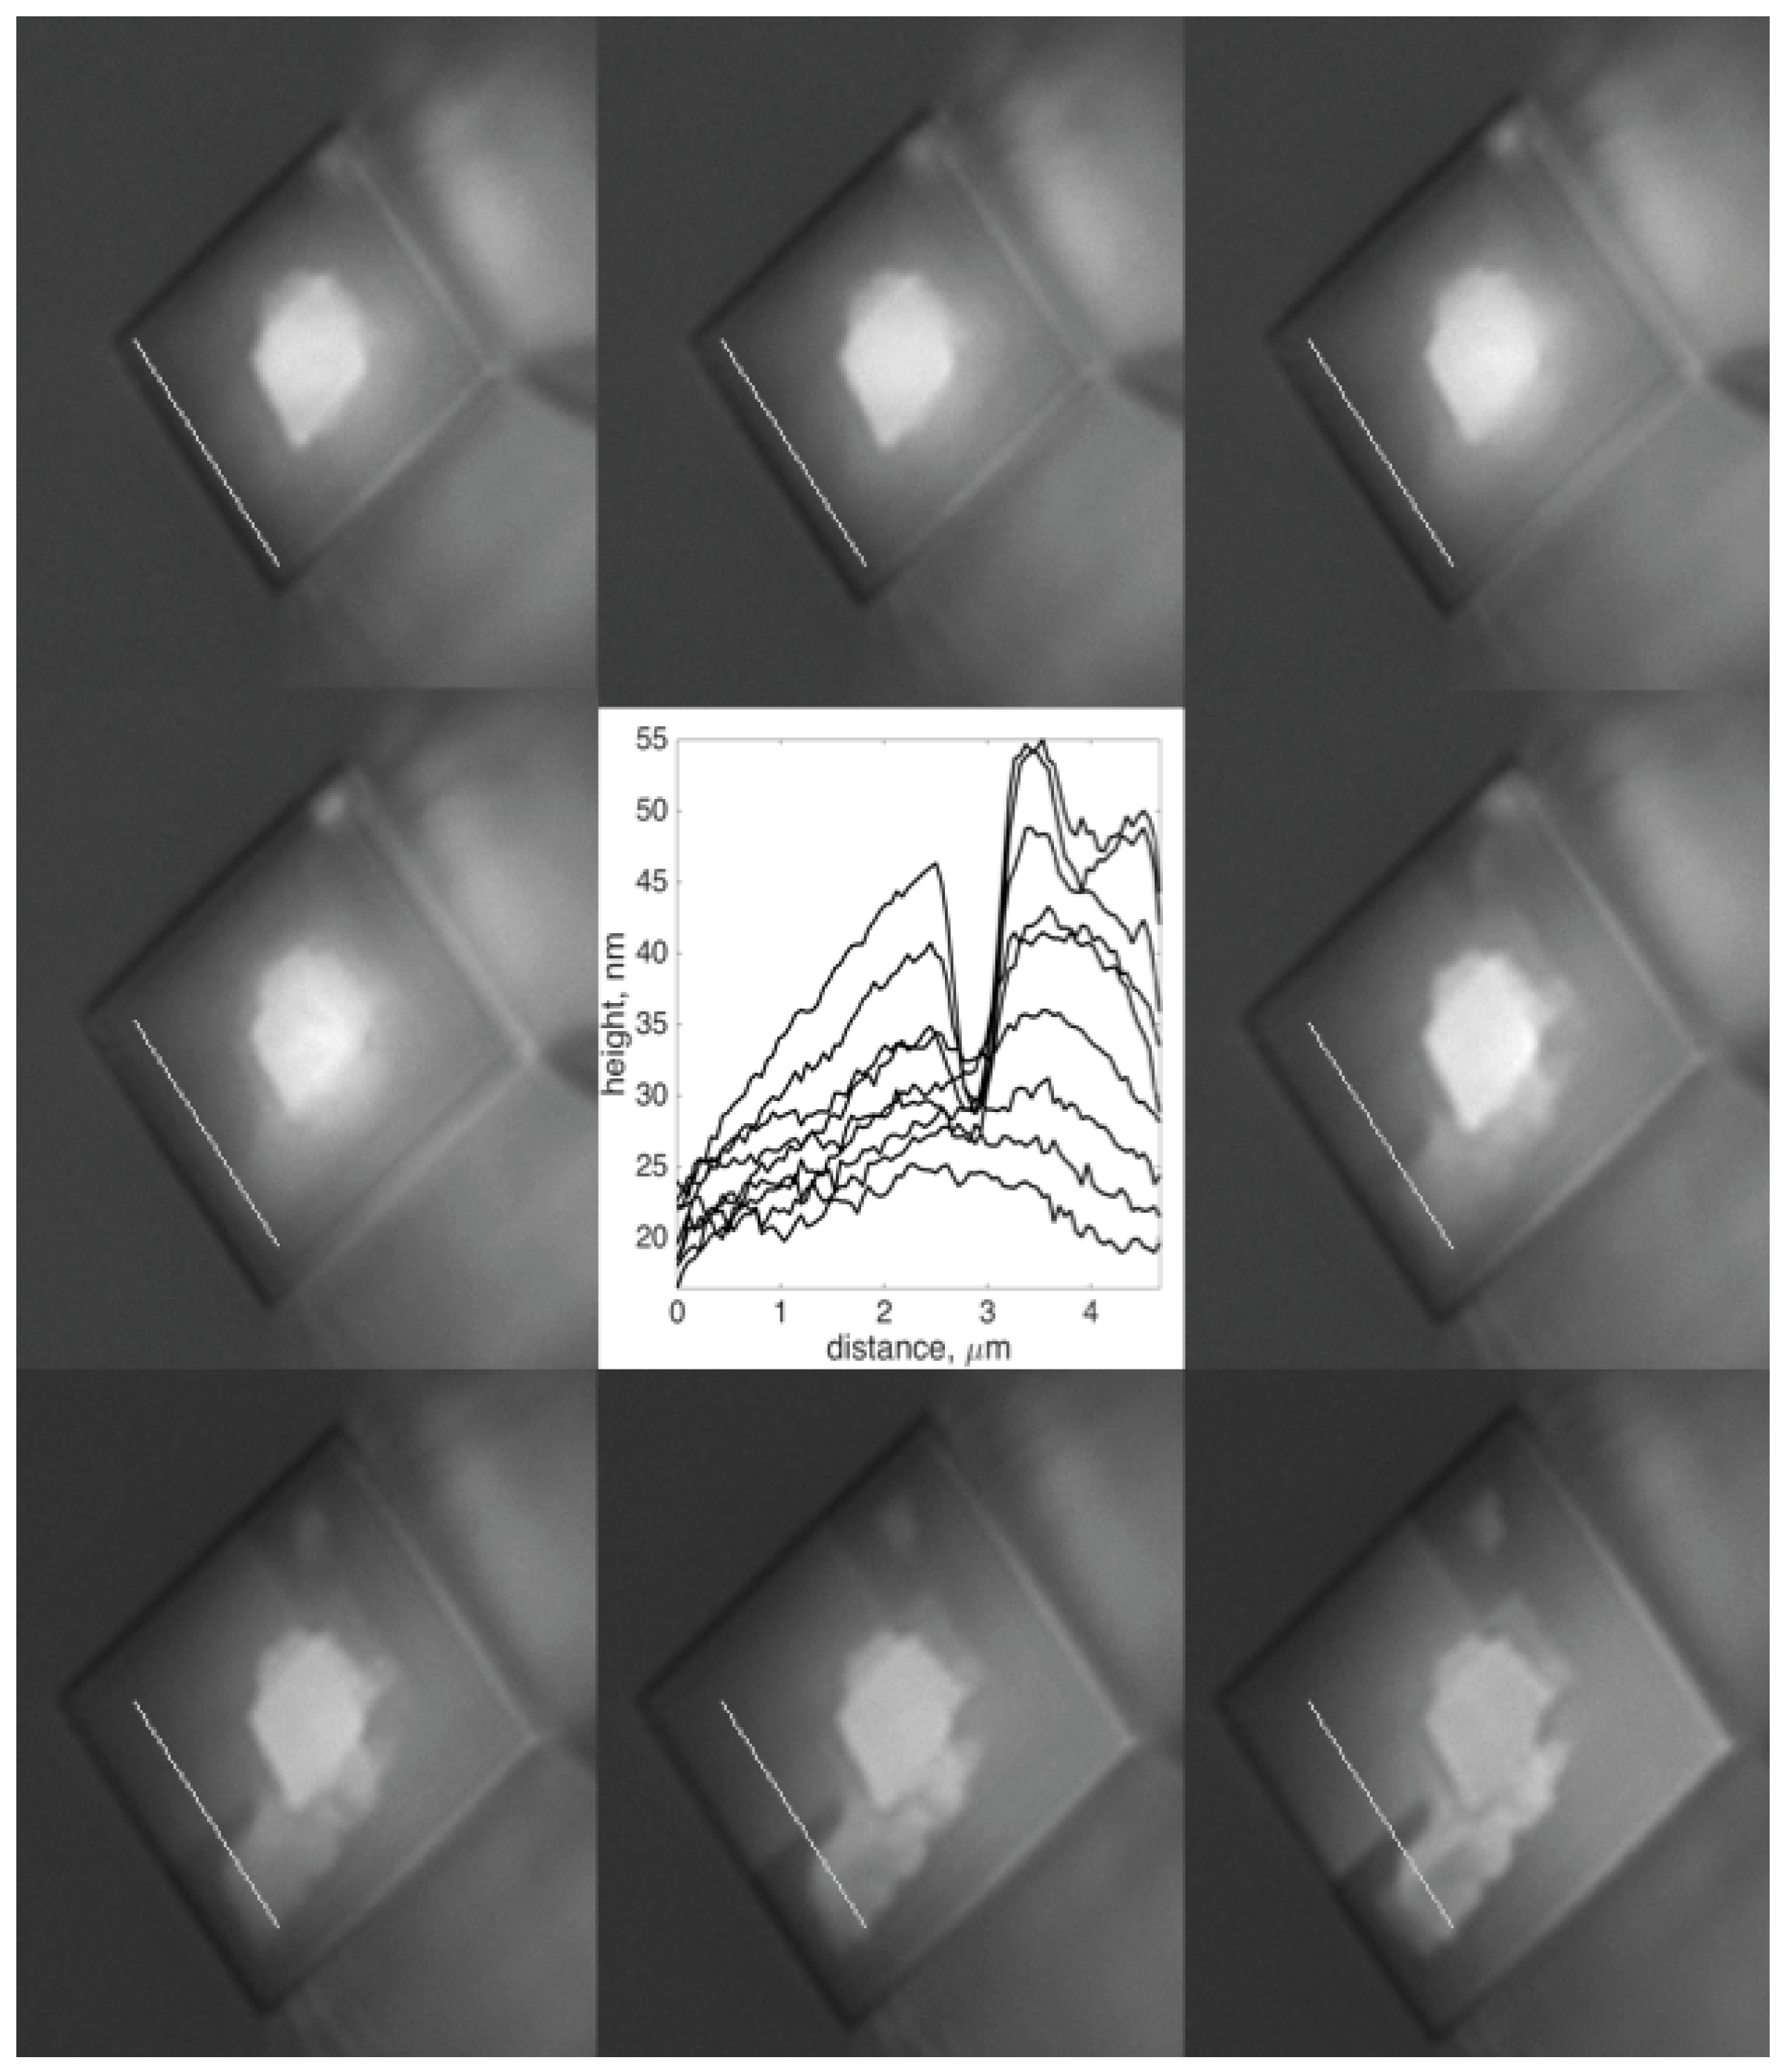
Figure 8.
Disjoining pressure of silica on calcite interface in saturated CaCO solution calculated from DLVO theory (whole drawn line) and contact pressures versus fluid film thickness, h, calculated from experimental interference intensities for Crystal A.
Figure 8.
Disjoining pressure of silica on calcite interface in saturated CaCO solution calculated from DLVO theory (whole drawn line) and contact pressures versus fluid film thickness, h, calculated from experimental interference intensities for Crystal A.

Table 1.
Summary of growth rates for all the crystals. “Downward growth rate” is the growth rate in the confined region causing the crystal to be lifted upwards.
Table 1.
Summary of growth rates for all the crystals. “Downward growth rate” is the growth rate in the confined region causing the crystal to be lifted upwards.
| Crystal | Concentration c mM | Supersaturation | Downward | Smooth/Intermittent | Outwards | Relative |
|---|---|---|---|---|---|---|
| Growth Rate | Growth Rate | Growth Rate | ||||
| nm/h | nm/h | % | ||||
| A | 0.8 | 0.6 | Smooth | (6→)0.4 | ||
| B | 0.7 | 0.4 | Rough | 21 | ||
| C | 0.8 | 0.6 | Smooth | 8(→)0 | ||
| D | 0.7 | 0.4 | Smooth | 5 | ||
| E | 0.8 | 0.6 | Rough | 12 | ||
| F | 0.8 | 0.6 | Smooth | (3→)0 | ||
| G | 0.7 | 0.4 | Smooth | (12→)3 | ||
| H | 0.8 | 0.6 | Rough | 6 |
© 2017 by the authors. Licensee MDPI, Basel, Switzerland. This article is an open access article distributed under the terms and conditions of the Creative Commons Attribution (CC BY) license (http://creativecommons.org/licenses/by/4.0/).
Share and Cite
MDPI and ACS Style
Li, L.; Kohler, F.; Røyne, A.; Dysthe, D.K. Growth of Calcite in Confinement. Crystals 2017, 7, 361. https://doi.org/10.3390/cryst7120361
AMA Style
Li L, Kohler F, Røyne A, Dysthe DK. Growth of Calcite in Confinement. Crystals. 2017; 7(12):361. https://doi.org/10.3390/cryst7120361
Chicago/Turabian StyleLi, Lei, Felix Kohler, Anja Røyne, and Dag Kristian Dysthe. 2017. "Growth of Calcite in Confinement" Crystals 7, no. 12: 361. https://doi.org/10.3390/cryst7120361
Note that from the first issue of 2016, this journal uses article numbers instead of page numbers. See further details here.