
Experimental and Theoretical Investigation of Lowering the Band Gaps of Phononic Crystal Beams through Fluid-Solid Coupling

Key Laboratory of Soft Machines and Smart Devices of Zhejiang Province, School of Aeronautics and Astronautics, Institute of Applied Mechanics, Zhejiang University, Hangzhou 310027, China
*
Author to whom correspondence should be addressed.
Crystals 2017, 7(12), 366; https://doi.org/10.3390/cryst7120366
Submission received: 15 October 2017
/
Revised: 20 November 2017
/
Accepted: 6 December 2017
/
Published: 8 December 2017
(This article belongs to the Special Issue Phononics)
Abstract
:We experimentally and theoretically investigate the band-gap and transmission properties of phononic crystal (PC) beams immersed in water. Spectral element method (SEM) is developed for theoretical analysis in which the hydrodynamic loading is taken into consideration. Influence of the hydrodynamic loading on band-gap and transmission properties of the PC beams are studied. To directly detect the displacement transmission of a fully or partially submerged PC beam, a fiber Bragg grating (FBG) displacement sensing system is set up. Agreement between the experimental results and theoretical/numerical calculations also indicates the excellent dynamic sensing performance of the FBG sensing system in the research of the fluid-structure interaction (FSI) problem. Obvious lowering of the band gaps due to fluid-solid coupling is clearly demonstrated. The results in this work might be useful in research such as active tuning of the band gap and transmission properties of the PCs through fluid-solid coupling.
1. Introduction
Phononic crystals (PCs) are periodic structures made up of two or more kinds of materials (solid-solid or fluid-solid) with different acoustic impedance [1,2,3]. Due to their ability to forbid propagation of acoustic or elastic waves through band gaps induced by Bragg scattering or local resonance, PCs have received significant attention in the applications of wave manipulation, vibration suppression, wave guiding, and so on [4,5,6]. Although fluid-solid PCs have been one of the research focuses in the past years, in most literature fluid only serves as a constituent or a medium through which acoustic waves propagate [7,8,9,10,11]. Conventionally, accelerometers (e.g., [8,12] for flexural waves) or ultrasonic immersion transmission technique (e.g., [9,11] for longitudinal waves) are used to detect the transmission spectra of phononic crystals.The fluid-structure interaction (FSI) on tuning the band-gap or transmission properties of the PCs are seldom addressed. As a promising method for the PCs to adapt to different operation conditions, tuning band gaps through solid-fluid coupling is currently receiving attention. To actively control the localized modes for guiding or filtering waves, Jin et al. theoretically investigated the dynamics of a phononic crystal plate with hollow and liquid-filled pillars [7]. Casadei and Bertoldi realized self-regulation of dispersion properties by coupling incident aerodynamic flow to a slender beam carrying a periodic array of local resonators [12]. In fact, in addition to band gap tuning, knowledge about the influence of fluids coupled to PC beams or plates on elastic band-gap and transmission properties is fundamental to a variety of potential applications for the PCs, from environmental or liquid sensing to structural design or vibration control in the marine environment.
In fluid-solid coupling, hydrodynamic loadings may contain the contributions of added mass (i.e., the proportionality constant of the inertial force to the acceleration of the solid) and/or viscous damping (i.e., the proportionality constant of the viscous force to the velocity of the solid). A wide range of research on FSI of non-periodic structures submerged in a fluid have laid a foundation for the study of the fluid-solid coupling on the PCs, particularly vibration characteristics of slender beams subjected to hydrodynamic loadings. Eysden and Sader presented theoretical analysis of the resonant frequencies of rectangular cantilever beams immersed in fluid applicable to large Reynolds number [13]. Green and Sader studied the increase of hydrodynamic loading on an infinitely long rigid cylinder immersed in a viscous fluid undergoing small amplitude oscillations [14]. Naik et al. experimentally investigated the dynamic response of a resonant cantilever beam in a viscous fluid by considering the influence of liquid properties and the gap height between the beam and the solid boundary [15]. Generally, in modeling fluid-solid coupling for submerged structures, several challenges and factors need to be addressed compared with structural modeling performed in vacuo. These factors include the dimensions or shapes of the structures with respect to fluid damping, amplitude of vibration, viscosity of the fluid, and the influence of the fluid boundary conditions. Viscosity of the water plays a dominant role when the submerged structures being considered are of microscopic size. However, for structures of macroscopic size immersed in fluid, viscous damping can be neglected and the fluid can be assumed to be inviscid in nature [13].
Although some studies on the FSI problem have provided experimental comparisons on structural dynamics (e.g., [15,16,17,18]), few experimental research focused on the transmission properties of structures immersed in fluid. In this paper, we investigate the lowering of the flexural wave band gaps of a PC beam through fluid-solid coupling. First, we present the spectral element method (SEM) to determine the band structure and displacement transmission of the PC beam, in which the influence of hydrodynamic loading on the PC beam is considered. Then, we present a fiber Bragg grating (FBG) displacement sensing system and employ the FBG system to directly detect the displacement transmission of the PC beam partially or fully immersed in a water tank. Finite element method (FEM) simulations are also provided for comparisons. To the authors’ best knowledge, this is the first experimental study on FSI of the PC beam using the point-wise FBG displacement sensing technique.
2. Modeling of Fluid-Solid Coupling by Spectral Element Method
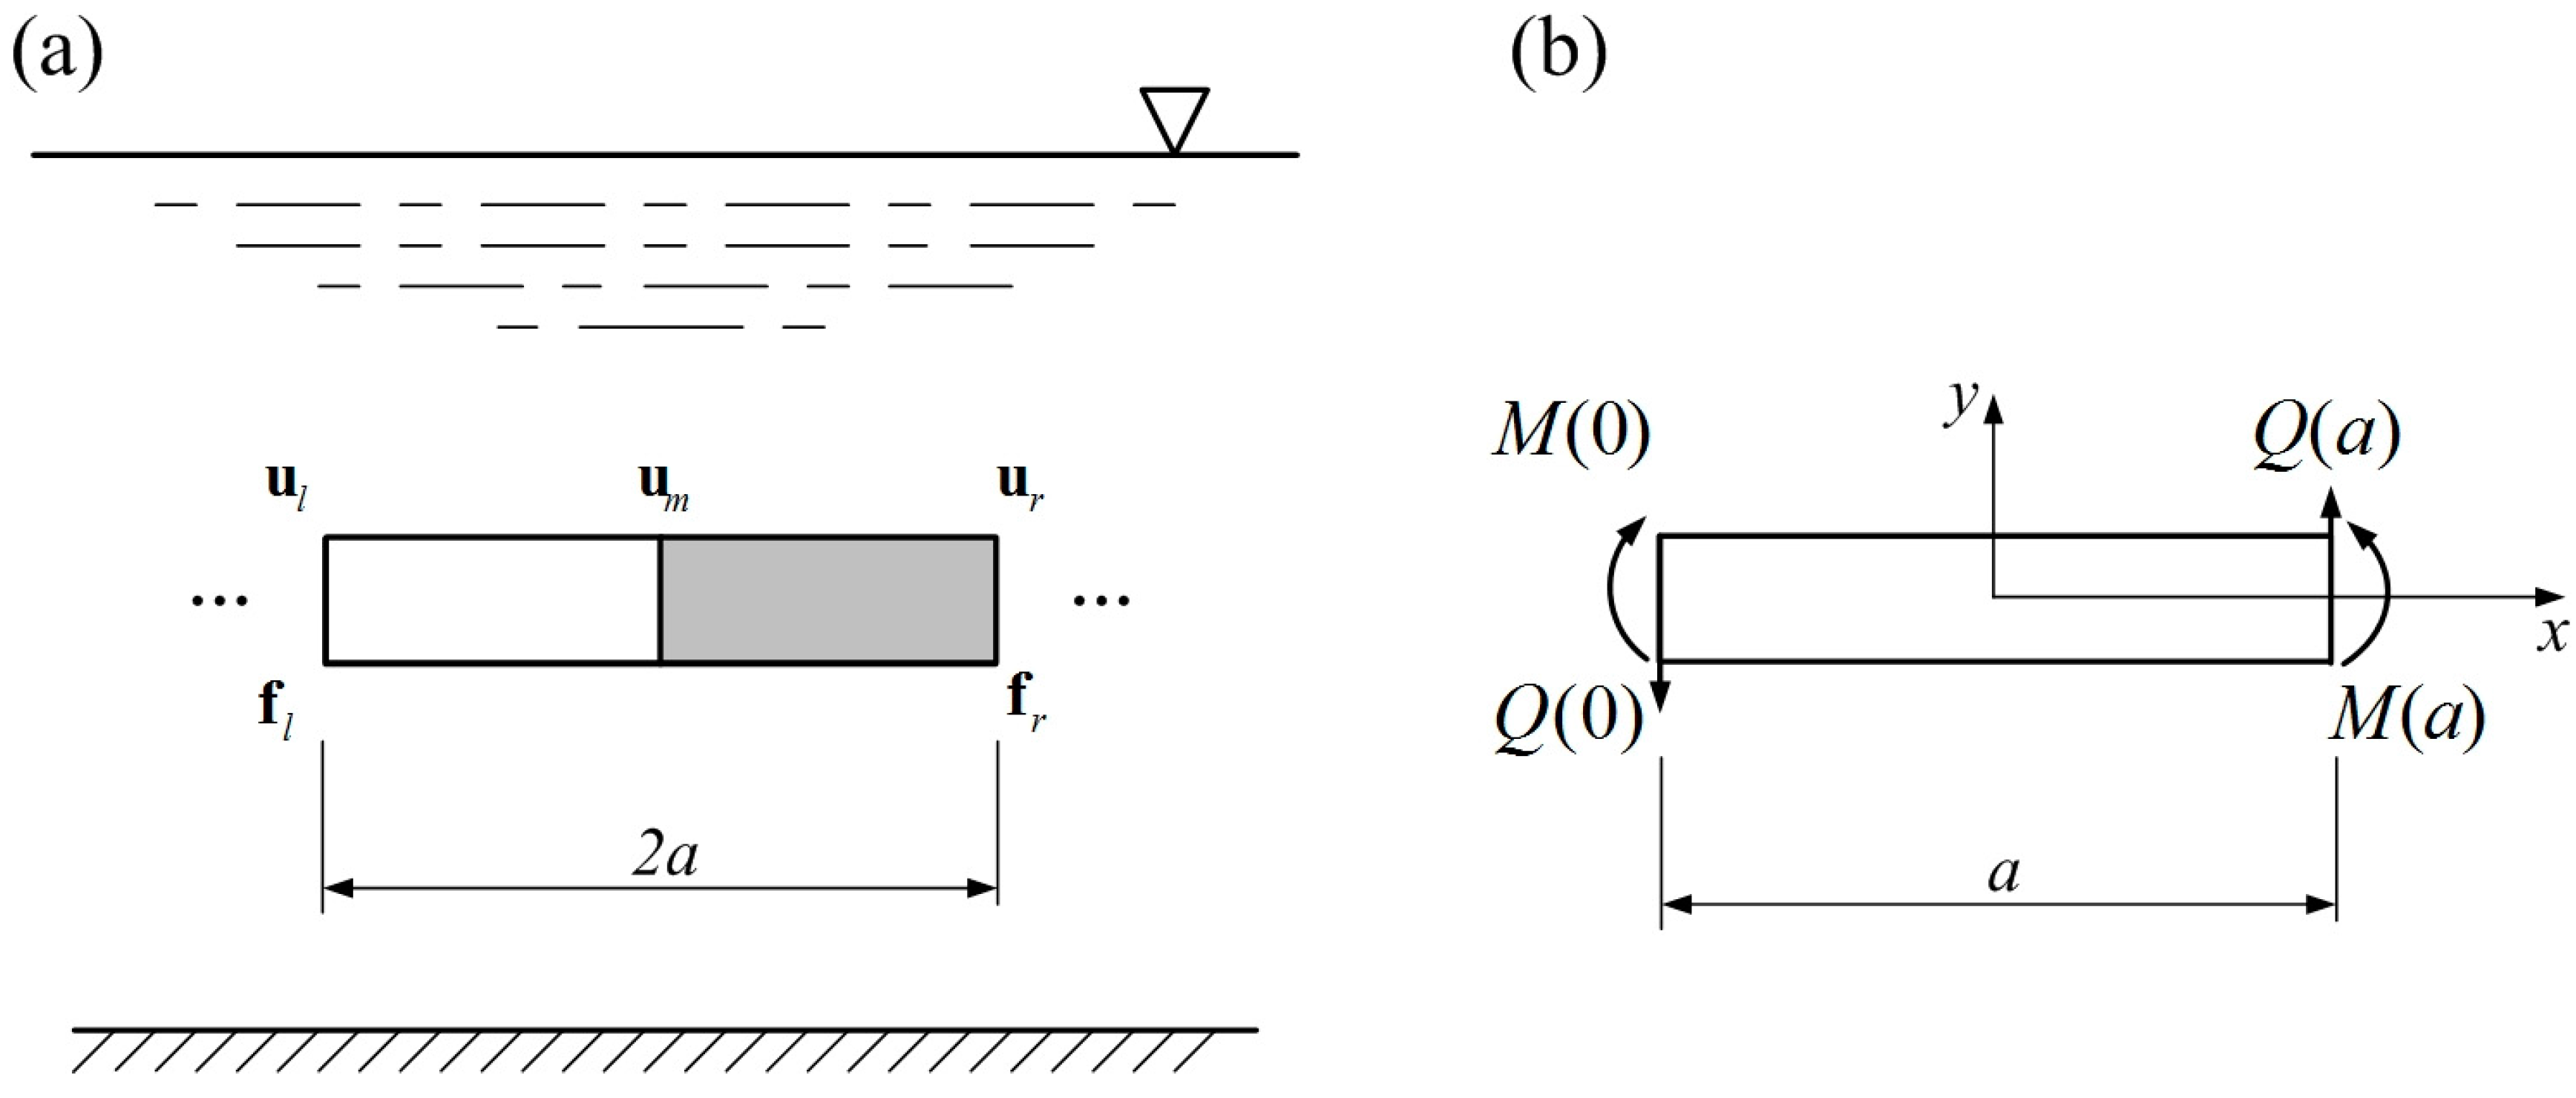
We investigate a periodic binary straight beam of macroscopic size immersed in water as illustrated in Figure 1a. Water is assumed to be incompressible and inviscid in nature. Each segment of the periodic binary straight beam has the same dimension (length , width , and height ). The spectral element method (SEM) [19] is used to analyze the influence of hydrodynamic loadings on the flexural wave band-gap properties and displacement transmission of the PC beam. The PC beam is located away from the boundary of the fluid domain and thus the boundary influence on the dynamic of the PC beam can be neglected.
First, we consider a single beam segment in a unit cell as shown in Figure 1b. The governing equation of the free bending vibration of a partially or fully submerged Timoshenko beam is described by
where is the transverse displacements, is the slope due to bending, is the area moment of inertia about the bending axis, is the mass density of the beam segment, is the effective added mass density of fluid (relating to the depth of the surrounding fluid), is the Young’s modulus, is the shear modulus, is the shear correction factor, and is the cross-section area [20]. The shear correction factor (also known as shear coefficient) accounts for the variation of the shear stress across the cross section of the phononic crystal beam and it is dependent on the shape of the cross section. The shear correction factor is shown to be related to the Poisson’s ratio (e.g., for rectangle cross section it is and for circle cross section it is [21]). Note that the surrounding fluid does not contribute to the rotational inertia of the beam segment. In Equation (1), the effect of the hydrodynamic loading is taken into account by introducing the effective mass density of fluid (here the water) to modify the density of the beam segment in air. The consideration of the added mass and neglection of the viscosity are often used in modeling non-micro Bernoulli-Euler beam structures fully or partially immersed in fluid [22,23,24].
The mode shape functions of and are assumed in the spectral forms as [25]
where the wavenumbers (i.e., ) are obtained by solving the dispersion equation of the beam segment. The four wavenumbers are respectively represented as [20]
where and respectively represent the rightward and leftward traveling waves, and respectively represent the rightward and leftward near-field decaying waves, , , and . Following the symbol in [20], we introduce new subscripts and for simplification of the symbols for later derivations.
Obviously, the wavenumbers and mode shape functions of the beam segment are influenced by the added mass of the fluid.
The spectral components of the applied transverse shear forces and bending moments of the submerged beam segment has the relationships to displacement and bending slope as
The spectral beam elements are related to the nodal shear forces and bending moments in the two ends of the beam segment as
where is the nodal displacement of the beam segment (i.e., ) and is the dynamic stiffness matrix, represented as
where the sub-matrix in Equation (6) are respectively
where
with
Now we consider flexural wave propagation in an infinite submerged PC beam. The Floquet boundary condition, , is applied on a single unit cell (as shown in Figure 1a, where is the wave propagation constant. To obtain the band structure of the infinite PC beam immersed in water, the spectral element matrix of the two segments in a unit cell is assembled. The equation of motion of the unit cell coupling with fluid in spectral form can be written as
where , , and are respectively the nodal displacement in the left, middle, and right of the unit cell and and are respectively the left and right nodal loading forces, namely,
Note that in Equation (10) we define two kinds of spectral beam elements with the same geometry but made of two different materials (stands for aluminum) and (stands for PMMA). In addition, the sub-matrix for each material in Equation (10) are again derived based on Equations (6)–(9). The degrees of freedom (DOFs) in the middle point connecting to the two beam segments can be eliminated by relating to and (i.e., Thus, Equation (10) can be further reduced as
where
Applying the Floquet boundary condition, Equation (13) can be reformulated by matrix transformation as
where is the transmission matrix obtained from spectral beam elements, given by
From the eigenvalue problem of Equation (15), one can calculate propagation constant and the band structure of the submerged PC beam can accordingly be obtained.
For a finite PC beam immersed in water under excitation of harmonic loadings, the global stiffness matrix of the entire beam is obtained after assembling the spectral stiffness matrix of each spectral beam elements. The equation of motion of the PC beam coupling with fluid in spectral form is given by
where is the nodal displacement vector in the form of , is the loading force vector with dimension of , and the global dynamic stiffness matrix of the beam is given by
Finally, the flexural displacement transmission of the submerged beam can be obtained by the definition of
where and are respectively the displacement amplitudes on the two ends of the submerged PC beam.
3. Experimental and Theoretical Validation and Discussion
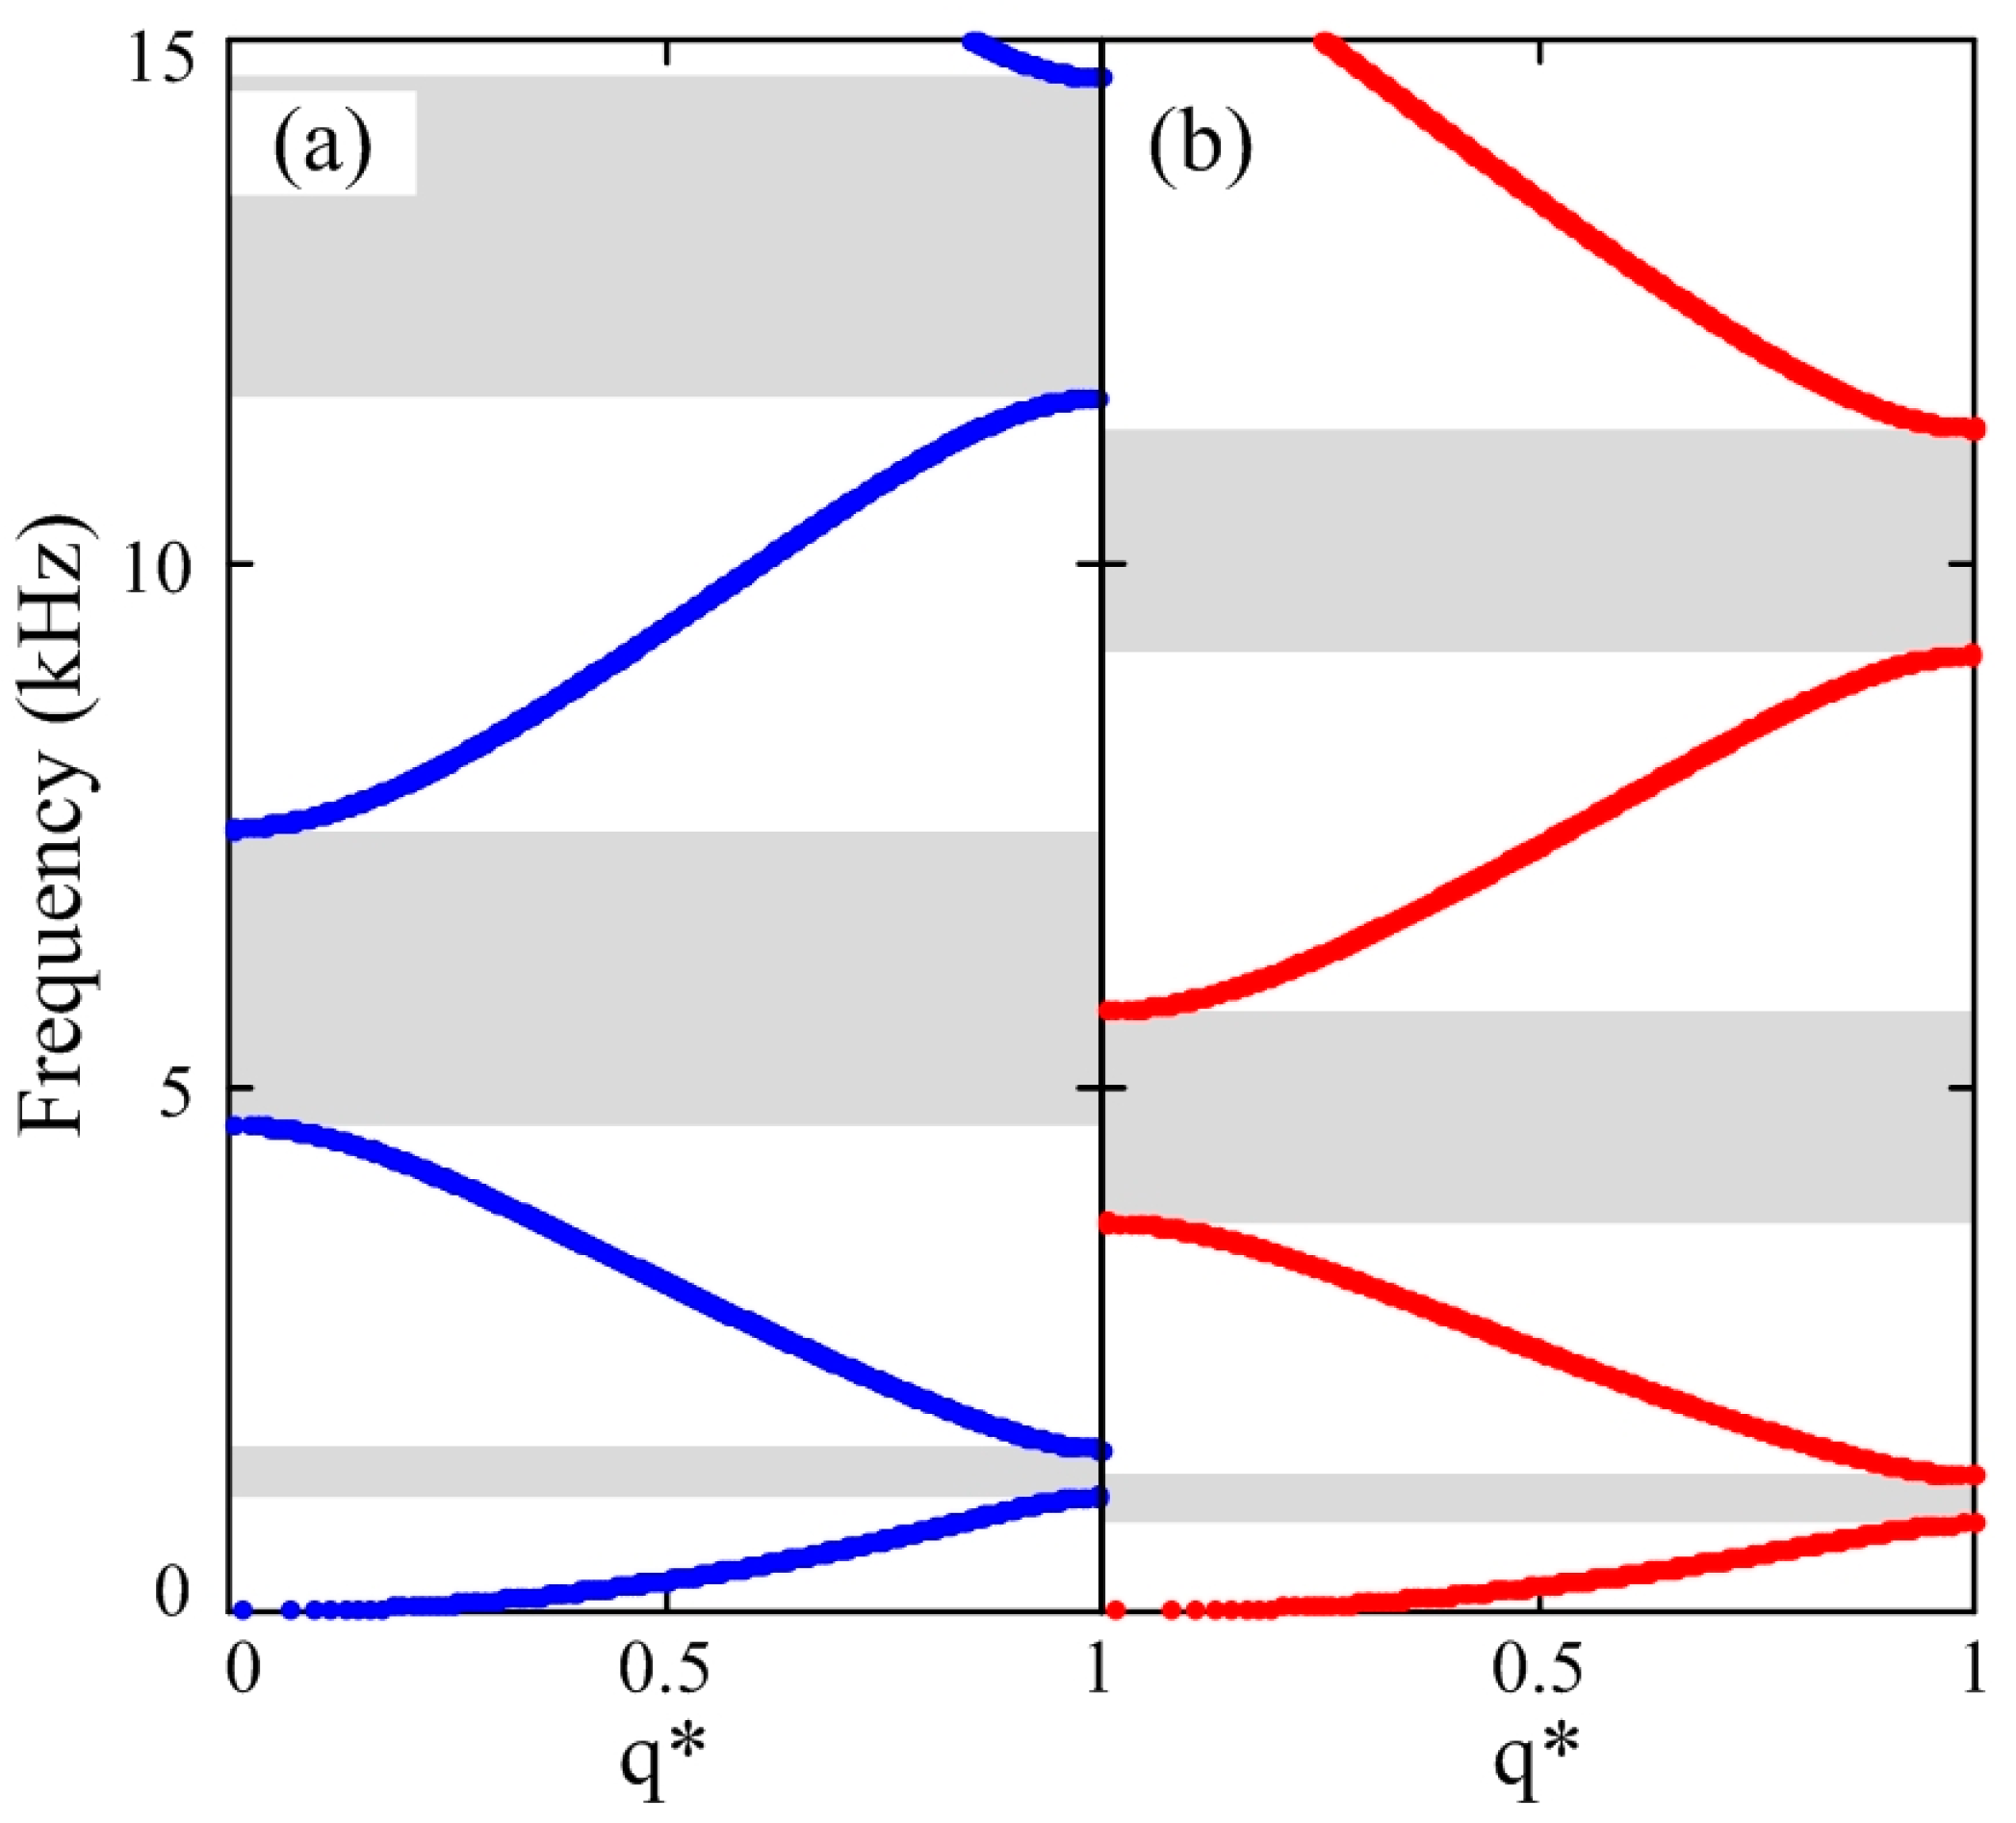
First, we compare the band structures of an infinite PC beam in vacuo (i.e., practically in air) and in water to see the influence of the added mass of fluid on the band-gap properties. Figure 2 shows the band structures of a PC beam in vacuo (Figure 2a) and in water (Figure 2b) calculated by the SEM, in which the complete band gaps are shaded and the wavenumbers are normalized for the unit cell (i.e., ). The PC beam consists of two materials, 6061 aluminum and PMMA. Each of the two materials (i.e., 6061 aluminum and PMMA) has the size of 0.045 m (length) 0.015 m (width) 0.01 m (height). The elastic constants of the PC beam used in the SEM calculation are , , , , and . The Poisson’s ratio of the two materials is 0.33. In the calculation of the band structures, the PC beam is assumed to be far away from the boundary of the fluid domain and thus the effective added mass density of fluid is set as the mass density of water as [24]. For the dry PC beam in air, is set as zero in SEM calculation. Three Bragg-scattering-induced band gaps can be seen in Figure 2 within 0–15 kHz. From Figure 2 we can see that both the center frequency and the gap widths decrease when the effect of the surrounding fluid is taken into account as an added mass applied on the phononic crystal beam. As a result, the effective mass density of the submerged phononic crystal beam is increased and accordingly the frequency ranges of the pass- and stop-bands decrease. The effect of the added mass on lowering the pass-bands as well as the stop-bands gets larger as the frequency increases. Obviously, the band-gap properties can be tuned via interaction with the surrounding fluid.
The relationships between the related band-gap parameters and the dimensions of the PC beam (i.e., , where and are respectively different calculated 3D dimensions and the dimensions of the submerged PC beam considered in Figure 2) are listed in Table 1. The considered band-gap parameters include the band-gap width , the center frequency , and the absolute and relative shift of the center frequency. The relative shift of center frequency is calculated as the percentage of shift of the center frequency due to fluid-solid coupling related to the center frequency of the dry PC beam (i.e., in air). The relative size of the band gap, which can be an important design parameter of phononic crystals, is also calculated in Table 1 as the ratio between band-gap width and the corresponding center frequency [26,27],
where and are respectively the frequencies of upper and lower edge limits of the considered band gap and is the center frequency of the band gap. From Table 1 we can see that, the relative size of the band gaps and the relative shift of the center frequencies of the submerged PC beam are influenced or lowered in the same way with almost identical values (compared with the same band gap) by the fluid-solid coupling. On the other hand, different dimensions of the submerged PC beam only leads to a different absolute shift of the band gaps and band-gap widths.
Then, an FBG displacement sensing system is employed to directly detect the displacement transmission of a finite PC beam in air, partially, or fully immersed in water. A fiber Bragg grating (FBG) is a periodic perturbation of the refractive index in a length of fiber core capable of selectively reflecting a particular wavelength of light according to Bragg reflection. Unless the cladding of the FBG are partially removed by side-polishing or hydrofluoric (HF) acid etching, submerged FBGs are intrinsically insensitive to surrounding fluid because of the well-screened core mode coupling [28]. The FBG, often used as strain sensors for structural health monitoring [29], has not been used as point-wise displacement sensors in the applications of the phononic crystals until the work recently published in [30]. Based on the fiber Bragg grating (FBG) sensing technique proposed in [30], we setup an FBG displacement sensing system to measure the displacement transmission of the submerged PC beam. To the authors’ best knowledge, this is the first experimental study of fluid-solid coupling on the PC beam through displacement transmission using the point-wise FBG displacement sensing technique.
Figure 3 shows the experimental setup and the corresponding fiber Bragg grating (FBG) displacement sensing system. There are 10 unit cells in total along the PC beam. The size of the PC beam is the same as that considered in Figure 2. The PC beam is placed in a water tank and only two points of the PC beam are rested on two soft rubbers. The bottom surface of the PC beam is 0.1 m away from the bottom of the water tank. The size of the water tank is 1.2 m (length) × 0.2 m (width) × 0.2 m (height). Note that the size of the water tank is relatively large compared to the cross-sectional area of the PC beam. Thus, reflected pressure field from the wall of the water tank is negligible.
In the FBG sensing system, a C-band amplified spontaneous emission (ASE) light source (China-Fiber Optics, Shanghai, China) is split into two paths by a coupler and sent to two FBG sensors (i.e., FBG1 and FBG2) and the corresponding FBG demodulation systems (i.e., FBG filter1 and FBG filter2). Two 3-port directional optical circulators (OCs) are set up in each demodulation system to guide the light beam. Photodiodes (PDA10CS, InGaAs amplified detector, Thorlabs, Newton, NJ, USA) are employed to convert the light to electrical signals and are connected to a dSPACE system (dSPACE GmbH, Paderborn, Germany) for displacement transmission measurement. The grating lengths of the FBG sensors and FBG filters are both 10 mm. One end of the FBG sensor is point-wisely glued to the sensing point (i.e., the extreme end of the PC beam) by epoxy glues. The other end of the FBG sensor is glued to a vertical translated stage. By careful matching the initial Bragg wavelength of the FBG sensor and the corresponding FBG filter, the Bragg wavelength shift of the FBG sensor during vibration of the PC beam can be linearly demodulated. In the experimental setup shown in Figure 3, FBG1 serves as an input sensor and FBG2 an output sensor.
To obtain the displacement transmission, white noise random signals are generated by the dSPACE DS1104 system and sent to a piezoelectric multilayered actuator (AE0505D16, Thorlabs, Newton, NJ, USA) to excite flexural wave propagation in the PC beam. To prevent electric leakage, the wires of the piezoelectric multilayered actuator are carefully wrapped with an insulating layer of epoxy glues. The responses of FBG1 and FBG2 within 20 s are recorded in the dSPACE DS1104 system. The displacement transmission is then obtained from calculating the relationship , where is the auto-spectral density function of the input random displacement (detected by the FBG1) and is the cross-spectral density function between the input random and transmitted displacements (obtained by FBG2).
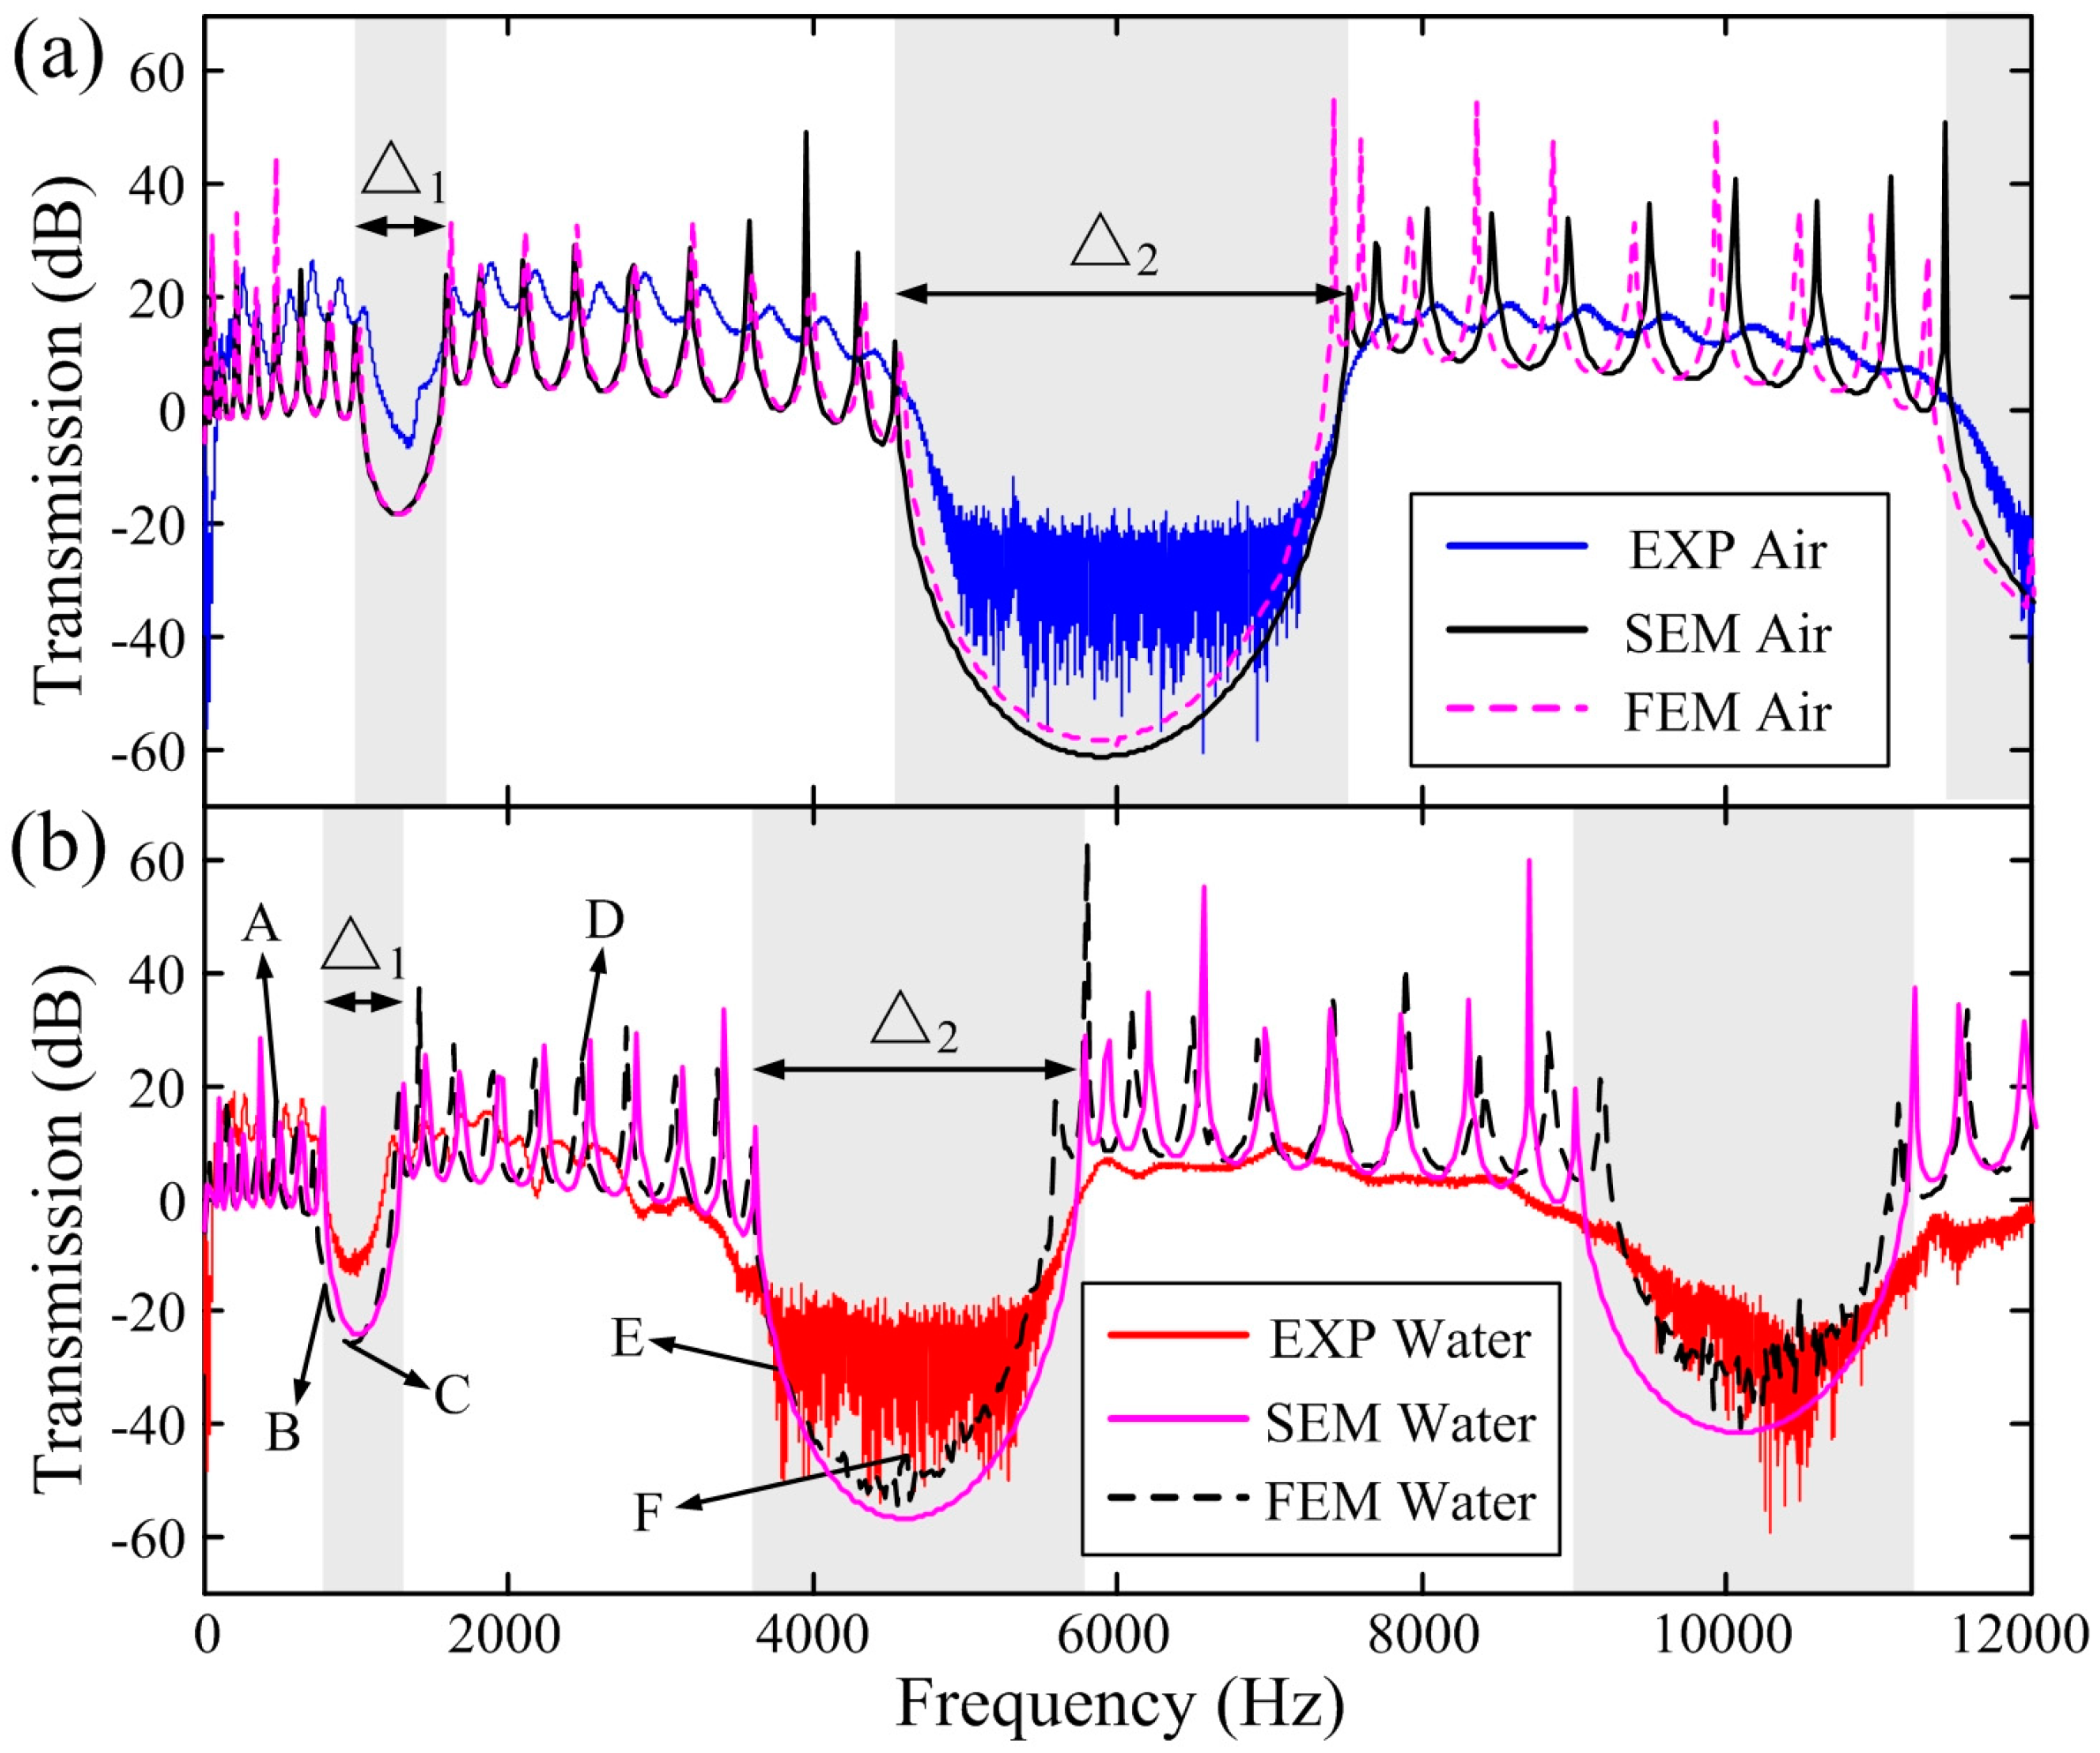
The identified displacement transmissions when the PC beam is respectively excited in air and in a water tank full of water are shown in Figure 4, compared with the results obtained by the SEM (i.e., using Equation (18)) and FEM performed by the COMSOL Multiphysics® software (Comsol Inc., Stockholm, Sweden). In SEM simulations, the coupling of the water is considered as an added mass applied on the dry PC beam. In FEM analysis, instead of simply applying the added mass, the acoustic-solid interaction module is selected in which the water is set as a pressure acoustic model and the space of the water is set the same as the experimental condition. The acoustic-solid interaction module first calculates the frequency response and mode shapes of the linear PC beam and then feeds the information of the dynamics of the solid back to the acoustic domain. The acoustic pressure field is calculated by solving the frequency-domain Helmholtz equation for sound pressure in water [31]. A normal acceleration boundary condition is then considered to feed back the frequency response of the PC beam to the acoustic field. Note that the structural damping, which can be considered in the modeling of the PC beam by introducing a complex Young’s modulus that leads to decaying wave propagation, is neglected in both SEM and FEM simulations. The structural damping mainly reduces the vibration amplitudes near the resonant frequencies and has no influence on the band-gap locations [32]. Despite the neglection of the structural damping in SEM/FEM simulations, good agreement can be obtained in Figure 4 between the experimental, theoretical, and numerical results both in air and water.
The results shown in Figure 4 clearly indicate that the FBG sensors immersed in water are indeed intrinsically insensitive to surrounding fluid and can possess good point-wise displacement sensing performance even in water. In addition, the lowering of the band gaps and decreasing of the band-gap widths can still be observed in the experimental, SEM, and FEM results for the finite PC beam. Strong damping of the resonant peaks is observed when the PC beam is immersed in water. As the frequency gets higher, discrepancy between the SEM, FEM, or experimental results can be observed. Without the coupling of the water (i.e., Figure 4a) and when the wavelength in the PC beam is not small compared to the beam thickness, the frequency responses calculated by the SEM can be regarded as accurate due to the fact it uses exact dynamic stiffness matrices [20]. However, structural modeling using SEM is limited to simple geometry, loads, and boundary conditions. On the other hand, FEM can be applied to structures of complicated geometry or boundary conditions but the accuracy of FEM is based on the finite element discretization [32]. Thus, increasing element numbers in FEM analysis can reduce the high-frequency (i.e., small wavelength) discrepancy. In the presence of water, good agreements between SEM, FEM, and FBG experimental results especially at low frequencies indicates that both the added mass in SEM and the acoustic-solid interaction module in FEM are capable of analyzing the considered fluid-solid coupling problem for low-order band gaps.
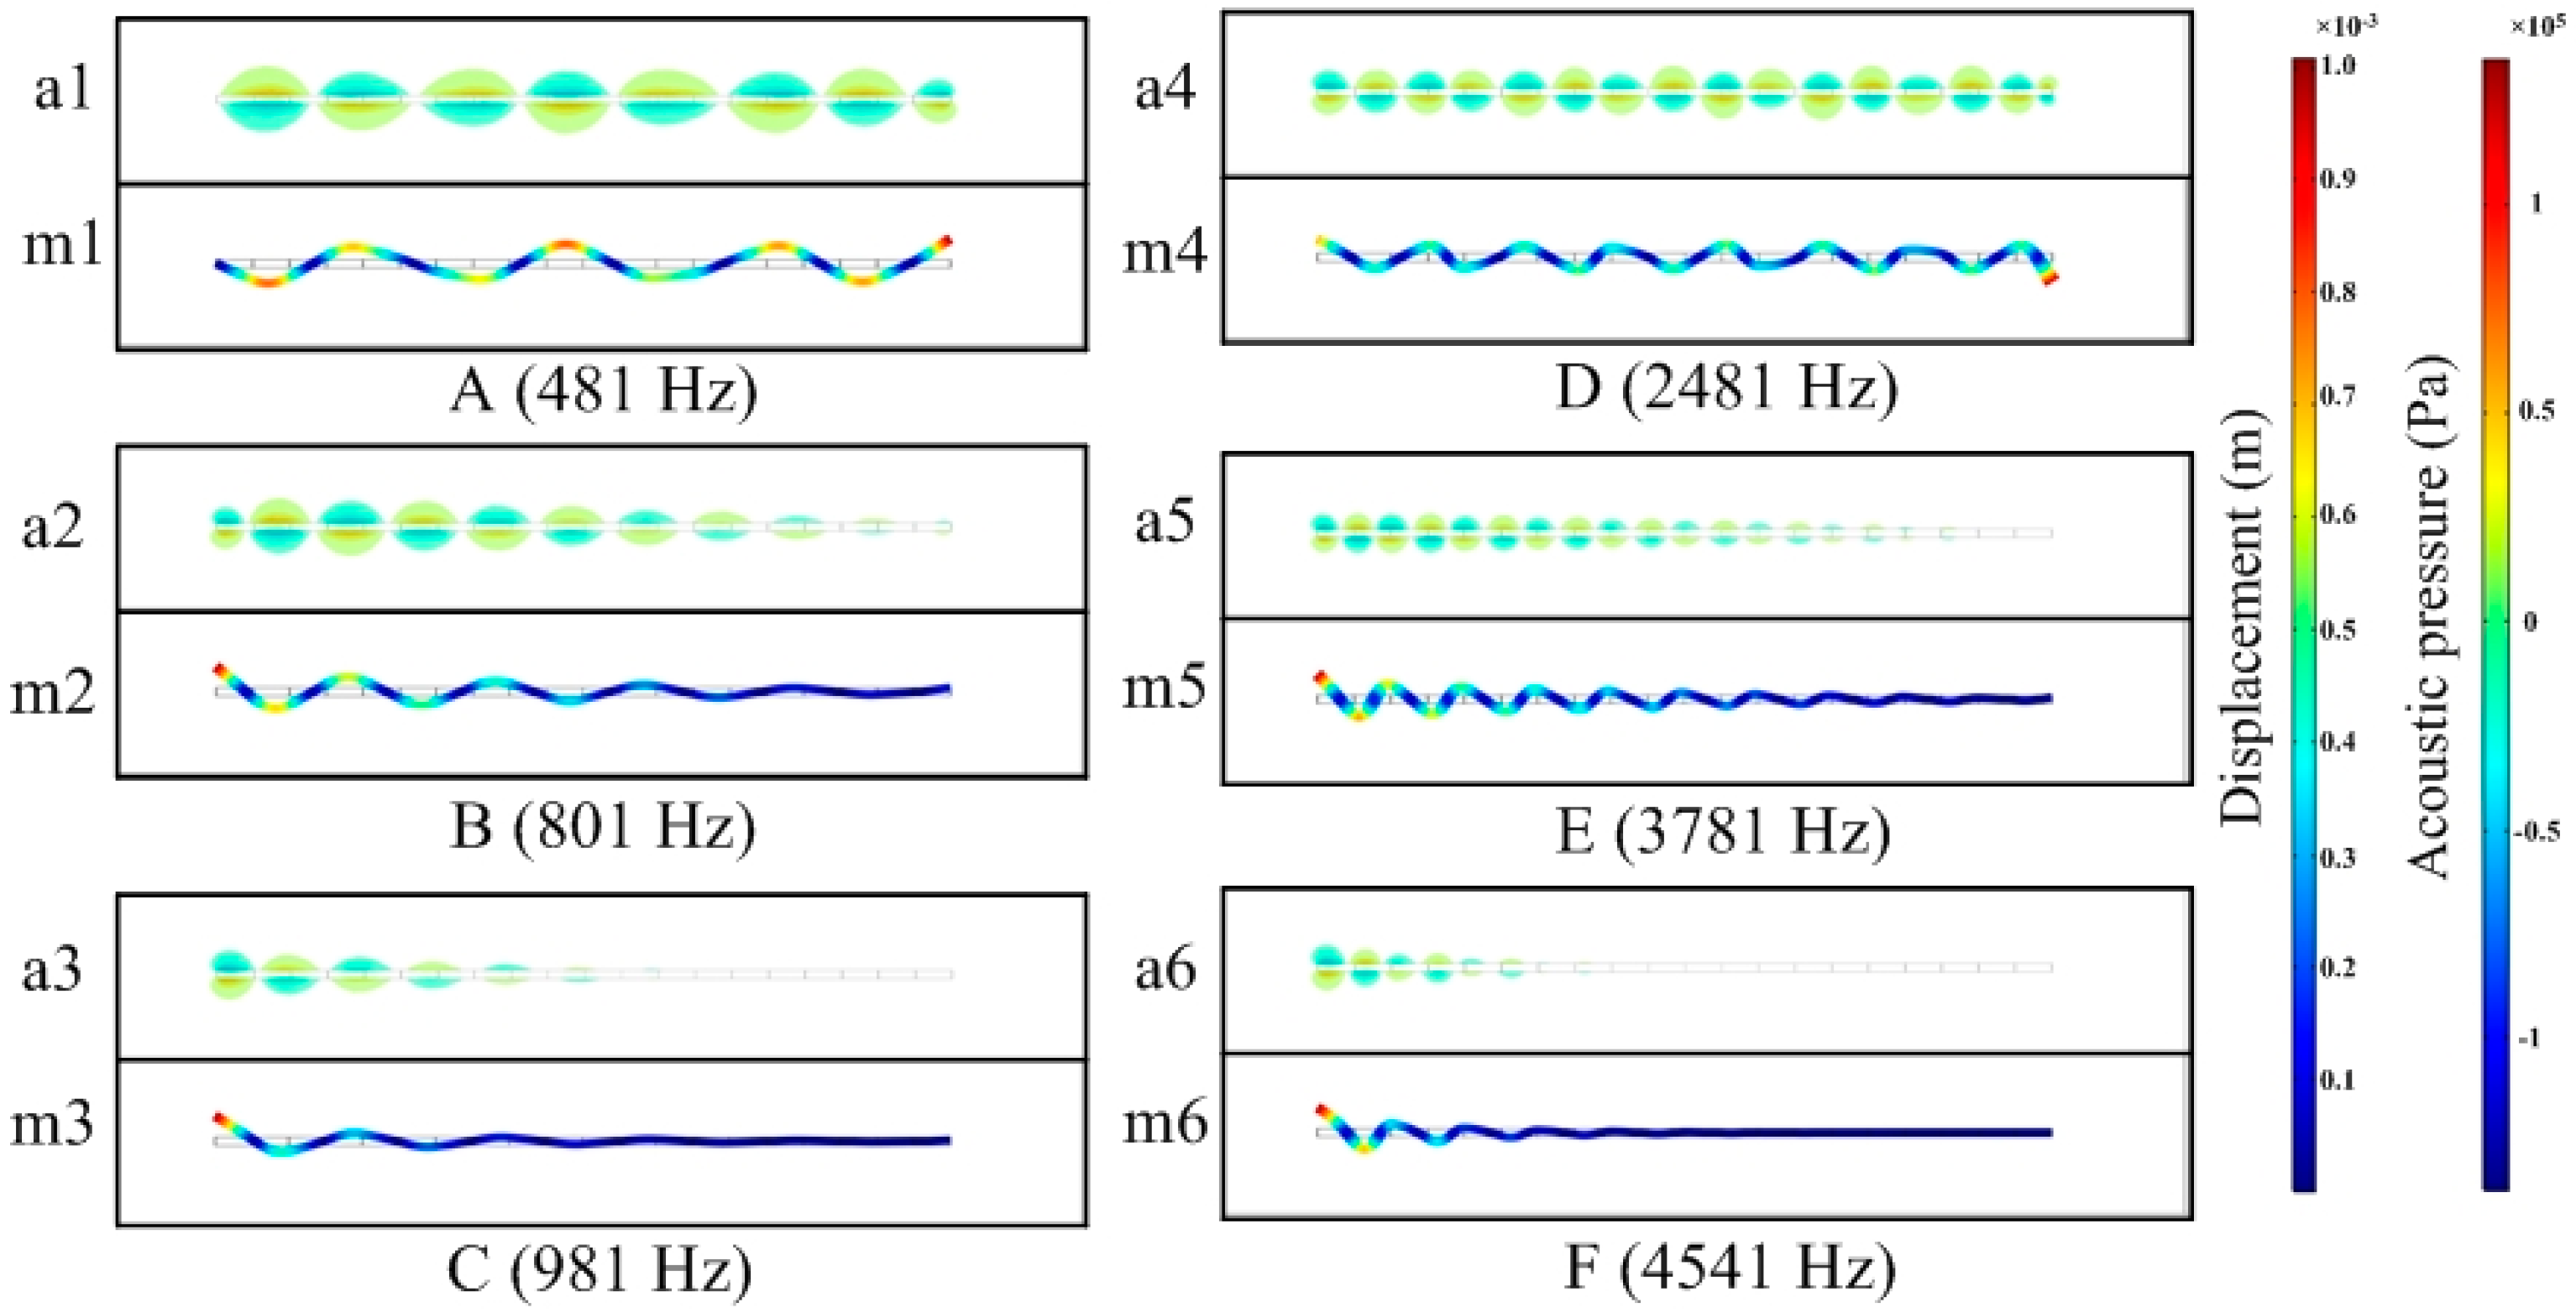
The normal velocity of the fluid is equal to that of the structure at the fluid-structure interface. The vibration modes in vacuo are assumed to be preserved when the PC beam is immersed in water and each mode shape generates corresponding surface pressure distributions (e.g., see [33,34]). To demonstrate the coupling of the water to the dynamics of the PC beam, we select representative frequencies in Figure 4 to show the corresponding steady-state vibration profiles of the PC beam and the acoustic pressure field by COMSOL. The frequencies of the selected vibration profiles are marked as A to F in Figure 4, including resonant peaks in pass bands (i.e., A = 481 Hz, D = 2481 Hz), lower edge of the first band gap (i.e., B = 801 Hz, E = 3781 Hz), and center of the band gaps (i.e., C = 981 Hz, F = 4541 Hz). The results are shown in Figure 5. We can see clear correspondence, such as the nodal points, between the vibration profiles and the interacted acoustic field in the water at these frequencies. Inside the band gaps, the acoustic pressure field decays along the PC beam. In addition, even for the resonant frequencies at pass bands (i.e., “A” and “D”), the intensity of the acoustic pressure field also gets stronger close to the excitation point. Thus, the energy of the acoustic pressure is decayed away from the excitation point instead of uniformly distributed along the PC beam. The correspondences in Figure 5 also suggest that employing the acoustic-solid interaction module in FEM is equivalent to considering the added mass of fluid on the PC beam. Despite the correspondence between the vibration modes and acoustic pressure field, we note that the vibration of the submerged PC beam is mainly considered and the absorption of structure-borne sound in water and their influence on the vibrations is neglected in our work. In addition, the influence of the wall of the water tank can be neglected at the considered frequency ranges.
In Table 2, we compare the first and the second band-gap widths (i.e., denoted as “” and “”), the center frequencies in the band gaps, and shift of the center frequencies obtained in Figure 2 (i.e., band structure, denoted in Table 2 as “BS”) and Figure 4 (i.e., displacement transmissions). The results show that the discrepancies between the FEM and experimental results for center frequencies are less than 5%, indicating that the proposed FBG displacement sensing system is suitable to be applied in fluid-solid coupling problem. The center frequencies and their shifts in the band gaps of the band structure and the displacement transmission obtained by the SEM calculations are closely related as shown in Table 2. Larger inconsistency is found for the band-gap widths in the first band gap. We observe that a practical finite PC beam possesses larger band-gap widths than the ideal infinite PC beam. For the first band gap, the relative size of the band gap is larger in the presence of water for the band structure, SEM, FEM, and FBG experimental results. For many applications, the larger relative size of the band gap is preferable [26,27]. However, it is interesting to note that while decreasing the band-gap width and the center frequency, the relative size of the band gap also decreases for the second band gap when there is fluid-solid coupling.
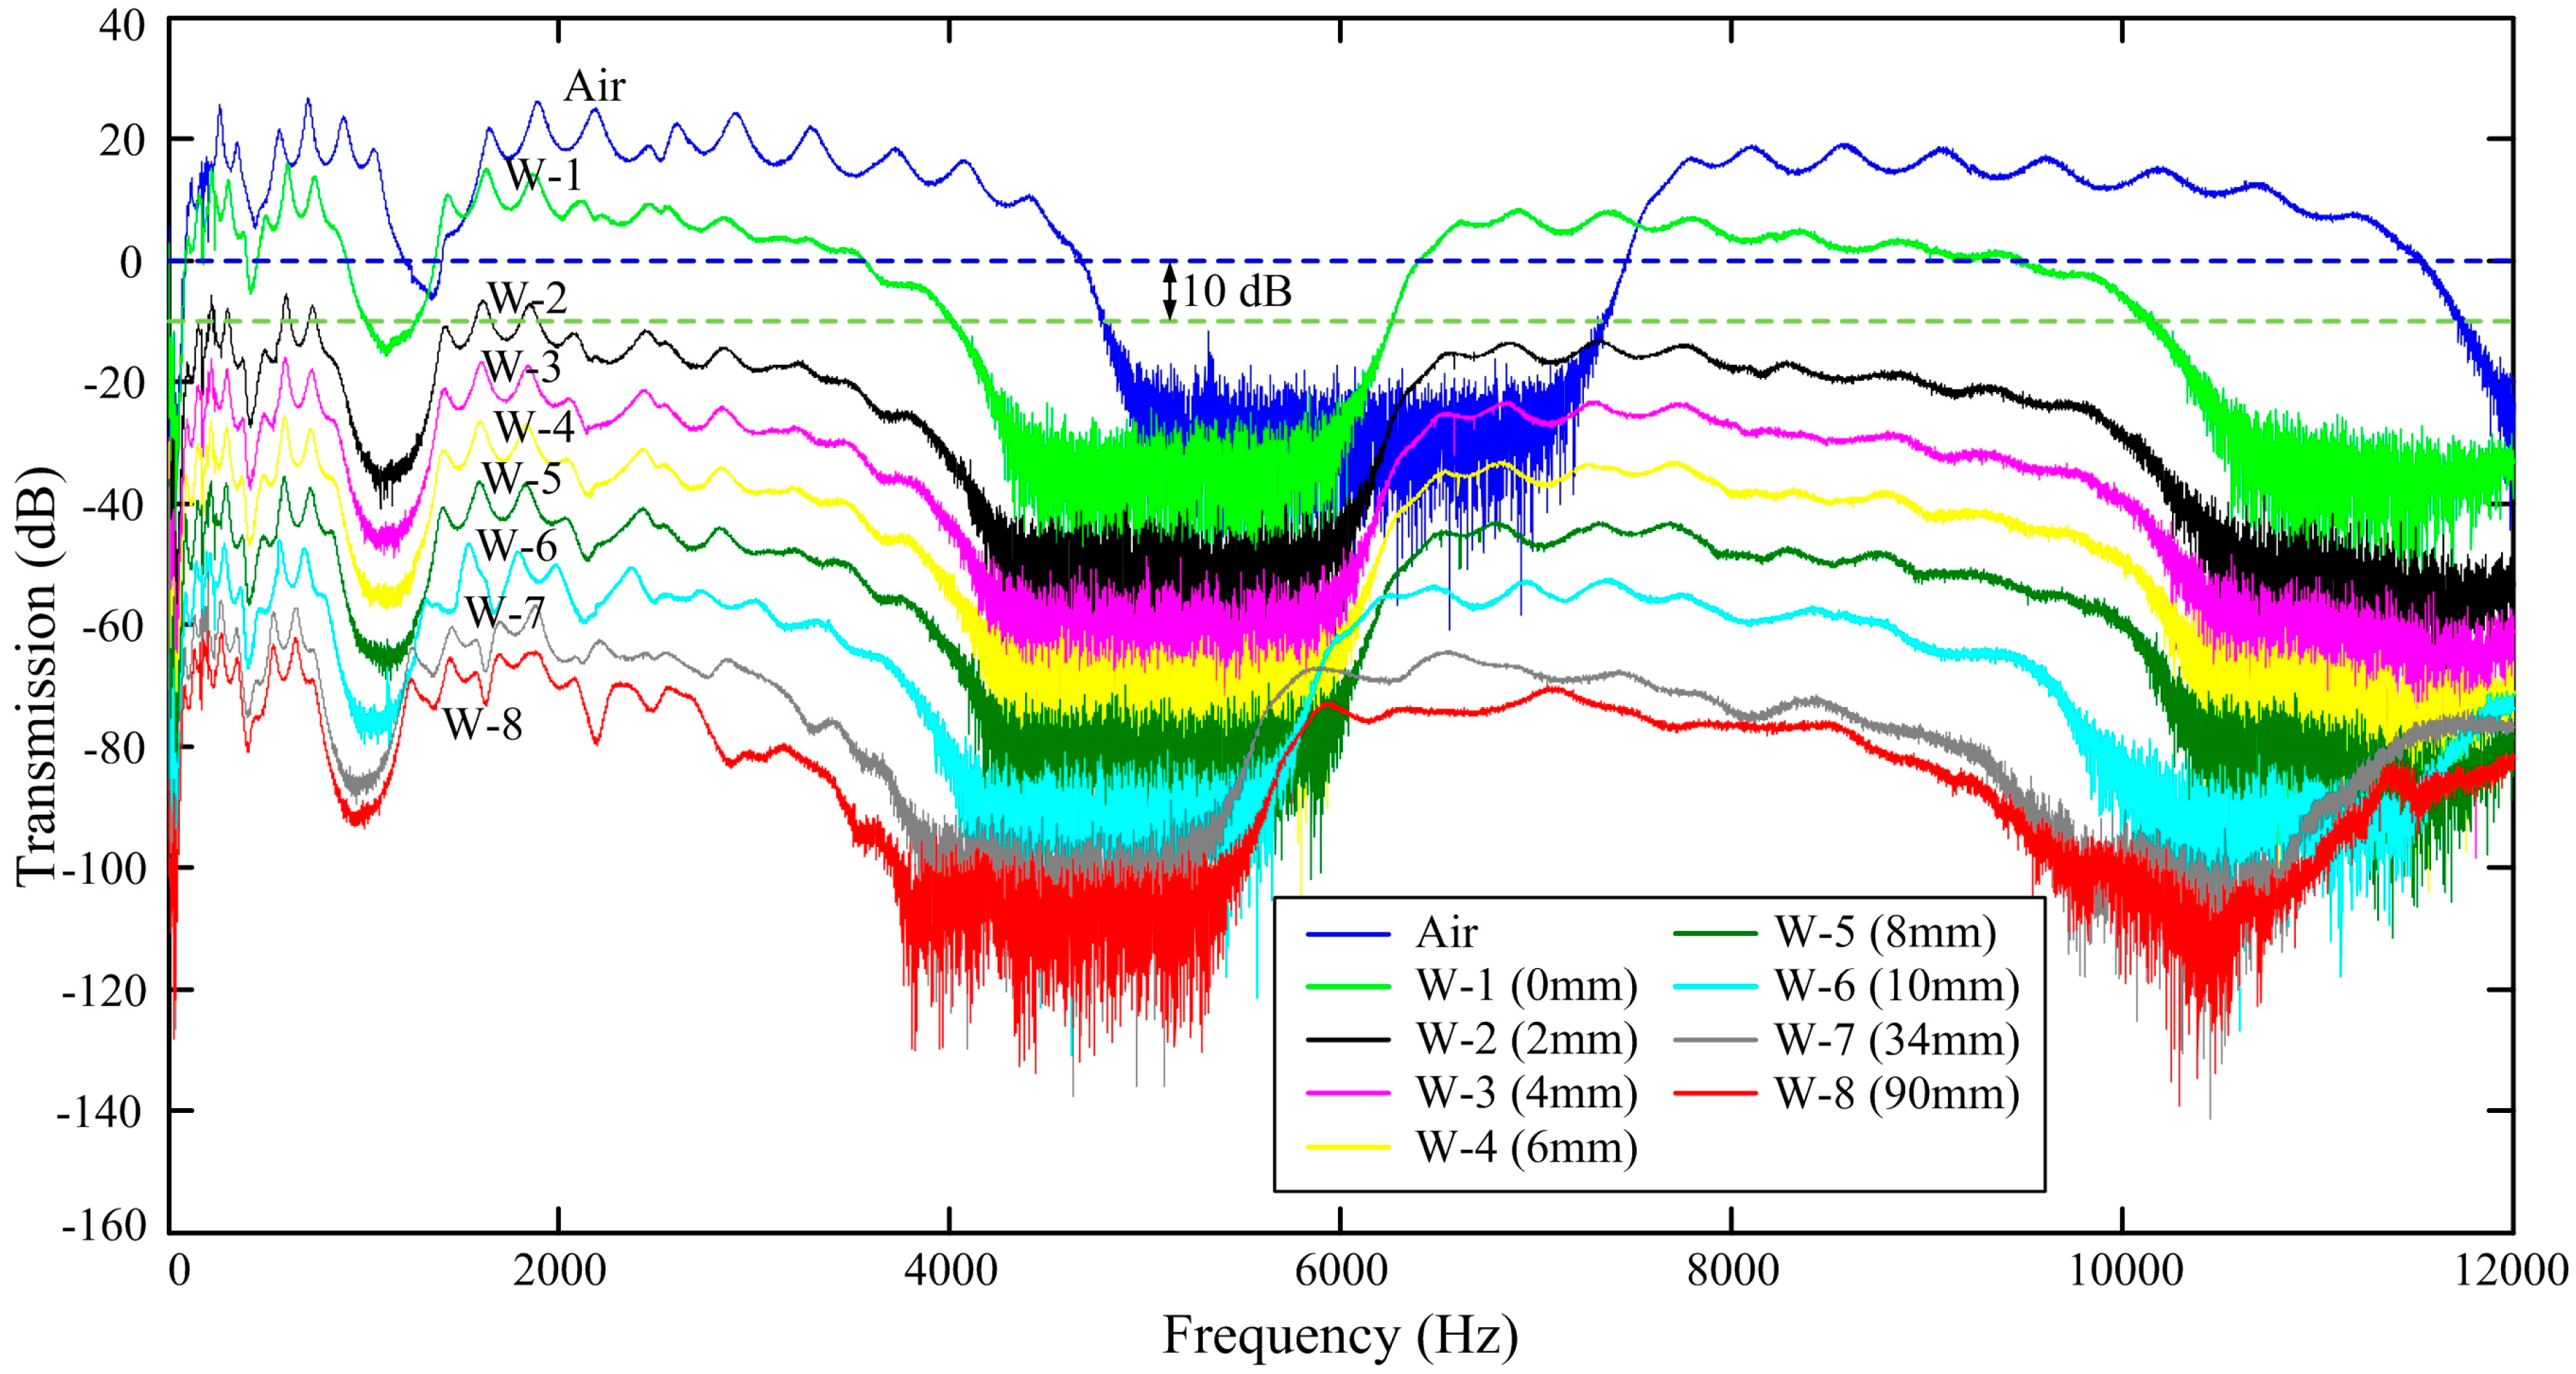
Next, to clearly demonstrate the influence of the coupling of the water on the displacement transmission and the band gaps, we detect the displacement transmissions of the PC beam with different immersed depths. Figure 6 shows the experimental results performed in different operation conditions (i.e., in air, fully, or partially immersed in water). During the experiments, the water is first filled to the bottom surface of the PC beam, then the water depth is increased with an increment of 2 mm until the top surface of the PC beam is immersed with a layer of water. Then, the water is filled to the lower edge of the fiber grating and finally the water tank is full of water. We obtain the displacement transmission at these operation conditions. The experimental results performed in air and fully immersed in water have been plotted in Figure 4 and we plot them again in Figure 6 for the purpose of comparisons. There are nine displacement transmissions, in which W-1 is the result when the water just touches the bottom surface of the PC beam, W-2 to W-6 are the results of the PC beam immersed with different water depths, W-7 is the result when the lower edge of the grating section touches the water surface, and W-8 is the result when the water tank is full of water. Except for the results in air, each result shown in Figure 6 is shifted 10 dB for clearer observation. The shift of 10 dB is illustrated in the case of W-1, in which the 0 dB lines (i.e., blue dashed line for the case in air and green dashed line for the case in W-1) are shifted 10 dB downward.
The band-gap widths, center frequencies, and percentage of shifts of the center frequencies for different operation conditions are listed in Table 3. The water depths listed in Table 3 are measured from the bottom surface of the PC beam. In addition, 0 mm in Table 3 means the bottom surface of the PC beam is just wet. From Figure 6 and Table 3 we can see that, the resonant peaks and band gaps shift to lower frequencies as more surface area of the PC beam immersed in water. From Table 3 we can also see that the percentage of shift of the center frequencies are very close but the absolute shifts of the center frequencies gets larger for higher-order band gaps. First, from the results of W-2, W-3, W-4, and W-5 (i.e., partially immersed in water with different water depths), we can see that the variations of the displacement properties are not much compared to those properties when the bottom surface of the PC beam just touches the water (i.e., W-1). However, significant shifts of the center frequencies can be found by comparing the dry PC beam and the case of W-1. When the PC beam is partially immersed in water, the submerged part of the PC beam has larger effective density due to the added mass than the density of the dry part of the PC beam [23]. The increasing of the effective density decreases the pass bands and the band gaps. After the top surface of the PC beam touches the water (i.e., in the case of W-6 and the top surface of the PC beam is wet), larger shifts of the band gaps as well as resonant peaks can again be observed due to additional fluid-interaction of pressure field from the top surface of the PC beam.
From the results of W-7 (i.e., the water just reaches the lower edge of the grating) and W-8 (i.e., the water tank is full of water), we can again validate that the FBG displacement sensors are very suitable to detect dynamic responses of the submerged PCs. In fact, the reflected light spectrum of the FBG sensors almost remains unchanged for the FBG sensors immersed in water or not. Thus, the differences in W-7 and W-8 are not attributed to the coupling of the water to the light in fiber but to the added mass of the water on the PC beam for different water depths. Finally, as the water depth increases, the structural damping interacted with water gets stronger and the amplitudes of the resonant peaks at pass bands are decreased. In fact, some modes are merged during fluid-solid interaction [33,34].
4. Conclusions
In this work, we investigated the band-gap and transmission properties of a PC beam partially or fully immersed in water. Using SEM, the band structures of the infinite PC beams and displacement transmission of the finite PC beam in vacuo and in water are obtained. A fiber Bragg grating (FBG) displacement sensing system is set up to detect the displacement transmission. Due to the well-screened core mode coupling, submerged FBGs are intrinsically insensitive to surrounding fluid and this makes the FBGs suitable candidates in sensing dynamic vibrations of submerged PCs. Then, we vary the depth of the water and investigate the influence of the fluid-solid coupling on the lowering of the band gaps as well as the resonant frequencies. When the PC beam is partially immersed in water, the submerged part of the PC beam has larger effective density due to the added mass which decreases the pass bands and the band gaps. Larger shifts of the band gaps and resonant peaks can be observed due to additional fluid-interaction of pressure field even when the top surface of the PC beam is only covered by a layer of water. Furthermore, we experimentally observed that as the water depth increases, the structural damping interacting with water gets stronger and the amplitudes of the resonant peaks at pass bands decrease as some modes merge during the fluid-solid interaction. We also showed the correspondence between the steady-state vibration profiles of the PC beam and the surrounding acoustic pressure field pattern. Inside the band gaps, the acoustic pressure field decays along the PC beam. The energy of the acoustic pressure is decayed away from the excitation point instead of uniformly distributed along the PC beam. This work indicates the feasibility of tuning band gaps through fluid-solid coupling and the results might be useful in the research of the FSI problem for periodic structures such as phononic crystals or metamaterials. Our future work includes investigating the influence of the fluid-solid coupling on local-resonance-induced band gaps.
Acknowledgments
This research work was supported by the National Natural Science Foundation of China (Nos. 11672263 and 11532011). The costs to publish this paper in open access were covered by the National Natural Science Foundation of China (Nos. 11672263).
Author Contributions
Kuo-Chih Chuang, Xiang Fang, and Zhi-Long Huang conceived and designed the main ideas together; Xiang Fang and Kuo-Chih Chuang performed theoretical analysis; Kuo-Chih Chuang conceived and designed the experiments; Xiang Fang and Zhi-Wen Yuan performed the experiments and numerical simulation; Kuo-Chih Chuang, Xiang Fang, Zhi-Wen Yuan, and Zhi-Long Huang analyzed the data; Kuo-Chih Chuang and Xiang Fang wrote the paper draft. All authors conducted subsequent improvements to the manuscript.
Conflicts of Interest
The authors declare no conflict of interest. The funding sponsors had no role in the design of the study; in the collection, analyses, or interpretation of data; in the writing of the manuscript, and in the decision to publish the results.
References
- Kushwaha, M.S.; Halevi, P.; Dobrzynski, L.; Djafari-Rouhani, B. Acoustic band structure of periodic elastic composites. Phys. Rev. Lett. 1993, 71, 2022–2025. [Google Scholar] [CrossRef] [PubMed]
- Hussein, M.I.; Leamy, M.J.; Ruzzene, M. Dynamics of phononic materials and structures: Historical origins, recent progress and future outlook. Appl. Mech. Rev. 2014, 66, 040802. [Google Scholar] [CrossRef]
- Xiao, X.Y.; Chen, R.P. Acoustic band gap extension in one-dimensional solid/fluid phononic crystal hetero structure. J. Comput. Acoust. 2014, 22, 1450010. [Google Scholar] [CrossRef]
- Li, G.; Chen, G.; Peng, P.; Cao, Z.; Ye, H. Manipulation of resonant tunneling by substrate-induced inhomogeneous energy band gaps in graphene with square super lattice potentials. Phys. Lett. A 2013, 377, 2895–2900. [Google Scholar] [CrossRef]
- Yu, D.; Wen, J.; Zhao, H.; Liu, Y.; Wen, X. Vibration reduction by using the idea of phononic crystals in a pipe-conveying fluid. J. Sound Vib. 2008, 318, 193–205. [Google Scholar] [CrossRef]
- Khelif, A.; Choujaa, A.; Djafari-Rouhani, B.; Wilm, M.; Ballandras, S.; Laude, V. Trapping and guiding of acoustic waves by defect modes in a full-band-gap ultrasonic crystal. Phys. Rev. B 2003, 68, 214301. [Google Scholar] [CrossRef]
- Jin, Y.; Pennec, Y.; Pan, Y.; Djafari-Rouhani, B. Phononic crystal plate with hollow pillars actively controlled by fluid filling. Crystals 2016, 6, 64. [Google Scholar] [CrossRef]
- Wen, J.H.; Wang, G.; Yu, D.L.; Zhao, H.G.; Liu, Y.Z. Theoretical and experimental investigation of flexural wave propagation in straight beams with periodic structures: Application to a vibration isolation structure. J. Appl. Phys. 2005, 97, 114907. [Google Scholar] [CrossRef]
- Hsiao, F.L.; Khelif, A.; Moubchir, H.; Choujaa, A.; Chen, C.C.; Laude, S. Complete band gaps and deaf bands of triangular and honeycomb water-steel phononic crystals. J. Appl. Phys. 2007, 101, 044903. [Google Scholar] [CrossRef]
- Lucklum, R.; Li, J. Phononic crystals for liquid sensor applications. Meas. Sci. Technol. 2009, 20, 124014. [Google Scholar] [CrossRef]
- Khelif, A.; Choujaa, A.; Laihem, R.; Wilm, M.; Ballandras, S.; Laude, V.; Solal, M. Experimental study of band gaps and defect modes in a two-dimensional ultrasonic crystal. In Proceedings of the IEEE International Ultrasonics Symposium, Honolulu, Hawaii, USA, 8 October 2003; IEEE: Piscataway, NJ, USA, 2006; pp. 377–380. [Google Scholar]
- Casadei, F.; Bertoldi, K. Harnessing fluid-structure interactions to design self-regulating acoustic metamaterials. J. Appl. Phys. 2014, 115, 2075–2084. [Google Scholar] [CrossRef] [Green Version]
- Van Eysden, C.A.; Sader, J.E. Resonant frequencies of a rectangular cantilever beam immersed in a fluid. J. Appl. Phys. 2006, 100, 7709. [Google Scholar] [CrossRef]
- Green, C.P.; Sader, J.E. Small amplitude oscillations of a thin beam immersed in a viscous fluid near a solid surface. Phys. Fluids 2005, 17, 073102. [Google Scholar] [CrossRef]
- Naik, T.; Longmire, E.K.; Mantell, S.C. Dynamic response of a cantilever in liquid near a solid wall. Sens. Actuators A 2003, 102, 240–254. [Google Scholar] [CrossRef]
- Phan, C.N.; Aureli, M.; Porfiri, M. Finite amplitude vibrations of cantilevers of rectangular cross sections in viscous fluids. J. Fluids Struct. 2013, 40, 52–69. [Google Scholar] [CrossRef]
- Chon, J.W.M.; Mulvaney, P.; Sader, J.E. Experimental validation of theoretical models for the frequency response of atomic force microscope cantilever beams immersed in fluids. J. Appl. Phys. 2000, 87, 3978–3988. [Google Scholar] [CrossRef]
- Liao, C.Y.; Wu, Y.C.; Chang, C.Y.; Ma, C.C. Theoretical analysis based on fundamental functions of thin plate and experimental measurement for vibration characteristics of a plate coupled with liquid. J. Sound Vib. 2017, 394, 545–574. [Google Scholar] [CrossRef]
- Xiao, Y.; Wen, J.; Wang, G.; Wen, X. Theoretical and experimental study of locally resonant and bragg band gaps in flexural beams carrying periodic arrays of beam-like resonators. J. Vib. Acoust. 2013, 135, 041006. [Google Scholar] [CrossRef]
- Lee, U. Spectral Element Method in Structural Dynamics; John Wiley & Sons: Singapore, 2009. [Google Scholar]
- Hutchinson, J.R. Shear coefficients for Timoshenko beam theory. ASME J. Appl. Mech. 2001, 68, 87–92. [Google Scholar] [CrossRef]
- Öz, H.R. Natural frequencies of an immersed beam carrying a tip mass with rotatory inertia. J. Sound Vib. 2003, 266, 1099–1108. [Google Scholar] [CrossRef]
- Uściłowska, A.; Kołodziej, J.A. Free vibration of immersed column carrying a tip mass. J. Sound Vib. 1998, 216, 147–157. [Google Scholar] [CrossRef]
- Wu, J.S.; Hsu, S.H. A unified approach for the free vibration analysis of an elastically supported immersed uniform beam carrying an eccentric tip mass with rotary inertia. J. Sound Vib. 2006, 291, 1122–1147. [Google Scholar] [CrossRef]
- Zhu, R.; Liu, X.N.; Hu, G.K.; Sun, C.T.; Huang, G.L. A chiral elastic metamaterial beam for broadband vibration suppression. J. Sound Vib. 2014, 333, 2759–2773. [Google Scholar] [CrossRef]
- Wang, P.; Shim, J.; Bertoldi, K. Effects of geometric and material nonlinearities on tunable band gaps and low-frequency directionality of phononic crystals. Phys. Rev. B 2013, 88, 014304. [Google Scholar] [CrossRef]
- Maldovan, M.; Thomas, E.L. Simultaneous complete elastic and electromagnetic band gaps in periodic structures. Appl. Phys. B Lasers Opt. 2006, 83, 595–600. [Google Scholar] [CrossRef]
- Dong, X.; Zhao, R. Detection of liquid-level variation using a side-polished fiber bragg grating. Opt. Laser Technol. 2010, 42, 214–218. [Google Scholar]
- Majumder, M.; Gangopadhyay, T.K.; Chakraborty, A.K.; Dasgupta, K.; Bhattacharya, D.K. Fibre Bragg gratings in structural health monitoring-Present status and applications. Sens. Actuators A Phys. 2008, 147, 150–164. [Google Scholar] [CrossRef]
- Chuang, K.C.; Zhang, Z.Q.; Wang, H.X. Experimental study on slow flexural waves around the defect modes in a phononic crystal beam using fiber bragg gratings. Phys. Lett. A 2016, 380, 3963–3969. [Google Scholar] [CrossRef]
- Yang, W.P.; Wu, L.Y.; Chen, L.W. Refractive and focusing behaviours of tunable sonic crystals with dielectric elastomer cylindrical actuators. J. Phys. D Appl. Phys. 2008, 41, 135408. [Google Scholar] [CrossRef]
- Wu, Z.J.; Li, F.M.; Wang, Y.Z. Study on vibration characteristics in periodic plate structures using the spectral element method. Acta Mech. 2013, 224, 1089–1101. [Google Scholar] [CrossRef]
- Ergin, A.; Uğurlu, B. Linear vibration analysis of cantilever plates partially submerged in fluid. J. Fluids Struct. 2003, 17, 927–939. [Google Scholar] [CrossRef]
- Chuang, K.C.; Ma, C.C.; Wang, C.Y. The measurement of dynamic strain and resonant frequency for three-dimensional solids partially immersed in water using free-edge bonded fiber Bragg grating sensors. Sens. Actuators A 2016, 247, 65–74. [Google Scholar] [CrossRef]
Figure 1.
Schematic representation of: (a) a unit cell of the PC beam immersed in water; (b) the force equilibrium of a submerged beam segment.
Figure 1.
Schematic representation of: (a) a unit cell of the PC beam immersed in water; (b) the force equilibrium of a submerged beam segment.

Figure 2.
Band structure of the phononic crystal beam: (a) without coupling with water; (b) coupling with water (color online).
Figure 2.
Band structure of the phononic crystal beam: (a) without coupling with water; (b) coupling with water (color online).

Figure 3.
Experimental setup of the submerged PC beam and the fiber Bragg grating (FBG) displacement sensing system (color online).
Figure 3.
Experimental setup of the submerged PC beam and the fiber Bragg grating (FBG) displacement sensing system (color online).
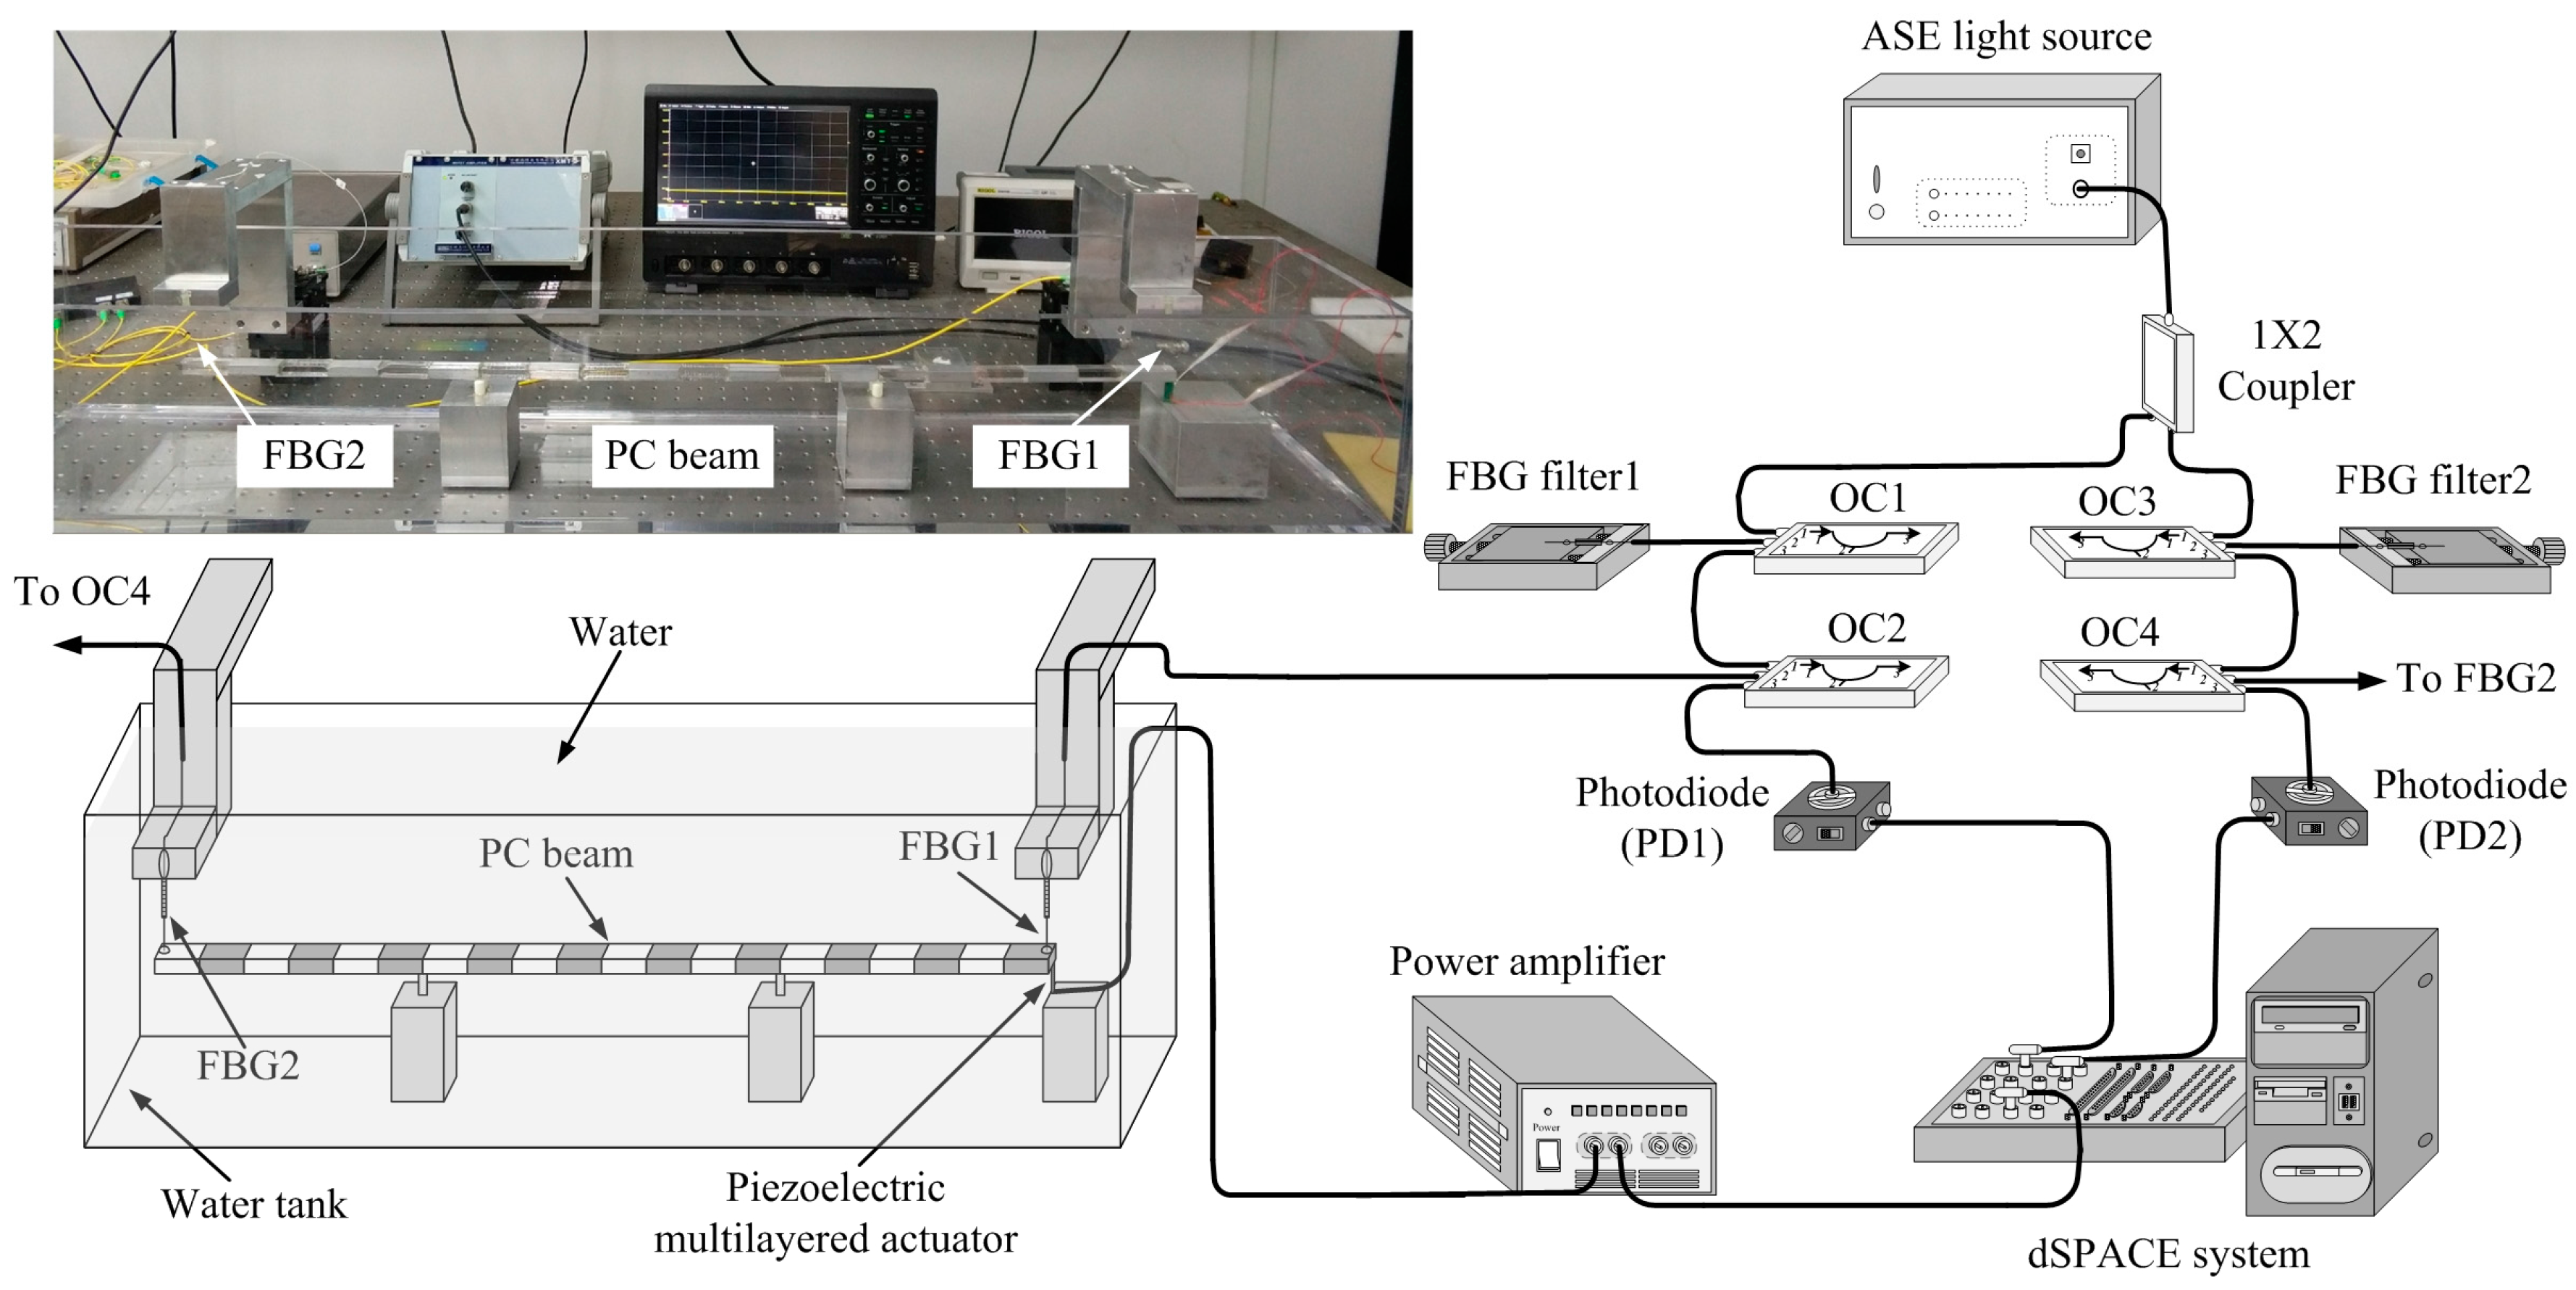
Figure 4.
Displacement transmission obtained by FBG, SEM, and FEM: (a) in air; (b) in water (color online).
Figure 4.
Displacement transmission obtained by FBG, SEM, and FEM: (a) in air; (b) in water (color online).

Figure 5.
Comparison of the steady-state vibration profiles of the PC beam and the relating acoustic pressure fields (“a” stands for acoustic pressure field and “m” stands for steady-state vibration modes) (color online).
Figure 5.
Comparison of the steady-state vibration profiles of the PC beam and the relating acoustic pressure fields (“a” stands for acoustic pressure field and “m” stands for steady-state vibration modes) (color online).

Figure 6.
Shifts of the displacement transmission with different immersed depths (color online).


Table 1.
The relationships between the related band-gap parameters and the dimensions of the immersed PC beam obtained from the band structure calculated by the SEM. a
Table 1.
The relationships between the related band-gap parameters and the dimensions of the immersed PC beam obtained from the band structure calculated by the SEM. a
| Calculation Condition | 1st Band Gap | 2nd Band Gap | |||||||
|---|---|---|---|---|---|---|---|---|---|
| Shift of (Ratio) | (%) | Shift of (Ratio) | (%) | ||||||
| Air | d/D = 0.1 | 4730 | 13,255 | -- | 35.68 | 28,400 | 60,590 | -- | 46.87 |
| d/D = 0.5 | 912 | 2649 | -- | 34.42 | 5643 | 12,118.5 | -- | 46.56 | |
| d/D = 1.0 | 450 | 1325 | -- | 33.96 | 2810 | 6045 | -- | 46.48 | |
| d/D = 1.5 | 311.1 | 881.45 | -- | 35.29 | 1908 | 4045 | -- | 47.17 | |
| Water | d/D = 0.1 | 4589 | 10,645.5 | 2609.5 (19.68%) | 43.1 | 19,910 | 46,685 | 139,05 (22.92%) | 42.65 |
| d/D = 0.5 | 882 | 2140 | 509 (19.60%) | 41.2 | 3975 | 9332.5 | 2786 (22.98%) | 42.59 | |
| d/D = 1.0 | 440 | 1075 | 250 (18.87%) | 40.93 | 2015 | 4722 | 1408 (21.89%) | 42.67 | |
| d/D = 1.5 | 303.4 | 709.9 | 171.55 (19.46%) | 42.74 | 1323 | 3111.5 | 933.5 (23%) | 42.52 | |
a Unit: Hz.
Table 2.
Widths of the band gaps, center frequencies, percentage of shift of the center frequency, and relative size of the band gap in the displacement transmission of the PC beam. a
Table 2.
Widths of the band gaps, center frequencies, percentage of shift of the center frequency, and relative size of the band gap in the displacement transmission of the PC beam. a
| Operation Condition | 1st Band Gap | 2nd Band Gap | |||||||
|---|---|---|---|---|---|---|---|---|---|
| Shift of (Ratio) | (%) | Shift of (Ratio) | (%) | ||||||
| BS | Air | 450 | 1325 | -- | 33.96 | 2810 | 6045 | -- | 46.48 |
| Water | 440 | 1075 | 250 (18.87%) | 40.93 | 2015 | 4722 | 1353 (21.89%) | 42.67 | |
| SEM | Air | 600 | 1296 | -- | 46.96 | 2980 | 6021 | -- | 49.49 |
| Water | 540 | 1044 | 252 (19.44%) | 51.72 | 2160 | 4690 | 1331 (22.11%) | 46.06 | |
| FEM | Air | 600 | 1307 | -- | 45.91 | 2840 | 5990 | -- | 47.41 |
| Water | 560 | 995 | 312 (23.87%) | 56.22 | 2000 | 4599 | 1391 (23.22%) | 43.49 | |
| EXP | Air | 591 | 1353 | -- | 43.68 | 2948 | 6098 | -- | 48.34 |
| Water | 501 | 989 | 364 (26.90%) | 50.66 | 2030 | 4531 | 1567 (25.70%) | 44.80 | |
a Unit: Hz.
Table 3.
Widths of the band gaps, center frequencies, and percentage of shift of the center frequency in the displacement transmission of the PC beam operated in different experimental conditions. a
Table 3.
Widths of the band gaps, center frequencies, and percentage of shift of the center frequency in the displacement transmission of the PC beam operated in different experimental conditions. a
| Experimental Condition (Depth) | 1st Band Gap | 2nd Band Gap | ||||
|---|---|---|---|---|---|---|
| Shift of (Ratio) | Shift of (Ratio) | |||||
| Air (--) | 591 | 1353 | -- | 2948 | 6098 | -- |
| W-1 (0 mm) | 581 | 1146 | 207 (15.30%) | 2566 | 5140 | 958 (15.71%) |
| W-2 (2 mm) | 575 | 1125 | 228 (16.85%) | 2533 | 5081 | 1017 (16.68%) |
| W-3 (4 mm) | 566 | 1119 | 234 (17.29%) | 2518 | 5064 | 1034 (16.96%) |
| W-4 (6 mm) | 561 | 1116 | 237 (17.52%) | 2486 | 5051 | 1047 (17.17%) |
| W-5 (8 mm) | 561 | 1110 | 243 (17.96%) | 2509 | 5035 | 1063 (17.43%) |
| W-6 (10 mm) | 511 | 1065 | 288 (21.29%) | 2324 | 4838 | 1260 (20.66%) |
| W-7 (34 mm) | 507 | 993 | 360 (26.61%) | 2035 | 4540 | 1558 (25.55%) |
| W-8 (90 mm) | 501 | 989 | 364 (26.90%) | 2030 | 4531 | 1567 (25.70%) |
a Unit: Hz.
© 2017 by the authors. Licensee MDPI, Basel, Switzerland. This article is an open access article distributed under the terms and conditions of the Creative Commons Attribution (CC BY) license (http://creativecommons.org/licenses/by/4.0/).
Share and Cite
MDPI and ACS Style
Fang, X.; Chuang, K.-C.; Yuan, Z.-W.; Huang, Z.-L. Experimental and Theoretical Investigation of Lowering the Band Gaps of Phononic Crystal Beams through Fluid-Solid Coupling. Crystals 2017, 7, 366. https://doi.org/10.3390/cryst7120366
AMA Style
Fang X, Chuang K-C, Yuan Z-W, Huang Z-L. Experimental and Theoretical Investigation of Lowering the Band Gaps of Phononic Crystal Beams through Fluid-Solid Coupling. Crystals. 2017; 7(12):366. https://doi.org/10.3390/cryst7120366
Chicago/Turabian StyleFang, Xiang, Kuo-Chih Chuang, Zhi-Wen Yuan, and Zhi-Long Huang. 2017. "Experimental and Theoretical Investigation of Lowering the Band Gaps of Phononic Crystal Beams through Fluid-Solid Coupling" Crystals 7, no. 12: 366. https://doi.org/10.3390/cryst7120366
Note that from the first issue of 2016, this journal uses article numbers instead of page numbers. See further details here.