
Influence of Alkali Metal Substitution on the Phase Transition Behavior of CsGaQ2 (Q = S, Se)


1
Institut für Anorganische Chemie, Universität Regensburg, Universitätsstraße 31, 93040 Regensburg, Germany
2
Deutsches Elektronensynchrotron (DESY), Notkestraße 85, 22607 Hamburg, Germany
*
Author to whom correspondence should be addressed.
Crystals 2017, 7(12), 379; https://doi.org/10.3390/cryst7120379
Submission received: 20 October 2017
/
Revised: 27 November 2017
/
Accepted: 4 December 2017
/
Published: 14 December 2017
(This article belongs to the Special Issue Synthesis and Structural Investigations of Polymorphic Compounds)
Abstract
:The formation of solid solution series Cs1−xMxGaQ2-mC64 (M = K, Rb; Q = S, Se; x = 0–1) was studied by X-ray diffraction and spectroscopic methods, revealing a complete miscibility of CsGaQ2-mC64 with RbGaQ2 and KGaSe2, and a large miscibility gap with KGaS2. All solid solution members exhibit similar Raman spectra, indicating the covalent Ga-Q bonding character. The similar optical band gaps likewise further contribute to this conclusion. Up to a certain degree of substitution, these solid solutions undergo a phase transition similar to CsGaQ2-mC64. The influence of the substitution parameter x on phase transition process was investigated in situ using high-temperature X-ray powder diffraction experiments. Phase-pure solid solutions of the high-temperature polymorphs Cs1−xMxGaQ2-mC16 were obtained up to xmax(K) = 0.1 and xmax(Rb) = 0.3. The crystal structures of these new CsGaQ2-mC16 analogous high-temperature phases were refined from synchrotron diffraction data by Rietveld-refinement.
1. Introduction
Chalcogenometallates of the group 13 metals containing alkali metal cations MxTyQz (M = alkali metal, T = triel, Q = chalcogen) are interesting materials for technical applications because of their semiconducting properties [1]. These solids crystallize in a large variety of different crystal structures [2]. The main structural features of these compounds are the oligomeric or polymeric one-, two-, or three-dimensional (1D, 2D, 3D) anions formed by condensed TQ4 tetrahedra. The crystal structures of the resulting solids contain these anionic chains, layers, or networks embedded in the surrounding alkali metal cations. Among all known compounds, the MTQ2 phases are known for most of the possible element combinations. The dominating structure type among these solids is the TlGaSe2 structure type [3], featuring anionic layers [T4Q84−]. This structure type obviously has a very high tolerance for different combinations of the involved elements. Another structural motif of MTQ2 phases are the anionic chains [TQ2−] found in the Tl2Se2 [4] and KFeS2 [5] structure types, respectively. Only the high-temperature polymorphs of CsGaS2 [6] and CsGaSe2 [7] crystallize in the latter type, but no analogous phase transition is known for the lighter homologous compounds. This behavior likely results from the higher degree of spatial separation necessary for the formation of one-dimensional structures, which can only be realized by the larger cesium cations.
Herein, we report on the synthesis of new phases with the KFeS2 structure type. Based on our investigations on the high-temperature phase transitions of CsGaS2 (Ttrans = 600 °C) and CsGaSe2 (Ttrans = 610 °C), we decided to explore the possibilities of the formation of solid solutions of these compounds with RbGaQ2 and KGaQ2. As the compounds KGaQ2 [8,9], RbGaQ2 [10,11] and the low-temperature phases CsGaQ2-mC64 [6,7] (Q = S, Se) all crystallize isotypically in the TlGaSe2 structure type, the formation of solid solutions Cs1−xMxGaQ2-mC64 (M = K, Rb; Q = S, Se; x = 0–1) should be possible. CsGaTe2 [12] also crystallizes in the TlGaSe2 structure type, but no phase transition occurs upon heating of this compound. Therefore, no solid solutions using this phase were attempted. The influence of the alkali metal substitution on the high-temperature phase transition behavior of the cesium compounds was further studied in situ by using high-temperature X-ray diffraction techniques. Using this substitution approach, the isolation of new KFeS2 type phases Cs1−xMxGaQ2-mC16 is possible. The solid solutions were also studied by Raman spectroscopy. Furthermore, the influence of the alkali metal substitution on the band gaps of these semiconductors was investigated by UV-VIS diffuse reflectance spectroscopy. The crystal structures of the new high-temperature phases were refined from synchrotron powder diffraction data by Rietveld refinement.
2. Results
2.1. Crystal Structures of the CsGaQ2 Polymorphs
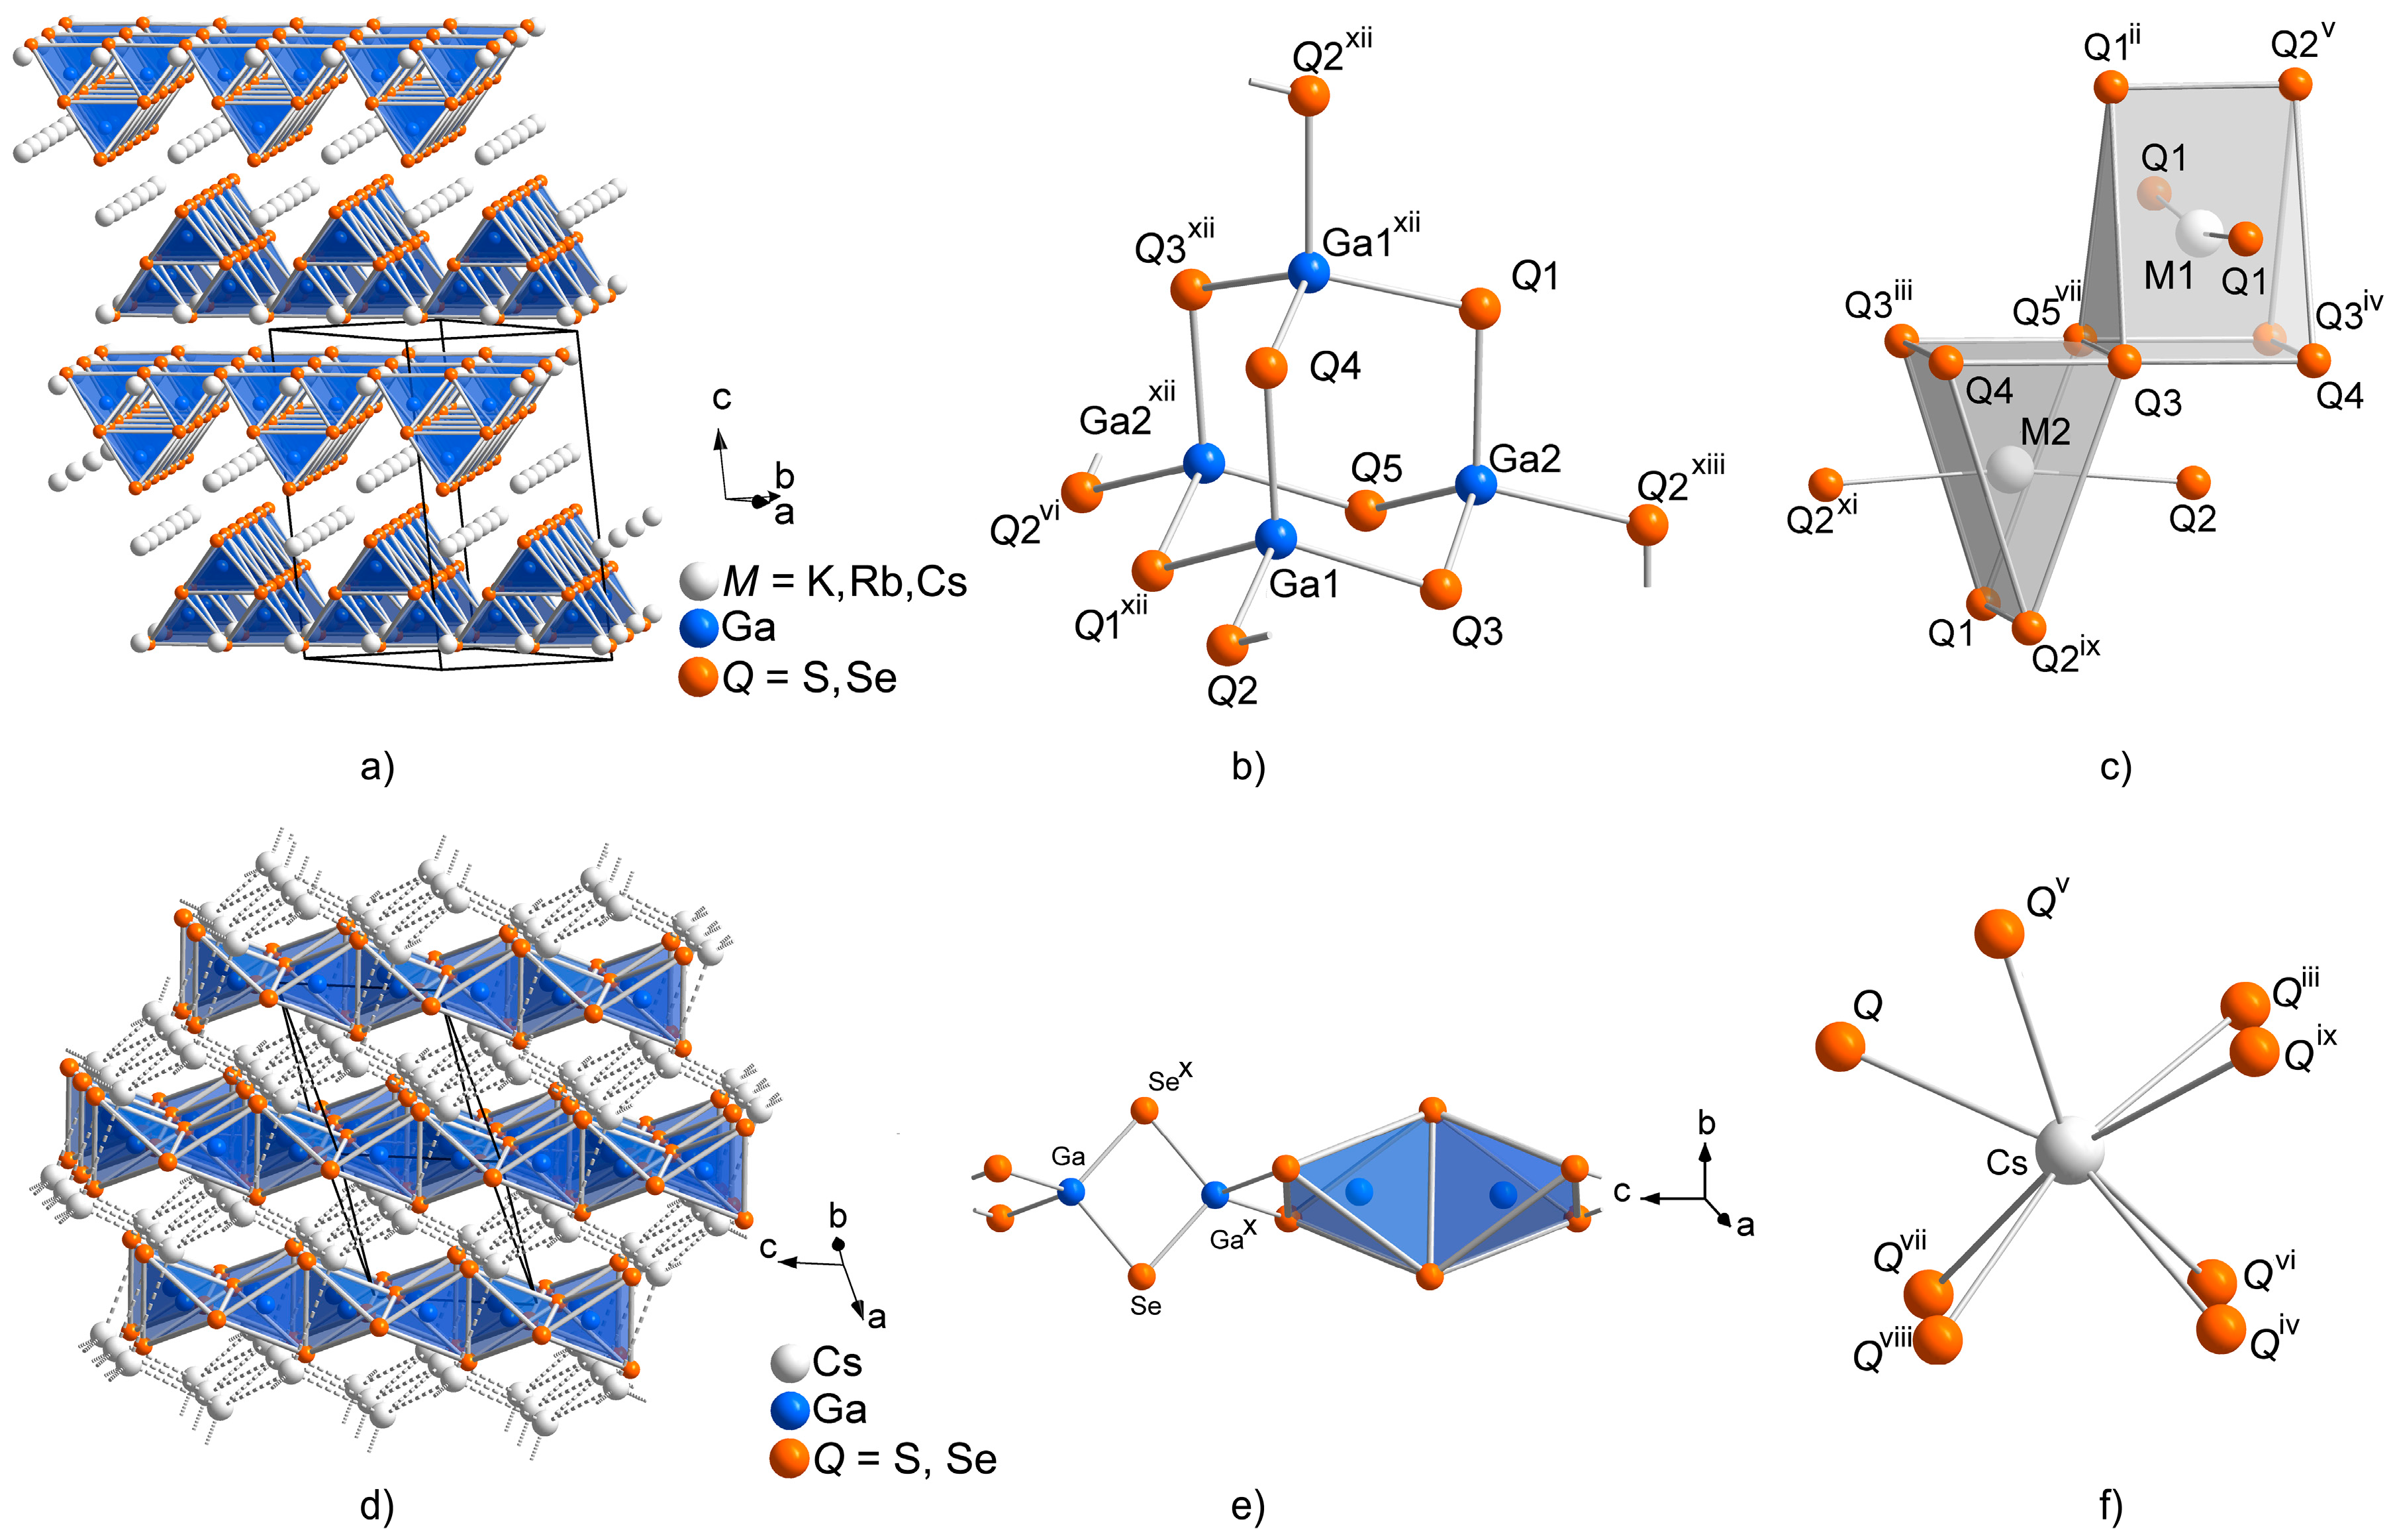
As all investigated compounds and solid solutions in this paper are related to the polymorphic modifications of CsGaS2 and CsGaSe2, the crystal structures of these polymorphs will be discussed beforehand. The low-temperature polymorph CsGaQ2-mC64 [6,7], as well as KGaQ2 [8,9] and RbGaQ2 (Q = S, Se) [10,11], crystallize in the TlGaSe2 structure type (Figure 1, Table 1). The TlGaSe2 structure type features anionic 2D layers [Ga4Q84−], composed of vertex-sharing Ga4Q10 supertetrahedra, stacked along [001]. These layers are penetrated by cesium cations. The cesium cations are 6+2 fold coordinated by chalcogen atoms, resulting in bicapped trigonal prisms.
The high-temperature polymorphs CsGaQ2-mC16 (Q = S, Se) crystallize in the KFeS2 structure type (Figure 1). This structure type features 1D [GaQ2−] anionic chains along [001], formed by edge-sharing tetrahedra. These chains form a hexagonal rod packing embedded in a cationic network with a topology similar to cubic diamond. The cesium cations are eight-fold coordinated by the chalcogenide anions, resulting in an irregular polyhedron. Contrary to the low-temperature phase, which obviously has a very high tolerance for different combinations of the involved elements, only cesium compounds crystallize in this structure type. This is likely due to the higher degree of spatial separation necessary for the formation of the 1D structure, which can only be realized by the larger cesium cations.
2.2. Formation of Solid Solutions Cs1−xMxGaQ2-mC64 (M = K, Rb; Q = S, Se; x = 0–1)
In order to prepare the solid solution series Cs1−xMxGaQ2-mC64 (M = K, Rb; Q = S, Se; x = 0–1) the ternary phases of CsGaQ2-mC64 were mixed with stoichiometric amounts of RbGaQ2 or KGaQ2. x was varied in steps of 0.1, i.e., 10%, for all series under discussion. These mixtures were thoroughly ground in an agate mortar and pressed into compact pellets. Several different annealing temperatures and times were tested to optimize the syntheses. The best quality for these solid solution samples was achieved by annealing the pellets at 550 °C (slightly below the phase transition temperatures of pure CsGaQ2-mC64 [6,7]) for seven days. This step was repeated two more times in order to ensure a maximum intermixture of the starting phases. Afterwards, the samples were homogenized again and investigated by X-ray powder diffraction. Furthermore, the samples were analyzed several times in the course of six months, but no change in the diffraction patterns hinting on a possible phase separation was observed.
2.2.1. X-ray Diffraction Experiments
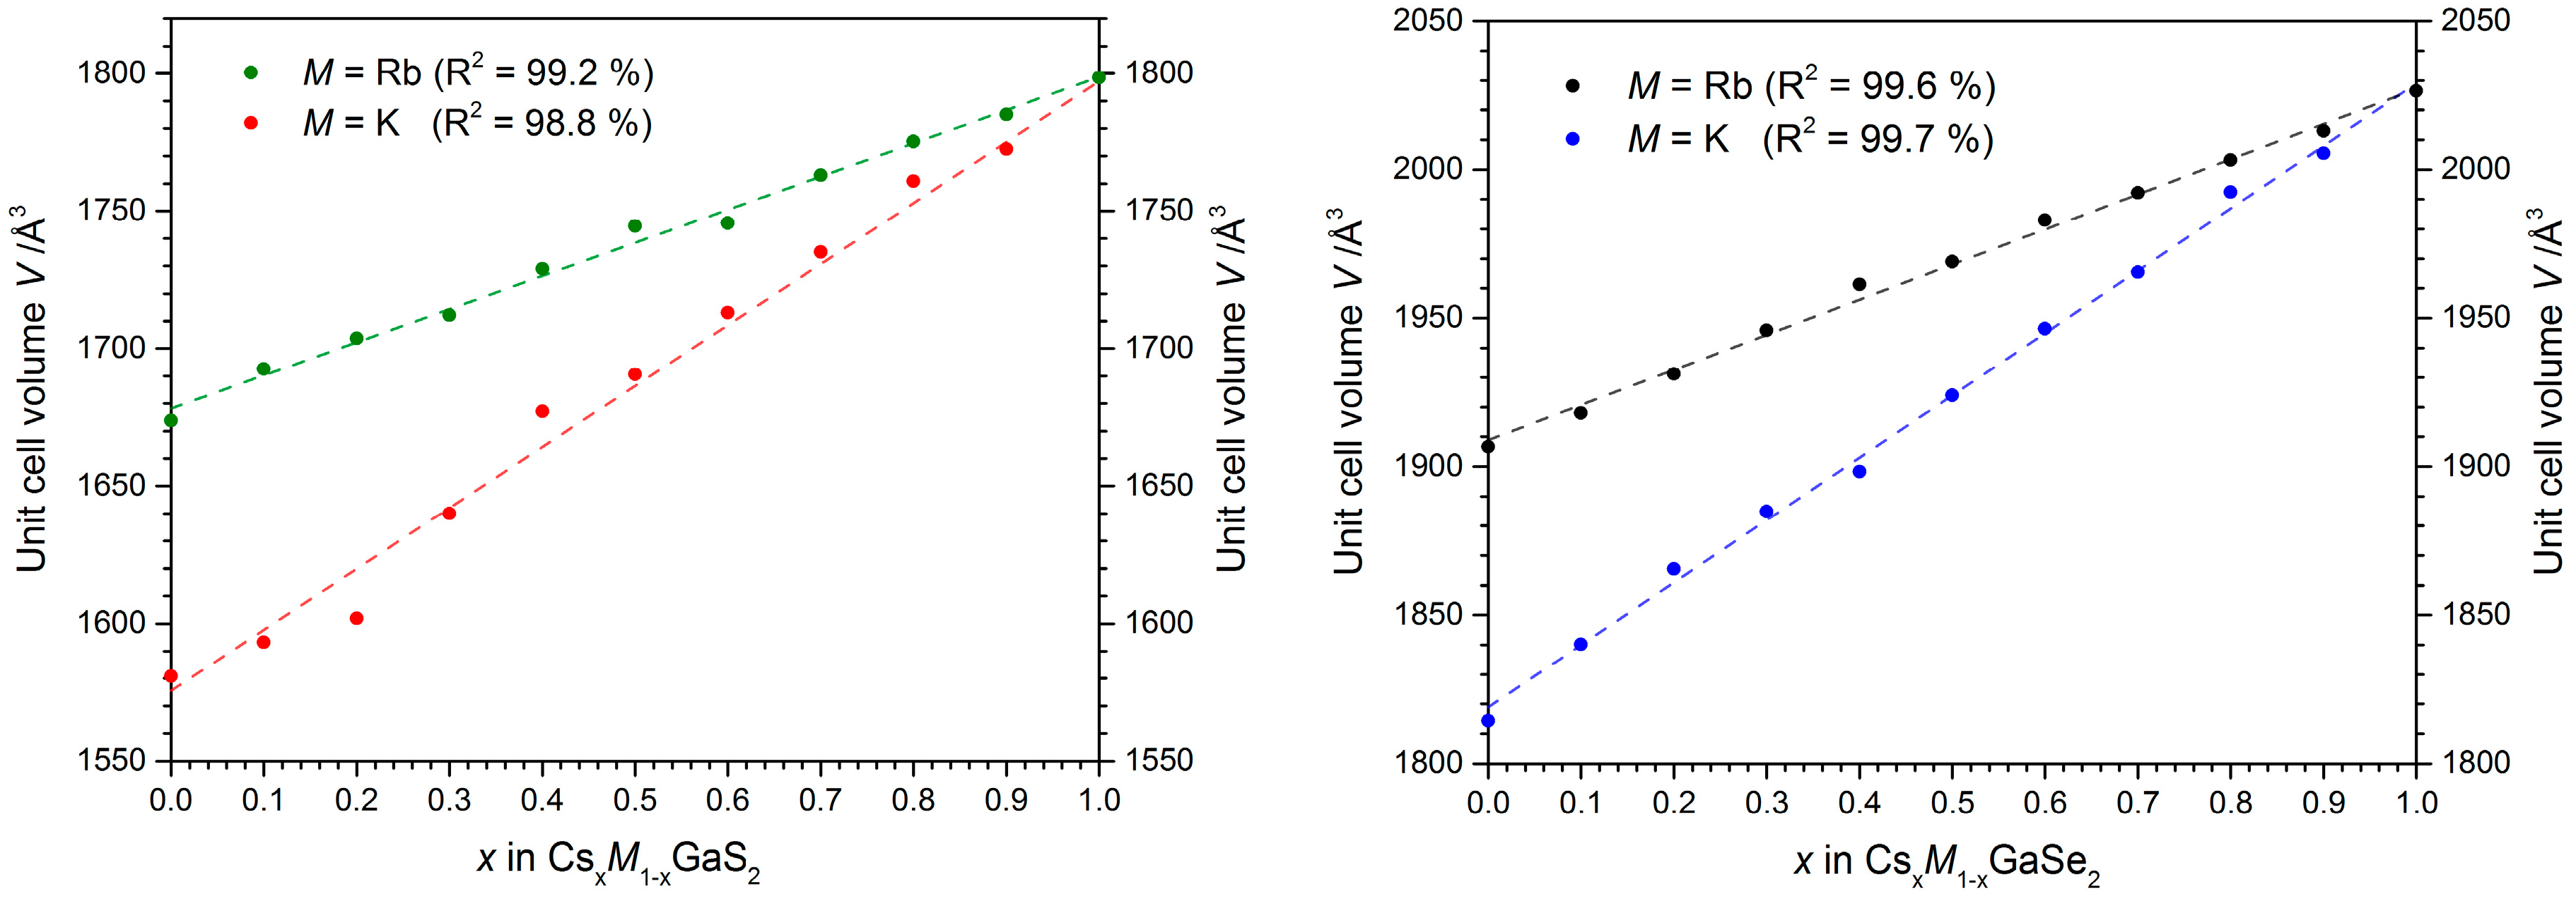
The various diffraction patterns of all solid solution members are shown in the Figures S1–S4. All diffraction patterns resemble the ternary end members, indicating the formation of solid solutions in all four cases. Accordingly, all reflections shift towards larger 2θ values with decreasing cesium content. For the samples with a composition Cs1−xKxGaS2-mC64 (x = 0.4–0.7), a significant broadening of the reflections and additional reflections originating from Ga2S3 were observed. This indicates an incomplete mixture of KGaS2 and CsGaS2-mC64. Figure 2 shows a plot of the refined cell volumes vs. the composition of the different samples.
An increasing unit cell volume with increasing cesium content is observed in all four cases as a general trend. However, a significant deviation from an ideal linear dependence is observed in case of the sulfide samples. This scattering is most pronounced in the series Cs1−xKxGaS2.
2.2.2. Raman Spectroscopy
As all end members and solid solutions under discussion crystallize in the same crystal structure type, we could study the influence of the alkali metal substructure on the vibrational frequencies of these chalcogenotrielates. The Raman spectra of the pure phases KGaQ2, RbGaQ2, and CsGaQ2-mC64, as well as the spectra of the solid solutions of Cs1−xMxGaQ2-mC64 (M = K, Rb; Q = S, Se; x = 0–1), are shown in Figure 3. The Raman spectra of the ternary phases KGaQ2, RbGaQ2, and CsGaQ2-mC64 revealed an almost identical pattern for the sulfides and selenides, respectively.
Consequently, the Raman spectra of all members of the solid solution series Cs1−xMxGaQ2-mC64 (M = K, Rb; Q = S, Se; x = 0–1) also show an identical pattern. This observation confirms that only Ga-Q vibrations of the anionic substructure appear in the Raman spectra of these compounds, at least in the detected frequency range. Ga-S and Ga-Se stretching modes can be attributed to the vibrations in the range from 280–400 cm−1 and 180–300 cm−1, respectively. The vibrations with lower Raman shifts are tentatively assigned as Ga-Q deformation modes or lattice vibrations, respectively. Tables S1 and S2 list all the observed Raman shifts in all of the solid solution series, as well as an assignment of the vibrational modes. The slight blue shift of all vibrations in the spectra of the lighter alkali metals indicate slightly stronger bonds Ga-Q, corresponding to the smaller distances d(Ga-Q) in the rubidium and potassium compounds [6,7,8,9,10,11]. In the solid solutions of Cs1−xRbxGaS2-mC64 (x = 0.3–0.6), we observed one weak peak at 240 cm−1, which can be attributed to the strongest vibration of α-Ga2S3. As this impurity phase is not visible in the X-ray patterns of any of the ternary phases used for the synthesis, this observation could be another hint for an incomplete solid solution of the sulfides at ambient conditions. Other hints for incomplete mixtures, like peak broadening or splitting, however, could not be observed in the Raman spectra.
2.2.3. Optical Properties
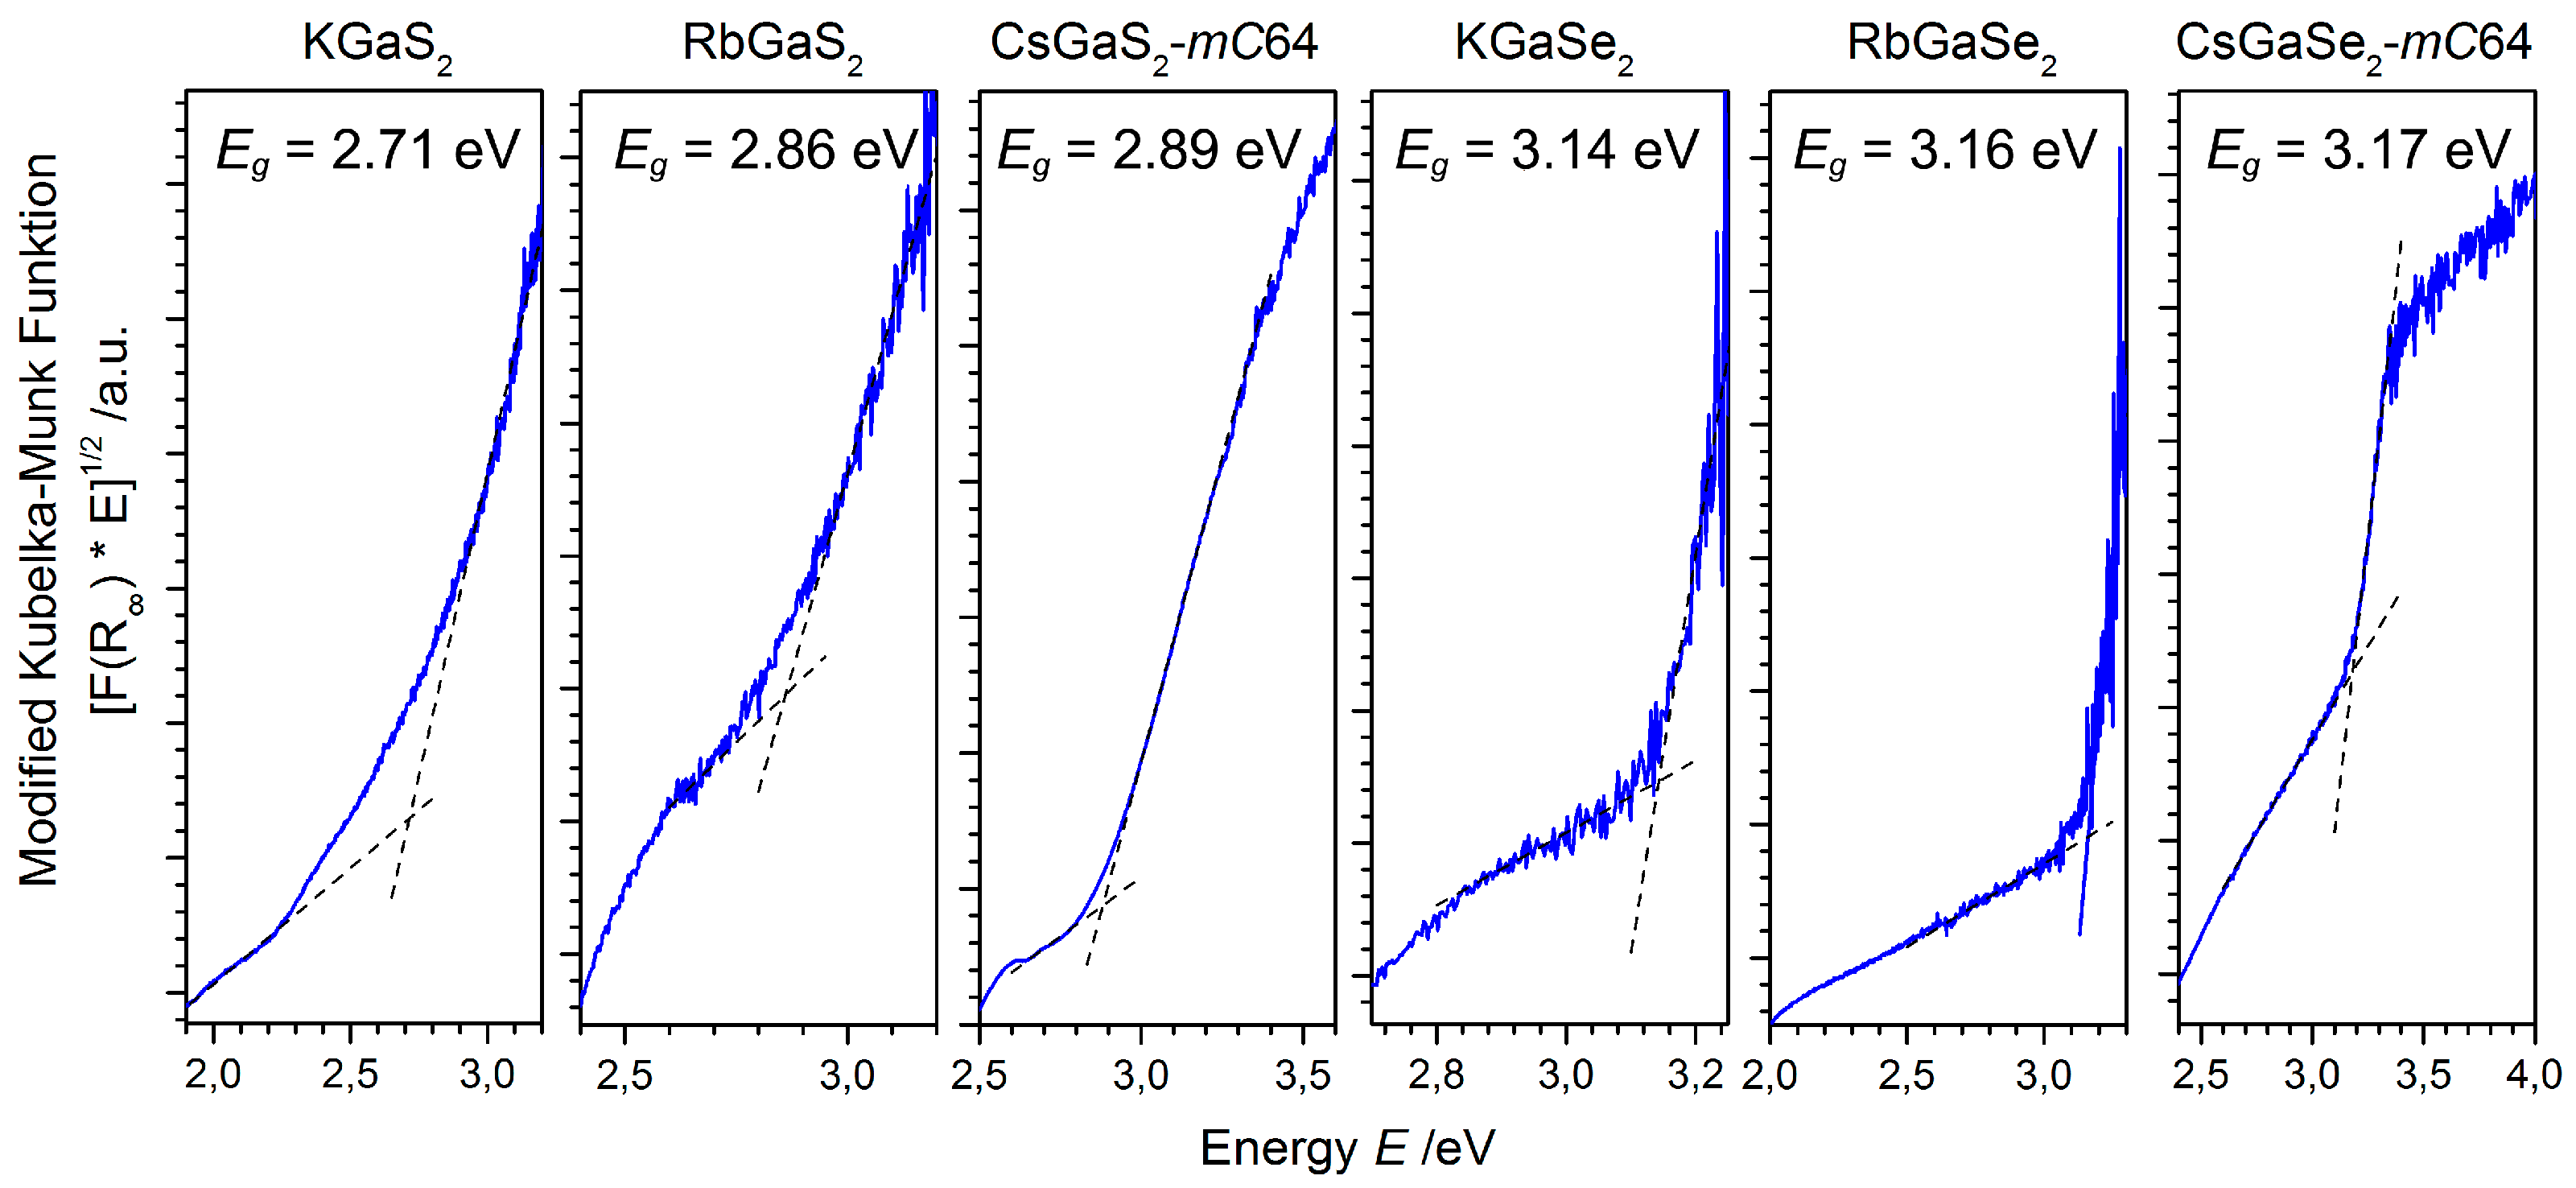
The influence of the alkali metal substitution on the electronic structure, especially the optical band gaps of the solid solutions, was investigated by UV-VIS diffuse reflectance spectroscopy. As only the optical band gaps of KGaSe2, CsGaSe2-mC64, and CsGaS2-mC64 are reported in the literature, we measured the missing band gaps for a complete study (Figure 4). All of these chalcogenides are wide band gap semiconductors with band gaps of about 3 eV corresponding to the white color of the powdered samples.
The comparison of all spectra reveals almost identical band gaps for the respective sulfides and selenides. This observation can easily be interpreted by DFT simulations performed by Feng et al. for KGaSe2 [8] and by us for the cesium compounds [6,7,13] and RbGaSe2 [11]. While these calculated values are in good agreement with experimental data for the sulfides, significant deviations (>1 eV) between the experimental and calculated band gaps were obtained for all selenides [7,8,9,10,11]. These calculations further revealed direct band gaps for the pure ternary chalcogenides. The smaller calculated band gaps in the case of the selenides indicate that conventional calculations apparently underestimate the Ga-Se interactions between the selenogallate layers. For all compounds, however, a similar bonding situation was derived from these calculations. The bonding character of the alkali metals in these compounds is mainly ionic, which can be concluded from the unoccupied K-4s, Rb-5s, and Cs-6s states, respectively. Ga-Q interactions within the GaQ4 tetrahedra cause a splitting into valence and conduction bands. The band gaps are mostly dominated by the Ga-4s, Ga-4p, and the respective p states of the chalcogen atoms (S-3p or Se-4p). The highest occupied alkali metal states (K-3p, Rb-4p, or Cs-5p) are located at energies below −10 eV and, therefore, do not contribute to the states near the band gap, resulting in similar experimental values.
2.3. High-Temperature Phase Transition
2.3.1. Influence of the Alkali Metal Substitution on the Phase Transition Behavior
Following the successful preparation of the solid solution series Cs1−xMxGaQ2-mC64 (M = K, Rb; Q = S, Se; x = 0–1) we decided to study the influence of the alkali metal substitution on the high-temperature behavior (especially the phase transition) of these compounds. An initial analysis using differential thermal analysis (DTA) was not successful and, as in most cases, no thermal effect could be detected. An investigation of the resulting samples using X-ray powder diffraction, however, revealed that, in some cases, the phase transition proceeded nevertheless. Therefore, we investigated these substances in situ using high-temperature X-ray powder diffraction techniques. All experiments were performed with the same experimental conditions (grain-size, temperature program, etc.) to ensure a good comparability of the data. The experiments were performed in the temperature range from 20–900 °C. In the case of a complete phase transition below 900 °C, the experiment was aborted below the maximum temperature. In order to check for a possible phase transition of KGaQ2 and RbGaQ2, these compounds were also investigated by in situ powder diffraction at elevated temperatures.
The in situ experiments revealed a similar behavior of all four solid solution series at elevated temperatures (Supplemental Material Figure S5). For the pure cesium phases a phase transition occurs at 600 °C for CsGaS2-mC64 and 620 °C for CsGaSe2-mC64, respectively. An increase of the potassium or rubidium content in these phases has an influence on the starting temperature and the time necessary for this phase transition. With a decreasing cesium content, the start of the phase transition shifts to higher temperatures. For the solid solutions Cs1−xKxGaS2-mC64 (0 ≤ x ≤ 0.6), Cs1−xRbxGaS2-mC64 (0 ≤ x ≤ 0.6), Cs1−xKxGaSe2-mC64 (0 ≤ x ≤ 0.4), and Cs1−xRbxGaSe2-mC64 (0 ≤ x ≤ 0.6) a phase transition to the mC16 type structure is observed. The selenides with potassium content higher than 40%, however, melt before this solid-solid phase transition occurs. Samples with a higher degree of substitution do not show the mC64 to mC16 phase transition at all.
In order to test which solid solution members actually produced pure samples of the high-temperature phases Cs1−xMxGaQ2-mC16 (M = K, Rb; Q = S, Se; x = 0–1), each sample of the solid solutions Cs1−xMxGaQ2-mC64 (M = K, Rb; Q = S, Se; x = 0–1) was annealed at 950 °C for one week, quenched in ice water, and investigated by X-ray diffraction. This treatment should answer the question, whether the phase transition progressed until completion, or a phase separation takes place at high temperature. Among all samples, only Cs0.9K0.1GaQ2, Cs0.8K0.2GaS2, Cs0.9Rb0.1GaQ2, Cs0.8Rb0.2GaQ2, and Cs0.7Rb0.3GaQ2 (Q = S, Se) showed a phase pure X-ray diffraction pattern analogous to the KFeS2 structure type. Up to a composition of Cs0.6K0.4GaS2, Cs0.5K0.5GaSe2, Cs0.5Rb0.5GaS2, and Cs0.5Rb0.5GaSe2, a separation into a mixture of a TlGaSe2 and a KFeS2 analogous phase could be detected. This mixture is likely composed of a cesium rich solid solution, which underwent a phase transition to the high-temperature polymorph and a corresponding rubidium/potassium rich phase which does not transform. A higher degree of substitution does not lead to a phase transition at all, which is in good agreement with the results of the in situ measurements.
2.3.2. Structure Refinement of New Cs1-xMxGaQ2-mC16 (M = K, Rb; Q = S, Se) Phases
In order to analyze the crystal structures of these CsGaQ2-mC16 (Q = S, Se) analogous solid solutions, we decided to perform Rietveld refinements of the phase pure high-temperature polymorphs. Most diffraction patterns had a bad signal to noise ratio due to the relatively high absorption coefficient (cesium) and X-ray fluorescence (rubidium, selenium) when using Mo-radiation. We, therefore, collected high-quality synchrotron diffraction data using a custom wavelength of λ = 0.20717 Å at the P02.1 beamline at PETRA III (DESY, Hamburg). These measurements revealed that the mixtures Cs0.7Rb0.3GaSe2, Cs0.8K0.2GaS2, and Cs0.9K0.1GaSe2 also contained traces of the low-temperature polymorphs which were not detected from the in-house measurements using Mo-radiation. After indexing of the observed reflections of all samples, we obtained slightly smaller cell volumes compared to the pure cesium compounds CsGaS2-mC16 (V = 493.8(1) Å3) and CsGaSe2-mC16 (V = 544.3(3) Å3), as well as some deviations in the reflection intensities. This indicates that another alkali metal was indeed incorporated into the crystal structures. As a starting model for the Rietveld refinement, we used the solution obtained from charge flipping methods using SUPERFLIP [14] (implemented in Jana2006 [15]). After splitting of the alkali metal site for Cs and M (M = K, Rb) and linking the occupation factors of both alkali metals to ensure charge balance, we tested several different models (1–3) for the structure refinement:
- (1)
- Using the least possible number of restrictions, we initially refined all atomic coordinates and displacement parameters independently with only the occupation factors of the alkali metals restrained to sum up to 1. While this procedure worked for all structures, reasonable refinements could only be obtained using isotropic displacement parameters. Furthermore, some refinements converged with unreasonably large or small displacement parameters of the minority alkali metal.
- (2)
- The best structural R values were obtained by separate refinement of the displacement parameters and atomic coordinates of two independent alkali metal positions. Due to the high cesium content in all solid solutions, only the Cs site could be refined with anisotropic displacement parameters, while isotropic displacement parameters were applied for Rb and K sites, respectively. Even though these refinements yielded the best values, the displacement parameters of the Rb and K sites, respectively, were unreasonably small (Uiso < 0.002 Å2).
- (3)
- As the anisotropic refinement using mixed Cs/M sites always yielded only slightly larger R values, but very reasonable displacement parameters, these results were chosen as the best refinements of these solid solutions.
However, it should be noted that the different treatments only resulted in different structural R values and did not significantly affect the profile fit. The occupation factors for all refinements also differed by a maximum of only 2%. Table 2 lists the crystallographic data of all refined Cs1−xMxGaQ2-mC16 (M = K, Rb; Q = S, Se) phases. Plots of the measured and refined diffraction patterns are collected in the SI, Figures S6–S10. The atomic coordinates and displacement parameters are listed in the supplementary material (Tables S1–S10). As all of these compounds are isotypic, no significant changes in the crystal structures like in the related thioferrates can be observed [16,17,18] Furthermore, due to the relatively low degree of substitution, no significant changes in the bond distances d(Ga-Q) and angles <Q-Ga-Q in the anionic chains are observed, i.e., all calculated distances and angles vary in a range smaller than three times the e.s.d.s. The mixed occupancies of the alkali metal sites and their large displacement parameters, prevents reasonable conclusions concerning any changes of the alkali metal coordination.
3. Discussion and Summary
Our investigations on the solid solutions series Cs1−xMxGaQ2-mC64 (M = K, Rb; Q = S, Se; x = 0–1) revealed, that the formation of such solid solutions is indeed possible. Depending on the chalcogenide and alkali metal combination, however, different mixing behavior is observed. In general, the sulfide mixtures reveal a miscibility gap, while the selenides form a complete solid solution series for both K and Rb. While the possibility of such a gap is only hinted at by the Raman measurements in case of Cs1−xRbxGaS2-mC64, a decreasing miscibility gap for Cs1−xKxGaS2-mC64 with increasing temperature could be observed in the in situ X-ray experiments. All of these solid solutions did not show any hint of a phase separation at room temperature over the course of six months.
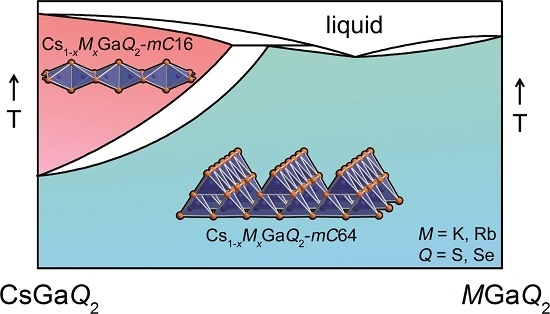
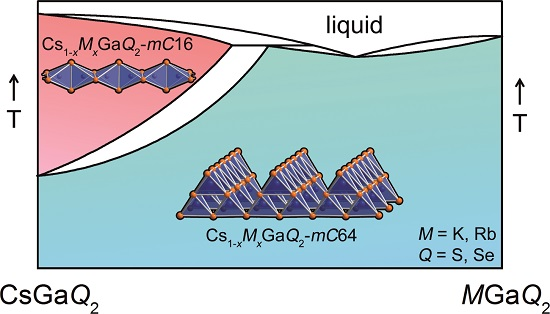
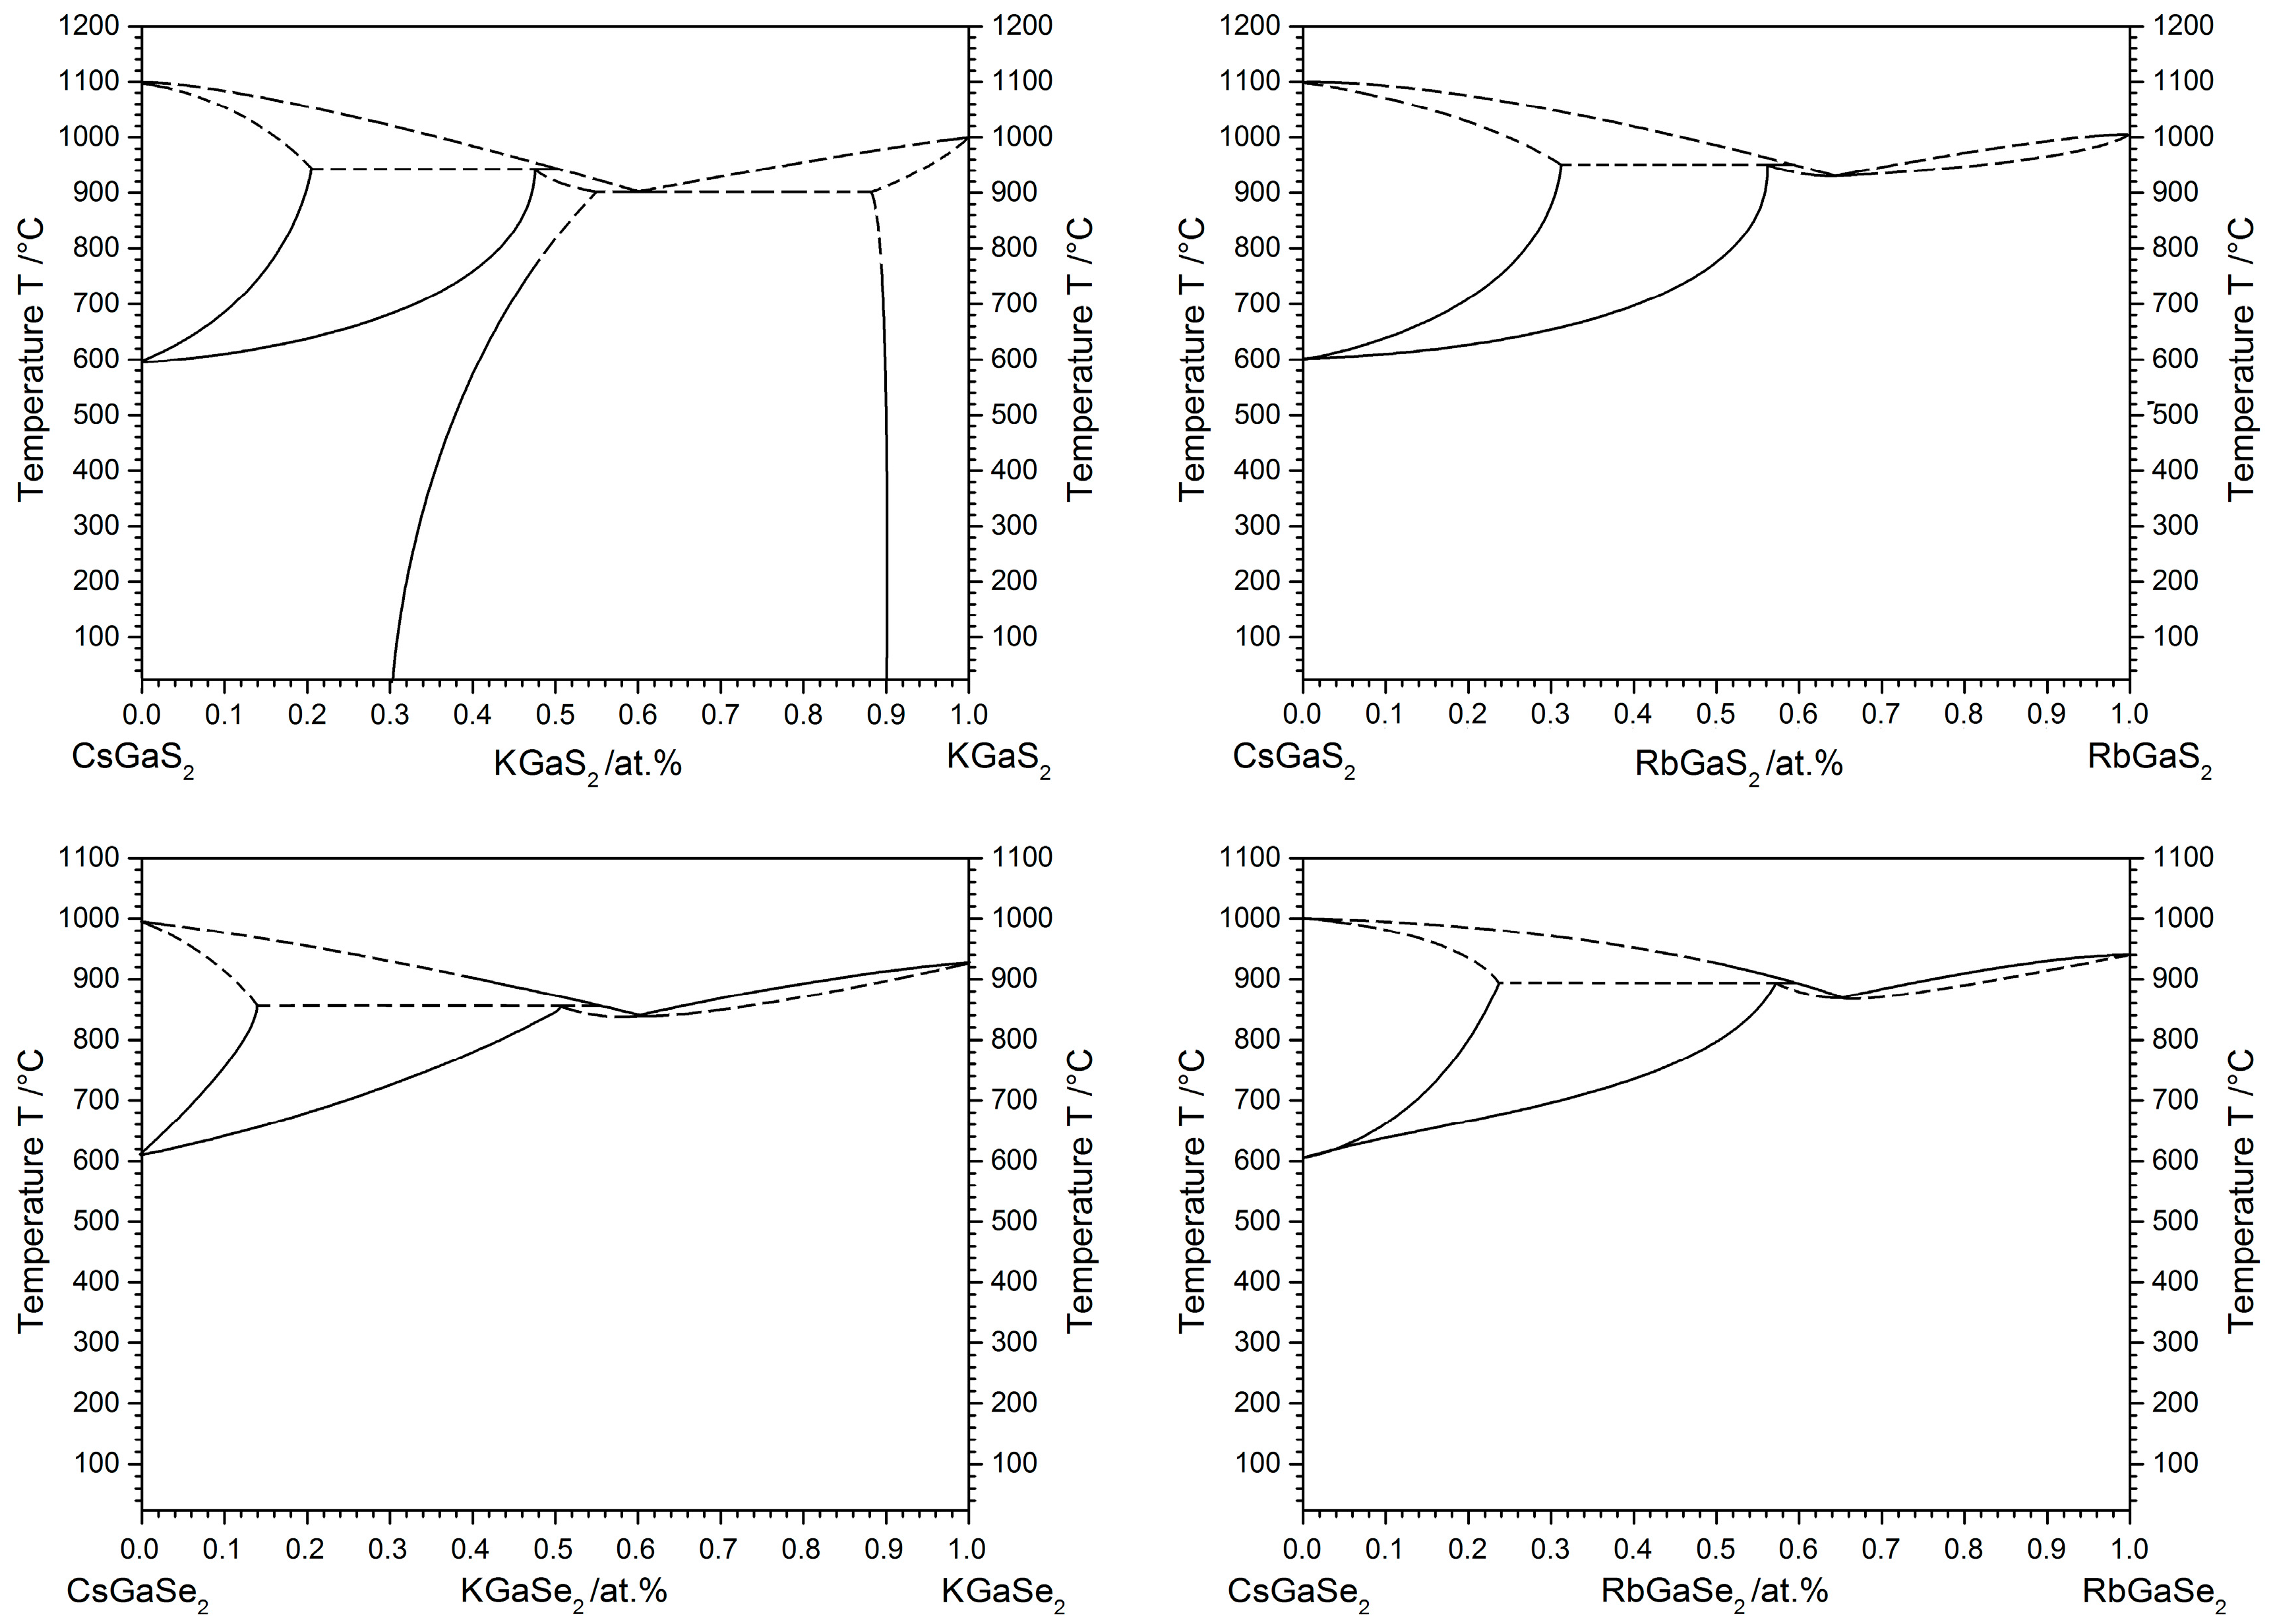
Upon heating of cesium-rich solid solutions, a phase transition similar to the pure cesium phases, i.e., a transformation of the 2D anionic network to 1D strands [6,7] takes place. This process was investigated in situ using X-ray powder diffraction techniques. Up to a degree of substitution of approximately 60 at%, a phase transition could be detected. An in depth analysis, however, revealed, that phase-pure samples of the high-temperature polymorphs could only be obtained up to a 30 at% substitution of cesium. A degree of substitution of 0.3 < x < 0.6 leads to a phase separation into a mixture of a cesium-rich solid solution Cs1−xMxGaQ2-mC16 and a corresponding rubidium/potassium-rich phase Cs1−xMxGaQ2-mC64 where the phase transition is suppressed. Substituting more than 60 at% of cesium completely suppresses the phase transition. The crystal structures of several high-temperature polymorphs of Cs1−xMxGaQ2-mC16 (M = K, Rb; Q = S, Se) were refined from synchrotron powder diffraction data by Rietveld refinement. The combination of all these results leads to the quasi-binary phase diagrams CsGaQ2-MGaQ2, which are depicted in Figure 5.
Analysis of the solid solutions using UV-VIS and Raman spectroscopy revealed further details on the bonding situation in these, and related, chalcogenometallates. Prior investigations using DFT calculations reported in [6,7,8] already revealed covalent Ga-Q (Q = S, Se) interactions in these kind of substances, which is in accordance with the chemical expectations. The character of the alkali metals is mainly ionic, which is concluded from the unoccupied K-4s, Rb-5s, and Cs-6s states. These findings are further confirmed by the Raman spectra of all solid solutions. The pattern of valence and deformation vibrations is more or less identical for all sulfides and selenides, respectively, regardless of the nature of the alkali metals. Only the Ga-Q vibrations of the extended anions are observed by vibrational spectroscopy (lattice vibrations are of course excluded). Substitution of the alkali metals only leads to a slight blue shift of the Raman bands due to the different ionicity of the alkali metals and the shorter distances d(Ga-Q) in the rubidium and potassium compounds. Another consequence of the ionic bonding character of the alkali metals can be derived from the optical band gaps. As the highest occupied alkali metal states (K-3p, Rb-4p, or Cs-5p) are located at energies below −10 eV, the states near the band gap are dominated by the Ga-4s, Ga-4p, and the respective p states of the chalcogen (S-3p or Se-4p). The alkali metals, therefore, do not significantly contribute to the optical band gaps of these chalcogenometallates, as concluded from the almost identical band gaps for all sulfides and selenides, respectively.
4. Materials and Methods
4.1. Synthesis of the Starting Materials
Pure KN3, RbN3, and CsN3 were obtained by passing hydrazoic acid (prepared by acidifying an aqueous solution of NaN3 (99.0%, Sigma-Aldrich, Munich, Germany) into an aqueous solution of K2CO3 (99%, Sigma-Aldrich, Munich, Germany), Rb2CO3 (99%, Sigma-Aldrich, Munich, Germany), or Cs2CO3 (99.9%, Rockwood Lithium, Langelsheim, Germany), respectively. Attention: Condensed NH3 is highly explosive; therefore, tools made from transition metals must be avoided. The binary gallium starting materials Ga2S3 and GaSe were prepared by annealing stoichiometric mixtures of Ga (99.999%, Chempur, Karlsruhe, Germany) and the corresponding chalcogen (99.999%, Chempur, Karlsruhe, Germany) at 1000 °C (Ga2S3) and 850 °C (GaSe), respectively.
4.2. Synthesis of KGaQ2, RbGaQ2, and CsGaQ2-mC64 (Q = S, Se)
The ternary compounds were obtained by slow, controlled thermal decomposition of the respective alkali metal azide, combined with a stoichiometric mixture of the binary starting materials and elemental chalcogens in a quartz ampoule under dynamic vacuum conditions (0.3 g batch size, heating rate 0.5 °C/min). After complete decomposition of the azides, the resulting raw products were annealed in flame-sealed ampoules at 800 °C (for KGaQ2 and RbGaQ2) and 550 °C (for CsGaQ2-mC64), respectively.
4.3. X-ray Powder Diffraction
The X-ray powder diffraction measurements were carried out on a STOE STADI P diffractometer (STOE & Cie, Darmstadt, Germany) equipped with a Dectris Mythen 1K detector and a STOE high-temperature capillary furnace. Monochromatic Cu-Kα1 radiation (λ = 1.540598 Å) was used for the ambient temperature measurements, while Mo-Kα1 radiation (λ = 0.709300 Å) was used for the non-ambient experiments. For the high-temperature measurements, powdered samples were loaded in quartz capillaries (diameter: 0.3 mm) and investigated in the temperature region from 25–900 °C in steps of 10 °C (4.55° < 2θ < 23.42°, irradiation time 5 min per diffraction pattern). The furnace temperature was controlled by a Eurotherm 24.16 controller (ΔT = ±1 °C). The samples were held at the respective temperature for 3 min prior to each measurement to ensure thermal equilibrium. The WinXPOW software package from STOE & Cie was used for data collection and processing [19].
4.4. Rietveld Refinement
The X-ray powder diffraction patterns for the Rietveld refinements were collected at the P02.1 beamline at Petra III (DESY, Hamburg, Germany). A monochromatic photon energy of approximately 60 keV corresponding to a wavelength of λ = 0.20717 Å and a beam size of 0.7 × 0.7 mm2 was used for all experiments. For the data acquisition, a PerkinElmer XRD1621 fast area detector and a sample-to-detector distance of 710 mm was used. The 2D data was integrated using FIT2D software [20]. Powdered samples were measured in quartz glass capillaries (diameter: 0.7 mm) with an irradiation time of 90 s for all experiments. The Rietveld refinement was performed using Jana2006 [15]. A manual background combined with 8–10 Legendre polynomials was used for all diffraction patterns. The peak profiles were described by Pseudo Voigt functions refining the parameters GW, GU, and LY. The occupation factors of the mixed alkali metal sites were refined using a restraint in order to ensure charge balance. All other positions were fully occupied. The atomic coordinates and anisotropic displacement parameters were refined without any restraints.
4.5. Raman Spectroscopy
The Raman spectra were recorded on a DXRTM SmartRaman Spectrometer (excitation wavelength λ = 532 nm, Thermo Fischer Scientific, Schwerte, Germany) in the range of 50–1000 cm−1 with a resolution of 0.5 cm−1.
4.6. UV-VIS Diffuse Reflectance Spectroscopy
Diffuse reflectance spectra were measured with an Omega 20 UV-VIS spectrometer (Bruins Instruments, Puchheim, Germany) using BaSO4 as a white standard (100% reflectance). The absorption data was calculated using a modified Kubelka-Munk function [21].
Supplementary Materials
The following data are available online at www.mdpi.com/2073-4352/7/12/379/s1, Figure S1: X-ray diffraction patterns of the solid solution series Cs1−xKxGaS2-mC64, Figure S2: X-ray diffraction patterns of the solid solution series Cs1–xRbxGaS2-mC64, Figure S3: X-ray diffraction patterns of the solid solution series Cs1-xKxGaSe2-mC64, Figure S4: X-ray diffraction patterns of the solid solution series Cs1−xRbxGaSe2-mC64, Table S1: Observed vibrational bands in the solid solution series Cs1-xMxGaS2-mC64, Table S2: Observed vibrational bands in the solid solution series Cs1−xMxGaSe2-mC64, Figure S5: Evolution of the X-ray powder diffraction patterns of all solid solutions in the temperature region from 20–900 °C, Figure S6: Plot of the Rietveld refinement of the X-ray diffraction pattern of Cs0.90K0.10GaS2-mC16, Table S1: Atomic coordinates and isotropic displacement parameters for Cs0.90K0.10GaS2-mC16, Table S2: Anisotropic displacement parameters for Cs0.90K0.10GaS2-mC16, Figure S7: Plot of the Rietveld refinement of the X-ray diffraction pattern of Cs0.84Rb0.16GaS2-mC16, Table S3: Atomic coordinates and isotropic displacement parameters for Cs0.84Rb0.16GaS2-mC16, Table S4: Anisotropic displacement parameters for Cs0.84Rb0.16GaS2-mC16, Figure S8: Plot of the Rietveld refinement of the X-ray diffraction pattern of Cs0.74Rb0.26GaS2-mC16, Table S5: Atomic coordinates and isotropic displacement parameters for Cs0.74Rb0.26GaS2-mC16, Table S6: Anisotropic displacement parameters for Cs0.74Rb0.26GaS2-mC16, Figure S9: Plot of the Rietveld refinement of the X-ray diffraction pattern of Cs0.91Rb0.09GaSe2-mC16, Table S7: Atomic coordinates and isotropic displacement parameters for Cs0.91Rb0.09GaSe2-mC16, Table S8: Anisotropic displacement parameters for Cs0.91Rb0.09GaSe2-mC16, Figure S10: Plot of the Rietveld refinement of the X-ray diffraction pattern of Cs0.79Rb0.21GaSe2-mC16, Table S9: Atomic coordinates and isotropic displacement parameters for Cs0.79Rb0.21GaSe2-mC16, Table S10: Anisotropic displacement parameters for Cs0.79Rb0.21GaSe2-mC16.
Acknowledgments
The authors would like to thank Václav Petříček (Czech Academy of Sciences, Prague) for his helpful comments regarding the handling of the mixed occupations during the Rietveld refinement. We would further like to thank Manfred Scheer (University of Regensburg) for the Raman measurements, Tamara Woppmann for reproducing the rubidium solid solutions in the course of her bachelor thesis, and Rockwood-Lithium for supplying cesium carbonate.
Author Contributions
Daniel Friedrich conceived, designed and performed the experiments, analyzed the data, and wrote the manuscript draft; Marc Schlosser helped with the high-temperature PXRD measurements and critically revised the manuscript; Martin Etter helped with the synchrotron diffraction experiments and critically revised the manuscript; Arno Pfitzner is head of research and critically revised the manuscript.
Conflicts of Interest
The authors declare no conflict of interest.
References
- Petrov, V.; Yelisseyev, A.; Isaenko, L.; Lobanov, S.; Titov, A.; Zondy, J.J. Second harmonic generation and optical parametric amplification in the mid-IR with orthorhombic biaxial crystals LiGaS2 and LiGaSe2. Appl. Phys. B Laser Opt. 2004, 78, 543–546. [Google Scholar] [CrossRef]
- Krebs, B. Thio- und Selenoverbindungen von Hauptgruppenelementen—Neue anorganische Oligomere und Polymere. Angew. Chem. 1983, 95, 113–134. [Google Scholar] [CrossRef]
- Müller, D.; Poltmann, F.E.; Hahn, H. Zur Struktur ternärer Chalkogenide des Thalliums mit Aluminium, Gallium und Indium, XXII. Zeitschrift für Naturforschung B 1974, 29B, 117–118. [Google Scholar]
- Ketelaar, J.A.A.; t’Hart, W.H.; Moerel, M.; Polder, D. The Crystal Structure of TlSe, Thallous Thallic or Thallosic Selenide. Zeitschrift für Kristallographie-Cryst. Mater. 1939, 101, 396–405. [Google Scholar] [CrossRef]
- Boon, J.W.; Mac Gillavry, C.H. The crystal structure of potassium thioferrite KFeS2 and sodium thiochromite NaCrS2. Recueil des Travaux Chimiques des Pays-Bas 1942, 61, 910–920. [Google Scholar] [CrossRef]
- Friedrich, D.; Schlosser, M.; Weihrich, R.; Pfitzner, A. Polymorphism of CsGaS2—Structural characterization of a new two-dimensional polymorph and study of the phase-transition kinetics. Inorg. Chem. Front. 2017, 4, 393–400. [Google Scholar] [CrossRef]
- Friedrich, D.; Schlosser, M.; Pfitzner, A. Synthesis, crystal structure, and physical properties of two polymorphs of CsGaSe2, and high-temperature X-ray diffraction study of the phase transition kinetics. Cryst. Growth. Des. 2016, 16, 3983–3992. [Google Scholar] [CrossRef]
- Feng, K.; Mei, D.; Bai, L.; Lin, Z.; Yao, J.; Wu, Y. Synthesis, structure, physical properties, and electronic structure of KGaSe2. Solid State Sci. 2012, 14, 1152–1156. [Google Scholar] [CrossRef]
- Lemoine, P.; Carre, D.; Guittard, M. Structure du sulfure de gallium et de potassium, KGaS2. Acta Cryst. C 1984, 40, 910–912. [Google Scholar] [CrossRef]
- Kumari, A.; Vidyasagar, K. Rubidium thiogallate. Acta Cryst. E 2005, 61, i193–i195. [Google Scholar] [CrossRef]
- Friedrich, D.; Schlosser, M.; Pfitzner, A. Synthesis and structural characterization of the layered selenogallate RbGaSe2. Zeitschrift für Anorganische und Allgemeine Chemie 2017, 643, 1589–1592. [Google Scholar] [CrossRef]
- Wu, E.J.; Pell, M.A.; Fuelberth, T.M.; Ibers, J.A. Crystal structure of cesium gallium ditelluride, CsGaTe2. Zeitschrift für Kristallographie-New Cryst. Struct. 1997, 212, 91. [Google Scholar]
- Friedrich, D.; Schlosser, M.; Pfitzner, A. Interconversion of one-dimensional thiogallates Cs2[Ga2(S2)2–xS2+x] (x = 0, 1, 2) by using high-temperature decomposition and polysulfide-flux reactions. Cryst. Growth Des. 2017, 17, 4887–4892. [Google Scholar] [CrossRef]
- Palatinus, L.; Chapuis, G. SUPERFLIP—A computer program for the solution of crystal structures by charge flipping in arbitrary dimensions. J. Appl. Cryst. 2007, 40, 786–790. [Google Scholar] [CrossRef]
- Petříček, V.; Dušek, M.; Palatinus, L. Crystallographic Computing System JANA2006: General features. Zeitschrift für Kristallographie-Cryst. Mater. 2014, 229, 345–352. [Google Scholar] [CrossRef]
- Tiwary, S.K.; Vasudevan, S. Regular versus alternating (FeS4)n chains: Magnetism in KFeS2 and CsFeS2. Phys. Rec. B 1997, 56, 7812–7814. [Google Scholar] [CrossRef]
- Guy, J.K.; Spann, R.E.; Martin, B.R. Solid state ion exchange chemistry of the solid solution KxRb1−xFeS2. Solid State Ionics 2008, 179, 409–414. [Google Scholar] [CrossRef]
- Stüble, P.; Röhr, C. Cs[FeSe2], Cs3[FeSe2]2, and Cs7[Fe4Se8]: Missing Links of Known Chalcogenido Ferrate Series. Zeitschrift für Anorganische und Allgemeine Chemie 2017, 643, 1462–1473. [Google Scholar]
- STOE WinXPOW, Version 3.10, STOE & Cie GmbH: Darmstadt, Germany, 2017.
- Hammersley, A.P.; Svensson, S.O.; Hanfland, M.; Fitch, A.N.; Hausermann, D. Two-dimensional detector software: From real detector to idealised image or two-theta scan. High Press. Res. 1996, 14, 235–248. [Google Scholar] [CrossRef]
- Kisch, H. Semiconductor photocatalysis—Mechanistic and synthetic aspects. Angew. Chem. Int. Ed. 2013, 52, 812–847. [Google Scholar] [CrossRef] [PubMed]
Figure 1.
Comparison of the crystal structures of the TlGaSe2 (a–c) and the KFeS2 (d–f) structure types, showing: (a) the stacking of the anionic layers in the TlGaSe2 structure type; (b) the supertetrahedral building blocks Ga4Q10 of these layers; (c) coordination polyhedra of the alkali metal sites; (d) the arrangement of the anionic chains in the KFeS2 structure type; (e) the SiS2 analogous anionic chain; and (f) the coordination of the cesium site.

Figure 2.
Plots of the unit cell volumes vs. the composition of the solid solutions Cs1−xMxGaS2-mC64 (M = K, Rb; x = 0–1) and Cs1−xMxGaSe2-mC64 (M = K, Rb; x = 0–1). The dashed lines indicate a linear fit. The e.s.d.s (estimated standard deviations) are within the size of the spots.
Figure 2.
Plots of the unit cell volumes vs. the composition of the solid solutions Cs1−xMxGaS2-mC64 (M = K, Rb; x = 0–1) and Cs1−xMxGaSe2-mC64 (M = K, Rb; x = 0–1). The dashed lines indicate a linear fit. The e.s.d.s (estimated standard deviations) are within the size of the spots.

Figure 3.
Raman spectra of the solid solution series Cs1−xMxGaQ2-mC64 (a) Cs1−xKxGaS2-mC64, (b) Cs1−xRbxGaS2-mC64, (c) Cs1−xKxGaSe2-mC64, and (d) Cs1−xRbxGaSe2-mC64, including a tentative assignment of the vibrational modes (υ = stretching mode, δ = deformation mode). The position of the strongest vibration mode of the pure cesium phases is highlighted by a dashed line as a guide to the eye.
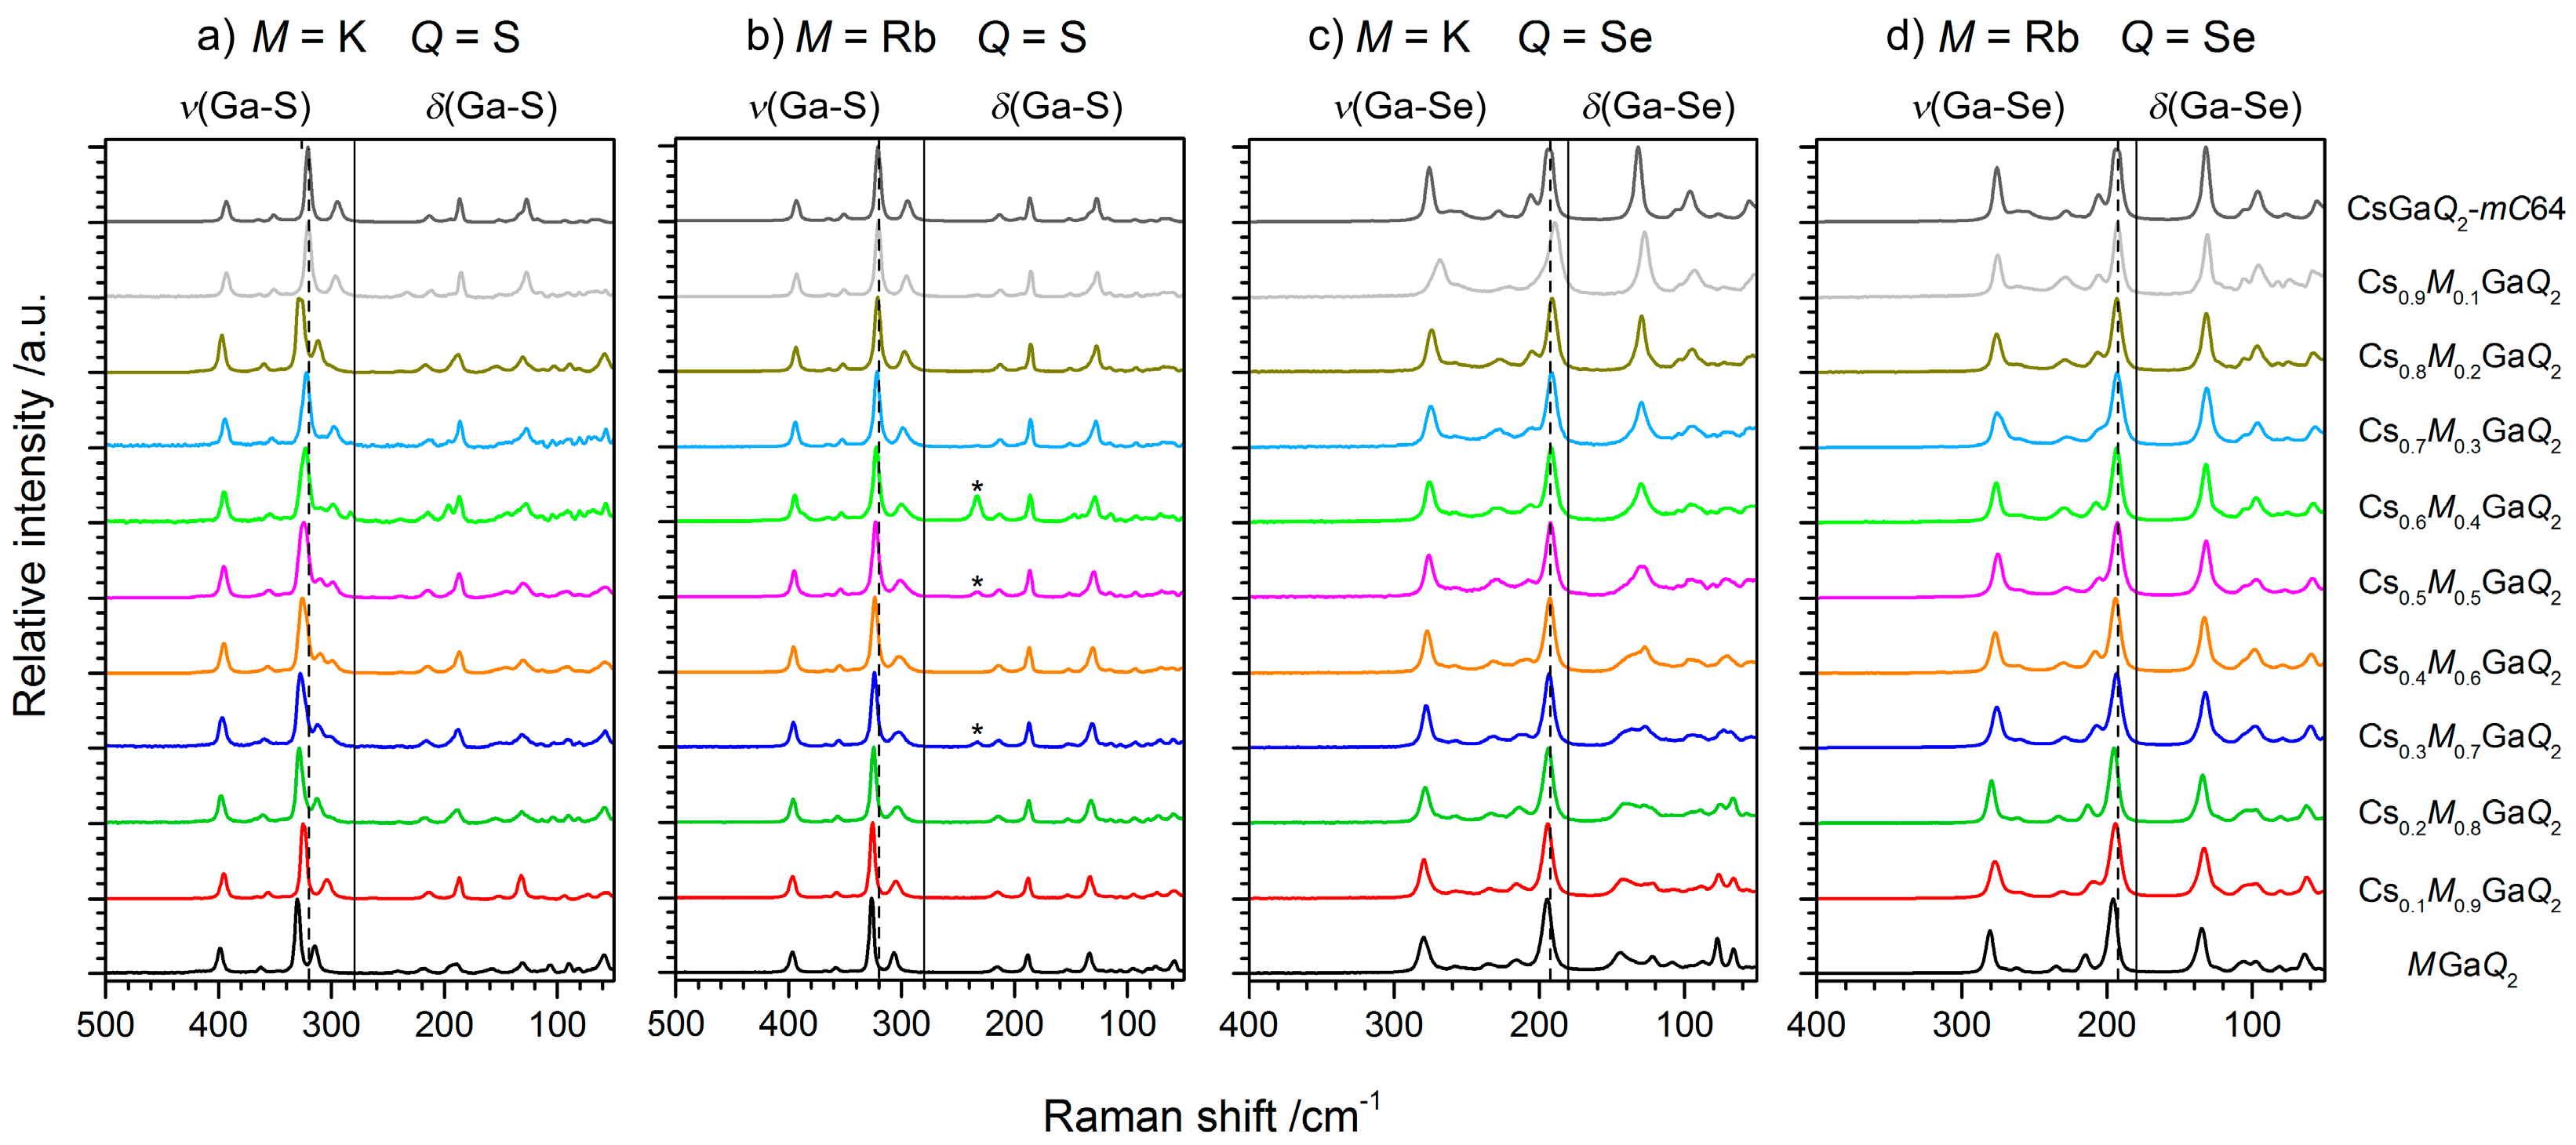
Figure 4.
Diffuse reflectance spectra of MGaQ2 (M = K, Rb, Cs; Q = S, Se) compounds. The data for CsGaQ2-mC64 and RbGaSe2 were taken from the respective literature [6,7,11].

Figure 5.
Schematic quasi-binary phase diagrams of the solid solutions Cs1−xKxGaS2-mC64, Cs1−xRbxGaS2-mC64, Cs1−xKxGaSe2-mC64, and Cs1−xRbxGaSe2-mC64. The solid lines are based on actual measurements, while the dashed lines represent physically plausible interpolations based on our observations.
Figure 5.
Schematic quasi-binary phase diagrams of the solid solutions Cs1−xKxGaS2-mC64, Cs1−xRbxGaS2-mC64, Cs1−xKxGaSe2-mC64, and Cs1−xRbxGaSe2-mC64. The solid lines are based on actual measurements, while the dashed lines represent physically plausible interpolations based on our observations.


Table 1.
Unit cell parameters of the chalcogenogallates MGaQ2 (M = K, Rb, Cs; Q = S, Se) determined from X-ray powder diffraction data at 20 °C.
Table 1.
Unit cell parameters of the chalcogenogallates MGaQ2 (M = K, Rb, Cs; Q = S, Se) determined from X-ray powder diffraction data at 20 °C.
| KGaS2 | RbGaS2 | CsGaS2 | KGaSe2 | RbGaSe2 | CsGaSe2 | |||
|---|---|---|---|---|---|---|---|---|
| mC64 (LT) | mC16 (HT) | mC64 (LT) | mC16 (HT) | |||||
| Structure type | TlGaSe2 | TlGaSe2 | TlGaSe2 | KFeS2 | TlGaSe2 | TlGaSe2 | TlGaSe2 | KFeS2 |
| Space group | Monoclinic, C2/c (No. 15) | |||||||
| Z | 16 | 16 | 16 | 4 | 16 | 16 | 16 | 4 |
| a/Å | 10.421(2) | 10.495(3) | 10.622(2) | 7.432(1) | 10.909(2) | 10.974(3) | 11.046(1) | 7.659(2) |
| b/Å | 10.413(2) | 10.485(2) | 10.616(2) | 12.220(1) | 10.920(3) | 10.965(3) | 11.051(1) | 12.559(5) |
| c/Å | 14.799(3) | 15.432(5) | 16.170(2) | 5.911(1) | 15.470(4) | 16.084(4) | 16.827(1) | 6.177(1) |
| β/° | 100.13(2) | 99.71(2) | 99.46(2) | 113.10(1) | 100.12(2) | 99.87(3) | 99.40(1) | 113.66(2) |
| V/Å3 | 1580.9(6) | 1673.8(8) | 1798.5(6) | 493.8(1) | 1814.4(7) | 1906.7(9) | 2026.5(3) | 544.3(3) |
Table 2.
Crystallographic data of the solid solutions Cs1−xMxGaQ2-mC16 (M = K, Rb; Q = S, Se).
| Cs0.90K0.10GaS2 | Cs0.84Rb0.16GaS2 | Cs0.74Rb0.26GaS2 | Cs0.91Rb0.09GaSe2 | Cs0.79Rb0.21GaSe2 | |
|---|---|---|---|---|---|
| M/g·mol−1 | 257.38 | 259.17 | 254.43 | 356.28 | 350.59 |
| Space Group | monoclinic, C2/c (No. 15) | ||||
| a/Å | 7.431(2) | 7.426(1) | 7.427(1) | 7.653(1) | 7.655(1) |
| b/Å | 12.171(3) | 12.151(2) | 12.041(3) | 12.482(3) | 12.415(2) |
| c/Å | 5.906(1) | 5.907(1) | 5.908(1) | 6.166(1) | 6.161(1) |
| β/° | 113.15(2) | 113.11(1) | 113.24(1) | 113.75(2) | 113.88(1) |
| V/Å3 | 491.2(2) | 490.3(1) | 485.5(2) | 539.1(2) | 535.4(1) |
| Diffractometer | DESY P02.1 beamline; λ = 0.20717 Å; T = 20 °C | ||||
| 2θ range; increment | 0.7° < 2θ < 15°; Δθ = 0.004° | ||||
| Structure solution | Charge flipping, SUPERFLIP [14] | ||||
| Structure refinement | Full matrix against F2, Jana2006 [15] | ||||
| Background | Manual background combined with 8–10 Legendre polynomials | ||||
| Reflection profile | Pseudo-Voigt function; refined parameters GW, GU, LY | ||||
| No. of parameters | 39 | 38 | 39 | 37 | 39 |
| µ/mm−1 | 1.546 | 1.512 | 1.407 | 1.879 | 1.767 |
| GooF | 1.74 | 1.04 | 1.26 | 2.80 | 2.62 |
| Rp, wRp | 0.0069, 0.0097 | 0.0045, 0.0061 | 0.0060, 0.0075 | 0.0104, 0.0143 | 0.0093, 0.0131 |
| R1, wR2 (I > 3σ(I)) | 0.0173, 0.0244 | 0.0185, 0.0241 | 0.0197, 0.0256 | 0.0284, 0.0412 | 0.0114, 0.0158 |
| R1, wR2 (all data) | 0.0173, 0.0244 | 0.0185, 0.0241 | 0.0197, 0.0256 | 0.0284, 0.0412 | 0.0114, 0.0158 |
[a] Further details on the crystal structures may be obtained from the Fachinformationszentrum Karlsruhe, 76344 Eggenstein-Leopoldshafen, Germany (Fax: (+49)7247-808-666; E-mail: [email protected]), on quoting the depository numbers CSD-433816 (Cs0.90K0.10GaS2-mC16), CSD-433815 (Cs0.84Rb0.16GaS2-mC16), CSD-433813 (Cs0.74Rb0.26GaS2-mC16), CSD-433817 (Cs0.91Rb0.09GaSe2-mC16), and CSD-433814 (Cs0.79Rb0.21GaSe2-mC16).
© 2017 by the authors. Licensee MDPI, Basel, Switzerland. This article is an open access article distributed under the terms and conditions of the Creative Commons Attribution (CC BY) license (http://creativecommons.org/licenses/by/4.0/).
Share and Cite
MDPI and ACS Style
Friedrich, D.; Schlosser, M.; Etter, M.; Pfitzner, A. Influence of Alkali Metal Substitution on the Phase Transition Behavior of CsGaQ2 (Q = S, Se). Crystals 2017, 7, 379. https://doi.org/10.3390/cryst7120379
AMA Style
Friedrich D, Schlosser M, Etter M, Pfitzner A. Influence of Alkali Metal Substitution on the Phase Transition Behavior of CsGaQ2 (Q = S, Se). Crystals. 2017; 7(12):379. https://doi.org/10.3390/cryst7120379
Chicago/Turabian StyleFriedrich, Daniel, Marc Schlosser, Martin Etter, and Arno Pfitzner. 2017. "Influence of Alkali Metal Substitution on the Phase Transition Behavior of CsGaQ2 (Q = S, Se)" Crystals 7, no. 12: 379. https://doi.org/10.3390/cryst7120379
Note that from the first issue of 2016, this journal uses article numbers instead of page numbers. See further details here.