Article

Calcined Solution-Based PVP Influence on ZnO Semiconductor Nanoparticle Properties

1
Department of Physics, Faculty of Science, Universiti Putra Malaysia, Serdang 43400, Selangor, Malaysia
2
Department of Physics, College of Science, University of Dammam, Dammam 31441, Saudi Arabia
3
Department of Physics, Faculty of Applied Science, Thamar University, P.O. Box 87246, Dhamar 12345, Yemen
*
Authors to whom correspondence should be addressed.
Crystals 2017, 7(2), 2; https://doi.org/10.3390/cryst7020002
Submission received: 7 November 2016 / Revised: 15 December 2016 / Accepted: 20 December 2016 / Published: 8 February 2017

Abstract

:
A water-based solution of polyvinylpyrrolidone (PVP) at various concentrations and zinc nitrates were used in conjunction with calcination to produce zinc oxide semiconductor nanoparticles. The extent to which the zinc oxide semiconductor nanoparticles had become crystallized was measured using X-ray diffraction (XRD), whilst morphological characteristics were determined using scanning electron microscopy (SEM). Transmission electron microscopy (TEM) supported by XRD results were used to evaluate the average particle size. Fourier transform infrared spectroscopy (FT-IR) was then carried out in order to identify the composition phase, since this suggested that the samples contained metal oxide bands and that all organic compounds had been effectively removed after calcination. A UV-VIS spectrophotometer was used to determine the energy band gap and illustrate optical features. Additionally, photoluminescence (PL) spectra revealed that the intensity of photoluminescence decreased with a decrease in particle size. The obtained results have mainly been inclusive for uses by several semiconductor applications in different fields, such as environmental applications and studies, since an absorption process for energy wavelengths could efficiently occur.

Graphical Abstract

1. Introduction

In order to produce materials that exhibit improved features [1], organic-inorganic nanomaterials are developed through the integration of altered nanoparticles (NPs) to polymer matrices or the combination of inorganic particles and artificial polymers. A unique material is produced through this process, which contains organic polymers and inorganic nanoparticles, and these materials exhibit improved characteristics when compared with their respective microscale size [2,3,4]. Therefore, there is an immense technological and scientific impact that can be achieved by using nanomaterials that include metal oxide nanoparticles, due to the greater quantity of surface atoms and nanoscale size. Hence, this combination leads to outstanding results in chemical and physical properties. There are practically endless potential applications of these nanomaterials as a result of the unique outcomes created by the quantum confinement effect and greater ratio between surface area and volume [5,6,7,8,9,10,11,12]. Different nanoparticles being created inside a polymer matrix have become synergistically combined, and a polymer matrix is used to house the development of nanoparticles [13,14,15,16].
Due to the unique features of materials created from nanoparticles of metal oxides housed within polymer matrices, many researchers have begun to pay attention to this topic over the last decade. The physiochemical attributes of the nanoparticles are markedly different from that of bulk and molecular materials due to the particles’ nanometer size. The mechanical, catalytic, magnetic, electrical, and optical features of this type of compound material are both unique and fascinating [17,18,19]. The creation of metal and metal oxide-polymer nanocomposites are studied using a range of methods [20,21]. ZnO is considered as one of the metal oxides whereas it contains two elements which are: metal-zinc (II) and non-metal element oxygen (VI) [22,23]. It is believed that ZnO boasts various applications due to its interesting physical and chemical features. ZnO nanostructures have been widely exploited by many applications due to the distinguished attributes of the crystal structure and nanoparticles’ size [16,24,25,26,27].
Various techniques have been used to create a number of ZnO nanomaterials, such as hydrothermal [28,29,30], sol-gel [31,32], microwave irradiation [33,34], catalytic-immersion [35], thermal oxidation [36], chemical [37], and solid-state pyrolytic reaction [38]. This being said, the re-accumulation of each nanoparticle and the formation of an equipoise setting in specific circumstances (which determines the distributed nanoparticle agglomerate’s dimension levels) limits the nanoparticle distribution efficiency of each method. Other limitations are raised with regards to the low tolerance of certain inorganic nanoparticles to the effects of pressures, as well as temperature levels. The significant decrease in surface energy (especially in comparison with plain particles) means that when dealing with accretion, particles that comprise a polymer chain show greater reliability. Chains can be created by polymers if inorganic nanoparticles are created using any of the techniques mentioned above and a polymer liquid is then used as a distribution environment.
Several forms of nanomaterials with polymers have been created, using various methods; this has resulted in producing unique properties for these nanomaterials and, therefore, many applications have exploited these distinctive characteristics [39,40,41,42,43]. The particles inside the polymer matrix become better synergized in the presence of a polymer chain for required lower level energy distribution. Polymers play an important role in capping the nanoparticle agglomeration distribution, regarding growth and as dissolving agents, which makes polymers an important asset when regulating different nanomaterials application [44,45].
This research work aims to study the morphologically unique ZnO nanoparticles product through the use of a polyvinylpyrrolidone (PVP) concentration prepared in an aqueous solution during calcination. This study especially highlights the performance of calcined and PVP production in producing structural and optical features of nanoparticles, to fulfil multifaceted functions.
A PVP capping agent can be used in conjunction with nitrate metallic ions to create a liquid that can effectively create pure ZnO nanoparticles when calcined at an appropriate temperature, and can then be assessed for structural, morphological, and optical features. It is evident that this method introduces several benefits of flexible, inexpensive, ease of handlng, and permits reproducible quality. It enables the production of nanoparticles with the desired properties because it can regulate particle size with high-purity nanoparticles. In addition, it makes a limited use of chemicals, has non-toxic effluences into the drainage system and, therefore, it is not damaging to the environment. It also has the potential to be employed on a large scale, in industrial applications.

2. Results and Discussion

2.1. Structural, Morphological, Phase Composition, and Optical Features Following Calcination at Various Temperatures

This section presents the findings from a prior research study on the ways of the temperature of calcination by which zinc oxide nanoparticles’ structure, morphology, phase composition, and optical features are affected [46]. The research revealed that calcination temperatures of 500, 550, 600, and 650 °C have resulted in 23, 26, 30, and 38 nm zinc oxide nanoparticles, respectively. These results were found using X-ray diffraction (XRD) and transmission electron microscopy (TEM) assessments. The study also showed that calcination temperatures of 500 °C and above prompted complete crystallization, confirmed by the absence of the organic absorption band within the Fourier transform infrared spectroscopy (FT-IR) spectrum. Optical assessments revealed that higher temperatures resulted in a smaller ZnO nanoparticle energy band gap. It was also found that the nanoparticles could remain pure at a temperature of no less than 600 °C; the point at which there was a nearly completely consistent form dispersion and the lowest ZnO semiconductor nanoparticle size.

2.2. Structural, Morphological, Phase Composition, and Optical Features in Relation to PVP Concentration

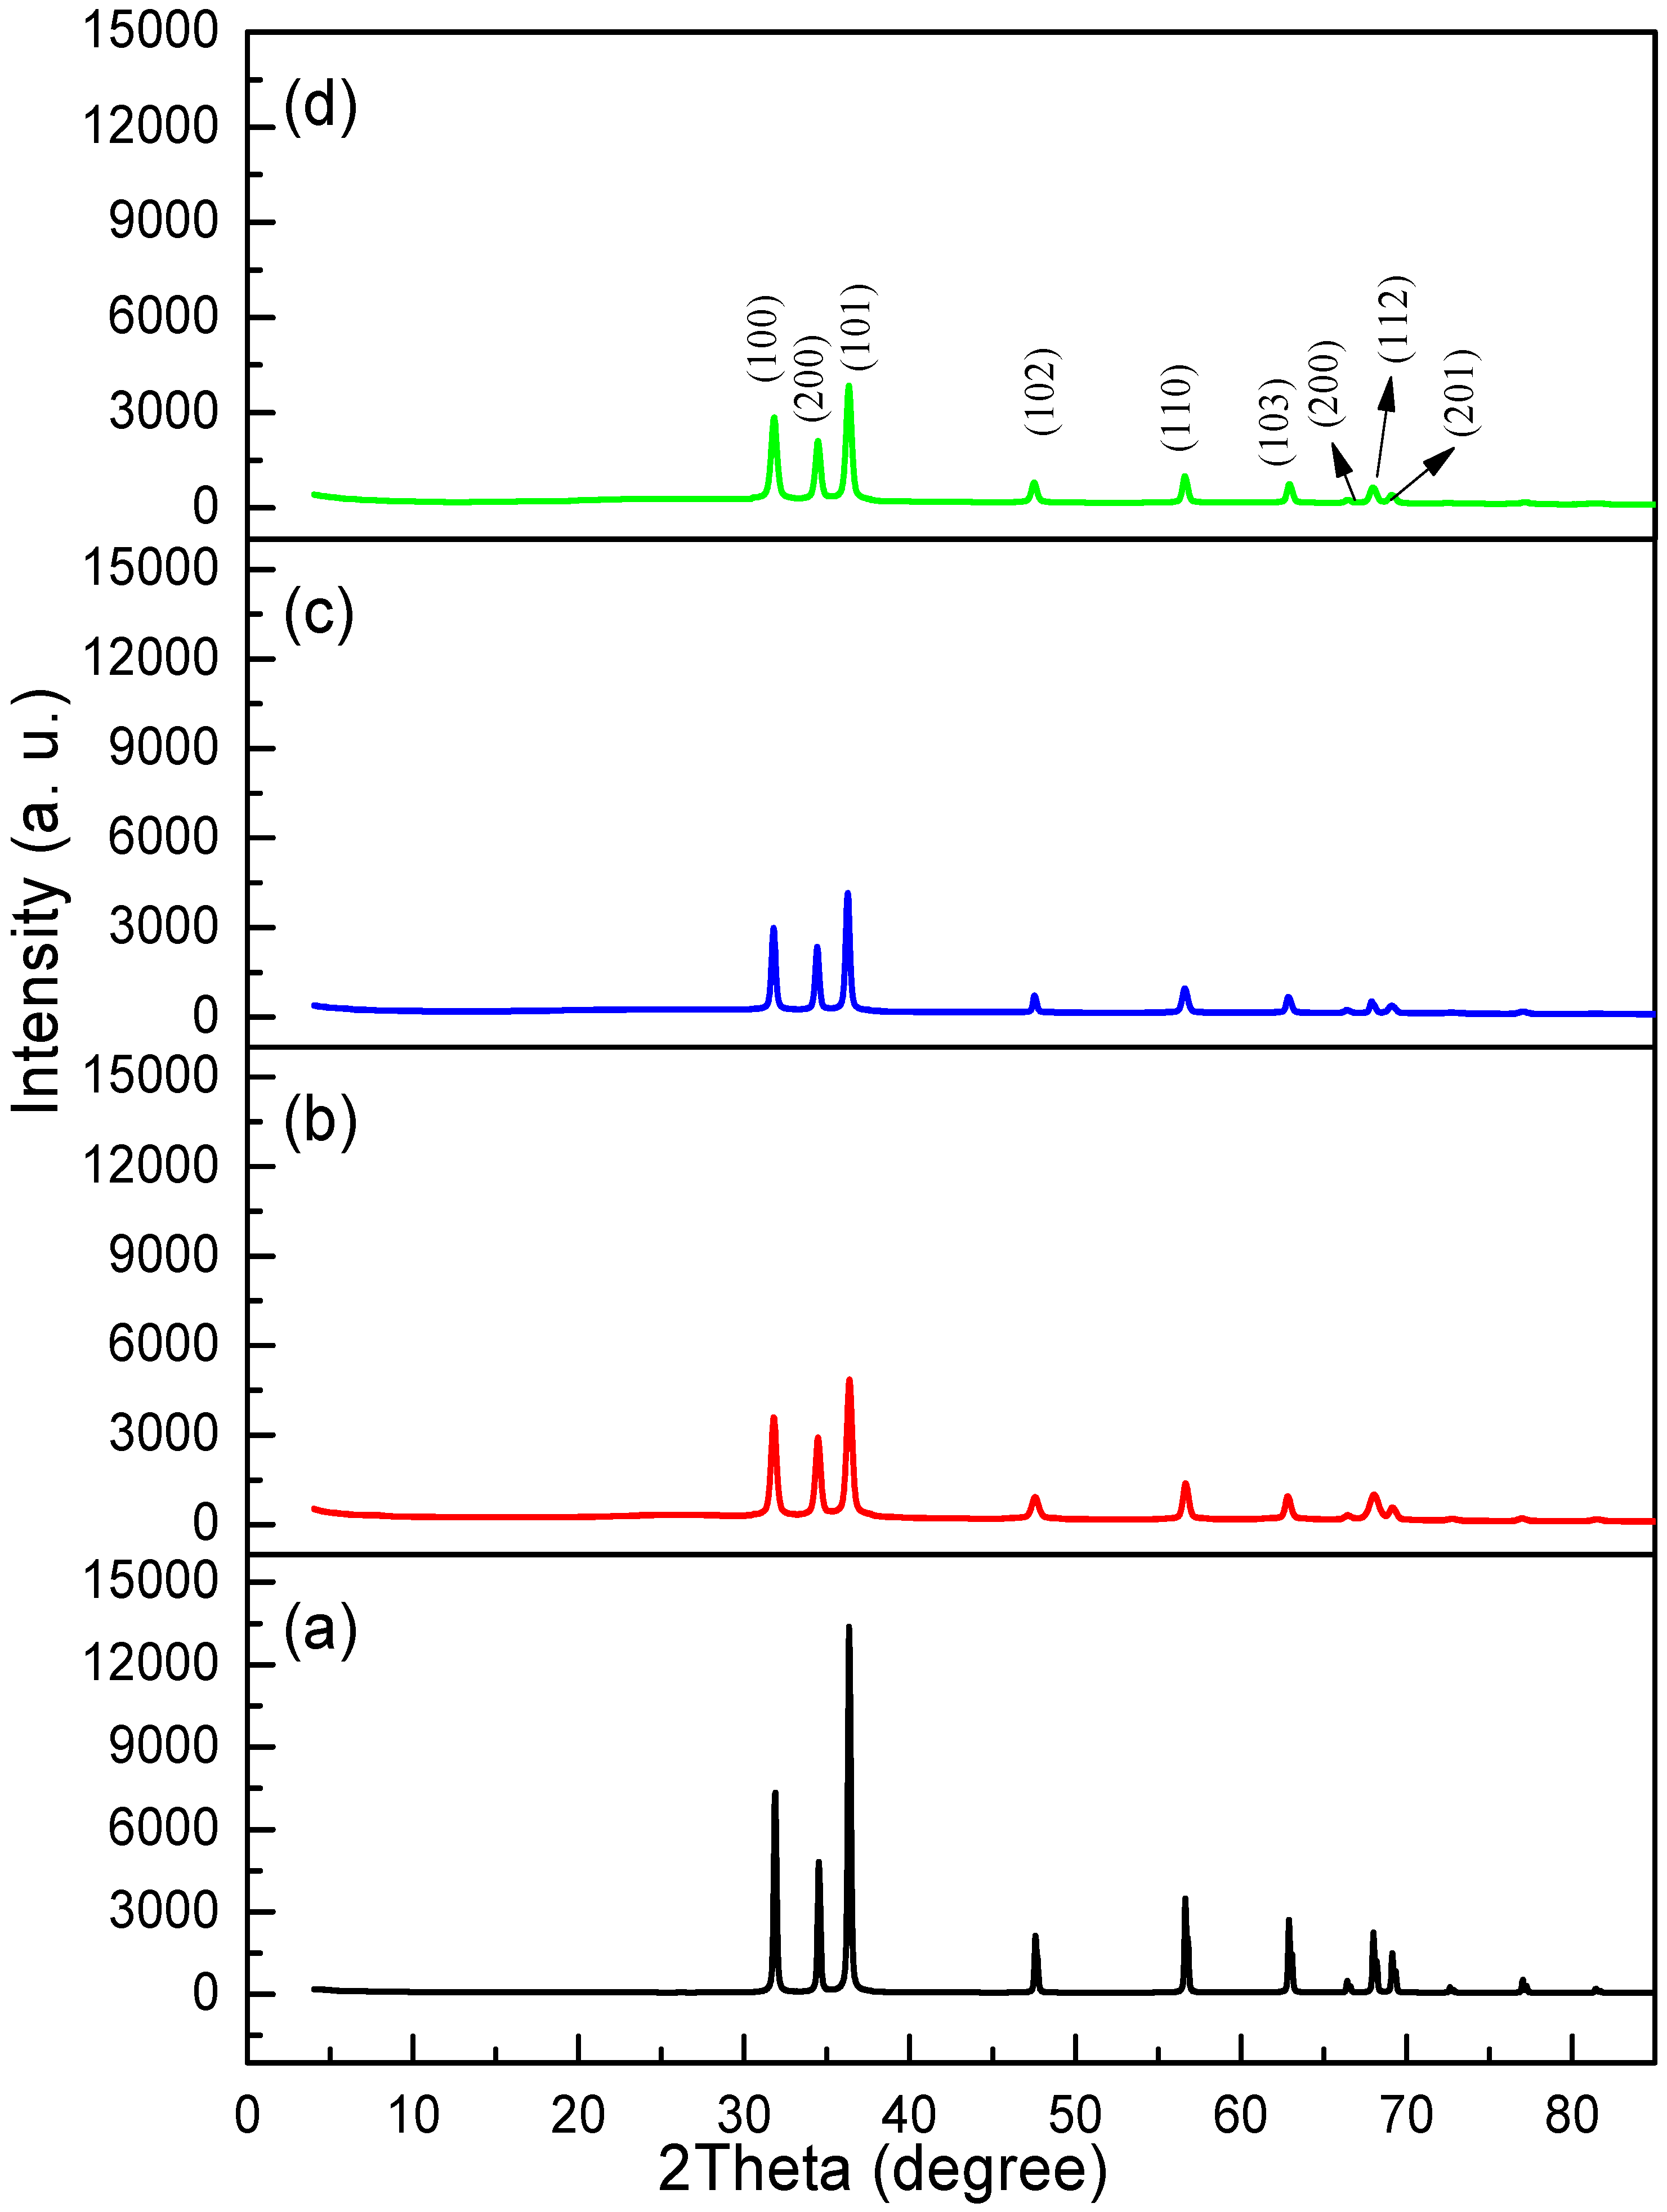
2.2.1. Structural Analysis

To understand the PVP role in relation to the zinc oxide formation nanoparticles, the XRD spectra of the nanoparticles should be taken at various concentrations of PVP (0–5 g).
The XRD patterns for the samples calcined at 600 °C with and without PVP are shown in Figure 1, whereas the XRD pattern for the sample without PVP is illustrated in Figure 1a, which reveals sharper and more pronounced ZnO reflection planes in the formation of a crystalline ZnO structure. The ZnO sample shows a hexagonal crystal structure based on the diffraction peaks of (100, 200, 101, 102, 110, 103, 200, 112, and 201), correspond to the data from JCPDS card no. 36-1451 [46,47,48]. Moreover, the crystalline size of the particles is large in the absence of PVP to control the particles agglomeration.
The ZnO nanoparticle XRD patterns prepared with PVP of 3–5 g concentrations are demonstrated in Figure 1b–d. Here, it is evident that from a lower XRD peak intensity, the crystalline sizes of ZnO nanoparticles become smaller corresponding to the increase of PVP concentrations. Table 1 also demonstrates that an increase of PVP levels associates with lower crystalline values. It is clear that ZnO nanoparticle samples exhibit a hexagonal crystal structure based on the diffraction peaks (100, 200, 101, 102, 110, 103, 200, 112, and 201), as per the data from JCPDS card no. 35-1451 [46,48,49].
The peaks intensities were assigned to the (100, 200, 101, 102, 110, 103, 200, 112, and 201) index plane (at 2θ = 31.90°, 34.55°, 36.37°, 47.67°, 56.72°, 62.99°, 66.50°, 68.07°, and 69.21°), respectively. Here, the popular Debye-Scherrer Equation (1) was applied to determine the average crystalline size based on the expansion of the peaks:
D = 0.9λ/βcosθ
where D represents the size of the crystallite (nm), β represents the total width of the diffraction line at half of the maximum intensities (i.e., (101, 200, 101, 102, 110, 103, 200, 112, and 201)), measured in radians, λ represents the X-ray wavelength of Cu Kα = 0.154 nm, and θ represents the Bragg’s angle [50]. The decrease of the ZnO nanoparticles from 31.8 nm to 25.7 nm with an increasing of 3–5 g PVP concentrations showed in Table 1.
When contrasting the non-PVP prepared ZnO versus the PVP prepared ZnO, it is clear that the non-PVP ZnO exhibits the most pronounced XRD patterns, indicating agglomeration of more particles, which is larger in crystalline size. However, by incorporating the PVP polymer, the particle growth has been successfully controlled with the crystalline size decreases when the PVP concentration increases.

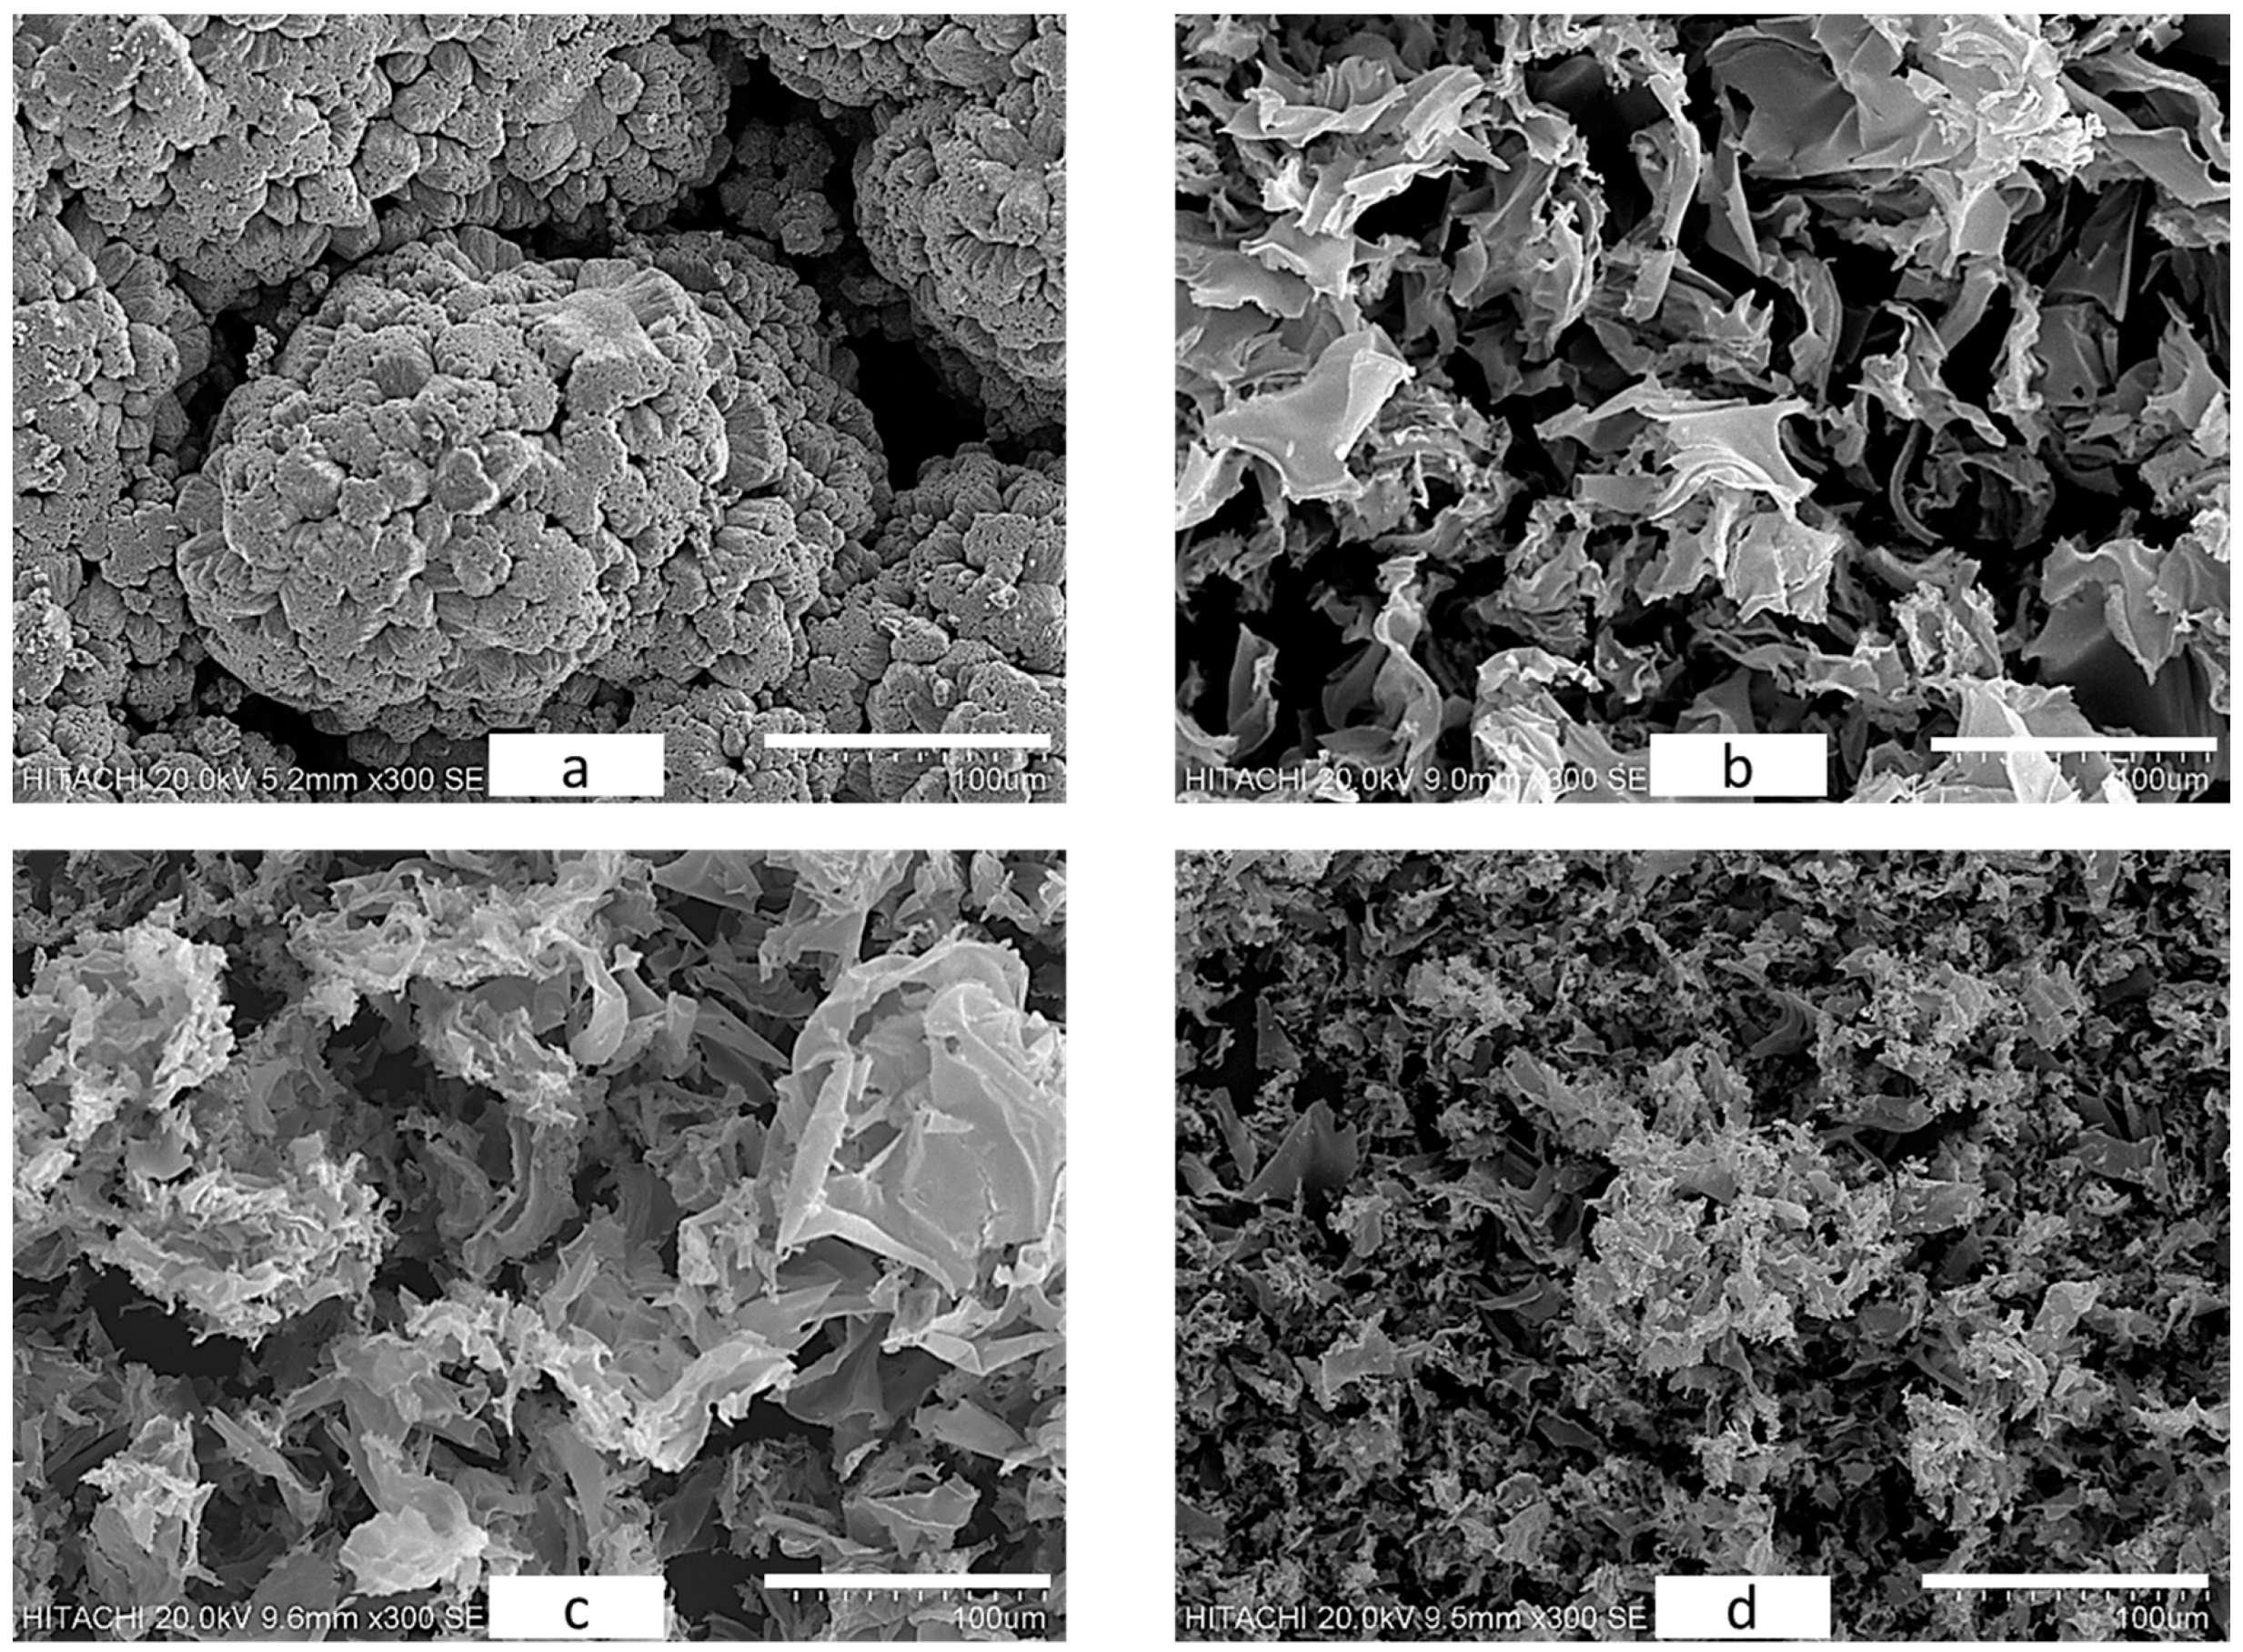
2.2.2. Surface Morphology Analysis
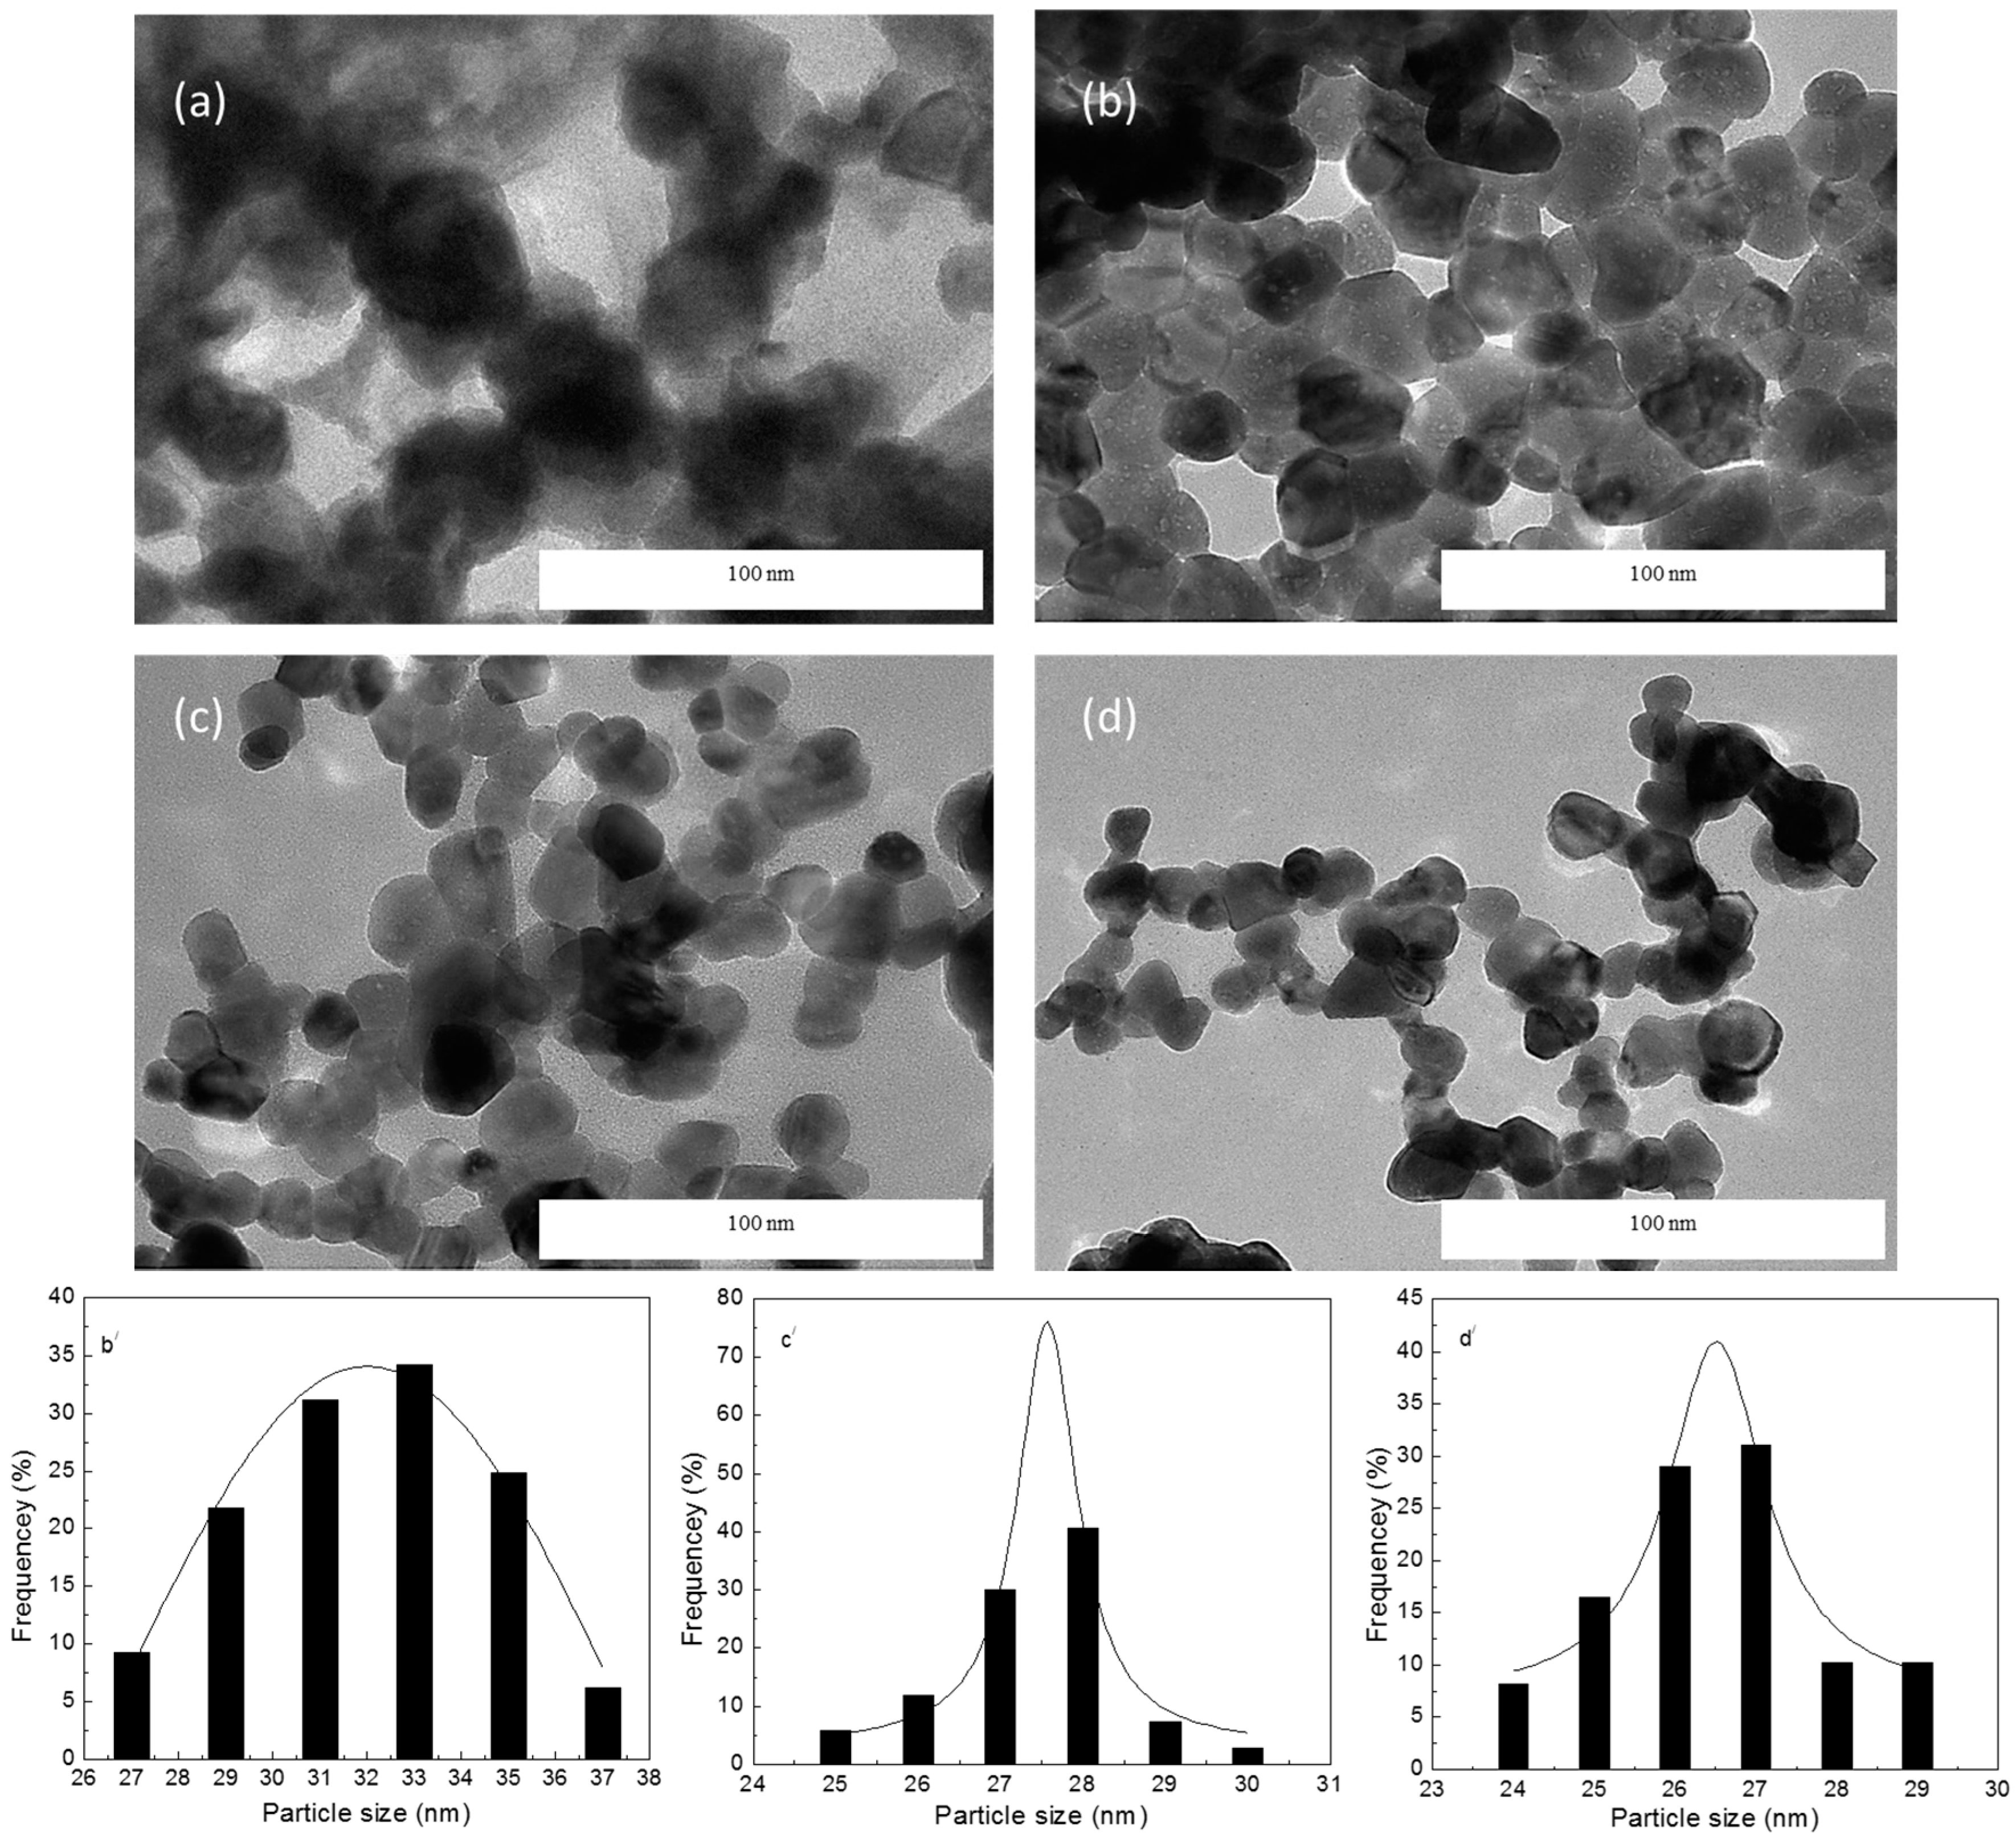
Scanning electron microscopy (SEM) was used to assess the nanoparticles’ surface morphology under both PVP and non-PVP conditions (see Figure 2). A heat-based treatment method was applied in order to prepare the samples for evaluation. An electron beam operating voltage of 20 KV was used at the point of micrographs recording. Figure 2a illustrates the non-PVP production of ZnO at a calcination temperature of 600 °C. The findings show that the structures of the samples were nearly sphere-shaped and homogenously dispersed [51]. The results of the SEM were collected together with a PVP concentration of 3–5 g, as shown in Figure 2b–d. The findings show that the sample exhibited a nanosheet morphology [52,53,54,55] (see Figure 2b,c). As illustrated in Figure 2c,d, the nanosheet quantity increases in line with an increase in the PVP concentration. Finally, as shown in Figure 2d, almost every nanosheet structure became smaller as the PVP concentration increased.
In other words, the product was prepared on a crucible plate, so the tendency is that when PVP is removed, the aggregation tends to be in the sheet form with large size(s). The PVP capping usually occurs more with any increase of its quantity. Therefore, when PVP increases, the particle size of the product becomes smaller because of PVP capping occurrence. The aggregation at low PVP quantity tends to form a larger sheet; and vice versa, the aggregation at higher PVP quantity tends to make smaller sheets.

2.2.3. TEM Analysis

The TEM was used to assess the zinc oxide nanoparticles, which had been prepared with metal nitrates in a water-based solution of a PVP (0, 3, 4, and 5 g) capping agent, designed to restrict particle growth. One sample was prepared without PVP and calcined at 600 °C (Figure 3a). The findings showed that even in the absence of PVP, ZnO was effectively produced. Nonetheless, the findings also showed a lack of homogenous form dispersion, and even accumulation, when PVP was absent. Therefore, nanoparticles produced without the assistance of PVP will become unevenly distributed: the higher surface energy levels result in the accumulation of smaller particles that become larger during calcination. Additionally, the absence of PVP also resulted in an even melting morphology in certain areas as well as a lack of clarity because the smaller particles accumulate and eventually turn into larger ones. Therefore, the experimental process revealed that images and imaging software alone is insufficient for achieving a clear understanding of the average particle size at a calcination temperature of 600 °C. Regarding the PVP-prepared samples, which were also calcined at 600 °C, Figure 3b–d presents the particle size and size dispersal images as produced through the TEM. The findings showed that the particle size dispersal was uniform and the particles’ morphologies were homogenous with an average size of 32 ± 4 nm at a 3 g PVP concentration and 26 ± 3 nm at 5 g PVP. These findings support those of the XRD evaluations.
Similarly, in accordance with the findings of other researchers [49,56,57,58], the particles in this experiment were found to be elliptical or spherical in shape. It also appears that greater concentrations of PVP are associated with a decrease in particle size due to the capping effect of the PVP (i.e., restricting accretion and expansion and resulting in smaller particles). Furthermore, if the PVP concentration is sufficiently high, PVP samples will accumulate at a lower level whilst also experiencing limited accretion. The average nanoparticle size at a 3 g PVP concentration was 32 ± 4 nm. As indicated in Figure 3b, the form of these nanoparticles became more homogenous than that of the non-PVP nanoparticles. However, the PVP concentration was too low to prevent particle accumulation and capping. Accumulation became stunted at a concentration of 5 g (see Figure 3c,d). As shown in Table 1, the ZnO nanoparticles ranged from 28 to 26 nm, reflecting a PVP concentration of 4 and 5 g.
A smaller degree of accretion and greater standardization of form was found in the TEM assessment of the PVP-aided nanoparticles where PVP was used as a capping agent. Additionally, the experiment showed that zinc oxide can be produced with a near-homogenous dispersal of particle size and structure using the heat-based treatment technique. Thus, it is clear that growth reduction and nanoparticle expansion regulation can be efficiently achieved when PVP is used.

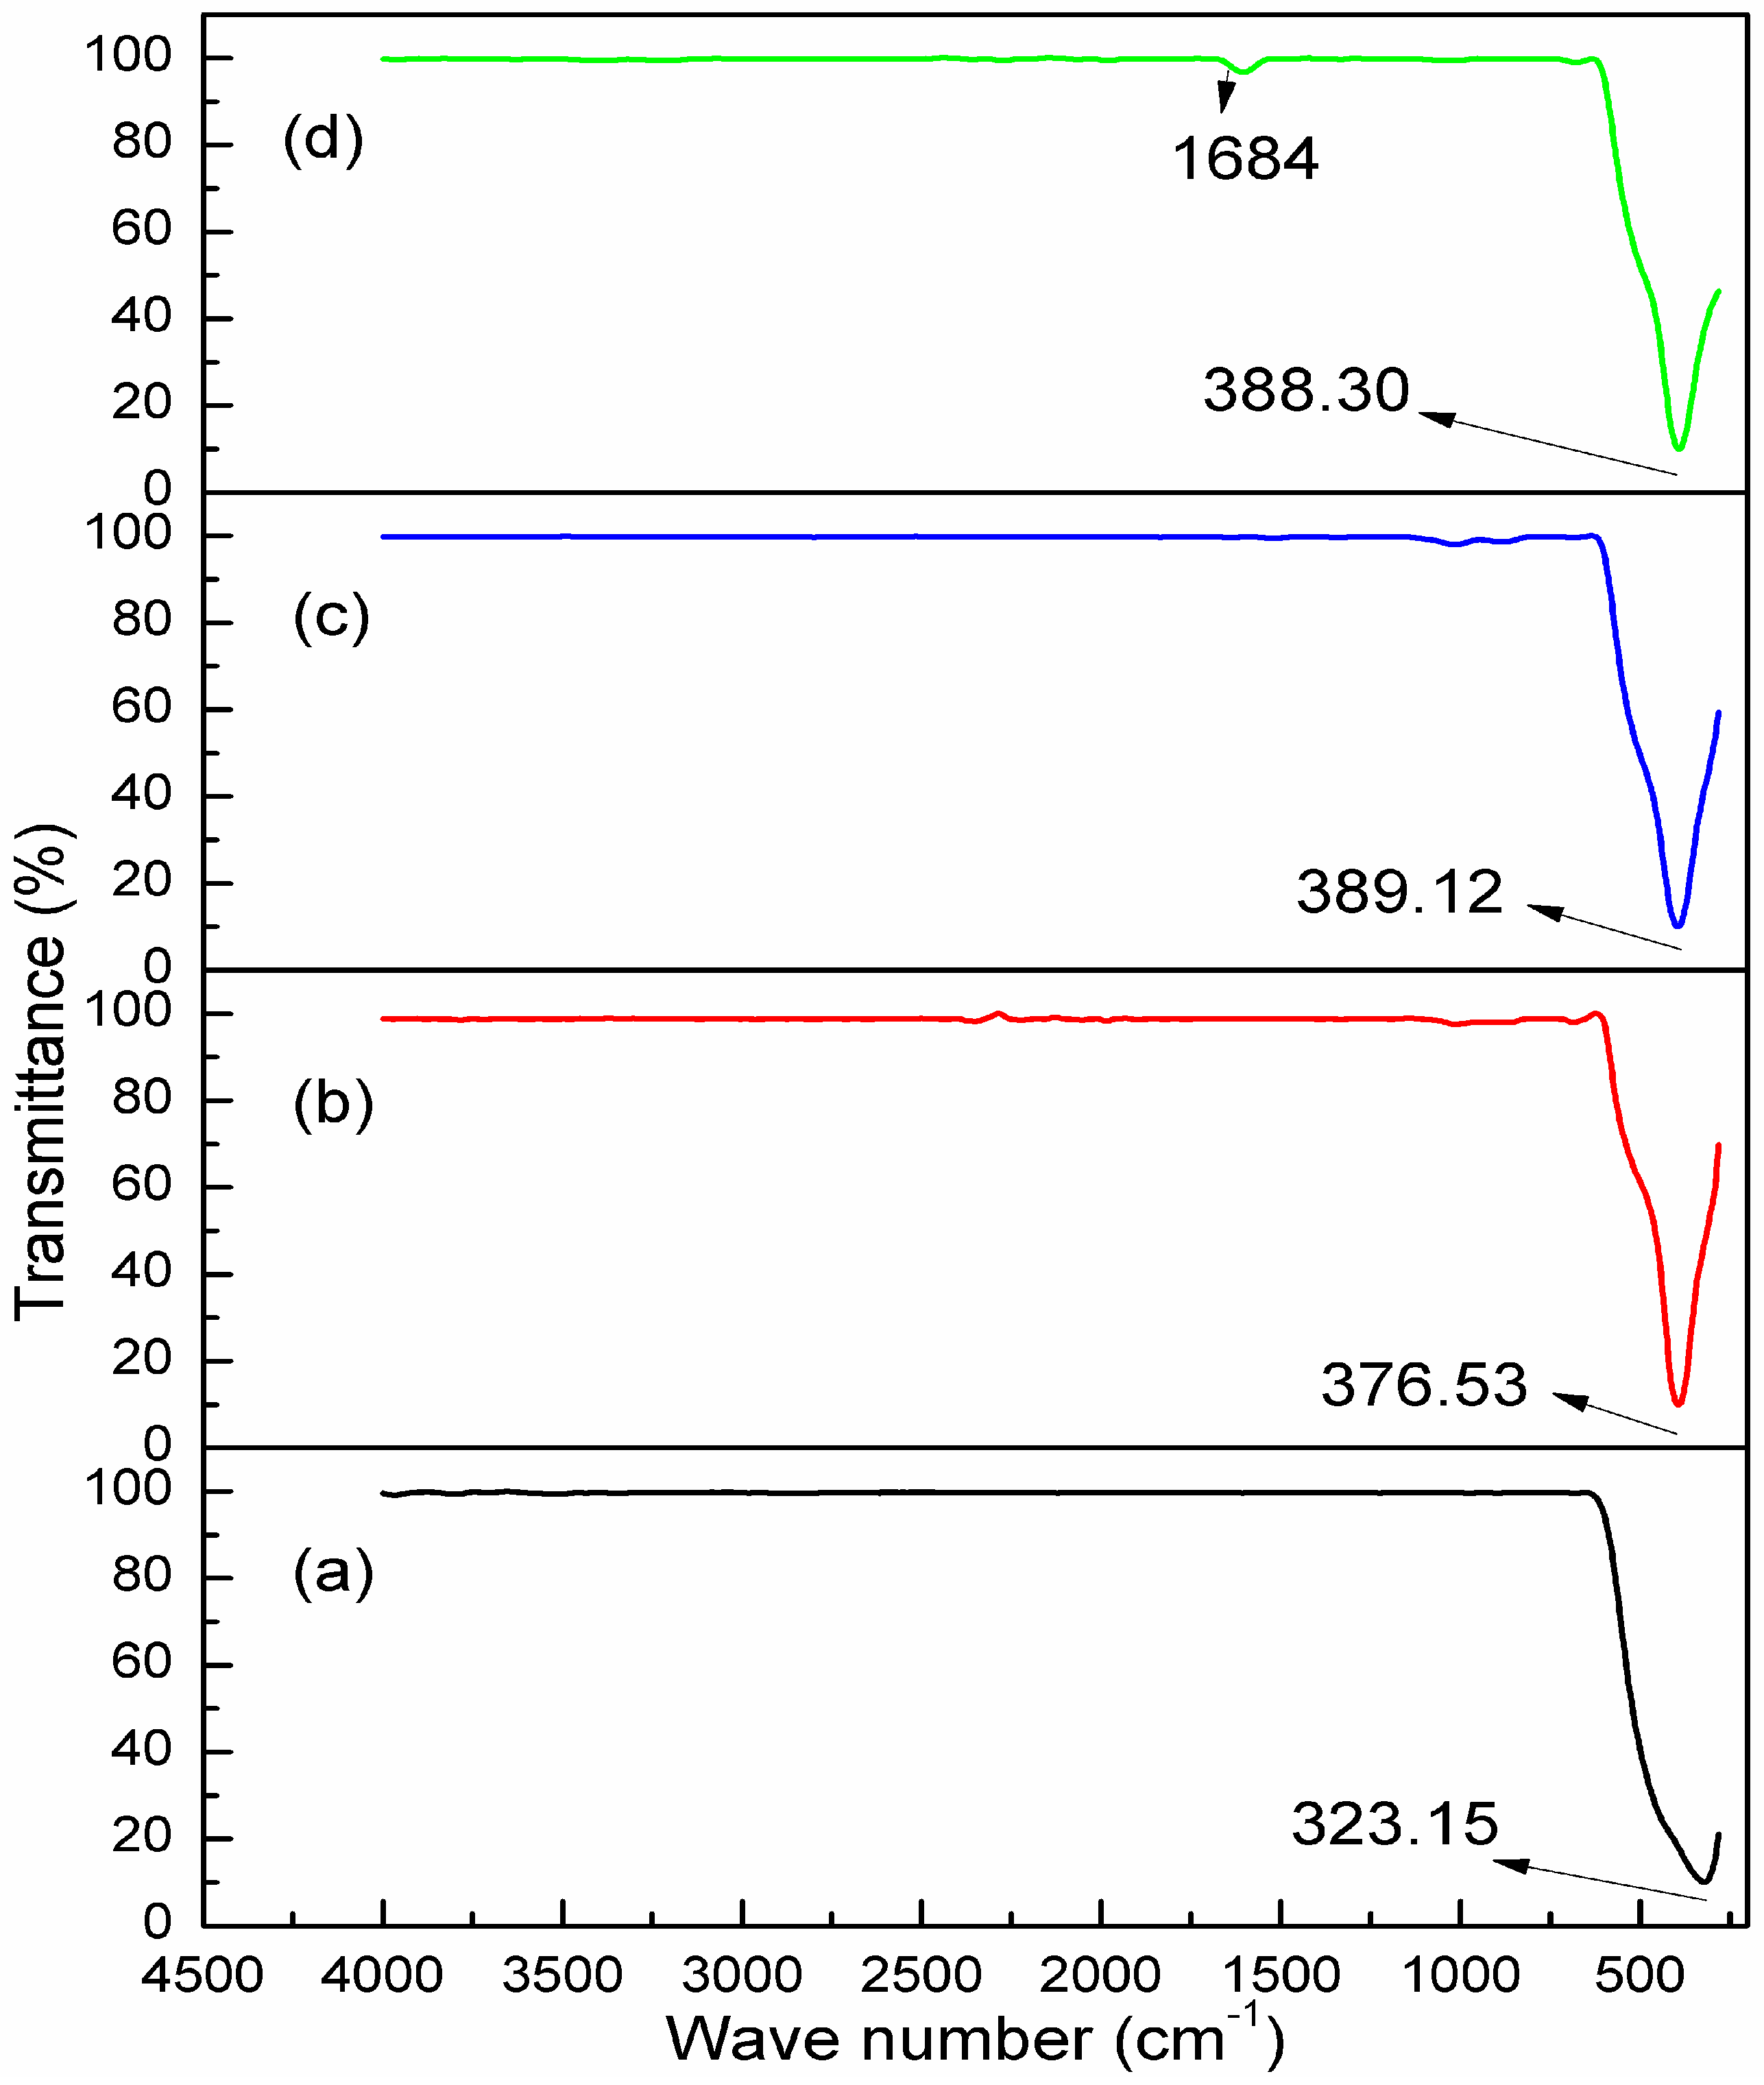
2.2.4. Phase Composition Analysis

This study explores the concentration of PVP for creating nanoparticles whilst completely eradicating the organic trace agent using FT-IR assessments. Another method for determining the ideal PVP concentration is to investigate the interaction between PVP and ZnO nanoparticles. Figure 4 presents the spectra results, showing both the organic and inorganic elements within the PVP-aided samples (0–5 g across a wave number range of 280–4000 cm−1). In the samples without PVP, the existence of metal oxide results in singular peaks, as shown in Figure 4a; whilst in the samples with the assistance of PVP, the existence of zinc oxide nanoparticles results in singular peaks, as shown in Figure 4b–d. It appears that the heat-based treatment method resulted in the accumulation of ZnO, as demonstrated by the presence of single absorption peaks within the ZnO spectra values. The application of heat-based treatment methods in conjunction with the use of PVP resulted in faster crystallization of the ZnO nanoparticles, thus resulting in single absorption peaks and a fluctuation in the spectra values’ wave number.
The values shown in Figure 4c reflect a level of purity that can be found in the form of zinc oxide nanoparticles produced with a PVP concentration of less than 5 g. In other words, as shown in Figure 4d, PVP concentrations of 5 g resulted in minor levels of organic matter (1684.00 cm−1, due to CO bond). Thus, it is clear that high levels of organic material overwhelmed the zinc oxide nanoparticles, meaning that the ideal PVP concentration for producing pure zinc oxide nanoparticles is 4 g using the heat-based treatment method. When applying calcination of 600 °C, this concentration of PVP provides the best environment to produce pure zinc oxide nanoparticles with enhanced crystallinity and the smallest particle sizes.

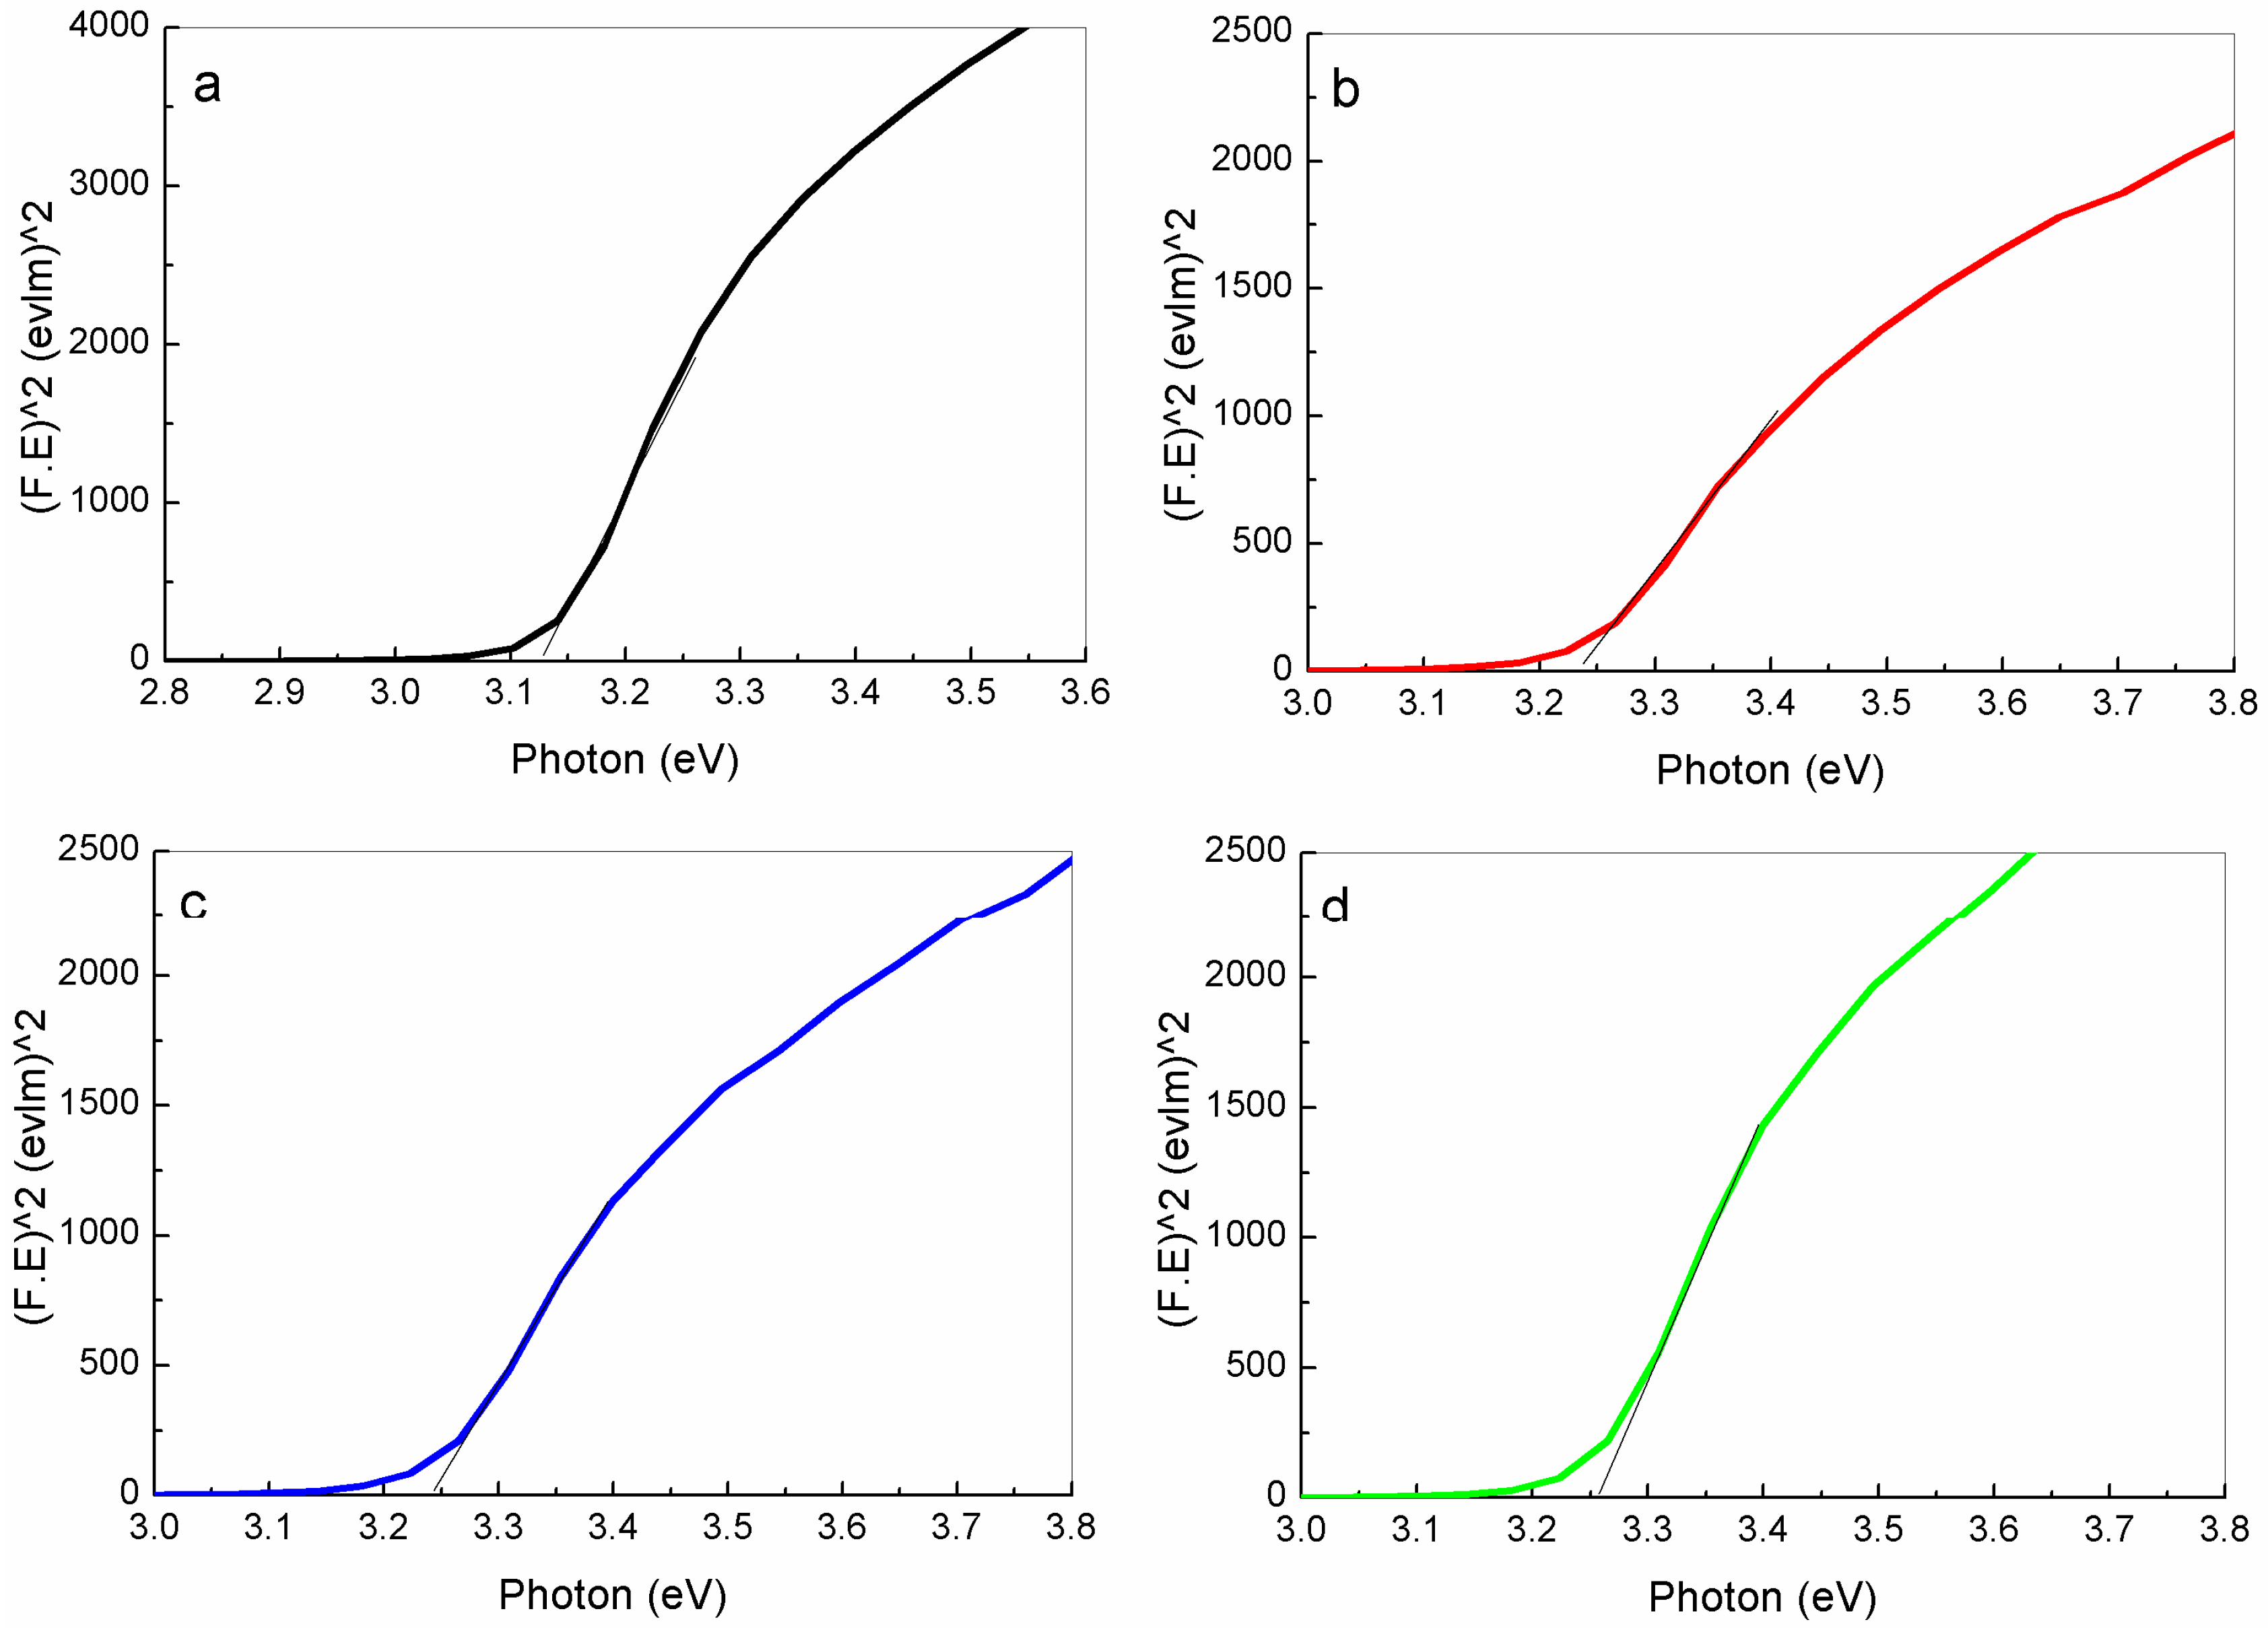
2.2.5. UV-VIS Spectrophotometer Analysis

This section of the paper presents the analysis of the ways in which ZnO nanoparticles’ optical features are influenced by a calcination temperature of 600 °C applied in conjunction with different PVP concentrations.
As per the Kubelka-Munk (KM) equation [59], the absorption coefficient was identified using the diffuse reflectance measurement. The equation is as follows:
F(R∞) = α/s = (1−R∞)/2R
where “α” represents the absorption coefficient, “S” represents the scattering coefficient, and F (R) represents the role of the KM [60]. The latter can be used as a substitute for “α” in the estimation of optical absorption edge energy for the diffused reflectance spectra values It was revealed that a plot of F(R)E vs. E was linear near the edge for direct allowed transition (η = 1/2). All samples were assigned an optical absorption edge energy value based on the intercept of the line on the abscissa (F(R)E = 0).
The following Kubelka-Munk equation was used in conjunction with the reflectance spectra values to identify the optical band gap of each sample (at different PVP concentrations and a calcination temperature of 600 °C):
(F(R) hv)2 = (A(hv−Eg))
where F(R) represents the Kubelka-Munk function/‘remission parameter’, (hv) represents the incident photon energy, A represents a constant that depends upon the probability of transition [61], and the diffuse reflectance (R), with (R) representing the diffuse reflectance obtained from R = Rsample/Rstandard [62].
Figure 5 presents the values of (F(R)∙hv)2 in comparison to (hv). The linear ranges on the graph are elongated to allow them to meet the (hv) axis [63,64]. This makes it possible to determine the optimal band gap values of the ZnO nanoparticles at different PVP concentrations. As illustrated in Figure 5, the results showed that an increase in PVP concentration (0–5 g) was associated with an increase to the optical band gap (3.12–3.26 eV, respectively). As supported by the XRD values, this relationship is due to a decrease in crystallinity enhancement and particle size: as particle size decreases, a lower number of atoms is required to create a particle, thus causing the conduction and valence electrons to be less attractive to the particles’ ion core. Consequently, the particles’ band gap expands.
On the other hand, as per the information outlined in Table 1 and Figure 5, an increase in PVP concentration was associated with an expansion in the energy band gaps of ZnO nanoparticles. It was found that the size of the ZnO particles was responsible for the change in band gap. Furthermore, it could be possible that band gap expansions resulted due to the electron transitions from the valence band to the conduction band (O2p → Zn3d) [65]. In addition, a reverse relation between the band gap energy increase and the crystalline size decrease could be derived. XRD analysis showed that the crystalline size of ZnO samples was decreased at high levels of PVP.
It is important not to overlook the ways in which the band gap is influenced by particle size: changes occur to the material’s features and band structure when particle sizes reduce. Thus, the band gap expands in line with a reduction in nanoparticle size; meaning that, small particles when energy increases, the conduction band of s-electrons and p-electrons are secured. Although these electrons are not situated close together. When the particle center is far away, nearer to the Fermi level, the conduction electrons achieve greater nuclear potential. Additionally, the absorption energy will decrease to that of the conduction band energy when approved quantum numbers are involved in each shift.

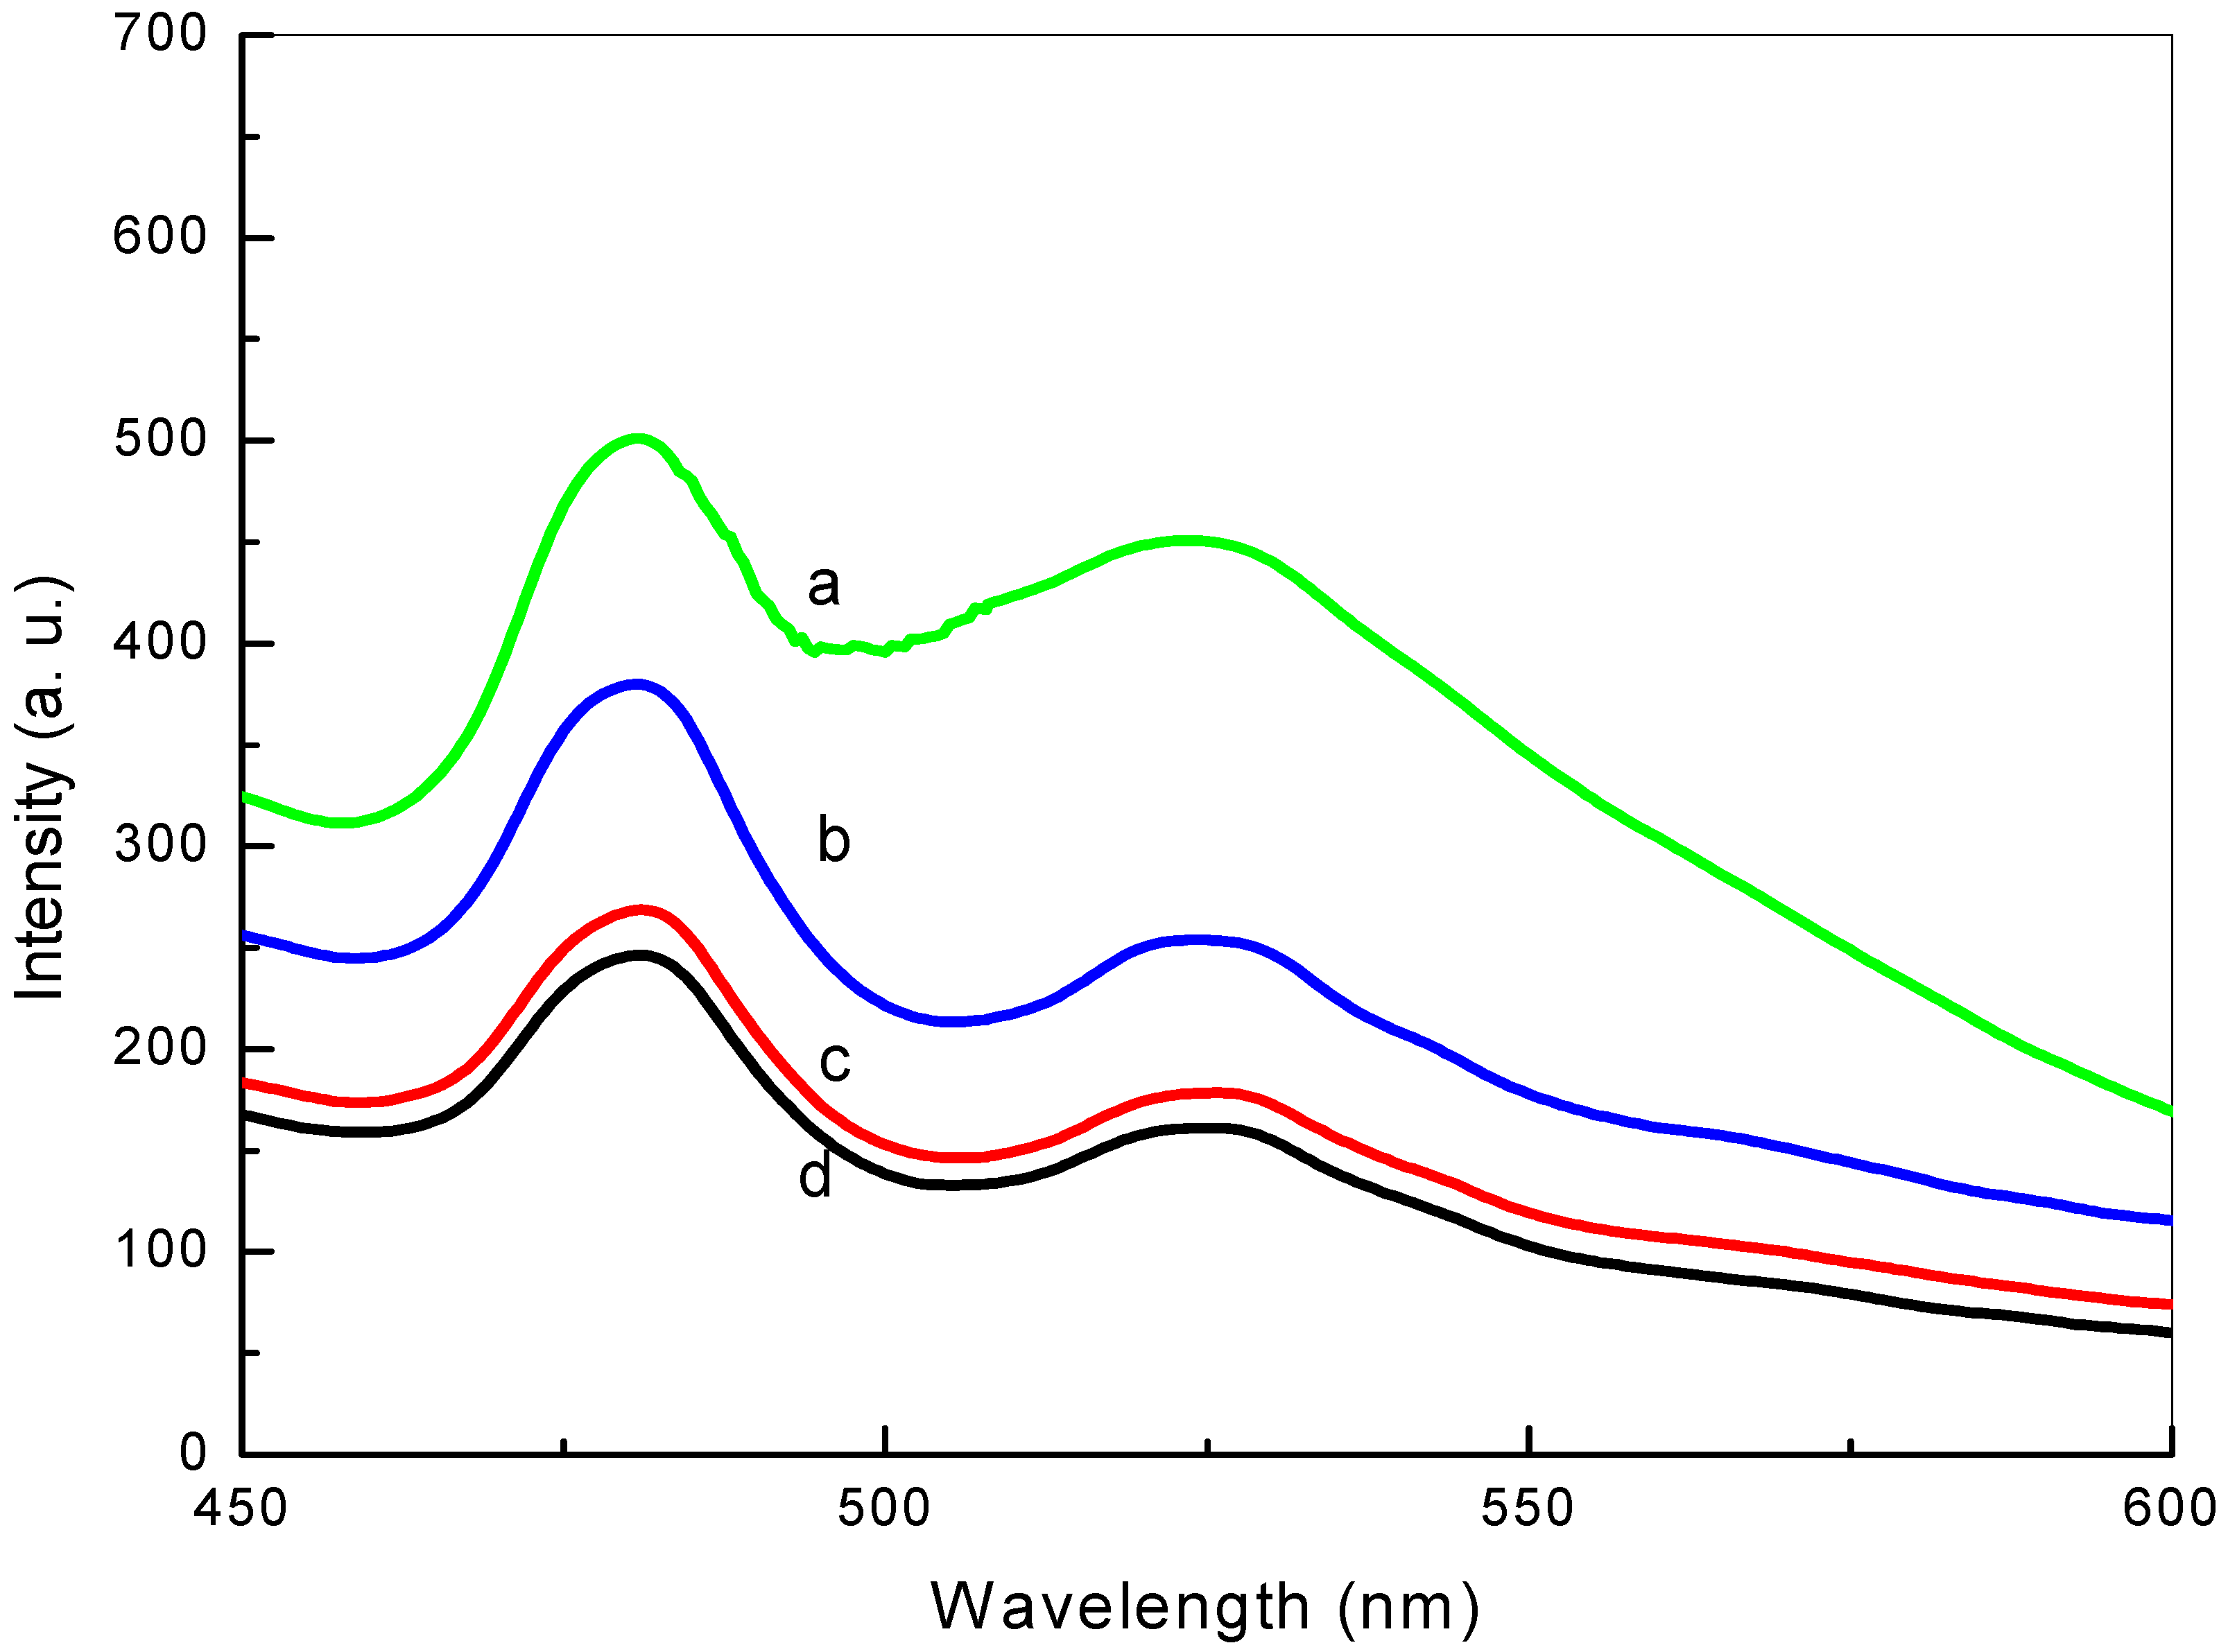
2.2.6. Photoluminescence Analysis

In this part of the paper, photoluminescence (PL) is used to evaluate the energy levels presented within the zinc oxide nanoparticle structure. The samples were prepared with a heat-based treatment technique and varying concentrations of PVP.
Figure 6 illustrates the ZnO nanoparticle (as a function of wavelength at room temperature and a 360 nm excitation wavelength) PL spectra values. Typically, crystal flaws and impurities lead to a number of potential emissions from the average metal oxide semiconductor, including the following: donor-acceptor recombination; band-edge recombination; exciton band to neutral acceptor; exciton band to neutral donor; free excitonic transition; interstitial X to conduction band excitation; X vacancy to the valance band; M vacancy to valance band excitation; and interstitial M to valance band.
Under ambient temperatures and a 360 nm excitation, the PVP-aided ZnO nanoparticles (produced at a calcination temperature of 600 °C) were assessed for their PL spectra values. Thus, two emission values have been found which are at ~475 and 525 nm for the ZnO nanoparticles produced with a PVP concentration of 3 g (Figure 6) [66,67,68,69]. The peak around 475 nm i.e., blue emission, is attributed to intrinsic defects, such as oxygen and zinc interstitials [70]. For the second, distinct composites (blue-green emissions observed at 525 nm) were recorded within the PL spectra values of ZnO nanoparticles, because of the transition between the valence and the conduction bands. Additionally, Cao et al. reported that the emission at the same wavelength (525 nm) is known to be a deep level emission which is caused by impurities of structural defects in the crystal, such as oxygen vacancies, and zinc interstitials [71,72,73]. This is a result of intrinsic defects within zinc oxide semiconductor nanoparticles [74,75].
When comparing the effects of different PVP concentrations, it is evident that—alongside a reduction in particle size—higher concentrations of PVP result in a decrease in intensity over time. The structure of ZnO is hexagonal with just a few surface and internal impurities.

3. Materials and Methods

3.1. Materials

The experimental chemical materials used here have never been purified further. In this study, deionized water, PVP, and a zinc nitrate reagent were used to produce the ZnO semiconductor nanoparticles. Here, PVP (MW = 29,000 g/mol) was provided from Sigma Aldrich to be used as a capping agent. In addition, a zinc nitrate reagent (MW = 297.47 g/mol) was provided from Acros Organics to be used as a metal precursor.

3.2. Synthesis of the Nanoparticles

One hundred milliliters of deionized water was used to dissolve the PVP at concentrations of 3, 4, and 5 g. This allowed for the preparation of the polymer solution prior to the introduction of the zinc nitrate (0.2 mmol), Zn(NO3)2∙6H2O. Homogeneity was achieved after 2 h of stirring. The solution was transferred into a glass vessel and placed in the oven at 100 °C for 24 h in order to remove all traces of water. A mortar and pestle was used for 15 min to reduce the remaining solid to a powder, which was then calcined (600 °C) for 3 h. This allowed for the complete removal of organic matter and the crystallization of the ZnO nanoparticles [53].

3.3. Characterization

The attributes of the resulting ZnO nanoparticles were evaluated using a number of characterization techniques. For instance, XRD was used to evaluate the structural attributes of the nanoparticles, as per the Shimadzu 6000 model. The nanoparticles samples’ consistency and morphological (e.g., shape-related) features have been evaluated by using SEM. Furthermore, as per the JEOL TEM 2010F UHR model, the evaluation of the nanoparticles sizes and their distribution have been assessed. Specifically, the TEM specimen was prepared by dissolving an amount of the powders (i.e., make them suspended) in an ethanol solvent. This sample was subjected to an ultrasonication process to obtain a good dispersion. Then, by using a micropipet (Pasteur pipet), a small drop of suspension had been dropped on the center of a carbon coated formvar grid. Finally, the grid was left for a dry process for 1 h to get the sample ready for TEM. As per the Perkin Elmer 1650 model, in order to assess the infrared spectra for the samples’ values ranging between 280 cm−1 and 4000 cm−1, an FT-IR spectrometer has been used. To assess the features of samples’ optical at ambient temperatures (200–800 nm), a UV-VIS spectrophotometer has been used, as per the Shimadzu UV-3600 model and photoluminescence (PL).

4. Conclusions

In summary, ZnO nanoparticles have been successfully synthesized through thermal treatment methods using only zinc nitrate as a metal precursor, PVP as a capping agent, and deionized water as a solvent. Overall, this result has revealed that PVP plays a crucial role in the preparation of the product. In fact, as demonstrated through the results of the XRD, TEM and FT-IR spectra, the average particle size was in the range of 32–26.5 nm, as confirmed by both XRD and TEM analyses. Furthermore, the energy band gap of the ZnO semiconductor nanoparticles has been determined from the reflectance spectra and found increase with the increase of PVP concentration. The PVP temporarily plays four different roles in the production of these nanoparticles. The first role is to regulate the nanoparticles’ nuclear expansion based on the PVP concentration used. The second role is to restrict the nanoparticles’ ability to accrete. The third role is to enhance the nanoparticles’ crystallinity capacity. Finally, the fourth role played by PVP is to support the production of homogenously-dispersed nanoparticles with regards to their form and size.
This study revealed an optimal PVP concentration of 4 g, finding that purity could not be achieved at any lower concentration. Additionally, the 4 g concentration level was also found to be the concentration that resulted in a nearly completely homogenous shape dispersal along.
The obtained results have revealed that this product is highly adequate for environmental researches and applications. Specifically, since different-sized ZnO nanostructures can be produced using different PVP concentrations, which would result in different band gap values capable of absorbing numerous solar energy wavelengths, this highlights strong potential for incorporation into sensors or solar cells.

Acknowledgments

The authors would like to thank the Faculty of Science, Universiti Putra Malaysia for providing a suitable environment to conduct this research.

Author Contributions

Naif Mohammed Al-Hada, Halimah Mohamed Kamari and Elias Saion conceived and designed the experiments; Naif Mohammed Al-Hada performed the experiments; Naif Mohammed Al-Hada, Halimah Mohamed Kamari, Elias Saion, Moayad Husein Flaifel and Abdullah Ahmed Ali Ahmed analyzed the data; Naif Mohammed Al-Hada, Elias Saion, Abdul Halim Shaari and Zainal Abidin Talib contributed reagents/materials/analysis tools; Naif Mohammed Al-Hada, Halimah Mohamed Kamari and Elias Saion wrote the paper.

Conflicts of Interest

The authors declare no conflict of interest.

References

  1. Pyun, J.; Matyjaszewski, K. Synthesis of Nanocomposite Organic/Inorganic Hybrid Materials Using Controlled/“Living” Radical Polymerization. Chem. Mater. 2001, 13, 3436–3448. [Google Scholar] [CrossRef]
  2. Schottner, G. Hybrid Sol-Gel-Derived Polymers: Applications of Multifunctional Materials. Chem. Mater. 2001, 13, 3422–3435. [Google Scholar] [CrossRef]
  3. Wang, Z.; Pinnavaia, T.J. Hybrid Organic-Inorganic Nanocomposites: Exfoliation of Magadiite Nanolayers in an Elastomeric Epoxy Polymer. Chem. Mater. 1998, 10, 1820–1826. [Google Scholar] [CrossRef]
  4. Jia, X.; Li, Y.; Cheng, Q.; Zhang, S.; Zhang, B. Preparation and Properties of Poly (Vinyl Alcohol)/Silica Nanocomposites Derived From Copolymerization of Vinyl Silica Nanoparticles and Vinyl Acetate. Eur. Polym. J. 2007, 43, 1123–1131. [Google Scholar] [CrossRef]
  5. Hau, S.K.; Yip, H.-L.; Baek, N.S.; Zou, J.; O’Malley, K.; Jen, A.K.-Y. Air-Stable Inverted Flexible Polymer Solar Cells Using Zinc Oxide Nanoparticles as an Electron Selective Layer. Appl. Phys. Lett. 2008, 92, 253301. [Google Scholar] [CrossRef]
  6. Boucle, J.; Ravirajan, P.; Nelson, J. Hybrid Polymer–Metal Oxide Thin Films for Photovoltaic Applications. J. Mater. Chem. 2007, 17, 3141–3153. [Google Scholar] [CrossRef]
  7. Sanvicens, N.; Marco, M.P. Multifunctional Nanoparticles—Properties and Prospects for Their Use in Human Medicine. Trends Biotechnol. 2008, 26, 425–433. [Google Scholar] [CrossRef] [PubMed]
  8. Neoh, K.G.; Kang, E.T. Functionalization of Inorganic Nanoparticles with Polymers for Stealth Biomedical Applications. Polym. Chem. 2011, 2, 747–759. [Google Scholar] [CrossRef]
  9. Tong, W.; Song, X.; Gao, C. Layer-by-Layer Assembly of Microcapsules and Their Biomedical Applications. Chem. Soc. Rev. 2012, 41, 6103–6124. [Google Scholar] [CrossRef] [PubMed]
  10. Krasia-Christoforou, T. Organic–Inorganic Polymer Hybrids: Synthetic Strategies and Applications. In Hybrid and Hierarchical Composite Materials; Springer: Berlin, Germany, 2015; pp. 11–63. [Google Scholar]
  11. Niederberger, M.; Pinna, N. Metal Oxide Nanoparticles in Organic Solvents: Synthesis, Formation, Assembly and Application; Springer: Berlin, Germany, 2009. [Google Scholar]
  12. Oskam, G. Metal Oxide Nanoparticles: Synthesis, Characterization and Application. J. Sol-Gel Sci. Technol. 2006, 37, 161–164. [Google Scholar] [CrossRef]
  13. Rozenberg, B.; Tenne, R. Polymer-Assisted Fabrication of Nanoparticles and Nanocomposites. Prog. Polym. Sci. 2008, 33, 40–112. [Google Scholar] [CrossRef]
  14. Kumar, A.P.; Depan, D.; Tomer, N.S.; Singh, R.P. Nanoscale Particles for Polymer Degradation fnd Stabilization—Trends and Future Perspectives. Prog. Polym. Sci. 2009, 34, 479–515. [Google Scholar] [CrossRef]
  15. Al-Hada, N.M.; Saion, E.B.; Shaari, A.H.; Kamarudin, M.A.; Flaifel, M.H.; Ahmad, S.H.; Gene, A. A facile Thermal-Treatment Route to Synthesize the Semiconductor CdO Nanoparticles and Effect of Calcination. Mater. Sci. Semicond. Process. 2014, 26, 460–466. [Google Scholar] [CrossRef]
  16. Song, N.; Fan, H.; Tian, H. PVP Assisted in Situ Synthesis of Functionalized Graphene/ZnO (FGZnO) Nanohybrids With Enhanced Gas-Sensing Property. J. Mater. Sci. 2015, 50, 2229–2238. [Google Scholar] [CrossRef]
  17. Reetz, M.T.; Helbig, W. Size-Selective Synthesis of Nanostructured Transition Metal Clusters. J. Am. Chem. Soc. 1994, 116, 7401–7402. [Google Scholar] [CrossRef]
  18. Antonietti, M.; Goltner, C. Superstructures of Functional Colloids: Chemistry on the Nanometer Scale. Angew. Chem. Int. Ed. Engl. 1997, 36, 910–928. [Google Scholar] [CrossRef]
  19. Schmid, G.; Chi, L.F. Metal Clusters and Colloids. Adv. Mater. 1998, 10, 515–526. [Google Scholar] [CrossRef]
  20. Pei, L.W. Architectural Control of Metal Sulfide Nanocrystals and Polymer Composites. Ph.D. Thesis, Department of Chemistry, National University of Singapore, Singapore, 2006. [Google Scholar]
  21. Liu, T.; Burger, C.; Chu, B. Nanofabrication in Polymer Matrices. Prog. Polym. Sci. 2003, 28, 5–26. [Google Scholar] [CrossRef]
  22. Adachi, S. Properties of Semiconductor Alloys: Group-IV, III–V and II–VI Semiconductors; John Wiley & Sons: Hoboken, NJ, USA, 2009; Volume 28. [Google Scholar]
  23. Cardona, M.; Peter, Y.Y. Fundamentals of Semiconductors; Springer: Berlin, Germany, 2005. [Google Scholar]
  24. Gupta, T.K. Application of Zinc Oxide Varistors. J. Am. Ceram. Soc. 1990, 73, 1817–1840. [Google Scholar] [CrossRef]
  25. Jagadish, C.; Pearton, S.J. Zinc Oxide Bulk, Thin Films and Nanostructures: Processing, Properties, and Applications; Elsevier: Oxford, UK; Amsterdam, The Netherlands, 2011. [Google Scholar]
  26. Tian, H.; Fan, H.; Guo, H.; Song, N. Solution-Based Synthesis of ZnO/Carbon Nanostructures by Chemical Coupling for High Performance Gas Sensors. Sens. Actuators B: Chem. 2014, 195, 132–139. [Google Scholar] [CrossRef]
  27. Fang, J.; Fan, H.; Tian, H.; Dong, G. Morphology Control of ZnO Nanostructures for High Efficient Dye-Sensitized Solar Cells. Mater. Charact. 2015, 108, 51–57. [Google Scholar] [CrossRef]
  28. Li, H.; Jiao, S.; Bai, S.; Li, H.; Gao, S.; Wang, J.; Yu, Q.; Guo, F.; Zhao, L. Precursor-Controlled Synthesis of Different ZnO Nanostructures by the Hydrothermal Method. Phys. Status Solidi 2014, 211, 595–600. [Google Scholar] [CrossRef]
  29. Baruah, S.; Dutta, J. Hydrothermal Growth of ZnO Nanostructures. Sci. Technol. Adv. Mater. 2009, 10, 1–19. [Google Scholar] [CrossRef] [PubMed]
  30. Andiyana, Y.; Suyatma, N.E. Physico-Mechanical Properties of Starch-Based Nanocomposite Film Incorporated with Hydrothermally Synthesized Zinc Oxide Nanoparticles. Mater. Sci. Forum 2016, 872, 162–167. [Google Scholar] [CrossRef]
  31. Farhadi-Khouzani, M.; Fereshteh, Z.; Loghman-Estarki, M.R.; Razavi, R.S. Different Morphologies of ZnO Nanostructures via Polymeric Complex Sol-Gel Method: Synthesis and Characterization. J. Sol-Gel Sci. Technol. 2012, 64, 193–199. [Google Scholar] [CrossRef]
  32. Khan, M.F.; Ansari, A.H.; Hameedullah, M.; Ahmad, E.; Husain, F.M.; Zia, Q.; Baig, U.; Zaheer, M.R.; Alam, M.M.; Khan, A.M.; et al. Sol-Gel Synthesis of Thorn-Like ZnO Nanoparticles Endorsing Mechanical Stirring Effect and Their Antimicrobial Activities: Potential Role as Nano-Antibiotics. Sci. Rep. 2016, 6, 27689. [Google Scholar] [CrossRef] [PubMed]
  33. Kumar, S. Synthesis of ZnO Nanostructures by Microwave Irradiation Using Albumen As a Template. J. Nanopart. 2013, 2013, 1–8. [Google Scholar] [CrossRef]
  34. Chen, D.; Ai, S.; Liang, Z.; Wei, F. Preparation and Photocatalytic Properties of Zinc Oxide Nanoparticles by Microwave-Assisted Ball Milling. Ceram. Int. 2016, 42, 3692–3696. [Google Scholar] [CrossRef]
  35. Azlinda, A.; Eswar, K.; Husairi, F.; Khusaimi, Z.; Rusop, M. Optical Properties of Nano-Porous Structure ZnO Prepared by Catalytic-Immersion Method; IOP Conference Series, Materials Science and Engineering; IOP Publishing: Shah Alam, Malaysia, 2013; p. 012044. [Google Scholar]
  36. Atchudan, R.; Edison, T.N.J.I.; Perumal, S.; Karthikeyan, D.; Lee, Y.R. Facile Synthesis of Zinc Oxide Nanoparticles Decorated Graphene Oxide Composite via Simple Solvothermal Route and Their Photocatalytic Activity on Methylene Blue Degradation. J. Photochem. Photobiol. B: Biol. 2016, 162, 500–510. [Google Scholar] [CrossRef] [PubMed]
  37. Yang, J.; Wang, Y.; Kong, J.; Yu, M.; Jin, H. Preparation of Controlled ZnO Nanostructures and Their Optical Properties. J. Mater. Sci. Mater. Electron. 2016, 27, 7227–7232. [Google Scholar] [CrossRef]
  38. Wang, Z.; Zhang, H.; Zhang, L.; Yuan, J.; Yan, S.; Wang, C. Low-Temperature Synthesis of ZnO Nanoparticles by Solid-State Pyrolytic Reaction. Nanotechnology 2002, 14, 11. [Google Scholar] [CrossRef]
  39. Gene, S.A.; Saion, E.; Shaari, A.H.; Kamarudin, M.A.; Al-Hada, N.M.; Kharazmi, A. Structural, Optical, and Magnetic Characterization of Spinel Zinc Chromite Nanocrystallines Synthesised by Thermal Treatment Method. J. Nanomater. 2014, 2014, 1–7. [Google Scholar] [CrossRef]
  40. Zakiyah, L.B.; Saion, E.; Al-Hada, N.M.; Gharibshahi, E.; Salem, A.; Soltani, N.; Gene, S. Up-Scalable Synthesis of Size-Controlled Copper Ferrite Nanocrystals by Thermal Treatment Method. Mater. Sci. Semicond. Process. 2015, 40, 564–569. [Google Scholar] [CrossRef]
  41. Hashem, M.; Saion, E.; Al-Hada, N.M.; Kamari, H.M.; Shaari, A.H.; Talib, Z.A.; Paiman, S.B.; Kamarudeen, M.A. Fabrication and Characterization of Semiconductor Nickel Oxide (NiO) Nanoparticles Manufactured Using A Facile Thermal Treatment. Results Phys. 2016, 6, 1024–1030. [Google Scholar] [CrossRef]
  42. Sekine, N.; Chou, C.-H.; Kwan, W.L.; Yang, Y. ZnO Nano-Ridge Structure and Its Application in Inverted Polymer Solar Cell. Org. Electron. 2009, 10, 1473–1477. [Google Scholar] [CrossRef]
  43. Ko, S.H.; Lee, D.; Kang, H.W.; Nam, K.H.; Yeo, J.Y.; Hong, S.J.; Grigoropoulos, C.P.; Sung, H.J. Nanoforest of Hydrothermally Grown Hierarchical ZnO Nanowires for A High Efficiency Dye-Sensitized Solar Cell. Nano Lett. 2011, 11, 666–671. [Google Scholar] [CrossRef] [PubMed]
  44. Al-Hada, N.M.; Saion, E.; Kamari, H.M.; Flaifel, M.H.; Shaari, A.H.; Talib, Z.A.; Abdullahi, N.; Baqer, A.A.; Kharazmi, A. Structural, Morphological and Optical Behaviour of PVP Capped Binary (ZnOo)0.4(CdO)0.6 Nanoparticles Synthesised by A Facile Thermal Route. Mater. Sci. Semicond. Process. 2016, 53, 56–65. [Google Scholar] [CrossRef]
  45. Al-Hada, N.M.; Saion, E.; Talib, Z.A.; Shaari, A.H. The Impact of Polyvinylpyrrolidone on Properties of Cadmium Oxide Semiconductor Nanoparticles Manufactured by Heat Treatment Technique. Polymers 2016, 8, 113. [Google Scholar] [CrossRef]
  46. Al-Hada, N.M.; Saion, E.B.; Shaari, A.H.; Kamarudin, M.A.; Flaifel, M.H.; Ahmad, S.H.; Gene, S.A. A Facile Thermal-Treatment Route to Synthesize ZnO Nanosheets and Effect of Calcination Temperature. PLoS ONE 2014, 9, e103134. [Google Scholar] [CrossRef] [PubMed]
  47. Cunha, D.M.; Souza, F.L. Facile Synthetic Route For Producing One-Dimensional Zinc Oxide Nanoflowers and Characterization of Their Optical Properties. J. Alloys Compd. 2013, 577, 158–164. [Google Scholar] [CrossRef]
  48. Al-Hada, N.M.; Saion, E.; Shaari, A.; Kamarudin, M.; Gene, S.A. The Influence of Calcination Temperature on the Formation of Zinc Oxide Nanoparticles by Thermal-Treatment. Appl. Mech. Mater. 2014, 446, 181–184. [Google Scholar] [CrossRef]
  49. Jang, Y.J.; Simer, C.; Ohm, T. Comparison of Zinc Oxide Nanoparticles and Its Nano-Crystalline Particles on the Photocatalytic Degradation of Methylene Blue. Mater. Res. Bull. 2006, 41, 67–77. [Google Scholar] [CrossRef]
  50. Cullity, B. Elements of X-ray Diffraction, 2nd ed.; Adisson-Wesley Publishing: Wesley, NY, USA, 1978. [Google Scholar]
  51. Zhang, Q.; Park, K.; Cao, G. Synthesis of ZnO Aggregates and Their Application in Dye-Sensitized Solar Cells. Mater. Matters 2010, 5, 32–39. [Google Scholar]
  52. Hu, J.; Bando, Y.; Zhan, J.; Li, Y.; Sekiguchi, T. Two-Dimensional Micrometer-Sized Single-Crystalline ZnO Thin Nanosheets. Appl. Phys. Lett. 2003, 83, 4414–4416. [Google Scholar] [CrossRef]
  53. Xiao, Q.; Huang, S.; Zhang, J.; Xiao, C.; Tan, X. Sonochemical Synthesis of ZnO Nanosheet. J. Alloys Compd. 2008, 459, L18–L22. [Google Scholar] [CrossRef]
  54. Yang, J.; Wang, Y.; Kong, J.; Jia, H.; Wang, Z. Synthesis of ZnO Nanosheets via Electrodeposition Method and Their Optical Properties, Growth Mechanism. Opt. Mater. 2015, 46, 179–185. [Google Scholar] [CrossRef]
  55. Umar, A.; Hahn, Y. ZnO Nanosheet Networks and Hexagonal Nanodiscs Grown on Silicon Substrate: Growth Mechanism and Structural and Optical Properties. Nanotechnology 2006, 17, 2174. [Google Scholar] [CrossRef]
  56. Yang, Y.; Chen, H.; Zhao, B.; Bao, X. Size Control of ZnO Nanoparticles via Thermal Decomposition of Zinc Acetate Coated on Organic Additives. J. Cryst. Growth 2004, 263, 447–453. [Google Scholar] [CrossRef]
  57. Hsiao, I.-L.; Huang, Y.-J. Effects of Various Physicochemical Characteristics on the Toxicities of ZnO and Tio2 Nanoparticles toward Human Lung Epithelial Cells. Sci. Total Environ. 2011, 409, 1219–1228. [Google Scholar] [CrossRef] [PubMed]
  58. Sangeetha, G.; Rajeshwari, S.; Venckatesh, R. Green Synthesis of Zinc Oxide Nanoparticles by Aloe Barbadensis Miller Leaf Extract: Structure and Optical Properties. Mater. Res. Bull. 2011, 46, 2560–2566. [Google Scholar] [CrossRef]
  59. Kubelka, P.; Munk, F. A Contribution to the Optics of Pigments. Z. Tech. Phys. 1931, 12, 593–599. [Google Scholar]
  60. Kubelka, P. New Contributions to the Optics of Intensely Light-Scattering Materials. Part I. J. Opt. Soc. Am. 1948, 38, 448–457. [Google Scholar] [CrossRef] [PubMed]
  61. Johnson, E.J. Absorption Near the Fundamental Edge. Semicond. Semimet. 1967, 3, 153–258. [Google Scholar]
  62. Torrent, J.; Barron, V. Encyclopedia of Surface and Colloid Science; Marcel Dekker Inc.: New York, NY, USA, 2002; pp. 1438–1446. [Google Scholar]
  63. Pankove, J.I. Optical Processes in Semiconductors; Prentice-Hall: Englewood Cliffs, NJ, USA, 1971. [Google Scholar]
  64. Aita, C.R.; Liu, Y.-L.; Kao, M.L.; Hansen, S.D. Optical Behavior of Sputter-Deposited Vanadium Pentoxide. J. Appl. Phys. 1986, 60, 749–753. [Google Scholar] [CrossRef]
  65. Yu, J.; Li, C.; Liu, S. Effect of PSS on morphology and optical properties of ZnO. J. Colloid Interface Sci. 2008, 326, 433–438. [Google Scholar] [CrossRef] [PubMed]
  66. Padmavathy, N.; Vijayaraghavan, R. Enhanced Bioactivity of ZnO Nanoparticles—An Antimicrobial Study. Sci. Technol. Adv. Mater. 2008, 9, 035004. [Google Scholar] [CrossRef] [PubMed]
  67. Zhao, J.-H.; Liu, C.-J.; Lv, Z.-H. Photoluminescence of ZnO Nanoparticles and Nanorods. Int. J. Light Electron Opt. 2016, 127, 1421–1423. [Google Scholar] [CrossRef]
  68. Shi, G.; Mo, C.; Cai, W.; Zhang, L. Photoluminescence of ZnO Nanoparticles in Alumina Membrane with Ordered Pore Arrays. Solid State Commun. 2000, 115, 253–256. [Google Scholar] [CrossRef]
  69. Fujihara, S.; Naito, H.; Kimura, T. Visible Photoluminescence of ZnO Nanoparticles Dispersed in Highly Transparent MgF2 Thin-Films via Sol-Gel Process. Thin Solid Films 2001, 389, 227–232. [Google Scholar] [CrossRef]
  70. Leprince-Wang, Y.; Yacoubi-Ouslim, A.; Wang, G. Structure Study of Electrodeposited ZnO Nanowires. Microelectron. J. 2005, 36, 625–628. [Google Scholar] [CrossRef]
  71. Cao, H.; Zhao, Y.; Ong, H.; Ho, S.; Dai, J.Y.; Wu, J.Y.; Chang, R.P. Ultraviolet Lasing in Resonators Formed by Scattering in Semiconductor Polycrystalline Films. Appl. Phys. Lett. 1998, 73, 3656–3658. [Google Scholar] [CrossRef]
  72. Liu, M.; Kitai, A.; Mascher, P. Point Defects and Luminescence Centres in Zinc Oxide and Zinc Oxide Doped with Manganese. J. Lumin. 1992, 54, 35–42. [Google Scholar] [CrossRef]
  73. Bylander, E. Surface Effects on the Low-Energy Cathodoluminescence of Zinc Oxide. J. Appl. Phys. 1978, 49, 1188–1195. [Google Scholar] [CrossRef]
  74. Ghosh, A.; Deshpande, N.; Gudage, Y.; Joshi, R.; Sagade, A.; Phase, D.; Sharma, R. Effect of Annealing on Structural and Optical Properties of Zinc Oxide Thin Film Deposited by Successive Ionic Layer Adsorption and Reaction Technique. J. Alloys Compd. 2009, 469, 56–60. [Google Scholar] [CrossRef]
  75. Dingle, R. Luminescent Transitions Associated with Divalent Copper Impurities and the Green Emission From Semiconducting Zinc Oxide. Phys. Rev. Lett. 1969, 23, 579. [Google Scholar] [CrossRef]
Figure 1. X-ray diffraction of ZnO NPs at various polyvinylpyrrolidone concentration of (a) 0, (b) 3, (c) 4, and (d) 5 g.
Crystals 07 00002 g001
Figure 2. SEM micrographs of ZnO NPs at various polyvinylpyrrolidone concentration of (a) 0, (b) 3, (c) 4, and (d) 5 g.
Crystals 07 00002 g002
Figure 3. TEM micrographs and particle size distribution of ZnO NPs at various polyvinylpyrrolidone concentration of (a) 0, (b,b/) 3, (c,c/) 4, and (d,d/) 5 g.
Crystals 07 00002 g003
Figure 4. FT-IR spectra of ZnO NPs at various polyvinylpyrrolidone concentration of (a) 0, (b) 3, (c) 4, and (d) 5 g in the range of 280–4000 cm−1.
Crystals 07 00002 g004
Figure 5. The method to extracting the energy band gaps of ZnO NPs at various polyvinylpyrrolidone concentration of (a) 0, (b) 3, (c) 4, and (d) 5 g.
Crystals 07 00002 g005
Figure 6. Photoluminescence spectra of the ZnO NPs at various polyvinylpyrrolidone concentration of (a) 0, (b) 3, (c) 4, and (d) 5 g.
Crystals 07 00002 g006
Table 1. Average particle size and band gap energy of ZnO nanoparticles at different PVP concentrations.
ZnO NPsPVP Concentration (g)Crystalline Size XRD (nm)Particle Size TEM (nm)Energy Band Gap Eg (eV)
Sample 10--3.120
Sample 2331.832 ± 43.231
Sample 3427.527.5 ± 23.246
Sample 4525.726.5 ± 33.261

