
Control of Intrinsic Defects in Lithium Niobate Single Crystal for Optoelectronic Applications

Abstract
:1. Introduction
2. Defects in Lithium Niobate and Its Implications on the Optoelectronic Application
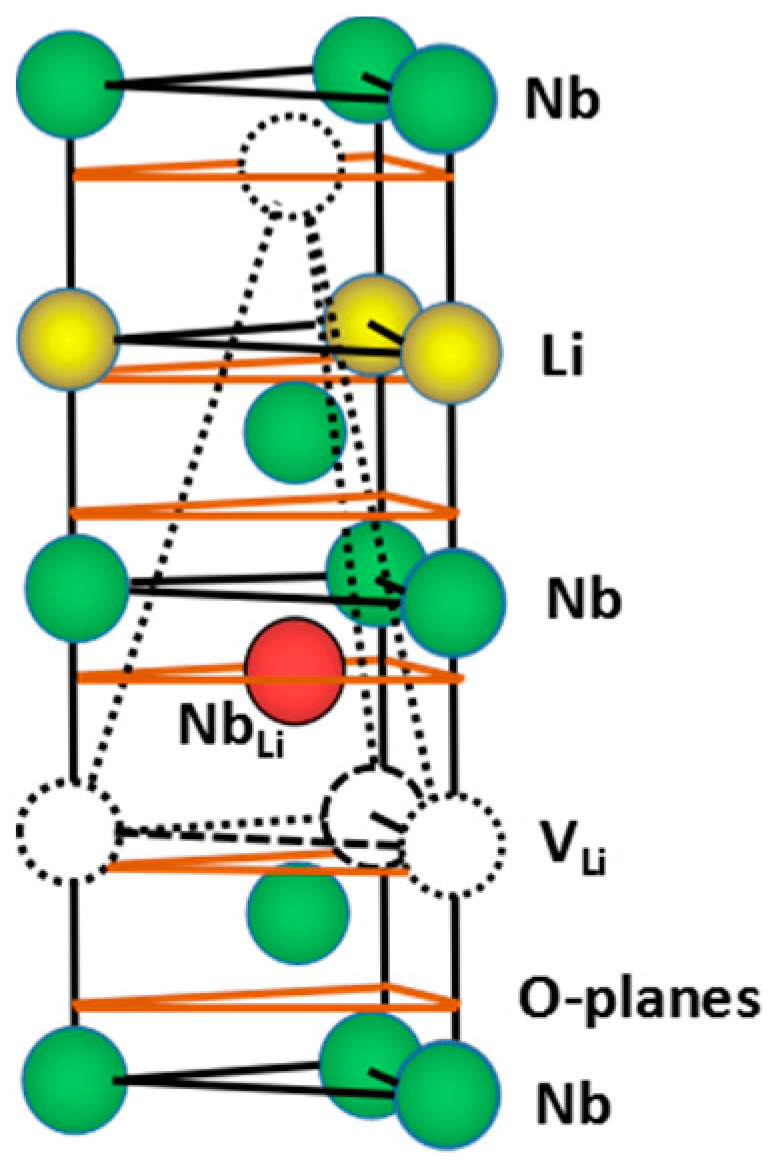
2.1. Point Defects in LiNbO3 Crystals
2.2. Effect of Intrinsic Defect on Properties
3. Preparation of Defect Controlled Crystals
3.1. Defect Control through Doping
3.2. Defect Control by Growing Near Stoichiometric LN Crystal
3.3. Preparation of Near Stoichiometric Sample by VTE
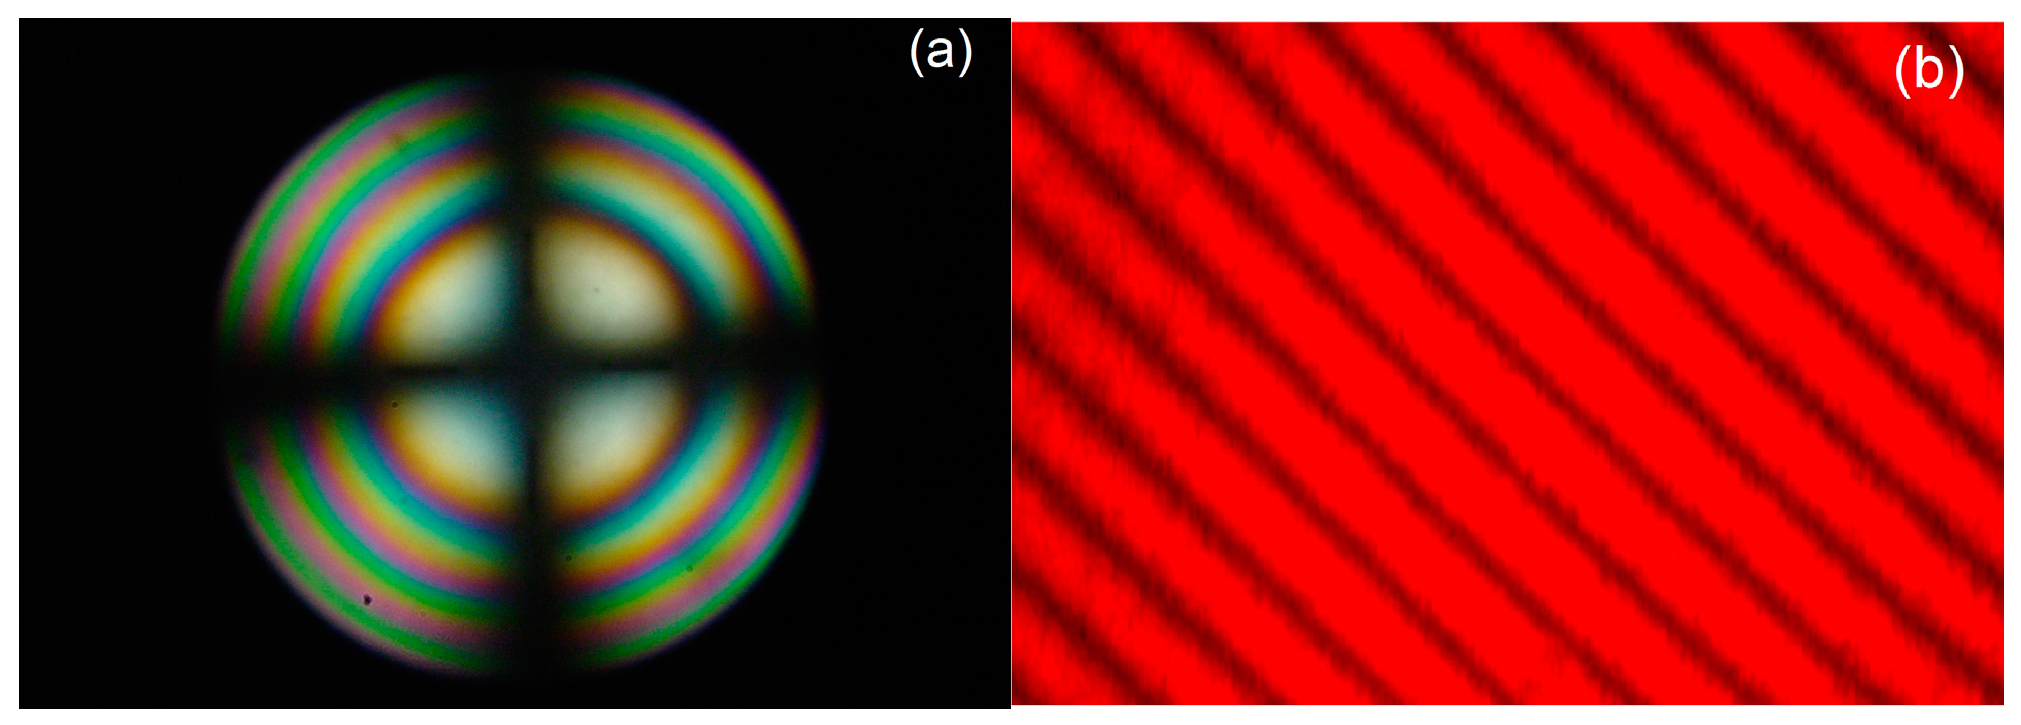
3.4. Test of Optical Homogeneity
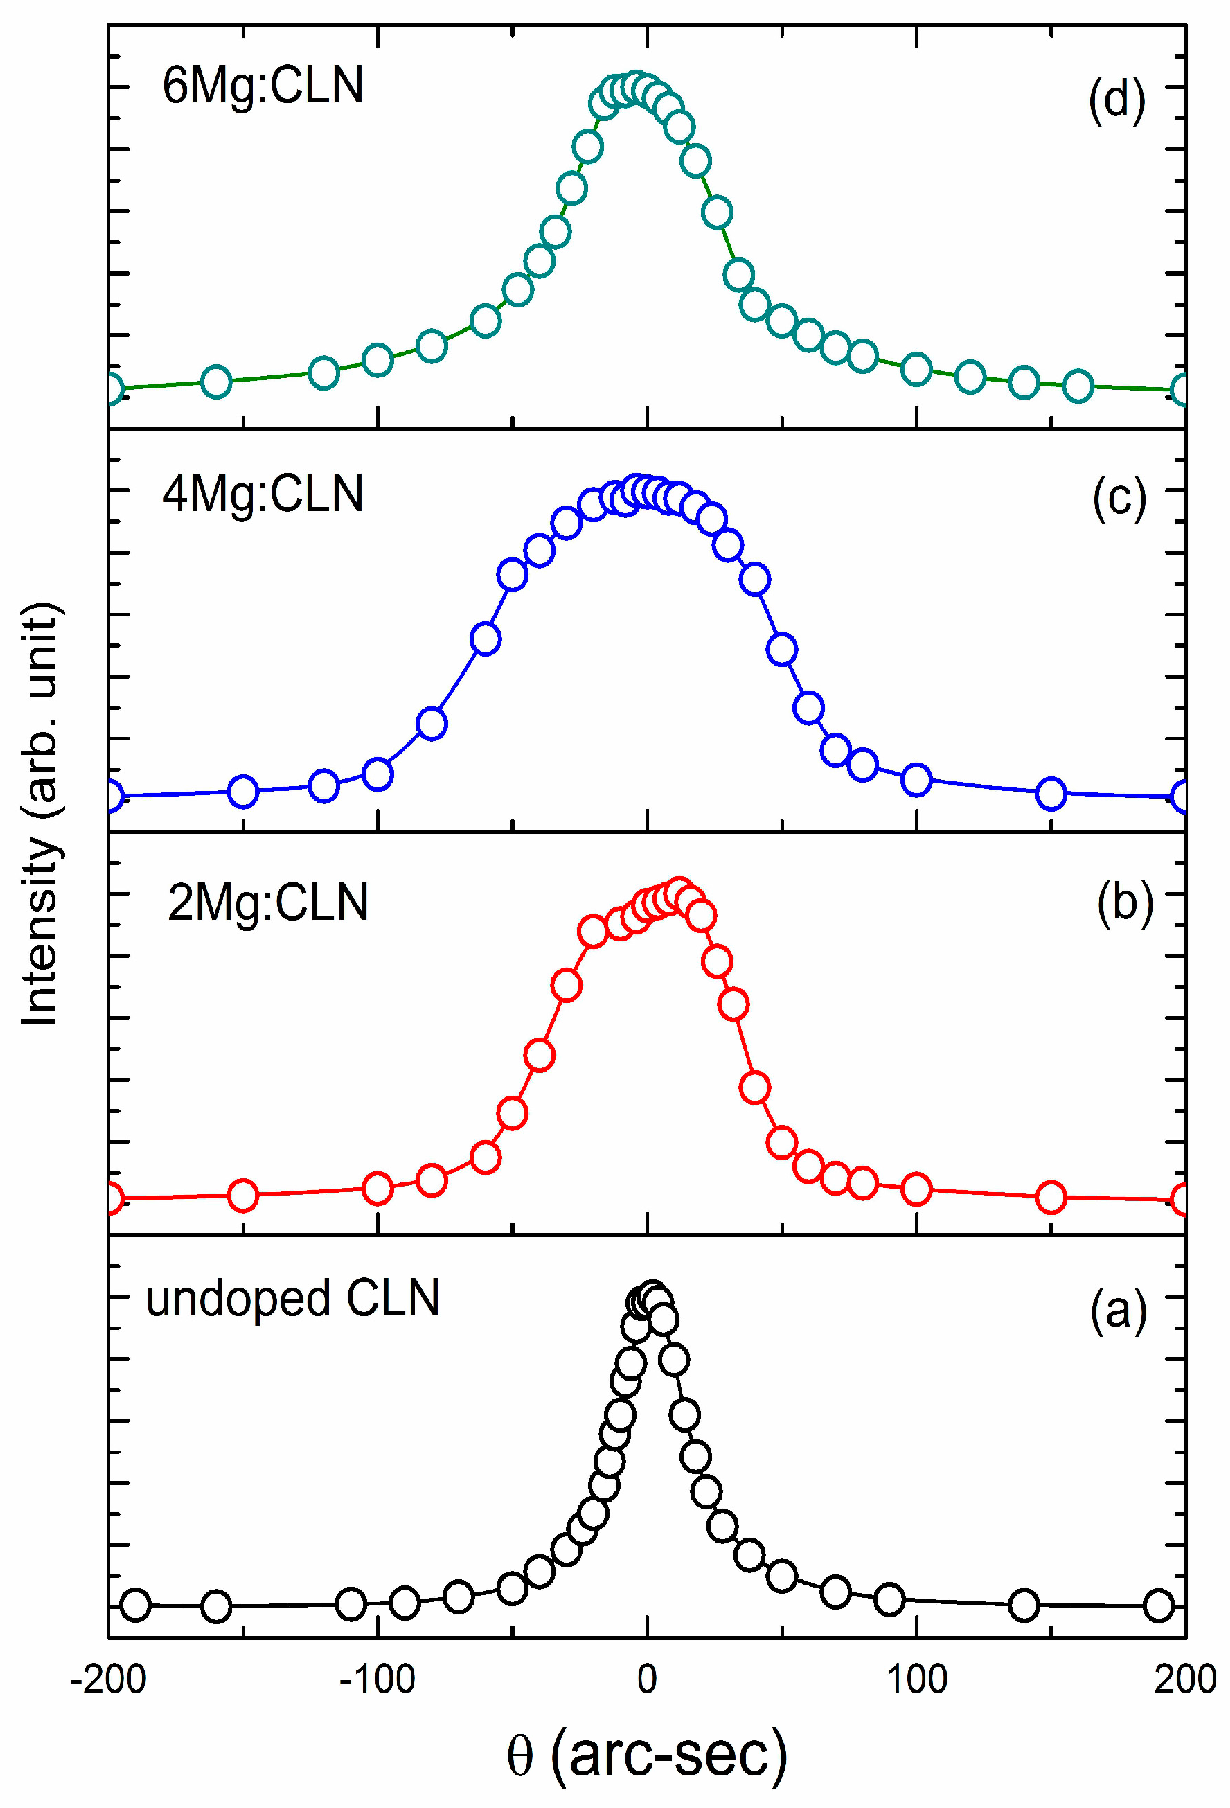
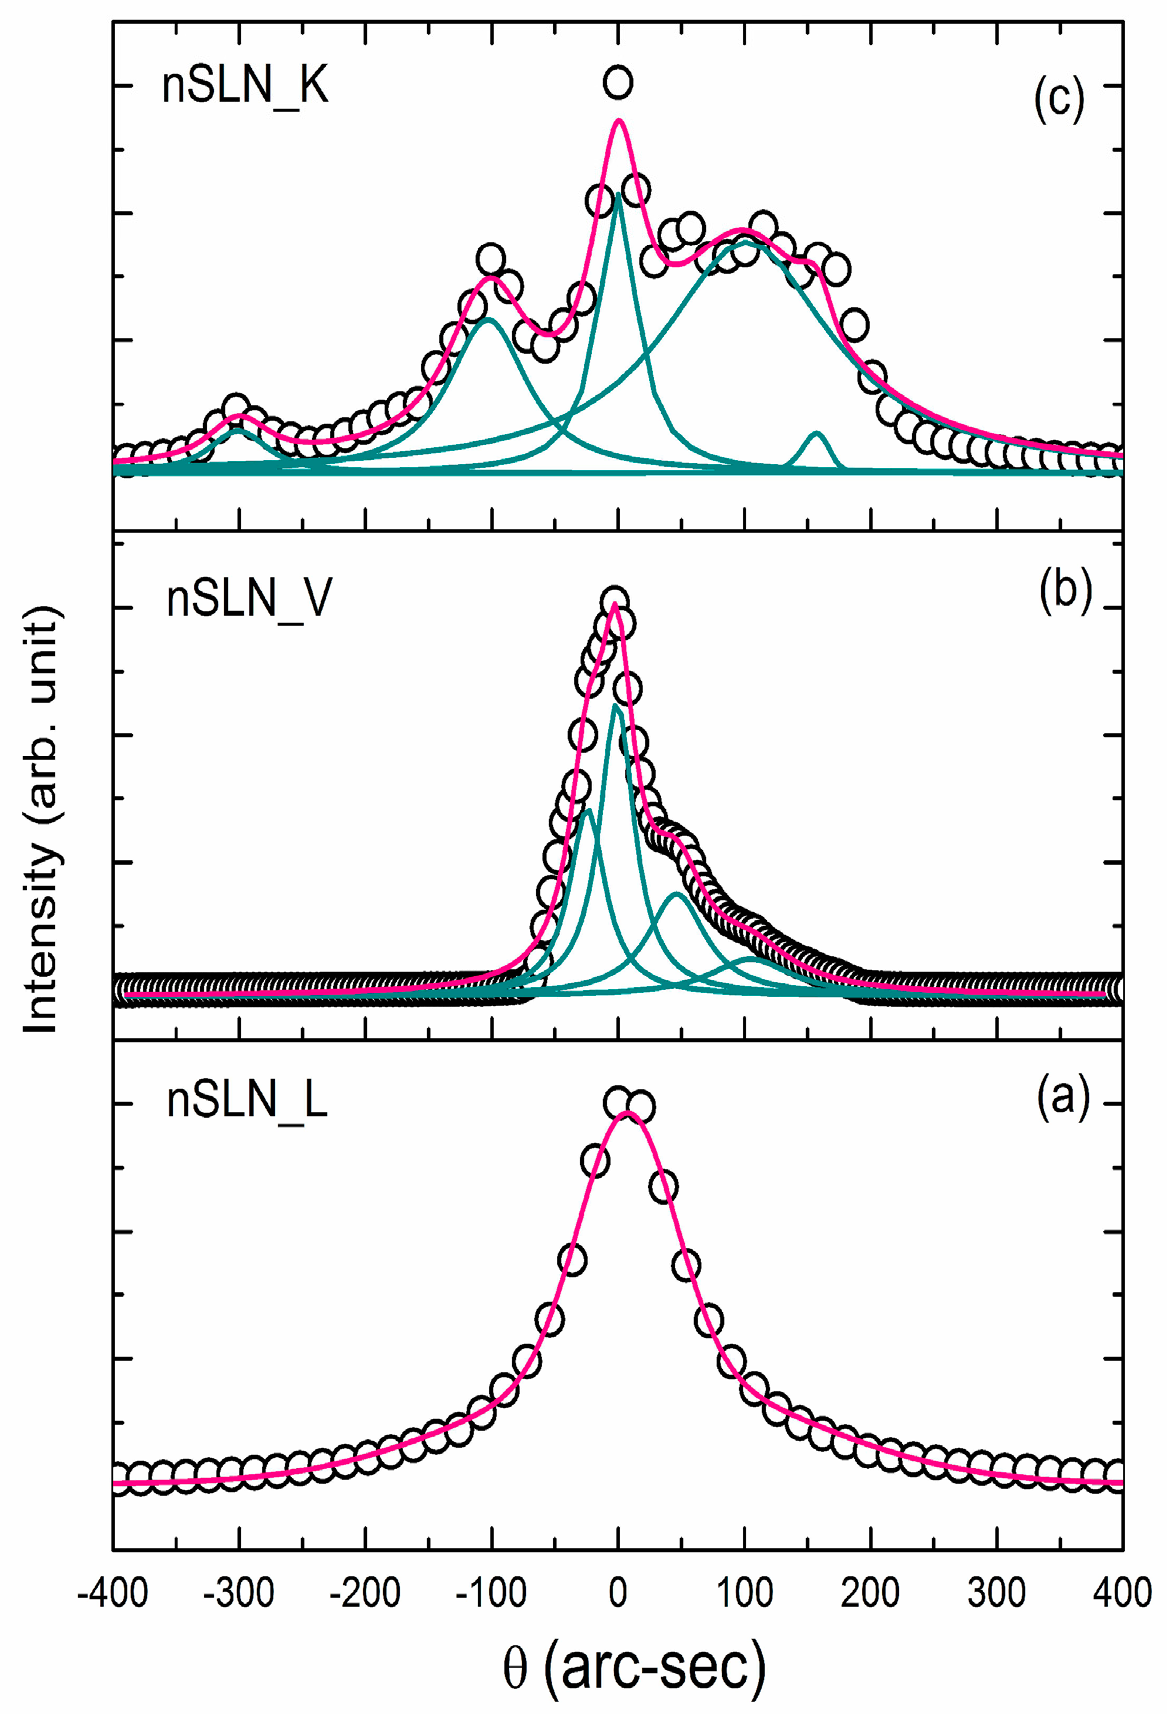
4. Effect of Defect Control Processes on Crystalline Quality
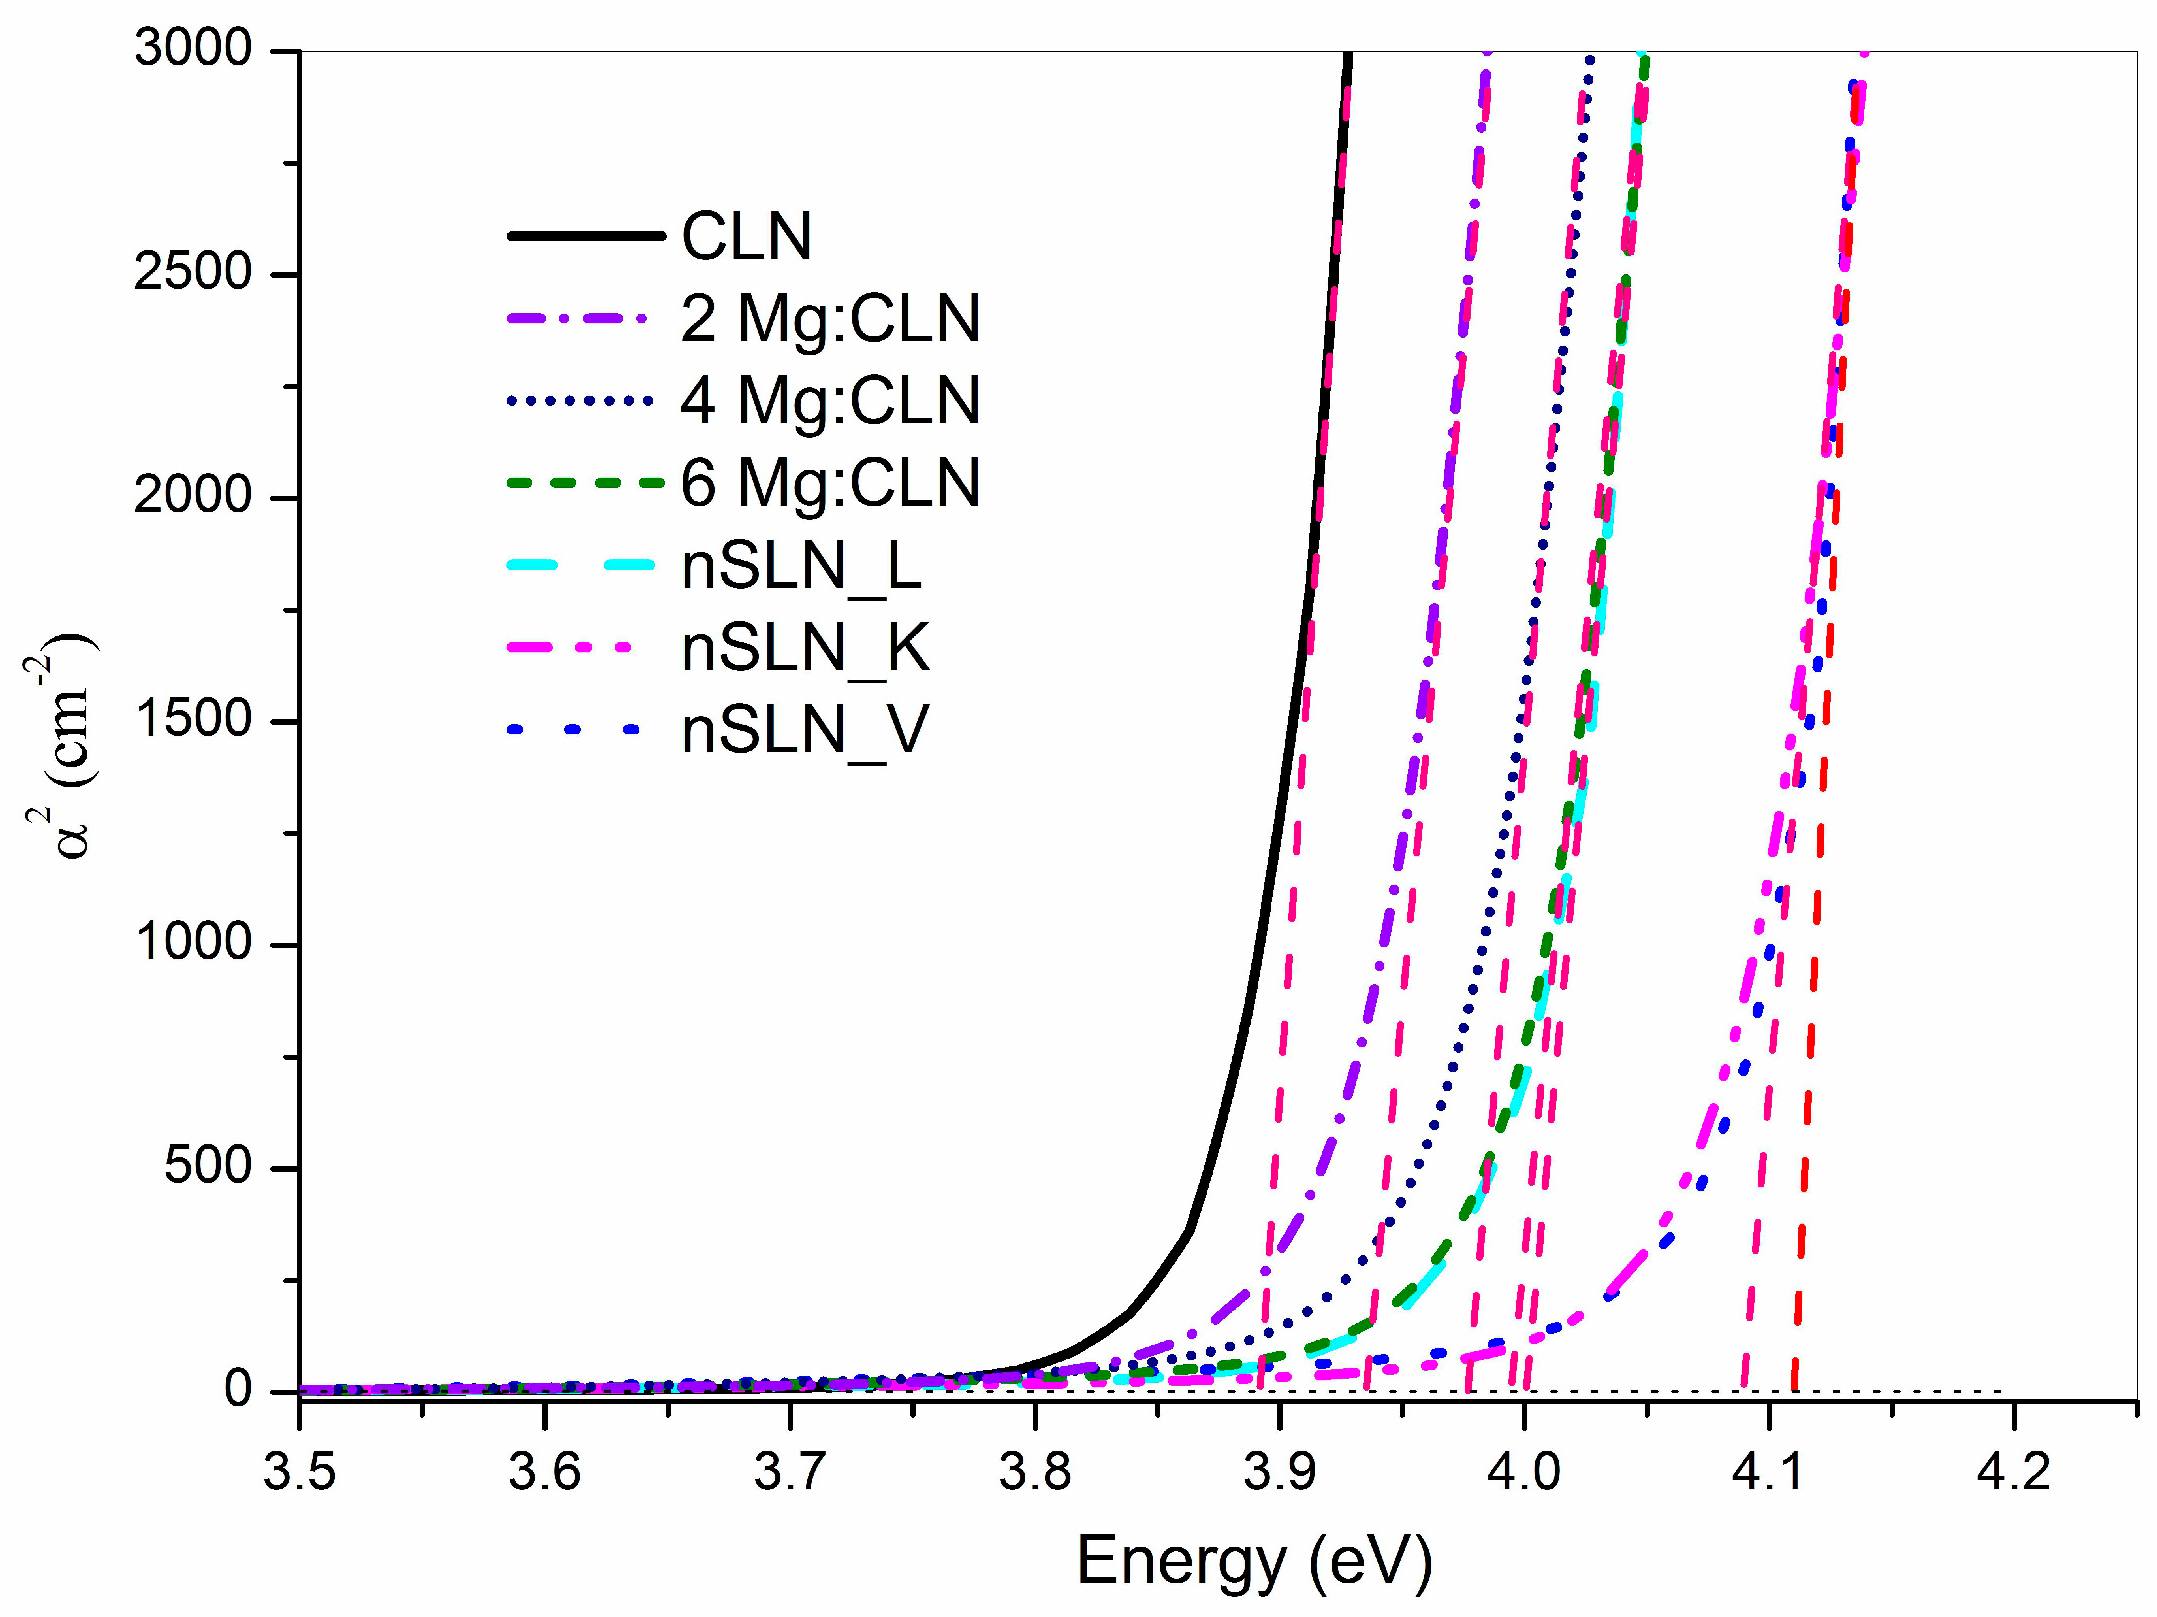
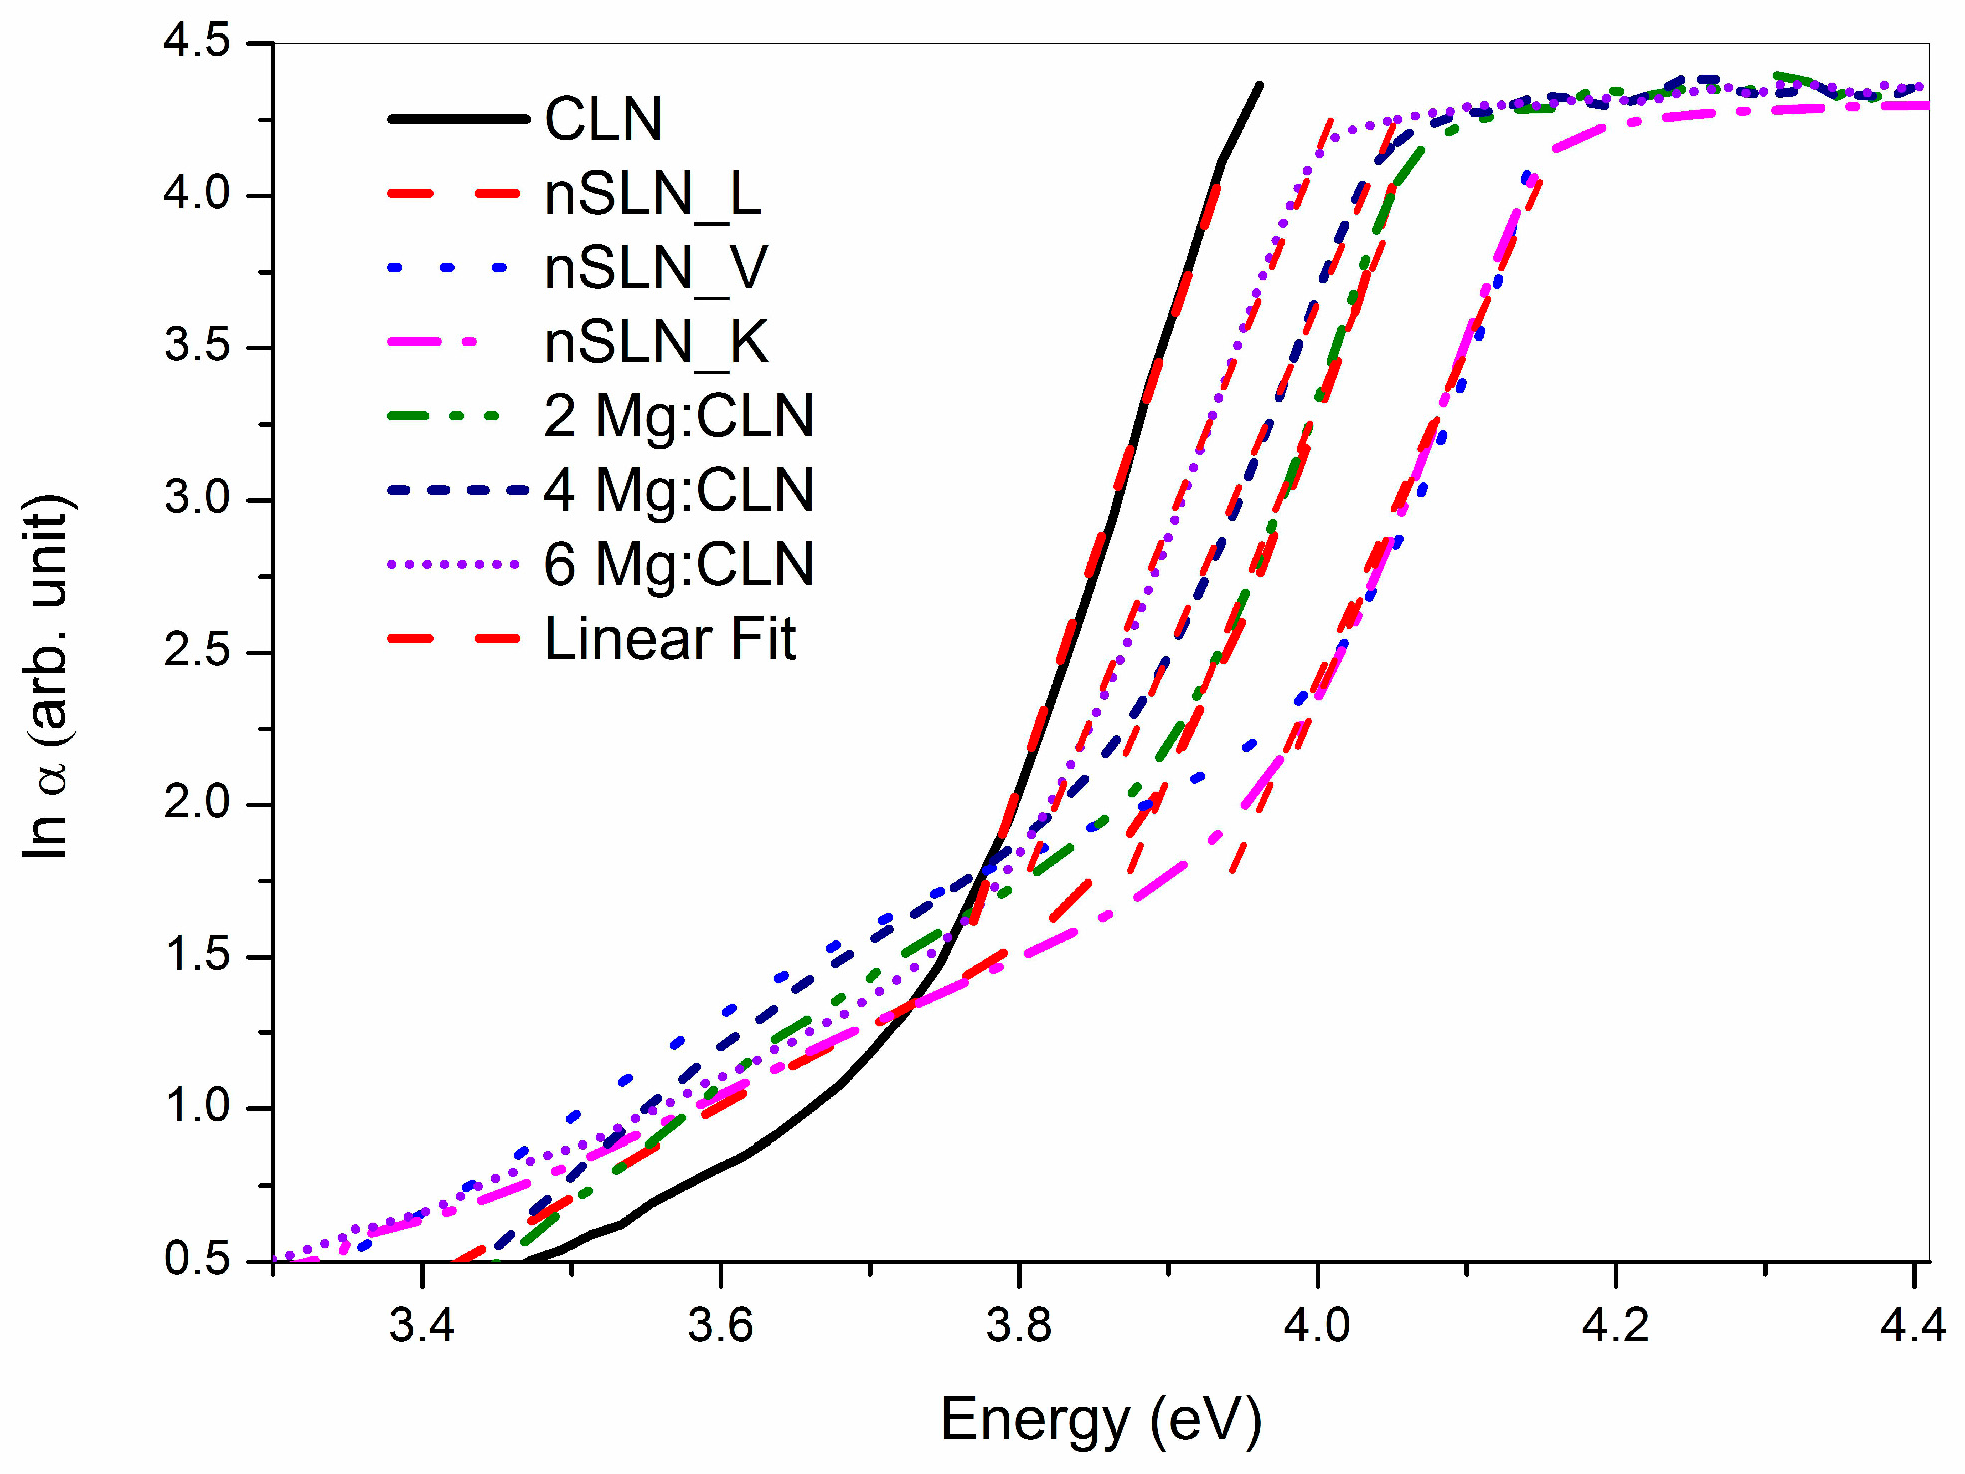
5. Effect of Defect Control Processes on the Optical Absorption
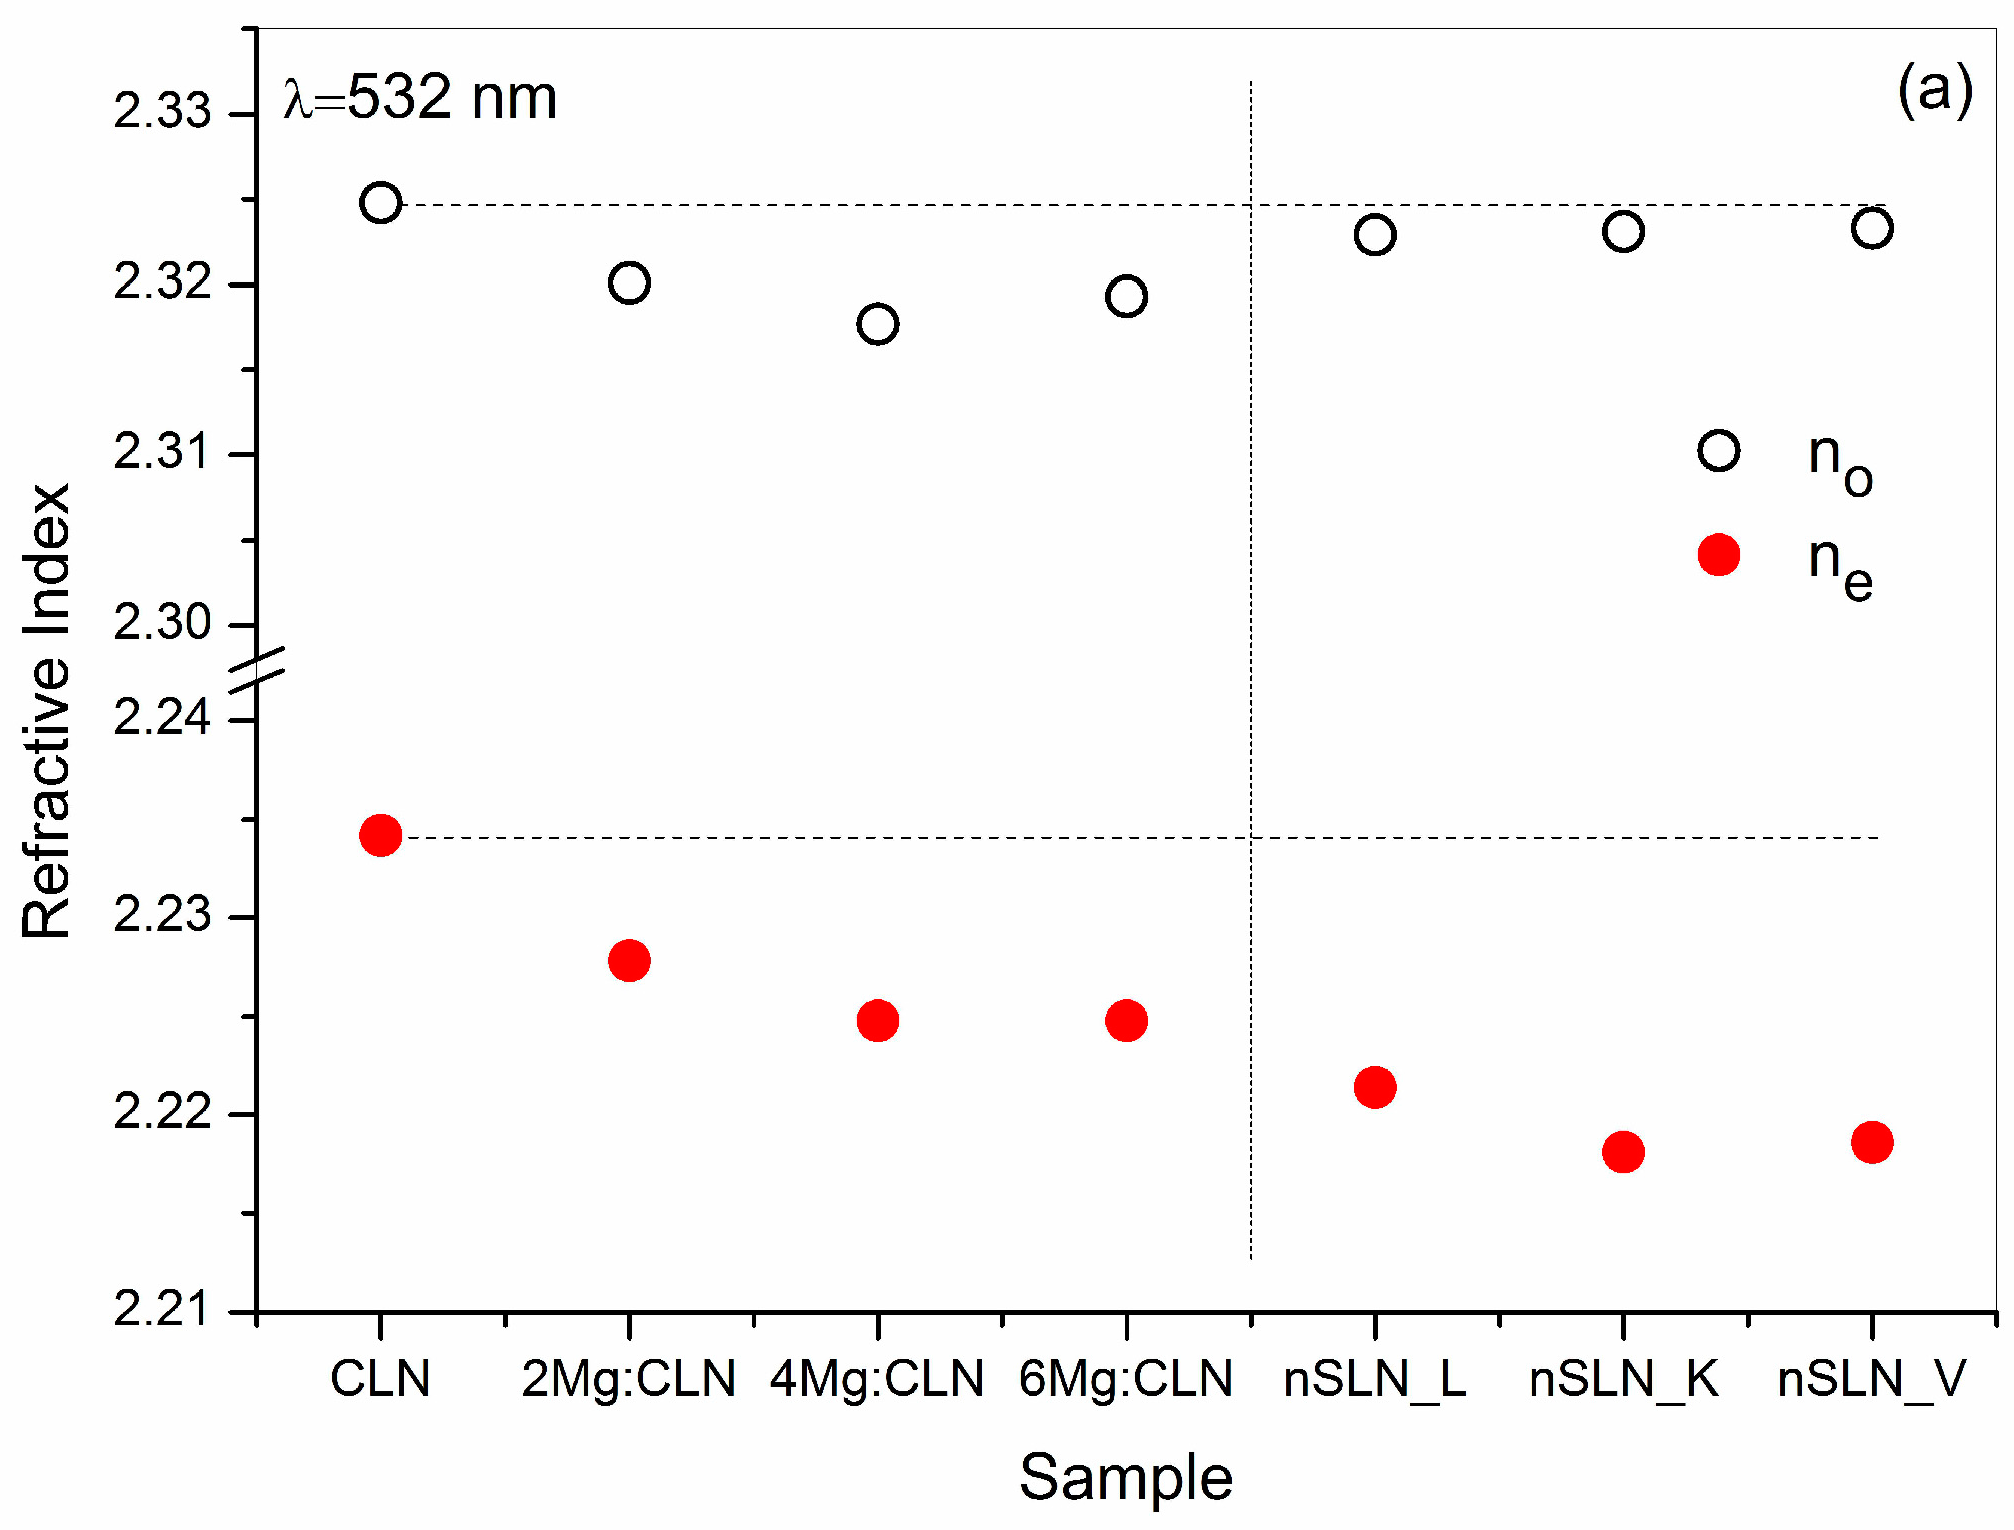
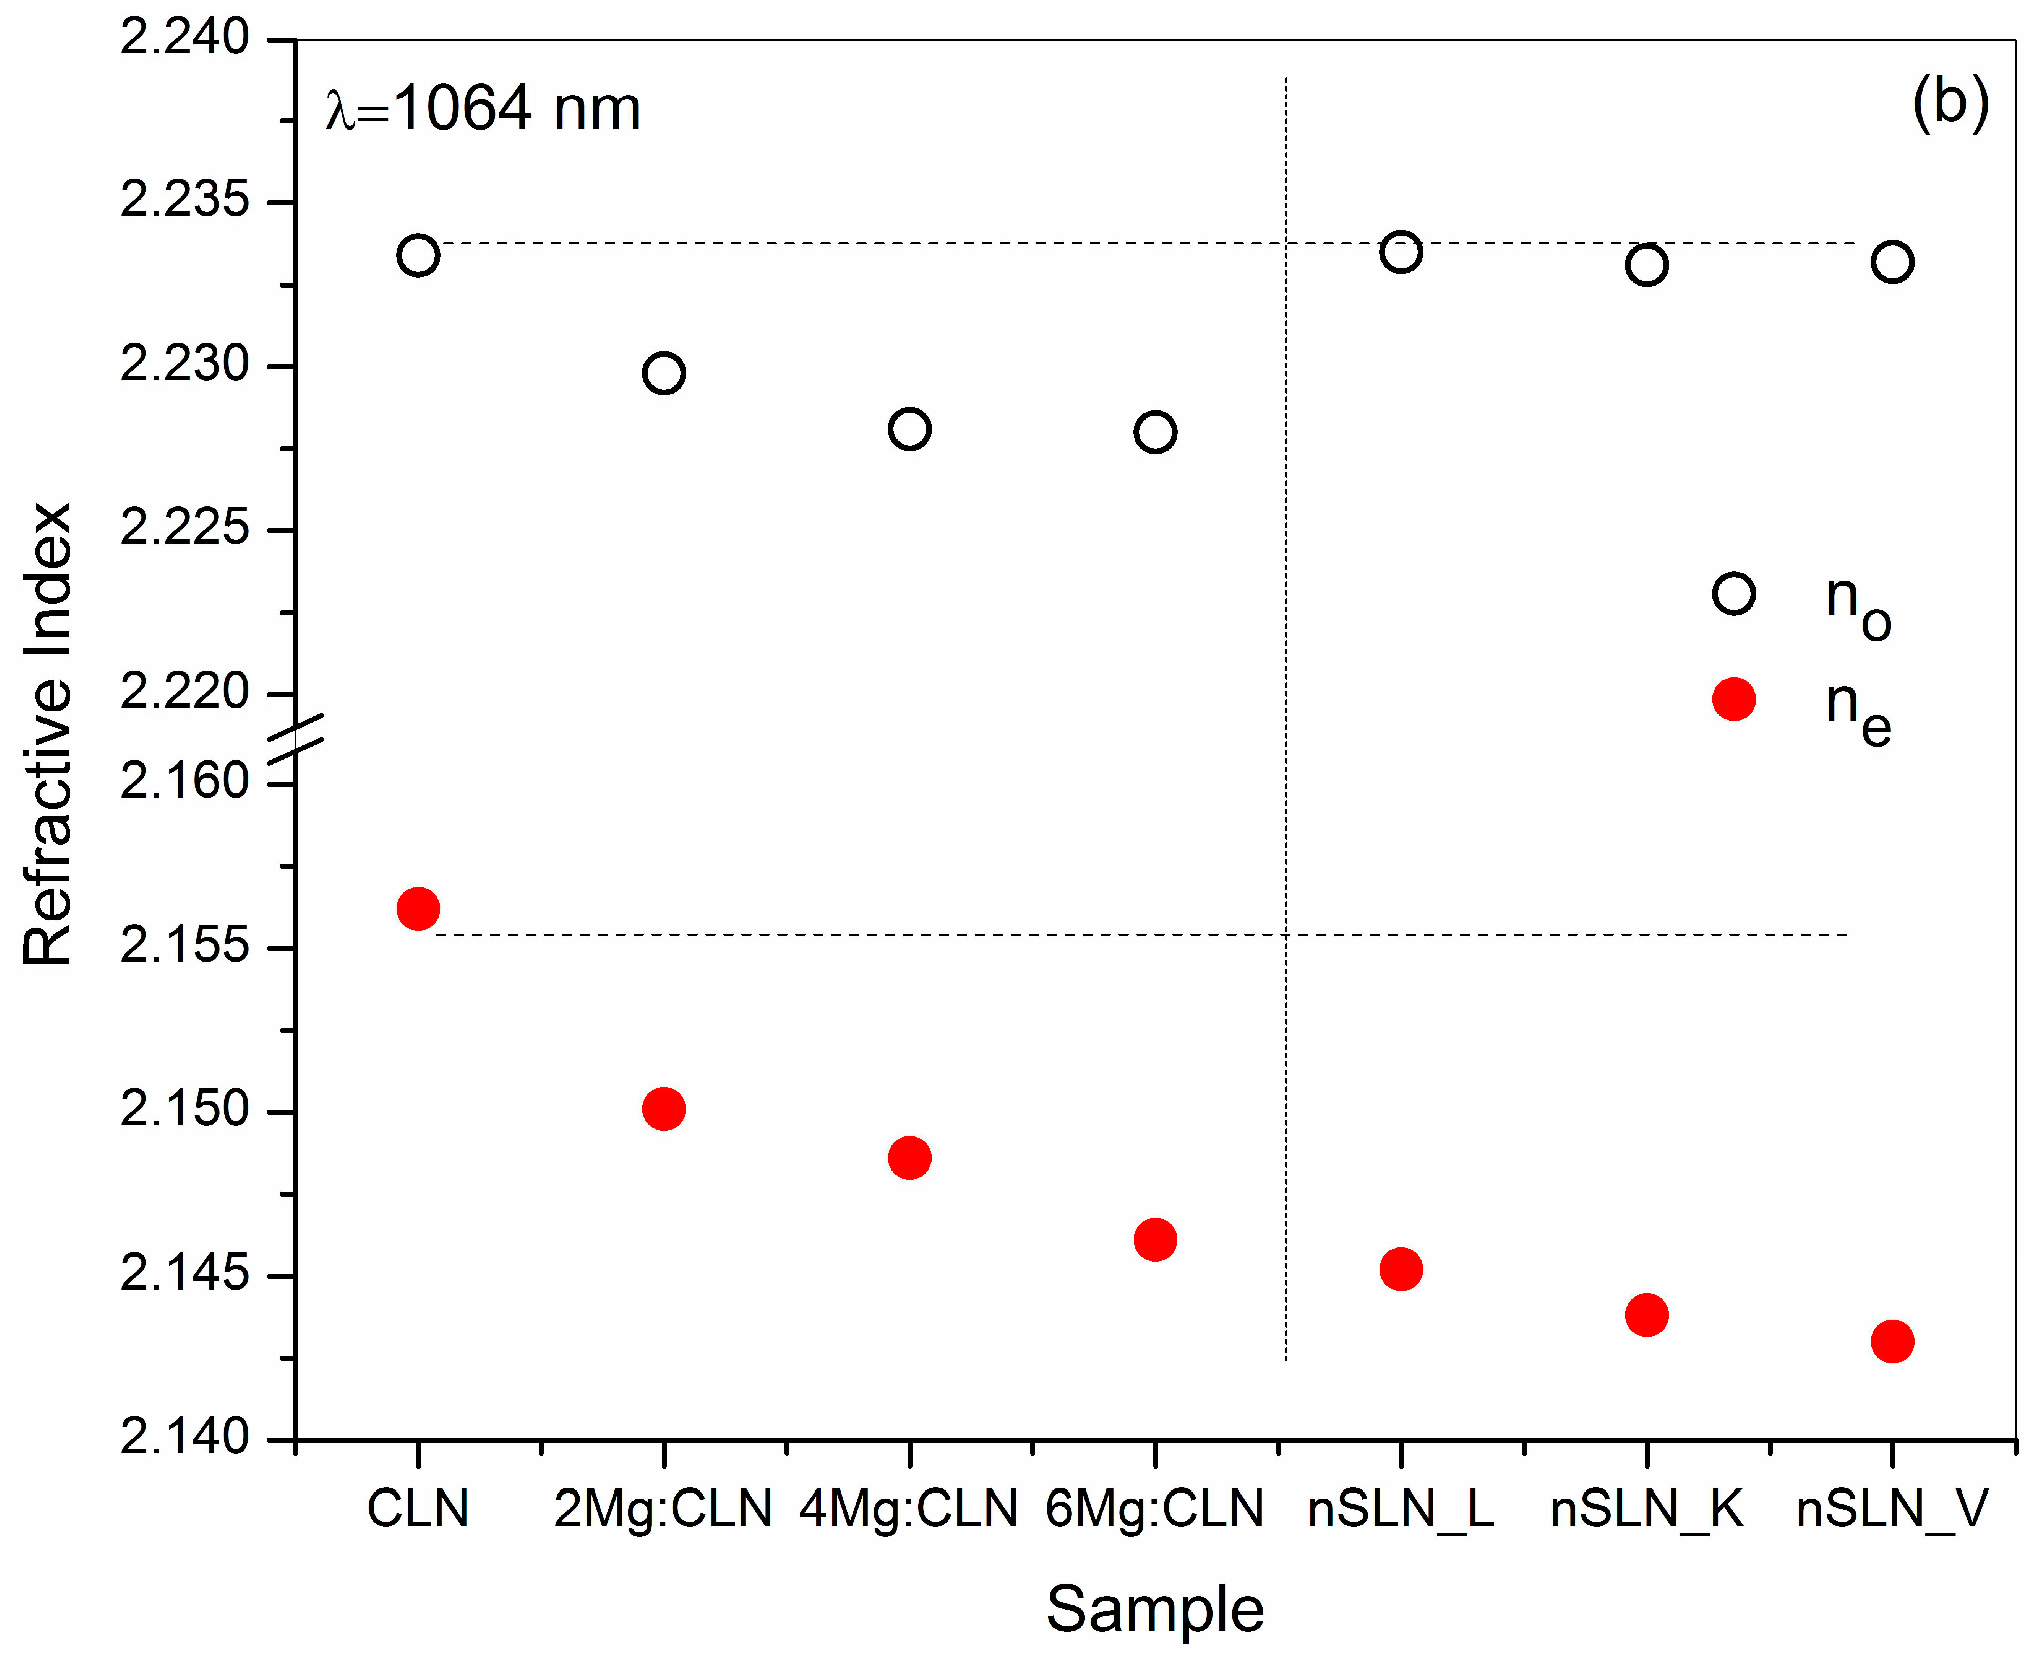
6. Effect of Defect Control Processes on the Refractive Index
7. Conclusions
Author Contributions
Conflicts of Interest
References
- Kosters, M.; Sturman, B.; Werheit, P.; Haertle, D.; Buse, K. Optical cleaning of congruent lithium niobate crystals. Nat. Photonics 2009, 3, 510–513. [Google Scholar] [CrossRef]
- Imlau, M.; Badorreck, H.; Merschjann, C. Optical nonlinearities of small polarons in lithium niobate. Appl. Phys. Rev. 2015, 2, 040606. [Google Scholar] [CrossRef]
- Guarino, A.; Poberaj, G.; Rezzonico, D.; Degl’Innocenti, R.; Gunter, P. Electro-optically tunable microring resonators in lithium niobate. Nat. Photonics 2007, 1, 407. [Google Scholar] [CrossRef]
- Soljacic, M.; Joannopoulos, J.D. Enhancement of nonlinear effects using photonic crystals. Nat. Mater. 2004, 3, 211. [Google Scholar] [CrossRef] [PubMed]
- Arizmendi, L. Photonic applications of lithium niobate crystals. Phys. Stat. Sol. A 2004, 201, 253. [Google Scholar] [CrossRef]
- Ruber, A. Chemistry and Physics of Lithium Niobate; Kaldis, E., Ed.; Current Topics in Materials Science; North-Holland Publ. Co.: Amsterdam, The Netherlands, 1978; vol. 1. [Google Scholar]
- Prokhorove, A.M.; Kuzminove, Y.S. Physics and Chemistry of Crystalline Lithium Niobate; Adam Hilger: Bristol, UK; New York, NY, USA, 1990. [Google Scholar]
- Wong, K.K. Properties of Lithium Niobate; IET: London, UK, 2002. [Google Scholar]
- Volk, T.; Wöhlecke, M. Lithium Niobate: Defects, Photorefraction and Ferroelectric Switching; Springer: Berlin, Germany, 2008; Volume 115. [Google Scholar]
- Topics in Applied Physics: Photorefractive Materials and Their Applications II; Gunter, P.; Huignard, J.P. (Eds.) Springer: Berlin, Germany, 1989; Volume 62.
- Armstrong, J.A.; Bloembergen, N.; Ducuing, J.; Pershan, P.S. Interactions between light waves in a nonlinear dielectric. Phys. Rev. 1962, 127, 1918. [Google Scholar] [CrossRef]
- Buse, K.; Adibi, A.; Psaltis, D. Nonvolatile holographic storage in doubly doped lithium niobate crystals. Nature 1998, 393, 665. [Google Scholar]
- Canalias, C.; Pasiskevicius, V. Mirror-less optical parametric oscillator. Nat. Photonics 2007, 1, 459. [Google Scholar] [CrossRef]
- Hesselink, L.; Orlov, S.S.; Liu, A.; Akella, A.; Lande, D.; Neurgaonkar, R.R. Photorefractive Materials for Nonvolatile Volume Holographic Data Storage. Science 1998, 282, 1089. [Google Scholar] [CrossRef] [PubMed]
- Meyn, J.-P.; Fejer, M.M. Tunable ultraviolet radiation by second-harmonic generation in periodically poled lithium tantalate. Opt. Lett. 1997, 22, 1214. [Google Scholar] [CrossRef] [PubMed]
- Lim, H.H.; Prakash, O.; Joo, K.B.; Pandiyan, K.; Cha, M.; Rhee, B.K. Ultra-broadband optical parametric generation and simultaneous RGB generation in periodically poled lithium niobate. Opt. Express 2007, 15, 18294. [Google Scholar] [CrossRef] [PubMed]
- Yu, E.N.; Choi, J.W.; Kang, H.; Ko, D.-K.; Fu, S.-H.; Liou, J.-W.; Kung, H.; Choi, H.J.; Kim, B.J.; Cha, M.; et al. Speckle noise reduction on a laser projection display via a broadband green light source. Opt. Express 2014, 22, 3547. [Google Scholar] [CrossRef] [PubMed]
- Heese, C.; Phillips, C.R.; Gallmann, L.; Fejer, M.M.; Keller, U. 75 MW few-cycle mid-infrared pulses from a collinear apodized APPLN-based OPCPA. Opt. Express 2012, 20, 18066. [Google Scholar] [CrossRef] [PubMed]
- Kitamura, K.; Furukawa, Y.; Ji, Y.; Zgonik, M.; Medrano, C.; Montemezzani, G.; Gunter, P. Photorefractive effect in LiNbO3 crystals enhanced by stoichiometry control. J. Appl. Phys. 1997, 82, 1006. [Google Scholar] [CrossRef]
- Xu, H.; Lee, D.; He, J.; Sinnott, S.B.; Gopalan, V.; Dierolf, V.; Phillpot, S.R. Stability of intrinsic defects and defect clusters in LiNbO3 from density functional theory calculations. Phys. Rev. B 2008, 78, 174103. [Google Scholar] [CrossRef]
- Schirmer, O.F.; Thiemann, O.; Wohlecke, M. Defects in LiNbO3—I. Experimental aspects. J. Phys. Chem. Solids 1991, 52, 185. [Google Scholar] [CrossRef]
- Gopalan, V.; Mitchell, T.E.; Furukawa, Y.; Kitamura, K. The role of nonstoichiometry in 180° domain switching of LiNbO3 crystals. Appl. Phys. Lett. 1998, 72, 1981. [Google Scholar] [CrossRef]
- Korkishko, Y.N.; Fedorov, V.A. Ion Exchange in Single Crystal for Integrated Optics and Optoelectronics; Cambridge International Science Publishing: Cambridge, UK, 1999. [Google Scholar]
- Fontana, M.; Chah, K.; Aillerie, M.; Mouras, R.; Bourson, P. Optical damage in undoped LiNbO3 crystals. Opt. Mater. 2001, 16, 111. [Google Scholar] [CrossRef]
- Ashkin, A.; Boyd, G.D.; Dziedzik, J.M.; Smith, R.G.; Ballman, A.A.; Nassau, K. Optically-induced refractive index inhomogeneities in LiNbO3 and LiTaO3. Appl. Phys. Lett. 1966, 9, 72. [Google Scholar] [CrossRef]
- Bryan, D.A.; Gerson, R.; Tomaschke, H.E. Increased optical damage resistance in lithium niobate. Appl. Phys. Lett. 1984, 44, 847. [Google Scholar] [CrossRef]
- Zhong, G.; Jin, J.; Wu, Z.K. Measurements of optically induced refractive-index damage of lithium niobate doped with different concentrations of MgO. J. Opt. Soc. Am. 1980, 70, 631. [Google Scholar]
- Choubey, R.K.; Sen, P.; Sen, P.K.; Bhatt, R.; Kar, S.; Shukla, V.; Bartwal, K.S. Optical properties of MgO doped LiNbO3 single crystals. Opt. Mater. 2006, 28, 467. [Google Scholar] [CrossRef]
- Bhaumik, I.; Ganesamoorthy, S.; Bhatt, R.; Karnal, A.K.; Wadhawan, V.K.; Gupta, P.K.; Kitamura, K.; Takekawa, S.; Nakamura, M. The ferroelectric phase transition in lithium tantalate single crystals: A composition dependence study. J. Appl. Phys. 2008, 103, 014108. [Google Scholar] [CrossRef]
- Kitamura, K.; Yamamoto, J.K.; Iyi, N.; Kimura, S.; Hayashi, T. Stoichiometric LiNbO3 single crystal growth by double crucible Czochralski method using automatic powder supply system. J. Cryst. Growth 1992, 116, 327. [Google Scholar] [CrossRef]
- Furukawa, Y.; Kitamura, K.; Takekawa, S.; Niwa, K.; Yajima, Y.; Iyi, N.; Mnushkina, I.; Guggenhein, P.; Martin, J. The correlation of MgO-doped near-stoichiometric LiNbO3 composition to the defect structure. J. Cryst. Growth 2000, 211, 230. [Google Scholar] [CrossRef]
- Bhatt, R.; Ganesamoorthy, S.; Bhaumik, I.; Sexana, A.; Karnal, A.K.; Gupta, P.K.; George, J.; Ranganathan, K. Photorefractive properties of Fe, Zn co-doped near stoichiometric LiNbO3 crystals at moderate intensities (0.5-6W/cm2). Opt. Laser Technol. 2013, 50, 112. [Google Scholar] [CrossRef]
- Bhatt, R.; Bhaumik, I.; Ganesamoorthy, S.; Karnal, A.K.; Gupta, P.K.; Swami, M.K.; Patel, H.S.; Sinha, A.K.; Upadhyay, A. Study of structural defects and crystalline perfection of near stoichiometric LiNbO3 crystals grown from flux and prepared by VTE technique. J. Mol. Struct. 2014, 1075, 377. [Google Scholar] [CrossRef]
- Bordui, P.F.; Norwood, R.G.; Jundt, D.H.; Fejer, M.M. Preparation and characterization of off-congruent lithium niobate crystals. J. Appl. Phys. 1992, 71, 875. [Google Scholar] [CrossRef]
- Holman, R.L.; Cressman, P.J.; Revelli, J.F. Chemical control of optical damage in lithium niobate. Appl. Phys. Lett. 1978, 32, 280. [Google Scholar] [CrossRef]
- Han, H.; Cai, L.; Xiang, B.; Jiang, Y.; Hui, H. Lithium-rich vapor transport equilibration in single-crystal lithium niobate thin film at low temperature. Opt. Mat. Express 2015, 5, 2634. [Google Scholar] [CrossRef]
- Hua, P.; Zhang, D.; Cui, Y.; Wang, Y.; Pun, E.Y.B. Off-congruent LiNbO3 crystals prepared by Li-poor vapor transport equilibration for integrated optics. Cryst. Growth Des. 2008, 8, 2125. [Google Scholar] [CrossRef]
- Lerner, P.; Legras, C.; Dumas, J.P. Stoechiometrie des monocristaux de metaniobate de lithium. J. Cryst. Growth 1968, 231, 3. [Google Scholar] [CrossRef]
- Kityk, I.V.; Janusik, M.M.; Fontana, M.D.; Alleric, M.; Abdi, F. Band structure treatment of the influence of nonstoichiometric defects on optical properties in LiNbO3. J. Appl. Phys. 2001, 90, 5542. [Google Scholar] [CrossRef]
- Kar, S.; Bhatt, R.; Shukla, V.; Choubey, R.K.; Sen, P.; Bartwal, K.S. Optical behaviour of VTE treated near stoichiometric LiNbO3 crystals. Solid State Commun. 2006, 137, 283. [Google Scholar] [CrossRef]
- Schirmer, O.F.; Imlau, M.; Merschjann, C.; Schoke, B. Electron small polarons and bipolarons in LiNbO3. J. Phys. Condens. Matter 2009, 21, 123201. [Google Scholar] [CrossRef] [PubMed]
- Peterson, G.E.; Carnevale, A. 93Nb NMR linewidths in nonstoichiometric lithium niobate. J. Chem. Phys. 1972, 56, 4848. [Google Scholar] [CrossRef]
- Fay, H.; Alford, W.J.; Dess, H.M. Dependence of second-harmonic phase-matching temperature in LiNbO3 crystals on melt composition. Appl. Phys. Lett. 1968, 12, 89. [Google Scholar] [CrossRef]
- Jermann, F.; Otten, J. Light-induced charge transport in LiNbO3:Fe at high light intensities. J. Opt. Soc. Am. B 1993, 10, 2085. [Google Scholar] [CrossRef]
- Furukawa, Y.; Kitamura, K.; Alexandrovski, A.; Route, R.K.; Fejer, M.M.; Foulon, G. Green-induced infrared absorption in MgO doped LiNbO3. Appl. Phys. Lett. 2001, 78, 1970. [Google Scholar] [CrossRef]
- Busacca, A.C.; Sones, C.L.; Apostolopoulos, V.; Eason, R.W.; Mailis, S. Surface domain engineering in congruent lithium niobate single crystals: A route to submicron periodic poling. Appl. Phys. Lett. 2002, 81, 4946. [Google Scholar] [CrossRef]
- Malovichko, G.; Grachev, V.; Schirmer, O. Interrelation of intrinsic and extrinsic defects–congruent, stoichiometric, and regularly ordered lithium niobate. Appl. Phys. B 1999, 68, 785. [Google Scholar] [CrossRef]
- Polgar, K.; Peter, A.; Foldvari, I. Crystal growth and stoichiometry of LiNbO3 prepared by the flux method. Opt. Mater. 2002, 19, 7. [Google Scholar] [CrossRef]
- Grisard, A.; Lallier, E.; Polgar, K.; Peter, A. Low electric field periodic poling of thick stoichiometric lithium niobate. Electron. Lett. 2000, 36, 1043. [Google Scholar] [CrossRef]
- Kong, Y.; Liu, S.; Xu, J. Recent Advances in the Photorefraction of Doped Lithium Niobate Crystals. Materials 2012, 5, 1954. [Google Scholar] [CrossRef]
- Xue, D.; Kitamura, K. An estimation of nonlinear optical properties of lithium niobate family ferroelectrics by the chemical bond model. Jpn. J. Appl. Phys. 2003, 42, 6230. [Google Scholar] [CrossRef]
- Weis, R.S.; Gaylord, T.K. Lithium niobate: Summary of physical properties and crystal structure. Appl. Phys. A 1985, 37, 191. [Google Scholar] [CrossRef]
- Gopalan, V.; Sanford, N.A.; Aust, J.A.; Kitamura, K.; Furukawa, Y. Ferroelectrics and Dielectrics. In Handbook of Advanced Electronic and Photonic Materials and Devices; Nalwa, H.S., Ed.; Academic Press: San Diego, CA, USA, 2001; vol. 4. [Google Scholar]
- Laurell, F. Periodically poled materials for miniature light sources. Opt. Mater. 1999, 11, 235. [Google Scholar] [CrossRef]
- Bhaumik, I.; Ganesamoorthy, S.; Bhatt, R.; Karnal, A.K.; Wadhawan, V.K.; Gupta, P.K.; Kumaragurubaran, S.; Kitamura, K.; Takekawa, S.; Nakamura, M. Dielectric and ac conductivity studies on undoped and MgO-doped near-stoichiometric lithium tantalate crystals. J. Appl. Phys. 2008, 103, 74106. [Google Scholar] [CrossRef]
- Broderick, N.G.R.; Ross, G.W.; Offerhaus, H.L.; Richardson, D.J.; Hanna, D.C. Hexagonally Poled Lithium Niobate: A Two-Dimensional Nonlinear Photonic Crystal. Phys. Rev. Lett. 2000, 84, 4345. [Google Scholar] [CrossRef] [PubMed]
- Matthias, B.T.; Remeika, J.P. Ferroelectricity in the ilmenite structure. Phys. Rev. 1949, 76, 1886. [Google Scholar] [CrossRef]
- Barns, R.L.; Carruthers, J.R. Lithium tantalate single crystal stoichiometry. J. Appl. Cryst. 1970, 3, 395. [Google Scholar] [CrossRef]
- Ballman, A.A.; Levinstein, H.J.; Capio, C.D.; Brown, H. Optical waveguiding layers in LiNbO3 and LiTaO3. J. Am. Ceram. Soc. 1967, 50, 657. [Google Scholar] [CrossRef]
- O’Bryan, H.M.; Gallagher, P.K.; Brandle, C.D. Congruent composition and li-rich phase boundary of LiNbO3. J. Am. Ceram. Soc. 1985, 68, 493. [Google Scholar] [CrossRef]
- Iyi, N.; Kitamura, K.; Yajima, Y.; Kimura, S.; Furukawa, Y.; Sato, M. Defect structure model of MgO-doped LiNbO3. J. Solid State Chem. 1995, 118, 148. [Google Scholar] [CrossRef]
- Sweeney, K.C.; Hulliburton, L.E.; Bryan, D.A.; Rice, R.R.; Gerson, R.; Tomaschbe, H.E. Point defects in Mg-doped lithium niobate. J. Appl. Phys. 1985, 57, 1036. [Google Scholar] [CrossRef]
- Chen, S.S.; Liu, H.D.; Kong, Y.F.; Huang, Z.H.; Xu, J.J.; Zhang, G.Y. The resistance against optical damage of near-stoichiometric LiNbO3:Mg crystals prepared by vapor transport equilibration. Opt. Mater. 2007, 29, 885. [Google Scholar] [CrossRef]
- Grabmaier, B.C.; Otto, F. Growth and investigation of MgO-doped LiNbO3. J. Cryst. Growth 1986, 79, 682. [Google Scholar] [CrossRef]
- Sen, P.; Sen, P.K.; Bhatt, R.; Kar, S.; Shukla, V.; Bartwal, K.S. The effect of MgO doping on optical properties of LiNbO3 single crystals. Solid State Commun. 2004, 129, 747. [Google Scholar] [CrossRef]
- Bhatt, R.; Kar, S.; Shukala, V.; Sen, P.; Sen, P.K.; Bartwal, K.S.; Wadhawan, V.K. Studies on nonlinear optical properties of ferroelectric MgO-LiNbO3 single crystals. Ferroelectrics 2005, 323, 165. [Google Scholar] [CrossRef]
- Volk, T.R.; Pryalkin, V.I.; Rubinina, N.M. Optical-damage-resistant LiNbO3:Zn crystal. Opt. Lett. 1990, 15, 996. [Google Scholar] [CrossRef] [PubMed]
- Kokanyan, E.P.; Razzari, L.; Cristiani, I.; Degiorgio, V.; Gruber, J.B. Reduced photorefraction in hafnium-doped single-domain and periodically poled lithium niobate crystals. Appl. Phys. Lett. 2004, 84, 1880. [Google Scholar] [CrossRef]
- Razzari, L.; Minzioni, P.; Cristiani, I.; Degiorgio, V.; Kokanyan, E.P. Photorefractivity of Hafnium-doped congruent lithium–niobate crystals. Appl. Phys. Lett. 2005, 86, 131914. [Google Scholar] [CrossRef]
- Riscob, B.; Bhaumik, I.; Ganesamoorthy, S.; Bhatt, R.; Vijayan, N.; Karnal, A.K.; Wahab, M.A.; Bhagavannarayana, G. Effect of Mg doping on the growth aspects, crystalline perfection, and optical and thermal properties of congruent LiNbO3 single crystals. J. Appl. Cryst. 2013, 46, 1854. [Google Scholar] [CrossRef]
- Bhaumik, I.; Ganesamoorthy, S.; Bhatt, R.; Sundar, R.; Karnal, A.K.; Wadhawan, V.K. Novel seeding technique for growing KTiOPO4 single crystals by the TSSG method. J. Cryst. Growth 2002, 243, 522. [Google Scholar] [CrossRef]
- Santos, M.T.; Rojo, J.C.; Cintas, A.; Arizmendi, L.; Dieguez, E. Changes in the solid-liquid interface during the growth of Bi12SiO20, Bi12GeO20 and LiNbO3 crystals grown by the Czochralski method. J. Cryst. Growth 1995, 156, 413. [Google Scholar] [CrossRef]
- Xu, H.; Lee, D.; Sinnott, S.B.; Gopalan, V.; Dierolf, V.; Phillpot, S.R. Structure and energetics of Er defects in LiNbO3 from first-principles and thermodynamic calculations. Phys. Rev. B 2009, 80, 144104. [Google Scholar] [CrossRef]
- Bhatt, R.; Ganesamoorthy, S.; Bhaumik, I.; Karnal, A.K.; Gupta, P.K. Optical bandgap and electrical conductivity studies on near stoichiometric LiNbO3 crystals prepared by VTE process. J. Phys. Chem. Solids 2012, 73, 257. [Google Scholar] [CrossRef]
- Yoo, K.C.; Henningsen, T.; Dawson, K.D.G.; Singh, N.B.; Hopkins, R.H. Effects of subgrain structures on the optical homogeneity of Tl3AsSe3 single crystals. J. Appl. Phys. 1988, 64, 827. [Google Scholar] [CrossRef]
- Riscob, B.; Bhatt, R.; Vijayan, N.; Bhaumik, I.; Ganesamoorthy, S.; Wahab, M.A.; Rashmi; Bhagavannarayana, G. Structural, optical and thermal properties of Zr–Fe co-doped congruent LiNbO3 single crystals. J. Appl. Cryst. 2013, 46, 601. [Google Scholar] [CrossRef]
- Bhatt, R.; Ganesamoorthy, S.; Bhaumik, I.; Karnal, A.K.; Bhagavannarayana, G.; Gupta, P.K. Effect of annealing in Li-rich ambient on the optical absorption and crystallinity of Er doped LiNbO3 crystals. J. Optoelectron. Adv. Mater. 2011, 13, 245. [Google Scholar]
- Lal, K.; Bhagavannarayana, G. A high-resolution diffuse X-ray scattering study of defects in dislocation-free silicon crystals grown by the float-zone method and comparison with Czochralski-grown crystals. J. Appl. Cryst. 1989, 22, 209. [Google Scholar] [CrossRef]
- Kushwaha, S.K.; Vijayan, N.; Maurya, K.K.; Kumar, A.; Kumar, B.; Somayajulu, K.; Bhagavannarayana, G. Enhancement in crystalline perfection and optical properties of benzophenone single crystals: The remarkable effect of a liquid crystal. J. Appl. Cryst. 2011, 44, 839. [Google Scholar] [CrossRef]
- Hurle, D.T.J. Handbook of Crystal Growth: Bulk Crystal Growth A: Basic Techniques; North-Holland Elsevier Science Publishers: Amsterdam, The Netherlands, 1994; Vol. 2. [Google Scholar]
- Tauc, J.C. Optical Properties of Solids; North-Holland: Amsterdam, The Netherlands, 1972. [Google Scholar]
- Castillo-Torres, J. Optical absorption edge analysis for zinc-doped lithium niobate. Opt. Commun. 2013, 290, 107. [Google Scholar] [CrossRef]
- Kovacs, L.; Ruschhaupt, G.; Polgar, K.; Corradi, G.; Wohlecke, M. Composition dependence of the ultraviolet absorption edge in lithium niobate. Appl. Phys. Lett. 1997, 70, 2801. [Google Scholar] [CrossRef]
- Peter, A.; Polgar, K.; Ferriol, M.; Poppl, L.; Foldvari, I.; Cochez, M.; Szalle, Z.S. Ternary system Li2O–K2O–Nb2O5: Part II: Growth of stoichiometric lithium niobate. J. Alloy. Compd. 2005, 386, 246. [Google Scholar] [CrossRef]
- Wang, H.L.; Hang, Y.; Xu, J.; Zhang, L.H.; Zhu, S.N.; Zhu, Y.Y. Near-stoichiometric LiNbO3 crystal grown using the Czochralski method from Li-rich melt. Mater. Lett. 2004, 58, 3119. [Google Scholar] [CrossRef]
- Polgar, K.; Peter, A.; Kovacs, L.; Corradi, G.; Szaller, Z. Growth of stoichiometric LiNbO3 single crystals by top seeded solution growth method. J. Cryst. Growth 1997, 177, 211. [Google Scholar] [CrossRef]
- Serrano, M.D.; Bermudez, V.; Arizmendi, L.; Dieguez, E. Determination of the Li/Nb ratio in LiNbO3 crystals grown by Czochralski method with K2O added to the melt. J. Cryst. Growth 2000, 210, 670. [Google Scholar] [CrossRef]
- Chen, C.-Y.; Chen, J.-C.; Chia, C.T. Growth and optical properties of different compositions of LiNbO3 single crystal fibers. Opt. Mater. 2007, 30, 393. [Google Scholar] [CrossRef]
- Chen, Y.; Zhang, W.; Shu, Y.; Lou, C.; Kong, Y.; Huang, Z. Determination of the Li/Nb ratio in LiNbO3 crystals prepared by vapor transport equilibration method. Opt. Mater. 2003, 23, 295. [Google Scholar] [CrossRef]
- Abrahams, S.C.; Marsh, P. Defect structure dependence on composition in lithium niobate. Acta Cryst. B 1986, 42, 61. [Google Scholar] [CrossRef]
- Chen, Y.L.; Xu, J.J.; Kong, Y.F.; Chen, S.L.; Zhang, G.Y.; Wen, J.P. Effect of Li diffusion on the domain inversion of LiNbO3 prepared by vapor transport equilibration. Appl. Phys. Lett. 2002, 81, 700. [Google Scholar] [CrossRef]
- Schmidt, W.G.; Albrecht, M.; Wippermann, S.; Blankenburg, S.; Rauls, E. LiNbO3 ground and excited state properties from first-principles calculations. Phys. Rev. B 2008, 77, 035106. [Google Scholar] [CrossRef]
- Bhatt, R.; Bhaumik, I.; Ganesamoorthy, S.; Karnal, A.K.; Swami, M.K.; Patel, H.S.; Gupta, P.K. Urbach tail and bandgap analysis in near stoichiometric LiNbO3 crystals. Phys. Status Solidi A 2012, 209, 176. [Google Scholar] [CrossRef]
- Zhang, Y.; Guilbert, L.; Bourson, P.; Polgar, K.; Fontana, M.D. Characterization of short-range heterogeneities in sub-congruent lithium niobate by micro-Raman spectroscopy. J. Phys. Condens. Matter 2006, 18, 957. [Google Scholar] [CrossRef]
- Thierfelder, C.; Sanna, S.; Schindlmayr, A.; Schmidt, W.G. Do we know the band gap of lithium niobate? Phys. Status Solidi C 2010, 7, 362. [Google Scholar] [CrossRef]
- Dhar, A.; Mansingh, A. On the correlation between optical and electrical properties in reduced lithium niobate crystals. J. Phys. D Appl. Phys. 1991, 24, 1644. [Google Scholar] [CrossRef]
- Akhmadullin, I.S.; Golenishchev-Kutuzov, V.A.; Migachev, S.A. Electronic structure of deep centers in LiNbO3. Phys. Solid State 1998, 40, 1012. [Google Scholar] [CrossRef]
- Urbach, F. The long-wavelength edge of photographic sensitivity and of the electronic absorption of solids. Phys. Rev. 1953, 92, 1324. [Google Scholar] [CrossRef]
- Redfield, D.; Burke, W.J. Optical absorption edge of LiNbO3. J. Appl. Phys. 1974, 45, 4566. [Google Scholar] [CrossRef]
- John, S.; Soukoulis, C.; Cohen, M.H.; Economou, E.N. Theory of electron band tails and the Urbach optical absorption edge. Phys. Rev. Lett. 1986, 57, 1777. [Google Scholar] [CrossRef] [PubMed]
- Bhaumik, I.; Bhatt, R.; Ganesamoorthy, S.; Saxena, A.; Karnal, A.K.; Gupta, P.K.; Sinha, A.K.; Deb, S.K. Temperature-dependent index of refraction of monoclinic β-Ga2O3 single crystal. Appl. Opt. 2011, 50, 6006. [Google Scholar] [CrossRef] [PubMed]
- Wempal, S.; Didomenico, D. Oxygen-octahedra ferroelectrics-I. Theory of electro-optical and nonlinear optical effects. J. Appl. Phys. 1969, 40, 735. [Google Scholar] [CrossRef]
- Philips, J.C. Ionicity of the chemical bond in crystals. Rev. Mod. Phys. 1970, 42, 317. [Google Scholar] [CrossRef]
- Levine, B.F. d-electron effects on bond susceptibilities and ionicities. Phys. Rev. B 1973, 7, 2591. [Google Scholar] [CrossRef]


| Parameter | CLN | nSLN |
|---|---|---|
| Li2O:Nb2O5 | 48.6:51.4 | 49.9:50.1 |
| Non-linear optical coefficient (pm/V) @ λ = 633 nm | d13 = 6.1 | d13 = 6.3 |
| d33 = 34.1 | d33 = 44.0 (33% Higher) | |
| Linear electo-optic coefficient (pm/V) @ λ = 1064 nm | r31 = 10.0 | r31 = 10.4 |
| r33 = 31.5 | r33 = 38.3 (22% Higher) | |
| Coercive field (kV/mm) @ room temperature | ~21 | <4 (80% Lower) |
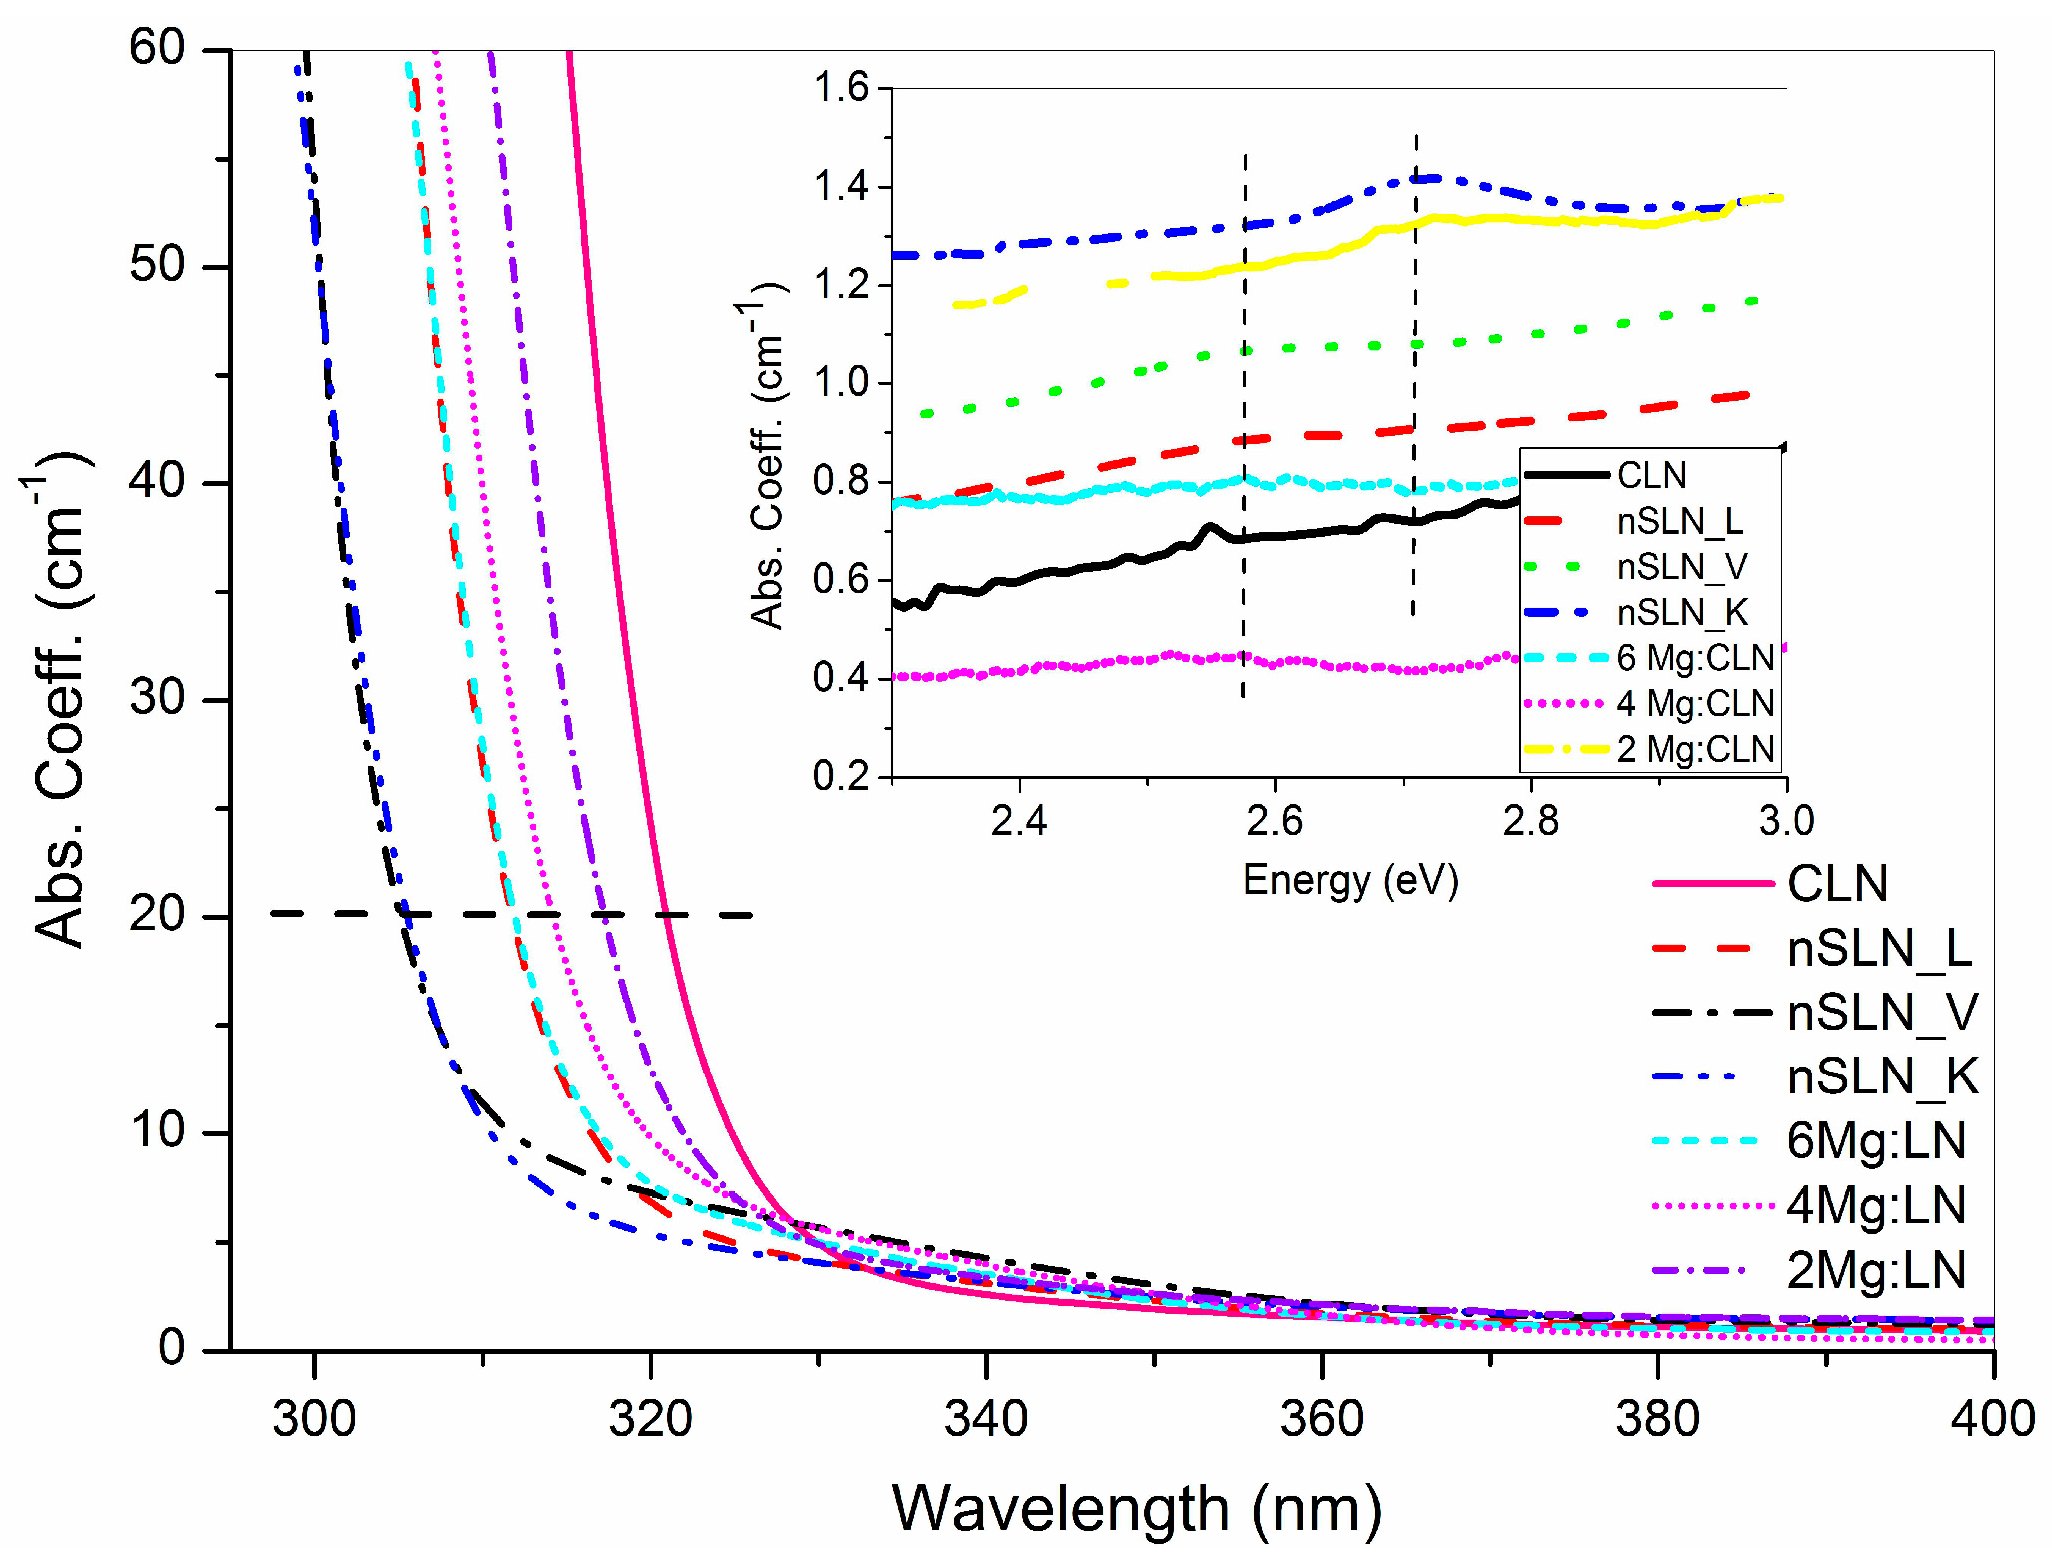
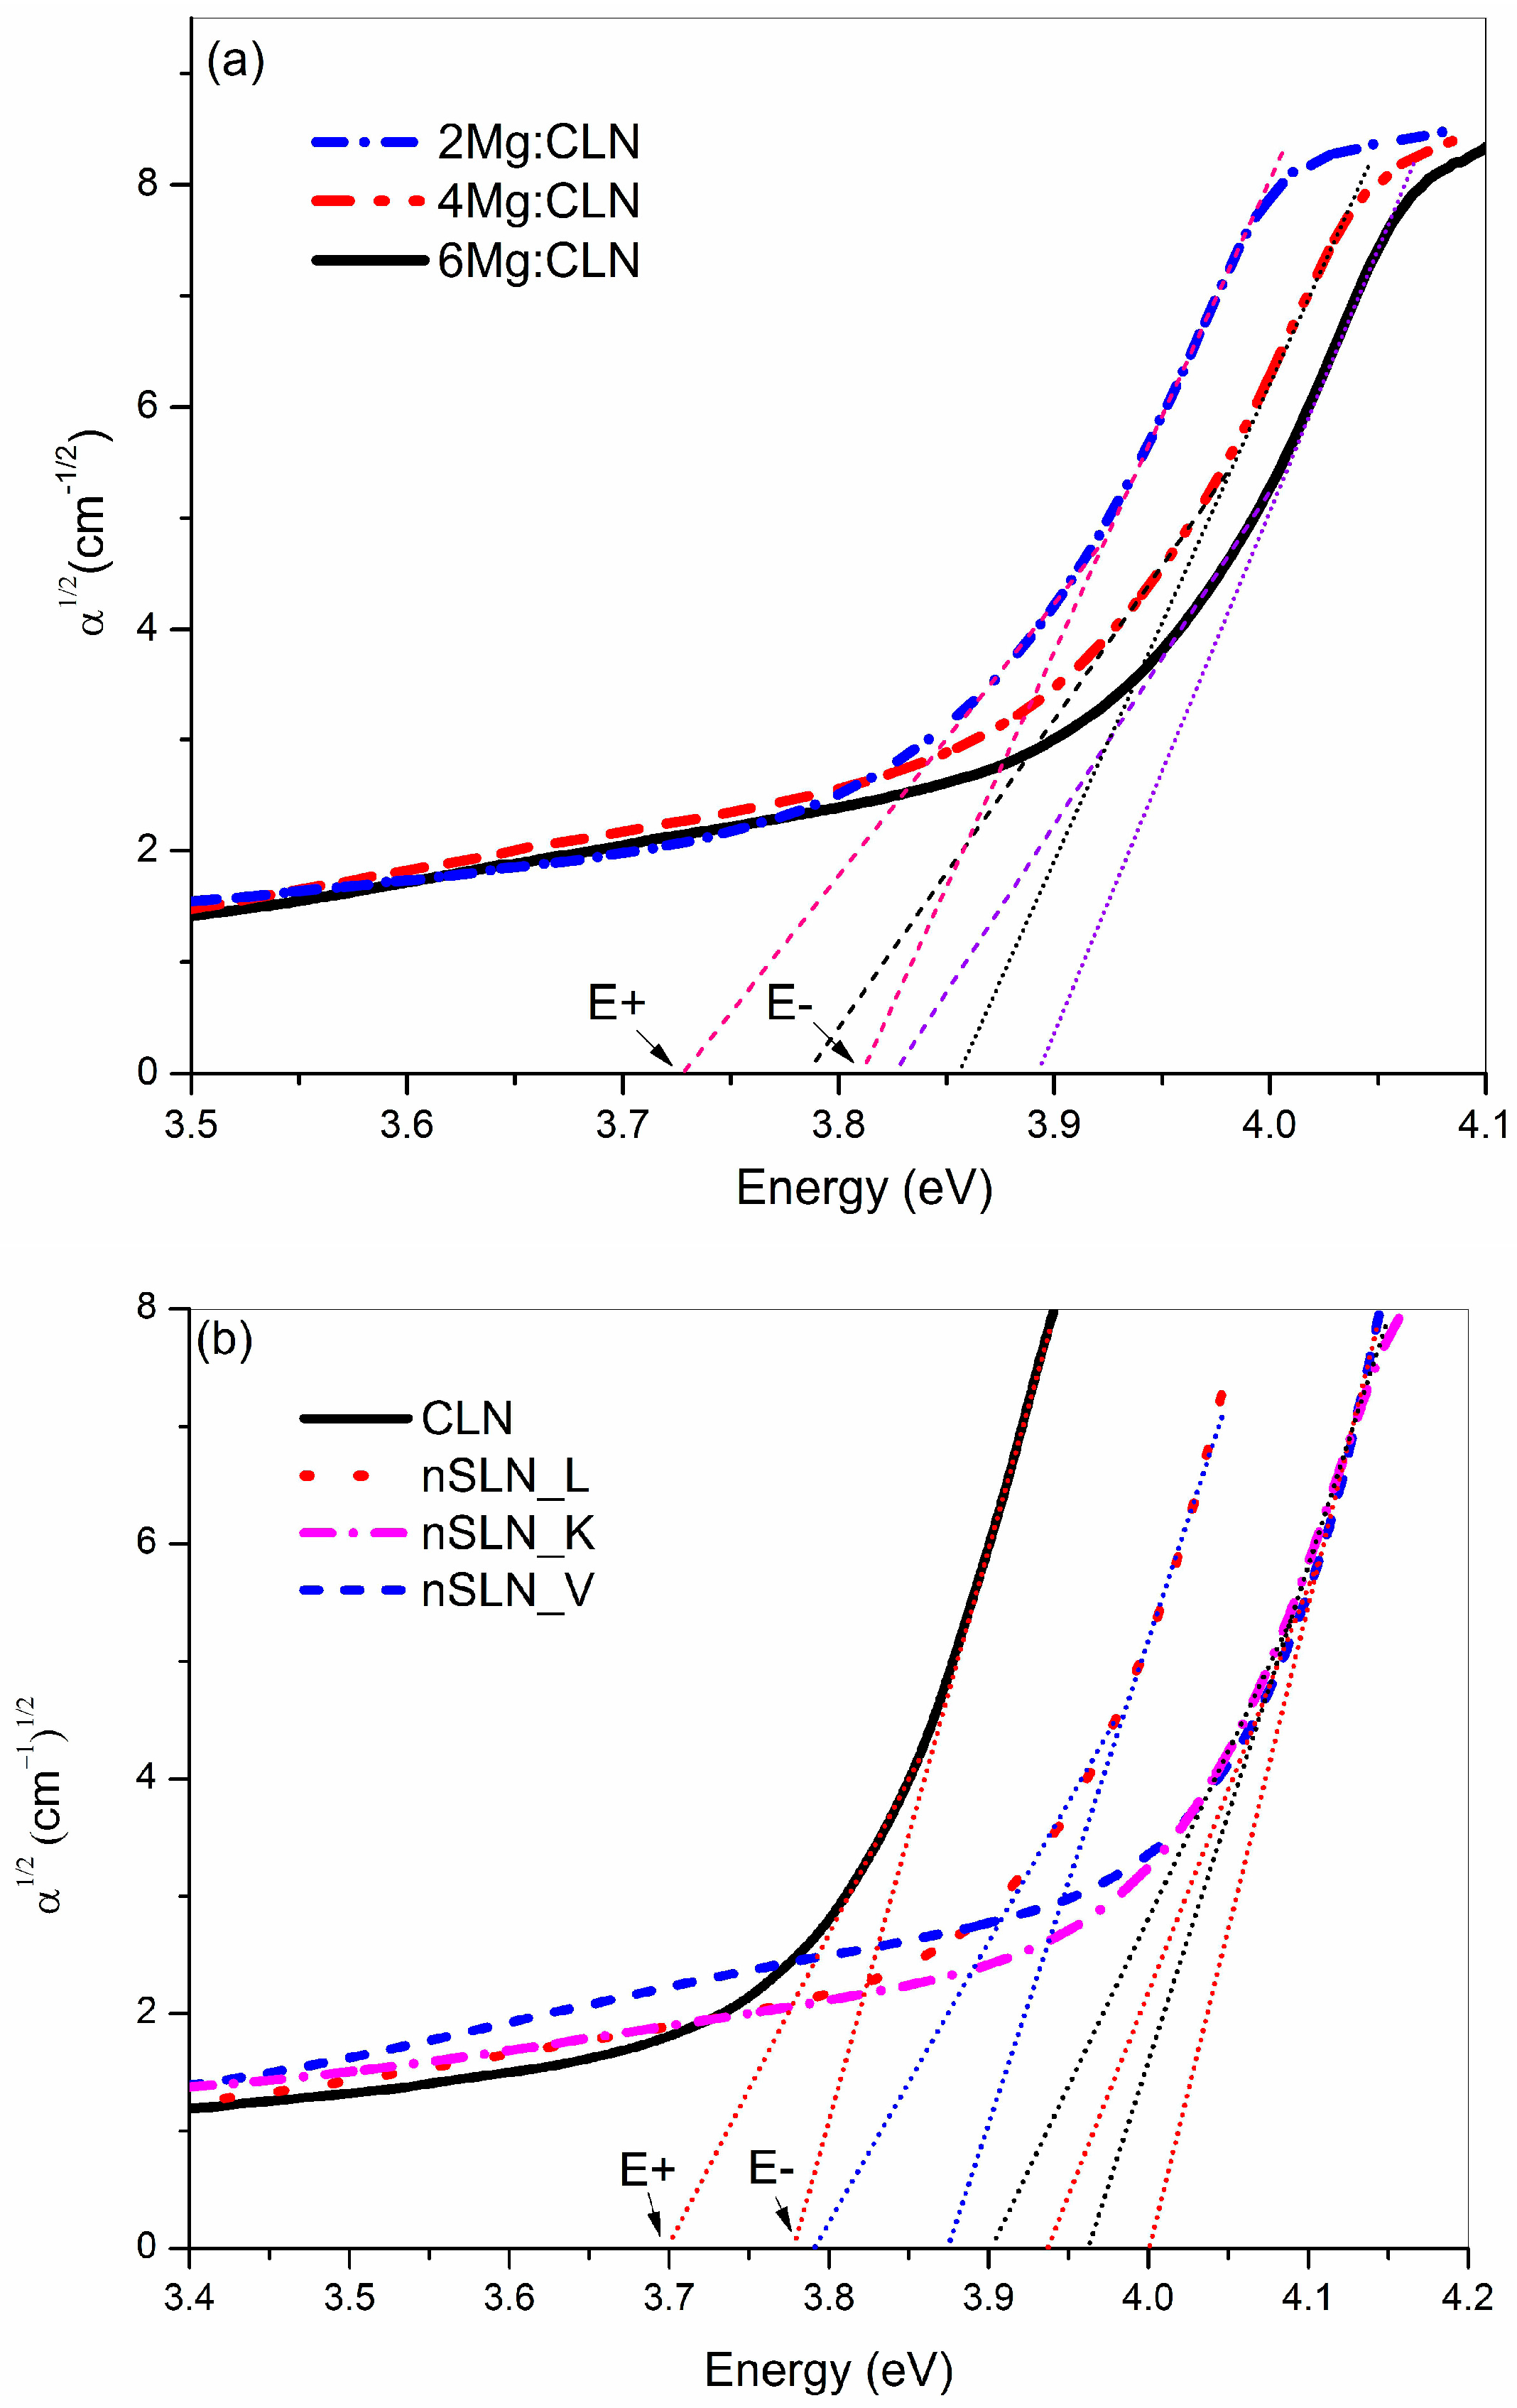
| Sample | FWHM of DC (arc-sec) | AE (nm) | Li/Nb (by Equation (4)) | Egind (eV) | Ep (meV) | Egd (eV) | EU (meV) |
|---|---|---|---|---|---|---|---|
| CLN | 29 | 320.6 | 0.936 | 3.74 | 40.5 | 3.89 | 64.9 |
| 2Mg:CLN | 76 | 317.1 | * | 3.77 | 39.2 | 3.93 | 80.1 |
| 4Mg:CLN | 112 | 314.2 | * | 3.82 | 35.1 | 3.97 | 82.2 |
| 6Mg:CLN | 65 | 311.6 | * | 3.86 | 34.2 | 3.99 | 74.4 |
| nSLN_L | 108 | 310.2 | 0.985 | 3.83 | 42.5 | 4.00 | 74.0 |
| nSLN_K | multi-peak | 305.5 | 0.996 | 3.93 | 32.1 | 4.09 | 74.1 |
| nSLN_V | 65 | 304.6 | 0.998 | 3.97 | 33.3 | 4.11 | 73.6 |
© 2017 by the authors. Licensee MDPI, Basel, Switzerland. This article is an open access article distributed under the terms and conditions of the Creative Commons Attribution (CC BY) license ( http://creativecommons.org/licenses/by/4.0/).
Share and Cite
Bhatt, R.; Bhaumik, I.; Ganesamoorthy, S.; Bright, R.; Soharab, M.; Karnal, A.K.; Gupta, P.K. Control of Intrinsic Defects in Lithium Niobate Single Crystal for Optoelectronic Applications. Crystals 2017, 7, 23. https://doi.org/10.3390/cryst7020023
Bhatt R, Bhaumik I, Ganesamoorthy S, Bright R, Soharab M, Karnal AK, Gupta PK. Control of Intrinsic Defects in Lithium Niobate Single Crystal for Optoelectronic Applications. Crystals. 2017; 7(2):23. https://doi.org/10.3390/cryst7020023
Chicago/Turabian StyleBhatt, Rajeev, Indranil Bhaumik, Sarveswaran Ganesamoorthy, Riscob Bright, Mohammad Soharab, Ashwani Kumar Karnal, and Pradeep Kumar Gupta. 2017. "Control of Intrinsic Defects in Lithium Niobate Single Crystal for Optoelectronic Applications" Crystals 7, no. 2: 23. https://doi.org/10.3390/cryst7020023