Article

Agglomeration Control during Ultrasonic Crystallization of an Active Pharmaceutical Ingredient

1
KU Leuven, Department of Chemical Engineering, Celestijnenlaan 200 F Box 2424, 3001 Leuven, Belgium
2
KU Leuven, Faculty of Engineering Technology, Agoralaan Building B Box 8, 3590 Diepenbeek, Belgium
*
Author to whom correspondence should be addressed.
Crystals 2017, 7(2), 40; https://doi.org/10.3390/cryst7020040
Submission received: 16 January 2017 / Revised: 1 February 2017 / Accepted: 2 February 2017 / Published: 8 February 2017
(This article belongs to the Special Issue Advances in Ultrasound Stimulated Crystallization)

Abstract

:
Application of ultrasound during crystallization can efficiently inhibit agglomeration. However, the mechanism is unclear and sonication is usually enabled throughout the entire process, which increases the energy demand. Additionally, improper operation results in significant crystal damage. Therefore, the present work addresses these issues by identifying the stage in which sonication impacts agglomeration without eroding the crystals. This study was performed using a commercially available API that showed a high tendency to agglomerate during seeded crystallization. The crystallization progress was monitored using process analytical tools (PAT), including focus beam reflectance measurements (FBRM) to track to crystal size and number and Fourier transform infrared spectroscopy (FTIR) to quantify the supersaturation level. These tools provided insight in the mechanism by which ultrasound inhibits agglomeration. A combination of improved micromixing, fast crystal formation which accelerates depletion of the supersaturation and a higher collision frequency prevent crystal cementation to occur. The use of ultrasound as a post-treatment can break some of the agglomerates, but resulted in fractured crystals. Alternatively, sonication during the initial seeding stage could assist in generating nuclei and prevent agglomeration, provided that ultrasound was enabled until complete desupersaturation at the seeding temperature. FTIR and FBRM can be used to determine this end point.

1. Introduction

Crystallization is one of the most important processes during the manufacturing of active pharmaceutical ingredients (APIs). Precise process control allows tuning the final physical properties of the crystals such as purity, size distribution and polymorphic form. On the one hand, these properties should be controlled to facilitate processing during filtration, drying and formulation. On the other hand, these characteristics also provide the opportunity to control the drug release profile after intake into the human body. As a result, industrial processes exploit numerous particle engineering techniques in combination with crystallization to produce crystals that meet both the bioavailability and processing requirements [1,2,3,4,5,6].
Particle formation during crystallization in agitated vessels is governed by two primary processes: crystal nucleation and growth. Furthermore, secondary mechanisms such as breakage, Ostwald ripening and agglomeration can have a substantial influence on the obtained crystal polymorph, shape and particle size distribution (PSD) [7,8]. Agglomeration should be clearly distinguished from aggregation since these phenomena describe two distinct types of particle assemblage. Aggregation denotes the association of individual (primary) particles into larger structures which can easily disintegrate since the particles are not cemented together. These are stabilized by attractive or adhesion forces including Van der Waals interactions that depend on the microscopic structure of the solvent and the solute, the orientation of the crystals faces and the presence of impurities. On the contrary, agglomerates require brute force to break the solid bridges binding the individual particles. The origin of the agglomerative bonds is unclear although it is believed that liquid bridges are involved in the process. The actual structure is, however, very complex and might even involve solvent inclusions during the cementation [9,10]. In terms of flowability, filterability and compaction properties, agglomerated particles can exhibit a clear benefit over single crystals, depending on the final morphology. In contrast, significant disadvantages such as reduced purity due to entrapment of mother liquor or other impurities, elevated generation of fines during transport and lower dissolution rate have been reported [11].
The mechanism of agglomeration involves three consecutive steps. Firstly, individual crystals collide due to fluid motion in agitated systems, followed by stabilization of these adhered or aggregated particles due to attractive forces. Finally, molecular growth forms solid bridges which transform the aggregates into agglomerates [7,8,10,12,13,14]. However, if the crystal–crystal adhesion is insufficient, the aggregates will disintegrate before agglomeration can occur. As a result, agglomeration during crystallization strongly depends on the collision frequency. In order for particles to combine, contact by means of a collision is necessary. Nonetheless, aggregated particles that have not yet been cemented together can be released by the impact of other colliding particles. The kinetics of agglomeration can be described by means of an agglomeration rate constant or kernel β (m3·s−1) that depends on the particle size and the mechanism for agglomeration [7,10,15]. In general, Equation (1) can be used to determine the agglomeration rate ragg (m−3·s−1), although several adoptions were proposed in literature to incorporate the kernels dependency on crystal size and processing conditions [16]. Despite these modifications, several authors emphasize that a size-independent kernel usually describes the experimental data best [16,17,18].
r a g g = η β N 2
where η (-) denotes the efficiency of the collisions between the particles, and N (m−3) represents the number concentration of particles.
To control or prevent agglomeration, numerous factors were identified that influence this phenomenon. The most dominant parameters are the degree of supersaturation, particle concentration, particle size and agitation rate. An increase in supersaturation level results in a higher agglomeration rate as evidenced by the strong presence of agglomerates in anti-solvent crystallization processes that operate under high supersaturation. In these conditions, particles have an increased tendency to stick together, inhibiting the disruption into separate elements [19]. The effect of the particle concentration exhibits a maximum. At low concentrations, the collision frequency is too low for efficient aggregation, while a high collision rate breaks up any pre-agglomerated structures at high particle concentration. The particle size determines the mechanism for agglomeration, which is either perikinetic or orthokinetic. The former one applies to small particles that collide due to Brownian or laminar fluctuations in a static solution. In a stirred crystallizer orthokinetic or shear induced agglomeration clearly dominates. This type of agglomeration requires a velocity gradient to be present before efficient particle collisions can occur. David et al. considered that particles above the Kolmogorov microscale (~20–40 µm) collide by the orthokinetic mechanism, while smaller particles collide due to the laminar microshear stresses [7,20]. In general, smaller particles exhibit a higher degree of agglomeration, with a clear abundance in the range of 1 µm to several tens of microns. Finally, a combination of computational modeling and experimental results indicated that agglomeration shows a maximum as a function of the agitation rate. Initially, increased agitation and shear promotes interparticle collisions that may lead to agglomeration. However, at some point the stress induced by the collisions overcomes the force of the crystal–crystal interactions and separates the aggregated or partially agglomerated particles [15,16,21].
A possible technique to inhibit agglomeration is the use of ultrasound during crystallization [13,22,23,24,25]. The benefits of this technology for crystallization were demonstrated before and include reduced metastable zone width, narrow particle size distribution and homogeneous crystal morphology [5,26,27,28]. Although the exact mechanism of these phenomena is not yet understood, the proposed hypotheses attribute this to acoustic cavitation, involving the formation and implosion of micron-sized bubbles, and its accompanying mechanical effects [29,30]. Additional work on the effect of ultrasound during crystallization indicated that agglomeration can be suppressed, yielding individual crystals with a smooth surface [31]. Guo et al. investigated this aspect in more detail by high speed imaging and evidenced that both mechanical effects from imploding cavitation bubbles and an enhanced collision rate contribute to the breakage of agglomerated particles [25]. Although numerous reports demonstrate the beneficial effect of sonication on the final crystal morphology, industrial applications are scarce. Most likely, this is due to the additional energy consumption, crystal breakage and surface erosion caused by continuous or improper operation of the sonication probe throughout the crystallization process in most cases [32,33,34]. However, it is not clear whether such a long treatment time is required for the production of non-agglomerated particles since the moment of initiation and the length of sonication have not yet been optimized. Prolonged operation of the ultrasonic source can also result in erosion of the probe which can subsequently contaminate the crystal suspension. In addition, most research only targets the behavior of inorganic compounds or small organic substances [5,28,35,36,37]. Although some active pharmaceutical ingredients were studied, more investigation is needed to evaluate the feasibility of sonication in pharmaceutical processes [5,27,38]. Therefore, this study aims to evaluate the potential of ultrasound for agglomeration control during the recrystallization of a commercially available API produced by Johnson & Johnson. The selected substance is sensitive to formation of agglomerated, star-shaped crystals during conventional seeding crystallization with dry seed material. Therefore, the present work evaluates whether the application of a short ultrasonic post-treatment or sonication as a seeding agent is able to reduce agglomeration for this compound. These results are compared to a process that successfully inhibited agglomeration by use of continuous sonication throughout the entire crystallization protocol. In the end, this study provides more insight into the mechanism by which ultrasound prevents the formation of agglomerated crystals. Furthermore, it shows how a targeted application of ultrasound in the correct stage of the crystallization process can aid in the production of desired crystal morphology, ruling out excessive energy demands during the entire process.

2. Materials and Methods

2.1. Experimental Setup

A Mettler Toledo Easymax 102 workstation was used for accurate and programmable temperature control throughout the entire experiment. This equipment was fitted with a 100 mL glass reactor and sealed with a Teflon lid mounted with a water cooled condenser. In both silent and sonicated experiments, macromixing was provided by a half-moon blade stirrer operating at 250 rpm. In the latter tests, ultrasound was supplied by a 30 kHz Hielscher UP50H sonotrode which operated at 10 W and was introduced from the top. In addition, the setup could be equipped with process analytical technology (PAT) such as a focus beam reflectance measurement probe (FBRM, S400A, Mettler Toledo, Columbus, OH, USA) or a Fourier Transform Infrared probe (FTIR, ReactIR 15, Mettler Toledo, Columbus, OH, USA) to gather real time data on the chord length distribution and solute concentration, respectively. Figure 1 shows a schematic view of the experimental setup in which the Teflon cover and condenser were not shown to simplify the picture.

2.2. Experimental Procedure

In this study, the effect of ultrasound on agglomeration during the crystallization process of a commercially available active pharmaceutical ingredient was investigated. The selected API is crystallized from ethanol denatured with methyl ethyl keton (MEK). Figure 2 displays the solubility curve for this solute-solvent system, which is obtained experimentally by determination of the clear point during slow heating (<0.1 °C·min−1) after addition of a fixed amount of API. The temperature at which complete dissolution occurred was assessed by a combination of visual detection and FBRM measurements. This data can be reasonably fitted with an exponential expression, given in Equation (2).
C = 0.0521 exp ( 0.0838 T )
where C represents the concentration of the solute in g/100 g solvent and T is the absolute temperature in °C.
At the start of the experiment, 25 g of the active pharmaceutical ingredient was dissolved in 75 g ethanol denatured with MEK, in order to prepare a solution with a concentration of 33 g API/100 g solvent. Based on the exponential fit of the solubility data, this solution has a solubility temperature of about 77 °C. Hence, to completely dissolve the substance, the solution was maintained at reflux temperature (~78 °C) for 45 min under continuous stirring. Next, the solution was cooled at a linear cooling rate of 0.5 °C·min−1 until the desired seeding temperature was obtained. The latter was evaluated at 57 °C, 62 °C and 70 °C, which corresponds to a supersaturation ratio (C0/Csat) of 5.28, 3.47 and 1.77, respectively. Seeding was either performed by addition of dry material or by activation of the ultrasonic field at 10 W at one of these seeding temperatures. In the experiments performed at a supersaturation ratio of 3.47 and 5.28, the seeding temperature was maintained for 80 min, after which the solution was subjected to a cooling trajectory. This includes cooling to 50 °C at 0.1 °C·min−1, followed by a temperature reduction until 15 °C at 0.3 °C·min−1. When the seeding temperature of 70 °C was evaluated, the initial waiting time of 80 min was also employed, but the solution was first cooled to 62 °C at 0.1 °C·min−1. This intermediate temperature was maintained for 80 min, after which the previously described cooling trajectory was started. This adjustment in the protocol was necessary to prevent build-up of the supersaturation during cooling which could result in secondary nucleation, increasing the possibility to produce agglomerated crystals. Hence, the additional waiting time at 62 °C provided isothermal desupersaturation, and allowed operating as close to the solubility curve as possible during the cooling profile after the initial desupersaturation at the seeding temperature.
During the experimental runs, data was obtained from the FBRM and IR probes, submerged in the crystallization vessel. Subsequently, these measurements were processed by the IControl software of Mettler Toledo. The chord length distributions were averaged over a 30 s time interval and displayed by a normalized square weighted distribution. The concentration of the solute was quantified by tracing a characteristic peak area at a wavelength of 1122 cm−1 in the IR-spectra. In the studied concentration range, this measurement provided a linear correlation with an R2 of at least 0.99. Similar as the FBRM measurements, the IR-data were averaged over 30 s in which 256 spectra were collected. The IR-plots shown in this paper, display the relative supersaturation level which can be calculated from the API concentration measurements using Equation (3).
Relative supersaturation level = C C s a t C 0 C s a t
where C (g API/100 g solvent) represents the actual concentration, and C0 and Csat are the initial concentration (33 g API/100 g solvent) and solubility level, respectively.
The slurry was stirred overnight at the isolation temperature of 15 °C, followed by separation of the crystals by vacuum filtration. Next, the crystals were dried in a fume hood by exposure to the air. Finally, the dried samples are classified as mono- or star-shaped crystals, displayed in Figure 3. The latter refer to strongly agglomerated structures, consisting of multiple intergrown crystals. On the contrary, individual crystals or very small agglomerates consisting of a maximum of three crystals cemented together are considered as mono-crystals. The analysis is performed using a combination of optical and scanning microscopy, and therefore provides qualitative assessment. Alternatively, some authors suggested the use of shape parameters such as the aspect ratio and perimeter to quantify the degree of agglomeration [7]. However, application of this approach using image processing by a Malvern G3 provided inconsistent classification for this particular API and this procedure was therefore discarded for sample allocation. Prior to SEM imaging with a Phenom Pro, the samples were coated with gold for 2 min using a constant current of 30 mA. Optical images of the dry crystals were made as a Z-stack with a Nikon Eclipse microscope without any preparation step.

3. Results and Discussion

3.1. Evaluation of the Conventional Crystallization Process

In the conventional crystallization process, seeding by the addition of 0.2 m% dry API at 62 °C initiated the nucleation process. After an aging time of 80 min, the aforementioned temperature profile with two gradients was started in order to cool the solution down to 15 °C. This conventional process yields strongly agglomerated crystals, shown in Figure 4a.
These crystals have a predominantly star-shaped form in which the faces are growing outwards from one center. This effect can be observed even more clearly in the early stage of the crystallization. Figure 4b,c shows a SEM capture of crystals which were obtained by hot filtration immediately after visual detection of nucleation. The elementary particles have a rod-like shape, implying that the fastest growth direction is oriented along the length axis of these rods. In general, fast growing faces exhibit the smallest area in the total surface of the crystal and develop stronger attractive forces compared to slow-growing faces [8,19,39]. As a result, the fast-growing faces will contact each other via liquid bridges and orient around one central core that cements the crystals together. This foundation is largely maintained through further growth and agglomeration processes, resulting in the star morphology. In addition, some of the agglomerates shown in Figure 4a have multiple smaller fragments grown into the surface of a larger crystal. Most likely, this phenomenon is caused by interparticle collisions and aggregation between crystals of different sizes that are subsequently cemented together into an agglomerative bond. This process is strongly dependent on the collision frequency between the crystals and can therefore result in a strong variety in the shape of the agglomerates [12,15,17,18,40,41]. In turn, this inconsistency in the final morphology might cause strong fluctuations in post-processing operations such as filtration and tableting, altering the drugs’ bioavailability. Therefore, the effect of seed mass and stirring rate, two parameters that have an impact on the formation of agglomerates, were studied in more detail [7,8].

3.1.1. Effect of Seed Mass

The effect of seed mass was evaluated at a constant stirring rate of 250 rpm and seeding temperature of 62 °C. Figure 5a,b shows the obtained crystals after seeding with 1 m% and 5 m%, respectively. In both tests, the presence of agglomerates is strongly reduced compared to the reference case with 0.2 m% seeds (Figure 4). This effect can be attributed to an increased collision frequency at higher seed loading, which splits the aggregates into single crystals before the cementation into agglomerates takes place [10]. In addition, the SEM images indicate that smaller crystals are produced when a higher seed load is used. Hence, as the growth is distributed across a larger number of particles, the size of each individual element is reduced. Overall, it is clear that a seed loading of 1 m% and more yields non-agglomerated mono-crystals.

3.1.2. Effect of Stirring Rate

Firstly, the crystallization was evaluated in the absence of stirring to minimize the interaction between the particles. This experiment was performed in a 25 mL test tube, placed inside a temperature-controlled jacket of the Easymax setup. During the dissolution stage, the solution was stirred with a magnetic stirrer to provide a homogeneous temperature distribution. However, during the cooling phase, stirring was disabled to avoid any grinding of sedimented crystals by the stirrer bar. To initiate nucleation, the tube was seeded with 3 m% milled crystals. Figure 6a shows the crystals that were obtained by this procedure. Although some small particles are still grouped into a single cluster, the majority of the sample consists of individual mono-crystals.
Secondly, an experiment with the addition of 3 m% milled seeds was evaluated under agitated conditions (250 rpm) in a 100 mL vessel by means of comparison. This seed material will contain many fines and damaged crystals with a rough surface. Crystals produced from these milled seeds, shown in Figure 6b, again exhibit a clear star-shaped morphology due to the strong degree of agglomeration. This observation clearly differs from previous experiments in which addition of >1 m% seeds resulted in a non-agglomerated crystal morphology, as illustrated in Figure 5. On the one hand, this can be attributed to an increased tendency of milled particles to aggregate and agglomerate, both before dosing in dry conditions and after seeding in the solution [8,19,42]. Under influence of supersaturation, agglomerative bonds will be formed which irreversibly lock the seed material into a clustered structure. On the other hand, the milled particles might have multiple fractured edges or faces that can act as nucleation and growth sites, resulting in dendritic crystal growth which yields an agglomerated structure. Additional breakage of these dendrites introduces more small particles in the solution that further promote agglomeration.
Finally, the conventional process in which 0.2 m% non-micronized seed material is added, was evaluated at 500 rpm. These results are displayed in Figure 6c. In comparison to the conventional procedure operating at 250 rpm (Figure 4), it is clear that a higher stirring rate yields less agglomerated crystals.
The previous results indicate that agglomeration as a function of stirring rate exhibits a maximum in its profile. Hence, agglomeration can be prevented by the absence of agitation, or by application of a high stirring rate [21]. A similar dependency was also established by computational modeling of orthokinetic aggregation in precipitation processes [16]. This model from Mumtaz assumes that agglomeration is initiated by collisions between particles, as already proposed by Smoluchowski’s theory, but introduces an efficiency factor that accounts for collisions that do not result in agglomeration. On the one hand, this model predicts a linear dependency of the agitation rate and the collision frequency. Since a higher stirring speed increases the velocity of the crystals in solution, the probability for a particle-particle collision is enhanced. On the other hand, the efficiency of the collisions to produce aggregates or agglomerates reduces with increasing shear rate. This can be attributed to both stronger hydrodynamic forces that break up aggregated clusters and a reduced time frame to transform aggregates into agglomerates. In the end, these opposing effects cause an intermediate stirring rate to exhibit a higher degree of agglomeration compared to very low or high agitation.

3.1.3. Prompt Generation of Nuclei

Overall, the previous results show that agglomeration can be minimized by adequate tuning of the stirring rate and/or seed loading. This corresponds to a crystallization process with a very high collision frequency in which aggregation is effectively reverted before agglomeration can occur. An alternative approach to increase the number of collisions without addition of high seed loads is prompt generation of crystals [17,43,44]. Hence, quasi-instantaneous generation of a large number of crystals will increase the collision frequency, rapidly deplete the supersaturation and therefore reduce agglomeration. To quickly produce crystals without addition of seeds, spontaneous nucleation at high supersaturation can be used. This method facilitates nuclei generation and rapidly increases the suspension density. However, it should be taken into account that this procedure will also reduce the average particle size, which could make the process more sensitive to agglomeration. Despite this possible disadvantage, spontaneous crystallization at 57 °C, corresponding to an initial supersaturation ratio of 5.28, was performed to evaluate whether prompt generation of crystals could inhibit agglomeration. As shown in Figure 7a, this sample predominantly consists of mono-crystals, confirming the applicability of this procedure. Further analysis of the FBRM and IR data, displayed in Figure 7b, allows gaining further insight into the consecutive steps of the crystallization process. Both the total FBRM counts which are correlated to the number of crystals and the IR signal, representing the solute concentration or supersaturation level, proceed through three different stages after nucleation [45]. Initially, these PAT tools only detect a small change, attributed to slow nucleation and desupersaturation kinetics. Afterwards, the profile of the total FBRM counts shows a steep incline, accompanied by a fast decrease in solute concentration. During this stage, the process is governed by nuclei generation under influence of a high supersaturation level. In the final phase, the solute concentration approaches the solubility level and the process evolves into a growth-dominated regime. During this transition, the slope of the FBRM and IR trends decrease as only small changes in the amount of crystals and concentration are detected [19].
Although it is demonstrated that agglomeration can be minimized by an adequate tuning of the stirring rate, this parameter strongly depends on the stirrer configuration and reactor design [46]. Hence, reoptimization is required if the process is performed in a different setup. Similarly, it was evidenced that the occurrence of star-shaped crystals depends on the size and pretreatment of the seed crystals. Any inconsistency in the drying procedure can introduce crystal defects or size reductions which influence the final crystal morphology. This problem is further complicated if the seeds are obtained after a milling operation, as this process affects the final seed properties in a complex and rather unpredictable way. Additionally, seeding by addition of dry material cannot be implemented if a sterile process is desired. Therefore, this study further evaluates the use of ultrasound as an alternative technology since literature has indicated that it can act both as a seeding source and agglomeration inhibitor [4,36,47].

3.2. Implementation of Ultrasound in the Crystallization Process

Different ultrasound-assisted crystallization processes were evaluated based on their ability to reduce crystal agglomeration. Firstly, it was studied whether sonication could be implemented as a post-treatment to destroy agglomerates. Next, it was assessed whether the use of continuous and pulsed sonication during the entire crystallization protocol could inhibit the formation of star-shaped crystals. In the end, ultrasound was implemented as a seeding agent in order to test it as an alternative to conventional seeding, while the production of mono-crystals was guaranteed by other means than ultrasound.

3.2.1. Ultrasound as Post-Treatment

The crystals obtained by the conventional crystallization process were strongly agglomerated as demonstrated previously in Figure 4a. Therefore, an ultrasonic treatment of 60 min with 15 W continuous ultrasound was introduced after cooling to 15 °C. Figure 8 shows the crystal morphology that is obtained by implementation of the additional sonication stage. This procedure removes most of the small particles that are attached and grown into the surface of large crystals, but does not break the agglomerates of equally sized particles.
Earlier work by Zeiger and Suslick studied the effect of sonication on crystal slurries in order to identify the mechanism of crystal fragmentation by ultrasound [48,49]. They concluded that the interaction between particles and cavitation shockwaves is the primary cause for this phenomenon, while other potential sources such as interparticle, particle-horn and particle-wall collisions only marginally contribute in the fragmentation process. However, some authors also believe that microjets directed towards the crystal surface can contribute to the disruption of weakly assembled particles and to their surface erosion. This jet formation is caused by an asymmetric bubble collapse and can reach a speed of over 100 m·s−1 [50]. Wagterveld et al. were even able to visualize these events by the use of high speed imaging during sonication of calcite crystals [51]. In the end, the ultrasonic post-treatment yielded large particles that exhibit rough crystal surfaces and edges, besides a significant amount of fines. This change in morphology can strongly influence the dissolution kinetics of the API in an irreproducible way. Although it is possible to remove these fines by additional temperature cycling methods, the ultrasonic post-treatment did not completely remove the agglomerates. Therefore, this procedure was considered unsuccessful in the production of mono-crystals.

3.2.2. Ultrasonic Treatment during the Entire Cooling Profile

In these set of experiments, ultrasound was enabled during the entire cooling profile. To reduce energy consumption and heat generation, sonication was operated in pulsed mode (10 W, 20%) [52]. Firstly, pulsed ultrasound was initiated immediately after the conventional seeding step with 0.2 m% dry material and was disabled when the solution reached 15 °C, yielding predominantly mono-crystals as shown in Figure 9a. This result indicates that pulsed ultrasound can prevent the formation of agglomerates without any further adjustments in the conventional crystallization process. However, it should be taken into account that an additional energy requirement is needed for the ultrasonic actuator during the entire cooling trajectory. In addition, the cooling power will increase as heat is introduced into the solution [53].
Secondly, pulsed sonication was enabled as soon as the solution reached the seeding temperature (62 °C) to initiate the nucleation without addition of dry seed material. Similarly, ultrasound was provided during the entire cooling trajectory until the isolation temperature. The final crystals shown in Figure 9b do not exhibit agglomeration and can therefore be classified as similarly shaped mono-crystals. This result demonstrates that sonication can be implemented as an alternative seeding technique since no seed material is needed to induce nucleation. Further application of ultrasonic energy prevents aggregation and agglomeration as observed previously in the ultrasound-assisted tests with addition of seed material.
The exact mechanism by which ultrasound inhibits agglomeration for this particular API remains unclear, although it is likely that three effects contribute in this process as schematically summarized in Figure 10. Firstly, application of ultrasound will improve mixing on a molecular scale induced by shear forces of imploding cavitation bubbles and acoustic streaming [54,55,56]. During cooling crystallization, this will enhance the mass transfer, resulting in homogeneous particle growth and accelerated desupersaturation. In addition, sonication will rapidly increase the amount of crystals in the solution. On the one hand, individual crystals arise due to fragmentation and disaggregation of larger crystals or aggregates [57,58,59]. On the other hand, cavitation bubbles can also act as direct nucleation sites to enhance the nuclei number [30,60]. Although this will result in smaller particles that are more prone to aggregation, the high particle loading will also effectively disrupt aggregates due to the increased number of collisions. In addition, the massive increase in surface area will deplete the supersaturation within a shorter time frame, similar as the effect of micromixing. This inhibits the cementation of these aggregates and moves the process quickly into a growth-dominated regime [17,43,44]. In this stage, new crystalline material will be deposited on the surfaces of the priory formed crystals. This deposition preferentially takes place on damaged edges and surfaces, masking possible erosion effects caused by sonofragmentation [5,19,61]. Finally, ultrasound also increases the collision frequency by a direct interaction between shockwaves or liquid jets and the aggregates which will disrupt the latter before an agglomerative bond is formed [25].

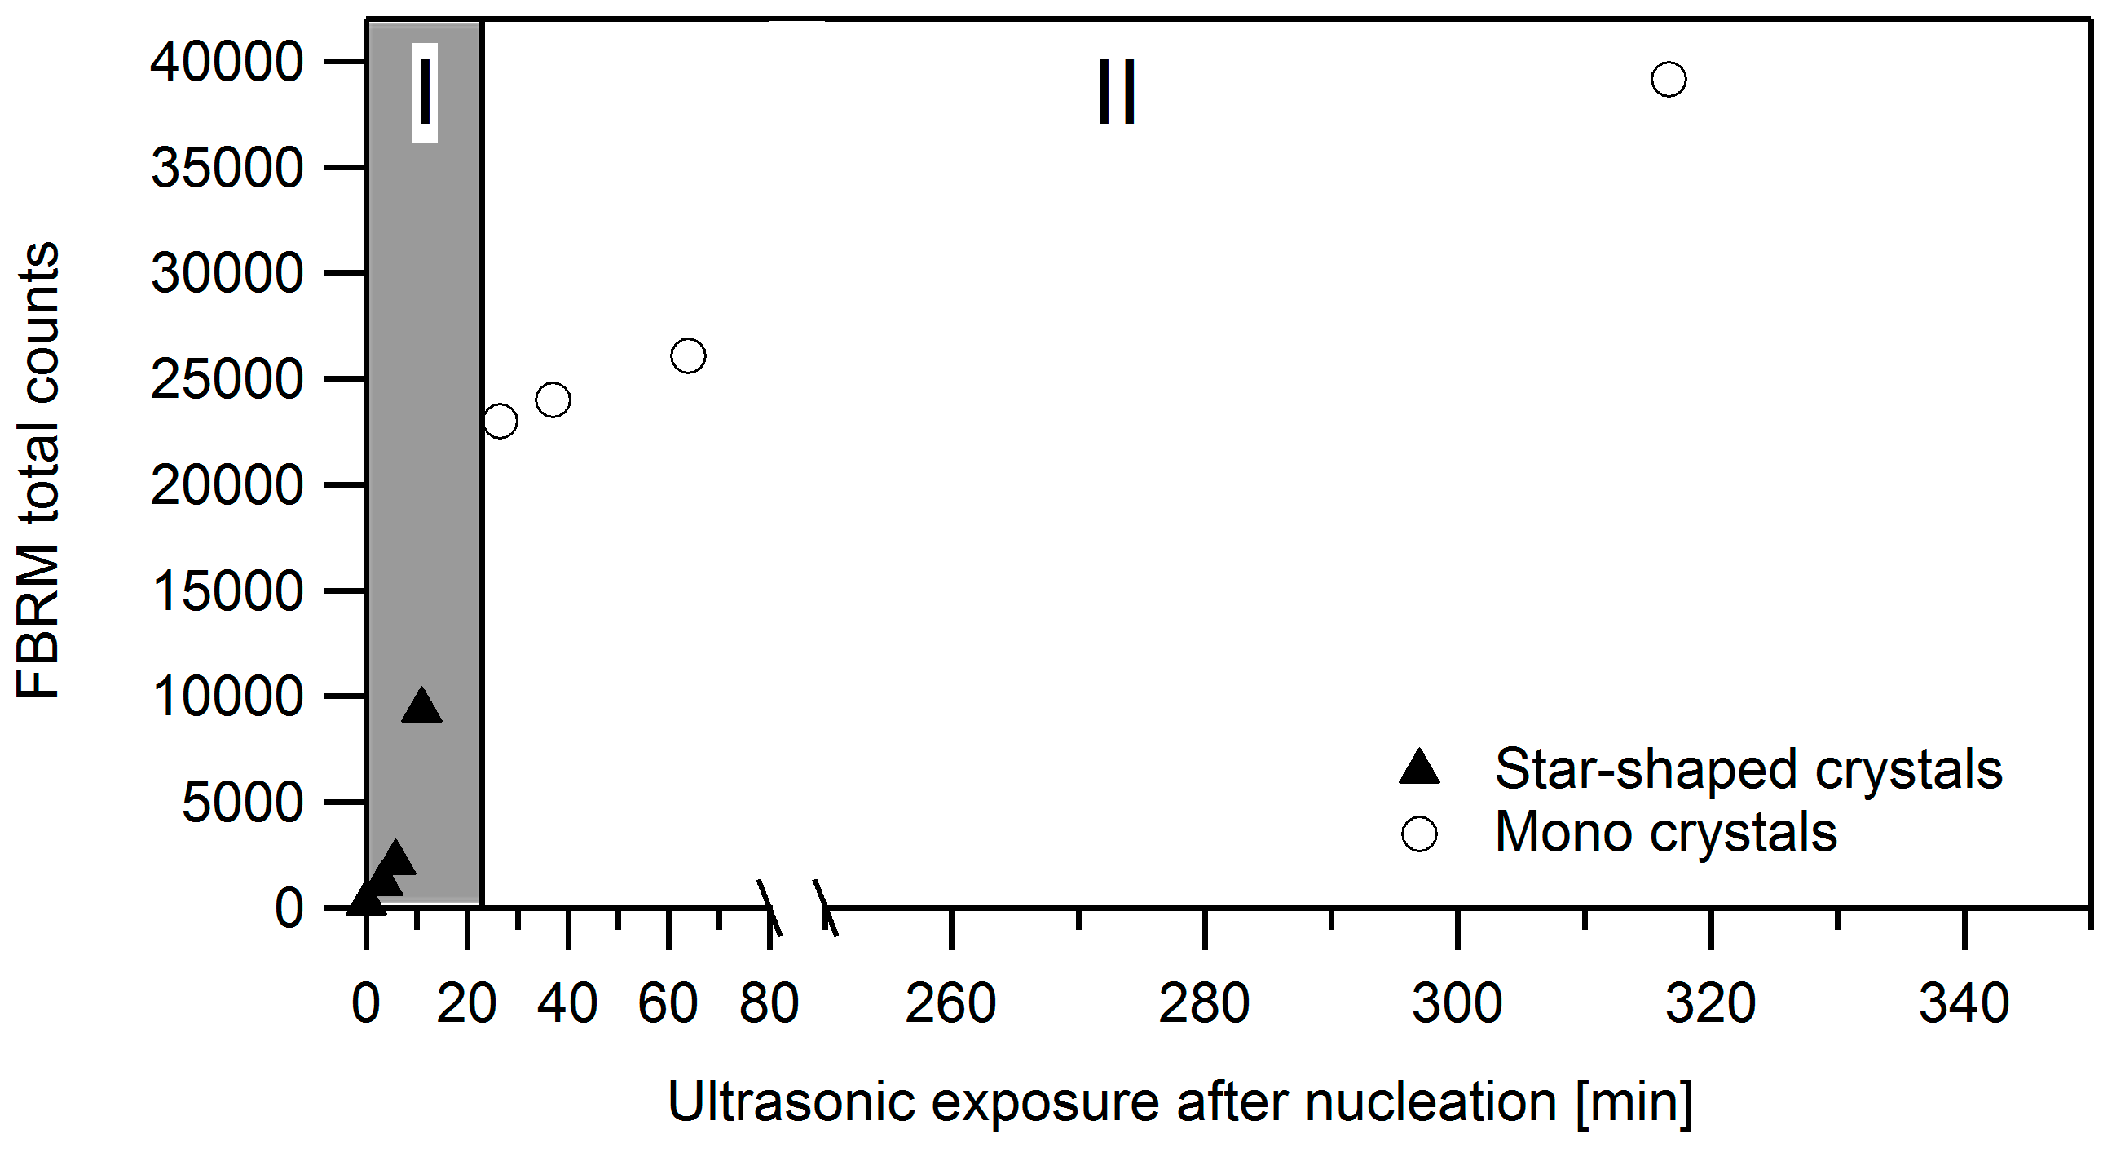
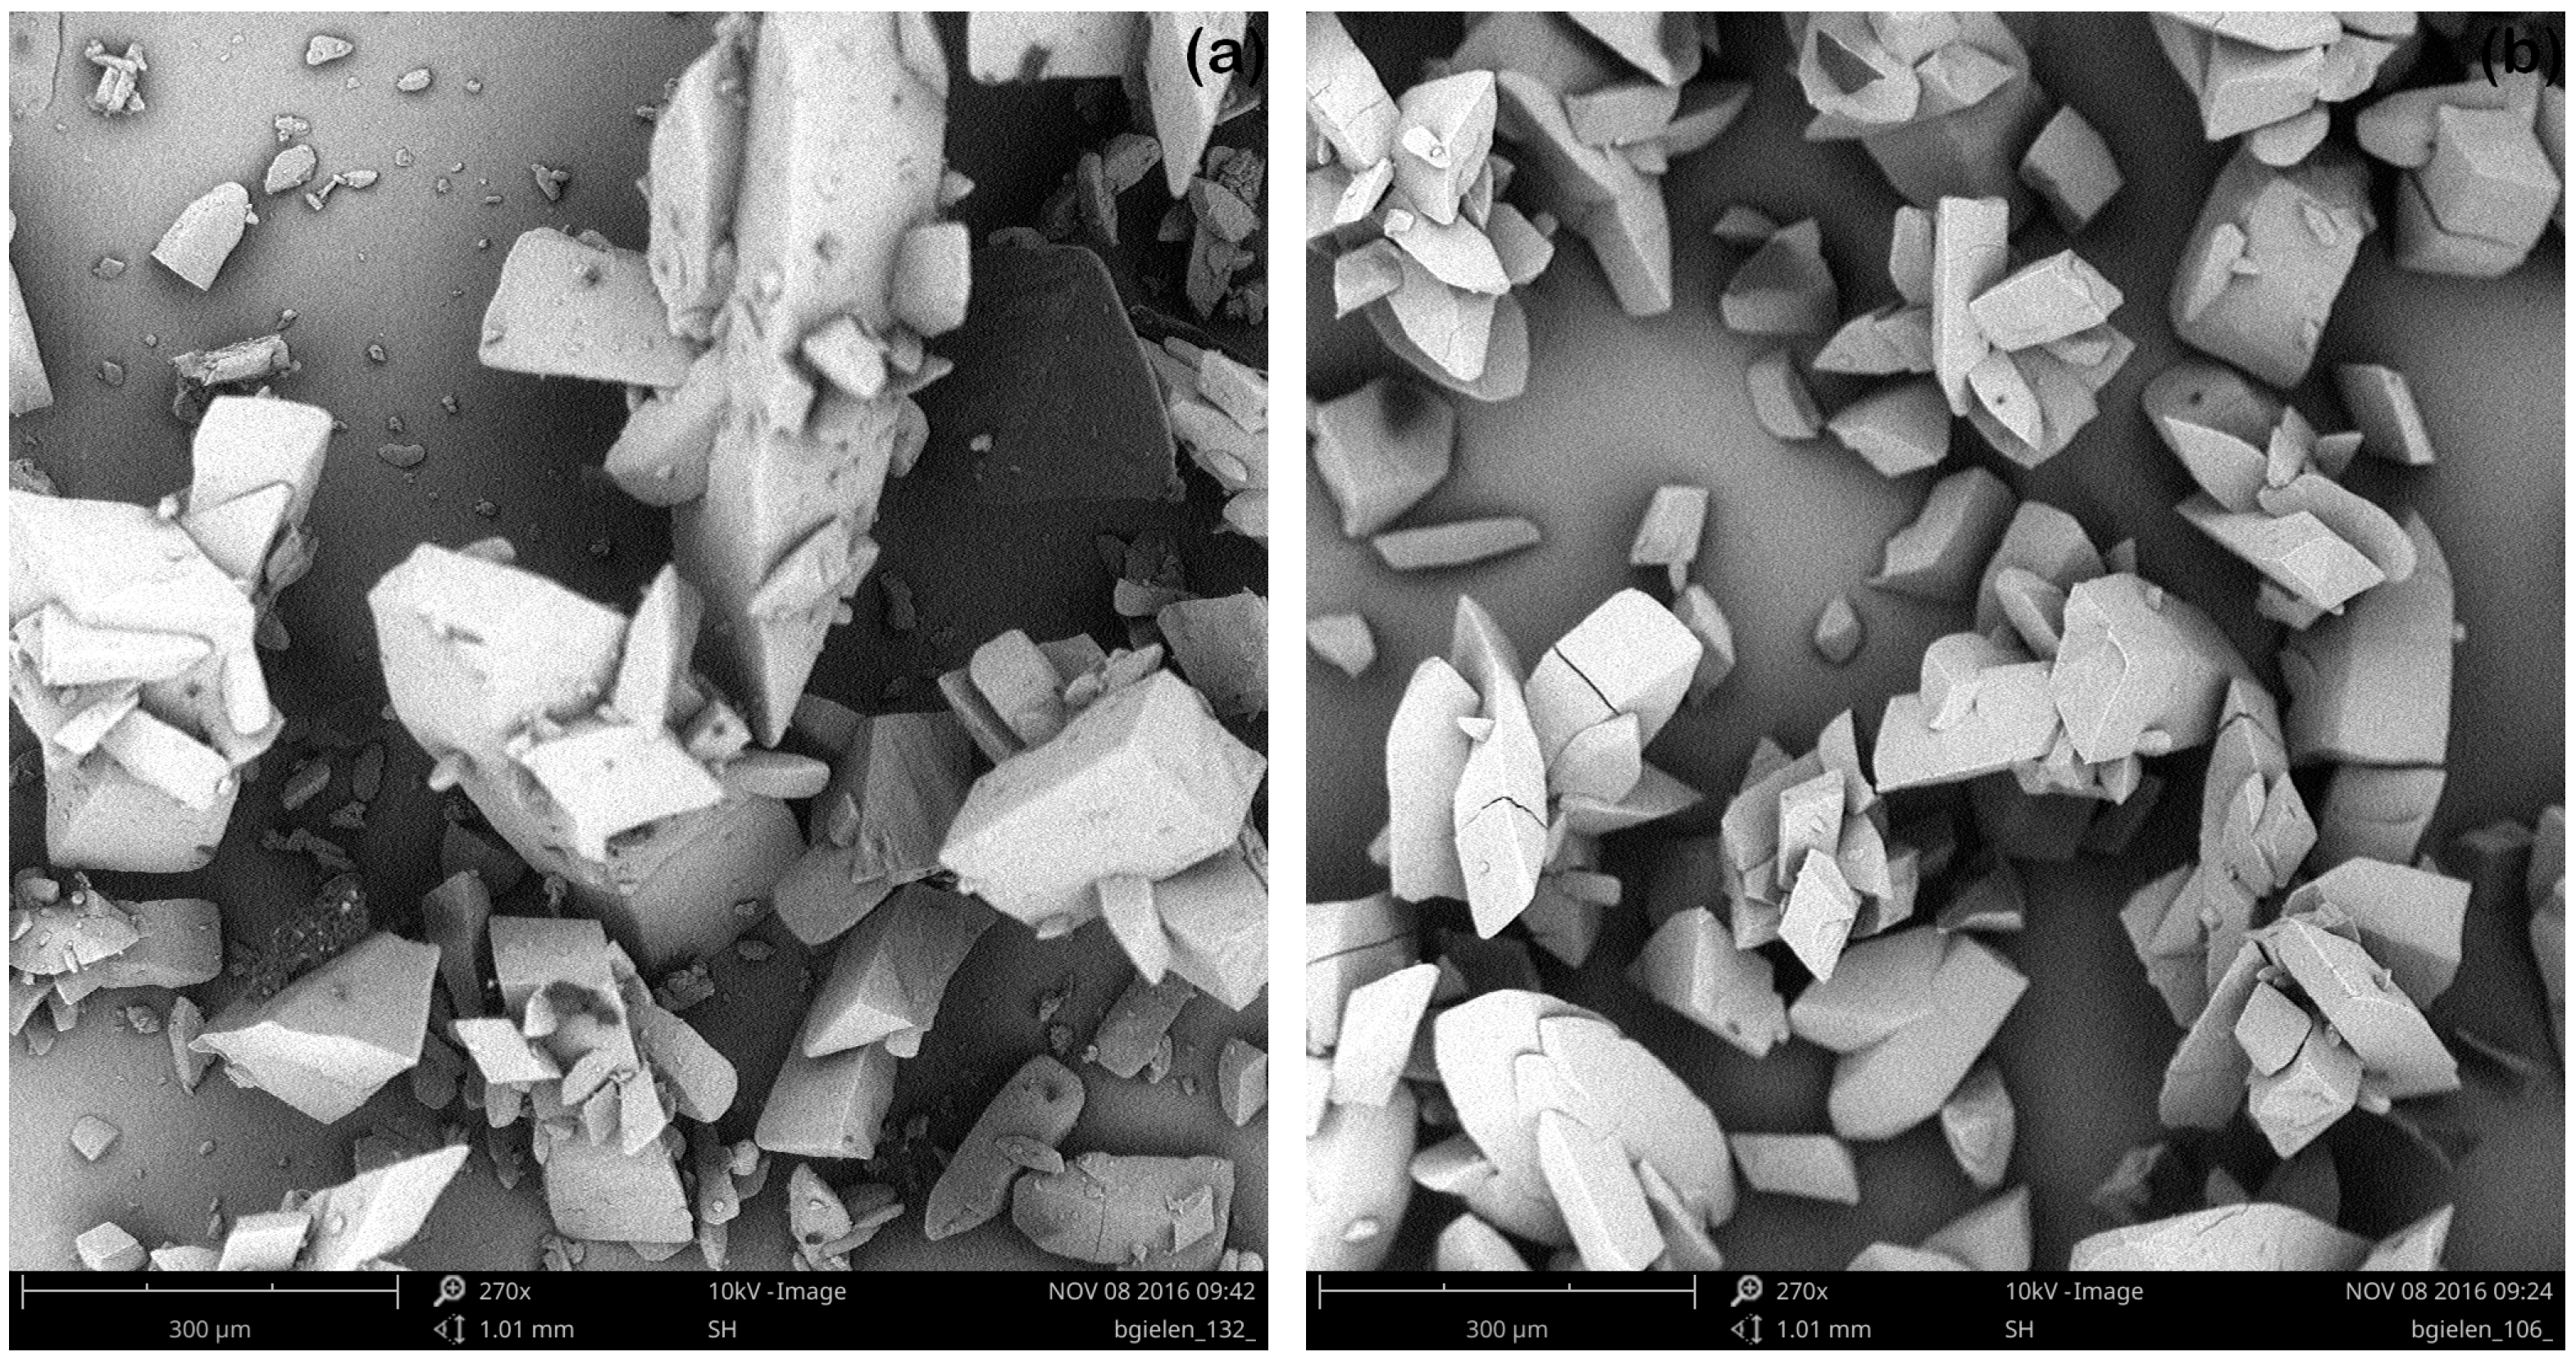
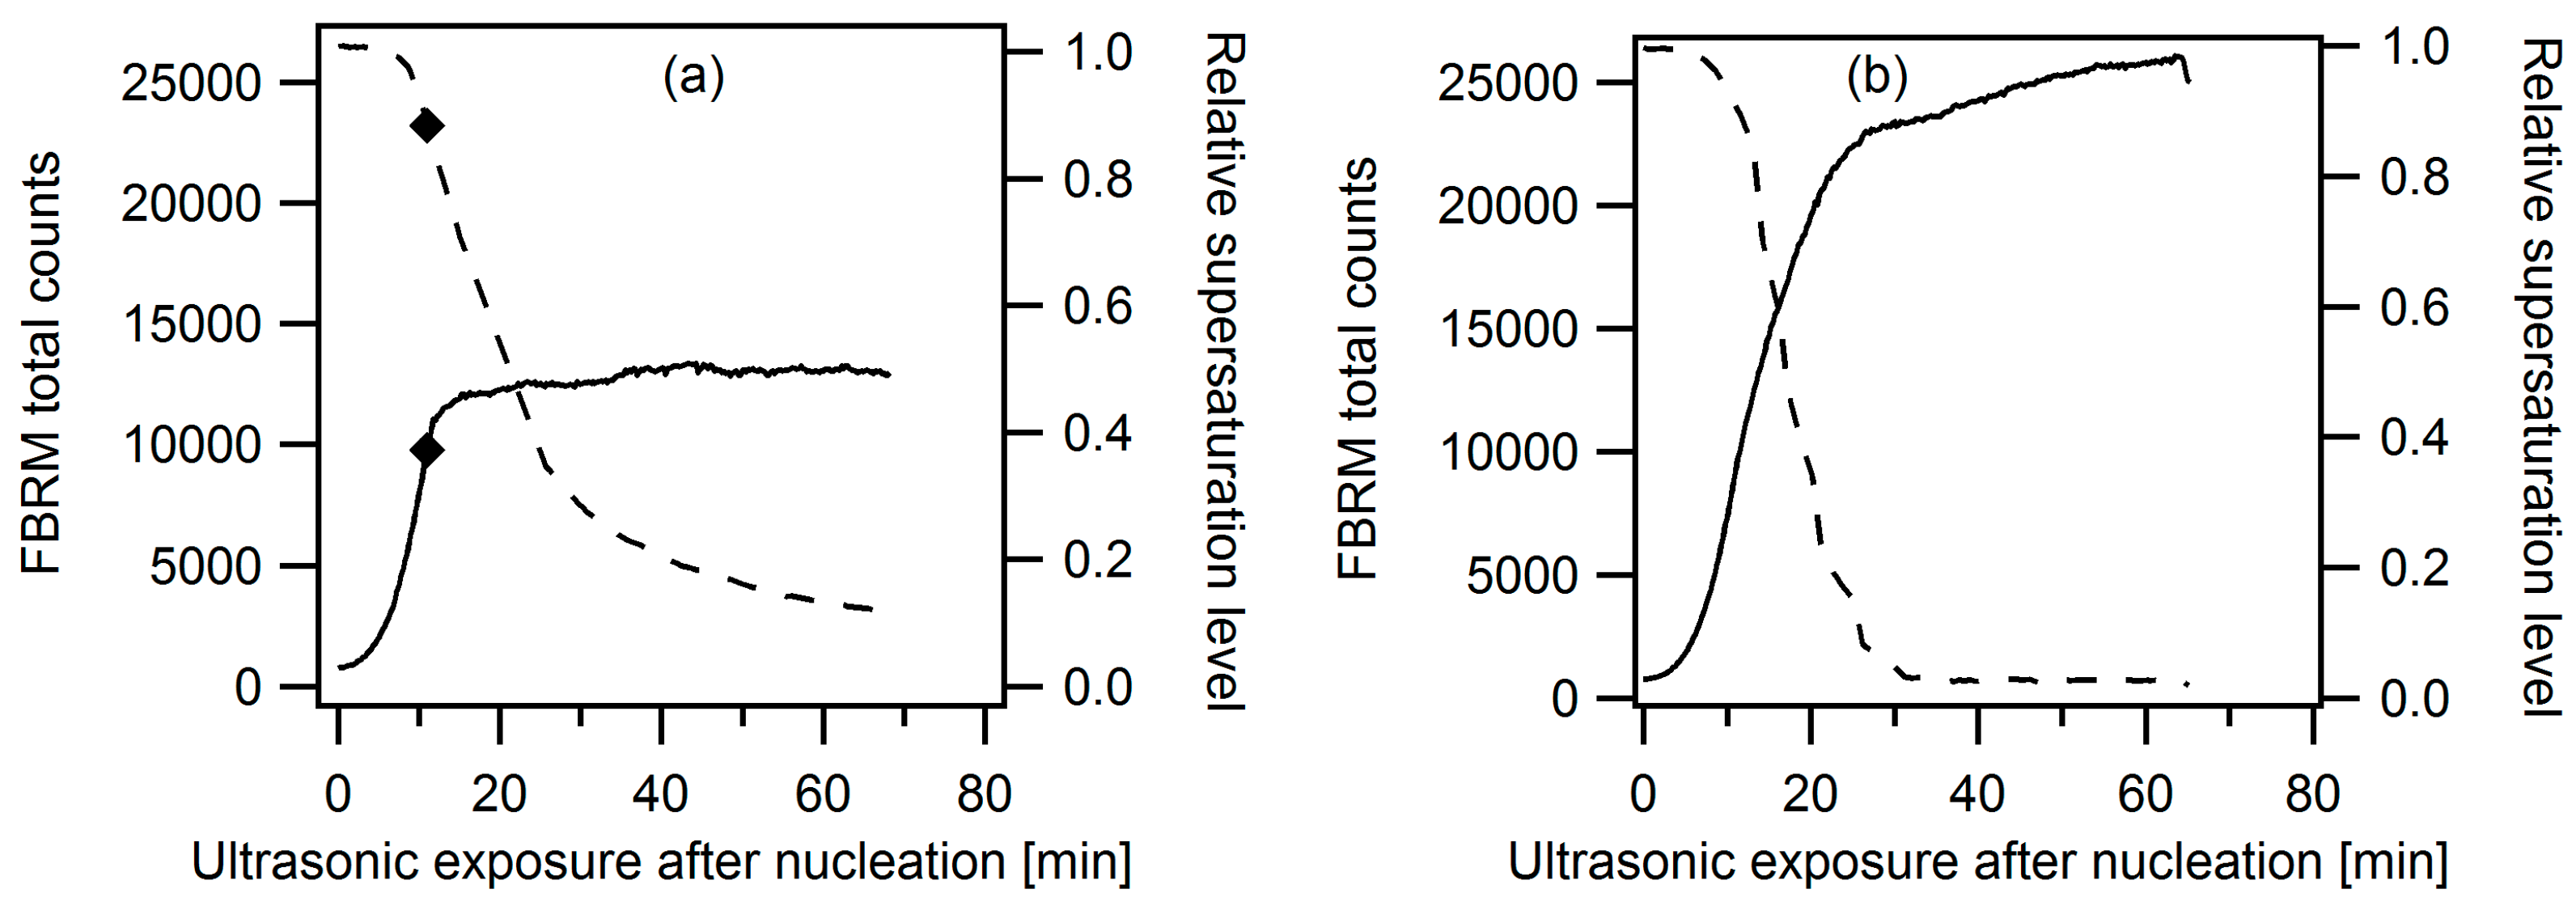
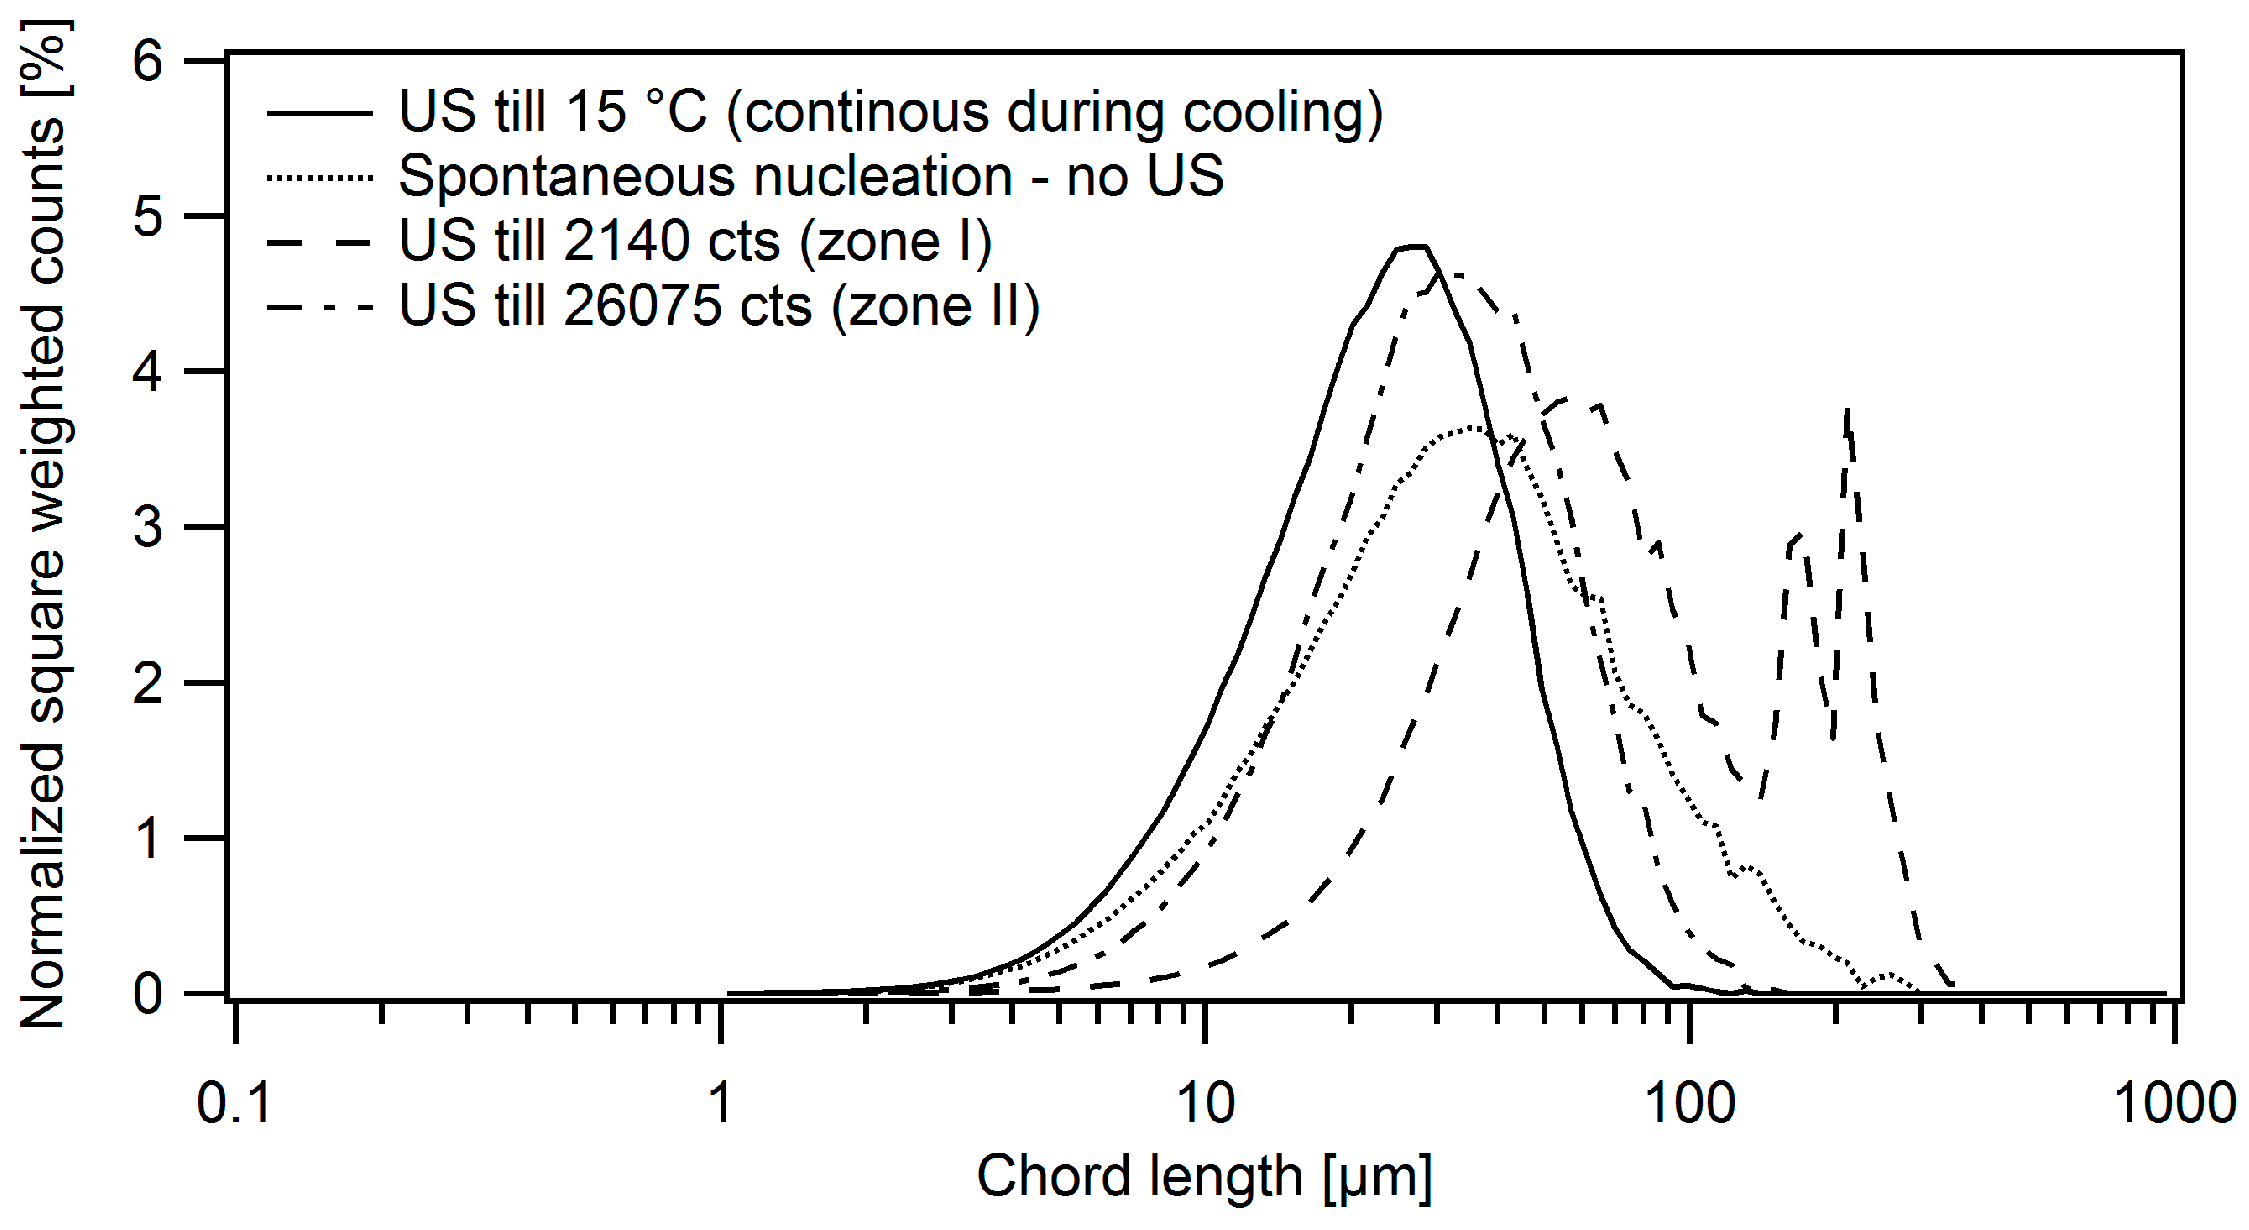
3.2.3. Targeted Ultrasonic Treatment at Seeding Temperature

As demonstrated before, agglomeration can be effectively inhibited by the application of ultrasound throughout the entire cooling trajectory. However, as the formation of agglomerates will predominantly occur in the initial stage of the crystallization process under influence of a high supersaturation, prolonged exposure to ultrasound is not required. Hence, in a later stage the process operates at a lower supersaturation level, reducing the cementation of aggregates into agglomerates [7,8,14]. Therefore, additional tests were performed to determine the minimum sonication period for the production of single crystals. In these sets of experiments, ultrasound was used to start the nucleation while the total FBRM counts were monitored in time. Next, the ultrasonic field was disabled at various FBRM counts and the crystallization protocol was completed as described earlier. In the end, the crystal morphology was analyzed to determine the presence of agglomerates. This assessment was performed for three supersaturation ratios: 3.47, 1.77 and 5.28. Figure 11 shows the total FBRM counts that were measured at the moment sonication was disabled. Ultrasound was started as soon as the solution reached the seeding temperature. After a certain time nucleation was induced by ultrasound, which was detected by a rise in the FBRM signal. The onset of nucleation is considered as t = 0, and the additional ultrasonic exposure time afterwards is varied to yield a certain number of FBRM counts. This exposure period to ultrasound after nucleation is plotted on the x-axis of the FBRM and IR plots.
The crystals produced under these conditions were analyzed to determine whether agglomerates (star-shaped crystals) or mono-crystals were present, as shown in Figure 12.
In all experiments, the ultrasonic energy was supplied at a constant temperature of 62 °C, corresponding to an initial supersaturation ratio of 3.47. Since a waiting time of 80 min is maintained after addition of seed crystals in the conventional process, a similar time span for application of ultrasound was evaluated. Within this window, the FBRM shows a similar response as discussed before during spontaneous nucleation at 57 °C (Figure 7b). After the initial low-response phase, the total counts sharply rise with increasing exposure time to the ultrasonic field and start to level off at around 25,000 counts. Furthermore, this plot indicates that a sufficient exposure time to the ultrasonic field, yielding a total FBRM count close to the plateau value, will predominantly result in mono-crystals (zone II), while agglomeration occurs by application of shorter sonication periods (zone I). Although some degree of agglomeration still occurs, especially for the smallest crystals, the reduced presence of the star-shaped morphology for large particles is clearly noticeable when sonication is maintained until 25,000 FBRM counts are reached.
Finally, the use of continuous ultrasound throughout the entire crystallization process (indicated by an exposure time of 317 min) is also evaluated as a mean of comparison. Similarly as the tests with the use of pulsed ultrasound during the entire process (Figure 9), this method produces mostly mono-crystals with a strongly reduced size compared to the conventional process. This prolonged sonication period will further increase the total FBRM counts to values close to 40,000 as more chord lengths are detected due to the higher amount of crystals in the solution. In general, these results show that a minimal ultrasonic exposure at the seeding temperature is necessary to avoid agglomeration of the crystals. To gain further understanding of the mechanism, the FBRM and IR trends during sonication were analyzed for tests yielding either star-shaped or mono-crystals. This comparison is shown in Figure 13a,b, respectively.
In both experiments, the FBRM and the IR data again proceed through three different stages, dominated by either nucleation or growth. When continuous sonication is applied within the seeding stage (Figure 13b), the supersaturation is already completely depleted within ca. 30 min, while the saturation level is not reached after 70 min if sonication is disabled in an earlier stage (Figure 13a). Although the IR signals initially show an identical progress in both cases, the rate of desupersaturation decreases as soon as sonication is disabled. Most likely, this is caused by two phenomena. On the one hand, the disruption of the ultrasonic field will have a negative effect on the overall mass transfer and degree of micromixing [54,55,56]. In turn, this reduces the nucleation and growth kinetics, and hence the depletion of the solute concentration [57]. On the other hand, ultrasound increases the available surface area in the solution by formation of additional crystals, disruption of aggregates and sonofragmentation phenomena [48,49,57,58,59]. Disabling the ultrasonic field will thus reduce these effects, affecting the desupersaturation profile. This hypothesis is supported by comparison of the FBRM data. Under continuous sonication, the total counts keep increasing although the most significant effect is obtained as long as the solution is supersaturated. The slow increase once the solubility level is reached can be mainly attributed to the disruption and breakage phenomena. In contrast, a much lower FBRM count is observed when sonication is disabled in an early stage, as shown in Figure 13b. Only a limited rise in FBRM counts is detected after the stop of the ultrasonic field due to some additional nucleation under the remaining supersaturation level. Although the FBRM signal stabilizes, the concentration keeps declining, indicating a growth-dominated process. As a result, the final crystal size will be higher in case sonication is interrupted in an earlier stage of the process. The latter statement is supported by a comparison of the SEM images and of the final chord length distributions, displayed in Figure 14.
These results indicate that a longer exposure to ultrasound, corresponding to a higher FBRM count, reduces the particle size and the span. This reduced span is mainly caused by the reduction of agglomerates in the crystallization processes under continuous sonication. Since the agglomerates vary in size, configuration and number of crystals, the FBRM will pick up multiple chord lengths, resulting in a wide distribution. The experiment in which ultrasound was enabled until 2140 counts even shows a multimodal distribution. It is, however, not clear whether the two peaks on the right shoulder can be correlated to the presence of agglomerates or eroded and suspended coating of the FBRM probe. In the end, continuous sonication exhibits the narrowest distribution, although similar results can be obtained by a sufficient exposure time at the seeding temperature.
Finally, the IR and FBRM data provide further evidence to explain why a minimum ultrasonic exposure time is needed to inhibit the formation of agglomerates. Sonication enhances the micromixing during the initial stage, resulting in a homogeneous distribution of the supersaturation and equal growth of the particles, further aided by an enhanced mass transfer. Consequently, the desupersaturation rate accelerates and the crystals will spend less time at high supersaturation where agglomeration phenomena are more likely to occur. After this initial phase, a low supersaturation level is maintained throughout the entire crystallization since the solution is completely desupersaturated before the start of the cooling profile. This minimizes secondary nucleation which could lead to a broad size distribution and reduces the cementation of aggregates into agglomerates. Secondly, the FBRM trend shows that the use of ultrasound after nucleation rapidly boosts the amount of nuclei in the solution as a result of disaggregation and sonofragmentation. In turn, this fast generation of crystals will promptly increase the suspension density and collision frequency. Although aggregates and agglomerates originate from these collisions, disintegration will dominate beyond a certain suspension density. Finally, ultrasound will also directly enhance the collision frequency by formation of shockwaves and liquid jet that interact with the aggregates, separating these into individual crystals.
To validate the mechanism of agglomeration inhibition by application of a threshold ultrasonic treatment, the same procedure was evaluated for two additional supersaturation levels. Figure 15 shows that for both supersaturation levels, a certain treatment time is indeed needed to produce mono-crystals, similarly as evidenced before for the conventional protocol.
Analysis of the FBRM and IR signals again supports the previously introduced mechanism. These plots are shown in Figure 16 and Figure 17 for an initial supersaturation ratio of 1.77 and 5.28, respectively. It is important to notice that the transition into mono-crystals is less pronounced in the latter case. Hence, the combination of a high supersaturation and sonication promotes the formation of fines. These will aggregate more easily and can therefore transform into agglomerates before collisions or interaction with cavitation bubbles disrupt these clusters. As a result, some agglomerates of small crystals are produced together with the mono-crystals.
In both cases, the threshold exposure time is obtained when the total FBRM counts tend to level off. Since the counts increase more rapidly at high supersaturation, corresponding to a faster depletion in supersaturation, a shorter treatment time to obtain mono-crystals was needed when sonication was started at 57 °C (C0/Csat = 5.28), compared to 70 °C (C0/Csat = 1.77). Furthermore, a different response by the FBRM is obtained after the ultrasound is switched off. At a low seeding temperature and high initial supersaturation, the signal continues to increase after sonication is disabled, while it stagnates in the experiments performed at 70 °C with a low supersaturation level at t = 0. This effect is attributed to the remaining absolute supersaturation ratio after ultrasound is stopped, which determines whether growth or nucleation dominates the crystallization process. The latter will be more likely at higher supersaturation levels, resulting in additional nuclei formation and a rise in FBRM counts instead of deposition onto the available surface area. For example, in the experiments at 57 °C the absolute supersaturation ratio equals almost 5.28 if the FBRM is disabled at 10,000 counts. As a result, more secondary crystals will be formed in the solution if sonication is disabled and the FBRM will only level off after a certain delay period (Figure 17a).

4. Conclusions

Agglomeration is an often encountered problem during crystallization and precipitation processes. In a conventionally seeded crystallization process, adequate tuning of the shear rate, seed loading and seeding temperature can avoid this phenomenon, but this method is highly sensitive to the properties of the seed material and therefore not robust. Although ultrasound was proven to be a successful alternative in the literature, the exact mechanism is unknown, leading to improper operation. In most cases, it is enabled throughout the entire process which results in a high energy demand, crystal breakage and surface erosion. This study identified the mechanism and can therefore reduce the operating time of ultrasound, while maintaining the production of non-agglomerated crystals. This research was performed on a commercially available API in order to evaluate the potential of the technology in pharmaceutical industry. Ultrasound was assessed both as a post-treatment technique to break agglomerates and as an alternative seeding agent. The former method proved to be unsuccessful since all crystals exhibited strong surface erosion and only part of the agglomerates could be destroyed. Sonication during the initial stage of crystallization is able to inhibit the formation of agglomerates as long as a sufficient exposure time is provided. Analysis with PAT tools identified that ultrasound should be enabled until the FBRM and IR signal counts reach a steady state, corresponding to a complete desupersaturation of the solute at the seeding temperature. The ultrasonic treatment enhances the degree of micromixing, boosts the amount of particles and increases the collision frequency. As a result, aggregates are efficiently disrupted before they are cemented into agglomerates. In the end, this strategy of a targeted application of ultrasound during the seeding stage enables the user to tune the properties of in-situ generated nuclei and prevent their agglomeration. Therefore, this method provides an alternative for conventionally seeded crystallization processes and thus increases the potential of ultrasound in pharmaceutical industry.

Acknowledgments

The research leading to these results has received funding from the European Community’s Seventh Framework Programme (FP7/2007-2013) under grant agreement No. NMP2-SL-2012-309874 (ALTEREGO). J. Jordens acknowledges funding of a grant by the Agency for Innovation by Science and Technology (IWT). The CTU-group of Johnson & Johnson in Beerse is acknowledged for their collaboration in this project, providing the API and allowing access to their experimental facilities.

Author Contributions

B. Gielen conceived the research, designed and performed the experiments and wrote the paper. J. Jordens, L.C.J. Thomassen, L. Braeken and T. Van Gerven contributed in the analysis and discussion of the data.

Conflicts of Interest

The authors declare no conflict of interest.

References

  1. Giulietti, M.; Seckler, M.M.; Derenzo, S.; Ré, M.I.; Cekinski, E. Industrial Crystallization and Precipitation from Solutions: State of the Technique. Braz. J. Chem. Eng. 2001, 18, 423–440. [Google Scholar] [CrossRef]
  2. Zeng, G.; Li, H.; Luo, S.; Wang, X.; Chen, J. Effects of ultrasonic radiation on induction period and nucleation kinetics of sodium sulfate. Korean J. Chem. Eng. 2014, 31, 807–811. [Google Scholar] [CrossRef]
  3. Bhoi, S.; Sarkar, D. Modelling and experimental validation of ultrasound assisted unseeded batch cooling crystallization of L-asparagine monohydrate. CrystEngComm 2016, 18, 4863–4874. [Google Scholar] [CrossRef]
  4. Dalvi, S.V.; Dave, R.N. Controlling particle size of a poorly water-soluble drug using ultrasound and stabilizers in antisolvent precipitation. Ind. Eng. Chem. Res. 2009, 48, 7581–7593. [Google Scholar] [CrossRef]
  5. Castillo-Peinado, L.D.L.S.; Dolores, M.; de Castro, L. The role of ultrasound in pharmaceutical production: Sonocrystallization. J. Pharm. Pharmacol. 2016, 68, 1249–1267. [Google Scholar] [CrossRef] [PubMed]
  6. Dhumal, R.S.; Biradar, S.V.; Paradkar, A.R.; York, P. Particle engineering using sonocrystallization: Salbutamol sulphate for pulmonary delivery. Int. J. Pharm. 2009, 368, 129–137. [Google Scholar] [CrossRef] [PubMed]
  7. Ålander, E. Agglomeration of Paracetamol during Crystallization in Pure and Mixed Solvents. Ind. Eng. Chem. Res. 2004, 43, 629–637. [Google Scholar] [CrossRef]
  8. Brunsteiner, M.; Jones, A.G.; Pratola, F.; Price, S.L.; Simons, S.J.R. Toward a molecular understanding of crystal agglomeration. Cryst. Growth Des. 2005, 5, 3–16. [Google Scholar] [CrossRef]
  9. Nichols, G.; Byard, S.; Bloxham, M.J.; Botterill, J.; Dawson, N.J.; Dennis, A.; Diart, V.; North, N.C.; Sherwood, J.D. A review of the terms agglomerate and aggregate with a recommendation for nomenclature used in powder and particle characterization. J. Pharm. Sci. 2002, 91, 2103–2109. [Google Scholar] [CrossRef] [PubMed]
  10. Beckmann, W. Crystallization: Basic Concepts and Industrial Applications; Beckmann, W., Ed.; Wiley-VCH Verlag GmbH & Co. KGaA: Weinheim, Germany, 2013. [Google Scholar]
  11. Yu, Z.Q.; Tan, R.B.H.; Chow, P.S. Effects of operating conditions on agglomeration and habit of paracetamol crystals in anti-solvent crystallization. J. Cryst. Growth 2005, 279, 477–488. [Google Scholar] [CrossRef]
  12. Chang, S.M.; Kim, J.M.; Kim, I.H.; Shin, D.M.; Kim, W.S. Agglomeration control of L-ornithine aspartate crystals by operating variables in drowning-out crystallization. Ind. Eng. Chem. Res. 2006, 45, 1631–1635. [Google Scholar] [CrossRef]
  13. Kim, J.M.; Chang, S.M.; Kim, K.S.; Chung, M.K.; Kim, W.S. Acoustic influence on aggregation and agglomeration of crystals in reaction crystallization of cerium carbonate. Colloids Surf. A Physicochem. Eng. Asp. 2011, 375, 193–199. [Google Scholar] [CrossRef]
  14. Wang, Y.; Ma, S.; Lü, X.; Xie, C. Control of the agglomeration of crystals in the reactive crystallization of 5-(difluoromethoxy)-2-mercapto-1H-benzimidazole. Front. Chem. Sci. Eng. 2012, 6, 423–431. [Google Scholar] [CrossRef]
  15. Schnebelen, M.; Mozet, K.; Jakob, A.; Sy, D.; Plasari, E.; Muhr, H. Agglomeration Mechanisms and Kinetics during the Carbonation of a Suspension of Lime in a Pilot Batch Reactor. Cryst. Struct. Theory Appl. 2015, 4, 35–46. [Google Scholar] [CrossRef]
  16. Mumtaz, H.S.; Hounslow, M.J.; Seaton, N.A.; Paterson, W.R. Orthokinetic Aggregation During Precipitation. Chem. Eng. Res. Des. 1997, 75, 152–159. [Google Scholar] [CrossRef]
  17. Hostomsky, J.; Jones, A.G. Calcium carbonate crystallization, agglomeration and form during continuous precipitation from solution. J. Phys. D Appl. Phys. 1991, 24, 165–170. [Google Scholar] [CrossRef]
  18. Wójcik, J.A.; Jones, A.G. Particle disruption of precipitated CaCO3 crystal agglomerates in turbulently agitated suspensions. Chem. Eng. Sci. 1998, 53, 1097–1101. [Google Scholar] [CrossRef]
  19. Mullin, J.W. Crystallization; Butterworth-Heinemann: Oxford, UK, 2001. [Google Scholar]
  20. David, R.; Espitalier, F.; Cameirão, A.; Rouleau, L. Developments in the understanding and modeling of the agglomeration of suspended crystals in crystallization from solutions. KONA Powder Part. J. 2003, 21, 40–53. [Google Scholar] [CrossRef]
  21. Li, D.; Kaner, R.B. Shape and aggregation control of nanoparticles: Not shaken, not stirred. J. Am. Chem. Soc. 2006, 128, 968–975. [Google Scholar] [CrossRef] [PubMed]
  22. Li, H.; Li, H.; Guo, Z.; Liu, Y. The application of power ultrasound to reaction crystallization. Ultrason. Sonochem. 2006, 13, 359–363. [Google Scholar] [CrossRef] [PubMed]
  23. Sivabalan, R.; Gore, G.M.; Nair, U.R.; Saikia, A.; Venugopalan, S.; Gandhe, B.R. Study on ultrasound assisted precipitation of CL-20 and its effect on morphology and sensitivity. J. Hazard. Mater. 2007, 139, 199–203. [Google Scholar] [CrossRef] [PubMed]
  24. Bari, A.H.; Chawla, A.; Pandit, A.B. Sono-crystallization kinetics of K2SO4: Estimation of nucleation, growth, breakage and agglomeration kinetics. Ultrason. Sonochem. 2017, 35, 196–203. [Google Scholar] [CrossRef] [PubMed]
  25. Guo, Z.; Jones, A.G.; Li, N.; Germana, S. High-speed observation of the effects of ultrasound on liquid mixing and agglomerated crystal breakage processes. Powder Technol. 2007, 171, 146–153. [Google Scholar] [CrossRef]
  26. Luque de Castro, M.D.; Priego-Capote, F. Ultrasound-assisted crystallization (sonocrystallization). Ultrason. Sonochem. 2007, 14, 717–724. [Google Scholar] [CrossRef] [PubMed]
  27. Ruecroft, G.; Hipkiss, D.; Ly, T.; Maxted, N.; Cains, P.W. Sonocrystallization: The use of ultrasound for improved industrial crystallization. Org. Process Res. Dev. 2005, 9, 923–932. [Google Scholar] [CrossRef]
  28. Iyer, S.R.; Gogate, P.R. Ultrasound assisted crystallization of mefenamic acid: Effect of operating parameters and comparison with conventional approach. Ultrason. Sonochem. 2017, 34, 896–903. [Google Scholar] [CrossRef] [PubMed]
  29. Hem, S.L. The effect of ultrasonic vibrations on crystallization processes. Ultrasonics 1967, 5, 202–207. [Google Scholar] [CrossRef]
  30. Wohlgemuth, K.; Kordylla, A.; Ruether, F.; Schembecker, G. Experimental study of the effect of bubbles on nucleation during batch cooling crystallization. Chem. Eng. Sci. 2009, 64, 4155–4163. [Google Scholar] [CrossRef]
  31. Guo, Z.; Zhang, M.; Li, H.; Wang, J.; Kougoulos, E. Effect of ultrasound on anti-solvent crystallization process. J. Cryst. Growth 2005, 273, 555–563. [Google Scholar] [CrossRef]
  32. Wu, T.Y.; Guo, N.; Teh, C.Y.; Hay, J.X.W. Challenges and Recent Developments of Sonochemical Processes. In Advances in Ultrasound Technology for Environmental Remediation; Springer Science & Business Media: New York, NY, USA, 2013; pp. 109–120. [Google Scholar]
  33. Sutkar, V.S.; Gogate, P.R. Design aspects of sonochemical reactors: Techniques for understanding cavitational activity distribution and effect of operating parameters. Chem. Eng. J. 2009, 155, 26–36. [Google Scholar] [CrossRef]
  34. Gogate, P.R.; Pandit, A.B. Sonochemical reactors: Scale up aspects. Ultrason. Sonochem. 2004, 11, 105–117. [Google Scholar] [CrossRef] [PubMed]
  35. Hatkar, U.N.; Gogate, P.R. Ultrasound assisted cooling crystallization of sodium acetate. Ind. Eng. Chem. Res. 2012, 51, 12901–12909. [Google Scholar] [CrossRef]
  36. Narducci, O.; Jones, A.G. Seeding in Situ the Cooling Crystallization of Adipic Acid using Ultrasound. Cryst. Growth Des. 2012, 12, 1727–1735. [Google Scholar] [CrossRef]
  37. Abbas, A.; Srour, M.; Tang, P.; Chiou, H.; Chan, H.K.; Romagnoli, J.A. Sonocrystallisation of sodium chloride particles for inhalation. Chem. Eng. Sci. 2007, 62, 2445–2453. [Google Scholar] [CrossRef]
  38. Kim, S.; Wei, C.; Kiang, S. Crystallization process development of an active pharmaceutical ingredient and particle engineering via the use of ultrasonics and temperature cycling. Org. Process Res. Dev. 2003, 7, 997–1001. [Google Scholar] [CrossRef]
  39. Addai-Mensah, J.; Prestidge, C.A.; Ralston, J. Interparticle forces, interfacial structure development and agglomeration of gibbsite particles in synthetic Bayer liquors. Miner. Eng. 1999, 12, 655–669. [Google Scholar] [CrossRef]
  40. Sohnel, O.; Mullin, J.W.; Jones, A.G. Crystallization and agglomeration kinetics in the batch precipitation of strontium molybdate. Ind. Eng. Chem. Res. 1988, 27, 1721–1728. [Google Scholar] [CrossRef]
  41. Wójcik, J.A.; Jones, A.G. Experimental Investigation into Dynamics and Stability of Continuous MSMPR Agglomerative Precipitation of CaCO3 Crystals. Chem. Eng. Res. Des. 1997, 75, 113–118. [Google Scholar] [CrossRef]
  42. Majano, G.; Darwiche, A.; Mintova, S.; Valtchev, V. Seed-Induced Crystallization of Nanosized Na-ZSM-5 Crystals. Ind. Eng. Chem. Res. 2009, 48, 7084–7091. [Google Scholar] [CrossRef]
  43. Zumstein, R.C.; Rousseau, R.W. Agglomeration of copper sulfate pentahydrate crystals within well-mixed crystallizers. Chem. Eng. Sci. 1989, 44, 2149–2155. [Google Scholar] [CrossRef]
  44. Li, H.; Wang, J.; Bao, Y.; Guo, Z.; Zhang, M. Rapid sonocrystallization in the salting-out process. J. Cryst. Growth 2003, 247, 192–198. [Google Scholar] [CrossRef]
  45. Heath, A.R.; Fawell, P.D.; Bahri, P.A.; Swift, J.D. Estimating average particle size by focused beam reflectance measurement (FBRM). Part. Part. Syst. Charact. 2002, 19, 84–95. [Google Scholar] [CrossRef]
  46. Synowiec, P.; Jones, A.G.; Shamlou, P.A. Crystal break-up in dilute turbulently agitated suspensions. Chem. Eng. Sci. 1993, 48, 3485–3495. [Google Scholar] [CrossRef]
  47. Bartos, C.; Kukovecz, Á.; Ambrus, R.; Farkas, G.; Radacsi, N.; Szabó-Révész, P. Comparison of static and dynamic sonication as process intensification for particle size reduction using a factorial design. Chem. Eng. Process. Process Intensif. 2015, 87, 26–34. [Google Scholar] [CrossRef]
  48. Zeiger, B.W.; Suslick, K.S. Sonofragmentation of molecular crystals. J. Am. Chem. Soc. 2011, 133, 14530–14533. [Google Scholar] [CrossRef]
  49. Sander, J.R.G.; Zeiger, B.W.; Suslick, K.S. Sonocrystallization and sonofragmentation. Ultrason. Sonochem. 2014, 21, 1908–1915. [Google Scholar] [CrossRef] [PubMed]
  50. Chen, D.; Sharma, S.K.; Mudhoo, A. Handbook on Applications of Ultrasound: Sonochemistry for Sustainability; CRC Press Taylor & Francis Group: Boca Raton, FL, USA, 2012. [Google Scholar]
  51. Wagterveld, R.M.; Boels, L.; Mayer, M.J.; Witkamp, G.J. Visualization of acoustic cavitation effects on suspended calcite crystals. Ultrason. Sonochem. 2011, 18, 216–225. [Google Scholar] [CrossRef] [PubMed]
  52. Gielen, B.; Kusters, P.; Jordens, J.; Thomassen, L.C.J.; Van Gerven, T.; Braeken, L. Energy efficient crystallization of paracetamol using pulsed ultrasound. Chem. Eng. Process 2017. submitted. [Google Scholar] [CrossRef]
  53. Louhi-Kultanen, M.; Karjalainen, M.; Rantanen, J.; Huhtanen, M.; Kallas, J. Crystallization of glycine with ultrasound. Int. J. Pharm. 2006, 320, 23–29. [Google Scholar] [CrossRef] [PubMed]
  54. Jordens, J.; Bamps, B.; Gielen, B.; Braeken, L.; Van Gerven, T. The effect of ultrasound on micromixing. Ultrason. Sonochem. 2015, in press. [Google Scholar] [CrossRef] [PubMed]
  55. Monnier, H.; Wilhelm, A.M.; Delmas, H. The influence of ultrasound on micromixing in a semi-batch reactor. Chem. Eng. Sci. 1999, 54, 2953–2961. [Google Scholar] [CrossRef]
  56. Parvizian, F.; Rahimi, M.; Faryadi, M. Macro- and micromixing in a novel sonochemical reactor using high frequency ultrasound. Chem. Eng. Process. Process Intensif. 2011, 50, 732–740. [Google Scholar] [CrossRef]
  57. Wagterveld, R.M.; Miedema, H.; Witkamp, G. Effect of Ultrasonic Treatment on Early Growth during CaCO3 Precipitation. Cryst. Growth Des. 2012, 12, 4403–4410. [Google Scholar] [CrossRef]
  58. Chow, R.; Blindt, R.; Chivers, R.; Povey, M. A study on the primary and secondary nucleation of ice by power ultrasound. Ultrasonics 2005, 43, 227–230. [Google Scholar] [CrossRef] [PubMed]
  59. Chow, R.; Blindt, R.; Chivers, R.; Povey, M. The sonocrystallisation of ice in sucrose solutions: Primary and secondary nucleation. Ultrasonics 2003, 41, 595–604. [Google Scholar] [CrossRef] [PubMed]
  60. Wohlgemuth, K.; Ruether, F.; Schembecker, G. Sonocrystallization and crystallization with gassing of adipic acid. Chem. Eng. Sci. 2010, 65, 1016–1027. [Google Scholar] [CrossRef]
  61. Boels, L.; Wagterveld, R.M.; Mayer, M.J.; Witkamp, G.J. Seeded calcite sonocrystallization. J. Cryst. Growth 2010, 312, 961–966. [Google Scholar] [CrossRef]
Figure 1. Experimental setup used during silent and sonicated experiments. (a) A 30 kHz probe is submerged from the top to supply ultrasound to the solution; (b) Overhead stirring is provided by a half-moon blade impeller; (c) A thermometer allowed accurately logging and controlling the temperature within this equipment; (d) PAT tools such as FBRM and FTIR were fitted to collect data on chord length distribution and solute concentration.
Crystals 07 00040 g001
Figure 2. Solubility data of the API in ethanol denatured with MEK. The dashed line corresponds to the exponentially fitted solubility curve, given in Equation (2).
Crystals 07 00040 g002
Figure 3. Example of the final morphology of the API. Dry samples are classified by SEM and optical microscopy: (a) mono-crystal (CE diameter: 233.2 µm, length: 329.1 µm, width: 207.5 µm); and (b) star-shaped crystal (CE diameter: 191.5 µm, length 247.5 µm, width: 197.9 µm).
Crystals 07 00040 g003
Figure 4. SEM images of the API produced by the conventional crystallization process in the Easymax 102 setup with addition of 0.2 m% dry seed material at 62 °C. The crystal were imaged after filtration at 15 °C and air drying. Crystals were taken at different magnifications, given by the length of the scale bar: (a) 300 µm; (b) 10 µm; and (c) 2 µm.
Crystals 07 00040 g004
Figure 5. Effect of seed mass on degree of agglomeration, while operating at a constant stirring rate of 250 rpm and seeding temperature of 62 °C: (a) 1 m% seed mass; and (b) 5 m% seed mass. These SEM images were magnified 265 and 260 times, respectively, and the scale bar represents a length of 300 µm.
Crystals 07 00040 g005
Figure 6. Effect of stirring rate on degree of agglomeration after seeding at a temperature of 62 °C: (a) 3 m% milled seeds, no stirring; (b) 3 m% milled seeds, 250 rpm; and (c) 0.2 m% seeds, 500 rpm. All SEM images were magnified 270 times and the scale bar represents a length of 300 µm.
Crystals 07 00040 g006
Figure 7. Evaluation of agglomeration during spontaneous crystallization at 57 °C (C0/Csat = 5.28), leading to fast crystal generation. (a) SEM-image (Magnification: 270×, 300 µm scale bar) showing the predominant presence of mono-crystals; (b) The FBRM and IR trend allow tracking the total chord count and solute concentration during the experiment.
Crystals 07 00040 g007
Figure 8. Final crystal morphology of the API after conventional seeded crystallization protocol followed by 60 min sonication at 15 W. SEM images are magnified 270 times and the scale bar represents a length of 300 µm. The white arrows indicate the remaining presence of agglomerates.
Crystals 07 00040 g008
Figure 9. Pulsed US applied during the cooling crystallization process of the API: (a) application after addition of 0.2 m% dry seed material; and (b) application to seed the solution and during cooling. The scale bar represents a length of 300 µm.
Crystals 07 00040 g009
Figure 10. Schematic overview of the proposed mechanism by which sonication inhibits agglomeration during crystallization.
Crystals 07 00040 g010
Figure 11. Measured total FBRM counts at the moment that sonication is disabled as a function of the ultrasonic exposure time after the detection of nucleation. The final morphology after completion of the crystallization protocol is indicated and exhibits two distinct areas. Insufficient exposure in zone I results in star-shaped crystals, while mono-crystals are obtained in zone II.
Crystals 07 00040 g011
Figure 12. SEM images of crystals resulting from selected experiments displayed in Figure 11 which are used to classify crystals into mono- or star-shaped morphology. The ultrasonic exposure time after nucleation for these images are: (a) 0 min; (b) 3.25 min; (c) 5.75 min; (d) 37 min; (e) 63.8 min; and (f) 317 min. All SEM pictures were magnified 270 times and the scale bar represents a length of 300 µm.
Crystals 07 00040 g012aCrystals 07 00040 g012b
Figure 13. Comparison of the FBRM and IR trend of an experiment from: zone I (a); and zone II (b), yielding star-shaped and mono-crystals, respectively. The solid lines represent the FBRM data and the dashed lines show the relative supersaturation level.
Crystals 07 00040 g013
Figure 14. Normalized square-weighted chord length distribution of final samples obtained after various sonication periods and corresponding FBRM counts at a seeding temperature of 62 °C.
Crystals 07 00040 g014
Figure 15. Measured total FBRM counts at the moment that sonication is disabled as a function of the ultrasonic exposure time after the detection of nucleation, performed at two seeding temperatures. Solid lines represent the data obtained at 57 °C (C0/Csat = 5.28), while the dashed lines indicate results at 70 °C (C0/Csat = 1.77). The final morphology after completion of the crystallization protocol is indicated.
Crystals 07 00040 g015
Figure 16. FBRM, IR and SEM analysis of the crystal morphology obtained after a targeted application of ultrasound during the seeding stage at 70 °C, corresponding to C0/Csat = 1.77. The solid lines represent the FBRM data and the dashed lines show the relative supersaturation level. A comparison is made between: (a,c) limited exposure time which yields star-shaped crystals; and (b,d) the production of mono-crystals after sonication until complete desupersaturation.
Crystals 07 00040 g016
Figure 17. FBRM, IR and SEM analysis of the crystal morphology obtained after a targeted application of ultrasound during the seeding stage at 57 °C, corresponding to C0/Csat = 5.28. The solid lines represent the FBRM data and the dashed lines show the relative supersaturation level. A comparison is made between: (a,c) limited exposure time which yields star-shaped crystals; and (b,d) the production of mono-crystals after sonication until complete desupersaturation.
Crystals 07 00040 g017

