Article

The Effects of ACRT on the Growth of ZnTe Crystal by the Temperature Gradient Solution Growth Technique

1
State Key Laboratory of Solidification Processing, Northwestern Polytechnical University, Xi’an 710072, China
2
Key Laboratory of Radiation Detection Materials and Devices, Ministry of Industry and Information Technology, Northwestern Polytechnical University, Xi’an 710072, China
3
Shaanxi Key Laboratory of Optoelectronic Functional Materials and Devices, Xi’an Technological University, Xi’an 710021, China
*
Author to whom correspondence should be addressed.
Crystals 2017, 7(3), 82; https://doi.org/10.3390/cryst7030082
Submission received: 22 February 2017 / Revised: 9 March 2017 / Accepted: 10 March 2017 / Published: 13 March 2017
(This article belongs to the Section Crystalline Materials)

Abstract

:
A finite element method is used here to simulate the temperature field, the thermosolutal convection, the solute segregation, and the non-isothermal phase transformation during the growth of ZnTe crystal via the temperature gradient solution growth technique (TGSG) with an accelerated crucible rotation technique (ACRT). Three different trapezoid-wave ACRT sequences are proposed, and their effects are examined from the views of the constitutional supercooling and the mixing of the solution. The solution in front of the growth interface can be fully mixed only during the constant rotation stage of the ACRT when there is a clockwise Ekman flow. An inappropriate ACRT can produce excessively strong clockwise and counterclockwise Ekman flows, and this results in constitutional supercooling in front of the central part of the growth interface at the beginning of the stop stage and in front of the peripheral part at the end of the constant rotation stage. By adjusting the acceleration rate of the ampoule rotation, the appropriate Ekman flows can be obtained to well mix the solution and avoid the constitutional supercooling. An appropriate ACRT sequence is provided, which can facilitate the mixing of the solution, avoid constitutional supercooling, and improve the growth interface morphology.

1. Introduction

ZnTe single crystal is a promising material for applications in green light emitting diodes (LEDs), laser diodes (LDs), solar cells, microwave devices, and terahertz devices [1,2,3,4,5,6].
The works on the ZnTe crystal growth, as conducted by Seki et al. [7], Sato et al. [8], Uen et al. [9], and Yang et al. [10] showed that the solution method is a promising way to grow ZnTe crystal with high quality because of its low growth temperature and impurity rejecting effect. Yang et al. [10] introduced the accelerated crucible rotation technique (ACRT) to the temperature gradient solution growth (TGSG) method and attained high quality ZnTe crystals. They emphasized the importance of the ACRT in the mass transfer improvement and final crystalline quality. However, the influencing mechanism of the ACRT on the transport phenomena during the growth of ZnTe crystal by TGSG is still not clear.
The ACRT was first introduced to crystal growth systems by Scheel and Schulz-DuBois [11,12], and it has been applied to crystal growth of II-VI compound semiconductors. Capper and coworkers [13,14,15,16,17,18,19] conducted a series of theoretical and experimental studies on the application of the ACRT to the vertical Bridgman growth of HgCdTe crystal. In the simulation experiments using water or organic liquids, they discussed in details the three important forced convections, i.e., transient Coutte flow, spiral shearing flow, and Ekman flow, appearing in the tall cylindrical crucible with the ACRT [13,14,19]. After giving the determinant conditions of the appearance and stability of the three convections, they provided several important principles to determine ACRT parameters in any specific Bridgman growth system, which have been shown to be very useful for crystal growers [16,18,19]. Using the ACRT, Capper et al. improved the composition uniformity, the grain structure, and the crystalline quality of HgCdTe crystal, while lowering the second phase precipitate levels [13,15,17,18,19]. Later, numerical simulation became the main method of theoretical studies on the ACRT. Yeckel and Derby [20] established a comprehensive finite element model to simulate the high-pressure vertical Bridgman growth of CdZnTe crystal. They investigated the effects of the ACRT on heat transfer, melt convection, growth interface shape, and dilute zinc segregation during the growth. With the finite difference method, Liu et al. [21,22] numerically simulated the ACRT effects on the transport phenomena and the growth interface during Bridgman growth of HgCdTe and CdZnTe crystals, and they found the proper ACRT parameters for their growth systems. Lan [23] investigated the effects of the ACRT and the angular vibration technique (AVT) on the vertical Bridgman crystal growth of CdZnTe, and he found that the two techniques generated similar averaged flow structures and reduced radial segregation. However, AVT seemed more suitable for growth control. Kawaguchi et al. [24] simulated the growth of CdZnTe by the Vertical Gradient Freezing (VGF) method, considering both constant and accelerated crucible rotations. Their simulation results showed that the compositional uniformity was much better with the application of the ACRT. Liu [25] simulated the effects of ACRT’s forced convection on the Bridgman growth of CdZnTe crystal and concluded that ACRT with suitable parameters could enhance the heat transfer in the melt and decrease the radial solute segregation of the crystal. Among all the studies on the ACRT listed here, the basic theoretical study by Capper et al., which omits the natural convections, can be a general qualitative guide to determining the ACRT parameters, but is not enough to apply to a specific crystal growth system. The conclusions obtained by other authors by means of numerical simulation may be true only for their own growth conditions, but they cannot be directly applied to the growth of ZnTe crystal by TGSG.
In the present work, we will apply different ACRT sequences to our previous finite element model about the transport phenomena during the growth of ZnTe by TGSG [26], examine their effects from the views of the constitutional supercooling and solution mixing, and provide theoretical references for optimizing ACRT parameters during the growth of ZnTe by TGSG. Some basic concepts and terms of ACRT related phenomena will be directly used here. More details about them can be found in references [13,14,19]. The main conclusions in reference [26] may also be directly used in this paper.

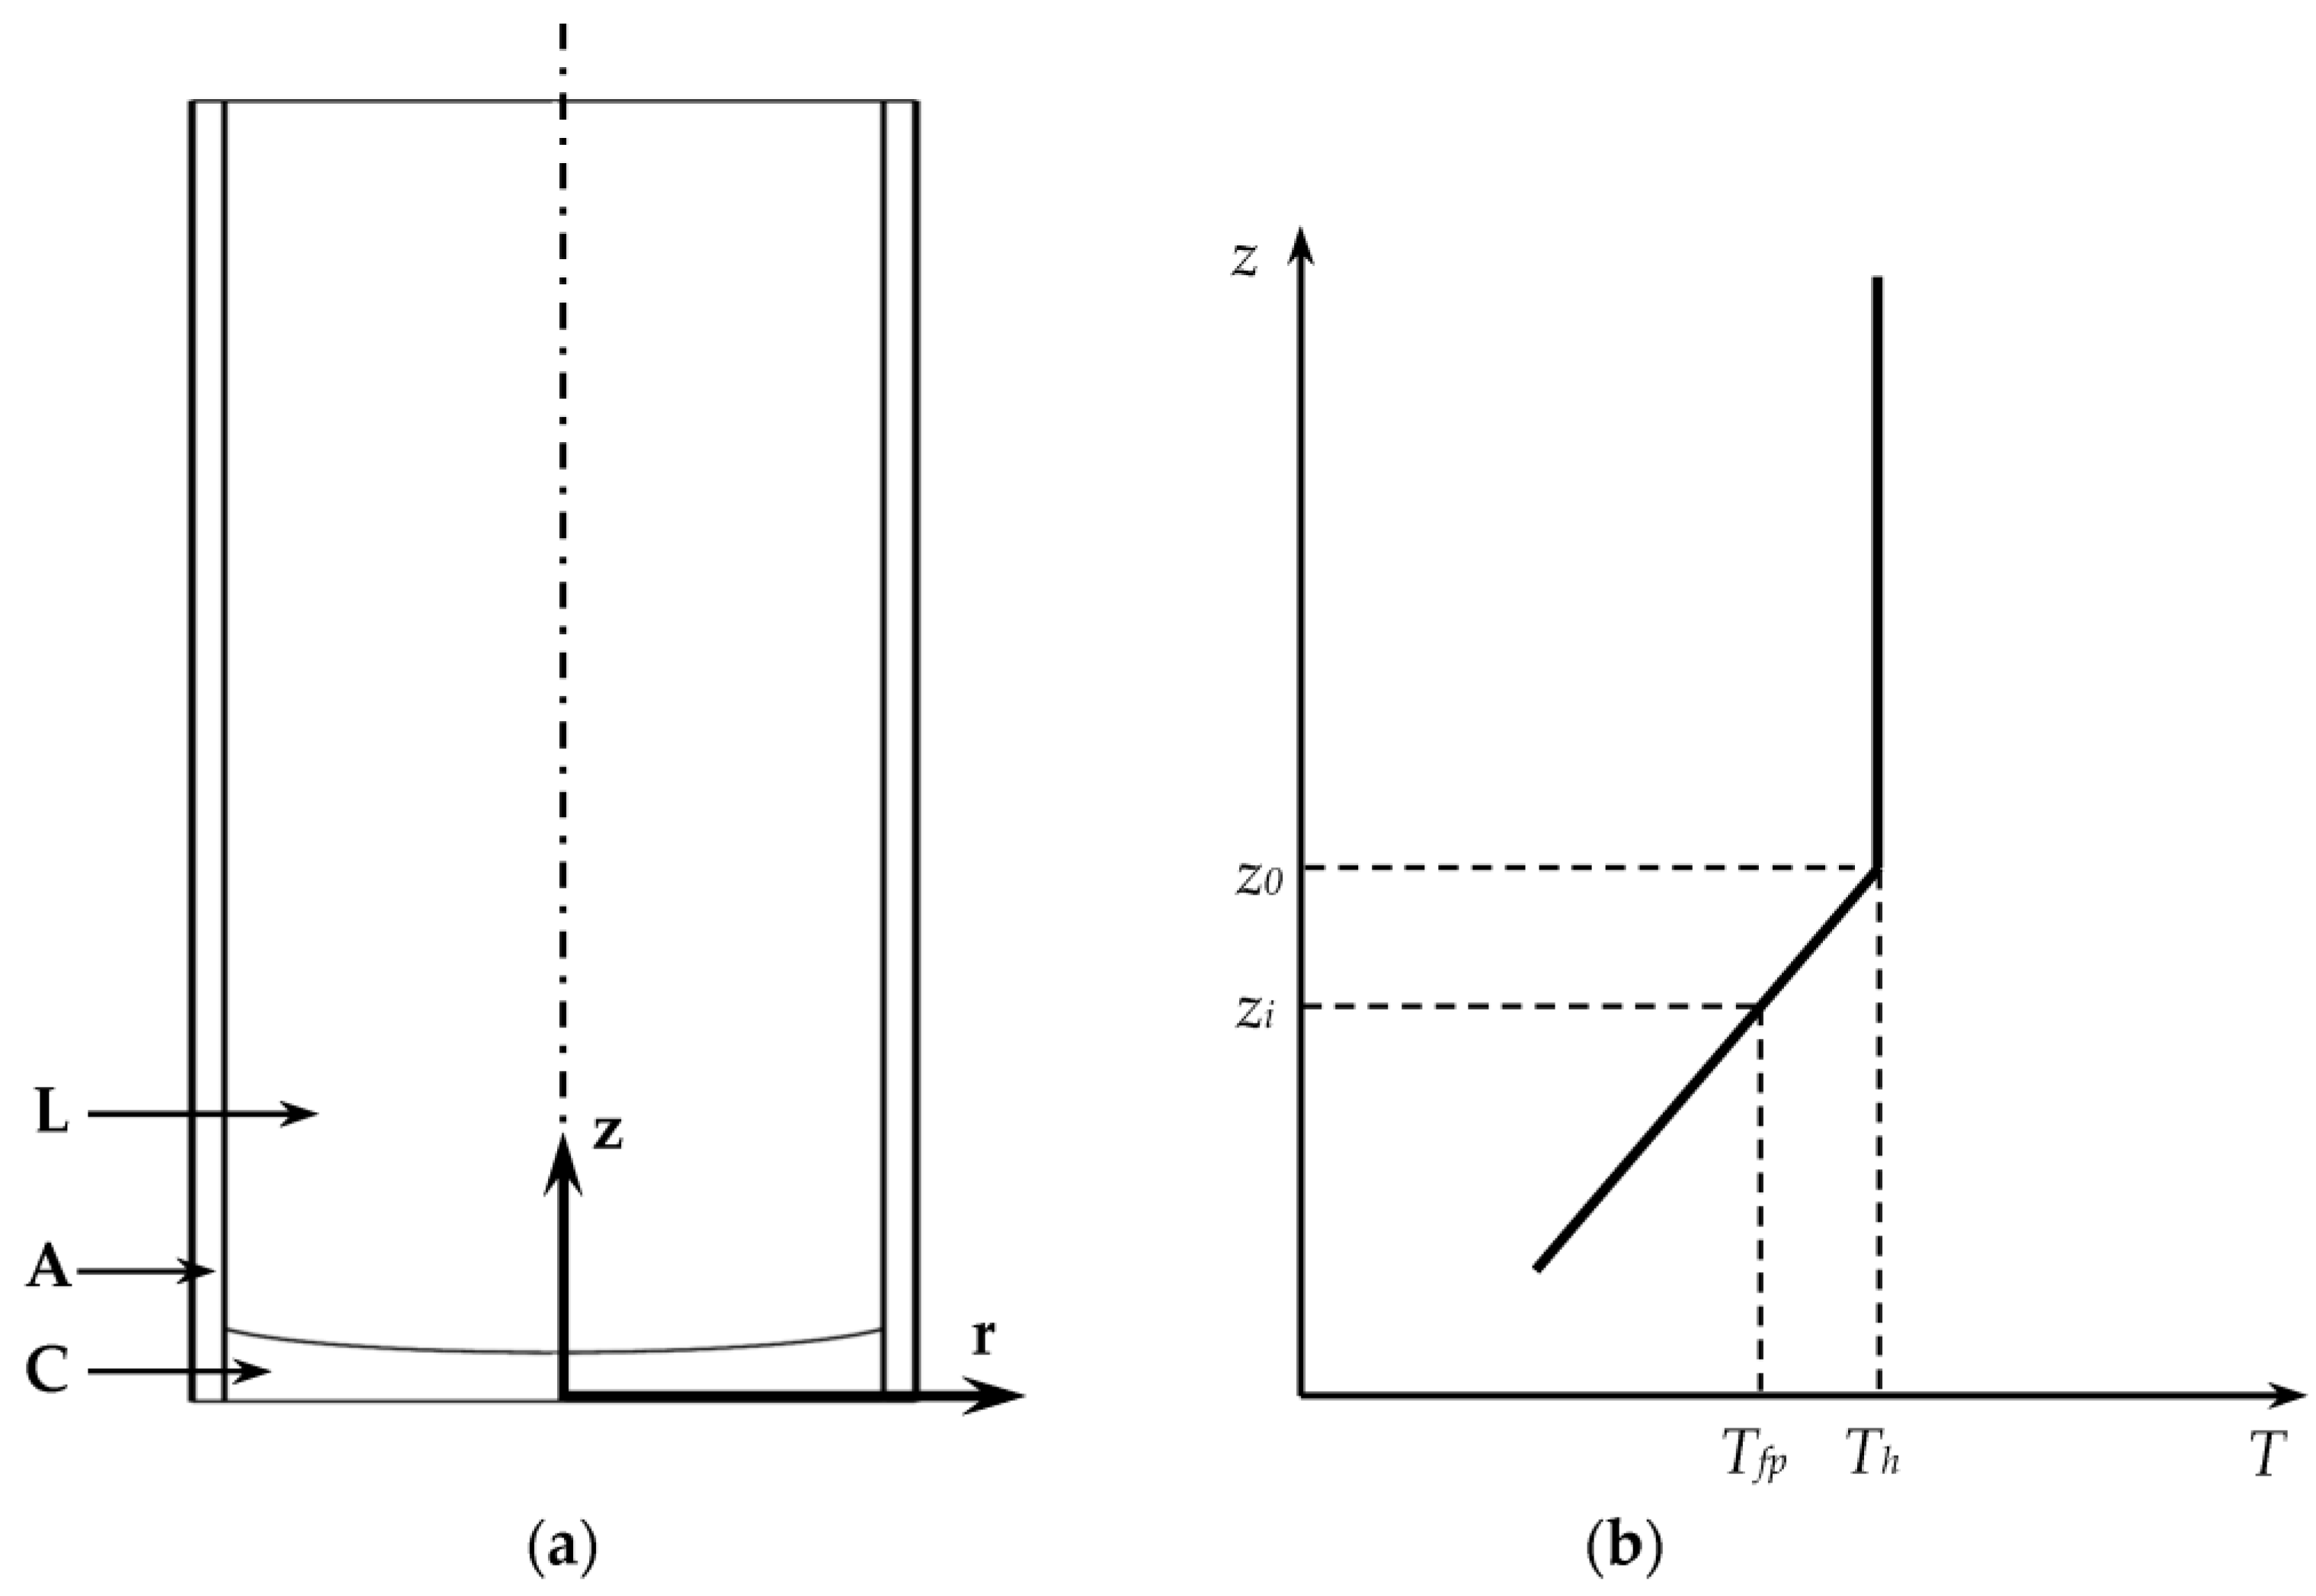
2. Modeling Approaches

Zn exists mainly in the form of ZnTe in Te-rich solution, and the Te-rich solution in this model is taken as a ZnTe-Te binary system [26]. Therefore, the mole fraction of ZnTe is used as the concentration of the solute. We consider the growth of a ZnTe ingot 30 mm in diameter in a vertical gradient freezing system. Figure 1a shows the quartz ampoule and the charge before growth. Mole fractions of Zn and Te in the initial solution are 0.3 and 0.7, respectively. Figure 1b shows the schematic diagram of the ambient temperature profile along the outer wall of the ampoule, with a temperature gradient of 30 K/cm, which will be applied in all the simulations in this paper.
The current model is based on our previous finite element model on the growth of ZnTe by TGSG [26], which accounts for the heat transfer, the thermosolutal convection, the solute segregation, and the non-isothermal phase transformation. The control equations here about the heat transfer, momentum transfer, and mass transfer are all the same as those in the previous model, with the same boundary conditions. However, as the ACRT is applied which makes the ampoule rotate about its center line, the no-slip condition of the velocity at the ampoule wall and the growth interface in reference [26] should be replaced by
v = Ωreθ
where Ω is the rotation rate of the ampoule and eθ is a unit vector in the azimuthal direction. Note that v in the current model consists of axial, radial and azimuthal components, which is different from the previous model.
All the control equations and the boundary conditions are solved by a finite element-based code, Cats2D [27]. We first calculate a steady state solution about the temperature and flow fields with a static temperature profile. Then, a transient simulation without the ACRT is started based on the steady state solution until the growth time reaches to 20 h, with a time step of 1440 s. When the ACRT is applied, the flow and the concentration fields change so frequently that the time step has to be as small as 1.44 s.

3. Results and Discussion

We will use the distributions of the stream function Ψ (mm3/s) and the mole fraction C of ZnTe to represent the flow and concentration fields in the solution, respectively.

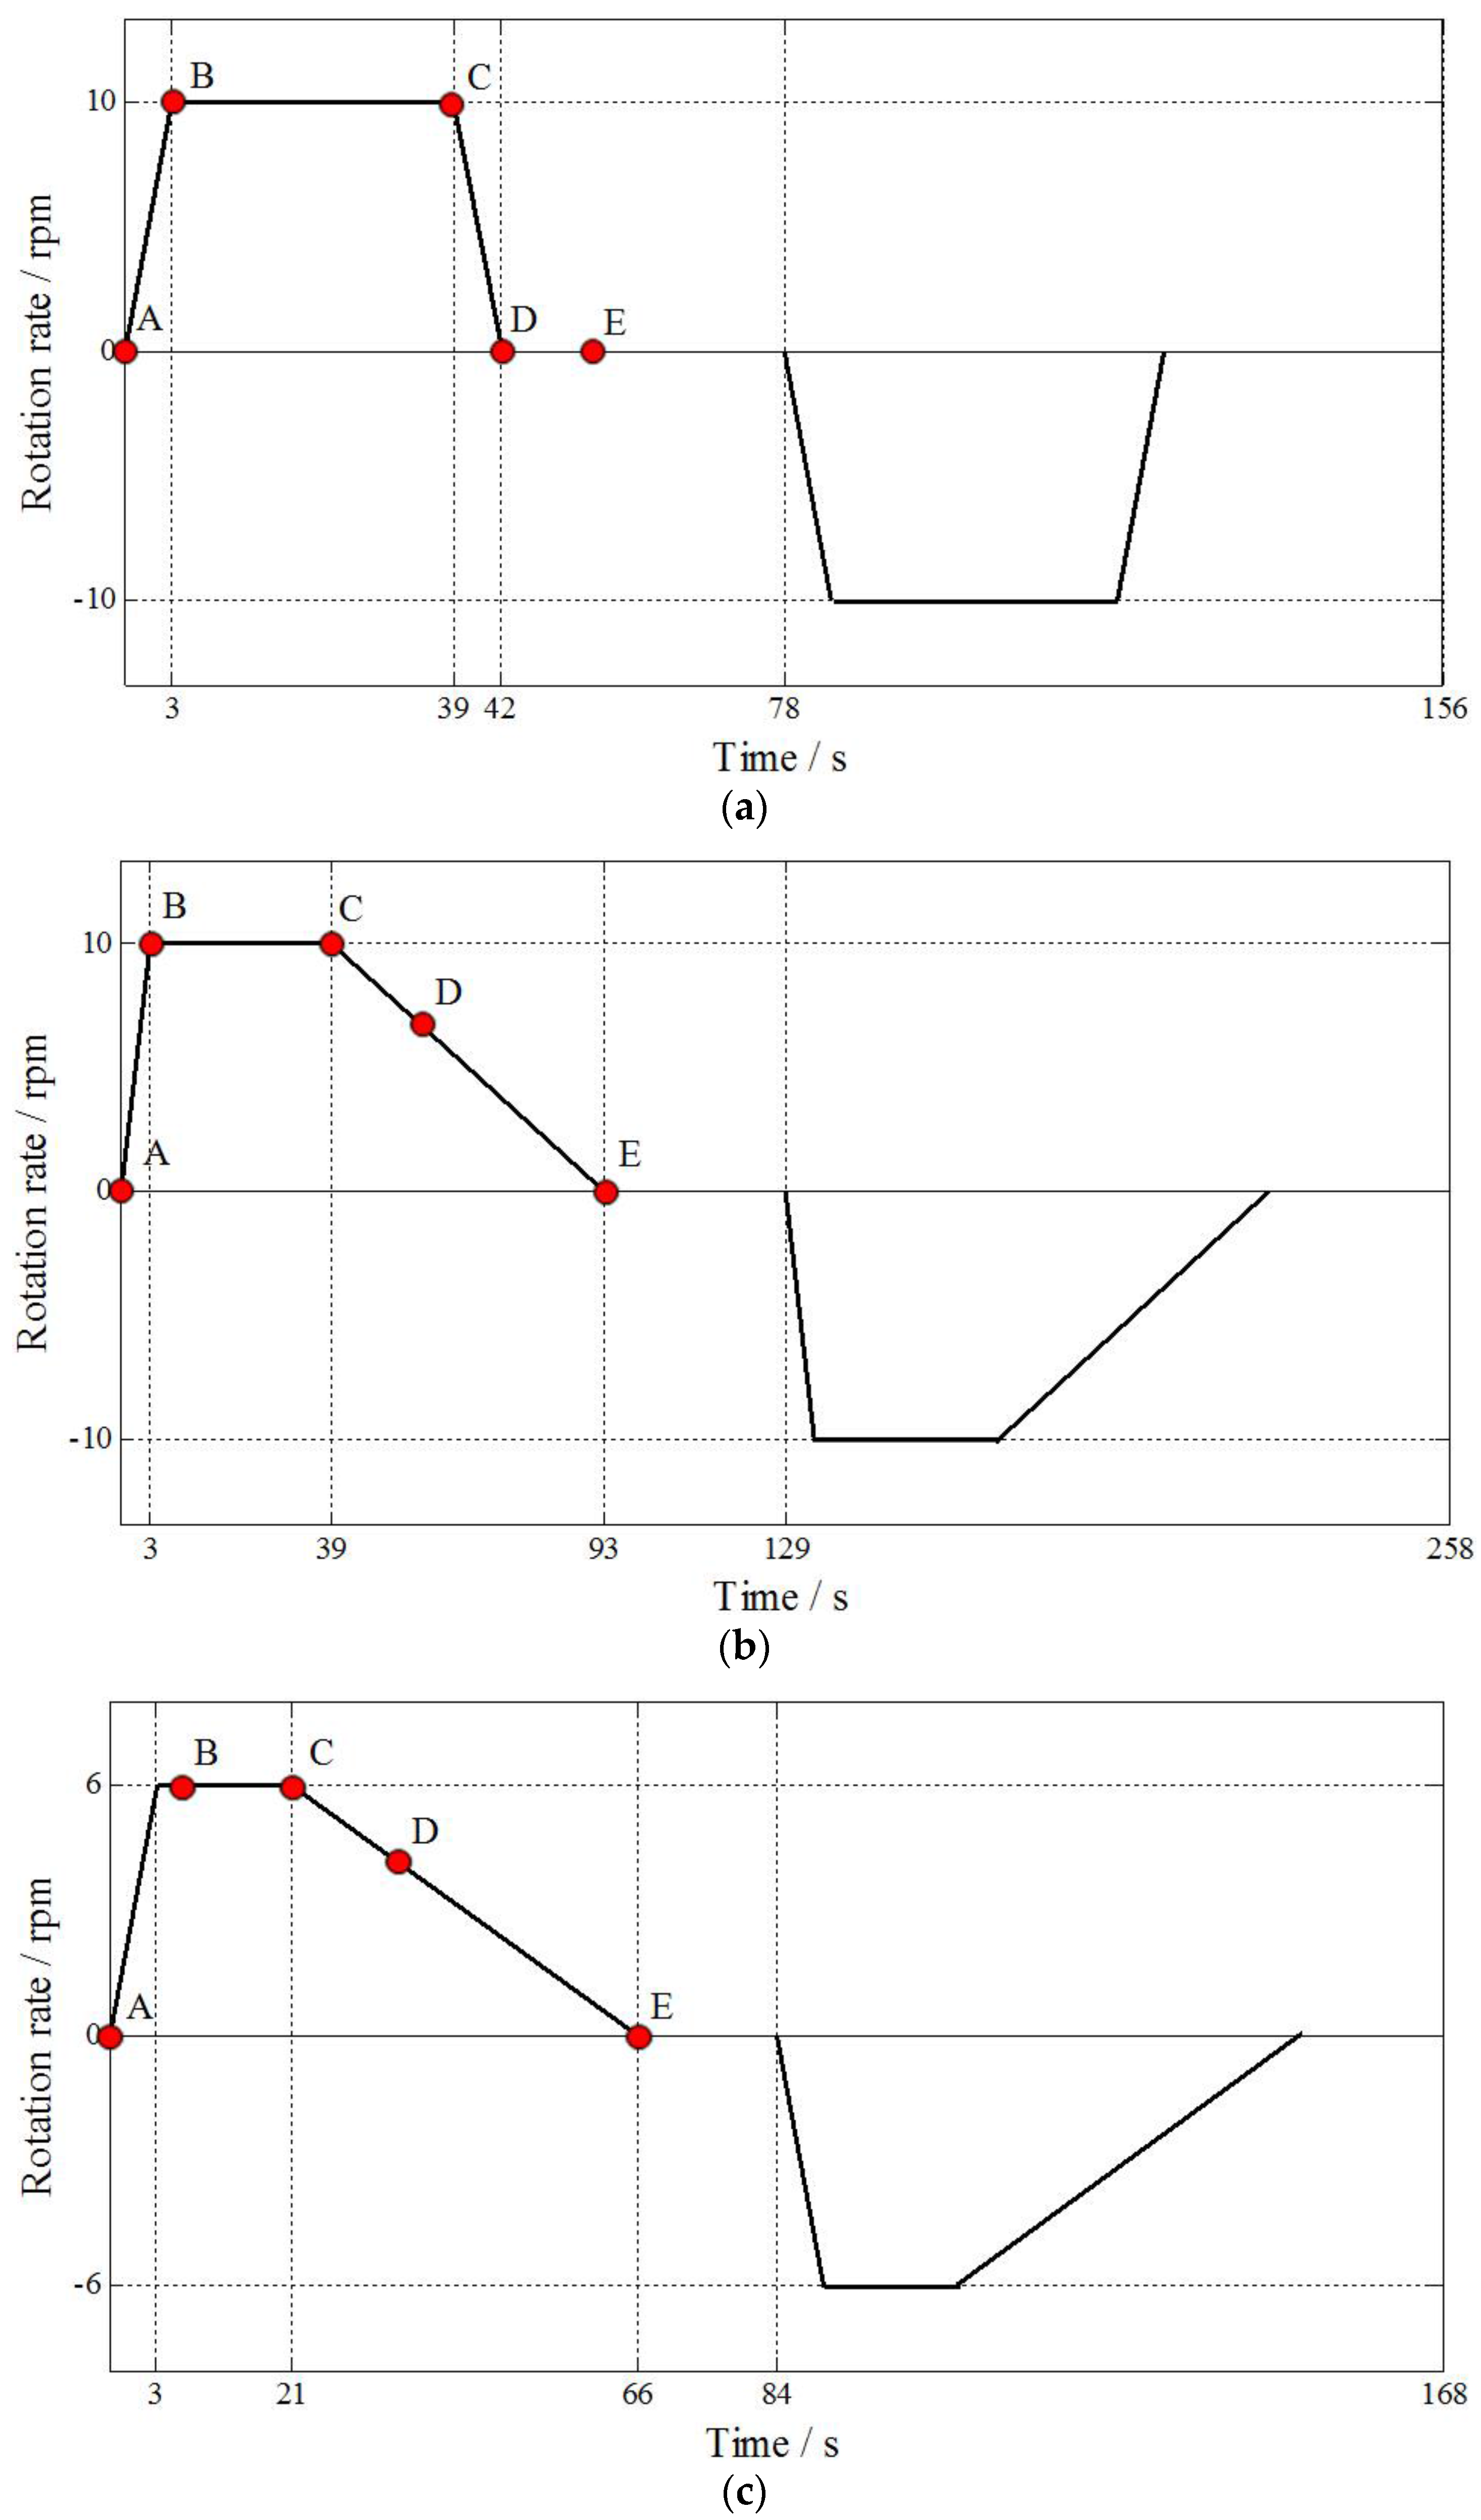
3.1. Computational Strategy

Figure 2 shows the flow and concentration fields in the solution when the growth reaches to t = 20 h without the ACRT. There is a clockwise vortex in the top part of the solution, nearly no vortex in the middle part, and a counterclockwise vortex in the bottom. Correspondingly, the concentration field consists of three different regions, i.e., a well mixed region, a diffusion region, and a partly mixed region. The solution in front of the peripheral part of the growth interface is relatively well mixed, while the solution in front of the central part is hardly influenced by the convection. The diluted solution with high density and low saturation temperature accumulates in front of the central part of the growth interface, making the growth interface differentiate into two distinct parts. The simulation result at t = 20 h will be taken as the initial state for all the following simulations with the ACRT in this paper.
In this model, we employ the trapezoid-wave ACRT sequence, which includes acceleration stage, constant rotation stage, deceleration stage, and the stop stage in every half period. To determine the main parameters of the ACRT, i.e., the maximum rotation rate, the constant rotation time, and the stop time, we first obtained the probable value ranges according to the general theoretical study by Capper et al. [16,19] on ACRT parameters, applied them to our numerical model on ZnTe growth, and made necessary modifications to ensure that the solution in front of the growth interface could be well mixed, and that the run and stop times were comparable to the duration of the Ekman flow.
From t = 20 h on, we started the ACRT with three different ACRT sequences, namely, Sequences 1, 2, and 3, which are all variations of trapezoid-wave ACRT sequence. The first period of each sequence is shown in Figure 3. Changes of the transport phenomena during the first half of one period are almost the same as those during the second half, except the spiral shearing flow, which has little effect on the axial or radial transfer of the solute [19]. Distributions of the convections and the concentration were very sensitive to the ACRT sequences, and regular periodic changes of the convections and the concentration could be quickly obtained just half a period after the ACRT began. In the following analyses, we will focus on the first half of the 5th period of each sequence. To study the periodic changes of the transport phenomena, we selected five key points in each ACRT sequence and marked them as A, B, C, D, and E. Hereafter, “result at 5A” will be used to represent the result at Point A of the 5th period; “5B,” “5C,” “5D,” and “5E” will be similarly used. The maximum rotation rate, the duration of each stage of the sequences, as well as the positions of the five key points are all detailed in Figure 3.

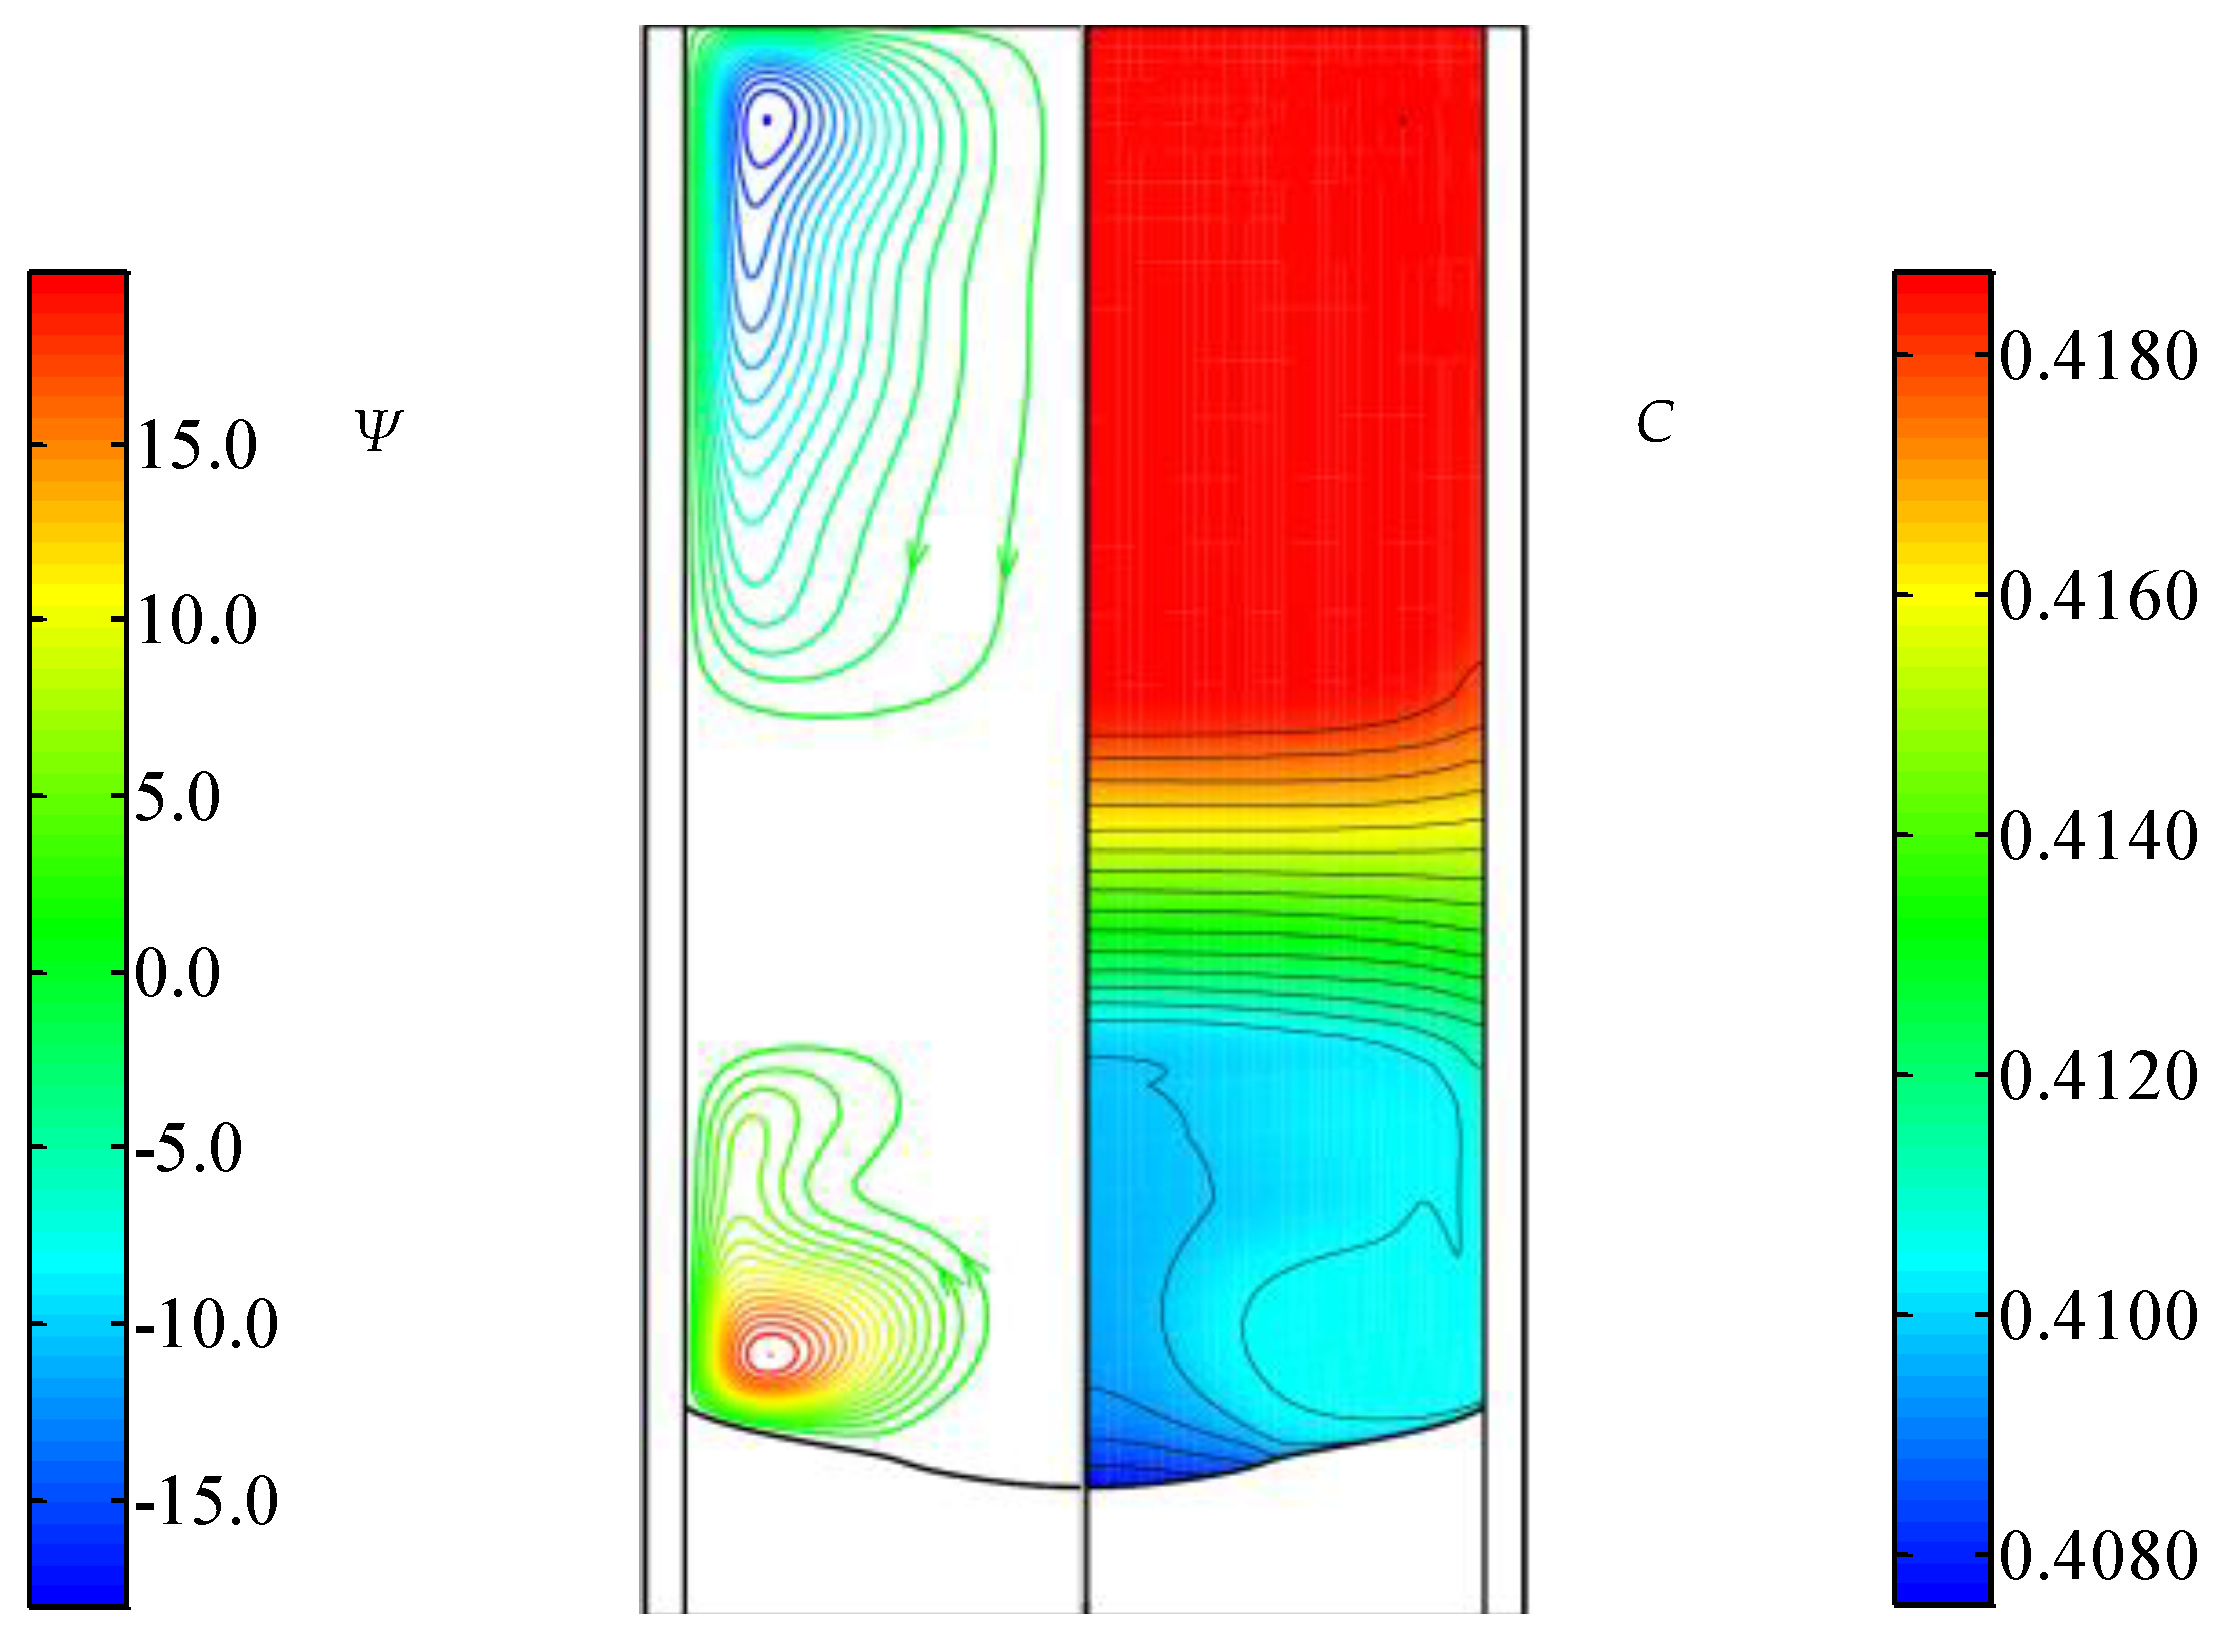
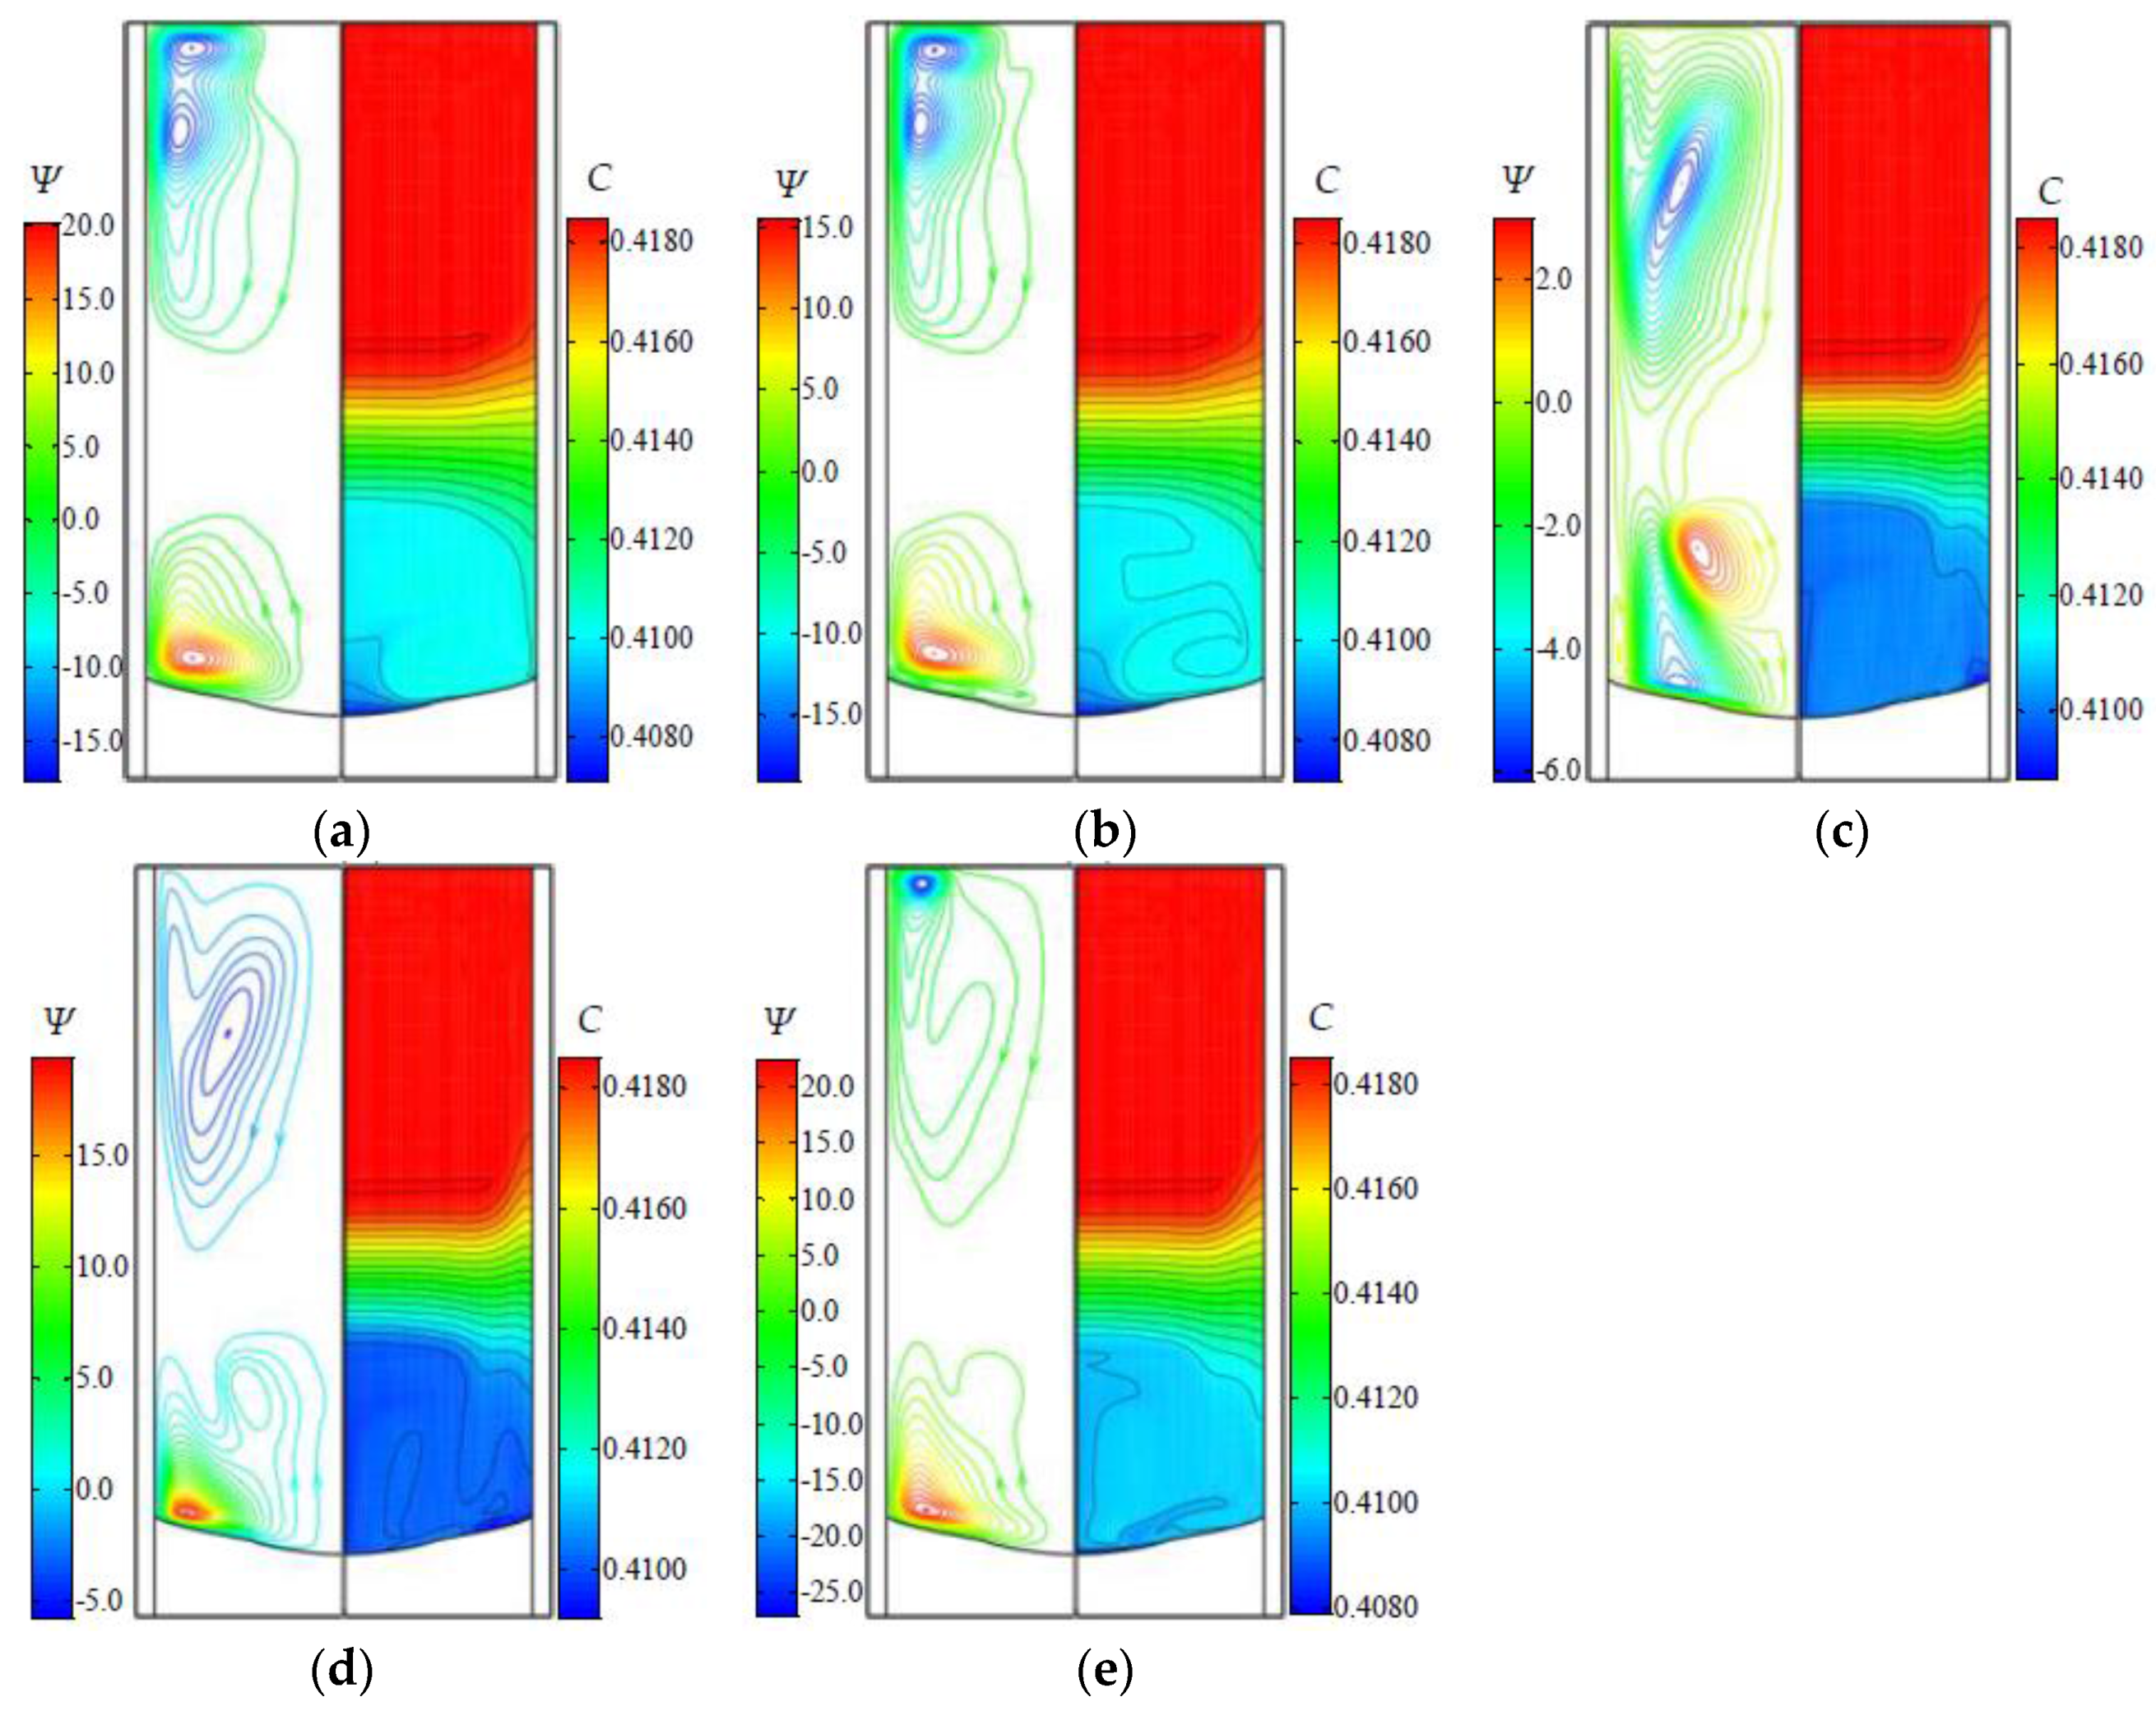
3.2. The Flow and Concentration Fields

Figure 4 shows the evolution of the flow and concentration fields during the first half of the 5th ACRT period when Sequence 1 is applied to the growth system. Results at 5A, the beginning of the acceleration stage or the end of the stop stage, are shown in Figure 4a. We find that the distributions of convections and concentration are similar to those without the ACRT (see Figure 2) except that there are two counterclockwise vortexes in the top part of the solution. After the acceleration stage, a clockwise Ekman flow appears between the growth interface and the existing counterclockwise vortex (Figure 4b). Later, the counterclockwise vortex weakens and moves upwards gradually, while the Ekman flow strengthens and expands to the whole bottom part of the solution (Figure 4c). The clockwise Ekman flow can efficiently drive the heavy dilute solution away from the center of the growth interface and mix the solution in front of the growth interface, although that there is a small amount of dilute solution accumulating near the corner of the growth interface and the ampoule inner wall (Figure 4c). After the constant rotation stage, the ampoule decelerates and stops within a very short time (3 s), during which the previous Ekman flow disappears and a new counterclockwise vortex emerges at the corner of the growth interface and the ampoule inner wall (Figure 4d). This new counterclockwise vortex is the mixture of the natural convection and the emerging counterclockwise Ekman flow, which forms due to the quick deceleration of the ampoule. During the following stop stage, the counterclockwise vortex occupies a very large region, but still cannot influence the solution at the center of the growth interface. Therefore, when swept to the center part of the growth interface by the counterclockwise vortex, the heavy dilute solution will accumulate there (Figure 4e), resulting in a steep concentration gradient region until the end of the stop stage, identical to the results at 5A (Figure 4a). In summary, with the application of the ACRT, the rotation of the ampoule accelerates and decelerates periodically in two opposite directions, the clockwise and counterclockwise Ekman flows appear and disappear alternately, and the dilute solution accumulates in front of the central part of the growth interface and then mixes into the bulk solution repeatedly.
The evolution of the flow and concentration fields during the first half of the 5th ACRT period with Sequence 2 applied is shown in Figure 5. Results at 5A, 5B, and 5C (Figure 5a–c) are quite similar to those shown in Figure 4, as the acceleration and constant rotation stages in Sequences 1 and 2 are the same (Figure 3). As shown in Figure 5c, there is also a narrow region near the corner of the growth interface and the ampoule inner wall, where a small amount of dilute solution accumulates, identical to the results shown in Figure 4c. The results at 5D and 5E are 18 s and 54 s after 5C, respectively. Such a long deceleration stage makes the recovery of the counterclockwise convection in front of the growth interface much slower than that when Sequence 1 is applied. The accumulation of the dilute solution at the center of the growth interface is also much slower, which is able to avoid the appearance of an overly steep concentration gradient. After 5E, the low concentration region at the center of the growth interface extends gradually, while the concentration gradient keeps decreasing until the end of the stop stage. Therefore, with Sequence 2, the solution in front of the growth interface can still be well mixed for quite a while in each ACRT period, and the concentration gradient in front the center of the growth interface will be much lower than that when Sequence 1 is applied, while the accumulation of the dilute solution near the corner of the growth interface and the ampoule inner wall is not eliminated.
With Sequence 3 applied to the growth system, the flow and concentration fields in the solution during the first half of the 5th ACRT period are shown in Figure 6. The periodic change of the convections and the concentration is very similar to that in the case of Sequence 2, because both Sequences 2 and 3 have a sudden acceleration stage and a very long deceleration stage. However, in the case of Sequence 3 with a low maximum rotation rate of 6 rpm, the clockwise Ekman flow is much smaller and weaker (Figure 6c) and is able to avoid the quick accumulation of the dilute solution near the corner of the growth interface and the ampoule inner wall, so that the concentration gradient in this region will not be too high. Therefore, with Sequence 3 applied, the concentration gradient in front of both the central and the peripheral parts of the growth interface should be much lower, which will be analyzed in the following section.

3.3. Analysis on the Constitutional Supercooling

We selected two representative positions on the growth interface, Points O (the center of the growth interface) and P (3 mm from the growth interface edge), to analyze the constitutional supercooling, because very severe (if not the severest) constitutional supercooling usually occurs near Point O at the beginning of the stop stage and near Point P at the end of the constant rotation stage. Obviously, constitutional supercooling occurs whenever the saturation temperature of the solution is higher than the actual temperature.
For Point O, we plot the actual and saturation temperatures of the solution along the ampoule centerline at 5E, with the application of the above three ACRT sequences (Figure 7a–c). The temperature gradients in front of Point O in the three cases are all about 10.0 K/cm. According to Figure 7a, the saturation temperature exceeds the actual temperature within a 0.1 cm wide region in front of Point O at 5E with Sequence 1 applied, indicating that obvious constitutional supercooling occurs, because the accumulation of the dilute solution is so fast that a very steep concentration gradient forms in front of Point O at 5E (Figure 4e). However, in the cases of Sequences 2 and 3 (Figure 7b,c), constitutional supercooling in front of Point O at 5E is almost avoided. During the long deceleration stage in the case of Sequence 2 or Sequence 3, developments of the counterclockwise convection and the low concentration region are so slow that no steep concentration gradient forms in front of the growth interface (Figure 5e and Figure 6e), and constitutional supercooling can be avoided. Therefore, a relatively long deceleration stage in the ACRT can reduce the probability of the constitutional supercooling in front of the central part of the growth interface.
For Point P, we plot the actual and the saturation temperatures of the solution along a plumb line (not vertical to the growth interface) at 5C for the three cases (Figure 7d–f). The temperature gradients in front of Point P in the three cases are all about 11.5 K/cm. Constitutional supercooling almost occurs in the cases of Sequences 1 and 2 (Figure 7d,e), but is well avoided in the case of Sequence 3 (Figure 7f). We know that the clockwise Ekman flow in the case of Sequence 3 is obviously weaker than that in the case of Sequence 1 or Sequence 2. In the case of Sequence 3, the accumulation of dilute solution in front of Point P is so slow that there is no steep concentration gradient or constitutional supercooling (Figure 6c). Thus, in the current growth system, a low maximum rotation combined with a long deceleration stage can help avoid the constitutional supercooling in front of both the central and the peripheral parts of the growth interface.

3.4. Effects of ACRT on the Growth Interface Morphology

When the ACRT is applied, the change of the growth interface morphology is much slower than that of the transport phenomena. We continue the simulations in Section 3.2 until the growth reaches the end of an ACRT period that is immediately after t = 26.2 h (note that the rotation starts from t = 20 h), and plot the growth interfaces in Figure 8. For comparison, the growth interface at t = 26.2 h without the ACRT is also plotted. It is clearly seen that the growth interface with the ACRT no longer differentiates into two distinct parts, as the growth interface does without the ACRT, indicating that all the three ACRT sequences can mix the solution in front of the growth interface very well. In addition, the growth interfaces in the three cases with the ACRT are almost the same as one another, indicating that a maximum rotation of 6 rpm seems sufficient to thoroughly mix the bottom part of the solution.

4. Conclusions

In the numerical simulation about the growth of ZnTe crystal by the temperature gradient solution growth technique, we applied three different trapezoid-wave ACRT sequences to the growth system and examined their effects from the views of the constitutional supercooling and the mixing of the solution. The conclusions are as follows.
With the application of the trapezoid-wave ACRT sequence, the rotation of the ampoule accelerates and decelerates periodically in two opposite directions, the clockwise and counterclockwise Ekman flows appear and disappear alternately, and the dilute solution accumulates in front of the central part of the growth interface and then mixes into the bulk solution repeatedly. The solution in front of the growth interface can be well mixed only during the constant rotation stage when the clockwise Ekman flow exists. During the stop stage, however, a large amount of a dilute solution will accumulate in front of the center of the growth interface.
An inappropriate ACRT may result in constitutional supercooling. With the application of an ACRT that can produce excessively strong clockwise and counterclockwise Ekman flows, constitutional supercooling will occur in front of the central part of the growth interface at the beginning of the stop stage, and in front of the peripheral part of the growth interface at the end of the constant rotation stage. The reason is that the strong convection drives the dilute solution to accumulate so fast that a high concentration gradient forms close to the growth interface where the temperature gradient does not change very much, and constitutional supercooling easily occurs.
By adjusting the acceleration of the ampoule rotation, such as lengthening the deceleration stage or decreasing the maximum rotation, appropriate Ekman flows can be obtained, to well mix the solution and avoid the constitutional supercooling.
The ACRT Sequence 3 shown in Figure 3c was proved to be effective in facilitating the mixing of the solution, avoiding constitutional supercooling and preventing the growth interface from differentiating into two distinct parts, as the growth interface does without the ACRT.

Acknowledgments

This work was supported by the National Key R&D Program of China (2016YFB0402405, 2016YFF0101301), Special Fund of National Key Scientific Instruments and Equipments Development (2011YQ040082), the National 973 Project of China (2011CB610400), the 111 Project of China (B08040), the National Natural Science Foundation of China (NNSFC-51672216, 61274081, 51372205, 51502244), the Fundamental Research Funds for the Central Universities (3102015BJ(II)ZS014, G2016KY0104, 3102016ZY011), the Research Fund of the State Key Laboratory of Solidification Processing(NWPU, SKLSP201410). The computer code Cats2D was used with permission from A. Yeckel and J.J. Derby, University of Minnesota.

Author Contributions

Liying Yin developed the mathematical model, carried out the simulations, analyzed the results, and wrote the manuscript. Wanqi Jie led the project, conceived the ideas, and revised the manuscript. Tao Wang developed the physical model and analyzed the results. Boru Zhou, Fan Yang, and Ruihua Nan helped in the numerical method and the interpretation of the results.

Conflicts of Interest

The authors declare no conflict of interest.

References

  1. Yoshino, K.; Yoneta, M.; Ohmori, K.; Saito, H.; Ohishi, M.; Yabe, T. Annealing effects of a high-quality ZnTe substrate. J. Electron. Mater. 2004, 33, 579–582. [Google Scholar] [CrossRef]
  2. Traversa, M.; Lovergine, N.; Prete, P.; Tapfer, L.; Mancini, A.M. Homoepitaxy of ZnTe on (100) oriented substrates: Technology issues and MOVPE growth aspects. Cryst. Res. Technol. 2005, 40, 1003–1010. [Google Scholar] [CrossRef]
  3. Kaneta, A.; Adachi, S. Photoreflectance study in the E1 and E1 + Δ1 transition regions of ZnTe. J. Phys. D Appl. Phys. 2000, 33, 901–905. [Google Scholar] [CrossRef]
  4. Rusu, G.I.; Prepelita, P.; Apetroaei, N.; Popa, G. On the electronic transport and optical properties of ZnTe thin films. J. Optoelectron. Adv. Mater. 2005, 7, 829–883. [Google Scholar]
  5. Blanchard, F.; Razzari, L.; Bandulet, H.C.; Sharma, G.; Morandotti, R.; Kieffer, J.C.; Ozaki, T.; Reid, M.; Tiedje, H.F.; Haugen, H.K.; et al. Generation of 1.5 μJ single-cycle terahertz pulses by optical rectification from a large aperture ZnTe crystal. Opt. Express 2007, 15, 13212–13220. [Google Scholar] [CrossRef] [PubMed]
  6. Ferguson, B.; Zhang, X.C. Materials for terahertz science and technology. Nat. Mater. 2002, 1, 26–33. [Google Scholar] [CrossRef] [PubMed]
  7. Seki, Y.; Sato, K.; Oda, O. Solution growth of ZnTe single crystals by the vertical Bridgman method using a hetero-seeding technique. J. Cryst. Growth 1997, 171, 32–38. [Google Scholar] [CrossRef]
  8. Sato, K.; Seki, Y.; Oda, O. Solution growth combined with solvent evaporation: A novel technique in solution growth. Jpn. J. Appl. Phys. 1999, 38, 5772–5774. [Google Scholar] [CrossRef]
  9. Uen, W.Y.; Chou, S.Y.; Shin, H.Y.; Liao, S.M.; Lan, S.M. Characterizations of ZnTe bulks grown by temperature gradient solution growth. Mater. Sci. Eng. B 2004, 106, 27–32. [Google Scholar] [CrossRef]
  10. Yang, R.; Jie, W.; Liu, H. Growth of ZnTe single crystals from Te solution by vertical Bridgman method with ACRT. J. Cryst. Growth 2014, 400, 27–33. [Google Scholar] [CrossRef]
  11. Scheel, H.J.; Schulz-Dubois, E.O. Flux growth of large crystals by accelerated crucible-rotation technique. J. Cryst. Growth 1971, 8, 304–306. [Google Scholar] [CrossRef]
  12. Schulz-Dubois, E.O. Accelerated crucible rotation: Hydrodynamics and stirring effect. J. Cryst. Growth 1972, 12, 81–87. [Google Scholar] [CrossRef]
  13. Capper, P.; Gosney, J.J.G.; Jones, C.L. Application of the accelerated crucible rotation technique to the Bridgman growth of CdxHg1−xTe: Simulations and crystal growth. J. Cryst. Growth 1984, 70, 356–364. [Google Scholar] [CrossRef]
  14. Capper, P.; Gosney, J.J.G.; Jones, C.L.; Pearce, E.J. Fluid flows induced in tall narrow containers by A.C.R.T. J. Electron. Mater. 1986, 15, 361–370. [Google Scholar] [CrossRef]
  15. Capper, P.; Gosney, J.J.G.; Jones, C.L.; Kenworthy, I. Bridgman growth of CdxHg1−xTe using ACRT. J. Electron. Mater. 1986, 15, 371–376. [Google Scholar] [CrossRef]
  16. Brice, J.C.; Capper, P.; Jones, C.L.; Gosney, J.J.G. ACRT: A review of models. Prog. Cryst. Growth Charact. 1986, 13, 197–229. [Google Scholar] [CrossRef]
  17. Capper, P.; Brice, J.C. Interfaces and flow regimes in ACRT grown CdxHg1−xTe crystals. J. Cryst. Growth 1988, 89, 171–176. [Google Scholar] [CrossRef]
  18. Coates, W.G.; Capper, P.; Jones, C.L.; Gosney, J.J.G.; Ard, C.K.; Kenworthy, I.; Clark, A. Effect of ACRT rotation parameters on Bridgman grown CdxHg1−xTe crystals. J. Cryst. Growth 1989, 94, 959–966. [Google Scholar] [CrossRef]
  19. Capper, P. The role of accelerated crucible rotation in the growth of Hg1−xCdxTe and CdTe/CdZnTe. Prog. Cryst. Growth Charact. Mater. 1994, 28. [Google Scholar] [CrossRef]
  20. Yeckel, A.; Derby, J.J. Effect of accelerated crucible rotation on melt composition in high-pressure vertical Bridgman growth of cadmium zinc telluride. J. Cryst. Growth 2000, 209, 734–750. [Google Scholar] [CrossRef]
  21. Liu, X.; Jie, W.; Zhou, Y. Numerical analysis on Hg1−xCdxTe growth by ACRT-VBM. J. Cryst. Growth 2000, 209, 751–762. [Google Scholar] [CrossRef]
  22. Liu, X.; Jie, W.; Zhou, Y. Numerical analysis of CdZnTe crystal growth by the vertical Bridgman method using the accelerated crucible rotation technique. J. Cryst. Growth 2000, 219, 22–31. [Google Scholar]
  23. Lan, C. Flow and segregation control by accelerated rotation for vertical Bridgman growth of cadmium zinc telluride: ACRT versus vibration. J. Cryst. Growth 2005, 274, 379–386. [Google Scholar] [CrossRef]
  24. Kawaguchi, Y.; Yasuda, H.; Okano, Y.; Dost, S. Numerical simulation of crystal growth of CdZnTe by Vertical Gradient Freezing method-Crucible Rotation Effect. Int. J. Transp. Phenom. 2005, 7, 175–187. [Google Scholar]
  25. Liu, J. ACRT forced convection and its effects on solute segregation and heat and mass transfer during single crystal growth. Cryst. Res. Technol. 2008, 43, 396–408. [Google Scholar]
  26. Yin, L.; Jie, W.; Wang, T.; Zhou, B.; Yang, F. The transport phenomena during the growth of ZnTe crystal by the temperature gradient solution growth technique. J. Cryst. Growth 2017, 461, 16–24. [Google Scholar] [CrossRef]
  27. Yeckel, A.; Goodwin, R.T. Cats2D: Crystallization and Transport Simulator, User Manual. 2015. Available online: http://cats2d.com/overview.html (accessed on 9 July 2015).
Figure 1. Schematic diagram of the growth system. (a) The ampoule and the charge. Regions A, C and L represent the ampoule, the crystal, and the solution, respectively. The inner diameter, outer diameter, and the length of the ampoule are 30 mm, 33 mm, and 60 mm, respectively; (b) The temperature boundary condition. zi and Tfp represent the position of the growth interface and the growth temperature, respectively.
Crystals 07 00082 g001
Figure 2. Flow (Ψ (mm3/s)) and concentration (C) fields at t = 20 h without the ACRT. The left side represents the contours of the stream function in the solution region, where the flow direction is indicated by the arrows, and the right side represents the concentration field of ZnTe. The positive and negative values of Ψ represent the counterclockwise and clockwise flows, respectively.
Crystals 07 00082 g002
Figure 3. ACRT sequences. (a) Sequence 1, E is 6 s after D; (b) Sequence 2, D is 18 s after C; (c) Sequence 3, B is 3 s after the beginning of the constant rotation stage, D is 15 s after C.
Crystals 07 00082 g003
Figure 4. Flow (Ψ (mm3/s)) and concentration (C) fields in the solution during the first half of the 5th period of ACRT Sequence 1. (ae) Results at 5A–5E, respectively.
Crystals 07 00082 g004
Figure 5. Flow (Ψ (mm3/s)) and concentration (C) fields in the solution during the first half of the 5th period of ACRT Sequence 2. (ae) Results at 5A–5E, respectively.
Crystals 07 00082 g005
Figure 6. Flow (Ψ (mm3/s)) and concentration (C) fields in the solution during the first half of the 5th period of ACRT Sequence 3. (ae) Results at 5A–5E, respectively.
Crystals 07 00082 g006
Figure 7. The actual (the blue solid curves) and the saturation (the red dashed curves) temperatures of the solution in front of Points O and P on the growth interface. Results for the solution in front of Point O at 5E of ACRT Sequences 1, 2, and 3 are shown in (a), (b), and (c), respectively. Results for the solution in front of Point P at 5C of ACRT Sequences 1, 2, and 3 are shown in (d), (e), and (f), respectively.
Crystals 07 00082 g007
Figure 8. The growth interface morphology at about t = 26.2 h in the cases of no ACRT and of Sequences 1, 2, and 3.
Crystals 07 00082 g008

