
Crystallographic Characteristics of Hydroxylapatite in Hard Tissues of Cololabis saira

1
School of Earth and Space Sciences, Peking University, Beijing 100871, China
2
Key Laboratory of Orogenic Belt and Crustal Evolution, Ministry of Education, Beijing 100871, China
*
Author to whom correspondence should be addressed.
Crystals 2017, 7(4), 103; https://doi.org/10.3390/cryst7040103
Submission received: 9 January 2017
/
Revised: 20 March 2017
/
Accepted: 1 April 2017
/
Published: 5 April 2017
(This article belongs to the Special Issue Mineral Crystallinity)
Abstract
:X-ray micro diffractometry, transmission electron microscopy, environmental scanning electron microscopy, energy dispersive spectrometry and Fourier transform infrared were employed to investigate the crystallographic characteristics of the inorganic mineral existing in bones of Cololabis saira. The results show that the crystal phase in hard tissues of Cololabis saira is hydroxylapatite (HAP). Chemical composition analysis reveals that the HAP in hard tissues lacks P and is rich in Ca. Refined lattice parameters of HAP show that a = 0.93622–0.93787 nm and c = 0.68549–0.69011 nm. The domain sizes calculated from the Scherrer equation are 18.9–20.7 nm long along the c-axis and about 6.2 nm thick perpendicular to the c-axis, and is well evidenced by TEM data. The crystallinity of HAP is poor compared with natural HAP. In situ X-ray micro diffraction patterns measured from raw hard tissue show a very strong reflection from the (002) and (004) lattice planes on the cross-section of bone and nearly no reflection from the (002) and (004) lattice planes on elongation surface of bone. Compared with the XRD pattern of standard HAP data and from the textural index R values, it indicates that the HAP in the hard tissues of Cololabis saira has a strong preferring orientation along the crystallographic c-axis. This is verified by Fourier transform infrared on the elongation surface of bone and by selected area electron diffraction of HRTEM on the section perpendicular to elongation of bone. A quantitative textural degree index DR is proposed. The crystallographic characteristics of bio-hydroxylapatites (particle size, crystallinity and preferring orientation) are designed by tissue function and controlled by organic matrix to provide a good mechanical performance.
1. Introduction
Fish is one of the most ancient vertebrates. The physical and chemical properties and crystallographic characteristics of biominerals in hard tissues of fish have theoretically important guidance value for biomineralization mechanism, mineralogy, crystallography and environmental sciences studies. The connection between the composition and structural differences with living environment has been a hot spot for discussion, and there have been abundant research results [1,2,3,4]. Some scholars investigated the relationship between scale structure and surface morphology with fish species [5], some studied the biochemical characteristics of scale [6,7] and some explored the applications in biological engineering [8]. Only a few research papers on microstructure and mechanical properties of fish bones were performed [9]. Different mineral properties are designed by mineral’s chemical compositions and crystal structures. Because organisms control the crystallization of inorganic phases in different levels [10] and regulate the growth morphology of crystals in three-dimensional space, there should exist some differences in texture and crystallinity between minerals originating from biomineralization and geological processes theoretically. Therefore, understanding the nature of biomineralization of fish is especially important to mineralogy and biology. The X-ray diffraction technique (XRD) is a useful tool to obtain information on crystal structure. In recent years, X-ray micro diffractometry (XRMD) has been preliminarily applied to biominerals [11,12,13], which provides a new insight into the microstructure of biomaterials. Here, we focus on the mineral phase, crystallinity and preferring orientation of minerals in “soft” bones of Cololabis saira by XRMD, and it is anticipated that this work would offer valuable data for discussing the differences in crystallographic performance of minerals among hard tissues and provide an effective basis for research and application of biomineralization.
2. Results
2.1. Phase Analysis
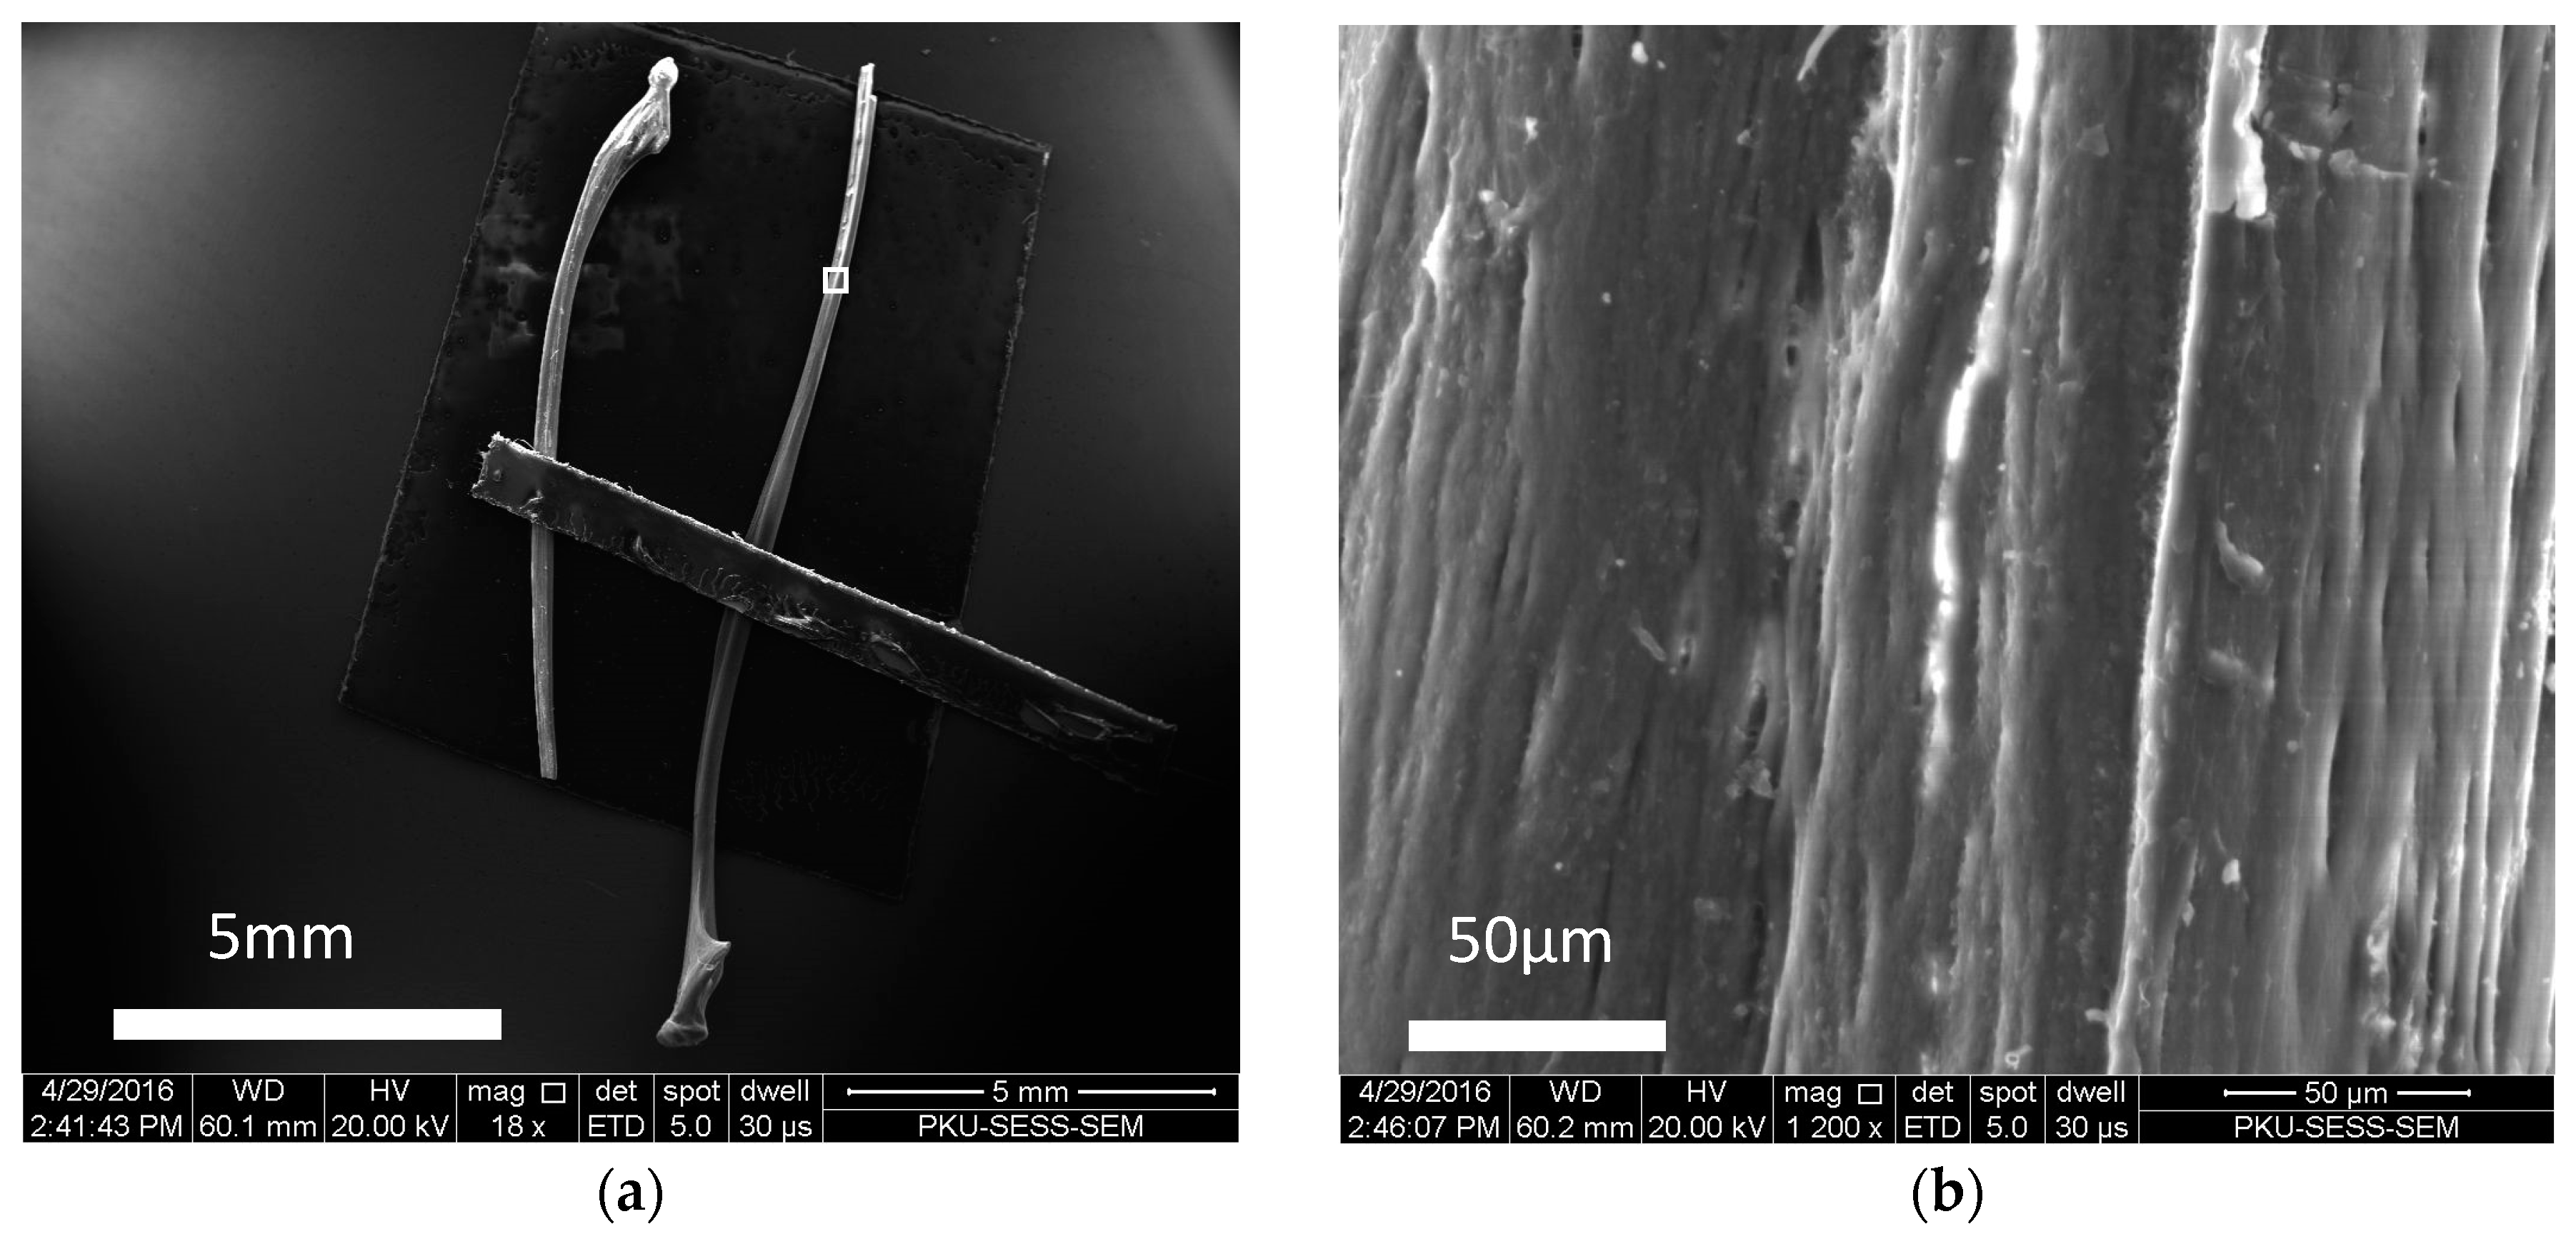
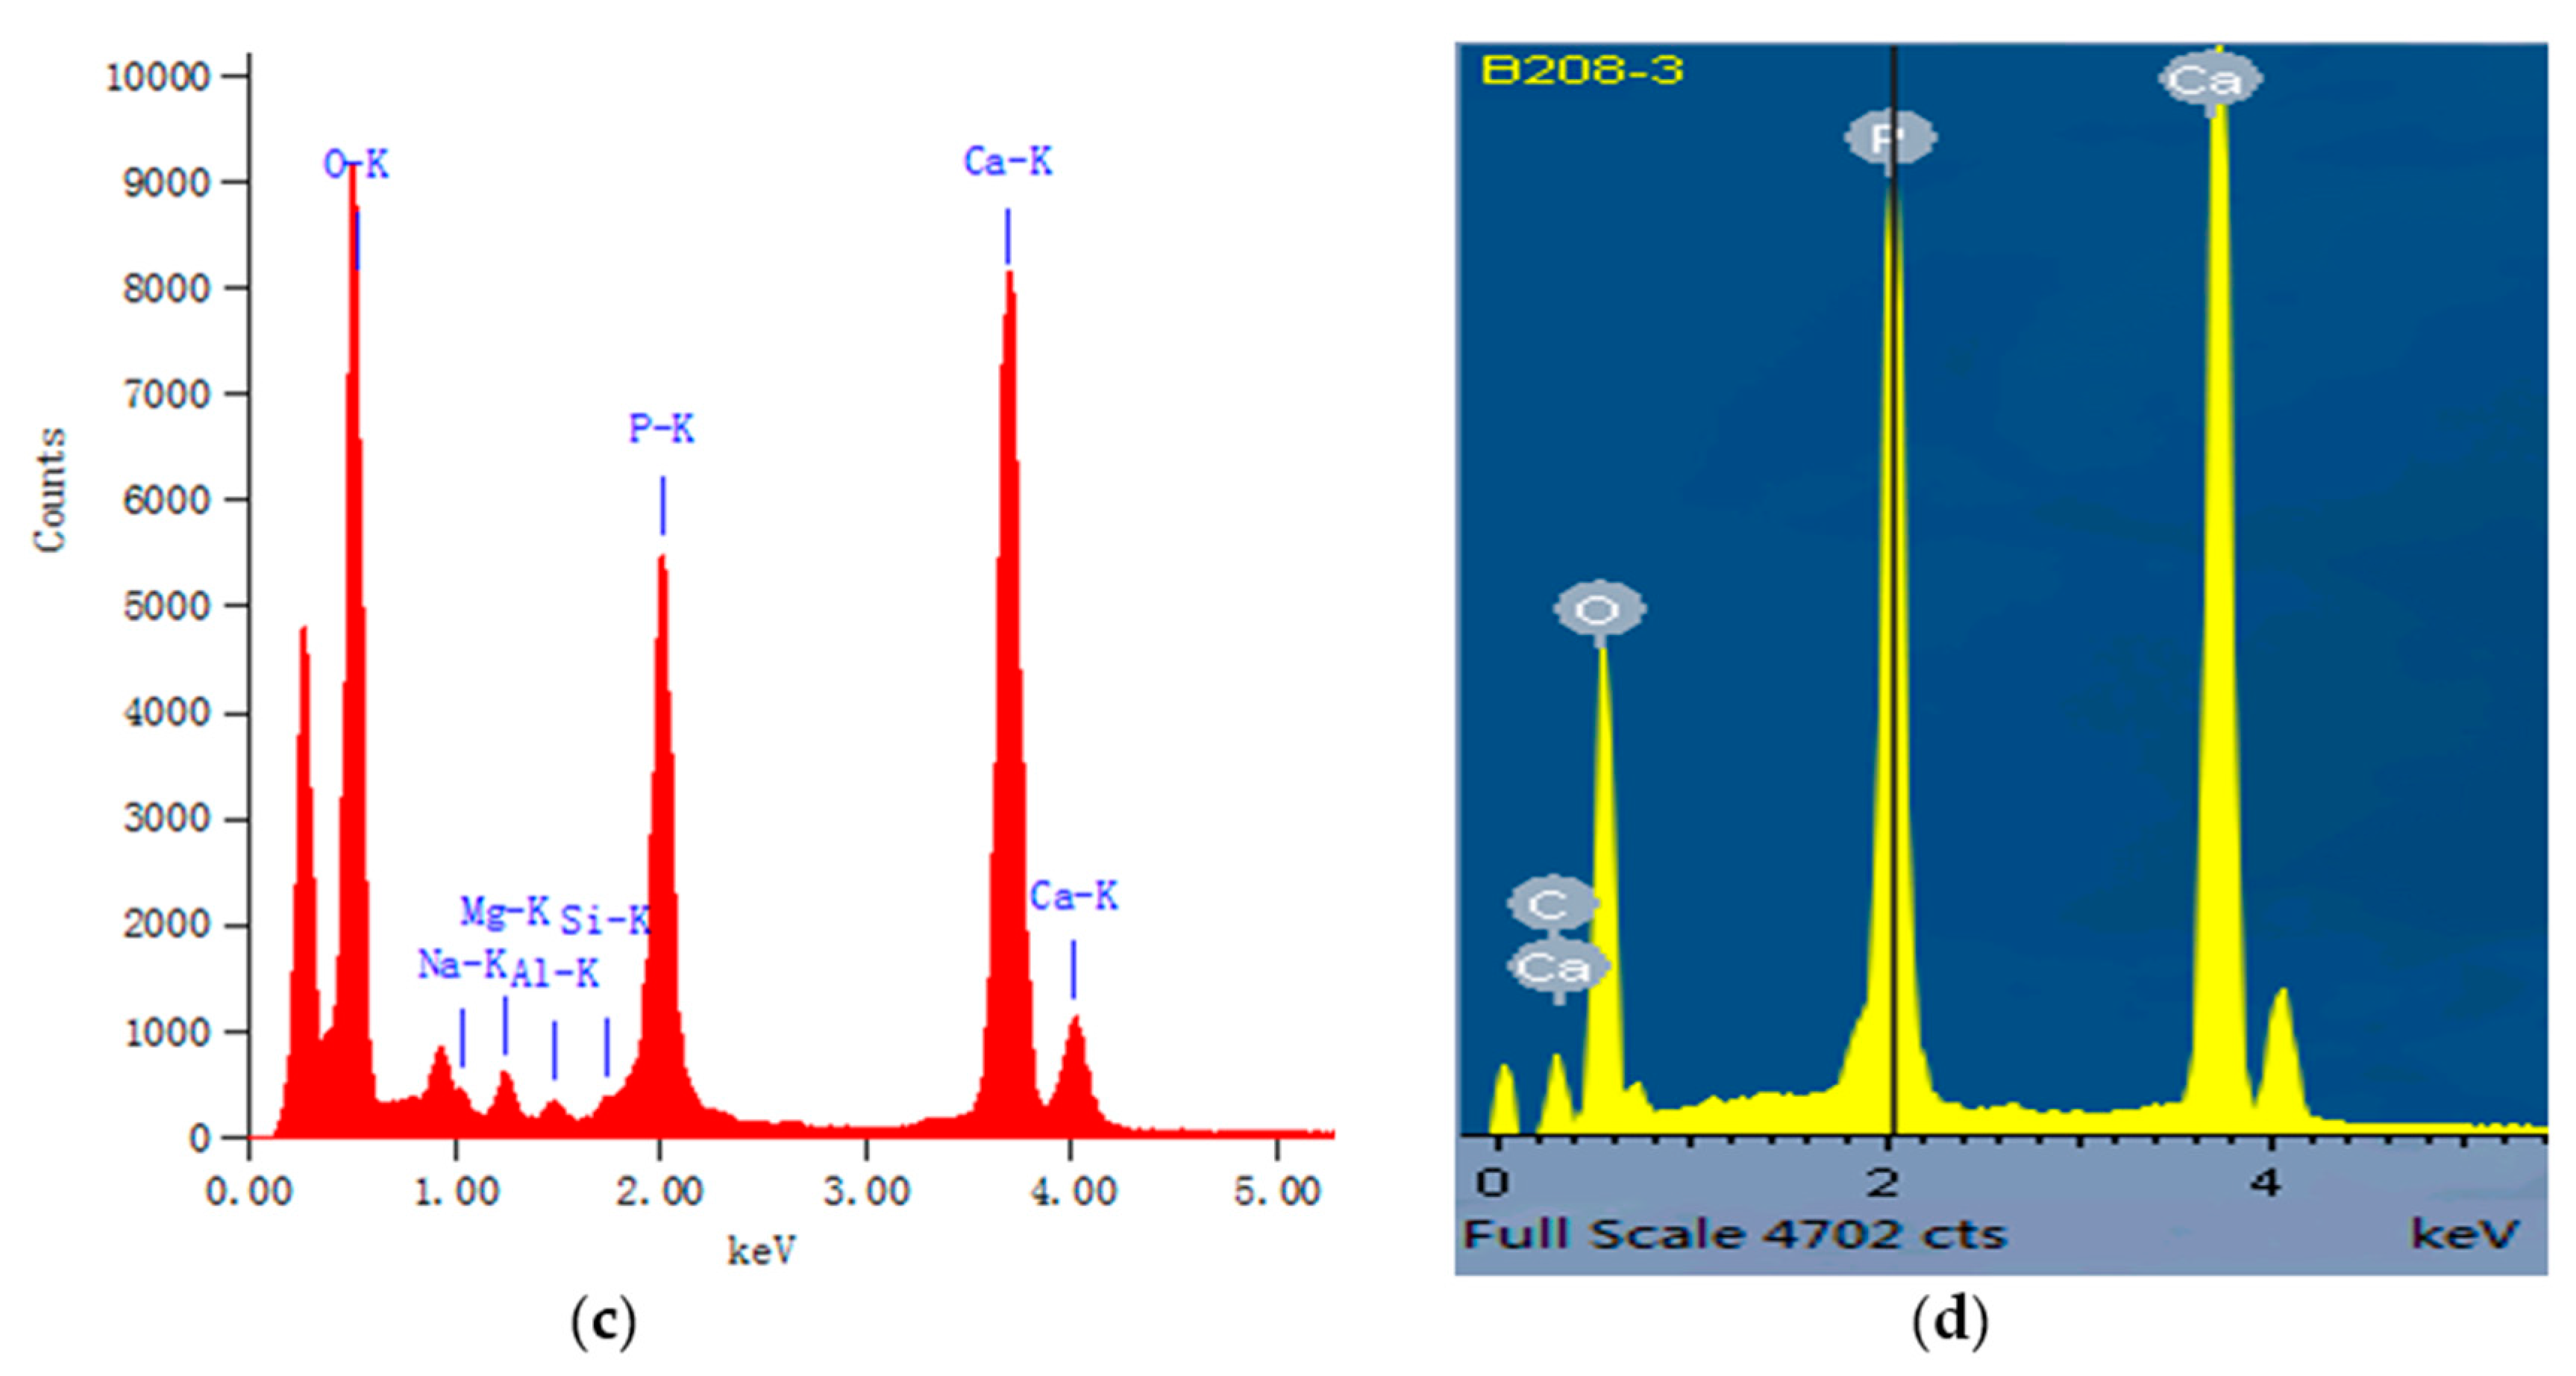
The XRMD results show that the crystal phase in bones is hydroxylapatite (HAP) (see data in Table 1). Figure 1 shows the morphology of the hard tissues by environmental scanning electron microscopy (ESEM). The compositional characteristics and concentrations of HAP in hard tissues of Cololabis saira measured by EDS (TEM) are listed in Table 2. The results show that there are a few elements such as Mg, Fe, Na, Al and Si existing in hard tissues except for Ca, P and O. Elements Mg, Fe and Na can substitute for Ca at the VI site of HAP, and Si and Al substitute for P in the IV site of HAP [14] (p. 871), [15] (p. 296), [16] (p. 1407). Note that Al can substitute for both P and Ca in sites VI and IV, and here we assume it substitutes for P since the IV site is insufficient. No matter the ratio of Ca/P or of SiteIV/SiteVI of HAP, all of them are higher than the theoretical value 1.67 [14] (p. 871) of Ca/P, indicating the chemical compositional characteristics of HAP in hard tissues of Cololabis saira are relatively lacking in P and rich in Ca. This is verified by a natural HAP that possesses an ideal ratio 1.67 of Ca/P (see the comparison of (c) and (d) in Figure 2).
2.2. Lattice Parameters
Refined lattice parameters of HAP by Unitcell (version 1.0, University of Cambridge, Cambridge, UK) are listed in Table 3. It shows that the HAP in the bones of Cololabis saira has lattice parameters a = 0.93622–0.93787 nm, c = 0.68549–0.69011 nm and V = 0.52050–0.52517 nm3.
2.3. Crystallinity
The term crystallinity denotes the degree of completeness of a crystal (including ordering degree in short- or long-term, crystal size and stoichiometric perfection) in the sense of crystallography. Considering the case of a crystalline being of ordering in long-term with stoichiometric perfection and in larger crystal size, it can be treated as good crystallinity; otherwise, it called poor crystallinity if ordering in the short-term with stoichiometric imperfection and in small crystal size. For the purpose of application, the crystallinity of a mineral could be simply represented by the crystallite size or equivalent to the FWHM of a typical reflection of XRD pattern concerned. In general, the bigger the crystal is, the better the crystallinity, and the sharper and more isolated the XRD reflections are. In recent years, many researchers have demonstrated this consideration of crystallinity in their publications—for example, broad XRD peak means low crystallinity [18,19], narrower XRD peak indicates an increase in the crystallinity [20], the appearances of narrow and different XRD peaks mark more crystalline [21], and the lower XRD peak indicated a lower degree of crystallinity [22], etc.
Sillen and Sealy [23] proposed that the full width at half maximum (FWHM) of the 0.344 nm (002) peak could reflect the crystallinity of hydroxylapatite. From the Scherrer equation, it is known that the crystal size of HAP along the c-axis can be calculated from the FWHM of the (002) reflection, and that the broader the (002) peak is, the shorter the crystal of HAP along the c-axis. Therefore, this proposal is actually based upon the crystallographic principle. For more detail, the Scherrer equation is given as follow:
where λ is the wavelength of X-ray used, K is the Scherrer constant, β denotes the FWHM of the (hkl) reflection (in radian) and θ the diffraction angle of the (hkl) reflection. As the Scherrer constant is a function of particle shape [24,25], and HAP has a shape of a hexagonal prism (a = 0.94 nm and c = 0.69 nm produces a hexagonal prism of 1.9 nm in diameter by 0.69 nm in height), it is actually a platelet-like particle in shape and not a cube; thus, we take the unit as the Scherrer K constant for the calculation of domain size of HAP [25] (p. 656). For the same reason, the FWHM of the (100) reflection of powder HAP is taken into account for evaluating the thickness of HAP along [100]. X-ray micro diffraction data of the (002) reflection and domain size and the powder XRD data of HAP in bones of Cololabis saira are listed in Table 4.
D = Kλ/(β·cosθ),
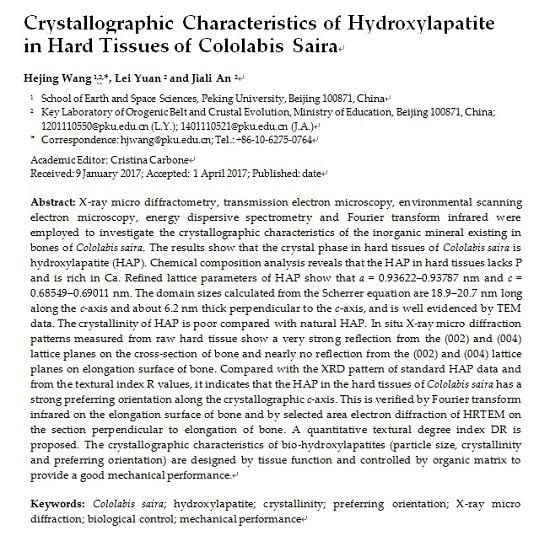
The domain size of HAP obtained from XRD is verified by TEM observation. Figure 2 shows the lattice fringes of HAP in bone from the P2 powder and its corresponding energy spectrum by TEM. It is known that a lattice fringe reflects the coherent domain of one HAP crystal; thus, from the observations under TEM, we directly obtained the crystallite size of HAP in a range from several nanometers to dozens of nanometers, which well agrees with the results of XRD analysis described above.
2.4. Crystal Orientation
It is widely accepted that XRMD can obtain most structure information of biominerals by non-destruction measurements. The XRMD patterns of HAP measured from the cross-section of bones of Cololabis saira display different characteristics from powder patterns of HAP as well as from the standard HAP pattern of ICDD 01-086-0740 [17] (see Figure 3). These 00l peaks from the XRMD patterns become the highest (002) and the second highest (004) reflections while the (211) peak ranks only in the third one. However, for the powder patterns of HAP (P1, P2), reflection (211) is the highest peak and nearly triple the height of the (002) peak. Compared with the decreasing order from the (211) to the (300) to the (112) reflections of HAP of ICDD 01-086-0740 [17], our XRMD patterns imply that the HAPs in the bones of Cololabis saira preferred orientation growth. The XRMD pattern measured from the elongation surface of the raw bone shows another characteristic that all 00l reflections have nearly disappeared, indicating that the elongation direction is normal to the crystallographic c-axis (see pattern B3 in Figure 3).
Low [26] proposed a textural index R to describe the orientation distribution of hydroxylapatite in enamel and dentin with the following Equation:
where Khkl is the intensity ratio of the (211) to the (hkl) reflections of HAP cited from ICDD data and I(hkl) is the measured intensity of the (hkl) reflection of HAP. When R = 1.0, the HAP particles are randomly distributed, whereas R ≠ 1.0 indicates that HAP particles prefer orientation or form texture. In the work, we employ this index to analyze the orientation of the HAP particles in bones of Cololabis saira (Table 5) and quoted these high intensity data K(002) = 2.77, K(102) = 8.93, K(112) = 2.29, K(213) = 3.1 and K(004) = 7.41 from a natural HAP of ICDD 01-086-0740 [17].
Rhkl = [I(211)/I(hkl)]/Khkl,
From Table 5, it is easy to read out that all R values do not equate to 1 except the R of the (112) lattice plane of powder “P1”, which means not only these HAP particles of bones (including (00l) and (hkl) lattice planes) prefer orientation but also HAP particles from random powder prefer orientation too. This is a question. We know that it is difficult to prepare a hundred percent random powder for ball-unlike particles; however, it is widely accepted that a random preparation must approach or be close to hundred percent random orientations. This leads to the needing to know how heavy the preferring orientation is. For the purpose of clear indication, here we propose a “textural degree” index DR to quantitatively describe the degree of preferring orientation:
where Rhkl can be calculated from Equation (2). From Equation (3), it is deduced that the larger the DR is, the heavier the degree of preferring orientation.
DR = 100 × |1 − Rhkl|/1,
Table 6 lists all DR values corresponding to those Rs in Table 5 and from which it is easily understood that DR = 96.93% (corresponding to R = 0.03) has a much stronger preferring orientation than that of DR = 6.83% (corresponding to R = 1.08). Figure 4 is the plot of DR vs. lattice planes from which the DR values of powders are much lower than those of bones, and they are separated from each other by at least 39% ΔDR and for powder group DR < 17% while the bone group DR > 47%.
3. Discussions
3.1. Substitution in HAP
HAP is the most stable thermodynamics phase of calcium phosphates under the body fluid environment [27]. Generally, HAP has a formula of M5[ZO4]3(X), where the M site is occupied mainly by Ca+2 and less by large cations such as Mg+2, Sr+2, Ba+2, Pb+2, K+1, Na+1, Fe+2, Mn+2, REE, etc. The Z site is occupied mainly by P+5 and less by small cations As+5, Si+4, S+6, C+4, and the X site must be occupied mainly by OH−1 and less mixed with F−1, Cl−1 or CO3−2. Structurally, a = 0.94166 nm and c = 0.68745 nm [14] are the cell parameters of HAP with an ideal formula Ca5[PO4]3(OH). However, when a substitute happens, e.g., Si+4 → P+5 in the Z site (here → means replace), Ce+2, Na+1 → Ca+2 in the M site and F−1 → OH−1 in the X site, it will change the structure of HAP and result in a = 0.94202 nm and c = 0.69157 nm for HAP with the formula of Ca4.557Na0.02Ce0.423(P2.595Si0.405)O12.664F0.335H0.664; For pure fluorapatite Ca5[PO4]3(F), the cell parameters are a = 0.93973 nm and c = 0.68782 nm. Statistics from published natural apatite data [14,15,16], these replacements in M and Z sites will make an increase along the c-axis but not significantly change with the a-axis; on the contrary, the substance of OH−1 in the X site by Cl−1 will obviously make an increase along the a-axis and decrease along the c-axis. A unit cell of HAP contains ten Ca2+ at 0, 1/2c, 1/4c and 3/4c of the hexagonal prism, two hydroxyls at the center zone of the unit cell and six P−3 at 1/4c and 3/4c. Previous research showed that the HAP in biominerals usually lacks Ca2+ or riches in CO32− [28], if CO32− replaces a part of PO4−3 (type B), it can cause the a-axis to obviously decrease, and, if CO32− replaces a part of hydroxyls (type A), the effect is the opposite, and there is no effect on the c-axis for those replacements [29]. Hench and Wilson [30] demonstrated that the variation of lattice parameters in bioceramics, especially the parameter a-axis is related to the replacement of trace elements in crystal structure. The deviation of lattice parameter of HAP in bones is attributed to the replacement among ions and the situation of defection in structure such as structural empty, lattice fault, folding, etc., which cause changes of chemical bands and interaction among ionic groups (electrostatic interaction) of HAPs, and leads to lattice parameter variation.
Compared with the natural sample [17], our data reveal that the cell dimensions of HAP is 0.4–0.58% short along the a-axis and −0.34–0.29% difference along the c-axis, respectively. It is revealed from IR data (Figure 5) that CO3−2 exists in the HAP of bones of Cololabis saira, and the CO3−2 mainly takes place at the Z site of PO4−3. The substitution of PO4−3 by CO3−2 (type B) in HAP will cause the a-axis to decrease. The replacement of PO4−3 by CO3−2 (type B) and its cause of decrease along the a-axis well agrees with the refined cell dimension of the a-axis (from ideal a = 0.94166 nm decreasing to 0.93622–0.93787 nm or about 0.49% reduced on average). The EDS test confirms that there are many elements such as Mg, Fe, Na, Al and Si in the HAP of bone of Cololabis saira. Analogous to natural HAP, these cations Mg+2, Na+1, and Fe+2 could occupy the M site in HAP and Al+3 and Si+4 occupy the Z site, and partly replace the Ca and the P, respectively. Those replacements at the M site do not cause variation along the c-axis very much, such as c = 0.68549–0.69011 nm or as 0.05% of the ideal c-axis (0.68745 nm) of natural HAP [14], and it is only about a tenth of the variation along the a-axis. Because of the replacement of PO4−3 by CO3−2 in the Z site, the ratio of Ca/P will increase relatively and results in the relative lack of P and richness in Ca. These cell dimensional variations caused by the replacements in M and Z sites confirm that those elements of Mg, Na, Fe, Al and Si detected by EDS in the hard tissues are from the HAPs in the bones of Cololabis saira rather than from collagen. It was reported from previous work on the hard tissues of freshwater Lateolabrax japonicus [31] that the Mg+2 was only found on the scale of freshwater Lateolabrax japonicus. It is likely that the chemical properties of living water such as seawater and fresh water have a major impact on elements absorbed and their concentrations in scale and bone [6]. HAP composes the major part of hard tissues of fishes, and its chemical composition and structural characteristic are closely associated with the biomineralization process and life activities. This close relationship with biomineralization and the environment could be a good point for further investigation of HAP in fish bones.
3.2. Particle Size and Crystallinity
The particle sizes of the HAPs in bones of Cololabis saira are in nanoscale. Many studies showed that the calcium phosphate formed in organisms under mild conditions possesses nanoscale features [32], high surface activity and ultrastructure [33] generally. Nano-mineral particles in bones are selected to ensure optimum breaking strength and maximum tolerance of flaws [34]. This means that the nano-HAPs can provide excellent mechanical properties to biological tissue for ensuring life activity and working correctly.
The mineral crystallinity can be roughly analyzed through X-ray diffraction patterns. In general, if the XRD pattern has many sharp peaks and their FWHMs are narrow, the mineral crystallinity is good and mineral crystal particles are big (coherent domain) and have better crystal form. In this work, no matter the powder XRD patterns or the in situ XRMD patterns of HAPs, all XRD reflections are wider in FWHM (>0.48°Δ2θ). It turns out that the crystals thickness along the c-axis of HAP in bones is 18–21 nm long and particle sizes in other directions are less than this limit. The increasing of the enamel hardness [35] is attributed to the increase in thickness of the crystallites, that is, the increasing in thickness makes the crystal particles have better mechanical properties to reduce wear. It is well known that biominerals’ nucleation and growth reply on protein chain templates are under the control of polysaccharides and polypeptides; therefore, the HAPs crystallinity in bones is controlled by organisms in order to adapt to different mechanical behaviors.
3.3. Orientation of HAP
The SEM technique can help well for describing micro particles. Figure 6 demonstrates the relationship between elongation and hard tissues of bone and the appearance of HAP clusters on the section of bone. A parallel relationship between elongation and tissues was observed whilst plenty of HAP clusters about <1 μm in diameter are gathered and surround by tiny tissues. This indicates the growing style of HAP in bone that tissues separate, enclose and weave HAP particles and let them form a series of clusters parallel to the elongation of bone.
The in situ XRMD patterns of HAPs are different from standard ICDD data of HAP. The main reason is that biominerals have the characteristics of preferring orientation; in other words, these biomineral particles usually grow around or tend to grow parallel to a particular direction. This leads their in situ XRMD patterns to becoming special orientation ones: the intensities of these reflections become stronger (crystallographic planes perpendicular to preferring orientation) or weaker (crystallographic planes parallel to preferring orientation) while others become relatively weaker or stronger. The X-ray powder diffraction records the patterns from powder particles, which is distributed randomly and results in losing the power of recording textural information such as heterogeneous distribution and stresses, whilst the in situ XRMD is of the power to overcome this difficulty, and it protects the original structure information of minerals from destroying and helping to investigate the crystal growth orientation through diffraction patterns. Figure 3 clearly demonstrates that (i) the XDMP patterns (B1, B2), measured on the section perpendicular to the elongation of bone, have very strong reflections of (00l) indicating HAP particles preferring along the c-axis; and (ii) the pattern (B3), measured from the surface parallel to the elongation of bone, is of no reflection of (00l), indicating HAP particles growing perpendicular to the elongation direction of bone or parallel to the c-axis; (iii) the powder patterns (P1,P2) possess some intermediate intensity of (00l) indicating a random distribution of reflections. This is the first evidence of HAP in bone preferring c-axis growth.
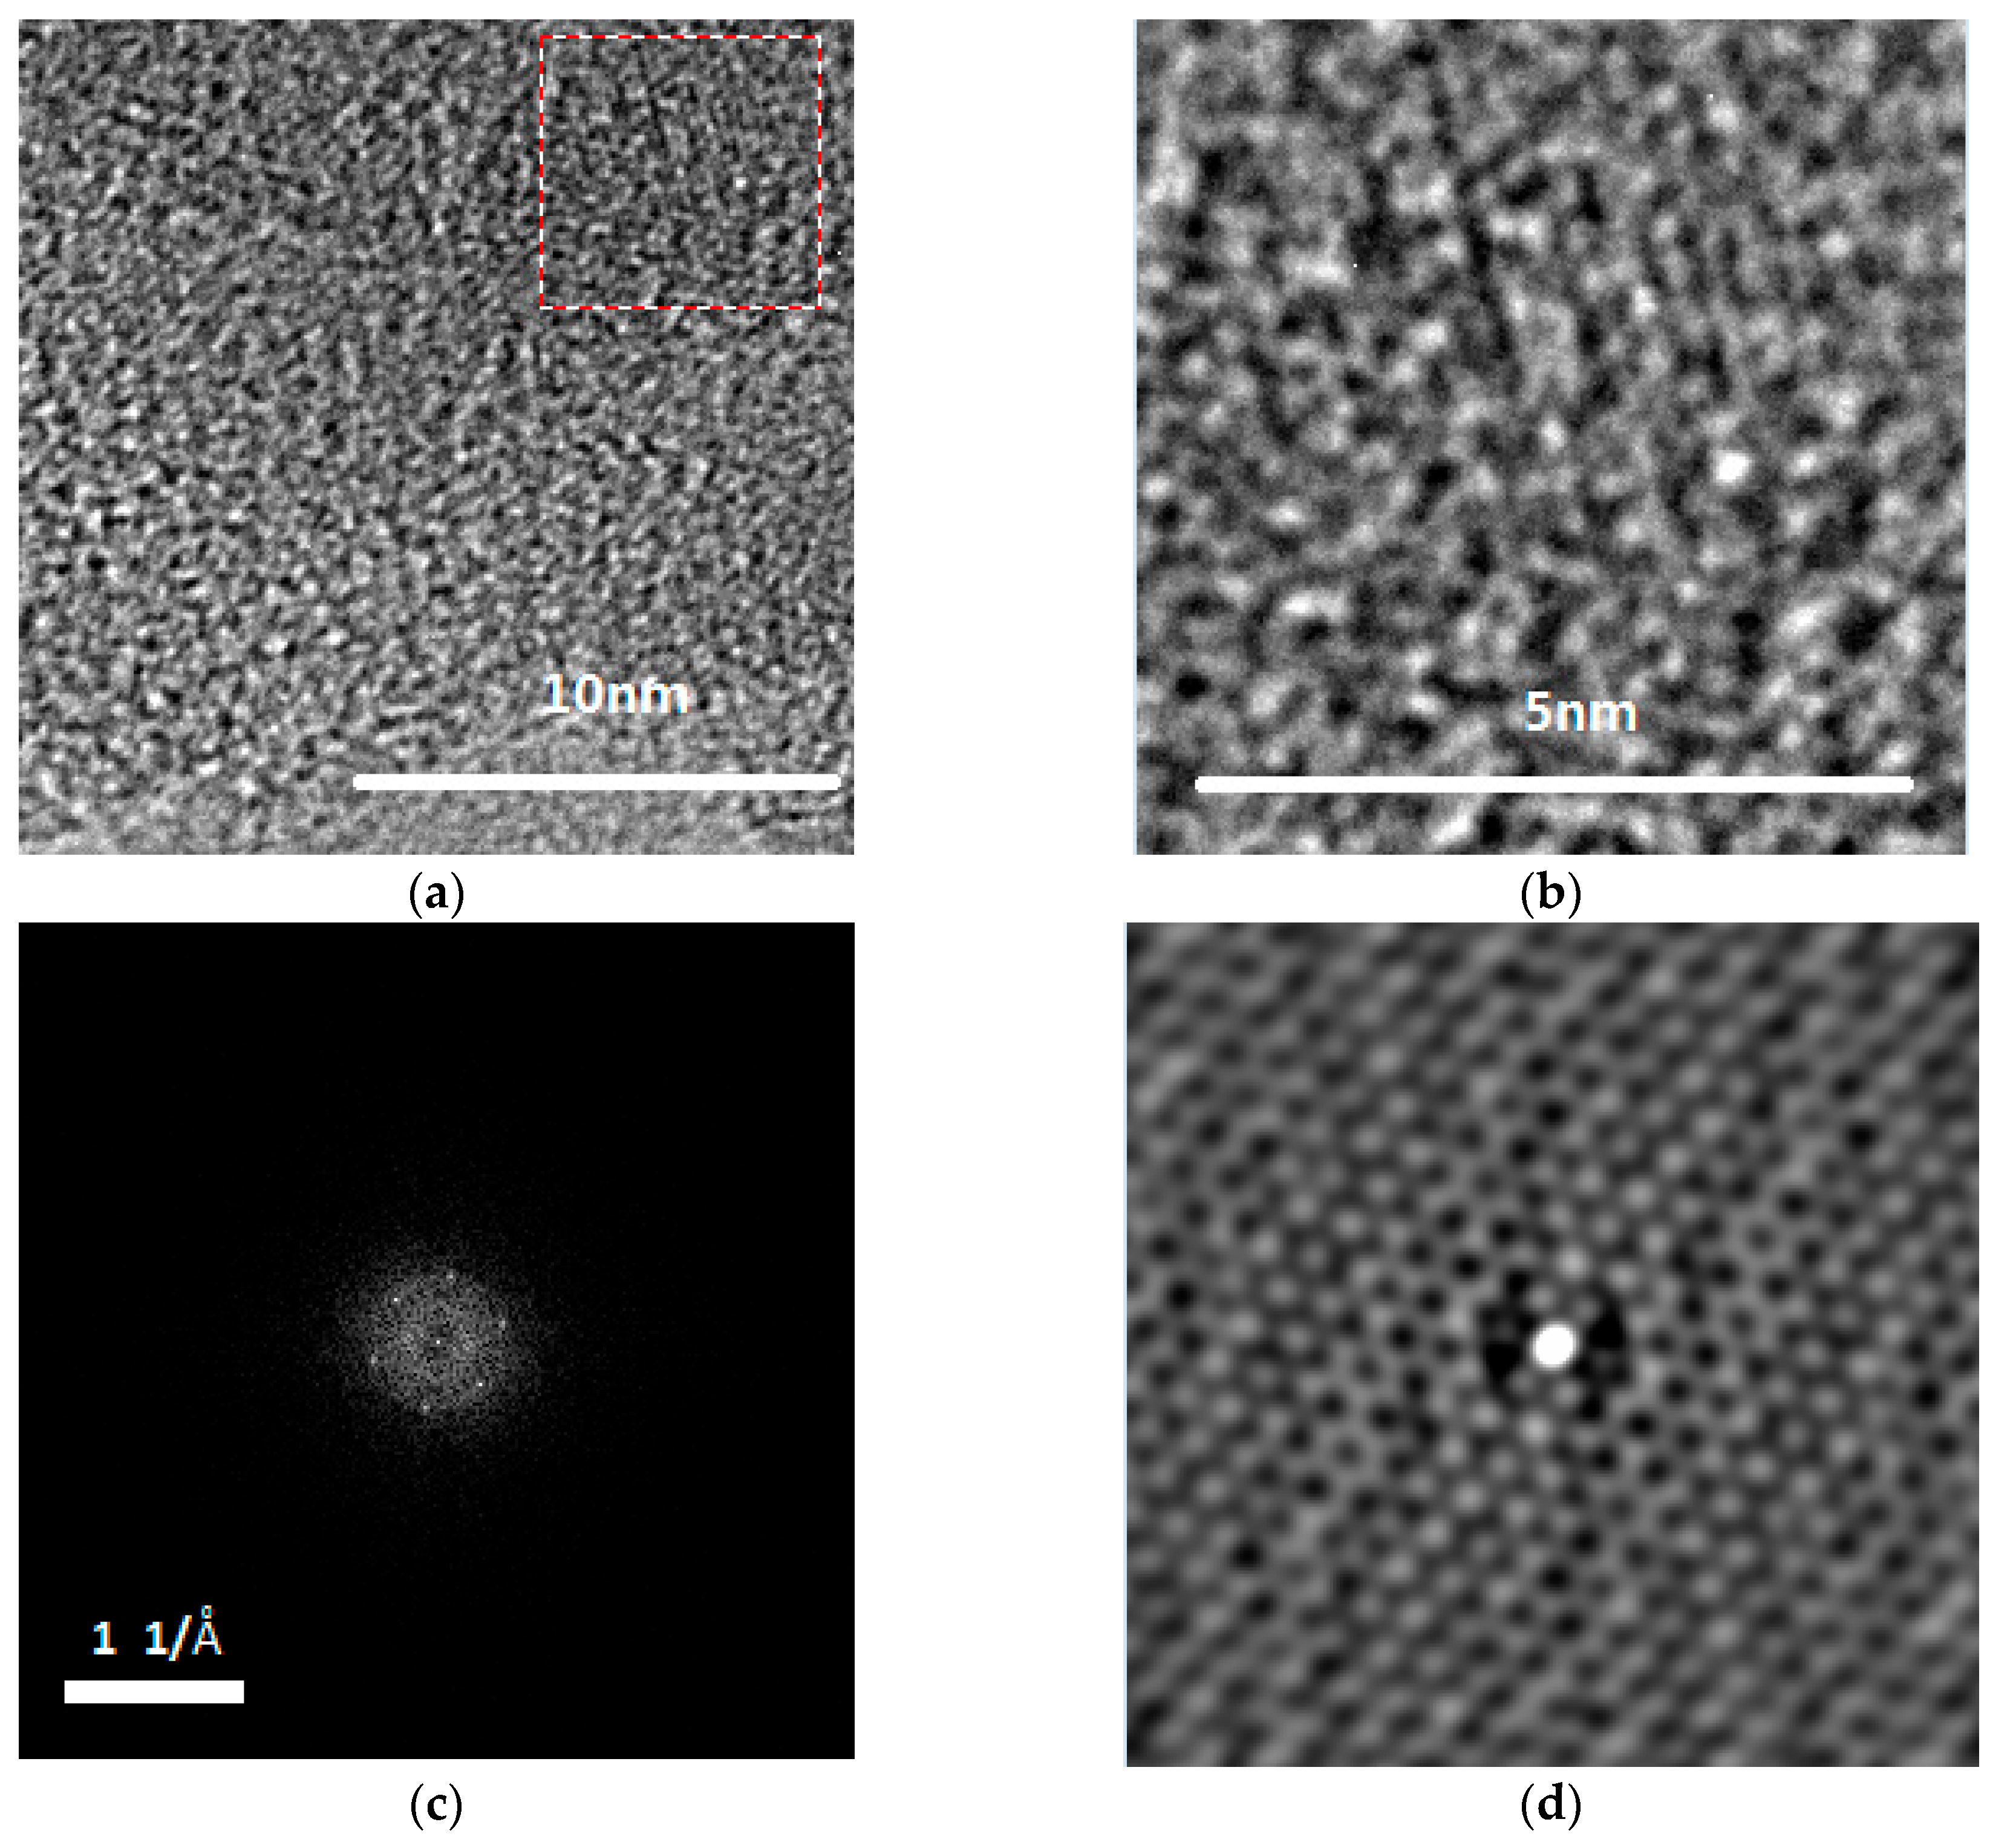
Recent FRIR investigation on HAP [36,37] reveals that the bands of OH−1 of FTIR vary from along the c-axis (E//c) (bands 3540 cm−1 standing up while 746 cm−1 is disappearing) to perpendicular to the c-axis (E⊥c) (bands 746 cm−1 occurring while 3540 cm−1 is disappearing) whilst the pair bands of CO3−2 at ~1428/1455 cm−1 from the maximum difference to nearly equal. The FTIR spectra perpendicular to the c-axis of HAP in bone (B2) was obtained by using an ATR technique in which the OH−1 bands at 746 cm−1 occur (no bands at 3540 cm−1) and the pair bands of CO3−2 at ~1428/1455 cm−1 appear equally (see Figure 5). This is the second evidence that the elongation (surface) of bone is parallel to the c-axis of HAP particles; in other words, HAP particles grow mostly along the c-axis. However, the FTIR spectra parallel to the c-axis of HAP was not successful due to section preparation. Instead, a super thin section perpendicular to the elongation of bone was obtained with the help of a Leica EM UC6 Ultramicrotome (Vienna, Austria), from which a typical selected electron diffraction pattern was derived which indicates the section surface being normal against the c-axis of HAP (see Figure 7). This again verifies the growing style of HAP preferring along the c-axis and is the third piece of evidence.
The textural index R by Low [26] and the textural degree index DR indicate that the HAPs in bones of Cololabis saira have a strong (47–96%) preferring orientation along the crystallographic c-axis. The preferring orientation of biominerals is determined by the function of the hard tissue [38], it makes the physical properties the best anisotropism in nano-size [39] and possesses the lowest surface free energy [40] and can resist the damage from the outside [41]. During the biomineralization, HAPs are controlled strictly by organic molecules and prefer orientation along the crystallographic c-axis nearly parallel to the collagen fibers’ axis [42,43]. In summary, the preferring orientation of biominerals is designed by the organic matrix in order to form tissue function and mechanical properties.
4. Materials and Methods
We bought a Cololabis saira from the market, collected bones (B1 and B2), washed them with clear water and put them on a shade place and let them be air-dried naturally. These bones were prepared for testing. Natural powder (P1) ground from raw bones and “fried powder” (P2) ground from bones after heating at 300 °C for an hour were prepared for comparison.
The instrument used for XRMD analysis is an X’Pert PRO MPD (PANalytical) diffractometer (Almelo, The Netherlands) with a spinning platform and a super detector (X’Celerator). It is equipped with 165 × 0.2 mm (length × diameter) monocapillary optics. Helping with a microscope, any part of the material tested can be adjusted and measured under the point focus. We selected a cross-section of bones for XRMD measurement. The detection parameters of the instrument were operated as follows: Cu Kα radiation and working at 45 kV and 40 mA, a 0.017°2θ step size, a 2000 s scan time per step and a 10–95°2θ scanning range in continuously scanning mode. After measurement, software X’Pert Highscore Plus (version 3.0, PANalytical, Almelo, The Netherlands) was used to deduct the background, strip Kα2 component, search peaks and match with the diffraction pattern from ICDD 2005 [17]. CrystalDiffract (version 6.6.5, CrystalMaker Software Ltd., Oxford, UK) was used to simulate the ICDD pattern. Fitting techniques were used to deconvolute peak overlap. The instrumental broadening was stripped when calculating the particle size. Lattice parameters were refined by Unitcell (version 1.0, University of Cambridge, Cambridge, UK) after indexing. A field emission scanning electron microscope (FEI Quanta 2000F, Hillsboro, OR, USA) was employed to obtain the microscopic information of morphology and was working at 15 kV. Electron microprobe analysis (EMPA) was performed on a JXA-8100 electron microprobe (Tokyo, Japan) at 15 kV acceleration voltage and 10 nA beam current, a 1 μm beam diameter, a PRZ correction, and a calibration against mineral standards of GB/T17359-1998A-B, Beijing, China. A transmission electron microscope (JEM-2100F, Tokyo, Japan) with energy dispersive spectrometer was used and was working at 200 kV to analyze the crystal size and lattice fringe. Sample preparation for a TEM test was made by pipetting suspensions of fried powder onto carbon-coated copper mesh. A Leica EM UC6 Ultramicrotome was used to cut the super thin section (~70 nm) of bone normal to elongation of bone. An infrared test was performed with a Fourier transform infrared spectrophotometer (Spectrum Spotlight 200 FT-IR microscopy, Waltham, MA, USA) in ATR for raw bone and with a KBr wafer (sample 0.9 mg with KBr 153.4 mg) for bone powder in the scanning range of 400–4000 cm−1 with a 4 cm−1 spectral resolution.
5. Conclusions
The crystal phase in hard tissues of Cololabis saira is hydroxylapatite. The chemical composition of HAP is rich in Ca and poor in P, and there are two kinds of replacements in HAP structure: Ca replaced by Mg, Fe, Na and P by Si and Al. HAP particles reach the nanoscale and the crystallinity is poor. The XRMD patterns display very strong (00l) reflections of HAP from vertical sections of bone and no (00l) reflection from elongation surfaces of bones, the OH−1 bands standing up and disappearing in their strength/vibration positions together with the double equal v3 bands of CO3 occurring in the FTIR spectra from the elongation surface of bone, and the hexagonal SAED pattern of HRTEM from cross-sections of bones distinctively prove that the HAPs in bones of Cololabis saira have a strong feature of preferring orientation along the c-axis.
Acknowledgments
Thanks are given to YunLing Jia for help with TEM work, to Jing Ju for super thin section cutting and to Wei Pan for FTIR recording. This study was supported by the National Natural Science Foundation of China (Grant Nos. 41372061, 40972038 and 40872034).
Author Contributions
H.W. and L.Y. conceived and designed the experiments; H.W., L.Y. and J.A. performed the experiments; H.W., L.Y. and J.A. analyzed the data; and H.W. and L.Y. wrote the paper.
Conflicts of Interest
The authors declare no conflict of interest. The founding sponsors had no role in the design of the study; in the collection, analyses, or interpretation of data; in the writing of the manuscript, and in the decision to publish the results.
References
- Rountrey, A.N.; Coulson, P.J.; Meeuwig, J.J.; Meekan, M. Water temperature and fish growh: Otoliths predict growth patterns of marine fish in a changing climate. Glob. Chang. Biol. 2014, 20, 2450–2458. [Google Scholar] [CrossRef] [PubMed]
- Phillis, C.C.; Ostrach, D.J.; Ingram, B.L.; Weber, P.K. Evaluating otolith Sr/Ca as a tool for reconstructing estuarine habitat use. Can. J. Fish. Aquat. Sci. 2011, 68, 360–373. [Google Scholar]
- Milton, D.A.; Chenery, S.R. Sources and uptake of trace metals in otoliths of juvenile barramundi (Lates calcarifer). J. Exp. Mar. Biol. Ecol. 2001, 264, 47–65. [Google Scholar] [CrossRef]
- Devereux, I. Temperature measurements from oxygen isotope ratios of fish otoliths. Science 1967, 155, 1684–1685. [Google Scholar] [CrossRef] [PubMed]
- Yang, T.Y.; Li, Z.H.; Zhu, M.W. Study on scale surface structure of colossomabrachypomum by scanning electron microscopy. Chin. J. Zool. 1999, 34, 8–12. [Google Scholar]
- Gu, Y.J.; Li, J.; Li, F.W.; Bao, J.Q. The research progress in chemical composition of fish scales. J. Shanxi Agric. Sci. 2011, 39, 1227–1231. [Google Scholar]
- Ikoma, T.; Kobayashi, H.; Tanaka, J.; Walsh, D.; Mann, S. Microstructure, mechanical, and biomimetic properties of fish scales from Pagrus major. J. Struct. Biol. 2003, 142, 327–333. [Google Scholar] [CrossRef]
- Panda, N.N.; Pramanik, K.; Sukla, L.B. Extraction and characterization of biocompatible hydroxyapatite from fresh water fish scales for tissue engineering scaffold. Bioprocess Biosyst. Eng. 2014, 37, 433–440. [Google Scholar] [CrossRef] [PubMed]
- Ma, C.; Cui, F.Z.; Wang, X.M. Variation of nanomechanical properties in the gene mutated Zebra fish bone. Mater. Rev. 2004, 18, 65–68. [Google Scholar]
- Mann, S. Biomineralization: Principals and Concepts in Bioinorganic Materials Chemistry; Oxford University Press: Oxford, UK, 2001; pp. 24–37. [Google Scholar]
- Xue, J.; Zavgorodniy, A.V.; Kennedy, B.J.; Swain, M.V.; Li, W. X-ray microdiffraction, TEM characterization and texture analysis of human dentin and enamel. J. Microsc. 2013, 251, 144–153. [Google Scholar] [CrossRef] [PubMed]
- Ma, Y.F.; Qiao, L.; Feng, Q.L. Research progress on biomineralization mechanism of freshwater pearl. J. Inorg. Mater. 2013, 28, 109–116. [Google Scholar] [CrossRef]
- Wei, W.; Mao, J.; Peng, Z.; Xiao, Z.J.; Liu, Y.; Gong, S.Q.; Wang, D.; Zhou, B. High-resolution X-ray microdiffraction analysis of NaOH-treated dentin. J. Appl. Crystallogr. 2009, 42, 616–620. [Google Scholar] [CrossRef]
- Hughes, J.M.; Cameron, M.; Crowley, K.D. Structural variations in natural Fo OH, and Cl apatites. Am. Mineral. 1989, 74, 870–876. [Google Scholar]
- Hughes, J.M.; Cameron, M.; Crowley, K.D. Crystal structures of natural ternary apatites: Solid solution in the Ca5(PO4)3X (X = F, OH, Cl) system. Am. Mineral. 1990, 75, 295–304. [Google Scholar]
- Wilson, R.M.; Elliott, J.C.; Dower, S.E.P. Rietveld refinement of the crystallographic structure of human dental enamel apatites. Am. Mineral. 1999, 84, 1406–1414. [Google Scholar] [CrossRef]
- International Center for Diffraction Database (ICDD). Powder Diffraction File (PDF-2), version 2005; ICDD: Newtown Square, PA, USA, 2005. [Google Scholar]
- Sasaki, T.; Sakai, Y.; Iizuka, A.; Nakae, T.; Kato, S.; Kojima, T.; Yamasaki, A. Evaluation of the Capacity of Hydroxyapaptite Prepared from Concrete Sludge to Remove Lead from Water. Ind. Eng. Chem. Res. 2011, 50, 9564–9568. [Google Scholar] [CrossRef]
- Liao, J.G.; Li, Y.Q.; Duan, X.Z.; Liu, Q. Synthesis and Characterization of CO32- Doping Nano-Hydroxyapatite. Spectrosc. Spectr. Anal. 2014, 34, 3011–3014. [Google Scholar]
- Okada, M.; Fujiwara, K.; Uehira, M.; Matsumoto, N.; Takeda, S. Expansion of nanosized pores in low-crystallinity nanoparticle-assembled plates via a thermally induced increase in solid-state density. J. Colloid Interface Sci. 2013, 405, 58–63. [Google Scholar] [CrossRef] [PubMed]
- Karamian, E.; Khandan, A.; Eslami, M.; Gheisari, H.; Rafiaei, N. Investigation of HA vanocrystallite size crystallographic characterizations in NHA, BHA and HA pure powders and their influence on biodegradation of HA. Adv. Mater. Res. 2014, 829, 314–318. [Google Scholar] [CrossRef]
- Locardi, B.; Pazzaglia, U.E.; Gabbi, C.; Profilo, B. Thermal behaviour of hydroxyapatite intended for medical applications. Biomaterials 1993, 14, 437–441. [Google Scholar] [CrossRef]
- Sillen, A.; Sealy, J.C. Diagenesis if strontium in fossil bone: A reconsideration of Nelson et al. (1986). J. Arch. Sci. 1995, 22, 313–320. [Google Scholar] [CrossRef]
- Wilson, A.J.C. X-ray Optics: The Diffraction of X-rays by Finite and Imperfect Crystals; Methuen: London, UK, 1962; pp. 37–54. [Google Scholar]
- Klug, H.P.; Alexander, L.E. X-ray Diffraction Procedures for Polycrystalline and Amorphous Materials; Wily: New York, NY, USA, 1974; pp. 618–708. [Google Scholar]
- Low, I.M. Depth-profiling of crystal structure, texture, and microhardness in a functionally graded tooth enamel. J. Am. Ceram. Soc. 2004, 87, 2125–2131. [Google Scholar] [CrossRef]
- Kalita, S.J.; Bhardwaj, A.; Bhatt, H.A. Nanocrystalline calcium phosphate ceramics in biomedical engineering. Mater. Sci. Eng. C 2007, 27, 441–449. [Google Scholar] [CrossRef]
- Cui, F.Z. Biomineralization; Tsinghua University Press: Beijing, China, 2007; pp. 17–21. [Google Scholar]
- Zhou, L.D.; Liu, Y.K.; Zhou, G.F. A study on modern biological apatite and fossil apatite. Act. Miner. Sin. 1999, 19, 41–52. [Google Scholar]
- Hench, L.L.; Wilson, J. An Introduction to Bioceramics; World Scientific Publishing Co.: Singapore, 1993; pp. 140–141. [Google Scholar]
- Yuan, L.; Wang, H.J.; Zhou, Z.; An, J.L. Crystallographic Characteristics of Hydroxylapatite in Hard Tissues of Freshwater LateolabraxJaponicus. Act. Miner. Sin. 2017, in press. [Google Scholar]
- Cai, Y.R.; Tang, R.K. Calcium phosphate nanoparticles in biomineralization and biomaterials. J. Mater. Chem. 2008, 18, 3775–3787. [Google Scholar] [CrossRef]
- Vallet-Regi, M.; Gonzalez-Calbet, J.M. Calcium phosphates as substitution of bone tissues. Prog. Solid State Chem. 2004, 32, 1–31. [Google Scholar] [CrossRef]
- Gao, H.J.; Ji, B.H.; Jager, I.L.; Arzt, E.; Fratzl, P. Materials become insensitive to flaws at nanoscales: Lessons from nature. Proc. Natl. Acad. Sci. USA 2003, 100, 5597–5600. [Google Scholar] [CrossRef] [PubMed]
- Cuy, J.L.; Mann, A.B.; Livi, K.J.; Teaford, M.F.; Weihs, T.P. Nanoindentation mapping of the mechanical properties of human molar tooth enamel. Arch. Oral Biol. 2002, 47, 281–291. [Google Scholar] [CrossRef]
- Wang, K.L.; Zhang, Y.X.; Naab, F.U. Calibration for IR measurements of OH in apatite. Am. Mineral. 2011, 96, 1392–1397. [Google Scholar] [CrossRef]
- Clark, K.; Zhang, Y.; Naab, F.U. Quantification of CO2 concentration in apatite. Am. Mineral. 2016, 101, 2443–2451. [Google Scholar] [CrossRef]
- Dumont, M.; Borbely, A.; Kaysser-Pyzalla, A.; Sande, P.M. Long bone cortices in a growth series of Apatosaurus sp. (Dinosauria: Diplodocidae): Geometry, body mass, and crystallite orientation of giant animals. Biol. J. Linn. Soc. 2014, 112, 782–798. [Google Scholar] [CrossRef]
- Landis, W.J.; Paine, M.C.; Glimcher, M.J. Electron-microscopic observations of bone tissue prepared anhydrously in organic-solvents. J. Ultrastruct. Res. 1977, 59, 1–30. [Google Scholar] [CrossRef]
- Akazawa, H.; Ueno, Y. Control of composition and crystallinity in hydroxyapatite films deposited by electron cyclotron resonance plasma sputtering. J. Phys. Chem. Solids 2014, 75, 94–99. [Google Scholar] [CrossRef]
- Naleway, S.E.; Taylor, J.R.A.; Porter, M.M.; Meyers, M.A.; McKittrick, J. Structure and mechanical properties of selected protective systems in marine organisms. Mater. Sci. Eng. C 2016, 59, 1143–1167. [Google Scholar] [CrossRef] [PubMed]
- Ji, B.H.; Gao, H.J. Mechanical principles of biological nanocomposites. Annu. Rev. Mater. Res. 2010, 40, 77–100. [Google Scholar] [CrossRef]
- Traub, W.; Arad, T.; Weiner, S. 3-dimensional ordered distribution of crystals in turkey tendon collagen-fibers. Proc. Natl. Acad. Sci. USA 1989, 86, 9822–9826. [Google Scholar] [CrossRef] [PubMed]
Figure 1.
ESEM images of hard tissues of Cololabis saira. (a) two bones with sizes of 9.8 × 0.33 mm and 13.7 × 0.38 mm, note: fixing matter is overlying the two bones; (b) a closer look (×1200) at the part within the white square of (a).
Figure 1.
ESEM images of hard tissues of Cololabis saira. (a) two bones with sizes of 9.8 × 0.33 mm and 13.7 × 0.38 mm, note: fixing matter is overlying the two bones; (b) a closer look (×1200) at the part within the white square of (a).

Figure 2.
Lattice fringes and energy spectrum of hard tissues of Cololabis saira. (a) lattice fringe of HAP in bone, white lines mark domain sizes of hydroxylapatite on nanoscale; (b) details of two domain sizes in (a); (c) corresponding energy spectrum of (a); (d) energy spectrum of natural HAP in eclogite (sample B208) with Ca/P = 1.671 obtained by electron microprobe analysis (EMPA).
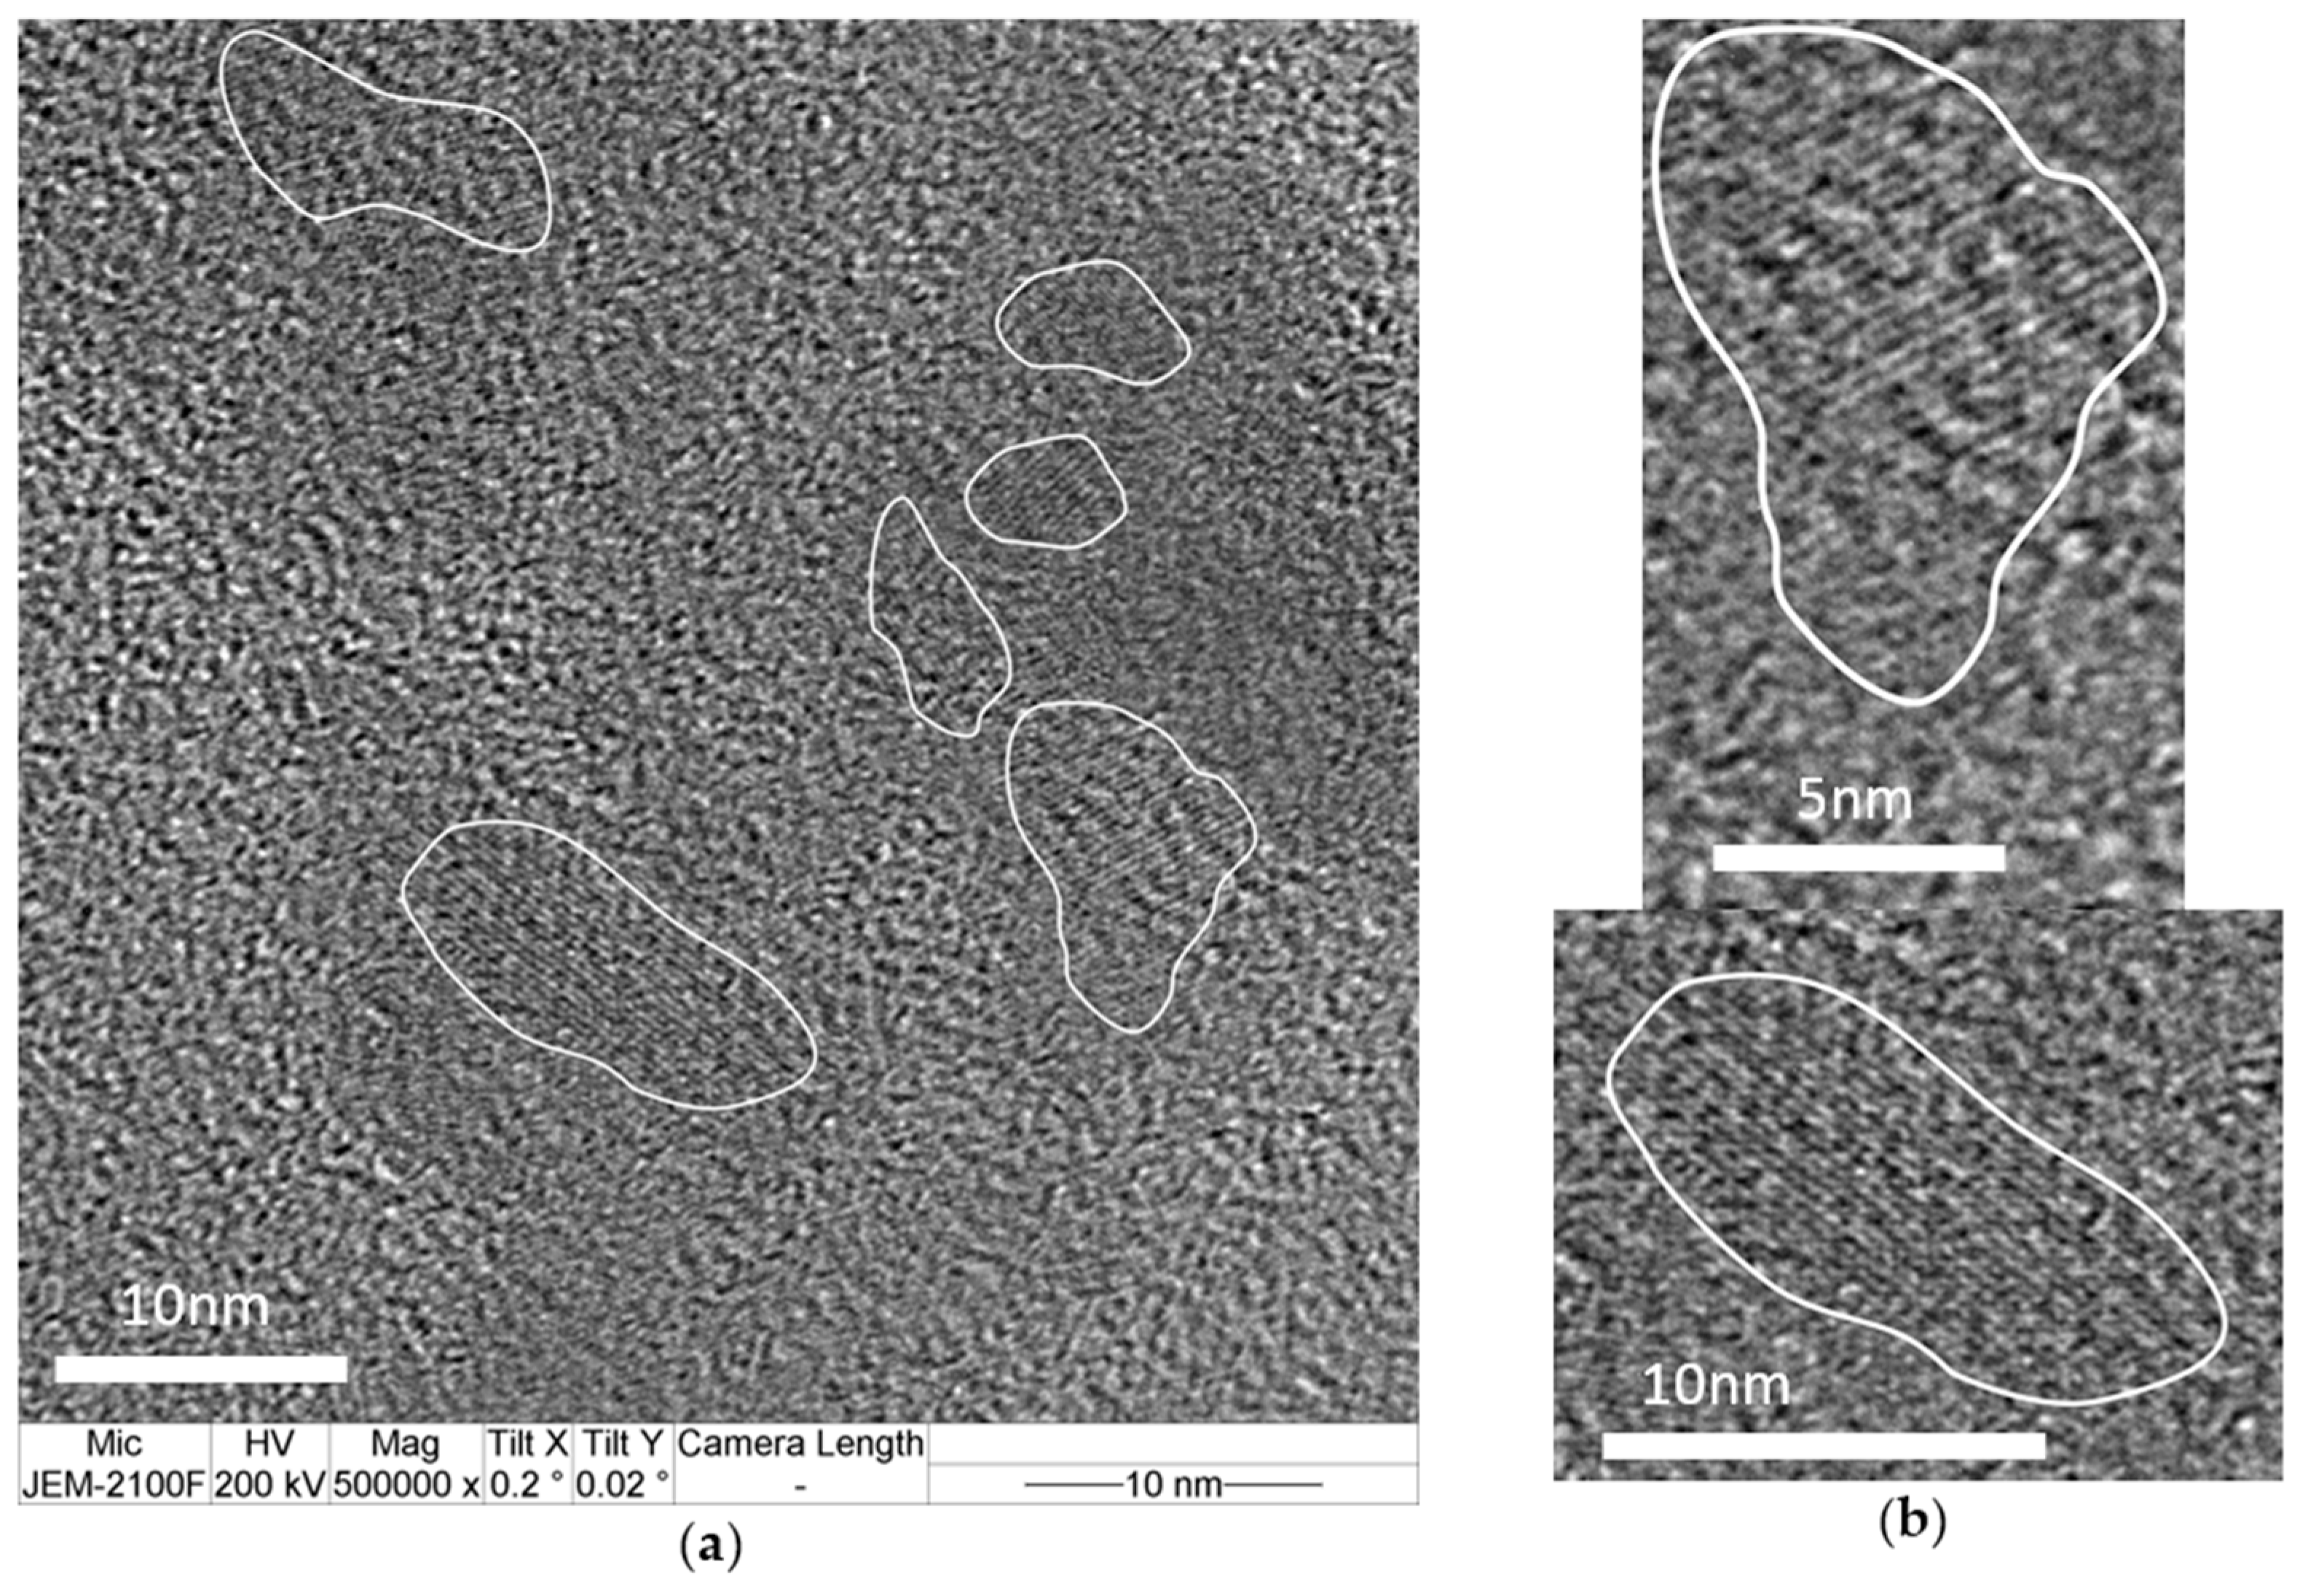

Figure 3.
XRMD patterns of HAPs (B1, B2, B3) and XRD patterns of powder HAPs (P1, P2) in bones of Cololabis saira; [17]: standard XRD pattern of ICDD 01-086-0740, B1: fishbone, B2: 161212, B3: measured on the elongation surface of fishbone, P1: normal powder, P2: fried-powder. For additional meanings of B1, B2, P1 and P2, see Table 1.
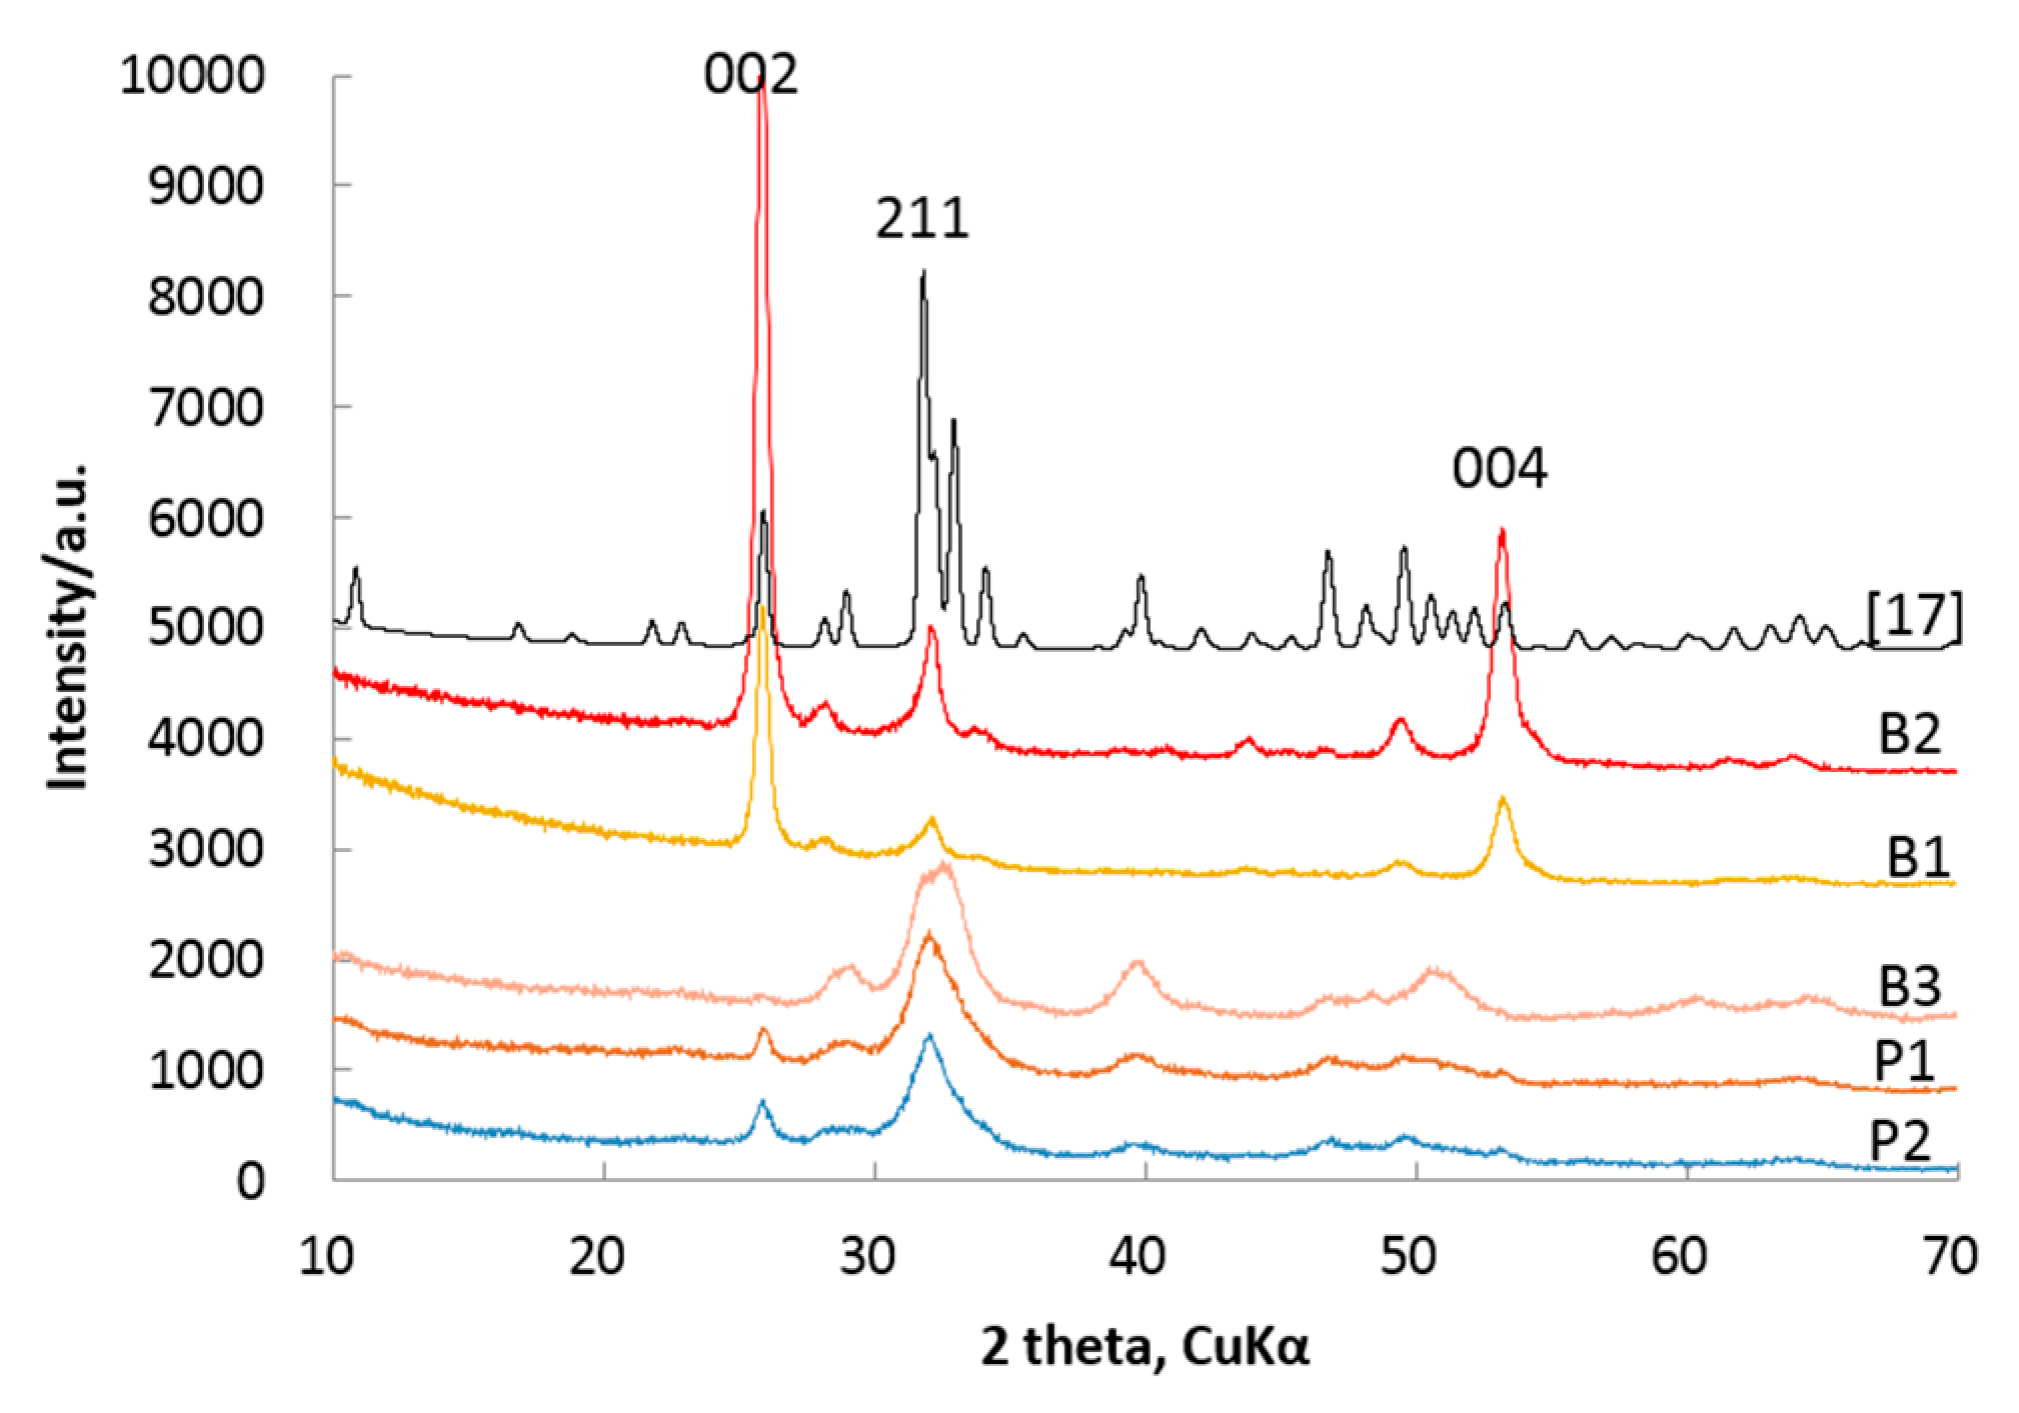
Figure 4.
Relationship between lattice planes and index DR. Empty square: fishbone, black square: 161212, empty circle: powder, black circle: fried-powder.
Figure 4.
Relationship between lattice planes and index DR. Empty square: fishbone, black square: 161212, empty circle: powder, black circle: fried-powder.
Figure 5.
FTIR spectra of HAP in bones of Cololabis saira.
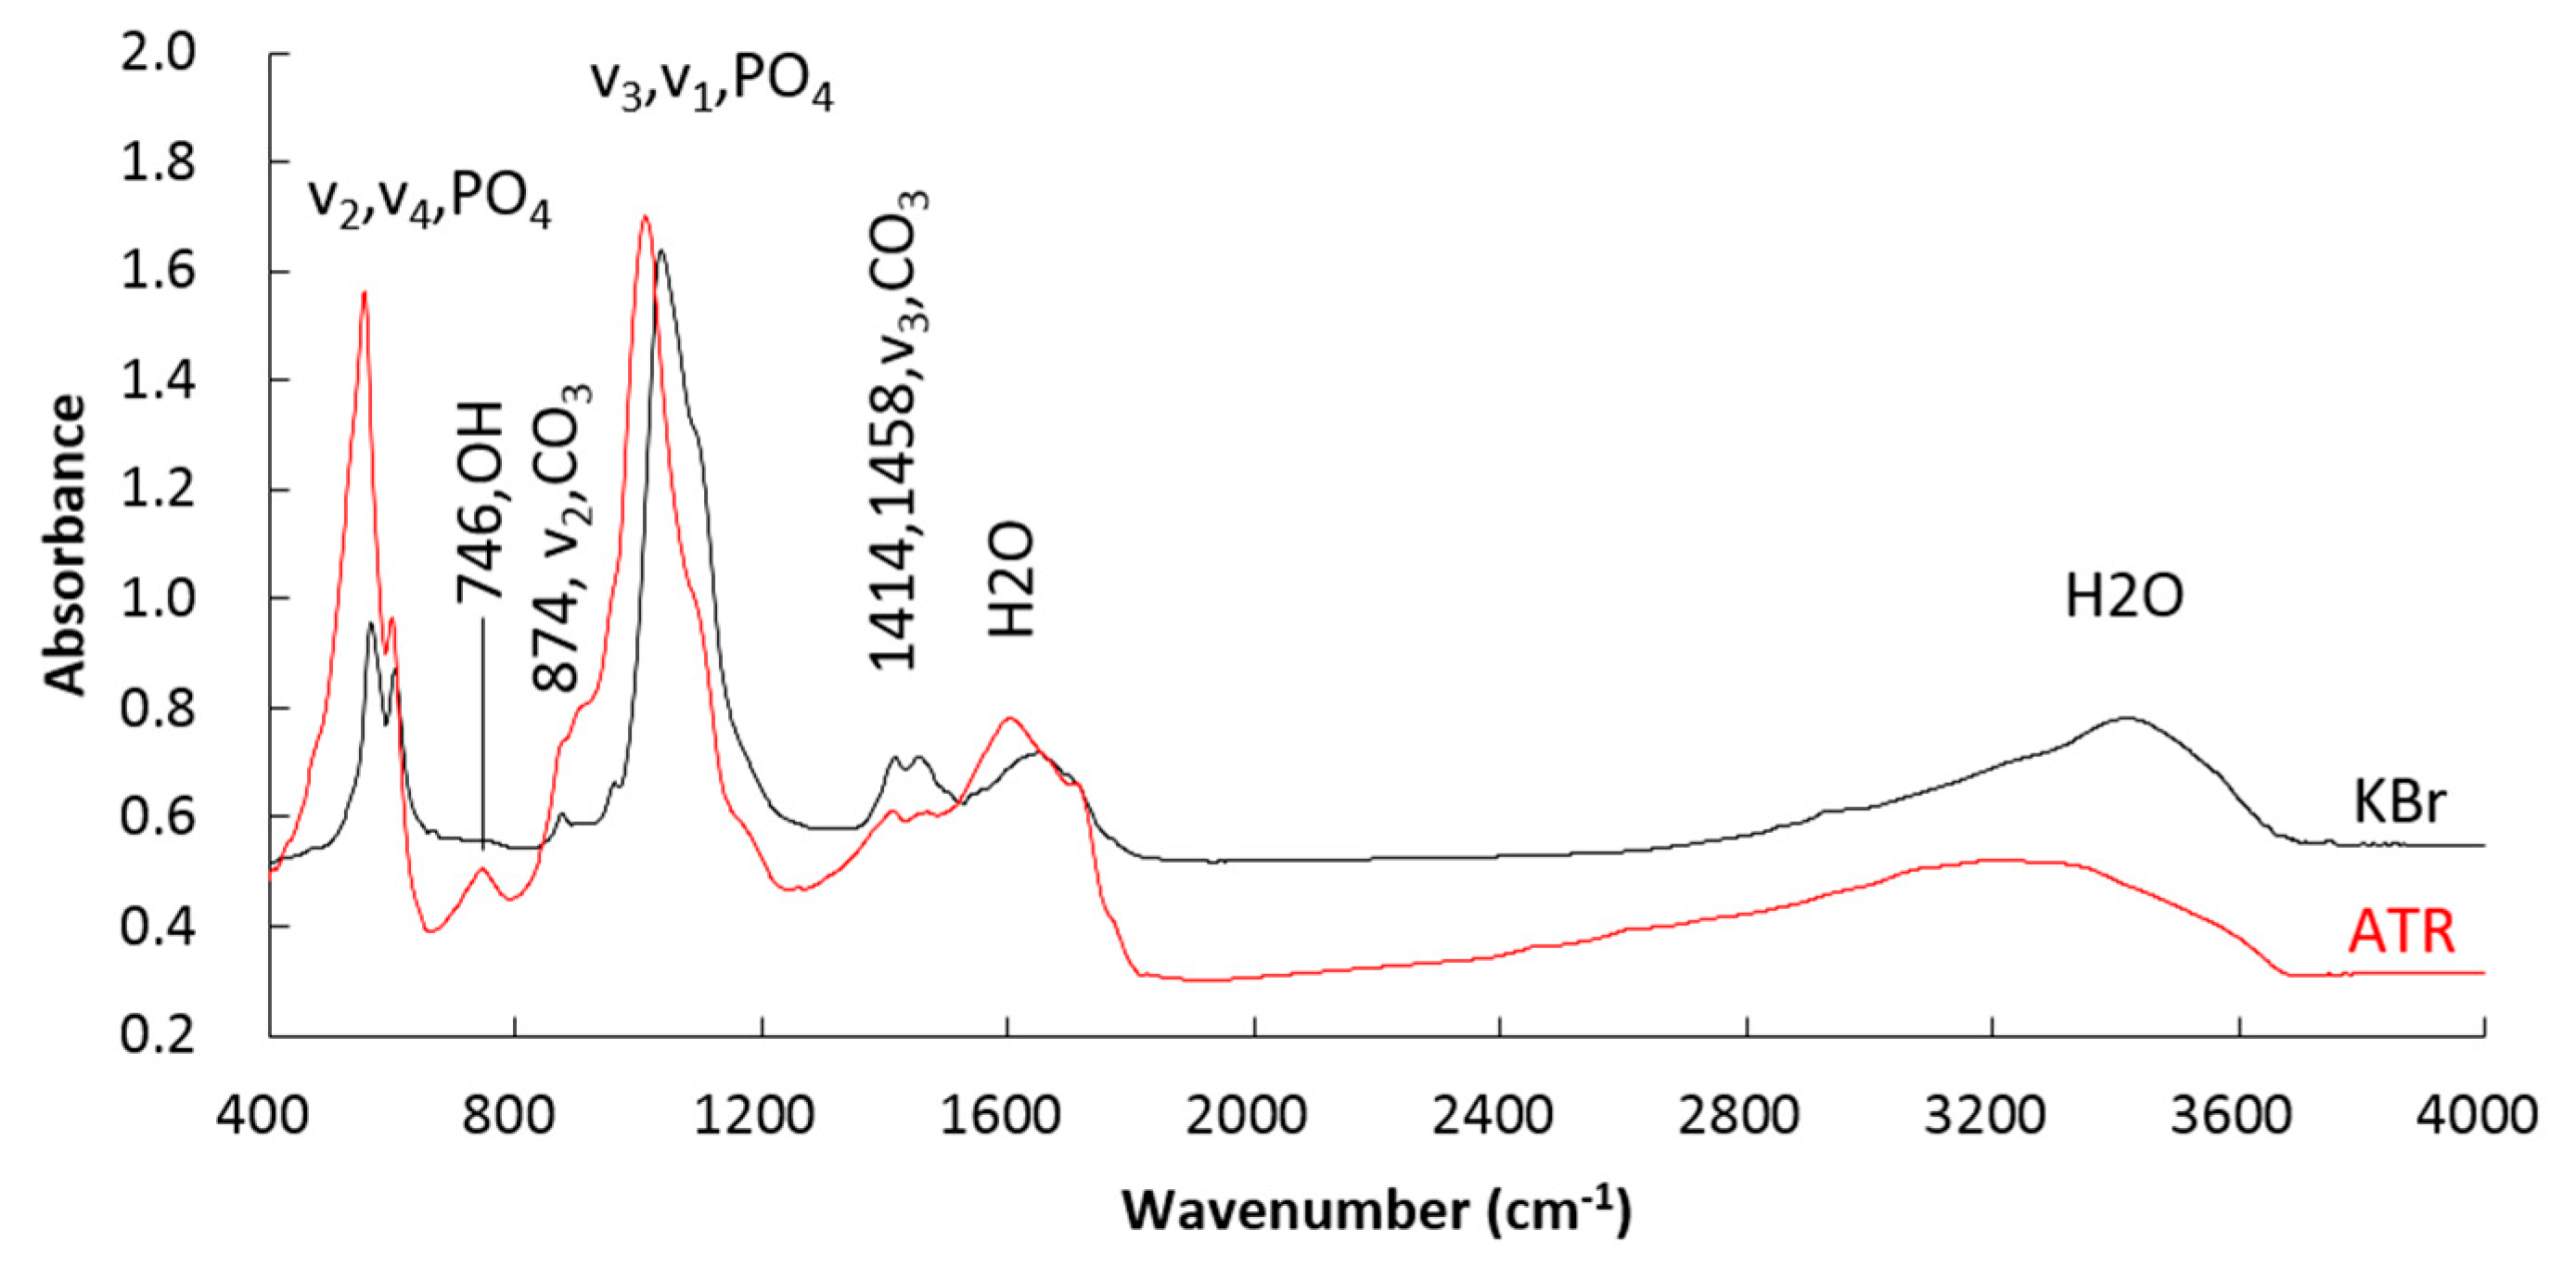
Figure 6.
SEM image of HAP in bones of Cololabis saira. (a) micrograph of HAP particles observed on section surface perpendicular to the c-axis. (b) HAP clusters observed on elongation section surface parallel to the c-axis.
Figure 6.
SEM image of HAP in bones of Cololabis saira. (a) micrograph of HAP particles observed on section surface perpendicular to the c-axis. (b) HAP clusters observed on elongation section surface parallel to the c-axis.
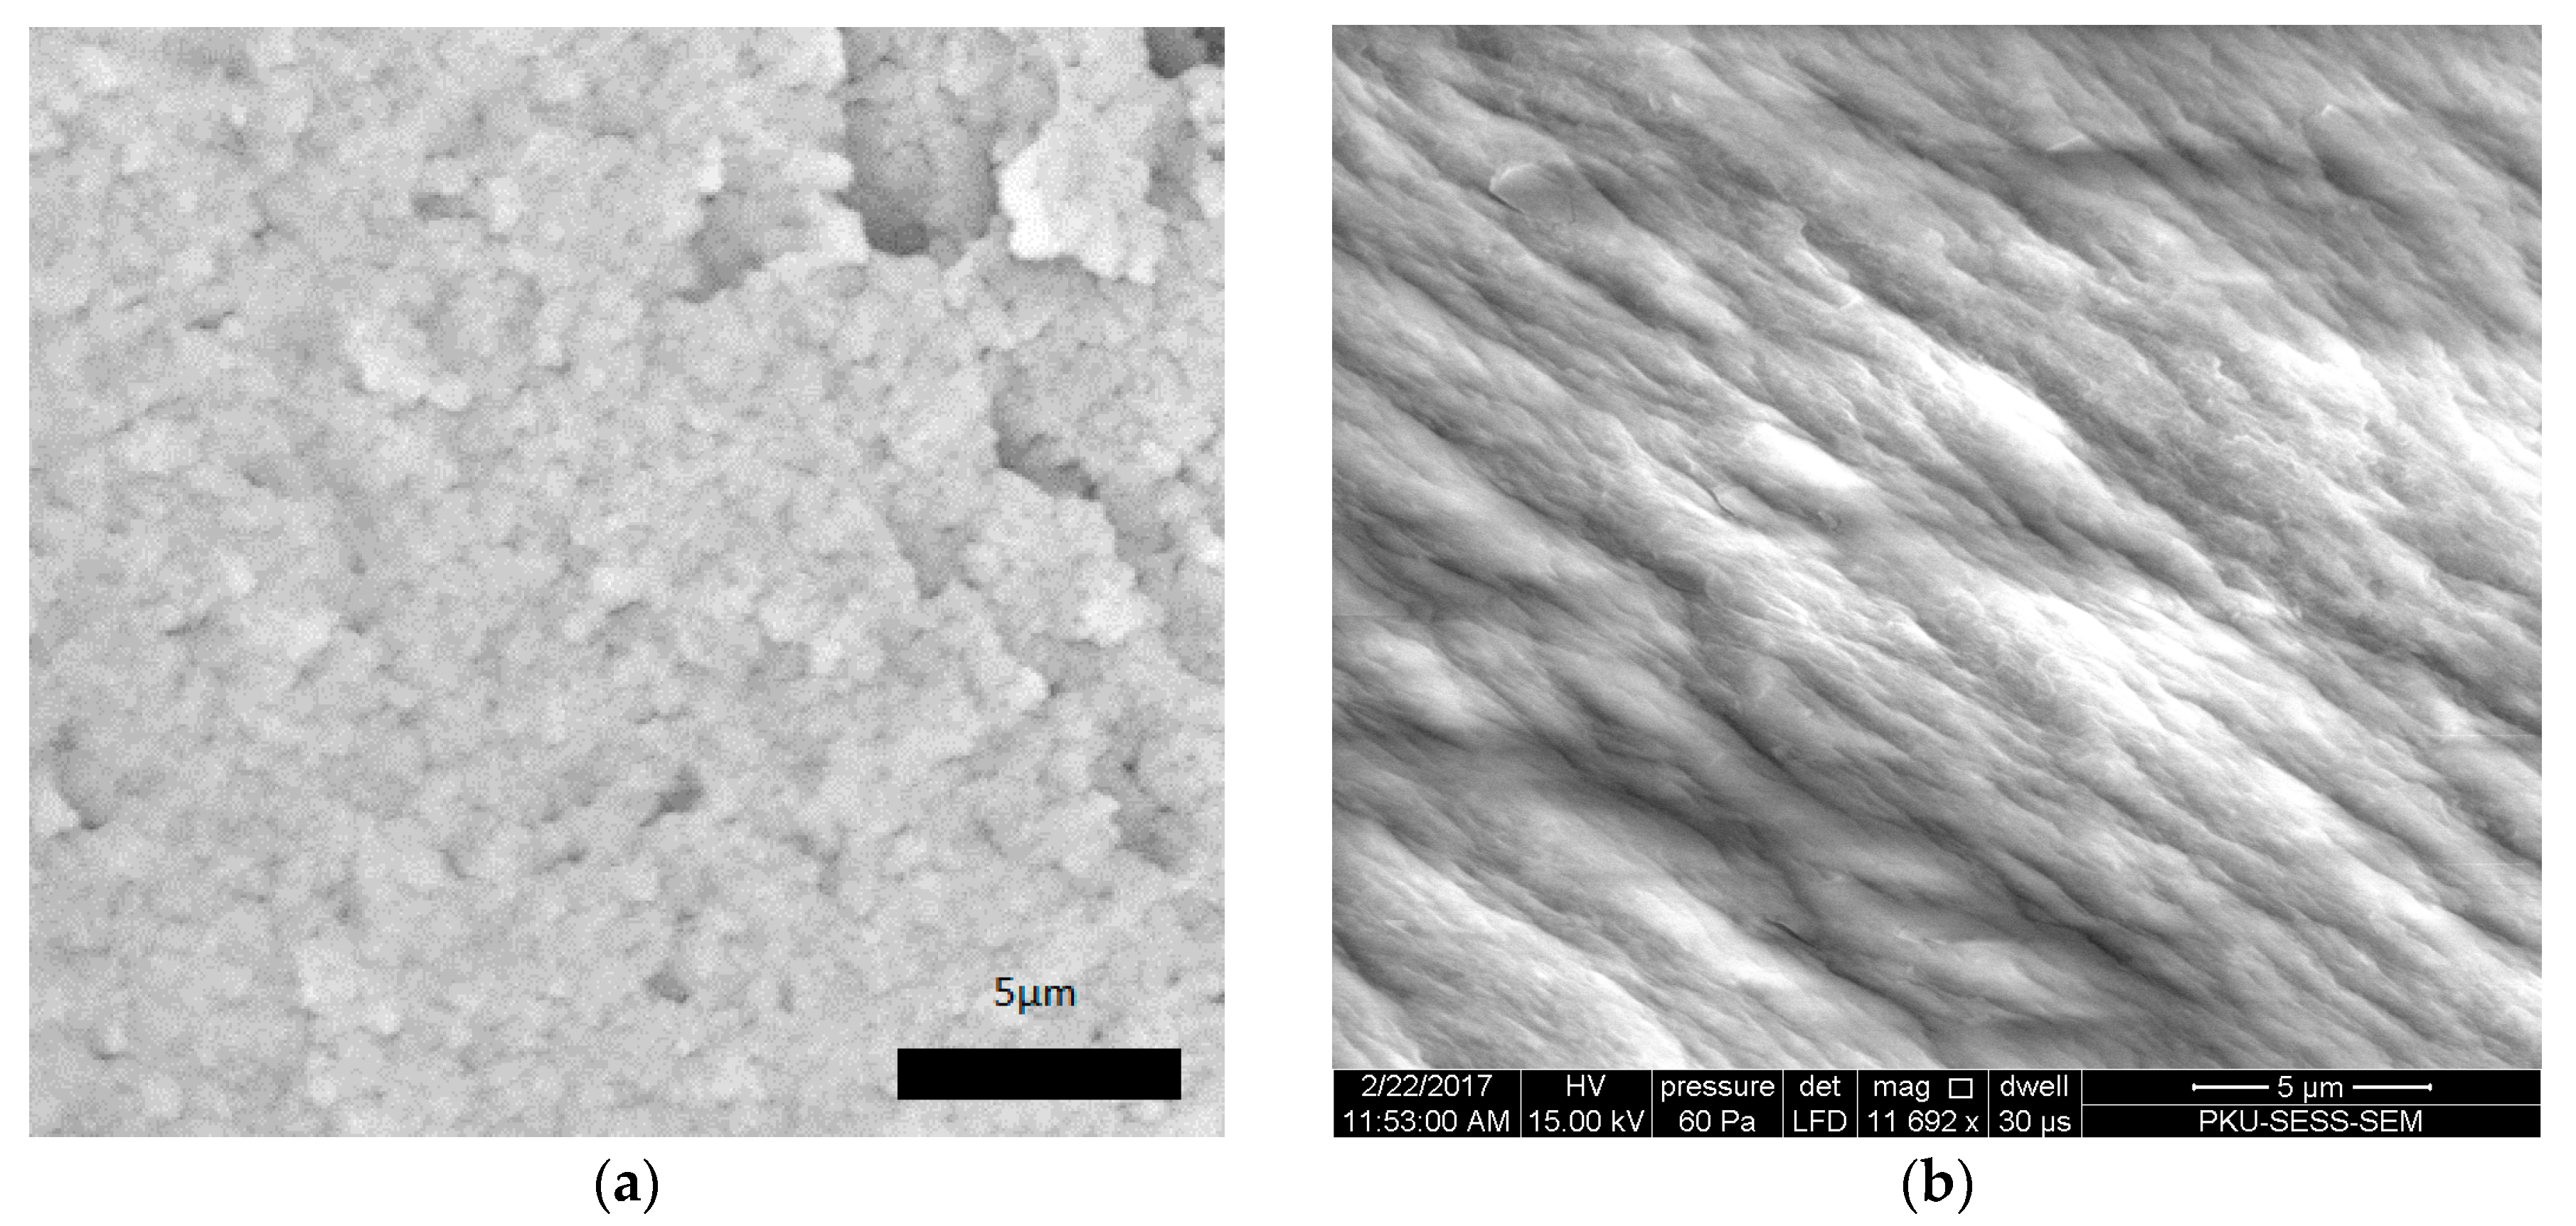
Figure 7.
(a) image of HAP in bones of the Cololabis saira. Squares in dashed color lines indicate the selected areas for FFT; (b) inverse FFT; and (c) FFT pattern indicating the [001] view direction; in other words, the surface of the super thin section is perpendicular to the crystallographic c-axis; (d) correlation image of FFT and IFFT.

Table 1.
XRD data of HAP in bones of Cololabis saira (nm).
| hkl | 01-086-0740 a | B1 | B2 | P1 | P2 |
|---|---|---|---|---|---|
| 100 | 0.80991 | 0.80803 | 0.80965 | ||
| 101 | 0.52444 | 0.52713 | 0.52779 | ||
| 111 | 0.38677 | 0.39296 | 0.39089 | ||
| 002 | 0.34410 | 0.34312 | 0.34432 | 0.34335 | 0.34432 |
| 102 | 0.31670 | 0.31664 | 0.31679 | 0.31563 | 0.31631 |
| 210 | 0.30612 | 0.30867 | 0.30485 | ||
| 211 | 0.27970 | 0.27851 | 0.27902 | ||
| 112 | 0.27715 | 0.27852 | 0.27770 | 0.27748 | |
| 202 | 0.26222 | 0.26374 | 0.26212 | ||
| 212 | 0.22871 | 0.22997 | 0.22792 | 0.22801 | |
| 130 | 0.22463 | 0.22495 | |||
| 103 | 0.22072 | 0.22102 | 0.22077 | ||
| 113 | 0.20595 | 0.20677 | 0.20655 | 0.20601 | 0.20666 |
| 203 | 0.19960 | 0.20058 | 0.19801 | 0.19996 | |
| 222 | 0.19339 | 0.19427 | 0.19431 | ||
| 213 | 0.18357 | 0.18433 | 0.18274 | 0.18342 | |
| 004 | 0.17205 | 0.17220 | 0.17225 | 0.17147 | 0.17187 |
| 322 | 0.16349 | 0.16469 | 0.16349 | ||
| 124 | 0.14998 | 0.15046 | 0.15057 | 0.150541 | |
| 502 | 0.14656 | 0.14599 | 0.14562 | ||
| 304 | 0.14509 | 0.14519 | 0.14557 | ||
| 523 | 0.12896 | 0.12968 | |||
| 234 | 0.12624 | 0.12611 | |||
| 144 | 0.12328 | 0.12374 | 0.13209 |
a: ICDD [17], B1: raw bone sample “fishbone”, B2: raw bone sample “161212”, P1: “normal powder” ground from raw bones, P2: “fried-powder” ground from bones after heating at 300 °C for an hour.
Table 2.
EDS data (atom %) of HAP in bones of Cololabis saira.
| Element | QDY-45-1 | QDY-45-2 | QDY-26 |
|---|---|---|---|
| O | 68.00 | 63.05 | 57.17 |
| Na | - | - | 0.45 |
| Mg | 1.28 | 1.25 | 1.52 |
| Fe | 0.20 | - | 0.16 |
| Ca | 18.72 | 22.29 | 25.87 |
| Al | - | 0.49 | - |
| Si | 1.21 | 0.3 | - |
| P | 10.59 | 12.58 | 14.84 |
| Σ | 100 | 100 | 100 |
| VI/IV | 1.71 | 1.76 | 1.89 |
| Ca/P | 1.76 | 1.77 | 1.74 |
QDY: abbreviation of Chinese word Cololabis saira, -: undetectable.
Table 3.
Lattice parameters of HAP in bones of Cololabis saira.
| Parameters | B1 | B2 | P1 | P2 |
|---|---|---|---|---|
| a/nm | 0.93787 | 0.93740 | 0.93636 | 0.93622 |
| c/nm | 0.68892 | 0.69011 | 0.68549 | 0.68823 |
| V/nm3 | 0.52479 | 0.52517 | 0.52050 | 0.52242 |
B1: fishbone, B2: 161212, P1: normal powder, P2: fried-powder. Additional meanings see Table 1.
Table 4.
FWHM (Δ°2θ) and domain size (nm) of HAP in the bones of Cololabis saira.
| Planes | B1 | B2 | P1 | P2 |
|---|---|---|---|---|
| FWHM100 | - | - | 1.513 | 0.965 |
| Size100 | - | - | 6.0 | 9.6 |
| FWHM002 | 0.511 | 0.482 | 0.524 | 0.675 |
| Size002 | 19.4 | 20.7 | 18.9 | 14.4 |
B1: fishbone, B2: 161212, P1: normal powder, P2: fried-powder, -: invisible. For additional meanings, see Table 1.
Table 5.
Values of textural index R.
| Plane | B1 | B2 | P1 | P2 |
|---|---|---|---|---|
| 002 | 0.05 | 0.03 | 1.08 | 0.83 |
| 102 | 0.23 | 0.29 | 1.03 | 0.95 |
| 112 | 0.49 | 0.51 | 1.00 | 1.01 |
| 213 | 0.53 | 0.52 | 1.11 | 1.07 |
| 004 | 0.04 | 0.04 | 1.02 | 0.92 |
B1: fishbone, B2: 161212, P1: normal powder, P2: fried-powder. For additional meanings, see Table 1.
Table 6.
Values of textural degree index DR (%).
| Plane | B1 | B2 | P1 | P2 |
|---|---|---|---|---|
| 002 | 95.33 | 96.93 | 6.83 | 16.89 |
| 102 | 76.55 | 70.88 | 2.89 | 5.33 |
| 112 | 51.20 | 49.28 | 0.06 | 1.03 |
| 213 | 47.22 | 48.37 | 10.80 | 6.55 |
| 004 | 96.11 | 96.30 | 1.63 | 7.55 |
B1: fishbone, B2: 161212, P1: normal powder, P2: fried-powder. For additional meanings, see Table 1.
© 2017 by the authors. Licensee MDPI, Basel, Switzerland. This article is an open access article distributed under the terms and conditions of the Creative Commons Attribution (CC BY) license (http://creativecommons.org/licenses/by/4.0/).
Share and Cite
MDPI and ACS Style
Wang, H.; Yuan, L.; An, J. Crystallographic Characteristics of Hydroxylapatite in Hard Tissues of Cololabis saira. Crystals 2017, 7, 103. https://doi.org/10.3390/cryst7040103
AMA Style
Wang H, Yuan L, An J. Crystallographic Characteristics of Hydroxylapatite in Hard Tissues of Cololabis saira. Crystals. 2017; 7(4):103. https://doi.org/10.3390/cryst7040103
Chicago/Turabian StyleWang, Hejing, Lei Yuan, and Jiali An. 2017. "Crystallographic Characteristics of Hydroxylapatite in Hard Tissues of Cololabis saira" Crystals 7, no. 4: 103. https://doi.org/10.3390/cryst7040103
Note that from the first issue of 2016, this journal uses article numbers instead of page numbers. See further details here.