
The Synergetic Effects of Combining Structural Biology and EPR Spectroscopy on Membrane Proteins

Institute of Biochemistry, Goethe University Frankfurt, Max-von-Laue-Strasse 9, 60438 Frankfurt, Germany
*
Author to whom correspondence should be addressed.
Crystals 2017, 7(4), 117; https://doi.org/10.3390/cryst7040117
Submission received: 14 February 2017
/
Revised: 9 April 2017
/
Accepted: 12 April 2017
/
Published: 20 April 2017
(This article belongs to the Special Issue Recent Advances in Protein Crystallography)
Abstract
:Protein structures as provided by structural biology such as X-ray crystallography, cryo-electron microscopy and NMR spectroscopy are key elements to understand the function of a protein on the molecular level. Nonetheless, they might be error-prone due to crystallization artifacts or, in particular in case of membrane-imbedded proteins, a mostly artificial environment. In this review, we will introduce different EPR spectroscopy methods as powerful tools to complement and validate structural data gaining insights in the dynamics of proteins and protein complexes such that functional cycles can be derived. We will highlight the use of EPR spectroscopy on membrane-embedded proteins and protein complexes ranging from receptors to secondary active transporters as structural information is still limited in this field and the lipid environment is a particular challenge.
1. Introduction
Structural biology aims for studying molecular structures and dynamics of biological macromolecules, in particular proteins and nucleic acids, to gain a deeper comprehension of how alterations in their structures affect their function. Here, mostly X-ray crystallography and cryo-electron microscopy provide structural information of the protein of interest at atomic resolution for a broad molecular weight range [1,2,3]. Based on those structures, complex interfaces can be analyzed, structure-based drugs designed and various mechanisms predicted. However, for different targets, in particular membrane proteins, structural biology is still challenging and often, rare conformations are difficult to trap. In addition, for the overall understanding of the proteins’ function a dynamic picture is essential. Time-resolved crystallography has been successfully conducted on proteins that are biologically active in the crystalline state with recent developments on X-ray free-electron lasers allowing for femtosecond time resolution on macromolecular structures, in both single crystals and solution. However, more frequently information on rare conformations and protein dynamics is gained by nuclear magnetic resonance (NMR) spectroscopy, Förster resonance energy transfer (FRET) spectroscopy and electron paramagnetic resonance (EPR) spectroscopy as well as combinations thereof. Furthermore, NMR spectroscopy allows for high-resolution structure determination. Based on the nuclear Overhauser effect (NOE) intra- and intermolecular distances below 1 nm can be assigned. In addition, NMR spectroscopy provides information about changes in the protein conformation and protein folding/unfolding in native-like conditions. However, the timescale of this technique is in the nano- to millisecond time range and may impede the study of short-lived intermediates. Further challenges are its limitation by the size and molecular weight of the investigated system and the low sensitivity, which is based on the magnetic moment of the nucleus. In comparison, FRET spectroscopy permits measurements of proteins in solution and is not limited by the size or the molecular weight of the investigated system. As a fluorescence-based method FRET spectroscopy exhibits very high sensitivity and allows for time-resolved experiments especially in single-molecule approaches. A particular challenge of this method is the uncertainty of the orientation factor, one of the key parameters of FRET spectroscopy, allowing rather the accurate determination of distance changes than exact distance values in a distance range of 1–8 nm. In addition, the usage of two different FRET labels complicates the required labeling strategy in particular for multimeric proteins. Simultaneously, the molecular size of these labels may cause structural perturbations and prevent native folding of the labeled protein.
Here, EPR spectroscopy, especially continuous wave (cw) and pulsed EPR, can complement the above discussed methods and beyond that contribute novel structural and dynamic information. Its inherent strength is substantiated in its various applications to proteins, notably to membrane proteins solubilized in detergent or embedded in the lipid bilayer and protein complexes in native-like conditions. Thus, this technique is not limited by the size or the complexity of the investigated system (for further reviews see e.g., [4,5,6]). Cw EPR spectroscopy probes the dynamics of a nitroxide side chain, the polarity of its environment and the structural properties of proteins such as interspin distances in the range of 0.8–1.8 nm in a time regime ranging from picoseconds to seconds. The potential of pulsed EPR spectroscopy, in particular pulsed electron double resonance (PELDOR) or referred to as double electron-electron resonance (DEER), lies in the accurate determination of interspin distances in the range of 2–8 nm including the membrane thickness of approximately 4 nm and covering the most important distance regime necessary for structural investigations.
This review summarizes the versatile aspects of EPR spectroscopy and the synergistic effects resulting from the combination of EPR spectroscopy and structural biology. Furthermore, this paper highlights the latest progress with special emphasis on applications to different classes of membrane proteins.
2. Continuous Wave (cw) and Pulsed EPR Methods—An Overview
2.1. Site-Directed Spin Labeling
A prerequisite for the utilization of EPR spectroscopy is the introduction of paramagnetic centers. For this purpose several paramagnetic species can be chosen e.g., radical centers, metal ions, Cu2+ or FeS clusters or nitroxide spin labels [7,8]. The choice of the spin label can be critical as it should be short enough to reduce its intrinsic flexibility but long enough to allow the native folding of the spin-labeled protein. Due to its specificity to cysteine residues, chemical stability and only small structural perturbations the (1-oxyl-2,2,5,5-tetramethylpyrroline-3-methyl)methanethiosulfonate (MTS) spin label is the most commonly used EPR spin probe in proteins [9]. The spin label is bound to the sulfhydryl group of a cysteine residue by the formation of a disulfide bond. By the formation of the disulfide bond created spin label side chains are frequently abbreviated as R1. Cysteines chosen for labeling are either endogenous amino acids or, more often, via site-directed mutagenesis engineered cysteine residues at defined positions. The latter requires not only the insertion of the cysteine but also the exchange of endogenous cysteine residues to achieve a defined system. Therefore, alanine or serine residues mostly replace endogenous cysteines. An alternative approach for spin labeling is the click-chemistry which utilizes a highly selective carbon–heteroatom bond under mild conditions [10]. Initially, the highly exergonic character of the copper-catalyzed azide-alkyne 1,3-dipolar cycloaddition (CuAAC), also called copper(I)-catalyzed Huisgen-Sharpless-Meldal alkyneazide cycloaddition has been used for spin labeling of DNA on solid-phase by the Sigurdsson group [11] and in solution by the Steinhoff group [12]. Although this approach has been advanced for the successful spin labeling of proteins by means of applying azide- and alkyne-functionalized spin labels, this review focuses on the application of EPR spectroscopy in combination with the commonly used MTS spin label. Additional functional approaches are required to confirm the functionality of the mutated, spin-labeled variant for all spin labeling approaches.
2.2. Spin Label Side Chain Mobility
In general, cw EPR measurements performed at different temperatures yield diverse information about the spin label dynamics, the interaction with its local environment, the position of the spin label with respect to the membrane boundaries and interspin distances in the range of 0.8–1.8 nm. Cw EPR experiments at room temperature (RT) and the adjacent analysis gain information about the motion of the nitroxide side chain and allow for conclusions about the spin label’s microenvironment as different environments effect the spin label’s motion differently. The time scale of EPR spectroscopy is in the order of nanoseconds, such that it is suitable for a broad range of fundamental biological processes. Extensive studies of the relation of the EPR spectra and the protein structure are reported in literature [13,14]. In Section 3.2 we introduce an EPR study on the activation mechanisms in a functional chimera of the extracellular domain of amine-gated Erwinia chrysanthemi ligand–gated ion channel and the transmembrane domain of Gloeobacter violaceus ligand–gated ion channel. This investigation is based on the application of cw EPR experiments at room temperature.
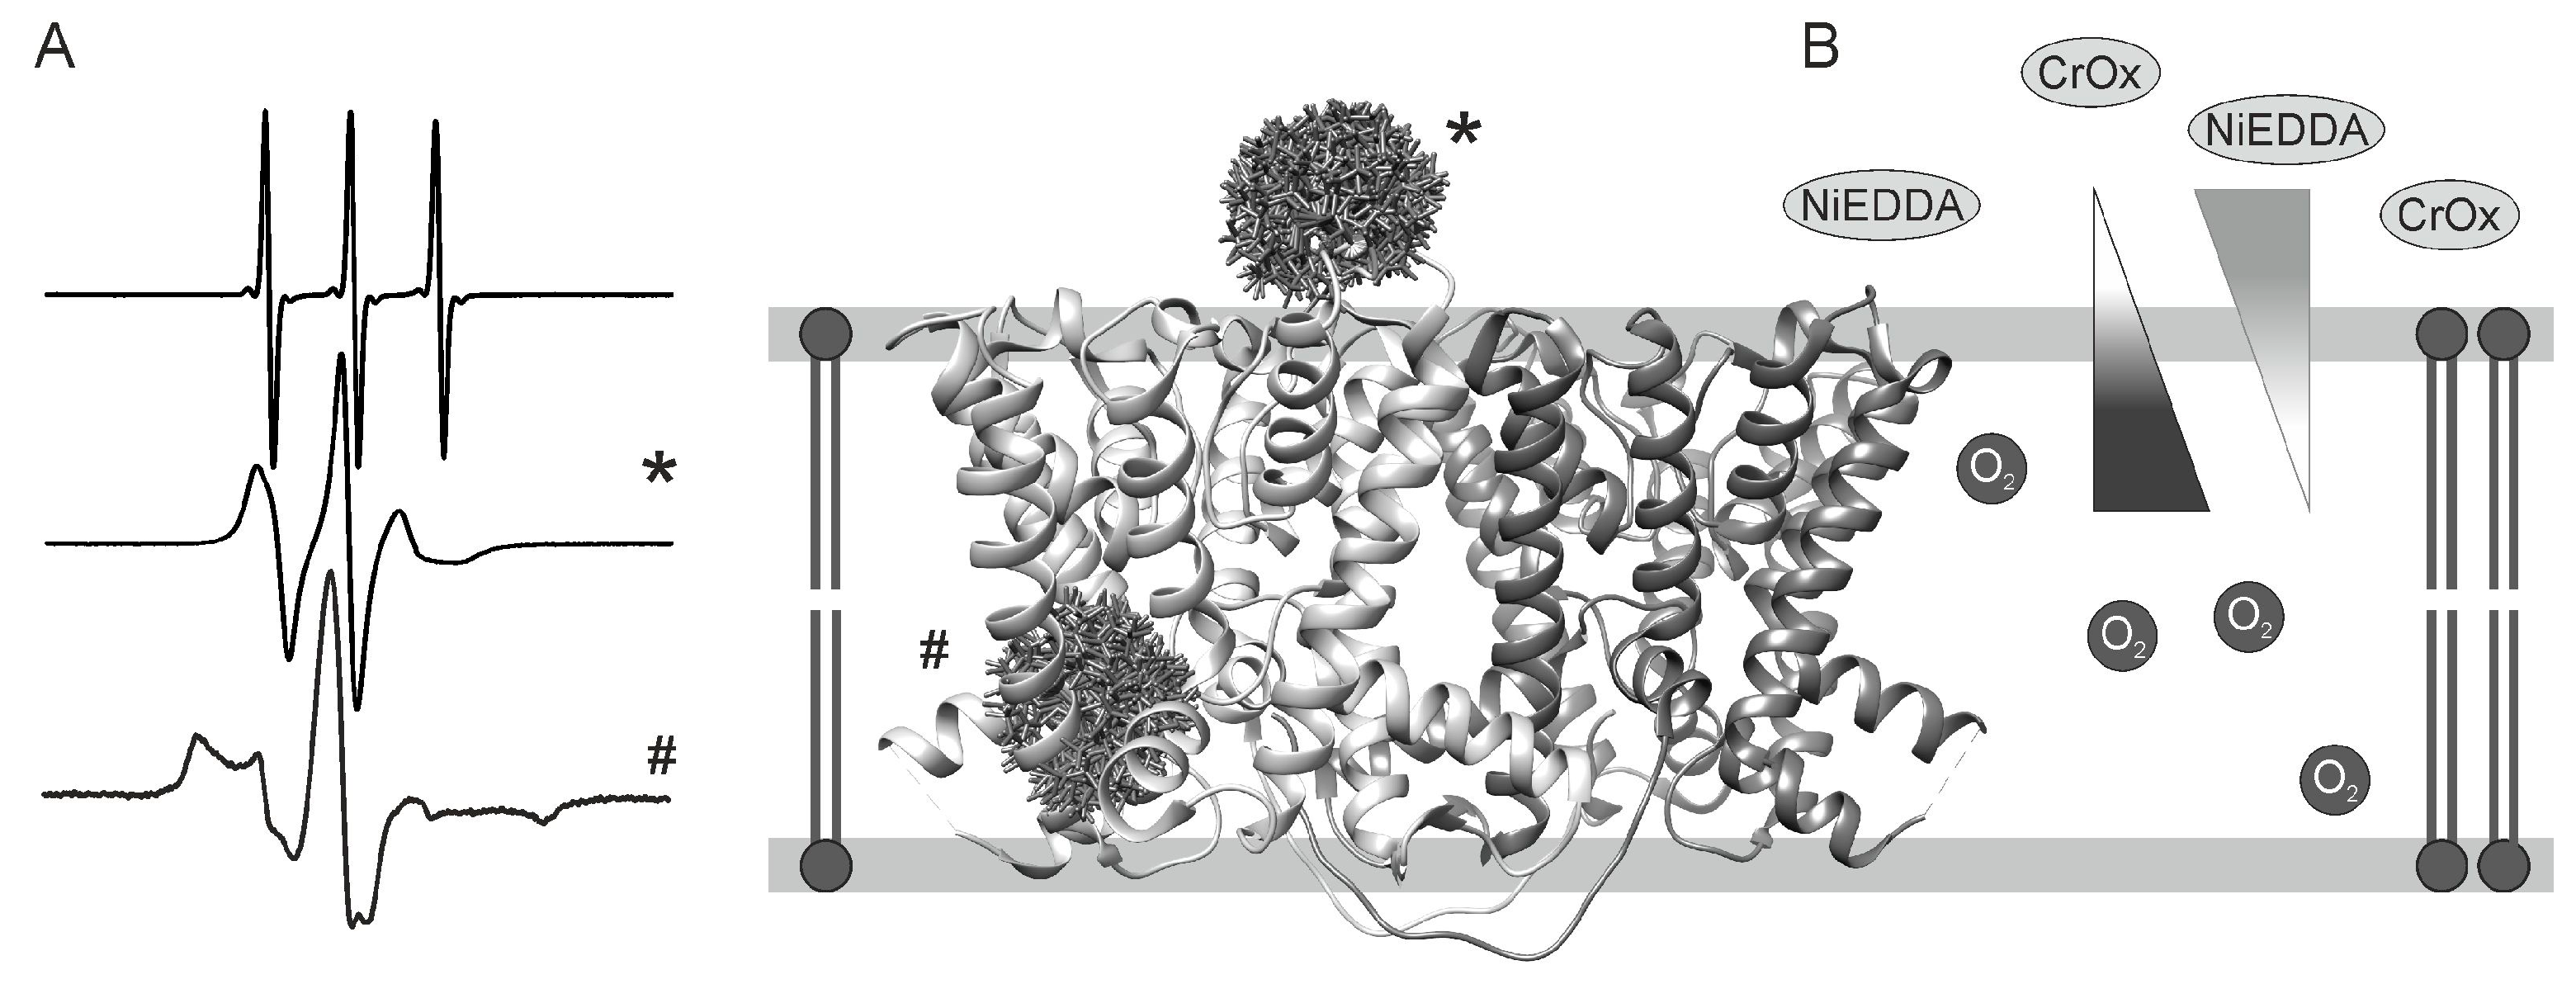
The intrinsic spin label motion is characterized by its rotational correlation time, which depends on the spin label’s intrinsic flexibility and its length. However, the measured effective rotational correlation time of a spin label bound to a protein is a result of the spin label’s interaction with the primary, secondary, tertiary and eventually quaternary structure of the protein. Additionally, the protein itself tumbles in solution, which may add to the overall rotational correlation time. Although, the rotational correlation time for proteins, protein complexes or proteins inserted into detergent micelles or liposomes with a total molecular weight above 200 kDa exceeds the sensitivity of the EPR time scale and thus is not resolved in the room temperature cw EPR spectra. Consequently, the term ‘mobility’ can be mostly interpreted to describe the interaction of the nitroxide side chain with its local environment. Weak interactions and thus a high degree of spin label mobility are defined as only marginal or no restrictions of the motional freedom of the spin probe by its close proximity. This situation applies to helix surfaces or loop regions as depicted in Figure 1. As a consequence the linewidth and the apparent hyperfine splitting of the EPR spectrum, reflected in the difference between the low and high field peak, are narrow. In contrast, the linewidth and the apparent hyperfine splitting increase for a restricted motional freedom of the spin label. This is the case for strong interaction of the nitroxide side chain with neighboring side chains or backbone atoms as found in tertiary contacts or at buried sites. However, in an equilibrium between two conformations with different dynamics or in the presence of two spin label rotamers with different degrees of motion, the detected cw EPR spectrum is the sum of the respective cw EPR spectra of each contribution. These multiple components in the spectra can be deduced by analyzing the cw EPR spectrum and may provide additional valuable information about the protein or protein complex.
The semi-empirical mobility parameters ΔH−1, the inverse linewidth of the central EPR peak, and the inverse second moment <H2>−1, the spectral breadth, allow a qualitative analysis of room temperature EPR spectra [14,15]. They refer to the motional freedom of the nitroxide side chain and therefore correlate to its interaction with the local environment and accordingly to the proximate structure of the investigated protein. As a result of the interaction between the nitroxide side chain and its environment, the motion of the spin label is anisotropic [16,17]. Both semi-empirical mobility parameters ΔH−1 and <H2>−1 are affected by the degree of averaging the anisotropic g and the hyperfine tensors. Thereby, the anisotropic g reflects the orientation dependency of the magnetic moment of the electron with respect to the molecule or on the orientation of the molecule with respect to the magnetic field direction, respectively.
In the case of multiple components in the cw EPR spectrum the inverse linewidth ΔH−1 is most affected by the mobile component and is sensitive to changes in the mobile component rather than to changes in the immobile component. On the contrary, the second moment <H2>−1 is dominated by the immobile component. Plotting the semi-empirical mobility parameters as a function of a series of amino acid residues discloses a periodic variation of the nitroxide side chain mobility and permits the identification of secondary structure elements such as protein surfaces, tertiary contacts or buried sites and thus the assignment of α-helices, β-strands or unstructured regions.
A quantitative analysis of room temperature cw EPR spectra requires the simulation of the EPR spectra on the basis of dynamic models [18,19,20] or molecular dynamics (MD) simulations [21,22]. Both approaches provide additional information for local interactions of the nitroxide side chain and the dynamics of the investigated system. In the latter case the analysis of cw EPR spectra supports the optimization of structural models as provided by structural biology.
2.3. Accessibility of the Spin Label Side Chain
A more advanced methodology compared to the beforehand-described cw EPR measurements is the determination of the accessibility of the nitroxide side chain towards paramagnetic quenchers. These cw EPR experiments carried out at room temperature provide additional information about the positioning of the EPR spin probe with respect to membrane/water/protein boundaries [23,24,25,26]. For instance, the analysis of accessibility experiments in combination with side chain mobility and interspin distance measurements has verified a beforehand proposed model for the HAMP domain of the NpHtrII/NpSRII complex from Natronomonas pharaonic (cf. Section 3.1).
The term accessibility is reflected by the Heisenberg exchange frequency Wex of the spin label with a paramagnetic reagent in solution. To determine the Heisenberg exchange frequency of a spin label with different paramagnetic quenchers initially the saturation behavior of a specific nitroxide side chain is determined. Here, saturation describes the state where the rate of excitation of the spin system exceeds the ability of the spin system to relax to equilibrium. In this context, the relaxation time is given by the spin-lattice relaxation time T1. Plotting the amplitude of the central EPR peak as a function of the square root of the incident microwave yields the so-called saturation curve. With increasing microwave power the amplitude of the EPR signal increases to its maximum followed by a decrease caused by saturation. Fitting of the saturation curve provides the parameter P1/2 which is defined as the microwave power at which the amplitude of the EPR signal is half of its maximum in the absence of saturation and correlates to the relaxation rates of the nitroxide side chain. The presence of paramagnetic quenchers during accessibility measurements leads to frequent collisions with the spin label and causes Heisenberg exchange. This in turn results in alterations of the relaxation time of the spin label and consequently alterations in the values for P1/2. The difference of the P1/2 values in the presence and in the absence of the paramagnetic reagent allows the determination of the Heisenberg exchange frequency Wex. A more detailed discussion of accessibility measurements can be found in [4]. For the analysis of the insertion of a membrane protein inside a lipid bilayer different paramagnetic quenchers with different permeabilities for different environments as visualized in Figure 1B are used. Possible paramagnetic reagents are polar metal complexes (Ni(II) complexes or chromium oxalate (CrOx)), molecular oxygen or organic radicals. Commonly utilized polar metal reagents such as NiEDDA and CrOx are not membrane permeable and therefore accumulate in the aqueous phase providing insights about the accessibility of the lipid/water interface. However, the application of CrOx potentially impedes the analysis due to its negative charge and the possibility of Coulomb interactions with charged membrane surfaces or protein segments, such that the use of NiEDDA is preferred. Molecular oxygen, on the other hand, preferably remains in the lipid bilayer with its maximum in the center of the membrane [26]. By determining the Heisenberg exchange frequencies Wex for a series of spin labeled residues secondary structure elements and the location of the spin label side chains with respect to the membrane interfaces can be assigned.
2.4. Polarity of the Spin Label Side Chain Environment
Low temperature cw EPR measurements (T = 160 K) are applied to achieve information about the polarity of the spin label side chain environment and to utilize the dipolar interaction between nitroxide side chains to determine interspin distances [30]. The determination of the polarity of the spin label environment is based on the hyperfine coupling which is directly obvious in the cw EPR spectrum in the difference between the low and high field peak. In more detail, the strength of the hyperfine coupling is described by the hyperfine splitting Azz. In general, a high accessibility of water molecules to the spin label side chain causes a strong hyperfine coupling and consequently a high Azz value (cf. Figure 2A). In contrast, a low polarity of the microenvironment results in a weak hyperfine coupling and therefore small Azz values. This is associated with a low accessibility of the EPR spin probe to water molecules (cf. Figure 2B). Thereby, the determination of Azz values identifies spin labeled residues with high, low or no accessibility for water molecules and thus their orientation with respect to the lipid-water interface. Precise values for the hyperfine splitting Azz are obtained by fitting the cw EPR spectra with the EPR spectra simulation program DipFit [31] (cf. Figure 2C). Plotting the values for Azz as a function of a series of amino acid residues reveals additional structural and topological information and evidence for protein folding or existing hydrophobic barriers.
2.5. Interspin Distance Measurements
Today, the determination of interspin distances is the main application of EPR spectroscopy on proteins. Instead of one, two or more spin probes are inserted into the studied system to evaluate distance distributions and their changes at varying conditions. By this, existing protein structures can be validated and unknown structures predicted. Distance changes disclose conformational rearrangements or complex formations. Cw and pulsed EPR spectroscopy at low temperature are the methods of choice to determine interspin distances between two spin label side chains in a distance range of 0.8–6 nm [32,33,34]. The studies presented in Section 3.3 and Section 3.4 on the ABC exporter TM287/288 from Thermotoga maritima and on the secondary active transporter GltPh from Pyrococcus horikoshii provide excellent examples for the application of interspin distance measurements. Both cases visualize the potential for identifying the molecular triggers that lead to conformational changes, here from an open to a closed NBD dimer in TM287/288 and a possible transport mechanism for the trimeric GltPh, respectively.
As discussed before each spin label possesses a specific length and an intrinsic flexibility, which causes the existence of a distance distribution instead of a defined interspin distance. In addition, protein motion occurs over time scales ranging from femtoseconds (vibrations of individual bonds) to nano- and microseconds and longer (collective motions of groups of bonded and non-bonded atoms). In frozen solutions below the so-called glass transition temperature of proteins, at approximately 200 K, the dynamical properties of proteins change and the collective motions of atom groups and backbone motions are disabled. Thus, only harmonic vibrations take place. At this point, the distance distributions and the relative orientations of the nitroxide side chains are homogeneously distributed and assumed to reflect the situation present at room temperature.
Cw EPR measurements at 160 K allow the determination of interspin distances in the range of 0.8–1.8 nm based on the dipolar interaction of two spin label side chains [35]. Here, a dipolar interaction results in a considerable line broadening of the cw EPR spectra compared to the cw EPR spectra of single labeled proteins or of double labeled proteins with interspin distances larger than 1.8 nm as depicted in Figure 2C. The dipolar broadening increases with decreasing interspin distances. Fitting of the dipolar broadened EPR spectra is carried out for instance with the EPR spectra simulation program DipFit [31], which allows a quantitative analysis of EPR distance measurements. Here, accurate values for the interspin distances are derived from the precise line shape analysis of the broadened EPR spectrum with respect to beforehand-defined parameters of the respective non-broadened EPR spectrum. The best-fit parameters are computated taking a Gaussian distribution of interspin distances and an arbitrary fraction of single labeled protein under consideration. The fraction of single labeled protein can be estimated based on the spin label efficiency. Therefore, the respective experimental cw EPR spectrum at RT is double integrated and compared with the double integral of a MTS spin label standard of a known concentration to determine the concentration of the spin label in the protein sample. A subsequent comparison with the known protein concentration allows the rough calculation of the spin label efficiency. More qualitative approaches of dipolar interactions employ the correlation between the line width of the EPR spectra and the interspin distances [36]. For this purpose the spectral line amplitude ratios or the spectral second moment values are calculated, which identifies spin probes in close or distant proximity. This is commonly executed for a series of double-labeled protein [37] as this approach does not allow for the determination of the exact interspin distance values. Interspin distance values below 0.8 nm are not reliable due to the increased partial overlap of the nitrogen π-orbitals of the two interacting spin label side chains [38].
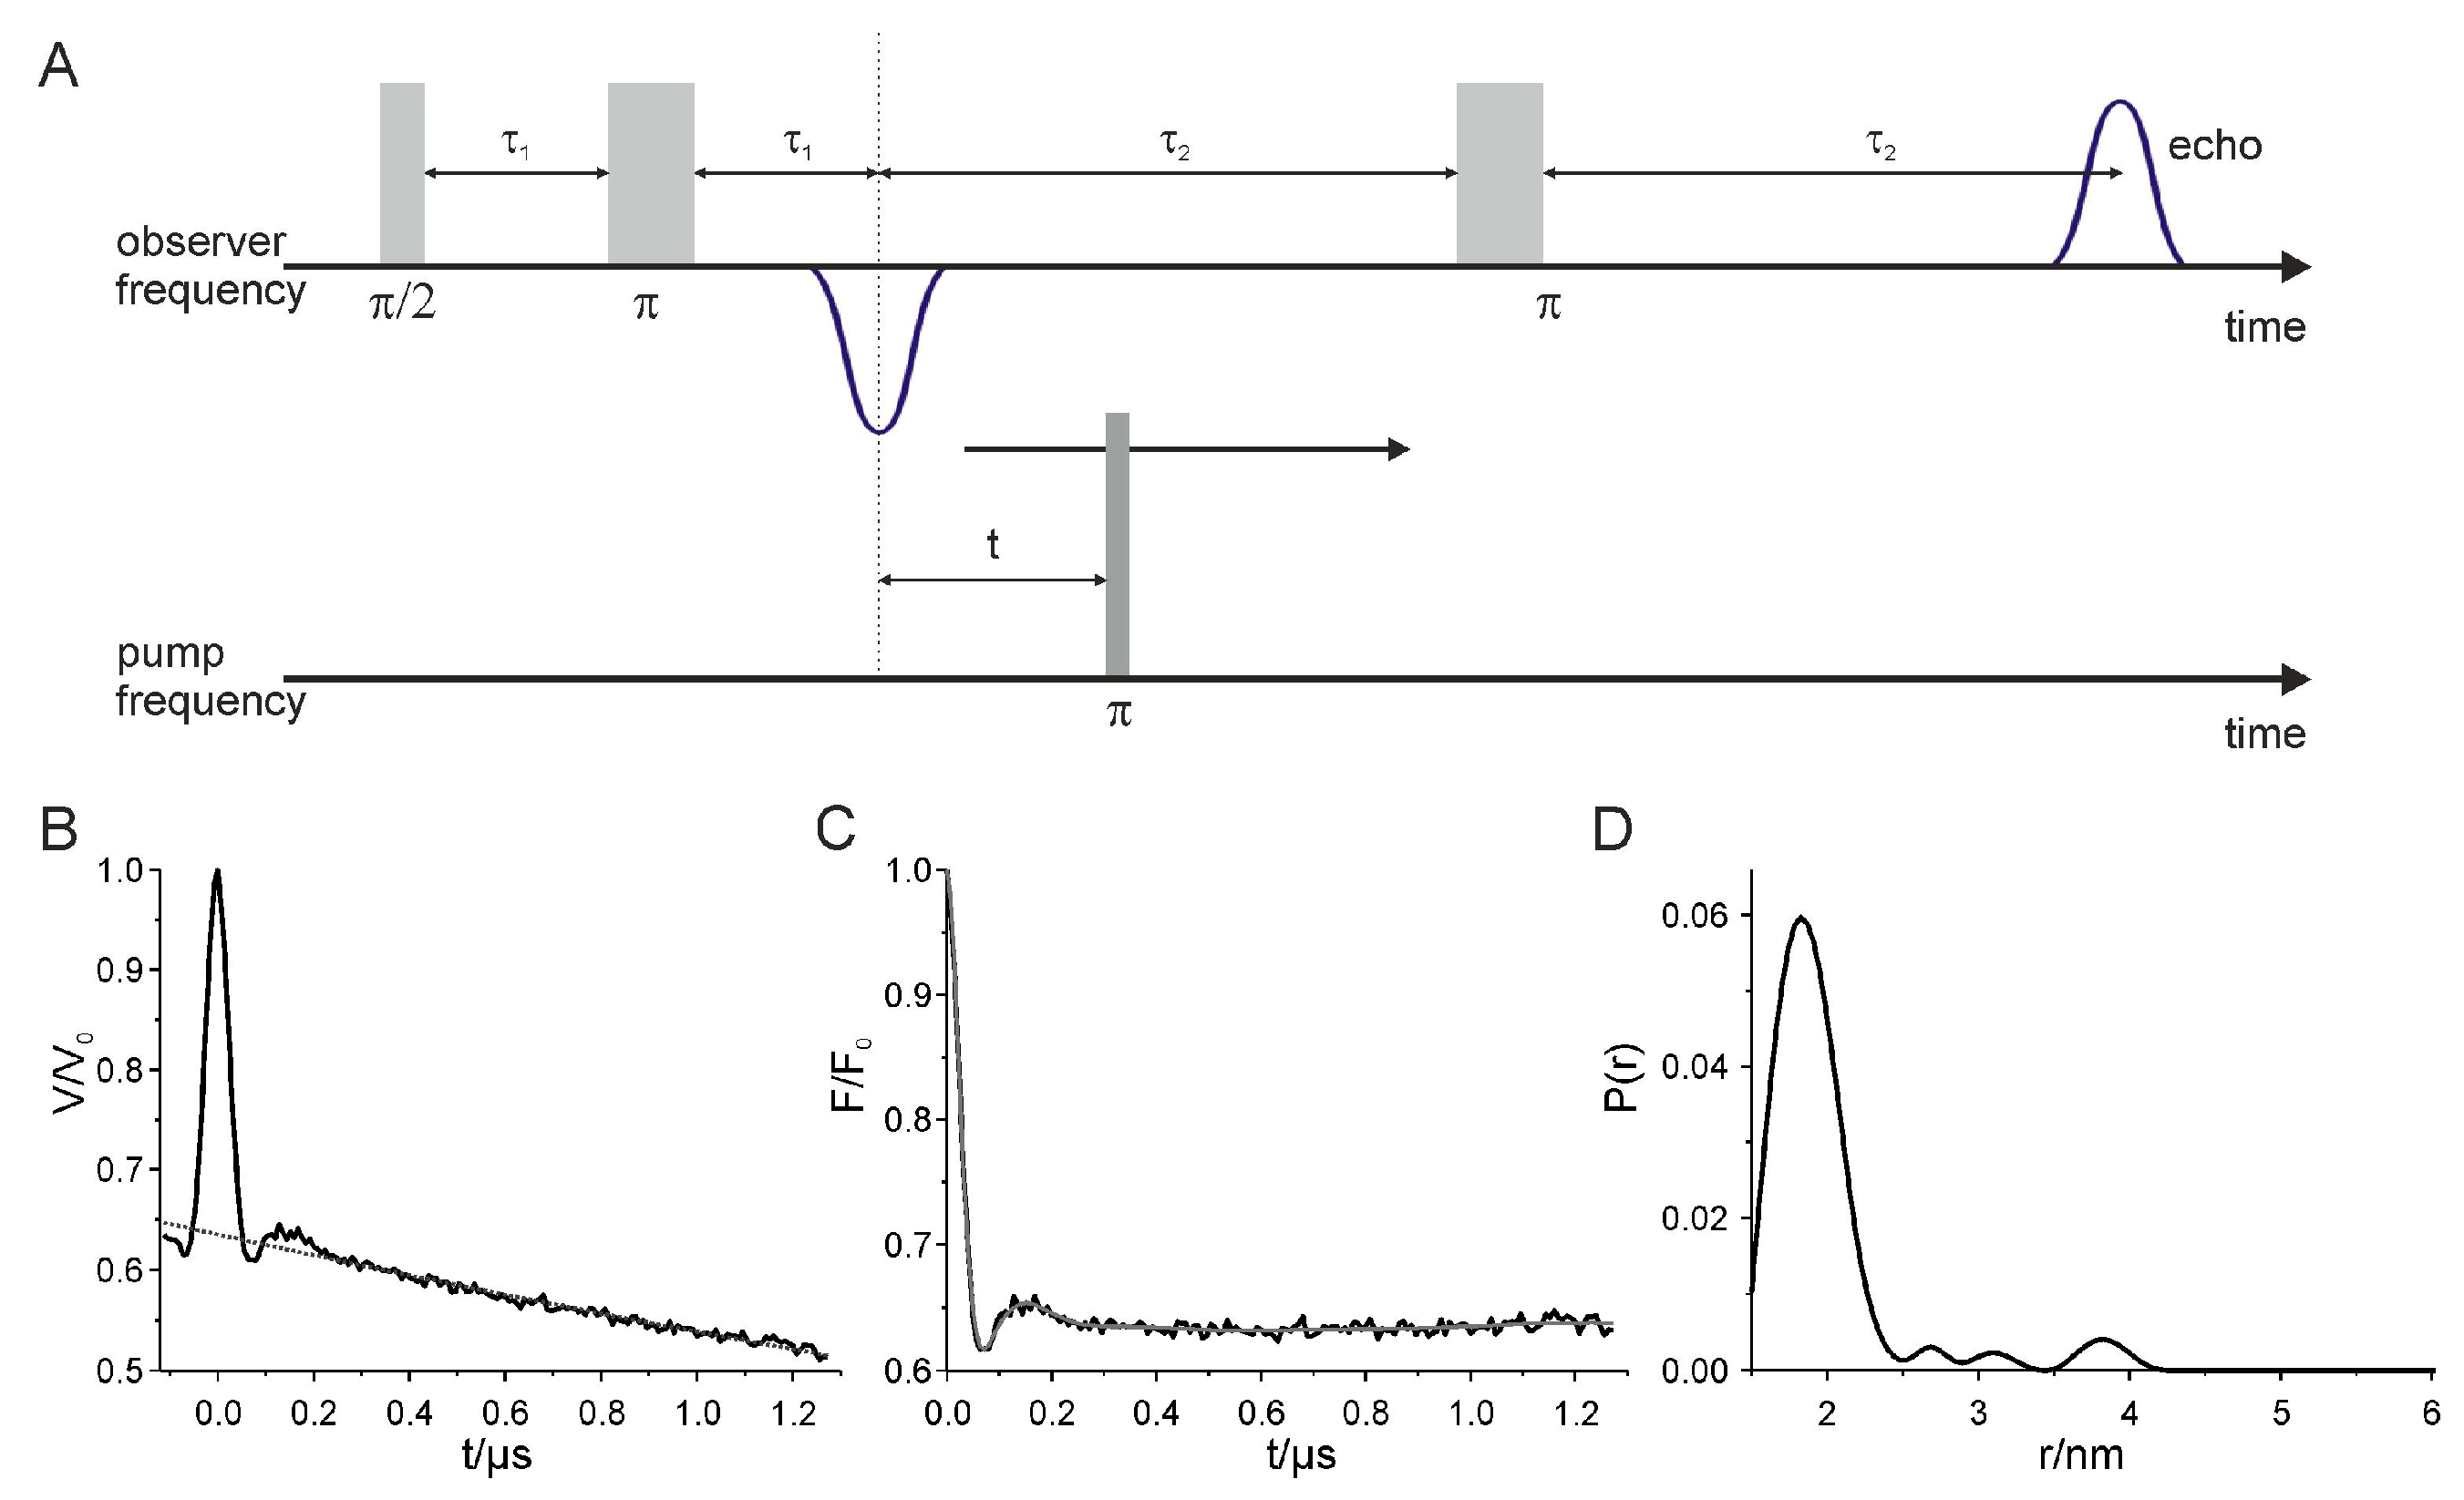
The currently most prominent applications for distance determinations are pulsed EPR methods, which allow to enlarge the measurable distance range of interspin distances up to 8 nm [33]. These measurements are performed at 50 K, which is a compromise designed to maximize T2 (spin-spin relaxation time) and minimize T1 (spin-lattice relaxation time) permitting experiments with a long persistent spin echo and a high repetition rate. Pulsed electron-electron double resonance (PELDOR) or also called double electron-electron resonance (DEER) experiments resolve long range distances by commonly utilizing a 4-pulse sequence at X- or Q-band (9.4 GHz and 34 GHz, respectively) as shown in Figure 3A [33,39]. These experiments are based on the selective excitation of two interacting spins fractions A and B using two different frequencies, the observer frequency νobs and the pump frequency νpump. The pump frequency νpump is positioned at the maximum of the echo-detected nitroxide EPR absorption spectrum and the observer frequency νobs at the low field local maximum resulting commonly in a 65 MHz and 50 MHz frequency offset for X- and Q-band, respectively. The excitation of the pump spin fraction B results in a resonance frequency shift of the dipolar coupled spins A. The Hahn-echo sequence, consisting of the first two pulses with the time delay of τ1 at the observer frequency νobs, creates the spin echo, which is also called Hahn-echo, after another time delay τ1. The π-pulse after time 2τ1 + τ2 leads to the refocused and monitored echo signal at 2τ1 + 2τ2. Applying a π-pulse at the pump frequency νpump selectively excites the spin fraction B which causes a resonance frequency shift of the dipolar coupled spin fraction A. For the experimental DEER signal V(t) the echo amplitude is determined in dependence of time t, corresponding to the pump pulse position [40]. Different t values result in a modulation of the detected echo signal with the dipolar frequency ωDD as depicted in Figure 3B. Furthermore, the observed experimental signal V(t) comprises the desired intramolecular contribution F(t) modulated with the frequency ωDD and an unmodulated background contribution B(t) (cf. Figure 3B, dotted line) resulting from homogeneous distributed molecules and therefore homogeneous distributed interspin distances within the sample. The modulated contribution shown in Figure 3C, also called form factor or background-corrected dipolar evolution data, has to be separated from the background by division of V(t) by B(t). Conventional, the final distance distribution is obtained by Tikhonov regularization [41,42] as utilized in the program DeerAnalysis [43] (cf. Figure 3D). In addition to the mean interspin distances the interspin distance distribution provides information about the distribution of the occupied conformations of the macromolecule and the flexibility of the spin label side chain reflected in the line width. To evaluate the quality and the reliability of the determined distance distribution a validation should be performed as implemented in the validation tool of DeerAnalysis. In order to compare the gained mean interspin distances and distance distributions with existing structural models conformational searching approaches such as the Multiscale Modeling of Macromolecules (MMM) software proved to be insightful [44]. Furthermore, the elastic network model (ENM), as implemented in MMM, has developed into an important tool in the construction of structural models. Here, the utilization of distance distribution constraints obtained by pulsed EPR measurements and an initial structure render new models possible. For instance cAMP-bound and unbound models of hyperpolarization-activated cyclic nucleotide-gated (HCN) ion channels have been successfully generated based on interspin distance constraints and the cAMP-bound HCN crystal structure as the starting structure [45].
3. EPR Spectroscopy Applied to Different Classes of Membrane Proteins
In the following sections we will review different examples for the elegant use of EPR spectroscopy methods on membrane proteins and their combination with structural biology approaches. We focus on four different classes, namely receptors, ion channels, ABC transporters and secondary active transporters, since each of these classes has its own challenges. For each class we highlight one particular paper, which in our opinion represents an excellent example for the use of one or more of the above-mentioned EPR methods to answer defined research questions. Simultaneously, on the basis of these papers we emphasize the complementary and novel information derived from EPR spectroscopy. For instance, EPR spectroscopy has provided information about an equilibrium between two conformations distinguishable by their dynamics and the accessibilities for water, where NMR spectroscopy could only capture the compact conformation (cf. Section 3.1). Furthermore, with the application of EPR experiments technical challenges related to crystallization in the presence of 3-amino propanol and under acidic conditions have been overcome monitoring amine- and pH-induced conformational changes as demonstrated in Section 3.2. Upon the addition of different nucleotides in combination with inhibitors and functional mutations specific conformations can be trapped as performed in Section 3.3. In the last section we show how EPR spectroscopy can be applied to propose a transport mechanism.
3.1. Receptors
Receptors are transmembrane proteins, which bind external signaling molecules (ligands) or respond directly to light or pressure and subsequently transmit a signal into a cell or tissue. Membrane receptors are divided into ionotropic receptors, which upon activation open intrinsic ion channels, metabotropic or G protein-coupled receptors, and enzyme-linked e.g., kinase-linked receptors. Upon signal perception different intracellular cascades are initiated which consequently affect the cell’s function. Since receptors are extracellular accessible they serve as major drug targets: Agonists activate the receptor signaling while antagonists bind to a receptor and block it. The development of new drugs is driven by structural and mechanistic information as gained by combinations of mostly X-ray crystallography and EPR spectroscopy. A prominent example studied for decades is rhodopsin, which has been investigated by the whole range of EPR methods discussed above (see review [46]). However, also recent publications on the β2-adrenergic receptor [47] and its interaction with heterotrimeric G proteins [48] highlight the synergistic effects of combining structural biology and EPR spectroscopy to understand the dynamic processes of receptor signaling. Light-activated ionotropic receptors are key players in optogenetics. Here, genetically modified cells e.g., neurons expressing light-sensitive receptors are controlled by light, which enables a high spatial and temporal resolution of activation. A function-specific engineering of receptors again requires the combined use of structural approaches like X-ray crystallography and NMR with EPR spectroscopy, which provides dynamic details and allows the prediction of non-resolved structures. Recent examples are two studies on Channelrhodopsin-2 [49,50], which identified helix movements upon light activation.
Intensively studied examples for light-activated metabotropic receptors are sensory rhodopsins I and II. In the haloarchaeon Halobacterium salinarum light sensing is executed by two sensory rhodopsins, SRI and SRII. According to the wavelength of the incident light these phototaxis receptors send signals to their associated halobacterial transducer proteins (HtrI and HtrII) and provide the cell with the ability to respond to light as an attractant or repellent [51]. For light with a wavelength below 500 nm sensory rhodopsin II (SRII) initiates a strong repellent response to avoid photooxidative stress in the presence of oxygen. After light activation of SRII the signal is transferred to the tightly bound transducer protein HtrII which in turn triggers a phosphorylation cascade modulating the cell’s flagellar motors including the histidine kinase CheA and the response regulators CheY and CheB [52,53]. Sensory rhodopsins are transmembrane proteins comprising seven helices and a retinal cofactor bound to a lysine residue on helix G via a protonated Schiff base [54,55]. Light excitation triggers the isomerization of the retinal chromophore from the all-trans to a 3-cis configuration which is the starting event for the signal transfer. The overall structure of the transducer is similar to that of chemoreceptors. The transducer protein HtrII contains a transmembrane and a cytoplasmic signaling domain, linked by a HAMP5 domain (conserved in histidine kinases, adenylyl cyclases, methyl-accepting chemotaxis proteins, and phosphatases [56]). The transmembrane N-terminal domain is comprised of two transmembrane helices (TM1 and TM2) and incorporates part of the receptor-binding site. The HAMP domain in turn is composed of two helical amphipathic sequences (AS-1 and AS-2) separated by a connector sequence and functions as a ubiquitous signal transduction module [56,57]. The succeeding rod-shaped cytoplasmic domain includes the sub-domains for signal transfer and for adaptation. In membranes, the phototransducers constitute a 2:2 complex with their cognate photoreceptors [58,59].
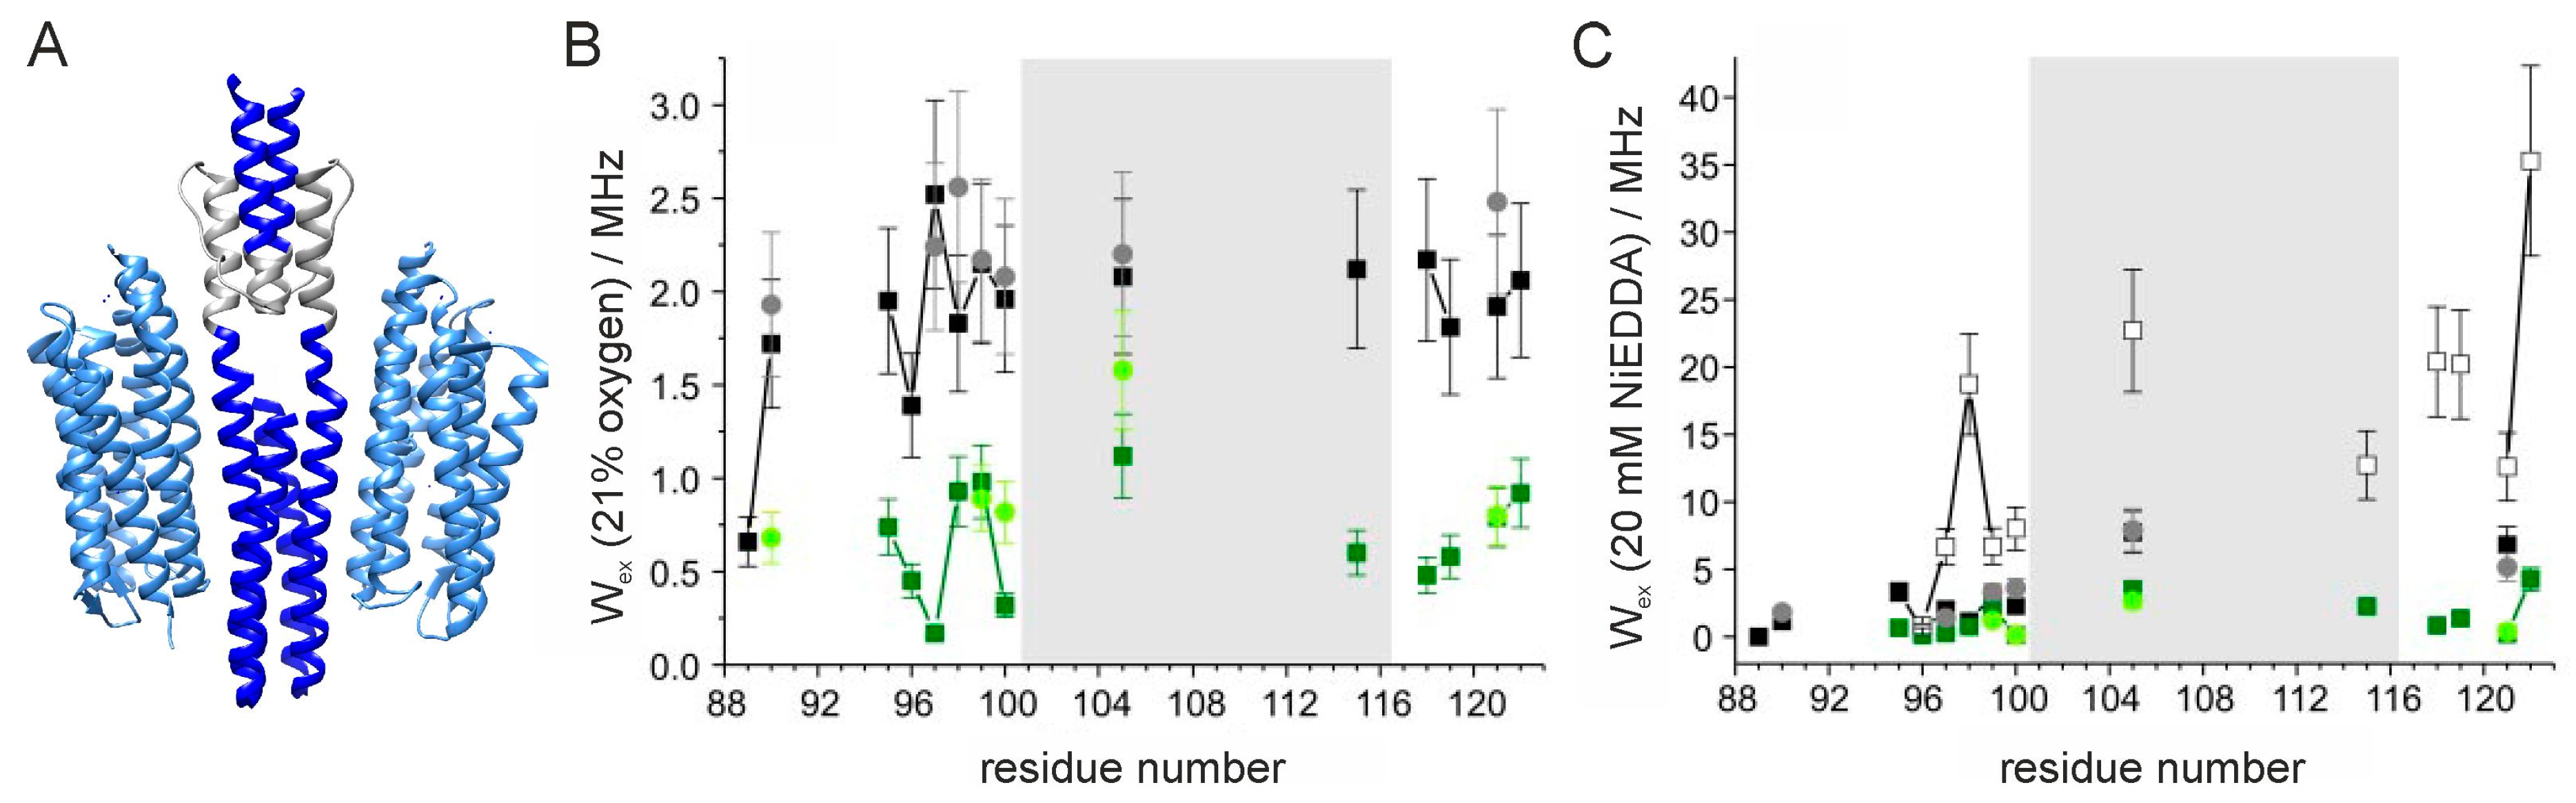
In the elaborate characterization of the phototransducer from Natronomonas pharaonis (NpHtrII) in complex with sensory rhodopsin II (NpSRII) one breakthrough has been the publication of the solution NMR structure of the HAMP domain from Archaeoglobus fulgidus [60]. The NMR structure displays a homodimeric, four helical, parallel coiled coil with an unusual interhelical packing. The assumption that the parallel four-helical bundle structure is likely to represent at least one possible conformation of the HAMP domain is supported by the crystal structures for the concatenated HAMP domains from the Pseudomonas aeruginosa soluble receptor Aer2 [61] revealing the same general structural characteristics. Based on the first NMR structure, a new model has been proposed in which the HAMP domain alternates between two conformations, one conformation is captured by the NMR structure, as shown in Figure 4A, whereas the second conformation resembles a canonical coiled coil via concerted helix rotations [60]. In the EPR study selected here this proposed model is confirmed by characterizing the structural properties of the HAMP domain of the NpHtrII/NpSRII complex from Natronomonas pharaonic [62]. Therefore, mobility and accessibility values for a series of spin-labeled variants at low and high salt conditions (cf. Figure 4B,C) at room temperature and interspin distances at 160 K and 50 K for cw and pulsed EPR experiments, respectively, have been determined. Positions for spin labeling have been chosen based on a sequence alignment of the two HAMP domains from Af1503 (A. fulgidus) and from NpHtrII (N. pharaonic) as there has been no structure available of the HAMP domain from NpHtrII. Concentrating on cw power saturation EPR experiments this paper provides an excellent example for its use and visualizes its potential for identifying residues with high or low accessibility for water and verifying a conformational equilibrium between two conformations distinguishable by their dynamics and the accessibilities for water.
The analysis of the mobility values has provided first evidence for the presence of a dynamic HAMP domain (dHAMP) at low salt concentrations and a compact HAMP domain (cHAMP) at high salt concentrations (for details see [62]). This assumption is supported by accessibility measurements which differentiate between nitroxide side chains exposed to buffer, oriented towards the lipid phase or buried in the protein interior as discussed before. At low salt concentrations the accessibility values for oxygen relate to spin labels exposed to water (thus are comparably low) and are almost constant which is obvious in Figure 4B. This accessibility relates to a dynamic, water-exposed HAMP domain (dHAMP). Whereas at high salt concentrations the accessibility values decrease even further and a periodic pattern is obvious starting at position 95, indicating a compact HAMP domain (cHAMP) structure with spin-labeled residues buried inside the protein at high salt condition with a well-defined secondary and tertiary interactions. The accessibility values for NiEDDA confirm this conclusion (Figure 4C) as at low salt concentrations and 3 mM NiEDDA relatively high Heisenberg exchange rates are determined indicative for a high water accessibility. At high salt concentrations as well as at low salt concentrations but high NiEDDA concentration (20 mM) low Heisenberg exchange rates with a periodic pattern are observed which are in agreement with the cHAMP structure. While expected for the high salt condition based on the oxygen accessibility measurements, this result is kind of surprising at low salt concentrations. However, the authors show by additional cw EPR measurements at room temperature that with 20 mM NiEDDA the mobile component, which agrees to the dHAMP structure, is almost completely suppressed such that also under this condition the HAMP domain to 90% adopts its compact structure. The authors thus demonstrate by the discussed accessibility measurements that the side chains in the cHAMP conformation are restricted in their mobility and poorly accessible from the bulk water. This conformation resembles the four helical bundle structure obtained by solution NMR for the HAMP domain of A. fulgidus. In the dHAMP conformation the spin label dynamics and its accessibility for water are very high, which suggests a rather unfolded secondary structure. Thus, changes in the dynamics of the HAMP domains of these systems can be hypothesized as the language of signaling. A detailed review about the progress in the EPR study of sensory rhodopsin–transducer complex can be found elsewhere [63]. However, the discussed paper highlights the necessity of the combined approach of structural biology and EPR spectroscopy and its potential to complement missing information even in the absence of a corresponding structure and to enhance our knowledge about structural properties and their relation to the function of proteins.
3.2. Ion Channels
Ion channels are pore-forming membrane proteins that allow the more or less selective translocation of cations and anions along an electrochemical gradient. Ion channels are found in all living cells and are responsible for a plethora of tasks, including pH homeostasis, cell growth, maintenance of osmolarity and cell volume, movement and, probably most importantly, electrical signaling. As diverse as their function is the regulation of ion channels. Besides being part of the aforementioned receptors, ion channels group into voltage-gated ion channels, intracellular ligand-gated ion channels, cyclic nucleotide-gated ion channels, temperature-gated ion channels, and mechanosensitive and volume-regulated ion channels. Understanding the mechanisms of activation, deactivation and channel gating are the key questions which are investigated. In addition, the molecular basis of ion selectivity and possibly rectification are in focus. The prime example of an ion channel is KcsA, the first ion channel ever crystallized [64]. Besides nowadays various structures a plethora of EPR studies has been performed with regard to conformational changes in the selectivity filter [65,66], the cytoplasmic helical bundle [67,68] and the communication between both features [69]. Further excellent examples for the combined use of structural biology and EPR spectroscopy are present for all classes of ion channels, e.g., for the intracellular Mg2+-gated Mg2+ channel CorA [70,71,72], the nucleotide- and Na+-gated K+ channel KtrAB [73], the mechanosensitive channel MscL [74,75], the cyclic AMP-gated HCN channel [45,76], the voltage-gated Na+ channel NavMs [77] and the pentameric receptor channels GLIC [78]. In all cases EPR measurements have been applied to validate existing protein structures, determine the structure of missing regions or distorted elements in structures, or add valuable information of the dynamics of the studied systems to provide a model of activation and regulation. A broader overview about EPR studies on ion channels can be found in a recent review [79]. A particular challenge for the investigation of ion channels by EPR spectroscopy is their mostly homo-oligomeric nature, which requires the interpretation of various distance distributions even if only one spin label is inserted per protomer [80]. A great advantage over most structural studies is the possibility to perform EPR measurements on liposome-reconstituted proteins such that electrochemical gradients as needed for the open conformation can be applied [73].
Synaptic transmissions in the central and peripheral nervous systems are conducted by pentameric ligand–gated ion channels (pLGICs). Nicotinic acetylcholine receptors (nAChRs), the γ–aminobutyric acid receptors (GABAARs), glycine receptors (GlyRs), and serotonin receptors (5HT3Rs) are members of the family of pLGICs [81,82,83,84]. The dysfunction of the synaptic transmission is associated with a multitude of neurodegenerative diseases such as Alzheimer’s disease, Parkinson’s disease or schizophrenia. Thus, pLGICs are suitable candidates for therapeutic investigations and approaches. Here, neurotransmitter binding initiates a rapid switch between the closed, open, and desensitized conformations in the pLGICs. The switch between these states occurs over a 6-nm distance along the length of the channel. The addition of drugs and modulators allosterically shifts the equilibrium toward the open and closed/desensitized conformation, respectively, leading to an enhanced or inhibited channel activity. However, the underlying gating and drug modulation at the molecular level is still under debate. A recent breakthrough has been the publications of several high resolution structures such as the glutamate-gated chloride channel [85], the human 3-GABAAR [86], the mouse 5-HT3 [87], and the prokaryotic homologues Gloeobacter violaceus ligand–gated ion channel (GLIC; pH gated) [88,89] and Erwinia chrysanthemi ligand–gated ion channel (ELIC; primary amine gated) [90]. Due to their high structural similarity to eukaryotic homologues, GLIC and ELIC are considered to be suitable structural surrogates to examine channel gating and its underlying structural changes and to identify conserved drug binding regions. First information about agonist and modulator binding sites but not about gating or modulation has been conducted from ELIC structures [91,92,93,94]. The here selected advanced approach of cw and pulsed EPR spectroscopy in combination with X-ray crystallography demonstrates impressively the advantages of such a combination and how EPR spectroscopy is able to compensate for technical challenges related to crystallization. The paper investigated the activation mechanisms in a functional chimera of the extracellular domain (ECD) of amine-gated Erwinia chrysanthemi ligand–gated ion channel and the transmembrane domain (TMD) of Gloeobacter violaceus ligand–gated ion channel by applying cw and pulsed EPR spectroscopy [95]. However, this review focuses on the analyses of the cw EPR data proving that cw EPR studies at room temperature and the derived information about the spin label side chain dynamics yield valuable insights for the understanding of structural mechanism.
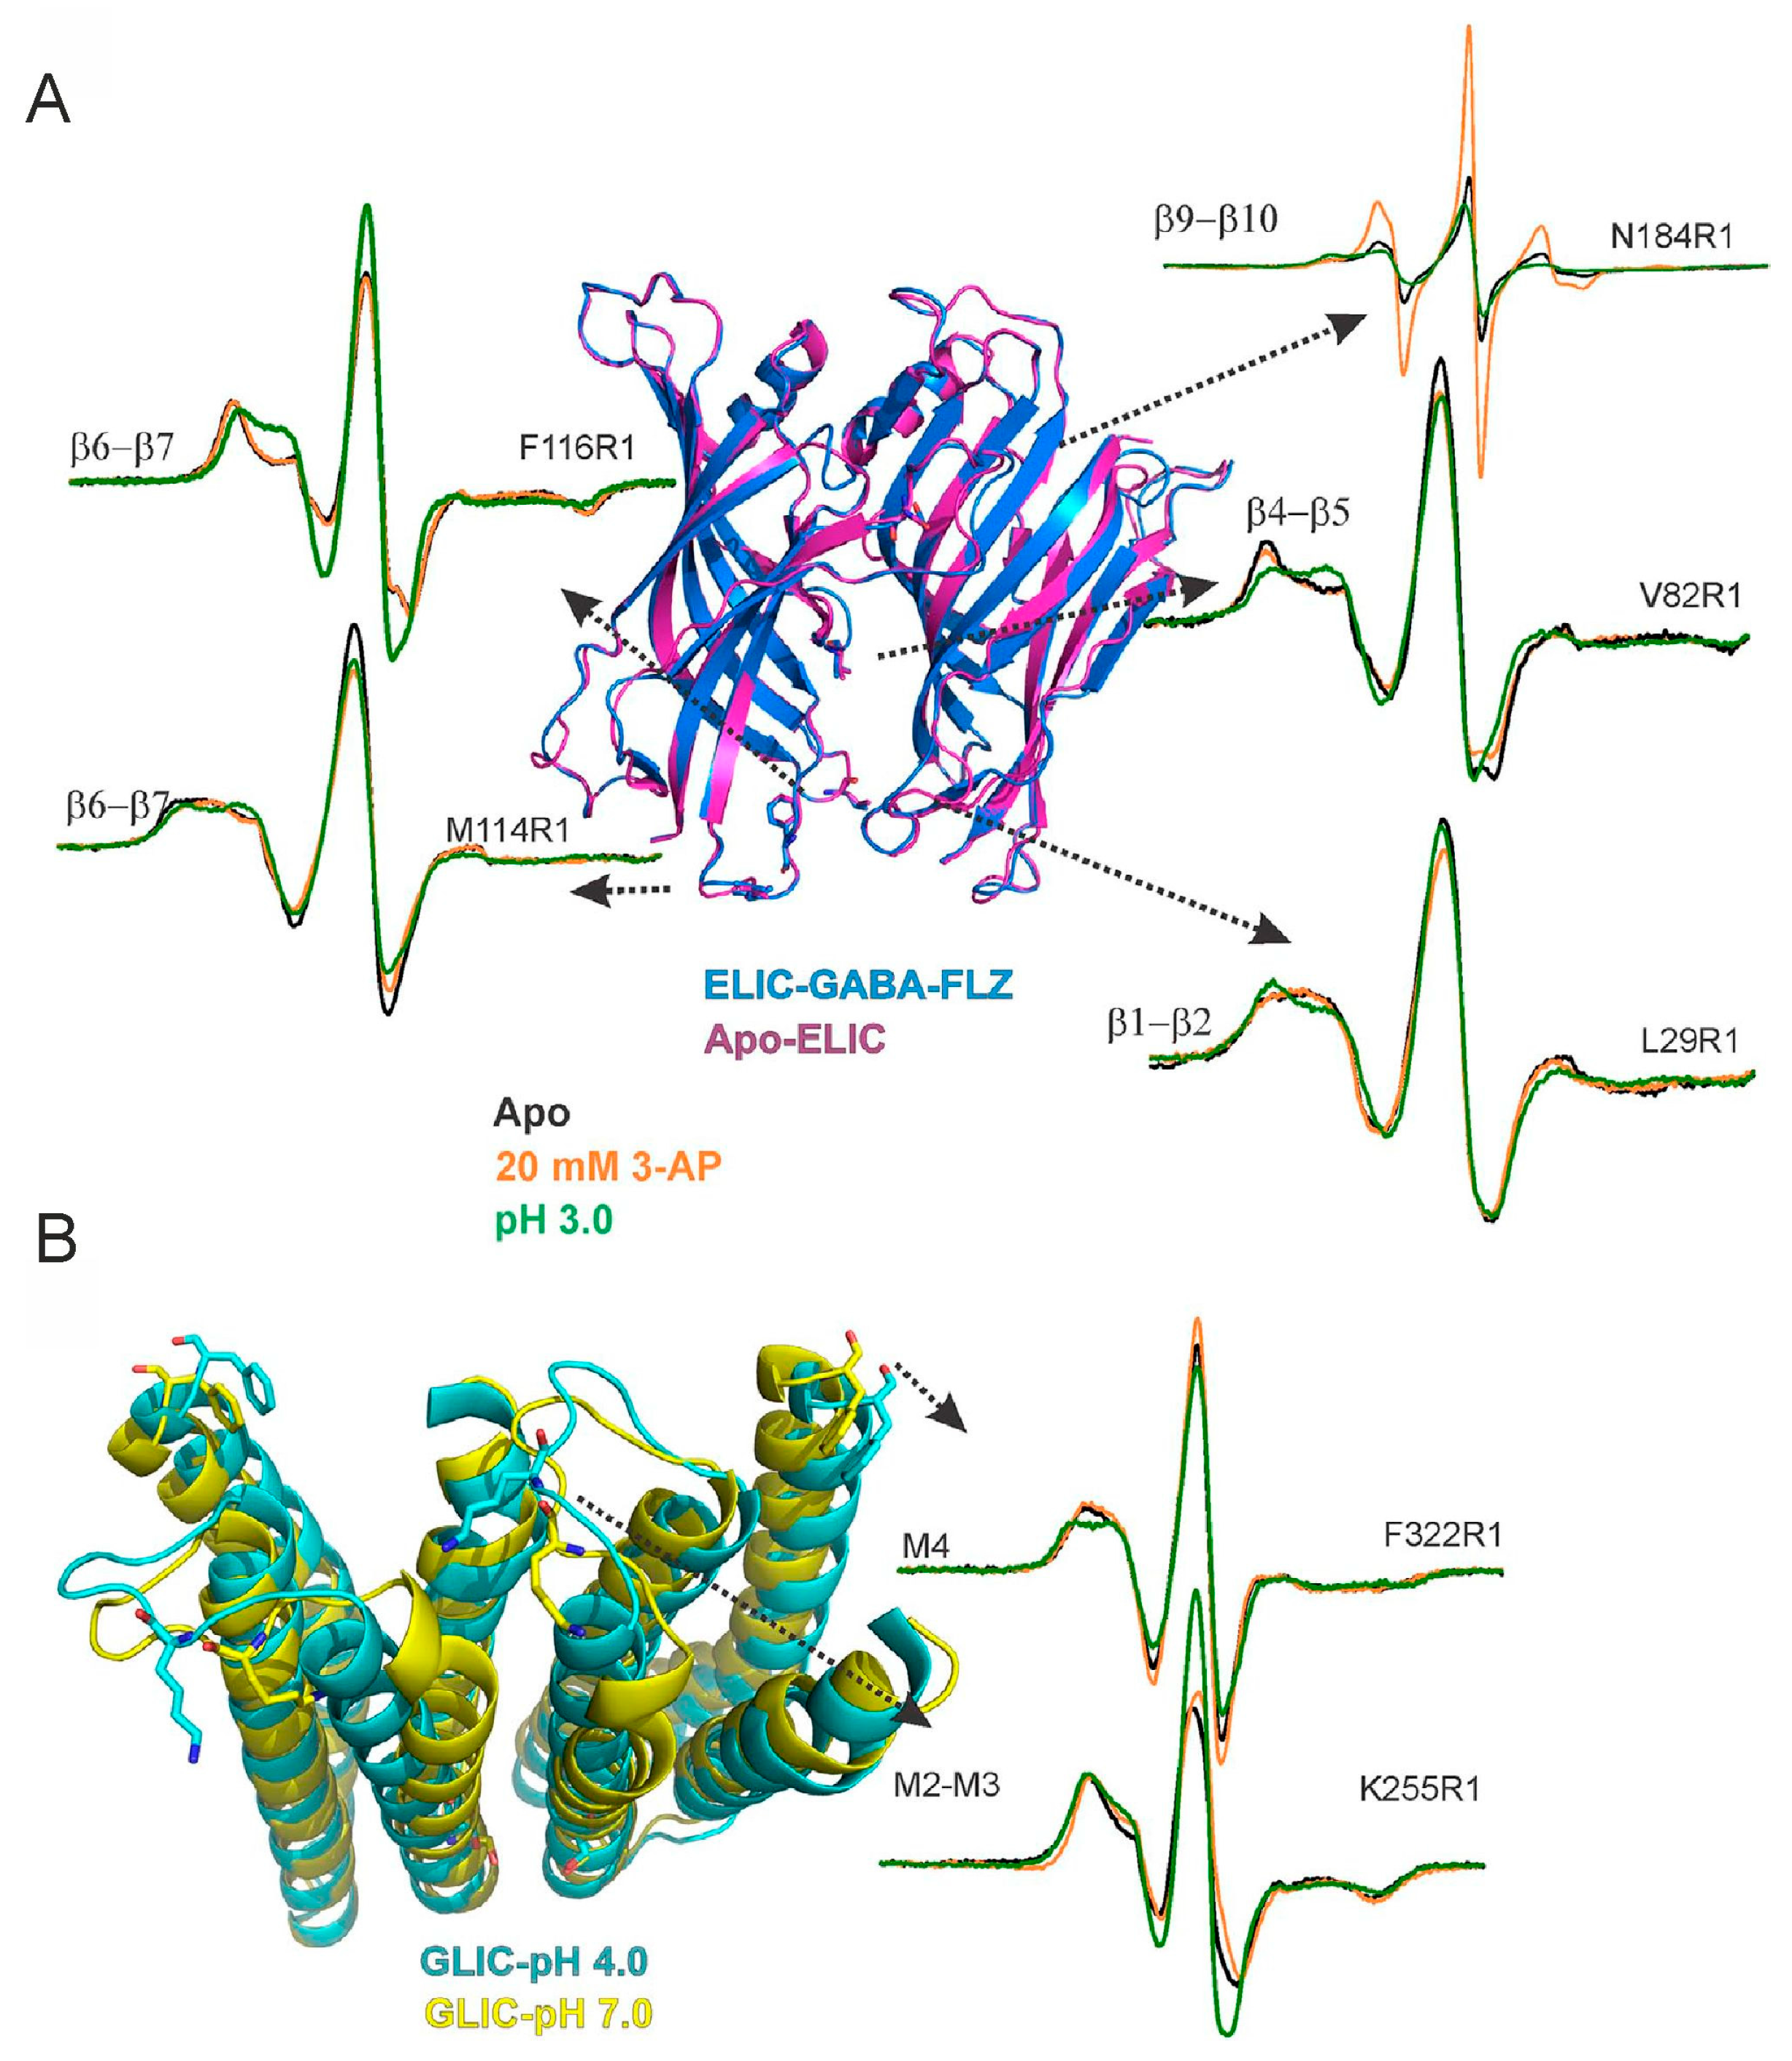
The chimera has been crystallized at pH 7.0 and in the absence of 3-AP (3-amino propanol) to capture the resting state (4.6-Å resolution). The overall arrangement of the TMD and the orientation of M2 in the ELIC-GLIC chimera are similar to GLIC at pH 7.0. A comparison of the chimera and the apo-ELIC-ECD highlighted a rotation of the chimera-ECD about the central symmetry axis such that the twist is most pronounced at the ECD–TMD interface. The chimera is in its closed-pore conformation. To achieve an enhanced understanding of gating further crystal structures in the presence of 3-AP and under acidic conditions are necessary. To overcome technical challenges related to crystals under these conditions cw and pulsed EPR experiments have been performed to monitor amine- and pH-induced conformational changes. It could be shown by pulsed EPR experiments at 50 K that structural rearrangements of loop C are not necessary for channel opening and gating and that the motions of loop F and loop C are not coupled as part of channel opening. Therefore, room temperature cw EPR measurements at representative positions in loops β1-β2, β4-β5, and β6-β7 in the ECD and in the M2-M3 linker and the C-terminal end of M4 in the TMD have been performed in the presence of 3-AP (Figure 5, orange lines) and in the presence of protons (Figure 5, green lines), respectively. These positions are chosen based on their corresponding positions in GLIC [96] and potential conformational changes.
First, mobility changes in the ECD upon activation are investigated. The cw EPR spectra for V82R1 (β4-β5 linker) display a slightly increased spin label mobility in the presence of 3-AP (Figure 5A) and a more pronounced increase of the mobility in the presence of protons. In contrast, for L29R1 the addition of 3-AP or protons results in a decrease of spin label mobility with a more pronounced decrease at pH 3.0. Similarly, for both positions in the loop β6-β7 protons induce stronger changes in the line shape compared to 3-AP binding, although the trend is opposite for the positions M114 and F116. For variant M114R1 the cw EPR spectra exhibit a slightly decreased spin label mobility at pH 3.0 and upon addition of 3-AP, respectively. For variant F116R1 an increased spin label mobility is obvious at pH 3.0 and no significant change in the presence of 3-AP. Also in the TMD residues undergo larger conformational changes in the presence of protons compared to 3-AP. In addition to the mobility changes, variant K255R1 (M2-M3 loop) displays strong spectral broadening most likely due to dipolar coupling caused by the close proximity of the nitroxide side chains (Cβ-Cβ distance of 1.7 nm between adjacent subunits in the pentamer [96]) as shown in Figure 5B. In the presence of protons the spectral broadening decreased, which is in agreement with an outward movement of loop M2-M3 as reported in GLIC [96,97]. In comparison, the effect is much weaker upon 3-AP addition. For variant F322R1, located at the C-terminal end of M4, the addition of 3-AP results in only minimal changes of the cw EPR spectrum. Whereas at pH 3.0 the immobile component becomes less pronounced. Further investigation of the ECD–TMD interface in the chimera and those at the equivalent positions in ELIC and GLIC provide evidence that for positions at the ECD–TMD interface the obtained differences between the chimera and the parent channels are consistent with a twist in the chimera ECD with respect to the TMD. While both 3-AP and protons are able to gate the ELIC-GLIC chimera, the degree of mobility changes upon gating depends on the type of ligand. In response to an acidification, the domain interfaces undergo large conformational rearrangements, consistent with conformational changes found in GLIC. Moreover, in response to 3-AP modest changes are observed in agreement with effects observed in ELIC. Thus, the ECD and TMD of the ELIC-GLIC chimera preserve the distinct conformational changes of the parent channels. By means of applying EPR spectroscopy in combination with structural information derived from crystal structures the authors suggested that the chimeric channel is gated not only by two different ligands but by two different mechanisms. These results enable the design of better allosteric modulators.
3.3. ABC Transporters
ATP-binding cassette transporters (ABC transporters) are a family of membrane proteins with representatives in all phyla of life from prokaryotes to humans. All ABC transporters consist of at least a pair of cytoplasmic nucleotide binding domains (NBDs), which are associated to two transmembrane domains (TMDs). Those domains can be arranged on a single polypeptide, as homo- or heterodimer with each one NBD and one TMD, with fused NBDs but single TMDs, or as single subunits. Despite those differences, the general overall topology is similar allowing a mechanism, in which ATP binding and hydrolysis, and ADP and Pi release in the NBDs catalyze the transport of diverse substrates by driving distinct conformational changes of the TMDs. Nonetheless, one cannot define a uniform mechanism of transport because ABC transporters in particular vary in the architecture of their TMDs. Based on their structural and functional similarities ABC transporters are currently grouped into four types namely type 1 and type 2 importers, exporters and ECF transporters (type 3 importers). ABC importers are exclusively found in prokaryotes. Type 1 and 2 importers contain an additional, mostly soluble substrate binding domain (SBD). Type 1 importers facilitate the uptake of diverse nutrients including ions, sugars, amino acids, short peptides, and oligosaccharides; type 2 importers support the high-affinity uptake of metal chelates including heme and other iron-containing complexes, and cobalamin; ECF transporters take up vitamins with high affinity; and ABC exporters mediate the transport of a wide range of cargos such as lipids, peptides, ions and drugs across lipid bilayers [98].
The mechanistic diversity of ABC transporters has been summarized in a recent review [99]. The mechanisms as proposed are a result of combining structural, functional, biophysical and spectroscopic studies. For type 1 and type 2 importers each one common transport model has been proposed, which are supported by several EPR studies [100,101,102,103,104,105,106,107,108,109,110]. First EPR studies on the dynamics of ECF transporters were presented recently [111,112], while the final mechanism is still under debate. Most EPR studies with a particular focus on pulsed methods, however, are available for ABC exporters [113,114,115,116,117,118,119,120,121,122,123,124] but their data are discussed as controversial as the present structures such that no final, common model has been agreed on.
Mostly, the origin of the power stroke for the transport is still under debate [125] and currently two models are postulated. In the first model, called the ATP-switch model, ATP binding results in the closure of the NBDs and the transition from the inward-facing (IF) to the outward-facing (OF) state [126]. Upon ATP hydrolysis the NBD interaction is destabilized, the substrate is released and the transporter returns to its IF state with disengaged NBDs. In this model, ATP hydrolysis is not required for substrate release but rather resets the exporter for the next ATP binding and substrate transport reaction. A series of crystal structures of ABC exporters in the absence and in the presence of nucleotides and pulsed EPR investigations support the ATP-switch model with few exceptions [127,128]. In the absence of nucleotides all ABC exporter structures exhibit IF states with partially or fully separated NBDs [118,128,129]. In the presence of nucleotides the NBDs are closed and the TMDs are in an outward-occluded or outward-facing conformation [130,131]. However, the ATP-switch model is challenged by the finding that the asymmetric occlusion of one nucleotide is important to trigger the affinity switch and thus substrate release [132,133]. Though, no structural evidence for the asymmetric nucleotide occlusion is published. Furthermore, a recent pulsed EPR study on the heterodimeric ABC exporter BmrCD stated that BmrCD requires ATP hydrolysis for complete NBD closure and TMD reorientation [113], which contradicts the ATP-switch model. A striking structural feature of BmrCD and other heterodimeric ABC exporters is the so-called degenerate ATP binding site in one NBD, which binds ATP tightly but is catalytically impaired [134,135]. The authors hypothesized that the power stroke for heterodimeric exporters could be different than for homodimeric exporters.
In the following paragraphs a couple of highlights of a recent EPR study on TM287/288 will be emphasized [119], dealing with the molecular trigger leading from an open to a closed NBD dimer with two nucleotides sandwiched at the interface. The study is an exquisite example for the combined use of pulsed EPR with different nucleotides in combination with inhibitors and functional mutations. As BmrCD, TM287/288 from Thermotoga maritima is a heterodimeric ABC exporter comprising one catalytically active and one degenerate nucleotide binding site. The study based on available inward-facing crystal structures in the presence of AMP-PNP-Mg and in the apo state, respectively, and on a former EPR study [118,136]. Other than in homodimeric exporters, in TM287/288 the NBDs remain in contact in the IF conformation. Moreover, in the presence of AMP-PNP-Mg the NBDs are not fully closed but a transition to the OF state is supported [118]. In the chosen study six spin-labeled TM287/288 variants are created based on the cys-less TM287/288. Two selected spin-labeled pairs each are located in the NBDs to follow interspin distance changes, detected at 50 K, at the consensus and degenerate ATPase sites, in the intracellular part of the TMDs and in the extracellular part of the TMDs, respectively (Figure 6A). The expected interspin distances for these variants are predicted by means of using the software MMM on the apo structure of TM287/288 and a homology model based on Sav1866. As mentioned before, this tool has proven to be very helpful to identify suitable residues for the intended measurements if structural information is available. The functionality of all spin-labeled variants has been tested by an ATPase activity test.
For all spin-labeled variants the experimentally determined interspin distances in the apo state are in agreement with the predicted interspin distances for the IF conformation. In the following experimental setup various nucleotides and inhibitors are applied to stabilize distinct conformations. Upon the assumptions of the ATP-switch model the following conformations are to be expected: ATP-Mg in the presence of vanadate (ATP-Vi-Mg) and ATPγS-Mg should only be slowly hydrolysable probably favoring the OF state or at least promoting a significant shift towards the OF state. AMP-PNP in the presence of Mg as well as ATP-EDTA (thus absence of magnesium) are non-hydrolysable, thus ideally the transporter should be trapped in an all OF state. ATP-Mg should enable the complete transport cycle allowing all conformations, while ADP-Mg mimics the post-hydrolysis state, in which the IF conformation should be favored. In fact, the addition of the different nucleotides has led to very different dipolar evolution traces for all spin pairs tested as can be clearly seen from the changing oscillations (Figure 6A left). By fitting those oscillations, either with a two-Gaussian fit DEER analysis as shown here or by Tikhonov regularization as used elsewhere in the paper and introduced previously in this review, distance distributions are derived, which allow for the interpretation of conformational changes in different areas of the protein. In fact, the addition of ATP-Vi-Mg (Figure 6B, magenta lines) results in the most pronounced change towards the OF conformation. Compared to the apo state, the interspin distance decreases for the spin-labeled variants in the NBDs and in intracellular TMD. In contrast, spin-labeled pairs in the extracellular region exhibit an increase of the mean distances (Figure 6B, magenta lines). In the same way, the effect of the other nucleotides could be analyzed. Surprisingly, both in the presence of ADP-Mg (Figure 6B, orange lines) and AMP-PNP-Mg (Figure 6B, purple lines), respectively, the IF state is stabilized. While this is expected for ADP-Mg, an OF state is hypothesized for AMP-PNP-Mg in agreement with the ATP-switch model. The presence of both, ATP-Mg (Figure 6B, red lines) and ATP-γS (Figure 6B, black lines), respectively, leads to a significant shift in the mean distances with a broad distance distribution indicating that the transporter has undergone a complete transport cycle sampling different conformations. With respect to the nucleotides and combinations discussed so far, one would hypothesize that ATP hydrolysis is in fact needed for the conformational change from the IF to the OF state as at least residual ATPase activity is given for all combinations leading to an IF to OF shift. Only the additional sampling with ATP-EDTA (Figure 6B, green lines) refutes this conclusion as a significant shift towards the OF state is observed (though not 100%) without any ATPase activity. Thus, a conformational change is possible without ATP hydrolysis.
To further confirm the ATP-switch model similar pulsed EPR measurements are applied to the catalytically inactive E-to-Q mutant, in which glutamate 517 in TM288 is mutated to a glutamine, which reduces the ATPase activity to almost zero and thus should allow to further stabilize the OF state with the corresponding nucleotides added. Such stabilization in fact is seen for ATP-Mg, ATP-γS and ATP-EDTA (Figure 6C) supporting the hypothesis that ATP hydrolysis is not required for the IF to OF switch. Surprisingly, AMP-PNP-Mg remains incapable in switching the transporter to the OF conformation (Figure 6C, purple lines), which is interpreted with the proteins’ inability to sandwich two AMP-PNP as needed for the switch due to the degenerated site in the NBD of TM287. By ranking the nucleotides according to their ability to stabilize the OF state (Figure 6D,E) ATP-Vi-Mg is identified as the best. In combination with the E-to-Q mutant this nucleotide probably has the highest potential to support the crystallization of TM287/288 in its OF state. In this respect EPR spectroscopy may help to further improve structural studies.
Finally, the authors extend their study to the heterodimeric BmrCD and the homodimeric MsbA and confirm the ATP-switch model with these two alternatives. However, it is very interesting to note that the energy landscapes for the different transporters are very different as can be derived from the distance distributions. Thus, EPR analyses allow for the interpretation of transporter dynamics instead of only providing structural snap shots. In summary, the discussed study has led to the suggestion of a comprehensive mechanism for heterodimeric ABC exporters, which likely applies to both TM287/288 and BmrCD as well as to other even human homologs and summarizes both differences and similarities with homodimeric exporters.
3.4. Secondary Active Proteins
Secondary active transporters form the largest and most diverse group of membrane proteins while transporting substrates across the membrane. In contrast to primary active transport, secondary active transport is not directly coupled to the hydrolysis of ATP. Instead, the transport of one substrate is coupled to the symport or antiport of another substrate such that at least one substrate is translocated along its electrochemical gradient, which can fuel the uphill transport of the second substrate. Thus, the transport of molecules across the membrane results from an electrochemical gradient which beforehand is generated by pumping ions in or out of the cell. A general concept for secondary active transport is the alternating access mechanism, which includes an outward-facing, an inward-facing and a substrate-occluded state. This concept ensures the strict coupling of substrate transport and hinders the dissipation of the electrochemical gradient. Based on their structural folds secondary transporters are grouped in different classes, with each of them having a more or less different underlying transport mechanism. Based on the structural information available the different mechanisms have been discussed recently by Forrest et al. [137]. In recent years, various EPR studies have complemented this structural knowledge, of which we will name only a few examples. As member of the major facilitator family (MFS) the H+-coupled multidrug antiporter LmrP has been studied extensively and is shown to function in the proposed rocker-switch mechanism [138]. In addition, the lipid dependency of the conformational-energy landscape has been evaluated [139]. The SLC6A family, which is better known as LeuT family, has been exemplified based on the Na+-coupled amino acid symporter LeuT [140,141]), the Na+/hydantoin symporter Mhp1 [142] and the Na+/proline symporter PutP [143,144,145,146]. All studies are in agreement with the suggested combination of the rocker-switch and gating-type mechanisms in order to achieve alternating access. However, they also highlight the different coupling schemes for different transporters in this family. The small multidrug resistance exporter family (SMR), which supports proton/substrate antiport, is represented by EmrE. Here in particular a study unraveling the protonation-dependent conformational dynamics has contributed significantly to the understanding of the underlying transport mechanism [147]. A combined effort of NMR, EPR and MD simulations shed light on global structural changes in the Cl−/H+ exchanger family CLC, which are necessary to form the previously unknown outward-facing open conformation [148]. Two studies [149,150] investigated the conformational dynamics of the aspartate/Na+ symporter GltPh, which is a member of the excitatory amino acid transporter family (EAAT), also referred to as SLC1. In the following section we will focus on the study by Hänelt et al. [149] to exemplify the combined use of cw and pulsed EPR at 160 K and 50 K, respectively, for the determination of distance distributions and dynamics and to highlight the conformational dependence of a protein on its environment.
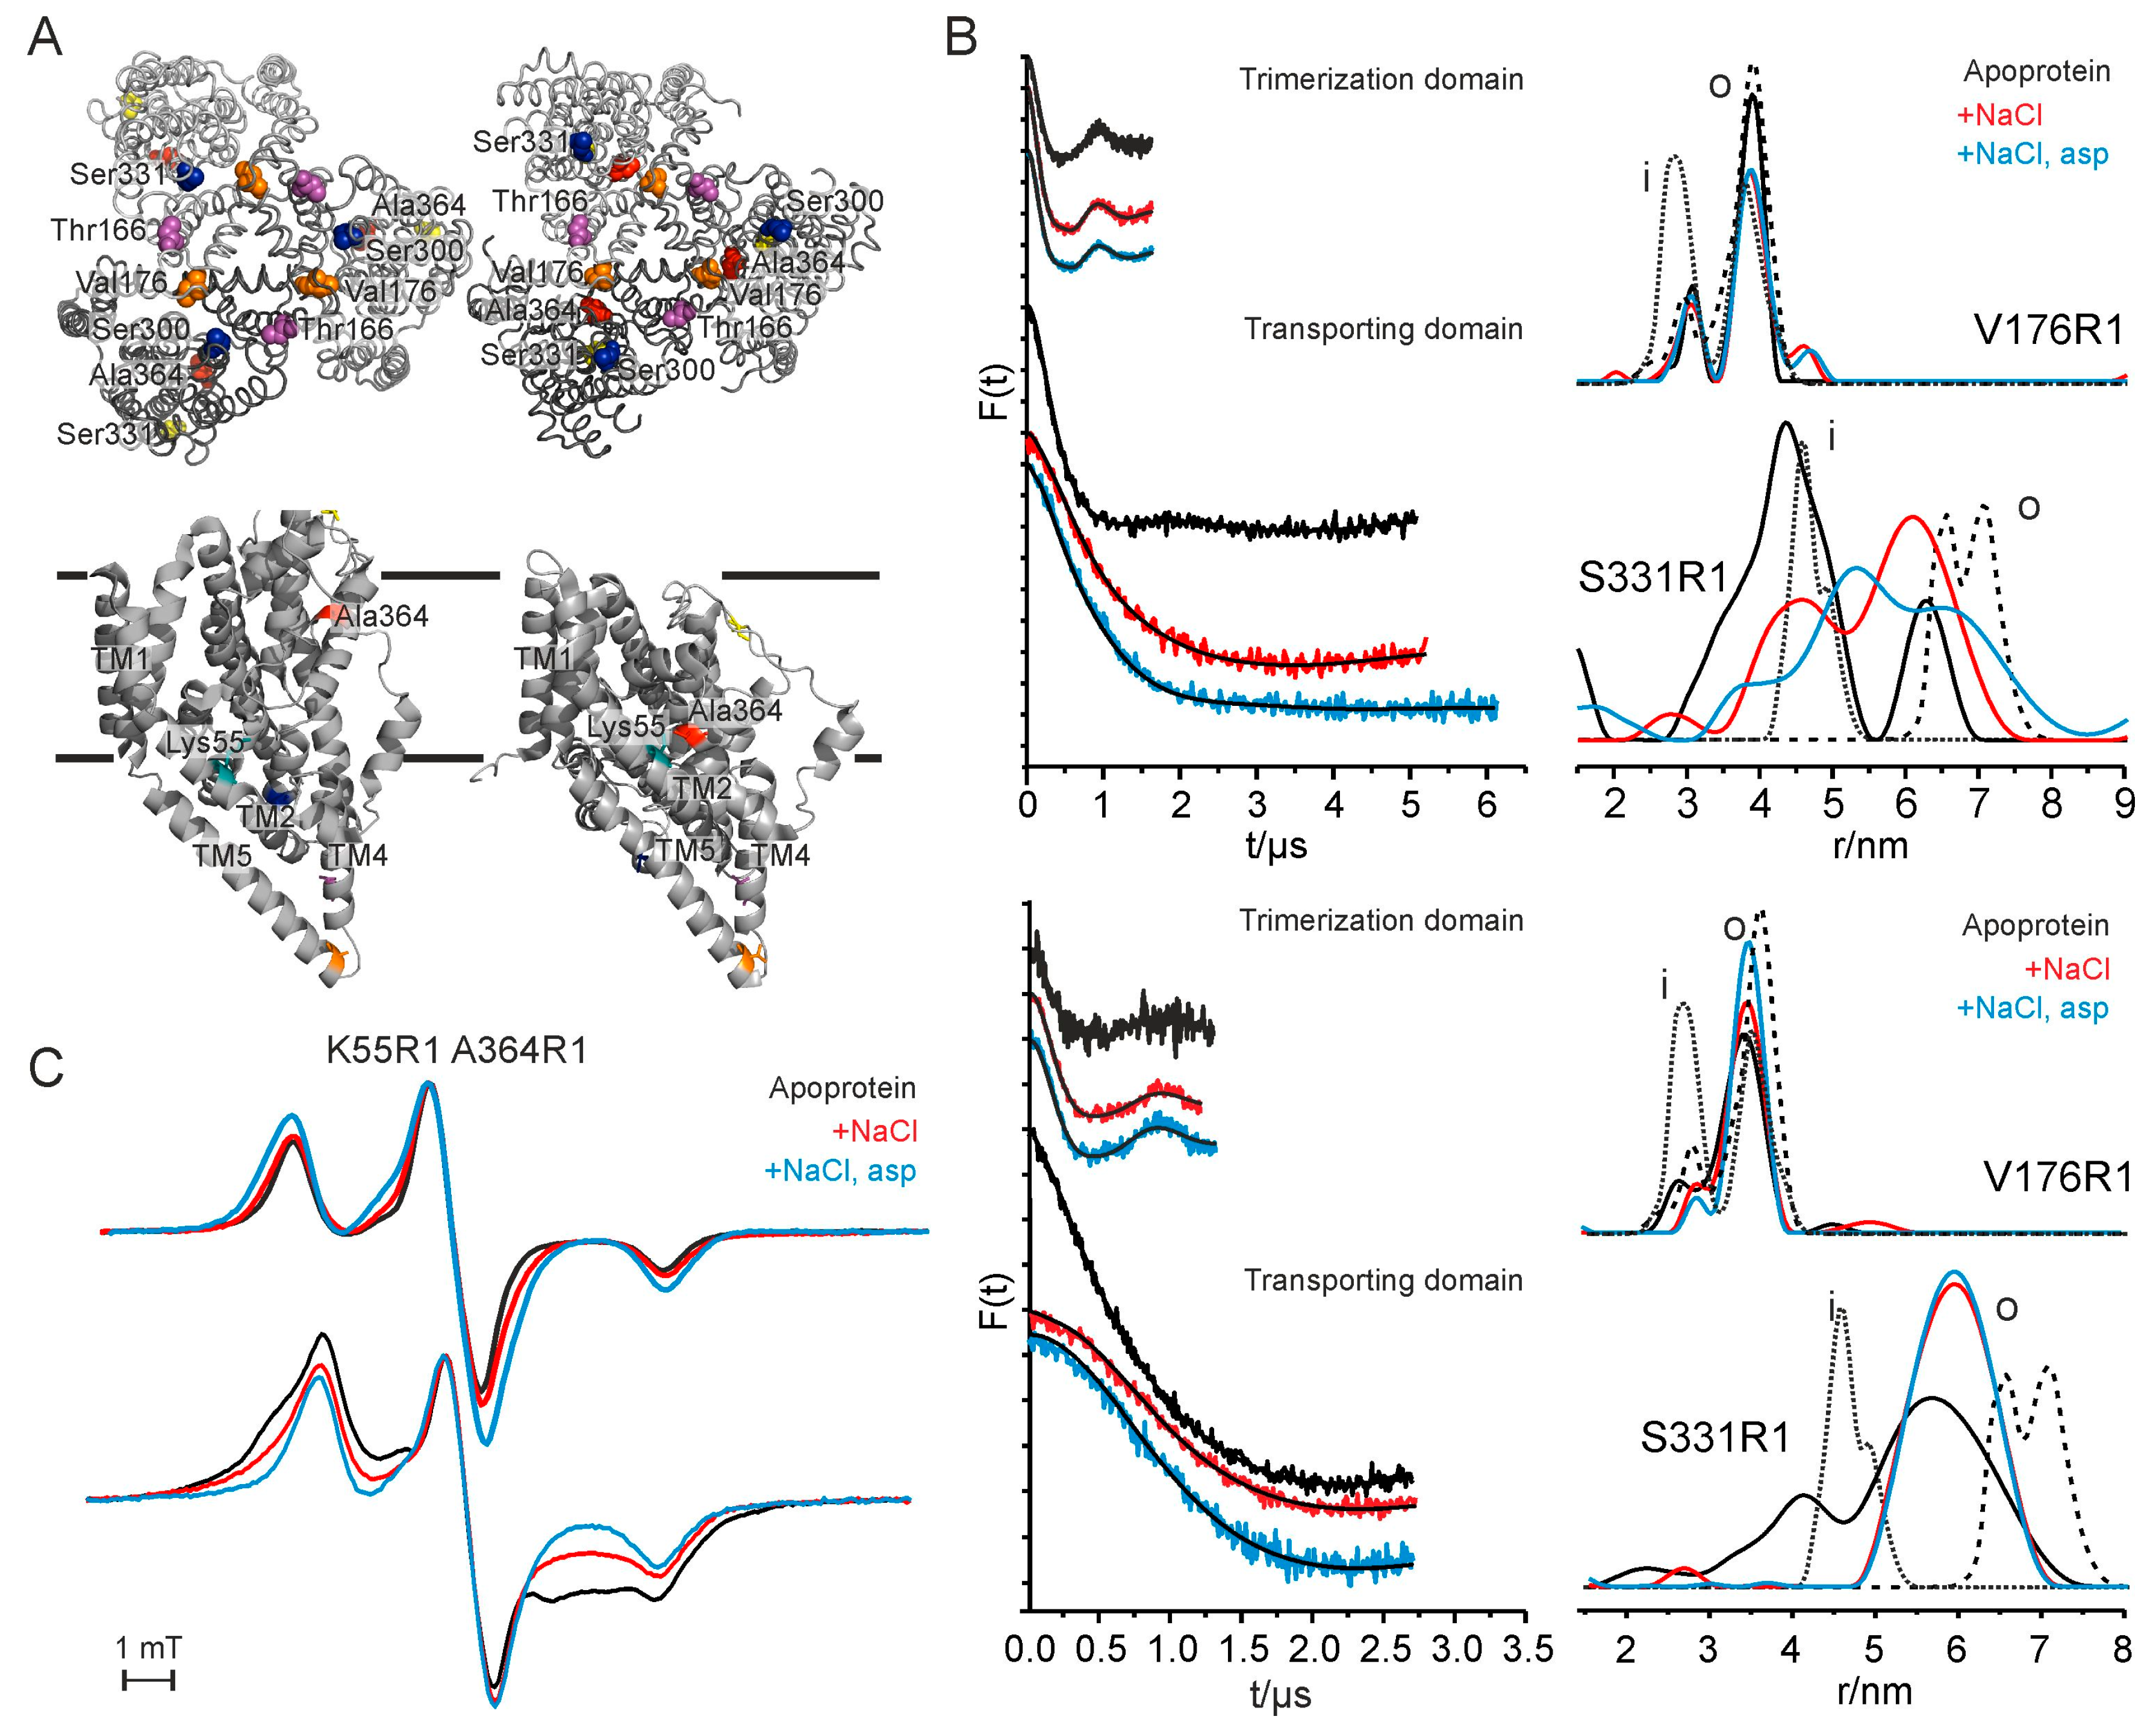
GltPh from the thermophilic archaeon Pyrococcus horikoshii serves as a model protein for EAATs. In the central nervous system EAATs transport extracellular glutamate to the inside of the nerve cells and thereby remove excessive extracellular fluid and facilitate efficient synaptic communication between the neurons. Dysfunction of the EAATs may cause various human diseases, such as Alzheimer’s disease, epilepsy and strokes [151,152]. In humans, there are five subtypes of glutamate transporters (EAAT1-5) [153]. EAATs couple the transport of glutamate or aspartate to the co- and counter-transport of different cations such as sodium ions, potassium ions or protons across the membrane. The type and the amount of the cations vary [154,155,156,157]. GltPh couples the transport of one aspartate to the co-transport of 3 Na+ [155]. Structurally, GltPh forms a homotrimeric protein, in which each protomer is composed of two domains, the trimerization domain and the transporting domain. Moreover, characteristic structural features of each subunit are the two helical hairpins called HP1 and HP2, which probably act as molecular gates closing the substrate binding site and translocation path [158]. The trimerization domain is formed by four transmembrane helices (TM1, TM2, TM4 and TM5) and functions as a rigid scaffold [158,159]. Whereas the four transmembrane helices TM3, TM6, TM7 and TM8 constitute the transporting domain which binds the substrates and is proposed to undergo large elevator-like movements spanning the membrane diameter to expose the helical hairpins to the intracellular and extracellular space, respectively (cf. Figure 7A). These movements are suggested by various crystal structures covering outward- (o) and inward- (i) oriented states as well as intermediate states (PDB 1XFH, 2NWL, 3KBC and 3V8G, respectively).
To follow structural changes of GltPh upon substrate binding by EPR spectroscopy single and double labeled variants have been designed with spin-labeled residues in the trimerization domain and in the transporting domain (Figure 7A). Subsequently, distance distribution of GltPh in detergent solution and reconstituted in liposomes are determined. Generally, single labeled variants have been applied to pulsed EPR experiments at low temperature (T = 50 K) with the apo-protein (Figure 7B, black lines), the protein in the presence of saturating concentrations of Na+ alone (Figure 7B, red lines), or the presence of saturating concentrations of both Na+ and aspartate (Figure 7B, blue lines) to determine inter-protomer interspin distances. Therefore, two sets of single labeled variants have been selected: T166R1 and V176R1 in the trimerization domain and S300R1, S331R1 and A364R1 in the transporting domain, of which we will focus on variants V176R1 and S331R1 exemplarily.
For V176R1 in detergent solution one main interspin distance around 3.9 nm and a less populated interspin distance at 3.1 nm have been identified both with a very narrow distance distribution at all conditions (Figure 7B, upper panel). A comparison of the experimental interspin distances of T176R1 with the ones of the rotamer library analysis gives evidence that the two different experimental distances result from two rotamers of the nitroxide side chain rather than from two different conformations of the protein. Thus, it has been concluded that the trimerization domain forms a stable scaffold.
In contrast, significant differences in the distance distributions are found for single labeled variant S331R1 located in the transporting domain upon substrate addition. Based on the crystal structures the mean interspin distance as derived by a rotamer library analysis for variant S331R1 is expected to increase when the transporting domain moves from an inward- to an outward-facing orientation. The experimentally determined distance distributions however display very broad distribution widths at all conditions indicating the conformational heterogeneity of the transporting domains (Figure 7B, upper panel). The addition of substrates shifts the distance distribution towards longer distances and thus to the outward-facing conformation, nonetheless at any condition several conformations are populated which leads to hypothesize a flat energy landscape with a relatively small difference in free energy between the conformations. This hypothesis is supported by the observation that already the insertion of a spin label at different positions (S300R1 and A364R1, respectively) populates different conformations.
To analyze the potential effect of the membrane environment on the protein conformations and their relative population EPR experiments for selected liposome-reconstituted variants are conducted (Figure 7B, lower panel). For variant V176R1 similar interspin distances are determined in the absence and in the presence of the substrates in detergent solution as well as reconstituted in liposomes. In contrast, different interspin distances are revealed in proteoliposomes compared to detergent solution for variant S331R1. The effects on the interspin distances upon addition of the substrates are qualitatively similar in detergent solution and reconstituted into liposomes. However, the extreme long and short distances are less pronounced and the population of intermediate distances increases. Furthermore, the relative distance changes are smaller in proteoliposomes compared to those in detergent solution indicating that the extreme conformations as found in the crystal structures are less occupied in the native membrane environment.
In addition to the pulsed EPR measurements low temperature cw EPR measurement have been performed to determine shorter intraprotomer distances based on dipolar broadening. For this, residues K55 in the trimerization domain and A364 in the transporting domain are mutated to cysteines and subsequently spin labeled. A previously published inward-facing crystal structure was gained by crosslinking these two residues [158]. In fact, GltPh in detergent solution shows broadened powder spectra at all conditions tested with an increased broadening upon substrate addition (Figure 7C, upper spectra). Thus, an inward-facing conformation is favored upon substrate addition, which is in agreement with the pulsed EPR measurements on single labeled residue A364R1. Additionally, the cw EPR measurements very clearly display the conformational changes upon reconstitution into liposomes. In comparison to the detergent-solubilized sample the apo protein shows very strong spin-spin interaction indicating distances in the 1-nm range. The addition of substrates decreases the spectral broadening, indicating an increase in average interspin distances (Figure 7C, lower spectra). Thus, substrate addition induces opposite distance changes compared to K55R1A364R1 in detergent solution, highlighting the role of the environment in the stabilization of particular conformations.
Based on the results of this cw and pulsed EPR study and existing crystal structures [158,160,161,162] a possible transport mechanism has been proposed in which the trimerization domain remains rigid during the transport process forming a stable core of trimeric GltPh while the transporting domains are constantly shuttling across the membrane. However, this shuttling likely is only a prerequisite for alternately exposing the binding site. Finally, local rearrangements like those shown for HP2 [158,163] may trigger the alternating accessibility of the binding sites by coordinately opening and closing the inward- and outward-facing gates in dependence of the presence of substrate and coupling ions.
3.5. New Developments
Due to the importance of biological membranes for membrane-protein structure, stability and function [164,165,166] EPR investigations of membrane proteins are commonly performed either in detergent micelles or in liposomes, though detergent micelles can be poor membrane mimics. For membrane proteins which are sensitive to their lipid surroundings [167,168] the potential of proteoliposomes lies in the possibility to monitor their function, to study structural details and to follow conformational transitions in a physiologically relevant environment. A disadvantage however is that membrane proteins can insert in two different orientations into the liposomes creating heterogeneity in the accessibility for e.g., ligands. Due to its orientation a membrane transporter might not respond to the addition of nucleotides or ligands to the proteoliposomes [101]. Hence, this heterogeneity might result in subpopulations contributing to the distance distribution in pulsed EPR experiments and therefore impedes the analysis and interpretation of the data. Over the last years the reconstitution of membrane proteins into nanodiscs evolved as a powerful alternative [140,169]. Nanodiscs are self-assembling systems comprising a lipid bilayer stabilized by modified apolipoproteins called membrane scaffold proteins (MSPs) [170] which form a belt-like antiparallel dimer [171,172]. The size of the nanodiscs, and so the area of the lipid bilayer, depends on the length of the MSP proteins. Next to the size of the nanodiscs the lipid composition is fully adaptable to the protein under investigation. Thus, nanodiscs are able to provide adequate lipid environments, support protein oligomeric states and allow access to both the intra- and extracellular part of the studied protein [173,174]. For instance the maltose transporter (MalFGK2) from E. coli [169] and the proton-powered multidrug transporter LmrP from Lactococcus lactis [140] have been successfully reconstituted in nanodiscs. For the latter study pulsed EPR measurements revealed concurrently two conformations of LmrP in detergent micelles and reconstituted in nanodiscs, respectively. However, the apparent pK value of the transition between the inward- and the outward-facing conformations is shifted by approximately two pH units for the reconstituted protein. This shift likely is caused by a proposed interaction between the lipid head groups and a conserved motif of charged residues stabilizing the inward-facing conformation. Thus, lipid interactions in more general may play a crucial role in modulating the proteins’ activity which promotes the comprehension of membrane-inserted proteins in lipid bilayers. However, the nanodisc approach is strictly restricted to membrane proteins whose function and structural dynamics are not based on membrane potentials. Therefore, before reconstitution into nanodiscs or liposomes for EPR investigations a thoroughly survey of the system under investigation and a good understanding of its physical properties are essential for selecting the best possible experimental conditions.
A very recent and promising new development in the field of EPR spectroscopy is the application of distance measurements in whole cells (for now Escherichia coli) and in native membranes [175,176]. The function of membrane proteins and their underlying mechanism may be effected by their surrounding environment emphasizing the necessity for investigations under native conditions. First pulsed EPR measurements have been performed on the cobalamin transporter BtuB acting as a model system for outer membrane transporter [175]. Crystal structures of BtuB in its apo, vitamin B12-bound [177] and TonB-bound [178] states are available. Despite this information the mechanism by which the substrate is released is still not known. A particular challenge working with in vivo systems is the spin labeling of reactive cysteines. Proteins in the outer membrane are suitable model proteins as they are generally free of reactive cysteines, thereby minimizing potential sources of non-specific signals [179,180]. For the first in vivo studies BtuB has been overexpressed and spin labeled in whole cells and outer membranes. Interspin distance measurements between the spin labeled BtuB and the spin labeled cobalamin reveal comparable interspin distances of measurements done in whole cells, outer membranes and synthetic vesicles demonstrating the successful application of in vivo pulsed EPR spectroscopy. However, further applications to inner membrane proteins or eukaryotic membranes might be challenging as higher background signals from endogenous cysteine-containing proteins are to be expected and reducing conditions are found inside the cytoplasm such that cysteine labeling by disulfide bonds is significantly reduced. An alternative coupling strategy to overcome this problem is the click chemistry in combination with unnatural amino acids using azide- and alkyne-functionalized spin labels. For this purpose the copper-catalyzed azide-alkyne 1,3-dipolar cycloaddition (CuAAC) or the copper-free, strain-promoted azide-alkyne cycloaddition (SPAAC) [181] can be implemented for spin labeling. A spin labeling protocol has been recently developed where unnatural amino acids are spin labeled with synthesized azide- or alkyne-functionalized spin labels [182]. The authors performed CuAAC spin labeling in living E. coli cells as a proof of principle for in cell spin labeling based on the click chemistry and first pulsed ERR experiments proofing the applicability of this approach for further EPR studies.
To further improve EPR studies and to render a more comprehensive view of membrane proteins and how alterations in their structures affect their function it is essential to extend the upper limit and accuracy of interspin distances that can be determined in membrane protein complexes. These method developments rely on an improved signal-to-noise ratio and increased modulation depth. In this context, a 7-pulse CP-PELDOR sequence has been introduced based on the Carr-Purcell (CP) decoupling scheme on the observer spin, a specific series of observer spin refocusing pulses [183,184]. This method allows a substantially longer observation time window extending the reliable and accurate interspin distance determination. The 7-pulse CP-PELDOR has been successfully applied to the trimeric betaine transporter BetP providing reliable interspin distance values around 6 nm which are not detectable with the commonly used 4-pulse PELDOR sequence [184]. These CP-PELDOR experiments result in a better determination of the intermolecular background contribution and an improved signal-to-noise ratio. Further developments in this direction might lead to a further increased sensitivity of distance measurements allowing the application of pulsed EPR spectroscopy on single molecules in the future.
Acknowledgments
This work was funded by the Deutsche Forschungsgemeinschaft (Emmy Noether grant HA 6322/3-1 and research grant HA 6322/2-1 to I.H.).
Author Contributions
Dorith Wunnicke and Inga Hänelt wrote the review.
Conflicts of Interest
The authors declare no conflict of interest.
References
- Loll, B.; Kern, J.; Saenger, W.; Zouni, A.; Biesiadka, J. Towards complete cofactor arrangement in the 3.0 Å resolution structure of photosystem II. Nature 2005, 438, 1040–1044. [Google Scholar] [CrossRef] [PubMed]
- Guzenko, D.; Chernyatina, A.A.; Strelkov, S.V. Crystallographic studies of intermediate filament proteins. In Fibrous proteins: Structures and Mechanisms; Parry, D.A.D., Squire, J.M., Eds.; Springer International Publishing: Cham, Switzerland, 2017; pp. 151–170. [Google Scholar]
- Nissen, P.; Hansen, J.; Ban, N.; Moore, P.B.; Steitz, T.A. The structural basis of ribosome activity in peptide bond synthesis. Science 2000, 289, 920–930. [Google Scholar] [CrossRef] [PubMed]
- Bordignon, E.; Steinhoff, H.-J. Membrane protein structure and dynamics studied by site-directed spin-labeling ESR. In Esr Spectroscopy in Membrane Biophysics; Springer: Berlin, Germany, 2007; pp. 129–164. [Google Scholar]
- Prisner, T.; Rohrer, M.; MacMillan, F. Pulsed EPR spectroscopy: Biological applications. Annu. Rev. Phys. Chem. 2001, 52, 279–313. [Google Scholar] [CrossRef] [PubMed]
- Klug, C.S.; Feix, J.B. Methods and applications of site-directed spin labeling EPR spectroscopy. Methods Cell Biol. 2008, 84, 617–658. [Google Scholar] [PubMed]
- Klare, J.P. Site-directed spin labeling EPR spectroscopy in protein research. Biol. Chem. 2013, 394, 1281–1300. [Google Scholar] [CrossRef] [PubMed]
- Roser, P.; Schmidt, M.J.; Drescher, M.; Summerer, D. Site-directed spin labeling of proteins for distance measurements in vitro and in cells. Org. Biomol. Chem. 2016, 14, 5468–5476. [Google Scholar] [CrossRef] [PubMed]
- Berliner, L.J.; Grunwald, J.; Hankovszky, H.O.; Hideg, K. A novel reversible thiol-specific spin label: Papain active site labeling and inhibition. Anal. Biochem. 1982, 119, 450–455. [Google Scholar] [CrossRef]
- Kolb, H.C.; Finn, M.; Sharpless, K.B. Click chemistry: Diverse chemical function from a few good reactions. Angew. Chem. Int. Ed. 2001, 40, 2004–2021. [Google Scholar] [CrossRef]
- Jakobsen, U.; Shelke, S.A.; Vogel, S.; Sigurdsson, S.T. Site-directed spin-labeling of nucleic acids by click chemistry: Detection of abasic sites in duplex DNA by EPR spectroscopy. J. Am. Chem. Soc. 2010, 132, 10424–10428. [Google Scholar] [CrossRef] [PubMed]
- Ding, P.; Wunnicke, D.; Steinhoff, H.J.; Seela, F. Site-directed spin-labeling of DNA by the azide–alkyne ‘click’ reaction: Nanometer distance measurements on 7-deaza-2′-deoxyadenosine and 2′-deoxyuridine nitroxide conjugates spatially separated or linked to a ‘da-dt’ base pair. Chem. A Eur. J. 2010, 16, 14385–14396. [Google Scholar] [CrossRef] [PubMed]
- Griffith, O.; Jost, P.; Berliner, L. Spin Labeling: Theory and Applications; Academic Press: New York, NY, USA, 1976; Volume 1, p. 453. [Google Scholar]
- McHaourab, H.S.; Lietzow, M.A.; Hideg, K.; Hubbell, W.L. Motion of spin-labeled side chains in T4 lysozyme. Correlation with protein structure and dynamics. Biochemistry 1996, 35, 7692–7704. [Google Scholar] [CrossRef] [PubMed]
- Hubbell, W.L.; McHaourab, H.S.; Altenbach, C.; Lietzow, M.A. Watching proteins move using site-directed spin labeling. Structure 1996, 4, 779–783. [Google Scholar] [CrossRef]
- Steinhoff, H.-J.; Hubbell, W.L. Calculation of electron paramagnetic resonance spectra from brownian dynamics trajectories: Application to nitroxide side chains in proteins. Biophys. J. 1996, 71, 2201–2212. [Google Scholar] [CrossRef]
- Steinhoff, H.-J.; Müller, M.; Beier, C.; Pfeiffer, M. Molecular dynamics simulation and EPR spectroscopy of nitroxide side chains in bacteriorhodopsin. J. Mol. Liq. 2000, 84, 17–27. [Google Scholar] [CrossRef]
- Barnes, J.P.; Liang, Z.; McHaourab, H.S.; Freed, J.H.; Hubbell, W.L. A multifrequency electron spin resonance study of T4 lysozyme dynamics. Biophys. J. 1999, 76, 3298–3306. [Google Scholar] [CrossRef]
- Borbat, P.P.; Costa-Filho, A.J.; Earle, K.A.; Moscicki, J.K.; Freed, J.H. Electron spin resonance in studies of membranes and proteins. Science 2001, 291, 266–269. [Google Scholar] [CrossRef] [PubMed]
- Freed, J.H. Theory of slow tumbling ESR spectra for nitroxides. Spin Label. Theory Appl. 1976, 1, 53–132. [Google Scholar]
- Beier, C.; Steinhoff, H.-J. A structure-based simulation approach for electron paramagnetic resonance spectra using molecular and stochastic dynamics simulations. Biophys. J. 2006, 91, 2647–2664. [Google Scholar] [CrossRef] [PubMed]
- DeSensi, S.C.; Rangel, D.P.; Beth, A.H.; Lybrand, T.P.; Hustedt, E.J. Simulation of nitroxide electron paramagnetic resonance spectra from brownian trajectories and molecular dynamics simulations. Biophys. J. 2008, 94, 3798–3809. [Google Scholar] [CrossRef] [PubMed]
- Hubbell, W.L.; Cafiso, D.S.; Altenbach, C. Identifying conformational changes with site-directed spin labeling. Nat. Struct. Mol. Biol. 2000, 7, 735–739. [Google Scholar] [CrossRef] [PubMed]
- Altenbach, C.; Froncisz, W.; Hemker, R.; McHaourab, H.; Hubbell, W.L. Accessibility of nitroxide side chains: Absolute heisenberg exchange rates from power saturation EPR. Biophys. J. 2005, 89, 2103–2112. [Google Scholar] [CrossRef] [PubMed]
- Altenbach, C.; Greenhalgh, D.A.; Khorana, H.G.; Hubbell, W.L. A collision gradient method to determine the immersion depth of nitroxides in lipid bilayers: Application to spin-labeled mutants of bacteriorhodopsin. Proc. Natl. Acad. Sci. USA 1994, 91, 1667–1671. [Google Scholar] [CrossRef] [PubMed]
- Marsh, D.; Dzikovski, B.G.; Livshits, V.A. Oxygen profiles in membranes. Biophys. J. 2006, 90, L49–L51. [Google Scholar] [CrossRef] [PubMed]
- Mchaourab, H.S.; Hyde, J.S. Dependence of the multiple-quantum EPR signal on the spin-lattice relaxation time. Effect of oxygen in spin-labeled membranes. J. Magn. Reson. Ser. B 1993, 101, 178–184. [Google Scholar] [CrossRef]
- Percival, P.; Hyde, J.S. Pulsed EPR spectrometer, II. Rev. Sci. Instrum. 1975, 46, 1522–1529. [Google Scholar] [CrossRef]
- Nielsen, R.D.; Canaan, S.; Gladden, J.A.; Gelb, M.H.; Mailer, C.; Robinson, B.H. Comparing continuous wave progressive saturation EPR and time domain saturation recovery EPR over the entire motional range of nitroxide spin labels. J. Magn. Reson. 2004, 169, 129–163. [Google Scholar] [CrossRef] [PubMed]
- Plato, M.; Steinhoff, H.-J.; Wegener, C.; Törring, J.T.; Savitsky, A.; Möbius, K. Molecular orbital study of polarity and hydrogen bonding effects on the g and hyperfine tensors of site directed no spin labelled bacteriorhodopsin. Mol. Phys. 2002, 100, 3711–3721. [Google Scholar] [CrossRef]
- Steinhoff, H.J.; Radzwill, N.; Thevis, W.; Lenz, V.; Brandenburg, D.; Antson, A.; Dodson, G.; Wollmer, A. Determination of interspin distances between spin labels attached to insulin: Comparison of electron paramagnetic resonance data with the X-ray structure. Biophys. J. 1997, 73, 3287–3298. [Google Scholar] [CrossRef]
- Cooke, J.A.; Brown, L.J. Distance measurements by continuous wave EPR spectroscopy to monitor protein folding. In Protein Folding, Misfolding, and Disease: Methods and Protocols; Hill, A.F., Barnham, K.J., Bottomley, S.P., Cappai, R., Eds.; Humana Press: Totowa, NJ, USA, 2011; pp. 73–96. [Google Scholar]
- Schiemann, O.; Prisner, T.F. Long-range distance determinations in biomacromolecules by EPR spectroscopy. Q. Rev. Biophys. 2007, 40, 1–53. [Google Scholar] [CrossRef] [PubMed]
- Berliner, L.J.; Eaton, S.S.; Eaton, G.R. Distance Measurements in Biological Systems by EPR; Springer Science & Business Media: New York, NY, USA, 2006; Volume 19. [Google Scholar]
- Rabenstein, M.D.; Shin, Y.K. Determination of the distance between two spin labels attached to a macromolecule. Proc. Natl. Acad. Sci. USA 1995, 92, 8239–8243. [Google Scholar] [CrossRef] [PubMed]
- Likhtenshtein, G.; Wiley, J. Spin labelling methods in molecular biology. FEBS Lett. 1977, 83, 1. [Google Scholar]
- Radzwill, N.; Gerwert, K.; Steinhoff, H.J. Time-resolved detection of transient movement of helices F and G in doubly spin-labeled bacteriorhodopsin. Biophys. J. 2001, 80, 2856–2866. [Google Scholar] [CrossRef]
- Fiori, W.R.; Millhauser, G.L. Exploring the peptide 310-helix⇆ α–helix equilibrium with double label electron spin resonance. Biopolymers 1995, 37, 243–250. [Google Scholar] [CrossRef] [PubMed]
- Pannier, M.; Veit, S.; Godt, A.; Jeschke, G.; Spiess, H.W. Dead-time free measurement of dipole-dipole interactions between electron spins. J. Magn. Reson. 2000, 142, 331–340. [Google Scholar] [CrossRef] [PubMed]
- Jeschke, G.; Polyhach, Y. Distance measurements on spin-labelled biomacromolecules by pulsed electron paramagnetic resonance. Phys. Chem. Chem. Phys. 2007, 9, 1895–1910. [Google Scholar] [CrossRef] [PubMed]
- Jeschke, G.; Panek, G.; Godt, A.; Bender, A.; Paulsen, H. Data analysis procedures for pulse ELDOR measurements of broad distance distributions. Appl. Magn. Reson. 2004, 26, 223. [Google Scholar] [CrossRef]
- Chiang, Y.-W.; Borbat, P.P.; Freed, J.H. The determination of pair distance distributions by pulsed ESR using tikhonov regularization. J. Magn. Reson. 2005, 172, 279–295. [Google Scholar] [CrossRef] [PubMed]
- Jeschke, G. Deeranalysis2006—A comprehensive software package for analyzing pulsed ELDOR data. Appl. Magn. Reson. 2006, 30, 473–498. [Google Scholar] [CrossRef]
- Polyhach, Y.; Bordignon, E.; Jeschke, G. Rotamer libraries of spin labelled cysteines for protein studies. Phys. Chem. Chem. Phys. 2011, 13, 2356–2366. [Google Scholar] [CrossRef] [PubMed]
- Puljung, M.C.; DeBerg, H.A.; Zagotta, W.N.; Stoll, S. Double electron-electron resonance reveals cAMP-induced conformational change in HCN channels. Proc. Natl. Acad. Sci. USA 2014, 111, 9816–9821. [Google Scholar] [CrossRef] [PubMed]
- Van Eps, N.; Caro, L.N.; Morizumi, T.; Ernst, O.P. Characterizing rhodopsin signaling by EPR spectroscopy: From structure to dynamics. Photochem. Photobiol. Sci. 2015, 14, 1586–1597. [Google Scholar] [CrossRef] [PubMed]
- Manglik, A.; Kim, T.H.; Masureel, M.; Altenbach, C.; Yang, Z.; Hilger, D.; Lerch, M.T.; Kobilka, T.S.; Thian, F.S.; Hubbell, W.L.; et al. Structural insights into the dynamic process of β2-adrenergic receptor signaling. Cell 2015, 161, 1101–1111. [Google Scholar] [CrossRef] [PubMed]
- Dror, R.O.; Mildorf, T.J.; Hilger, D.; Manglik, A.; Borhani, D.W.; Arlow, D.H.; Philippsen, A.; Villanueva, N.; Yang, Z.; Lerch, M.T.; et al. Structural basis for nucleotide exchange in heterotrimeric g proteins. Science 2015, 348, 1361–1365. [Google Scholar] [CrossRef] [PubMed]
- Sattig, T.; Rickert, C.; Bamberg, E.; Steinhoff, H.-J.; Bamann, C. Light-induced movement of the transmembrane helix B in channelrhodopsin-2. Angew. Chem. Int. Ed. 2013, 52, 9705–9708. [Google Scholar] [CrossRef] [PubMed]
- Krause, N.; Engelhard, C.; Heberle, J.; Schlesinger, R.; Bittl, R. Structural differences between the closed and open states of channelrhodopsin-2 as observed by EPR spectroscopy. FEBS Lett. 2013, 587, 3309–3313. [Google Scholar] [CrossRef] [PubMed]
- Wolff, E.K.; Bogomolni, R.A.; Scherrer, P.; Hess, B.; Stoeckenius, W. Color discrimination in halobacteria: Spectroscopic characterization of a second sensory receptor covering the blue-green region of the spectrum. Proc. Natl. Acad. Sci. USA 1986, 83, 7272–7276. [Google Scholar] [CrossRef] [PubMed]
- Klare, J.P.; Chizhov, I.; Engelhard, M. Microbial rhodopsins: Scaffolds for ion pumps, channels, and sensors. In Bioenergetics; Springer: Berlin, Germany, 2007; pp. 73–122. [Google Scholar]
- Spudich, J.L.; Yang, C.-S.; Jung, K.-H.; Spudich, E.N. Retinylidene proteins: Structures and functions from archaea to humans. Annu. Rev. Cell Dev. Biol. 2000, 16, 365–392. [Google Scholar] [CrossRef] [PubMed]
- Royant, A.; Nollert, P.; Edman, K.; Neutze, R.; Landau, E.M.; Pebay-Peyroula, E.; Navarro, J. X-ray structure of sensory rhodopsin II at 2.1-Å resolution. Proc. Natl. Acad. Sci. USA 2001, 98, 10131–10136. [Google Scholar] [CrossRef] [PubMed]
- Luecke, H.; Schobert, B.; Lanyi, J.K.; Spudich, E.N.; Spudich, J.L. Crystal structure of sensory rhodopsin II at 2.4 angstroms: Insights into color tuning and transducer interaction. Science 2001, 293, 1499–1503. [Google Scholar] [CrossRef] [PubMed]
- Aravind, L.; Ponting, C.P. The cytoplasmic helical linker domain of receptor histidine kinase and methyl-accepting proteins is common to many prokaryotic signalling proteins. FEMS Microbiol. Lett. 1999, 176, 111–116. [Google Scholar] [CrossRef] [PubMed]
- Appleman, J.A.; Stewart, V. Mutational analysis of a conserved signal-transducing element: The hamp linker of the escherichia coli nitrate sensor narx. J. Bacteriol. 2003, 185, 89–97. [Google Scholar] [CrossRef] [PubMed]
- Chen, X.; Spudich, J.L. Demonstration of 2:2 stoichiometry in the functional SRI–HtrI signaling complex in halobacterium membranes by gene fusion analysis. Biochemistry 2002, 41, 3891–3896. [Google Scholar] [CrossRef] [PubMed]
- Wegener, A.A.; Klare, J.P.; Engelhard, M.; Steinhoff, H.J. Structural insights into the early steps of receptor—Transducer signal transfer in archaeal phototaxis. EMBO J. 2001, 20, 5312–5319. [Google Scholar] [CrossRef] [PubMed]
- Hulko, M.; Berndt, F.; Gruber, M.; Linder, J.U.; Truffault, V.; Schultz, A.; Martin, J.; Schultz, J.E.; Lupas, A.N.; Coles, M. The hamp domain structure implies helix rotation in transmembrane signaling. Cell 2006, 126, 929–940. [Google Scholar] [CrossRef] [PubMed]
- Airola, M.V.; Watts, K.J.; Bilwes, A.M.; Crane, B.R. Structure of concatenated hamp domains provides a mechanism for signal transduction. Structure 2010, 18, 436–448. [Google Scholar] [CrossRef] [PubMed]
- Doebber, M.; Bordignon, E.; Klare, J.P.; Holterhues, J.; Martell, S.; Mennes, N.; Li, L.; Engelhard, M.; Steinhoff, H.-J. Salt-driven equilibrium between two conformations in the hamp domain from natronomonas pharaonis: The language of signal transfer? J. Biol. Chem. 2008, 283, 28691–28701. [Google Scholar] [CrossRef] [PubMed]
- Klare, J.P.; Bordignon, E.; Engelhard, M.; Steinhoff, H.-J. Transmembrane signal transduction in archaeal phototaxis: The sensory rhodopsin II-transducer complex studied by electron paramagnetic resonance spectroscopy. Eur. J. Cell Biol. 2011, 90, 731–739. [Google Scholar] [CrossRef] [PubMed]
- Doyle, D.A.; Cabral, J.M.; Pfuetzner, R.A.; Kuo, A.; Gulbis, J.M.; Cohen, S.L.; Chait, B.T.; MacKinnon, R. The structure of the potassium channel: Molecular basis of K+ conduction and selectivity. Science 1998, 280, 69–77. [Google Scholar] [CrossRef] [PubMed]
- Cordero-Morales, J.F.; Cuello, L.G.; Zhao, Y.; Jogini, V.; Cortes, D.M.; Roux, B.; Perozo, E. Molecular determinants of gating at the potassium-channel selectivity filter. Nat. Struct. Mol. Biol. 2006, 13, 311–318. [Google Scholar] [CrossRef] [PubMed]
- Liu, S.; Focke, P.J.; Matulef, K.; Bian, X.; Moënne-Loccoz, P.; Valiyaveetil, F.I.; Lockless, S.W. Ion-binding properties of a K+ channel selectivity filter in different conformations. Proc. Natl. Acad. Sci. USA 2015, 112, 15096–15100. [Google Scholar] [CrossRef] [PubMed]
- Liu, Y.-S.; Sompornpisut, P.; Perozo, E. Structure of the KcsA channel intracellular gate in the open state. Nat. Struct. Mol. Biol. 2001, 8, 883–887. [Google Scholar] [CrossRef] [PubMed]
- Cortes, D.M.; Cuello, L.G.; Perozo, E. Molecular architecture of full-length KcsA. Role Cytoplasmic Domains Ion Permeat. Act. Gating 2001, 117, 165–180. [Google Scholar]
- Raghuraman, H.; Islam, S.M.; Mukherjee, S.; Roux, B.; Perozo, E. Dynamics transitions at the outer vestibule of the KcsA potassium channel during gating. Proc. Natl. Acad. Sci. USA 2014, 111, 1831–1836. [Google Scholar] [CrossRef] [PubMed]
- Matthies, D.; Dalmas, O.; Borgnia, M.J.; Dominik, P.K.; Merk, A.; Rao, P.; Reddy, B.G.; Islam, S.; Bartesaghi, A.; Perozo, E.; et al. Cryo-em structures of the magnesium channel cora reveal symmetry break upon gating. Cell 2016, 164, 747–756. [Google Scholar] [CrossRef] [PubMed]
- Dalmas, O.; Sompornpisut, P.; Bezanilla, F.; Perozo, E. Molecular mechanism of Mg2+-dependent gating in cora. Nat. Commun. 2014, 5, 3590. [Google Scholar] [CrossRef] [PubMed]
- Dalmas, O.; Cuello, L.G.; Jogini, V.; Cortes, D.M.; Roux, B.; Perozo, E. Structural dynamics of the magnesium-bound conformation of cora in a lipid bilayer. Structure 2010, 18, 868–878. [Google Scholar] [CrossRef] [PubMed]
- Hänelt, I. Membrane region M2C2 in subunit KtrB of the K+ uptake system KtrAB from vibrio alginolyticus forms a flexible gate controlling K+ flux: An electron paramagnetic resonance study. J. Biol. Chem. 2010, 285, 28210–28219. [Google Scholar] [CrossRef] [PubMed]
- Perozo, E.; Cortes, D.M.; Sompornpisut, P.; Kloda, A.; Martinac, B. Open channel structure of Mscl and the gating mechanism of mechanosensitive channels. Nature 2002, 418, 942–948. [Google Scholar] [CrossRef] [PubMed]
- Perozo, E.; Kloda, A.; Cortes, D.M.; Martinac, B. Site-directed spin-labeling analysis of reconstituted Mscl in the closed state. J. Gen. Physiol. 2001, 118, 193–206. [Google Scholar] [CrossRef] [PubMed]
- DeBerg, H.A.; Brzovic, P.S.; Flynn, G.E.; Zagotta, W.N.; Stoll, S. Structure and energetics of allosteric regulation of HCN2 ion channels by cyclic nucleotides. J. Biol. Chem. 2016, 291, 371–381. [Google Scholar] [CrossRef] [PubMed]
- Bagnéris, C.; DeCaen, P.G.; Hall, B.A.; Naylor, C.E.; Clapham, D.E.; Kay, C.W.; Wallace, B.A. Role of the C-terminal domain in the structure and function of tetrameric sodium channels. Nat. Commun. 2013, 4, 2465. [Google Scholar] [CrossRef] [PubMed]
- Dellisanti, C.D.; Ghosh, B.; Hanson, S.M.; Raspanti, J.M.; Grant, V.A.; Diarra, G.M.; Schuh, A.M.; Satyshur, K.; Klug, C.S.; Czajkowski, C. Site-directed spin labeling reveals pentameric ligand-gated ion channel gating motions. PLoS Biol. 2013, 11, e1001714. [Google Scholar] [CrossRef] [PubMed]
- Chakrapani, S. Chapter fourteen—EPR studies of gating mechanisms in ion channels. In Methods in Enzymology; Arun, K.S., Ed.; Academic Press: New York, NY, USA, 2015; Volume 557, pp. 279–306. [Google Scholar]
- Dalmas, O.; Hyde, H.C.; Hulse, R.E.; Perozo, E. Symmetry-constrained analysis of pulsed double electron–electron resonance (DEER) spectroscopy reveals the dynamic nature of the KcsA activation gate. J. Am. Chem. Soc. 2012, 134, 16360–16369. [Google Scholar] [CrossRef] [PubMed]
- Sine, S.M.; Engel, A.G. Recent advances in cys-loop receptor structure and function. Nature 2006, 440, 448–455. [Google Scholar] [CrossRef] [PubMed]
- Thompson, A.J.; Lester, H.A.; Lummis, S.C.R. The structural basis of function in cys-loop receptors. Q. Rev. Biophys. 2010, 43, 449–499. [Google Scholar] [CrossRef] [PubMed]
- Corringer, P.-J.; Poitevin, F.; Prevost, M.S.; Sauguet, L.; Delarue, M.; Changeux, J.-P. Structure and pharmacology of pentameric receptor channels: From bacteria to brain. Structure 2012, 20, 941–956. [Google Scholar] [CrossRef] [PubMed]
- Da Costa, C.J.B.; Baenziger, J.E. Gating of pentameric ligand-gated ion channels: Structural insights and ambiguities. Structure 2013, 21, 1271–1283. [Google Scholar] [CrossRef] [PubMed]
- Hibbs, R.E.; Gouaux, E. Principles of activation and permeation in an anion-selective cys-loop receptor. Nature 2011, 474, 54–60. [Google Scholar] [CrossRef] [PubMed]
- Miller, P.S.; Aricescu, A.R. Crystal structure of a human GABAA receptor. Nature 2014, 512, 270–275. [Google Scholar] [CrossRef] [PubMed]
- Hassaine, G.; Deluz, C.; Grasso, L.; Wyss, R.; Tol, M.B.; Hovius, R.; Graff, A.; Stahlberg, H.; Tomizaki, T.; Desmyter, A.; et al. X-ray structure of the mouse serotonin 5-HT3 receptor. Nature 2014, 512, 276–281. [Google Scholar] [CrossRef] [PubMed]
- Bocquet, N.; Nury, H.; Baaden, M.; Le Poupon, C.; Changeux, J.-P.; Delarue, M.; Corringer, P.-J. X-ray structure of a pentameric ligand-gated ion channel in an apparently open conformation. Nature 2009, 457, 111–114. [Google Scholar] [CrossRef] [PubMed]
- Hilf, R.J.C.; Dutzler, R. Structure of a potentially open state of a proton-activated pentameric ligand-gated ion channel. Nature 2009, 457, 115–118. [Google Scholar] [CrossRef] [PubMed]
- Hilf, R.J.C.; Dutzler, R. X-ray structure of a prokaryotic pentameric ligand-gated ion channel. Nature 2008, 452, 375–379. [Google Scholar] [CrossRef] [PubMed]
- Zimmermann, I.; Dutzler, R. Ligand activation of the prokaryotic pentameric ligand-gated ion channel elic. PLoS Biol. 2011, 9, e1001101. [Google Scholar] [CrossRef] [PubMed]
- Pan, J.; Chen, Q.; Willenbring, D.; Yoshida, K.; Tillman, T.; Kashlan, O.B.; Cohen, A.; Kong, X.-P.; Xu, Y.; Tang, P. Structure of the pentameric ligand-gated ion channel ELIC cocrystallized with its competitive antagonist acetylcholine. Nat. Commun. 2012, 3, 714. [Google Scholar] [CrossRef] [PubMed]
- Spurny, R.; Ramerstorfer, J.; Price, K.; Brams, M.; Ernst, M.; Nury, H.; Verheij, M.; Legrand, P.; Bertrand, D.; Bertrand, S.; et al. Pentameric ligand-gated ion channel ELIC is activated by GABA and modulated by benzodiazepines. Proc. Natl. Acad. Sci. USA 2012, 109, E3028–E3034. [Google Scholar] [CrossRef] [PubMed]
- Ulens, C.; Spurny, R.; Thompson, A.J.; Alqazzaz, M.; Debaveye, S.; Han, L.; Price, K.; Villalgordo, J.M.; Tresadern, G.; Lynch, J.W.; et al. The prokaryote ligand-gated ion channel ELIC captured in a pore blocker-bound conformation by the alzheimer’s disease drug memantine. Structure 2014, 22, 1399–1407. [Google Scholar] [CrossRef] [PubMed]
- Schmandt, N.; Velisetty, P.; Chalamalasetti, S.V.; Stein, R.A.; Bonner, R.; Talley, L.; Parker, M.D.; Mchaourab, H.S.; Yee, V.C.; Lodowski, D.T.; et al. A chimeric prokaryotic pentameric ligand–gated channel reveals distinct pathways of activation. J. Gen. Physiol. 2015, 146, 323–340. [Google Scholar] [CrossRef] [PubMed]
- Velisetty, P.; Chalamalasetti, S.V.; Chakrapani, S. Structural basis for allosteric coupling at the membrane-protein interface in gloeobacter violaceus ligand-gated ion channel (GLIC). J. Biol. Chem. 2014, 289, 3013–3025. [Google Scholar] [CrossRef] [PubMed]
- Sauguet, L.; Shahsavar, A.; Poitevin, F.; Huon, C.; Menny, A.; Nemecz, À.; Haouz, A.; Changeux, J.-P.; Corringer, P.-J.; Delarue, M. Crystal structures of a pentameric ligand-gated ion channel provide a mechanism for activation. Proc. Natl. Acad. Sci. USA 2014, 111, 966–971. [Google Scholar] [CrossRef] [PubMed]
- Ter Beek, J.; Guskov, A.; Slotboom, D.J. Structural diversity of ABC transporters. J. Gen. Physiol. 2014, 143, 419–435. [Google Scholar] [CrossRef] [PubMed]
- Locher, K.P. Mechanistic diversity in ATP-binding cassette (ABC) transporters. Nat. Struct. Mol. Biol. 2016, 23, 487–493. [Google Scholar] [CrossRef] [PubMed]
- Böhm, S.; Licht, A.; Wuttge, S.; Schneider, E.; Bordignon, E. Conformational plasticity of the type I maltose ABC importer. Proc. Natl. Acad. Sci. USA 2013, 110, 5492–5497. [Google Scholar] [CrossRef] [PubMed]
- Grote, M.; Polyhach, Y.; Jeschke, G.; Steinhoff, H.-J.; Schneider, E.; Bordignon, E. Transmembrane signaling in the maltose ABC transporter MalFGK2-E: Periplasmic MalF-P2 loop communicates substrate availability to the ATP-bound MalK dimer. J. Biol. Chem. 2009, 284, 17521–17526. [Google Scholar] [CrossRef] [PubMed]
- Cui, J.; Qasim, S.; Davidson, A.L. Uncoupling substrate transport from ATP hydrolysis in the Escherichia coli maltose transporter. J. Biol. Chem. 2010, 285, 39986–39993. [Google Scholar] [CrossRef] [PubMed]
- Orelle, C.; Ayvaz, T.; Everly, R.M.; Klug, C.S.; Davidson, A.L. Both maltose-binding protein and ATP are required for nucleotide-binding domain closure in the intact maltose ABC transporter. Proc. Natl. Acad. Sci. USA 2008, 105, 12837–12842. [Google Scholar] [CrossRef] [PubMed]
- Rice, A.J.; Harrison, A.; Alvarez, F.J.D.; Davidson, A.L.; Pinkett, H.W. Small substrate transport and mechanism of a molybdate ATP binding cassette transporter in a lipid environment. J. Biol. Chem. 2014, 289, 15005–15013. [Google Scholar] [CrossRef] [PubMed]
- Rice, A.J.; Alvarez, F.J.D.; Davidson, A.L.; Pinkett, H.W. Effects of lipid environment on the conformational changes of an ABC importer. Channels 2014, 8, 327–333. [Google Scholar] [CrossRef] [PubMed]
- Sippach, M.; Weidlich, D.; Klose, D.; Abé, C.; Klare, J.; Schneider, E.; Steinhoff, H.-J. Conformational changes of the histidine ATP-binding cassette transporter studied by double electron–electron resonance spectroscopy. Biochim. Biophys. Acta Biomembr. 2014, 1838, 1760–1768. [Google Scholar] [CrossRef] [PubMed]
- Hvorup, R.N.; Goetz, B.A.; Niederer, M.; Hollenstein, K.; Perozo, E.; Locher, K.P. Asymmetry in the structure of the ABC transporter-binding protein complex BtuCD-BtuF. Science 2007, 317, 1387–1390. [Google Scholar] [CrossRef] [PubMed]
- Goetz, B.A.; Perozo, E.; Locher, K.P. Distinct gate conformations of the ABC transporter BtuCD revealed by electron spin resonance spectroscopy and chemical cross-linking. FEBS Lett. 2009, 583, 266–270. [Google Scholar] [CrossRef] [PubMed]
- Joseph, B.; Jeschke, G.; Goetz, B.A.; Locher, K.P.; Bordignon, E. Transmembrane gate movements in the type II ATP-binding cassette (ABC) importer BtuCD-F during nucleotide cycle. J. Biol. Chem. 2011, 286, 41008–41017. [Google Scholar] [CrossRef] [PubMed]
- Joseph, B.; Korkhov, V.M.; Yulikov, M.; Jeschke, G.; Bordignon, E. Conformational cycle of the vitamin B12 ABC importer in liposomes detected by double electron-electron resonance (DEER). J. Biol. Chem. 2014, 289, 3176–3185. [Google Scholar] [CrossRef] [PubMed]
- Majsnerowska, M.; Hänelt, I.; Wunnicke, D.; Schäfer, L.V.; Steinhoff, H.-J.; Slotboom, D.J. Substrate-induced conformational changes in the S-component ThiT from an energy coupling factor transporter. Structure 2013, 21, 861–867. [Google Scholar] [CrossRef] [PubMed]
- Finkenwirth, F.; Sippach, M.; Landmesser, H.; Kirsch, F.; Ogienko, A.; Grunzel, M.; Kiesler, C.; Steinhoff, H.-J.; Schneider, E.; Eitinger, T. ATP-dependent conformational changes trigger substrate capture and release by an ECF-type biotin transporter. J. Biol. Chem. 2015, 290, 16929–16942. [Google Scholar] [CrossRef] [PubMed]
- Mishra, S.; Verhalen, B.; Stein, R.A.; Wen, P.-C.; Tajkhorshid, E.; McHaourab, H.S. Conformational dynamics of the nucleotide binding domains and the power stroke of a heterodimeric ABC transporter. eLife 2014, 3, e02740. [Google Scholar] [CrossRef] [PubMed]
- Nöll, A.; Thomas, C.; Herbring, V.; Zollmann, T.; Barth, K.; Mehdipour, A.R.; Tomasiak, T.M.; Brüchert, S.; Joseph, B.; Abele, R.; et al. Crystal structure and mechanistic basis of a functional homolog of the antigen transporter TAP. Proc. Natl. Acad. Sci. USA 2017, 114, E438–E447. [Google Scholar] [CrossRef] [PubMed]
- Mittal, A.; Böhm, S.; Grütter, M.G.; Bordignon, E.; Seeger, M.A. Asymmetry in the homodimeric ABC transporter MsbA recognized by a darpin. J. Biol. Chem. 2012, 287, 20395–20406. [Google Scholar] [CrossRef] [PubMed]
- Dong, J.; Yang, G.; Mchaourab, H.S. Structural basis of energy transduction in the transport cycle of MsbA. Science 2005, 308, 1023–1028. [Google Scholar] [CrossRef] [PubMed]
- Zou, P.; Bortolus, M.; McHaourab, H.S. Conformational cycle of the ABC transporter MsbA in liposomes: Detailed analysis using double electron–electron resonance spectroscopy. J. Mol. Biol. 2009, 393, 586–597. [Google Scholar] [CrossRef] [PubMed]
- Hohl, M.; Hürlimann, L.M.; Böhm, S.; Schöppe, J.; Grütter, M.G.; Bordignon, E.; Seeger, M.A. Structural basis for allosteric cross-talk between the asymmetric nucleotide binding sites of a heterodimeric ABC exporter. Proc. Natl. Acad. Sci. USA 2014, 111, 11025–11030. [Google Scholar] [CrossRef] [PubMed]
- Timachi, M.H.; Hutter, C.A.J.; Hohl, M.; Assafa, T.; Böhm, S.; Mittal, A.; Seeger, M.A.; Bordignon, E. Exploring conformational equilibria of a heterodimeric ABC transporter. eLife 2017, 6, e20236. [Google Scholar] [CrossRef] [PubMed]
- Wen, P.-C.; Verhalen, B.; Wilkens, S.; Mchaourab, H.S.; Tajkhorshid, E. On the origin of large flexibility of P-glycoprotein in the inward-facing state. J. Biol. Chem. 2013, 288, 19211–19220. [Google Scholar] [CrossRef] [PubMed]
- Van Wonderen, J.H.; McMahon, R.M.; O’Mara, M.L.; McDevitt, C.A.; Thomson, A.J.; Kerr, I.D.; MacMillan, F.; Callaghan, R. The central cavity of ABCB1 undergoes alternating access during ATP hydrolysis. FEBS J. 2014, 281, 2190–2201. [Google Scholar] [CrossRef] [PubMed]
- Herget, M.; Baldauf, C.; Schölz, C.; Parcej, D.; Wiesmüller, K.-H.; Tampé, R.; Abele, R.; Bordignon, E. Conformation of peptides bound to the transporter associated with antigen processing (TAP). Proc. Natl. Acad. Sci. USA 2011, 108, 1349–1354. [Google Scholar] [CrossRef] [PubMed]
- Hellmich, U.A.; Lyubenova, S.; Kaltenborn, E.; Doshi, R.; van Veen, H.W.; Prisner, T.F.; Glaubitz, C. Probing the ATP hydrolysis cycle of the ABC multidrug transporter LmrA by pulsed EPR spectroscopy. J. Am. Chem. Soc. 2012, 134, 5857–5862. [Google Scholar] [CrossRef] [PubMed]
- Borbat, P.P.; Surendhran, K.; Bortolus, M.; Zou, P.; Freed, J.H.; McHaourab, H.S. Conformational motion of the ABCc transporter MsbA induced by ATP hydrolysis. PLoS Biol. 2007, 5, e271. [Google Scholar] [CrossRef] [PubMed]
- George, A.M.; Jones, P.M. Perspectives on the structure–function of ABCc transporters: The switch and constant contact models. Prog. Biophys. Mol. Biol. 2012, 109, 95–107. [Google Scholar] [CrossRef] [PubMed]
- Higgins, C.F.; Linton, K.J. The ATP switch model for ABC transporters. Nat. Struct. Mol. Biol. 2004, 11, 918–926. [Google Scholar] [CrossRef] [PubMed]
- Shintre, C.A.; Pike, A.C.; Li, Q.; Kim, J.-I.; Barr, A.J.; Goubin, S.; Shrestha, L.; Yang, J.; Berridge, G.; Ross, J. Structures of ABCB10, a human ATP-binding cassette transporter in apo-and nucleotide-bound states. Proc. Natl. Acad. Sci. USA 2013, 110, 9710–9715. [Google Scholar] [CrossRef] [PubMed]
- Ward, A.; Reyes, C.L.; Yu, J.; Roth, C.B.; Chang, G. Flexibility in the ABC transporter MsbA: Alternating access with a twist. Proc. Natl. Acad. Sci. USA 2007, 104, 19005–19010. [Google Scholar] [CrossRef] [PubMed]
- Lee, J.Y.; Yang, J.G.; Zhitnitsky, D.; Lewinson, O.; Rees, D.C. Structural basis for heavy metal detoxification by an ATM1-type ABC exporter. Science 2014, 343, 1133–1136. [Google Scholar] [CrossRef] [PubMed]
- Dawson, R.J.P.; Locher, K.P. Structure of a bacterial multidrug ABC transporter. Nature 2006, 443, 180–185. [Google Scholar] [CrossRef] [PubMed]
- Choudhury, H.G.; Tong, Z.; Mathavan, I.; Li, Y.; Iwata, S.; Zirah, S.; Rebuffat, S.; van Veen, H.W.; Beis, K. Structure of an antibacterial peptide ATP-binding cassette transporter in a novel outward occluded state. Proc. Natl. Acad. Sci. USA 2014, 111, 9145–9150. [Google Scholar] [CrossRef] [PubMed]
- Sauna, Z.E.; Ambudkar, S.V. Characterization of the catalytic cycle of atp hydrolysis by human P-glycoprotein: The two ATP hydrolysis events in a single catalytic cycle are kinetically similar but affect different functional outcomes. J. Biol. Chem. 2001, 276, 11653–11661. [Google Scholar] [CrossRef] [PubMed]
- Sauna, Z.E.; Ambudkar, S.V. About a switch: How P-glycoprotein (ABCB1) harnesses the energy of ATP binding and hydrolysis to do mechanical work. Mol. Cancer Ther. 2007, 6, 13–23. [Google Scholar] [CrossRef] [PubMed]
- Basso, C.; Vergani, P.; Nairn, A.C.; Gadsby, D.C. Prolonged nonhydrolytic interaction of nucleotide with CFTR’s NH2-terminal nucleotide binding domain and its role in channel gating. J. Gen. Physiol. 2003, 122, 333–348. [Google Scholar] [CrossRef] [PubMed]
- Tsai, M.-F.; Li, M.; Hwang, T.-C. Stable ATP binding mediated by a partial NBD dimer of the CFTR chloride channel. J. Gen. Physiol. 2010, 135, 399–414. [Google Scholar] [CrossRef] [PubMed]
- Hohl, M.; Briand, C.; Grütter, M.G.; Seeger, M.A. Crystal structure of a heterodimeric ABC transporter in its inward-facing conformation. Nat. Struct. Mol. Biol. 2012, 19, 395–402. [Google Scholar] [CrossRef] [PubMed]
- Forrest, L.R.; Krämer, R.; Ziegler, C. The structural basis of secondary active transport mechanisms. Biochim. Biophys. Acta Bioenerg. 2011, 1807, 167–188. [Google Scholar] [CrossRef] [PubMed]
- Masureel, M.; Martens, C.; Stein, R.A.; Mishra, S.; Ruysschaert, J.-M.; McHaourab, H.S.; Govaerts, C. Protonation drives the conformational switch in the multidrug transporter LmrP. Nat. Chem. Biol. 2014, 10, 149–155. [Google Scholar] [CrossRef] [PubMed]
- Martens, C.; Stein, R.A.; Masureel, M.; Roth, A.; Mishra, S.; Dawaliby, R.; Konijnenberg, A.; Sobott, F.; Govaerts, C.; Mchaourab, H.S. Lipids modulate the conformational dynamics of a secondary multidrug transporter. Nat. Struct. Mol. Biol. 2016, 23, 744–751. [Google Scholar] [CrossRef] [PubMed]
- Claxton, D.P.; Quick, M.; Shi, L.; de Carvalho, F.D.; Weinstein, H.; Javitch, J.A.; McHaourab, H.S. Ion/substrate-dependent conformational dynamics of a bacterial homolog of neurotransmitter:Sodium symporters. Nat. Struct. Mol. Biol. 2010, 17, 822–829. [Google Scholar] [CrossRef] [PubMed]
- Kazmier, K.; Sharma, S.; Quick, M.; Islam, S.M.; Roux, B.; Weinstein, H.; Javitch, J.A.; McHaourab, H.S. Conformational dynamics of ligand-dependent alternating access in LeuT. Nat. Struct. Mol. Biol. 2014, 21, 472–479. [Google Scholar] [CrossRef] [PubMed]
- Kazmier, K.; Sharma, S.; Islam, S.M.; Roux, B.; Mchaourab, H.S. Conformational cycle and ion-coupling mechanism of the Na+/Hydantoin transporter Mhp1. Proc. Natl. Acad. Sci. USA 2014, 111, 14752–14757. [Google Scholar] [CrossRef] [PubMed]
- Bracher, S.; Schmidt, C.C.; Dittmer, S.I.; Jung, H. Core transmembrane domain 6 plays a pivotal role in the transport cycle of the sodium/proline symporter PutP. J. Biol. Chem. 2016, 291, 26208–26215. [Google Scholar] [CrossRef] [PubMed]
- Raba, M.; Dunkel, S.; Hilger, D.; Lipiszko, K.; Polyhach, Y.; Jeschke, G.; Bracher, S.; Klare, J.P.; Quick, M.; Jung, H.; et al. Extracellular loop 4 of the proline transporter PutP controls the periplasmic entrance to ligand binding sites. Structure 2014, 22, 769–780. [Google Scholar] [CrossRef] [PubMed]
- Hilger, D.; Polyhach, Y.; Jung, H.; Jeschke, G. Backbone structure of transmembrane domain IX of the Na+/proline transporter PutP of Escherichia coli. Biophys. J. 2009, 96, 217–225. [Google Scholar] [CrossRef] [PubMed]
- Hilger, D.; Polyhach, Y.; Padan, E.; Jung, H.; Jeschke, G. High-resolution structure of a Na+/H+ antiporter dimer obtained by pulsed electron paramagnetic resonance distance measurements. Biophys. J. 2007, 93, 3675–3683. [Google Scholar] [CrossRef] [PubMed]
- Dastvan, R.; Fischer, A.W.; Mishra, S.; Meiler, J.; Mchaourab, H.S. Protonation-dependent conformational dynamics of the multidrug transporter EmrE. Proc. Natl. Acad. Sci. USA 2016, 113, 1220–1225. [Google Scholar] [CrossRef] [PubMed]
- Khantwal, C.M.; Abraham, S.J.; Han, W.; Jiang, T.; Chavan, T.S.; Cheng, R.C.; Elvington, S.M.; Liu, C.W.; Mathews, I.I.; Stein, R.A.; et al. Revealing an outward-facing open conformational state in a CLC Cl−/H+ exchange transporter. eLife 2016, 5, e11189. [Google Scholar] [CrossRef] [PubMed]
- Hänelt, I.; Wunnicke, D.; Bordignon, E.; Steinhoff, H.-J.; Slotboom, D.J. Conformational heterogeneity of the aspartate transporter GltPh. Nat. Struct. Mol. Biol. 2013, 20, 210–214. [Google Scholar] [CrossRef] [PubMed]
- Georgieva, E.R.; Borbat, P.P.; Ginter, C.; Freed, J.H.; Boudker, O. Conformational ensemble of the sodium-coupled aspartate transporter. Nat. Struct. Mol. Biol. 2013, 20, 215–221. [Google Scholar] [CrossRef] [PubMed]
- Yi, J.-H.; Hazell, A.S. Excitotoxic mechanisms and the role of astrocytic glutamate transporters in traumatic brain injury. Neurochem. Int. 2006, 48, 394–403. [Google Scholar] [CrossRef] [PubMed]
- Fontana, A.C.K. Current approaches to enhance glutamate transporter function and expression. J. Neurochem. 2015, 134, 982–1007. [Google Scholar] [CrossRef] [PubMed]
- Danbolt, N.C. Glutamate uptake. Prog. Neurobiol. 2001, 65, 1–105. [Google Scholar] [CrossRef]
- Teichman, S.; Qu, S.; Kanner, B.I. The equivalent of a thallium binding residue from an archeal homolog controls cation interactions in brain glutamate transporters. Proc. Natl. Acad. Sci. USA 2009, 106, 14297–14302. [Google Scholar] [CrossRef] [PubMed]
- Groeneveld, M.; Slotboom, D.J. Na+: Aspartate coupling stoichiometry in the glutamate transporter homologue Glt(Ph). Biochemistry 2010, 49, 3511–3513. [Google Scholar] [CrossRef] [PubMed]
- Zerangue, N.; Kavanaugh, M.P. Flux coupling in a neuronal glutamate transporter. Nature 1996, 383, 634–637. [Google Scholar] [CrossRef] [PubMed]
- Raunser, S. Structure and function of prokaryotic glutamate transporters from Escherichia coli and Pyrococcus horikoshii. Biochemistry 2006, 45, 12796–12805. [Google Scholar] [CrossRef] [PubMed]
- Reyes, N.; Ginter, C.; Boudker, O. Transport mechanism of a bacterial homologue of glutamate transporters. Nature 2009, 462, 880–885. [Google Scholar] [CrossRef] [PubMed]
- Groeneveld, M.; Slotboom, D.J. Rigidity of the subunit interfaces of the trimeric glutamate transporter GltT during translocation. J. Mol. Biol. 2007, 372, 565–570. [Google Scholar] [CrossRef] [PubMed]
- Verdon, G.; Boudker, O. Crystal structure of an asymmetric trimer of a bacterial glutamate transporter homolog. Nat. Struct. Mol. Biol. 2012, 19, 355–357. [Google Scholar] [CrossRef] [PubMed]
- Boudker, O.; Ryan, R.M.; Yernool, D.; Shimamoto, K.; Gouaux, E. Coupling substrate and ion binding to extracellular gate of a sodium-dependent aspartate transporter. Nature 2007, 445, 387–393. [Google Scholar] [CrossRef] [PubMed]
- Yernool, D.; Boudker, O.; Jin, Y.; Gouaux, E. Structure of a glutamate transporter homologue from Pyrococcus horikoshii. Nature 2004, 431, 811–818. [Google Scholar] [CrossRef] [PubMed]
- Focke, P.J.; Moenne-Loccoz, P.; Larsson, H.P. Opposite movement of the external gate of a glutamate transporter homolog upon binding cotransported sodium compared with substrate. J. Neurosci. 2011, 31, 6255–6262. [Google Scholar] [CrossRef] [PubMed]
- Singer, S.; Nicolson, G.L. The fluid mosaic model of the structure of cell membranes. Science 1972, 175, 720–731. [Google Scholar] [CrossRef] [PubMed]
- Von Heijne, G. The distribution of positively charged residues in bacterial inner membrane proteins correlates with the trans-membrane topology. EMBO J. 1986, 5, 3021. [Google Scholar]
- Phillips, R.; Ursell, T.; Wiggins, P.; Sens, P. Emerging roles for lipids in shaping membrane-protein function. Nature 2009, 459, 379–385. [Google Scholar] [CrossRef] [PubMed]
- Spector, A.A.; Yorek, M.A. Membrane lipid composition and cellular function. J. Lipid Res. 1985, 26, 1015–1035. [Google Scholar] [PubMed]
- Lee, A.G. How lipids affect the activities of integral membrane proteins. Biochim. Biophys. Acta Biomembr. 2004, 1666, 62–87. [Google Scholar] [CrossRef] [PubMed]
- Alvarez, F.J.D.; Orelle, C.; Davidson, A.L. Functional reconstitution of an ABC transporter in nanodiscs for use in electron paramagnetic resonance spectroscopy. J. Am. Chem. Soc. 2010, 132, 9513–9515. [Google Scholar] [CrossRef] [PubMed]
- Bayburt, T.H.; Sligar, S.G. Membrane protein assembly into nanodiscs. FEBS Lett. 2010, 584, 1721–1727. [Google Scholar] [CrossRef] [PubMed]
- Davidson, W.S.; Hilliard, G.M. The spatial organization of apolipoprotein AI on the edge of discoidal high density lipoprotein particles a mass spectrometry study. J. Biol. Chem. 2003, 278, 27199–27207. [Google Scholar] [CrossRef] [PubMed]
- Gorshkova, I.N.; Liu, T.; Kan, H.-Y.; Chroni, A.; Zannis, V.I.; Atkinson, D. Structure and stability of apolipoprotein AI in solution and in discoidal high-density lipoprotein probed by double charge ablation and deletion mutation. Biochemistry 2006, 45, 1242–1254. [Google Scholar] [CrossRef] [PubMed]
- Boldog, T.; Grimme, S.; Li, M.; Sligar, S.G.; Hazelbauer, G.L. Nanodiscs separate chemoreceptor oligomeric states and reveal their signaling properties. Proc. Natl. Acad. Sci. USA 2006, 103, 11509–11514. [Google Scholar] [CrossRef] [PubMed]
- Whorton, M.R.; Bokoch, M.P.; Rasmussen, S.G.; Huang, B.; Zare, R.N.; Kobilka, B.; Sunahara, R.K. A monomeric G protein-coupled receptor isolated in a high-density lipoprotein particle efficiently activates its G protein. Proc. Natl. Acad. Sci. USA 2007, 104, 7682–7687. [Google Scholar] [CrossRef] [PubMed]
- Joseph, B.; Sikora, A.; Bordignon, E.; Jeschke, G.; Cafiso, D.S.; Prisner, T.F. Distance measurement on an endogenous membrane transporter in E. Coli cells and native membranes using EPR spectroscopy. Angew. Chem. Int. Ed. 2015, 54, 6196–6199. [Google Scholar] [CrossRef] [PubMed]
- Joseph, B.; Tormyshev, V.M.; Rogozhnikova, O.Y.; Akhmetzyanov, D.; Bagryanskaya, E.G.; Prisner, T.F. Selective high-resolution detection of membrane protein–ligand interaction in native membranes using trityl–nitroxide peldor. Angew. Chem. Int. Ed. 2016, 55, 11538–11542. [Google Scholar] [CrossRef] [PubMed]
- Chimento, D.P.; Mohanty, A.K.; Kadner, R.J.; Wiener, M.C. Substrate-induced transmembrane signaling in the cobalamin transporter BtuB. Nat. Struct. Mol. Biol. 2003, 10, 394–401. [Google Scholar] [CrossRef] [PubMed]
- Shultis, D.D.; Purdy, M.D.; Banchs, C.N.; Wiener, M.C. Outer membrane active transport: Structure of the BtuB:Tonb complex. Science 2006, 312, 1396–1399. [Google Scholar] [CrossRef] [PubMed]
- Jiang, X.; Payne, M.A.; Cao, Z.; Foster, S.B.; Feix, J.B.; Newton, S.M.C.; Klebba, P.E. Ligand-specific opening of a gated-porin channel in the outer membrane of living bacteria. Science 1997, 276, 1261–1264. [Google Scholar] [CrossRef] [PubMed]
- Merianos, H.J.; Cadieux, N.; Lin, C.H.; Kadner, R.J.; Cafiso, D.S. Substrate-induced exposure of an energy-coupling motif of a membrane transporter. Nat. Struct. Mol. Biol. 2000, 7, 205–209. [Google Scholar]
- Agard, N.J.; Prescher, J.A.; Bertozzi, C.R. A strain-promoted [3 + 2] azide–alkyne cycloaddition for covalent modification of biomolecules in living systems. J. Am. Chem. Soc. 2004, 126, 15046–15047. [Google Scholar] [CrossRef] [PubMed]
- Kucher, S.; Korneev, S.; Tyagi, S.; Apfelbaum, R.; Grohmann, D.; Lemke, E.A.; Klare, J.P.; Steinhoff, H.-J.; Klose, D. Orthogonal spin labeling using click chemistry for in vitro and in vivo applications. J. Magn. Reson. 2017, 275, 38–45. [Google Scholar] [CrossRef] [PubMed]
- Spindler, P.E.; Glaser, S.J.; Skinner, T.E.; Prisner, T.F. Broadband inversion peldor spectroscopy with partially adiabatic shaped pulses. Angew. Chem. Int. Ed. 2013, 52, 3425–3429. [Google Scholar] [CrossRef] [PubMed]
- Spindler, P.E.; Waclawska, I.; Endeward, B.; Plackmeyer, J.; Ziegler, C.; Prisner, T.F. Carr–purcell pulsed electron double resonance with shaped inversion pulses. J. Phys. Chem. Lett. 2015, 6, 4331–4335. [Google Scholar] [CrossRef] [PubMed]
Figure 1.
Overview of the cw EPR methods at room temperature. (A) Representative cw EPR spectra at room temperature for unbound spin label and spin label with minor interaction (*) and strong interaction (#) with the local environment; (B) Cartoon representation of KtrB (PDB 4J7C) embedded in the membrane bilayer with the indicated paramagnetic quenchers (oxygen, NiEDDA and CrOx) and potential rotamers of the spin label side chain located in the loop region (*) and buried in the protein (#).

Figure 2.
Overview of the cw EPR methods at low temperature (T = 160 K). Schematic representation of the spin label N-O bond in a polar (A) and a non-polar environment (B). The oxygen 2s, 2px and 2py orbitals superimpose to the non-bonding lone pair orbitals ψn. (A) The external electric field component Ex is caused by the polar micro-environment which shift the π-electron density along the N-O bond towards the N-atom represented by increased orbitals; (B) In a non-polar environment the π-electron density is shifted towards the O-atom; (C) Simulated low temperature (T = 160 K) cw EPR powder spectra corresponding to interspin distances of 1.3 nm (black line), 1.5 nm (red line), 1.8 nm (green line) and 2.0 nm (blue line), respectively. Spectra are obtained by using DipFit [31] with equal g- and A-tensor elements and variable interspin distances. Twice the hyperfine coupling (2Azz) is indicated. All plots are normalized by spin number.
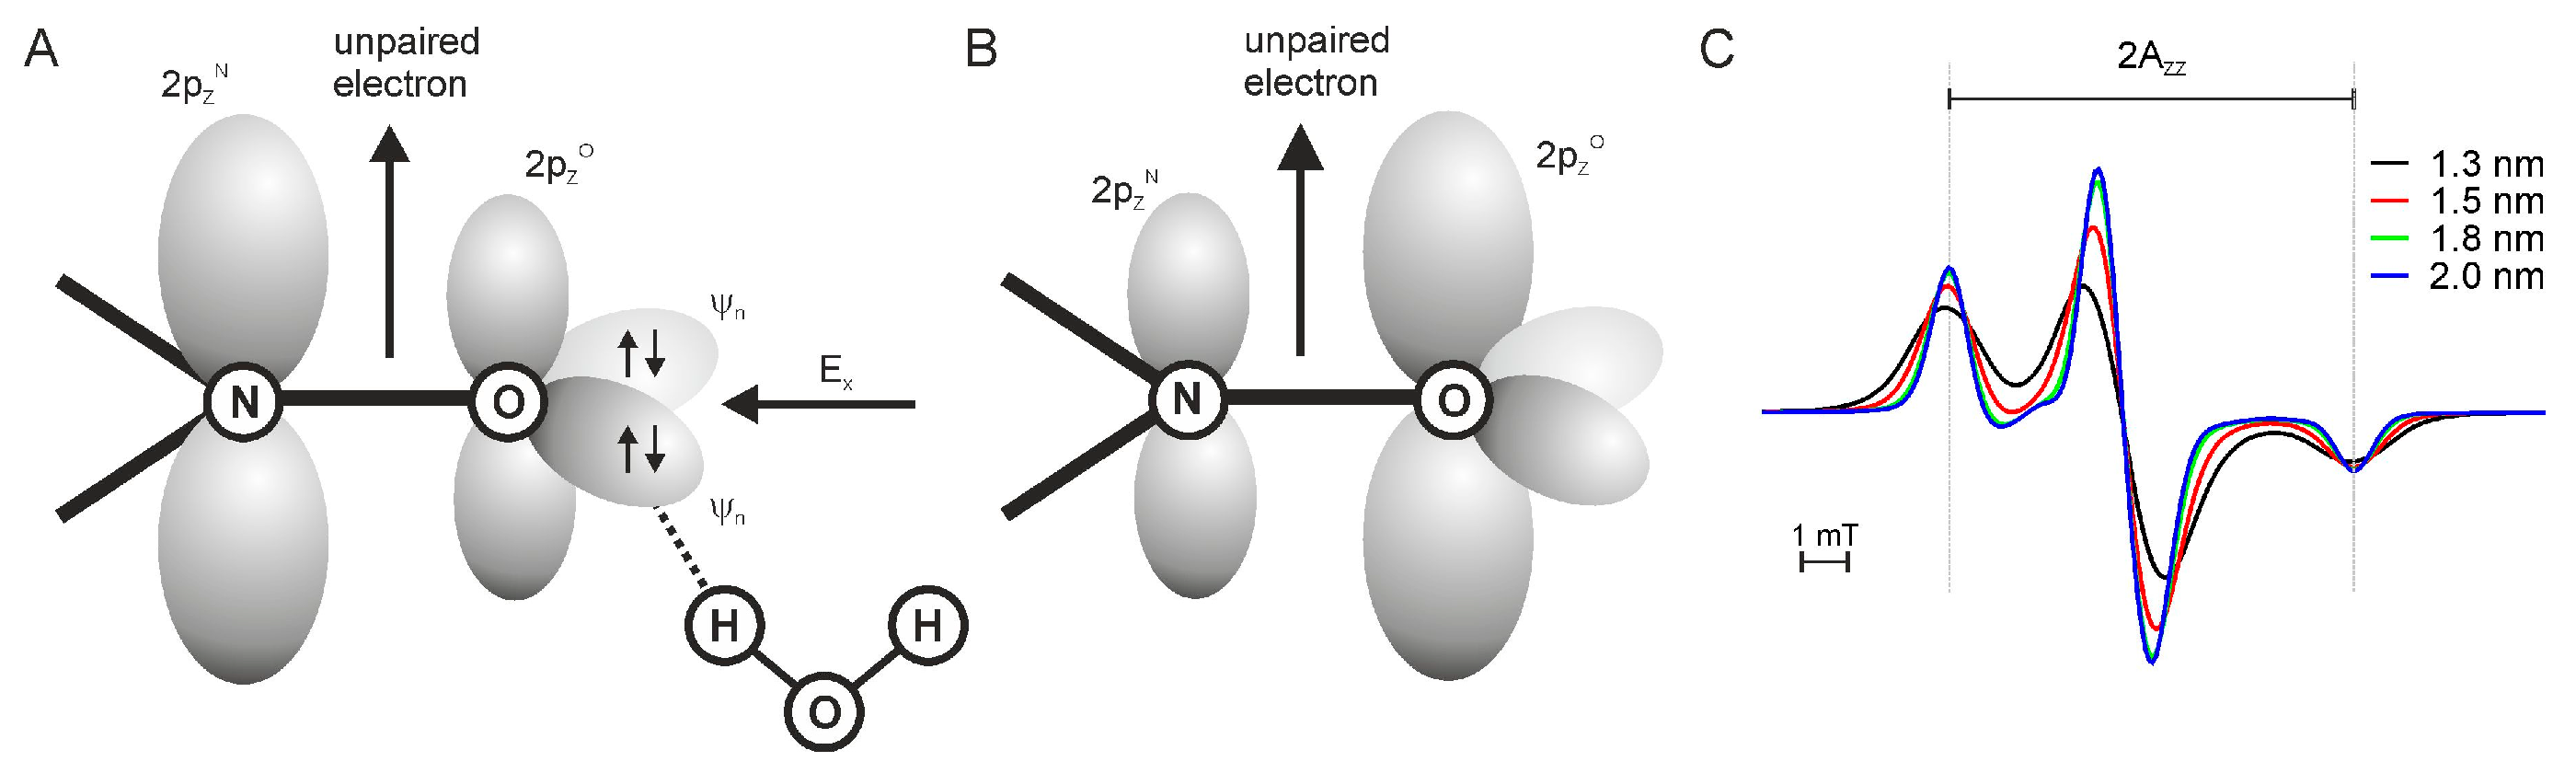
Figure 3.
Overview of the pulsed EPR method at low temperature. (A) The π/2 pulse and π pulse with a time delay of τ1 at the observer frequency νobs generates a spin echo after time delay τ1. The third π-pulse after 2τ1 + τ2 results in the refocused and monitored echo signal at 2τ1 + 2τ2. The π-pulse at the pump frequency νpump selectively excites spin fraction B causing a resonance frequency shift of dipolar coupled spin fraction A; (B) Low temperature (T = 50 K) pulsed EPR spectrum recorded at X-band with indicated background (grey, dotted line) (C) background corrected dipolar evolution data F(t); (D) Distance distributions P(r) obtained by Tikhonov regularization as utilized in the program DeerAnalysis [43].

Figure 4.
Model of the proposed compact HAMP conformation and accessibilities of spin-labeled NpHtrII mutants in complex with NpSRII reconstituted in purple membrane lipids (PML). (A) Model of the proposed compact HAMP (cHAMP) conformation based on the NMR structure of the Af1503 HAMP domain (PDB 2ASW) and the crystal structure of the NpHtrII/NpSRII transmembrane domain (PDB 1H2S). Investigated region of the HAMP domain are shown in grey; (B) Heisenberg exchange rates for oxygen (21%) of the spin-labeled NpHtrII157 mutants in complex with NpSRII reconstituted in PML versus residue numbers. Measurements have been performed at low (150 mM KCl, black/grey) and high (3.5 M KCl, dark/light green) salt concentrations at room temperature for 40-fold molar excess (squares) and 400-fold molar excess (circles) lipid content; (C) Heisenberg exchange rates for NiEDDA at low (150 mM KCl, black/grey) and high (3.5 M KCl, dark/light green) salt concentrations versus residue numbers. At low salt concentrations Heisenberg exchange rates were determined with 20 mM NiEDDA (closed squares) and with 3 mM NiEDDA (open squares), whereas all exchange rates were normalized to 20mM. Adapted from [62].

Figure 5.
Structural rearrangements at the domain interface in the ELIC-GLIC chimera. (A) Overlays of apo-ELIC (PDB 3RQU) and ELIC-GABA-flurazepam (PDB 4A96) with spin positions indicated and spin-normalized room temperature cw EPR spectra of interface domain residues L29R1 (β1-β2 loop), V82R1 (β4-β5 loop), M114R1, F116R1 (β6-β7 loop), and N184R1 (β6-β7 loop) in the apo state (black spectra), in the presence of 20 mM 3-AP (orange spectra), or at pH 3.0 (green spectra); (B) Overlay of GLIC structures in the closed (PDB 4NPQ, yellow) and open conformation (PDB 4HFI, green) with spin-labeled positions indicated and cw EPR spectra of K255R1 (M2-M3 linker) and F322R1 (M4) in the apo state (black spectra), in the presence of 20 mM 3-AP (orange spectra), and at pH 3.0 (green spectra). Taken from [95].

Figure 6.
Labeling sites and experimental results of the EPR study on the ABC exporter TM287/288. (A) Schematic of spin-labeled sites in the extracellular, intracellular and NBD regions of TM287/288 in (left) the inward-facing apo crystal structure (PDB 4Q4H) and in (right) the outward-facing homology model based on the Sav1866 crystal structure (PDB 2HYD); (B,C) Background-corrected DEER traces, detected at 50 K and corresponding two-Gaussian fit DEER analysis of three selected spin-labeled pairs of TM287/288 representing the extracellular region (50TM287/271TM288), intracellular region (131TM288/248TM288) and the NBDs (460TM287/363TM288) in the wildtype transporter (B) and the E-to-Q mutant (C); (D,E) Nucleotide ranking according to the ability to populate the OF conformation. The same three spin labeled pairs of TM287/288 as in (B,C) are used for the analysis of the IF/OF populations in the wildtype transporter (D) and the E-to-Q mutant (E). The percentage of the OF population is calculated using the relative area under the model-based two Gaussian distance distribution performed using DeerAnalysis2015. The purple squares with error bars show the average ability of each nucleotide to stabilize the conformational switch. Adapted from [119].
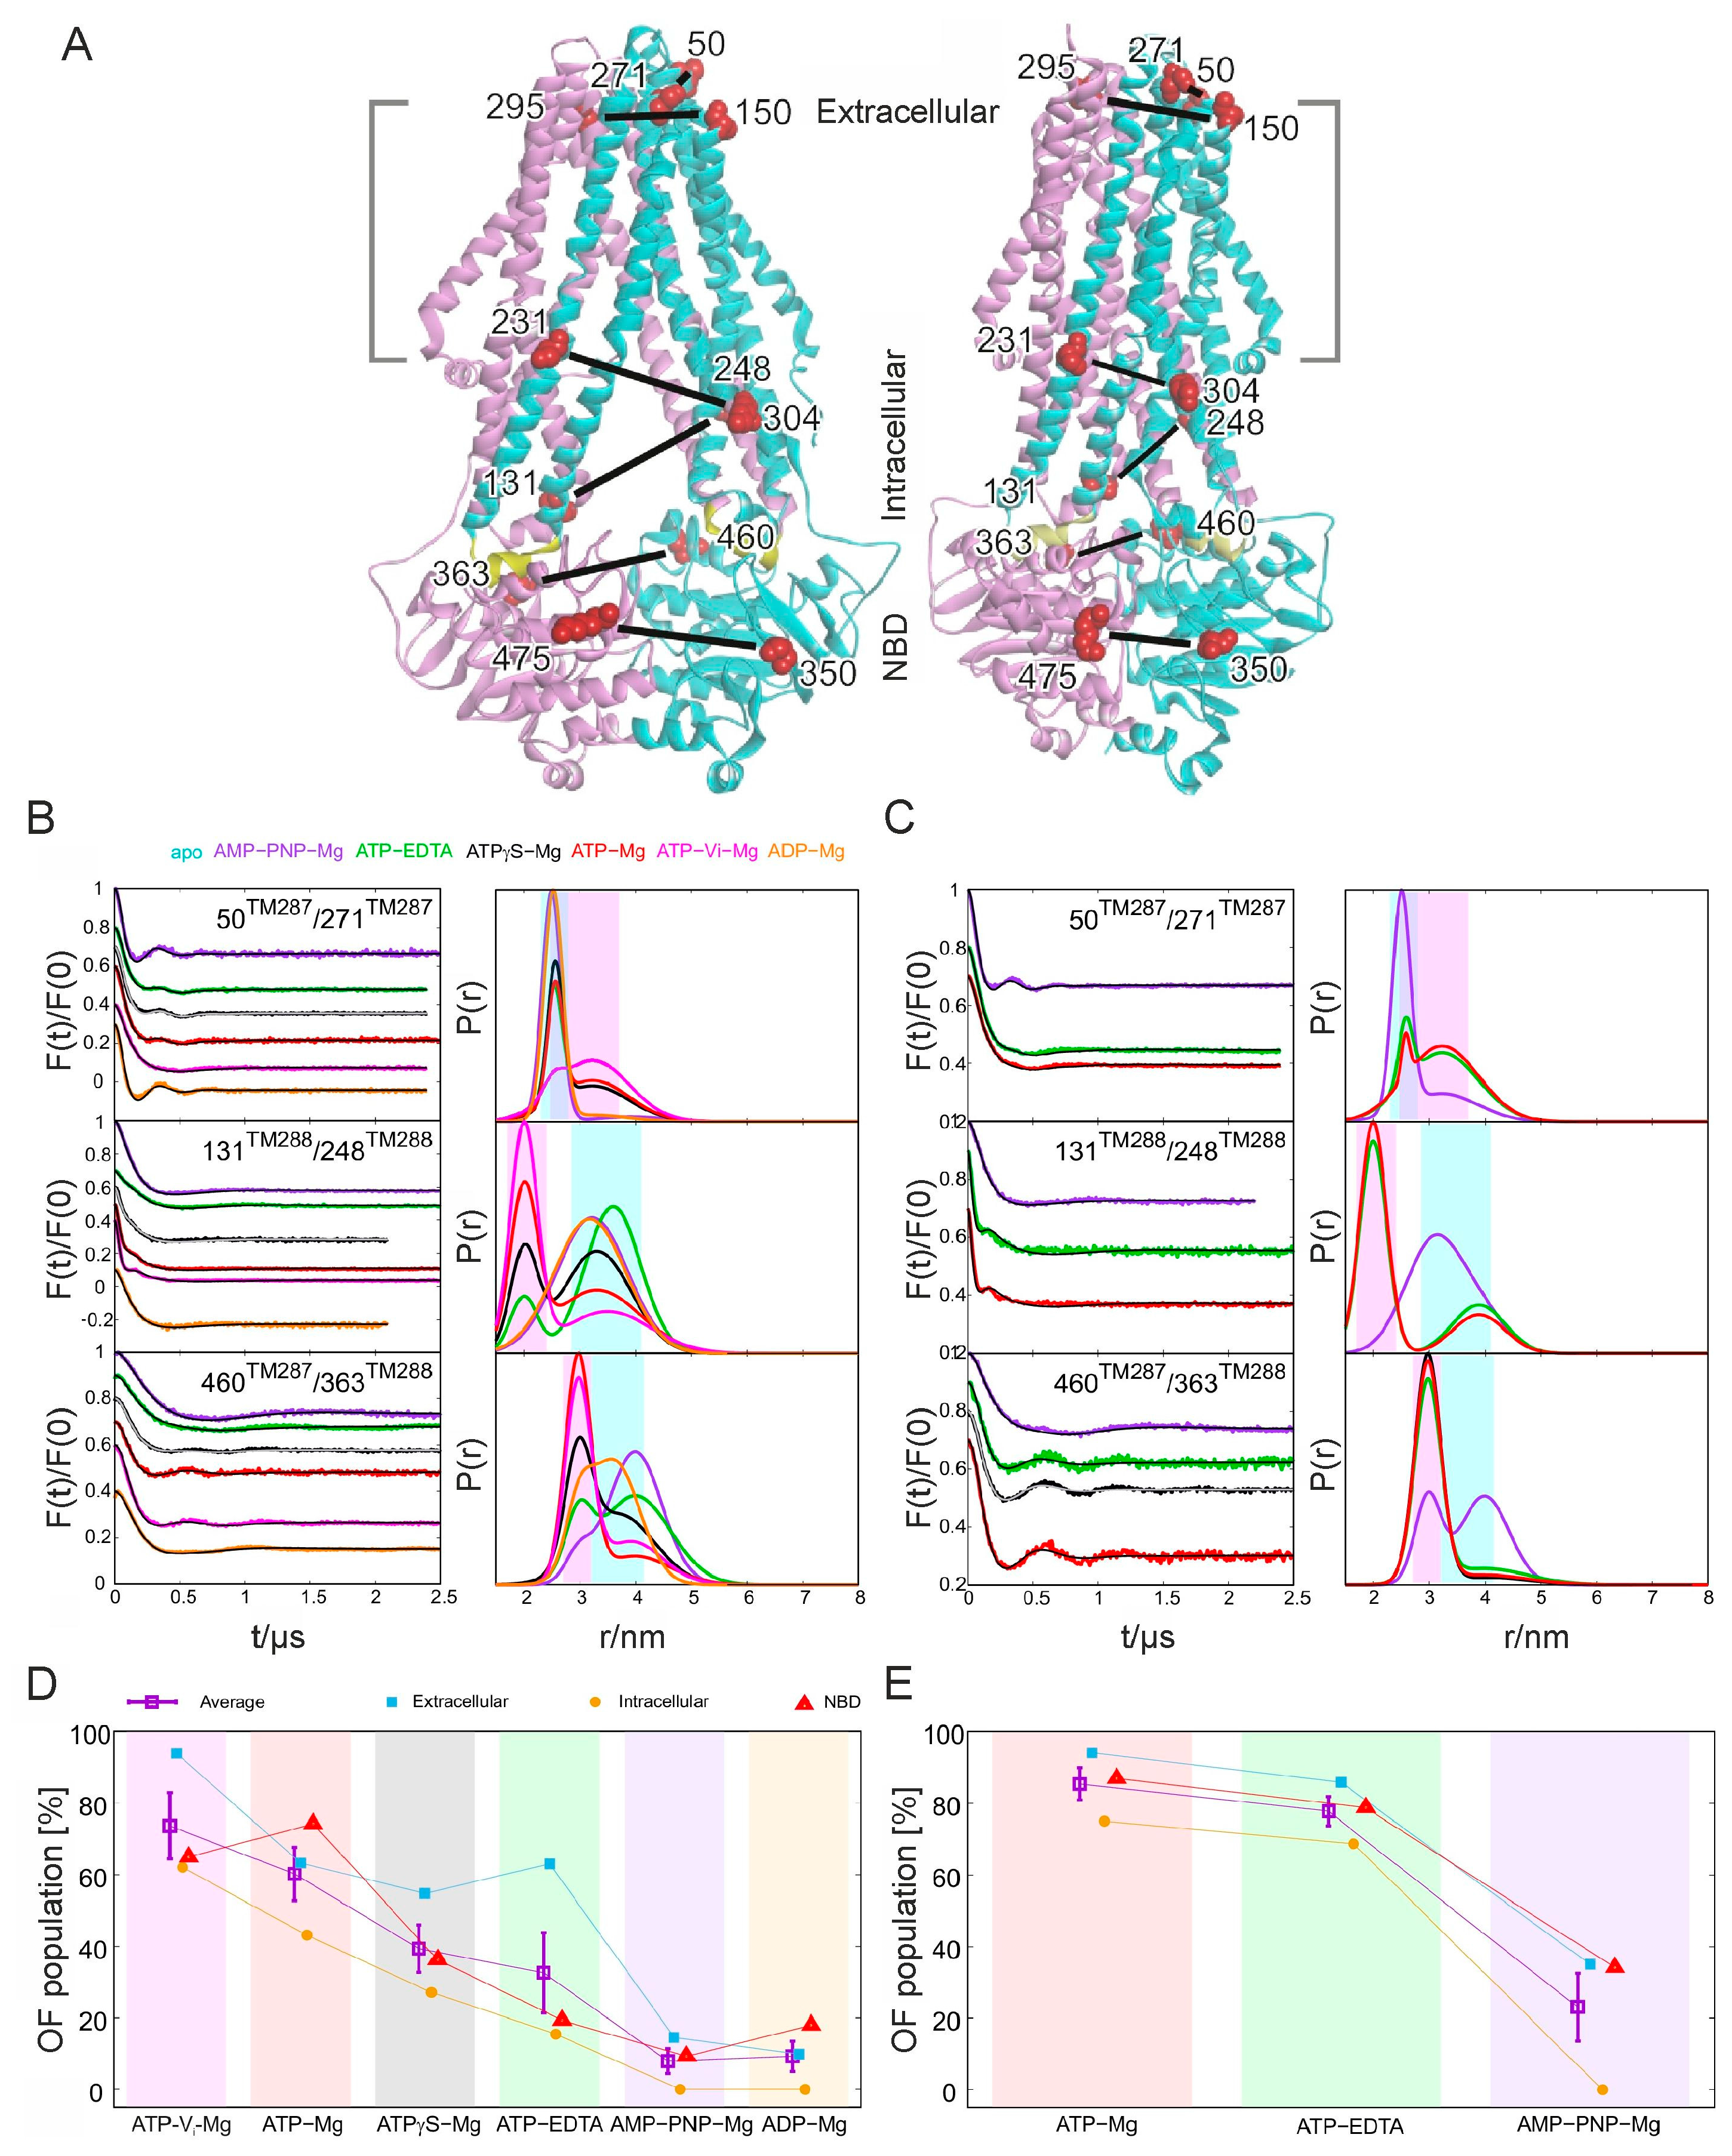
Figure 7.
Labeling sites and experimental results of the EPR study on the aspartate transporter GltPh. (A) Ribbon diagrams of GltPh trimers as viewed from the cytoplasm (top) and GltPh protomers as viewed from the membrane plane (bottom). TM, transmembrane segment. Black lines indicate the position of the plasma membrane. Transporting domains are shown in the outward-facing orientation (2NWL) (left) and in the inward-facing orientation (3KBC) (right). The residues used for cysteine mutagenesis and spin labeling are color-coded: purple, Thr166; orange, Val176; blue, Ser300; yellow, Ser331; red, Ala364; cyan, Lys55; (B) Normalized background-corrected dipolar evolution data F(t); tick marks are separated by 0.1 (left) and distance distributions obtained by Tikhonov regularization and by a rotamer library analysis of the inward-facing (i, dotted lines) and outward-facing (o, dashed lines) crystal structures (right). DEER data of GltPh variants recorded at X band (9.4 GHz and 50 K; for mutant V176R1) or Q band (34 GHz and 50 K; for mutant S331R1) in detergent solution (top) and reconstituted in liposomes (bottom). Data are shown for the apo protein (black lines) and for the protein in the presence of Na+ (NaCl; red lines) or Na+ and aspartate (NaCl, Asp; blue lines); (C) Low-temperature (T = 160 K) cw EPR spectra measured for the detergent-solubilized (top) or membrane-reconstituted (bottom) GltPh variant K55R1A364R1. Adapted from [149].

© 2017 by the authors. Licensee MDPI, Basel, Switzerland. This article is an open access article distributed under the terms and conditions of the Creative Commons Attribution (CC BY) license (http://creativecommons.org/licenses/by/4.0/).
Share and Cite
MDPI and ACS Style
Wunnicke, D.; Hänelt, I. The Synergetic Effects of Combining Structural Biology and EPR Spectroscopy on Membrane Proteins. Crystals 2017, 7, 117. https://doi.org/10.3390/cryst7040117
AMA Style
Wunnicke D, Hänelt I. The Synergetic Effects of Combining Structural Biology and EPR Spectroscopy on Membrane Proteins. Crystals. 2017; 7(4):117. https://doi.org/10.3390/cryst7040117
Chicago/Turabian StyleWunnicke, Dorith, and Inga Hänelt. 2017. "The Synergetic Effects of Combining Structural Biology and EPR Spectroscopy on Membrane Proteins" Crystals 7, no. 4: 117. https://doi.org/10.3390/cryst7040117
Note that from the first issue of 2016, this journal uses article numbers instead of page numbers. See further details here.