Enhanced Framework Rigidity of a Zeolitic Metal-Azolate via Ligand Substitution
by
Hongqiang Gao
1, 
Wenjuan Wei
2,
Liyuan Dong
2,
Guoqiang Feng
3,*,
Xingxing Jiang
4,*,
Rong Wu
1,*,
Zheshuai Lin
4 and
Wei Li
2 1
School of Physical Science and Technology, Xinjiang University, Urumqi 830046, China
2
School of Physics, Huazhong University of Science and Technology, Wuhan 430074, China
3
Department of Physics and Mechanical & Electrical Engineering, Hubei University of Education, Wuhan 430205, China
4
Technical Institute of Physics and Chemistry, Chinese Academy of Sciences, Beijing 100190, China
*
Authors to whom correspondence should be addressed.
Crystals 2017, 7(4), 99; https://doi.org/10.3390/cryst7040099
Submission received: 2 March 2017
/
Revised: 25 March 2017
/
Accepted: 27 March 2017
/
Published: 31 March 2017
(This article belongs to the Special Issue Selected Papers from "The Sixth Annual Conference of Chinese Crystallographic Society")
Abstract
:The elastic properties of a zeolitic metal-azolate framework, Zn(mtz)2 (MAF-7, mtz− = 3-methyl-1,2,4-triazolate), have been examined from the view point of the first principles calculations and experiments. Our results demonstrate that the three independent elastic constants of MAF-7 are about 5.0–73.3% higher than those of ZIF-8, though they are isomorphic. The electron-donating effect of the nitrogen atom at the 2-position in mtz- ring dominantly accounts for such a prominent difference. The detailed analysis of the full elastic tensors reveals that the volume moduli, shear moduli, and Poisson’s ratios of MAF-7 are about 3.4% to 20.1%, 3.2% to 20.6%, and −30.3% to 12.3% higher than those of ZIF-8. The underlying structural reasons were discussed to explain the anisotropic difference of those properties. Moreover, the conclusion deduced from first-principle calculations was also been verified by nanoindentation and high-pressure synchrotron X-ray diffraction measurements.
1. Introduction
Zeolitic metal-azolate frameworks (MAFs), a subclass of porous MOFs, have been attracting particular attention due to their potential application [1] superior to traditional zeolites in many fields, such as gas storage/separation [2,3,4], catalysis [5], sensing, and drug delivery [6,7]. In practical application, the zeolitic MAFs would experience several rounds of mechanical manufacturing processes. To maintain the intrinsic properties of zeolitic MAFs during the mechanical manufacturing processes, their fundamental mechanical properties should be fully understood and, therefore, the study about the mechanical property has become one of the hottest topics in the field of MAF study. Recently, much study has revealed that significant difference exists between zeolitic MAFs and zeolites in terms of mechanical robustness [8,9,10]. In 2009, Moggach et al. performed high pressure single-crystal X-ray diffraction studies on (ZIF), Zn(mim)2 (ZIF-8 [11], mim = 2-methylimidazolate), a zeolitic imidazolte framework, and discovered that the exertion of pressure can increase the accessible surface area and its absorption performance [12]. A follow-up high-pressure powder X-ray diffraction study reveals similar results and shows that the hydrostatic behavior of ZIF-8 also strongly depends on the size of different pressuretransmitting mediums [13]. Recently, Tan et al. reported a comprehensive nanoindentation study of ZIFs, and accordingly elaborate the structure-property relationship of its mechanical property [14]. In 2012, their another work reports the anomalously shear modulus of ZIF-8 one order lower than that of zodalite in magnitude [15].
Nevertheless, all these studies focused on zeolitic imidazolate frameworks (ZIFs), and up to now the mechanical property of zeolitic triazolate frameworks have not been investigated yet. In this work, we present a systematic study on the elastic properties of a zeolitic triazolate, Zn(mtz)2 (MAF-7 [16], mtz = 3-methyl-1,2,4-triazolate), which is isomorphous to ZIF-8. To examine the electronic difference in elastic properties between 2-methylimidazolate and 3-methyl-1,2,4-triazolate, we performed first-principles calculations to extract the full elastic tensors of the cubic MAF-7. Our density functional theory (DFT) results elucidated that, compared with ZIF-8, the trivial electron-donating effect strongly enhance the mechanical strength of MAF-7, especially in the ability to resist uniaxial and shear stresses. Moreover, the calculated result was also testified by nanoindentation and synchrotron high-pressure powder X-ray diffraction experiments.
2. Results and Discussion
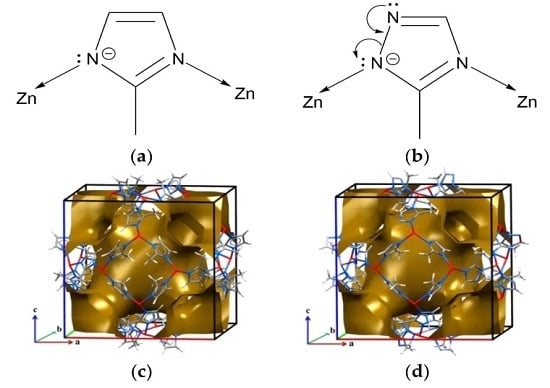
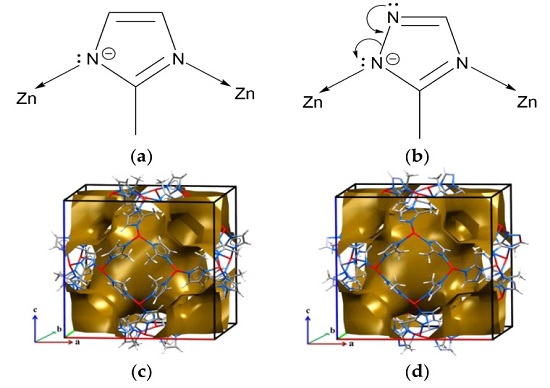
MAF-7 is isomorphous to ZIF-8 and crystallizes in the same cubic space group I-43m as reported by Zhang et al. [16]. In the structure, the Zn2+ ion is tetrahedrally coordinated with the triazolate ligand to form Zn(mtz)2 open framework with zeolitic sodalite (SOD) architecture. The mtz− ligand coordinates with the zinc ion via its N atoms on the 2- and 4-positions, and the N on the 1-position unbonded [16,17]. It should be emphasized the lone pair electrons of the unbonded nitrogen can donate electron to the adjacent N at the 2-position, and this effect pushes the lone pair electrons of the coordinated N to bonded with the zinc center more tightly (Figure 1). The experimentally-determined Zn-N bond length of MAF-7 (1.980(2) Å) is slightly shorter than that of ZIF-8(1.983(3) Å) at same temperature, confirming the stronger covalent interaction in the former than the latter [17].
The elastic properties of MAF-7 are listed in Table 1. Clearly, the calculated Cij’s satisfy the fundamental elastic stability criteria for a cubic crystal, i.e., C11 > |C12|, C11 + 2C12 > 0 and C44 > 0 [18,19]. It is observed that the three independent elastic constants C11, C12, and C44, which represent the stiffness of a cubic structure, are 5.0%, 15.8%, and 73.3% larger than those of ZIF-8, indicating the overall higher rigidity of MAF-7 than ZIF-8. The larger C12 and C44 values [20] of MAF-7 result in its significantly different elastic properties compared with ZIF-8 as we shall discuss below. To further understand the comprehensive elastic properties of MAF-7, we performed the full tensorial analysis of the elastic constants and extracted the key mechanical index (including anisotropic Young’s moduli (E), shear moduli (G), and Poisson’s ratios (ν), as listed in Table 1 and displayed in Figure 2, Figure 3 and Figure 4) [21]. We will discuss them in details in the following sections.
We first focus on Young’s modulus, which represents the stiffness with respect to uniaxial stress. The extracted E(100), E(110), and E(111) of MAF-7 are 2.828, 4.009, and 4.659 GPa, respectively. The representation 3D and 2D surfaces of E are shown in Figure 2a,b, which indicate that the Young’s modulus exhibit strong spatial anisotropy. It can be seen that E reaches the maximum along the <111> direction, the body diagonal perpendicular to the SOD six-membered ring. The E surfaces exhibit subsidences along the cubic axes normal to the SOD four-membered ring, implying that the MAF-7 is mostly mechanical compliant along the <100> direction. It is notable that the directions of Emax and Emin of MAF-7 are reverse to those of ZIF-8. In an arbitrary direction [hkl], Young’s modulus of a cubic system is given in terms of Sij, {E[hkl]}−1 = S11 − (2S11 − 2S12 − S44)N4, where N4 = n12n22 + n12n32 + n22n32, n1, n2, n3 are direction cosines for the direction [hkl] [19]. If 2S11 − 2S12 − S44 > 0, E reaches the maximum and minimum in the <111> and <100> directions, as the case in MAF-7. On the contrary, if 2S11 − 2S12 − S44 < 0, the reverse results would be obtained as in ZIF-8.
From Table 1, it is clear that the Emax and Emin of MAF-7 are about 20.1% and 3.4% higher than those of ZIF-8. Meanwhile, the E values of MAF-7 is more anisotropic than ZIF-8, characterized by the corresponding index AE = Emax/Emin = 1.65, 16.2% higher than that of ZIF-8 (1.42). The remarkable difference in Young’s modulus between MAF-7 and ZIF-8 originate from the aforementioned electron-donating effect. Such an effect leads to the stronger Zn-N bonds in MAF-7, which resultantly strengthens its resistance to axial deformation dominantly related with the change of Zn-N bonds and rotation of Zn-triazolate-Zn bond angles compared with ZIF-8 [15].
To testify the conclusion about calculated Young’s modulus, we conducted nanoindentation experiments using non-desolvated single-crystals to extract the elastic moduli of MAF-7. The experiment was carried out in the quasi-static mode and the maximum load was set as 5000 μΝ. Representative load-indentation depth (P-h) curves obtained normal to the (100) and (110) faces are displayed in Figure 3. The smooth loading parts of both faces demonstrates that the plastic deformation occurs underneath the three-side pyramidal Berkovich tip during indentation and is relatively homogeneous in nature [22]. The average values of E(100) and E(110), extracted from the P-h curves, are 2.92(14) and 3.87(17) GPa, respectively. The good agreement between the calculated and observed values (with relative error less than 5%) confirms the high Young’s modulus of MAF-7.
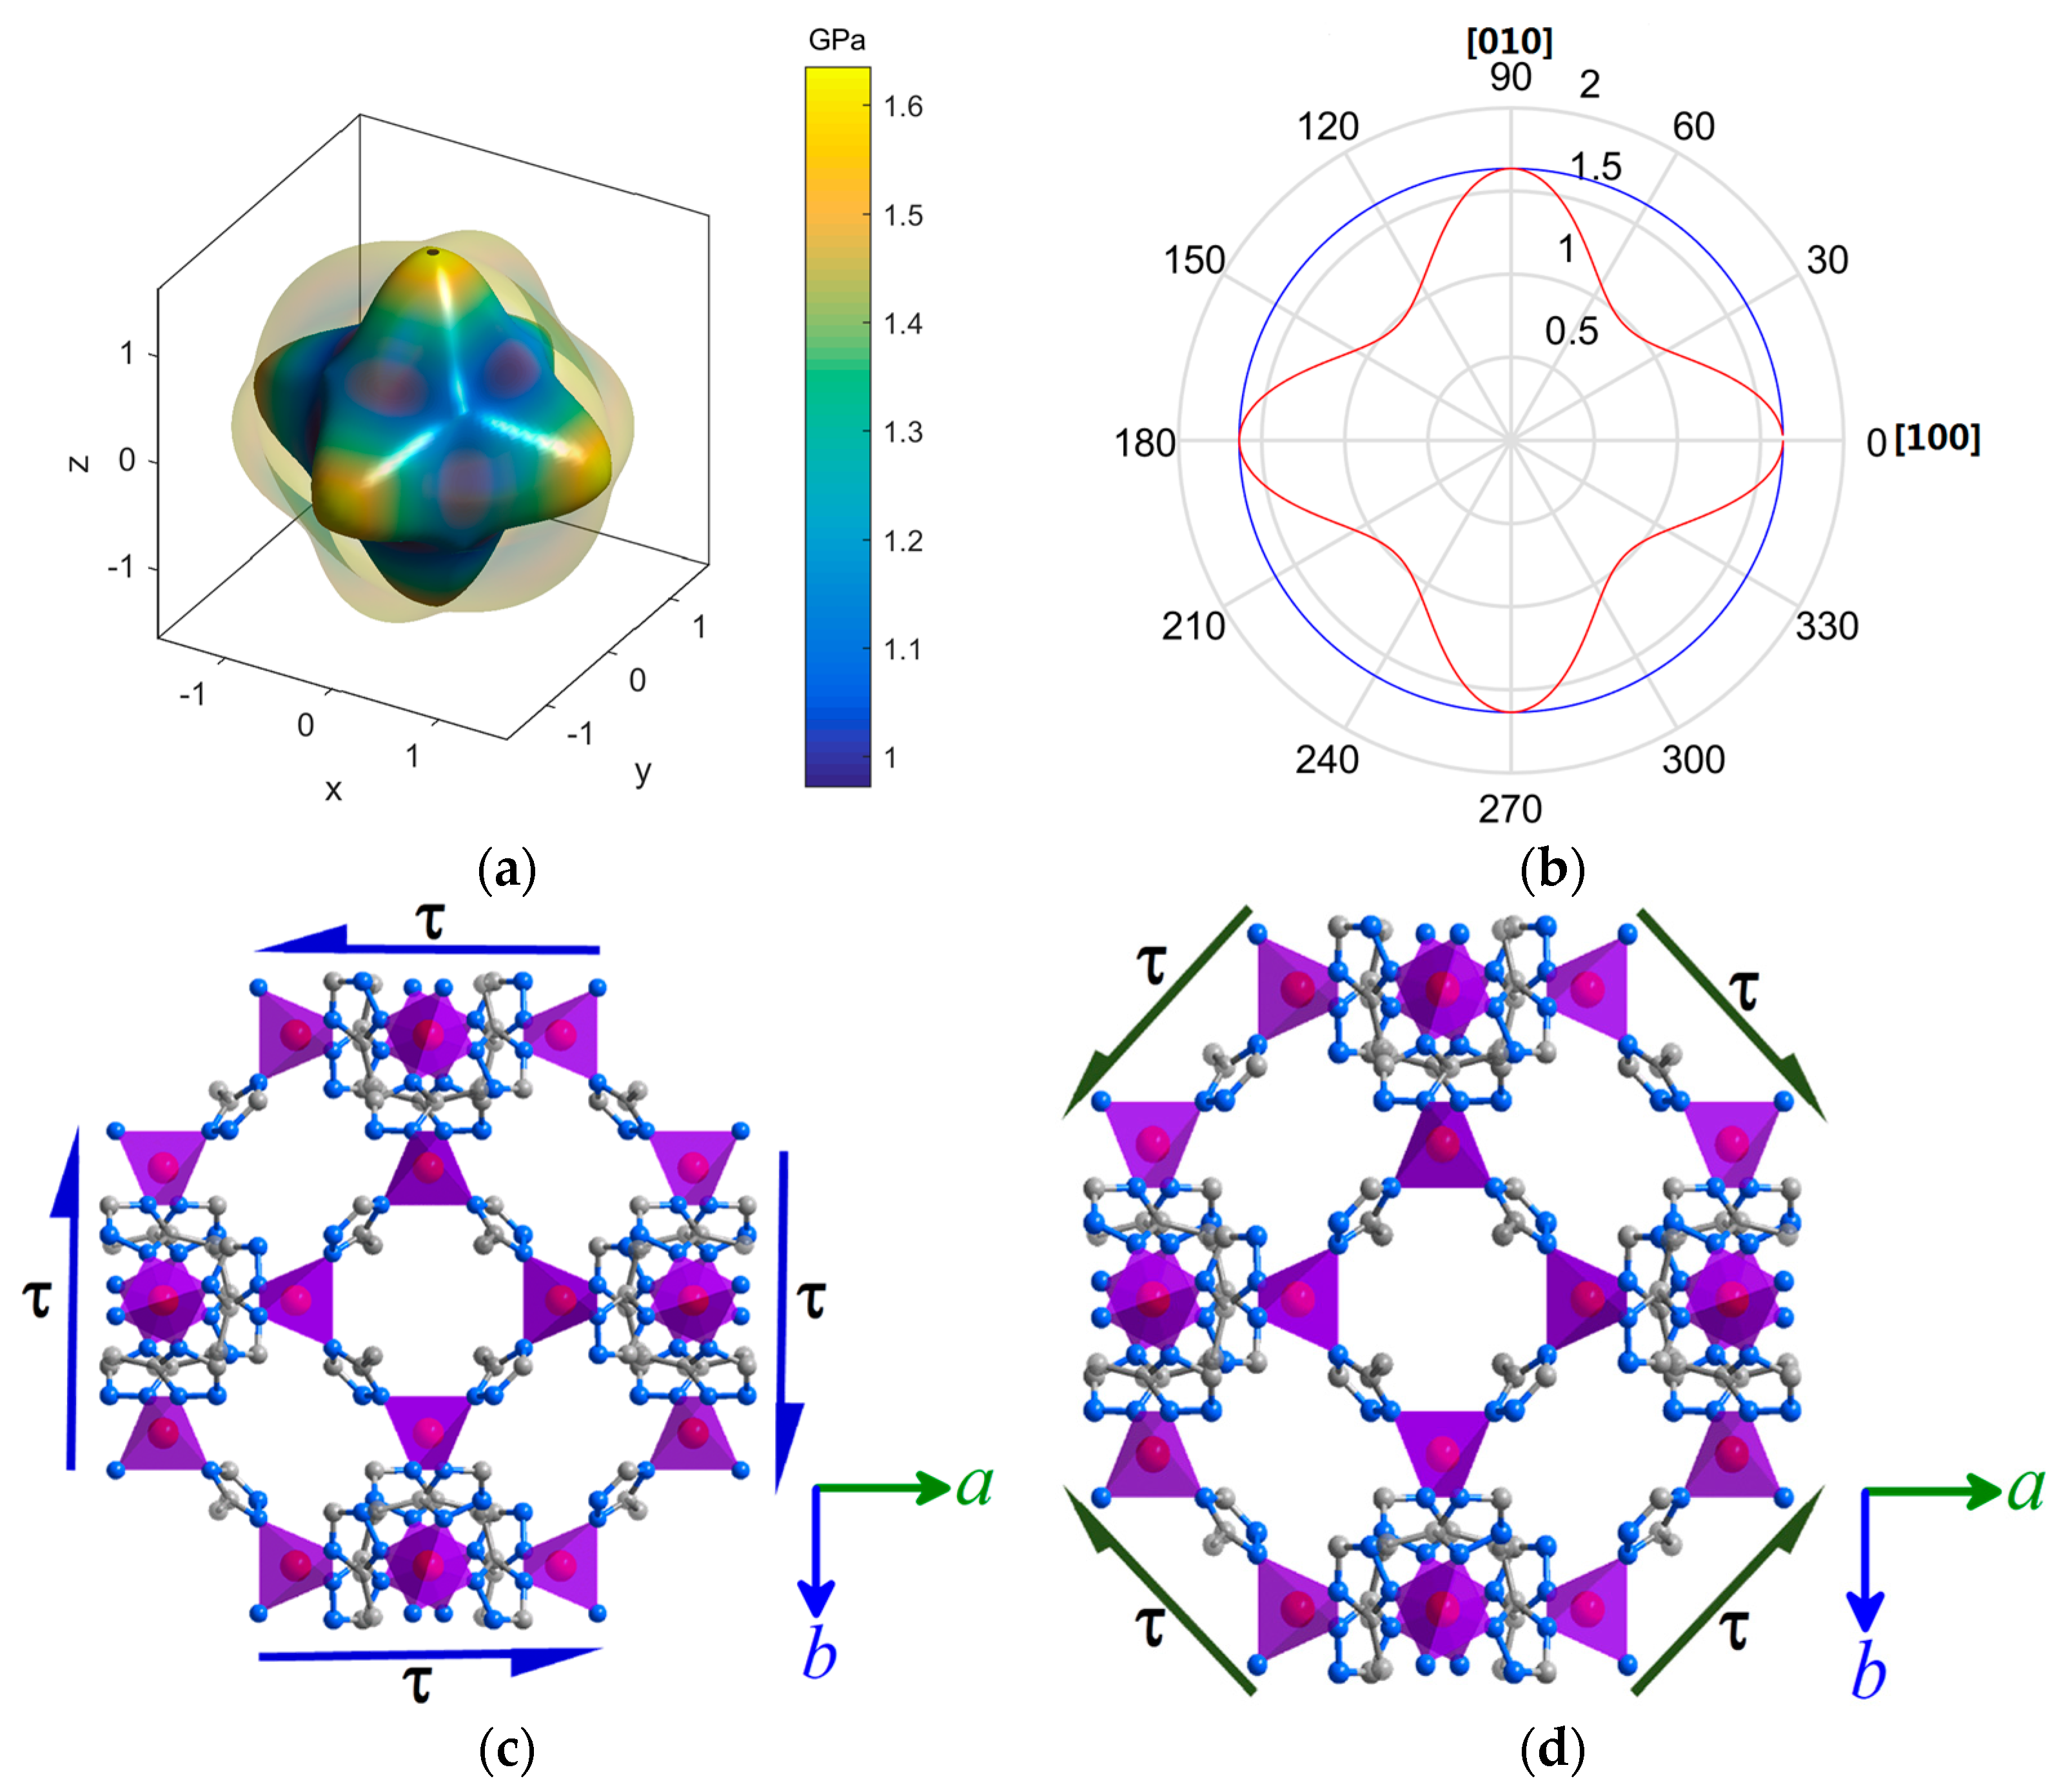
Now we turn attention to the shear modulus (G). Along an arbitrary direction [hkl], the general expression for shear modulus in cubic system is {G(hkl)}−1 = S44 + 2(2S11 − 2S12 − S44)N4, in which the direction-dependent values also depends on N4 [19]. The 3D representation G surface, characterized via the maximal and minimal G, is shown in Figure 4. Accordingly, the Gmax and Gmin are along the <100> and <110> directions, respectively, reversely to the situation in ZIF-8. As seen from Table 1, the Gmin and Gmax of MAF-7 are about 3.2% and 20.6% larger than those from ZIF-8, and the anisotropy in G of MAF-7 is about 15.9% higher than that of ZIF-8. For a cubic crystal, Gmax (=C44) characterize the ability to resist to shear strain on the (100) plane under a pair of opposing shear stresses τ exerted along the <0kl> directions, and Gmin = ((C11 − C12)/2) represents the resistance to shear on the (110) plane under a shear along the <1–10> direction [23]. The framework of MAF-7 resists shear mostly through the cooperative bending of the N-Zn-N and rotation of Zn-mtz-Zn bond angles. Like ZIFs, MAF-7 features four-membered rings in the structure, which are most susceptible to distortion under antiparallel shear forces. For a rectangle, shearing the edges is easier than the diagonals. As such, the same pair of opposing shear stresses τ applied on the (100) or (110) plane can generate larger deformation along the <110> than <100> direction, hence, leading to Gmin along <110> while Gmax along <100> direction.
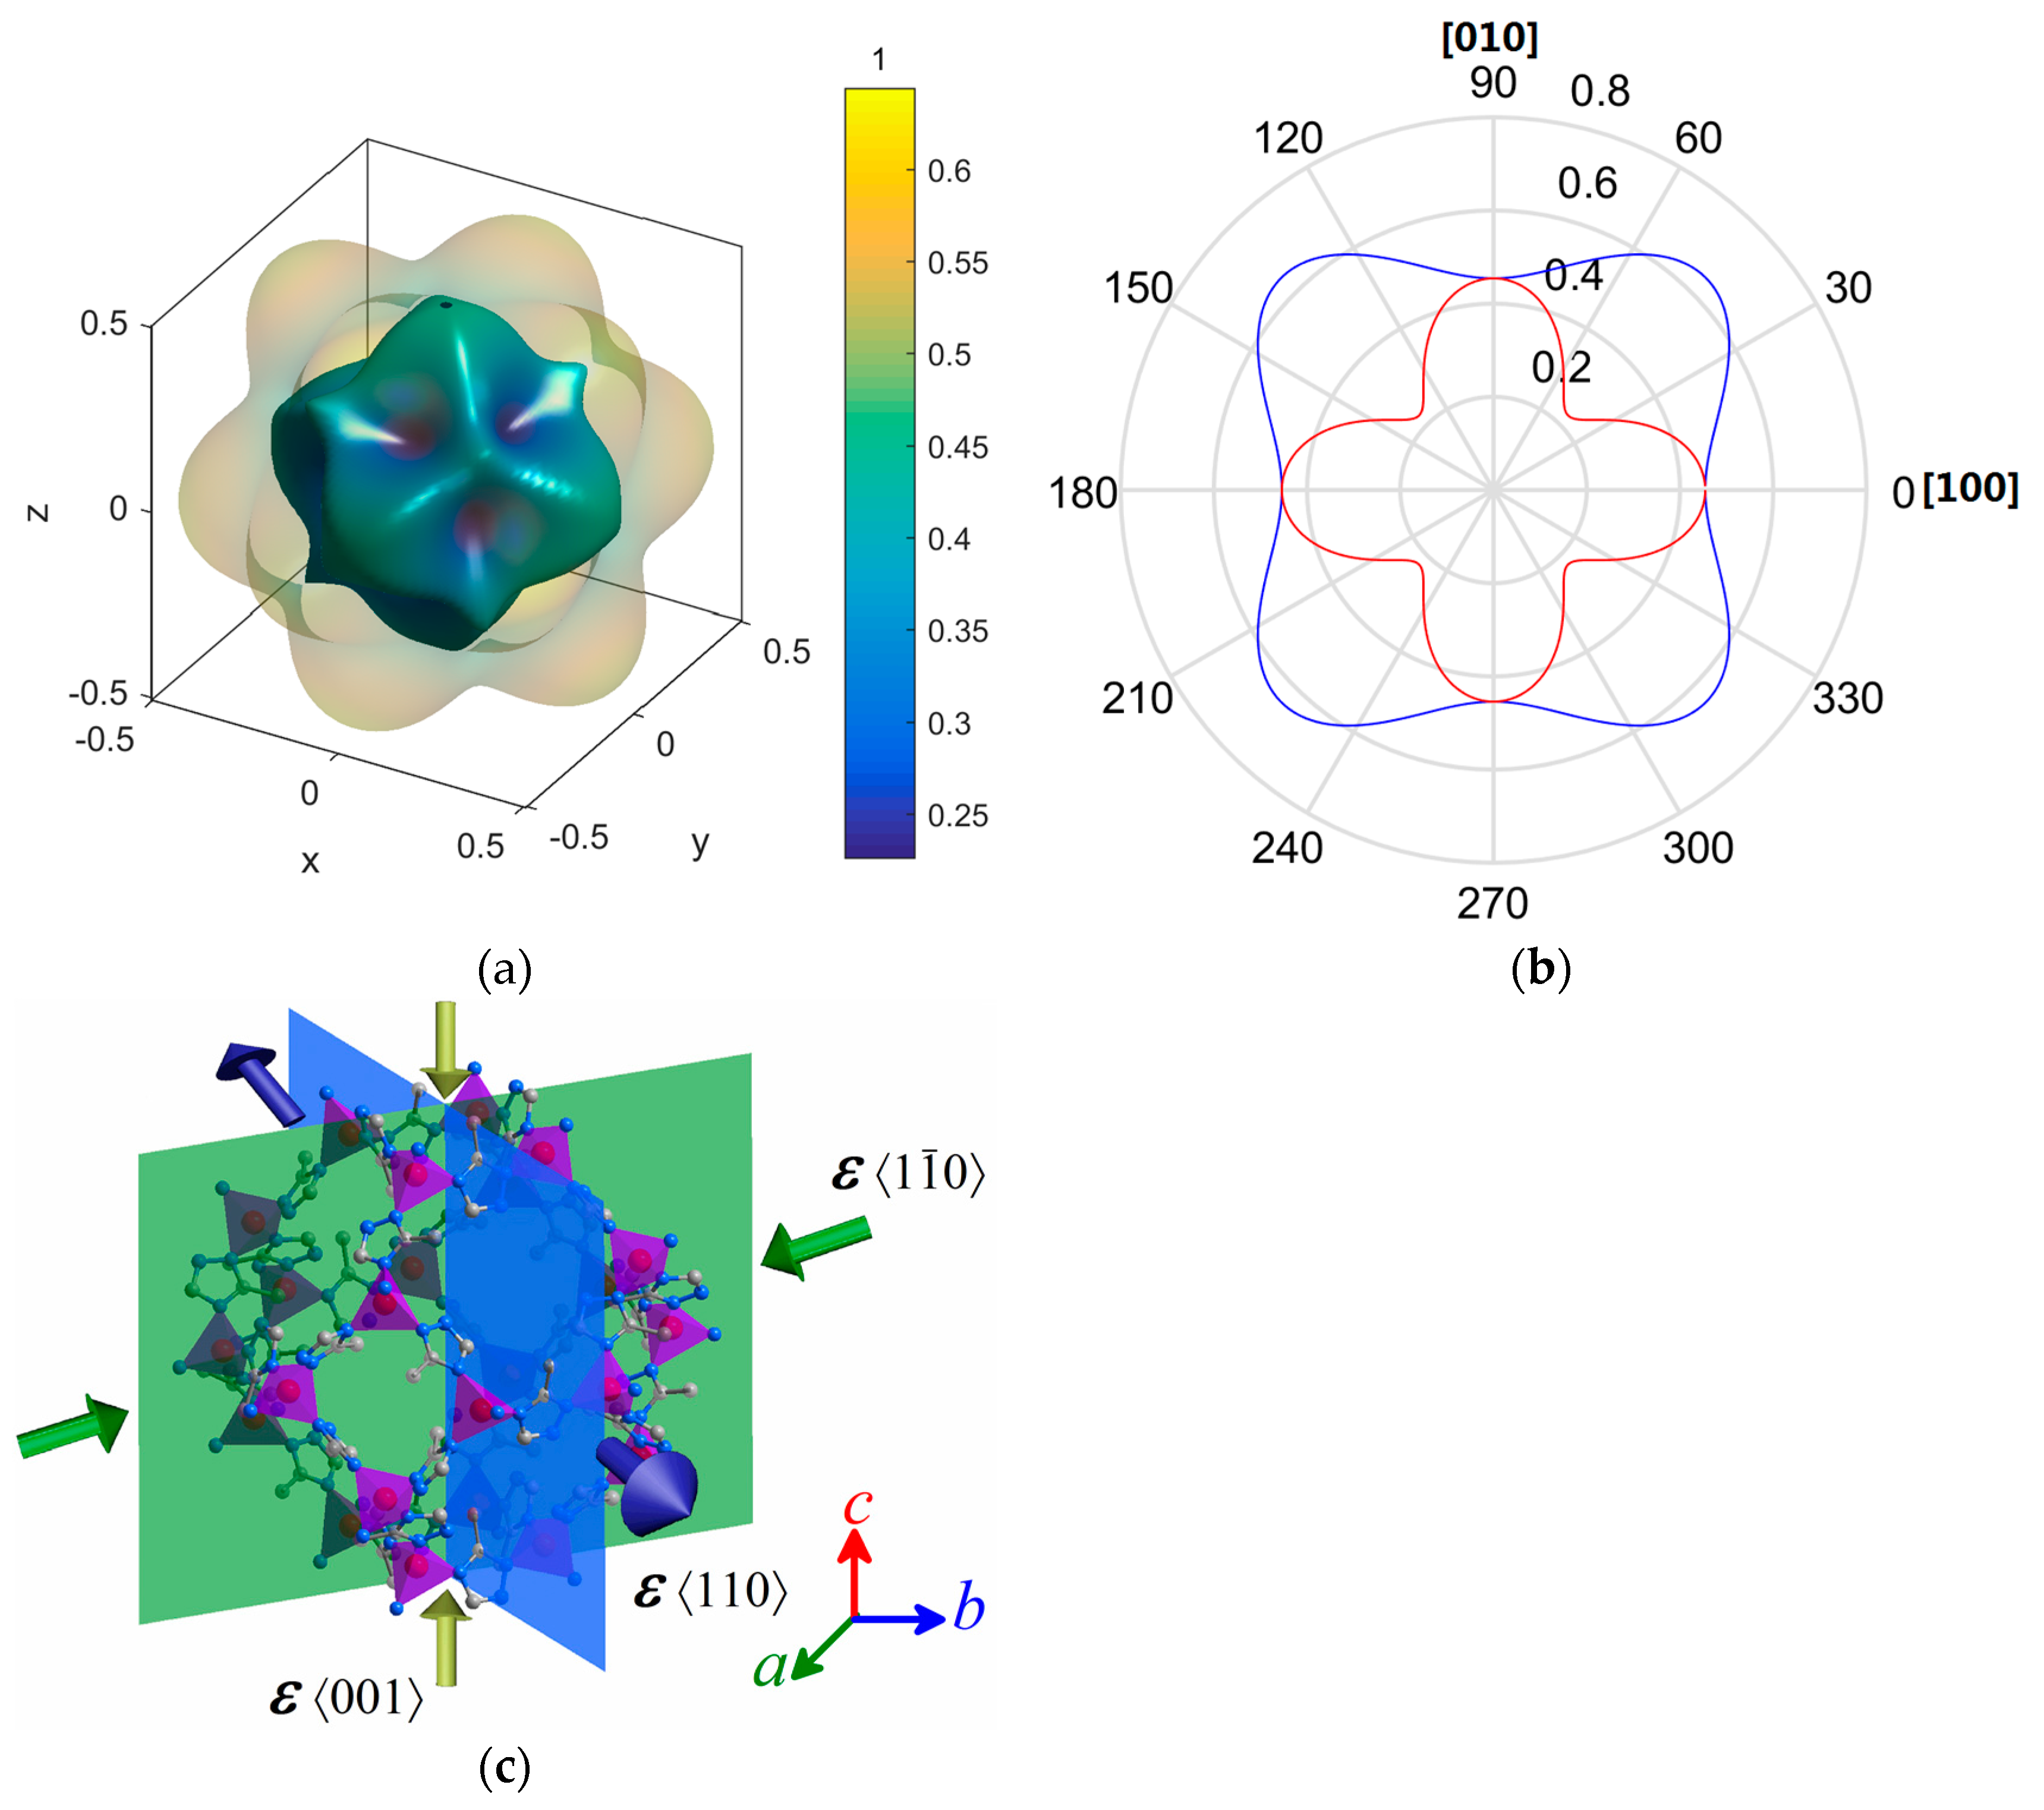
Now, we focus on the Poisson’s ratio (ν) which is defined as the negative ratio of the transverse strain (ɛj) to the longitudinal strain (ɛi), i.e., ν = −ɛj/ɛi [24]. Poisson’s ratio ν is expressed as in a cubic system [19]. Therein, M4 = n12m12 + n22m22 + n32m32, where m1, m2, and m3 are direction cosines for the direction [], respectively [19]. It can be seen that the directions of the νmax and νmin of MAF-7 are also closely related with the direction-dependent value of M4 and N4. The representation surfaces for Poisson’s ratios of MAF-7 are shown in Figure 5a,b, and the maximum and minimum ν values are 0.23 and 0.64 along <> and <001> directions. As illustrated in Figure 5c, when the structure is elongated along the <110> propelled by axial strain, νmin and νmax are obtained along the <001> and <>, respectively. The νmax is 12.3% higher while the νmin is 30.3% lower than ZIF-8. The large νmax of MAF-7 coincide with its high shear modulus, which arises from the electron-donating effect as well. However, the much lower νmin of MAF-7 than ZIF-8 implies that such an electron effect also negatively contribute to the framework stability enhancement under axial tensile or compression stresses along some directions.
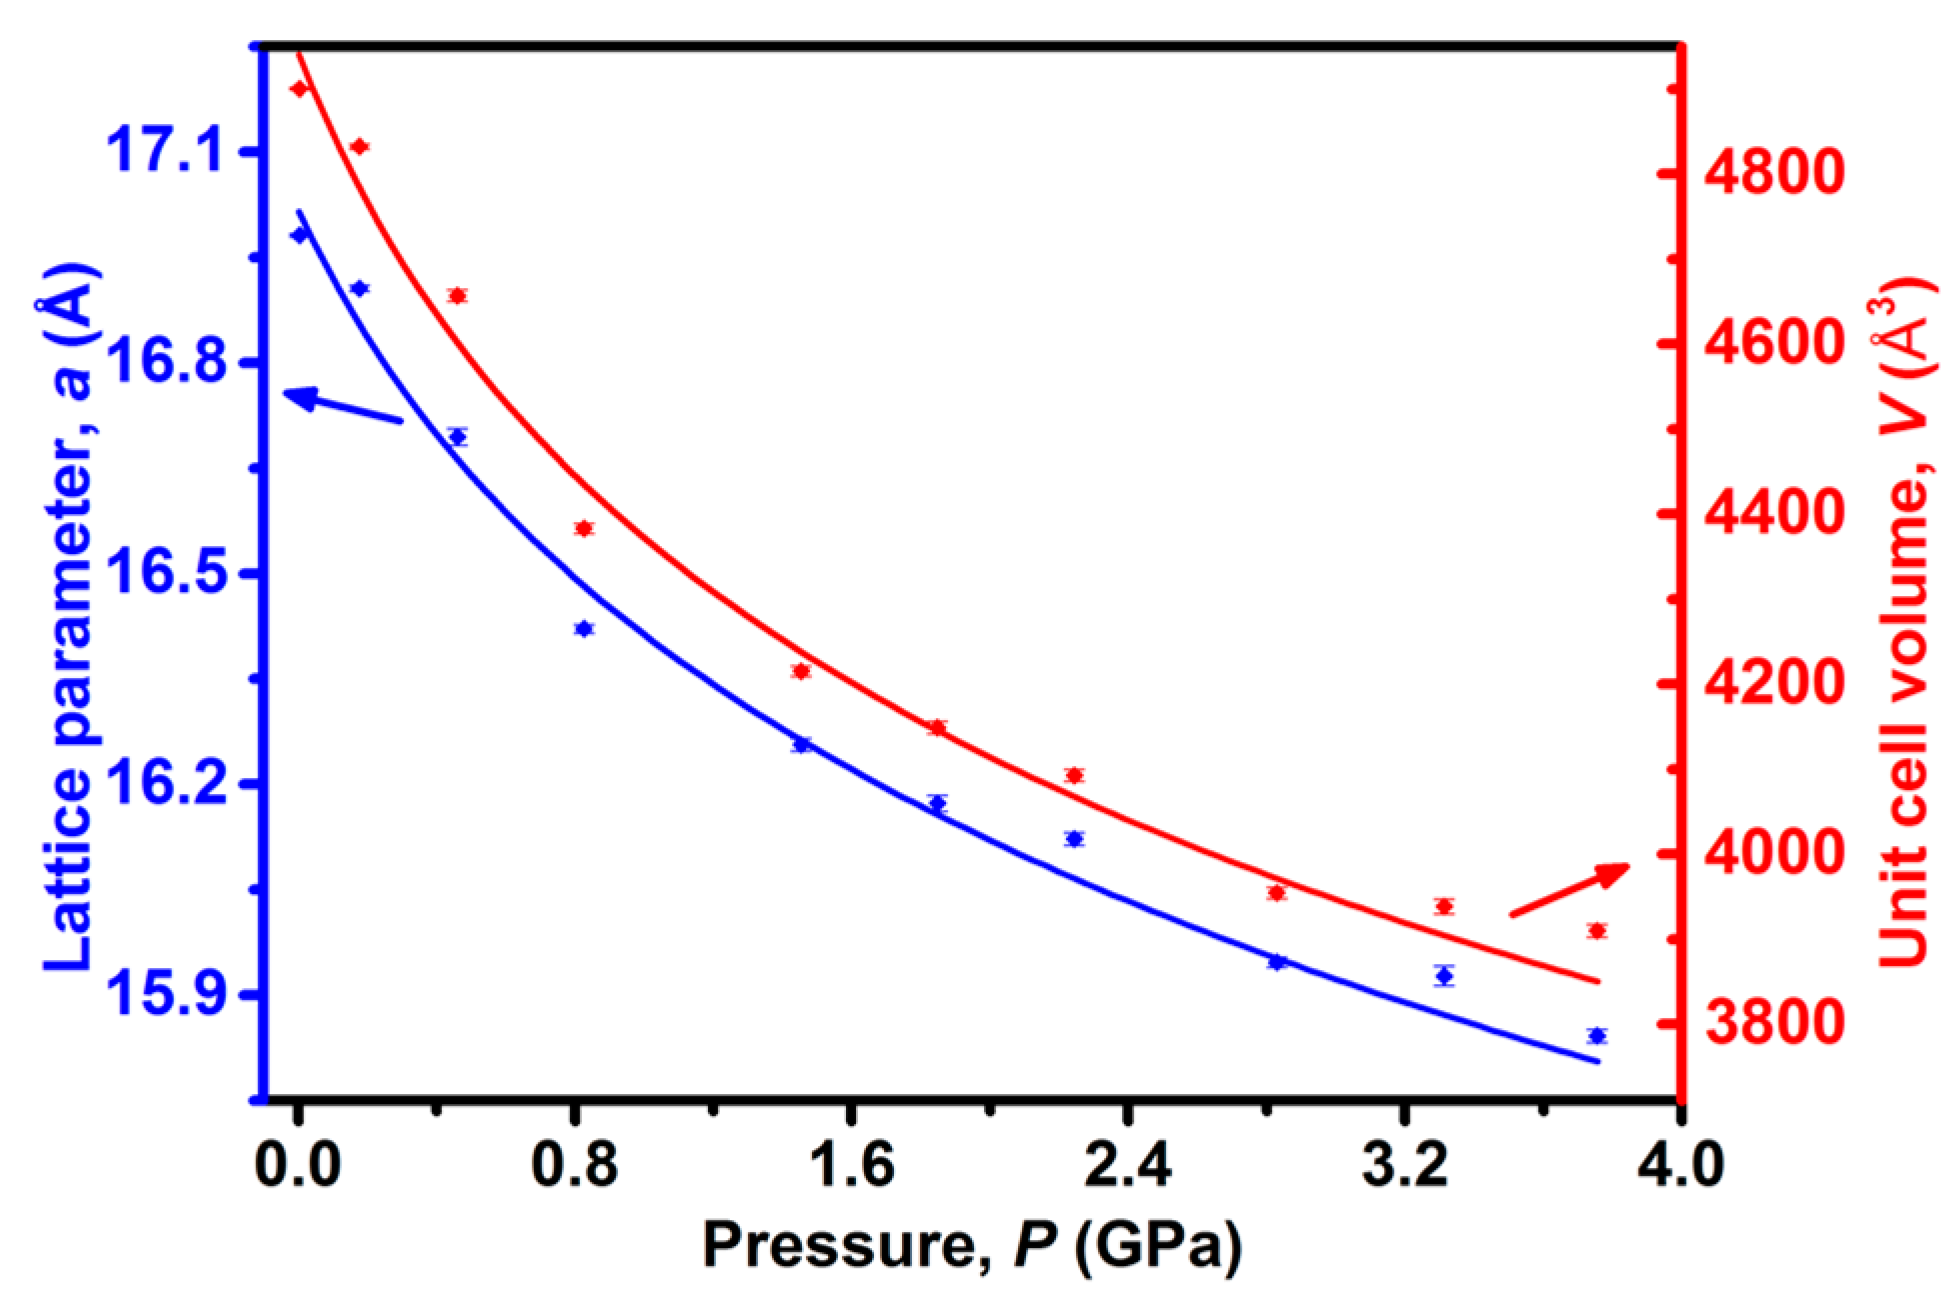
We finally focus on the bulk modulus (B), which represents the resistance of a material against hydrostatic stress. The B value derived from first-principle calculated elastic constants for MAF-7 is 10.29 GPa, indicating its stiffer character than ZIF-8 (theoretical values 9.23 GPa). To further demonstrate higher volume modulus from experimental view point, the high-pressure synchrotron X-ray powder diffraction experiments were performed. As shown in Figure 6, the diffraction peaks move to high angle direction with increasing pressure from 0 to 3.755 GPa, indicating the pressure-induced contraction of the framework. It is worth mentioning that no phase-transition occurs in MAF-7 in the whole pressure range, manifesting its higher stability to resist hydrostatic pressure than ZIF-8 with (phase transition about 0.34 GPa) [13]. The function of unit cell volume and lattice parameter a with respect to pressures (shown in Figure 7) were fitted using the second-order Birch-Murnaghan equation, and the obtained bulk modulus is 10.8(15) GPa, in excellent agreement with the calculated value (10.29 GPa). As expected, the experimental B value of MAF-7 is significantly larger than that of ZIF-8 (6.52(35) GPa), which further ascertains the high mechanical strength of MAF-7.
3. Materials and Methods
3.1. Synthesis of MAF-7
All chemicals and solvents were of reagent grade and used as received. Single crystals of Zn(mtz)2 were prepared by slow evaporation from a clear aqueous ammonia solutions according to the method of Chen et al. [16] In the procedure, 0.084 g Hmtz (Aladdin) and 0.198 g Zn(NO3)2·6H2O (Alfa Aesar) were dissolved in 10 mL aqueous ammonia solutions (25%) (Sinopham Chemical Reagent Co., Ltd., Shanghai, China). The colorless crystal have precipitated from liquid after a few days. Phase identification of a ground bulk sample was confirmed by X-ray powder diffraction (see ESI).
3.2. First-Principles Calculations
The first-principles elastic constant calculations were performed by CASTEP [26,27], a total energy package based on plane-wave pseudopotential density functional theory (DFT) [28]. The functionals developed by Perdew Burke and Ernzerhof (PBE) [29] in generalized gradient approximation (GGA) form [30] were adopted to describe the exchange–correlation energy. To account for the long-range dispersion interactions, the dispersion correction in DFT + D2 form developed by Grimme [31] was included in the calculation. Optimized ultrasoft pseudopotentials were adopted to model the effective interaction between the valence electrons and atom cores [32], which allow us to adopt a relatively small plane-wave basis set without compromising the computational accuracy. The kinetic energy cutoff of 400 eV and the Monkhorst–Pack [33] k-point mesh spanning less than 0.03 Å−1 were chosen.
Before the elastic constant calculation, the crystal structure with no solvent molecules at 0 GPa was firstly optimized using the Broyden–Fletcher–Goldfarb–Shanno (BFGS) [34] minimization scheme, with the convergence criteria for energy, maximum force, maximum stress and maximum displacement set to 10−5 eV per atom, 0.03 eV, 0.05 GPa and 0.001 Å, respectively. Based on the optimized crystal structure, the elastic constants were calculated by the finite-strain method [35], in which the components of the elastic constant tensor were determined by the second-order derivative of energy with respect to specific strain and the maximum strain amplitude and the number of steps for each strain were set as 0.003 and three steps, respectively. After obtaining the calculated elastic constants, the analyses of Young’s modulus, shear modulus and Poisson’s ratio were performed using the ElAM program [21].
3.3. High-Pressure Synchrotron X-ray Powder Diffraction
The high-pressure experiments were performed on the 4W2 beam line of Beijing Synchrotron Radiation Facility with wavelength of the X-ray beam is 0.61992 Å. The gasket (300 μm in thickness) of the pre-indented stainless steel (T301) was placed on the systematic diamond anvil cells (DACs) (a culet diameter of 400 μm). The ground bulk samples were loaded in a cylindrical hole (about 150 μm in diameter), together with a few ruby chips for pressure calibration and a few drops of silicon oil used to act as pressure-transmitting medium for surrounding the samples and ensuring the uniform application of pressure. The required pressures were obtained by manually turning screws and the internal pressures were determined from measuring the shift of ruby luminescence [36]. The data were refined by using the Topas program [37].
3.4. Nanoindentation Methodology of Single Crystals
Nanoindentation experiments were performed under ambient conditions by employing a Hysitron TI 750 Ubi Triboindenter (Hysitron Corp., Minneapolis, MN, USA) in the continuous stiffness measurement mode [38]. A non-desolvated single crystal was first selected by well-defined regular dodecahedron shapes and, after face indexing, was confirmed by single-crystal X-ray diffraction using an Oxford Diffraction Rigaku XtaLAB miniTM diffractometer (Rigaku Oxford Diffraction Ltd., Oxford, UK) with Mo-Kα radiation (λ = 0.70173 Å) at 300 K. Since any natural crystal facets were equivalent to the facet {110}, we had to polish off a certain natural facet to obtain an artificial facet (100). Crystals with {100} and {110}-oriented facets were then cold-mounted in epoxy resin and were carefully ground with emery paper up to 4000 grit, and polished with increasingly fine diamond suspensions to minimize surface roughness [15,22]. Accordingly, the indenter were aligned normal to the (100) and (110) crystal facets with a maximum surface penetration depth of 1200 nm [39]. The loading/unloading rates and the hold time at peak load, respectively, were maintained at 5000 μΝ s−1 and 30 s. A fused silica standard with an elastic modulus of 72 GPa and hardness of 9 GPa was used for calibration. Young’s modulus (Es) and indentation hardness (H) of the MAF-7 crystals were obtained from the P-h plots using the standard Oliver-Pharr method [40,41].
4. Conclusions
In summary, the elastic properties of MAF-7 were studied by first-principles calculation and experiment. Our results revealed that the elastic constant components of MAF-7 are about 5.0–73.3% higher than those of its isomorphous ZIF-8. Further analysis demonstrates that the elastic modulus, shear modulus and Poisson’s ratio values of MAF-7 are about 3.4% to 20.1%, 3.2% to 20.6% and −30.3% to 12.3% larger than those of ZIF-8, respectively. The remarkable enhancement of mechanical stiffness from MAF-7 to ZIF-8 mainly originates from the electron-donating effect of the additional nitrogen atom in the triazolate ligand. Moreover, the underlying reasons of the anisotropic difference in each property were discussed from a viewpoint of framework structure. Furthermore, the calculated high mechanical strength of MAF-7 is verified by nanoindentation and high-pressure X-ray diffraction experiment, indicating the reliability of our first principle calculations. We believe this study further deepens the understanding of mechanical properties of zeolitic azolate frameworks, and is informative for the exploration of MOF mechanics in general.
Supplementary Materials
The following are available online at www.mdpi.com/2073-4352/7/4/99/s1, Figure S1: The powder X-ray diffraction (PXRD) spectra of MAF-7 refined by Le Bail method. The black and red symbols, and the purple continuous lines are experimental, calculated, and difference profiles, respectively, and the vertical markers indicate the allowed Bragg reflections. Rp = 5.0%, Rwp = 7.4% and GOF = 4.598; Table S1: Lattice parameters and unit cell volume of MAF-7 at various pressure (GPa).
Acknowledgments
All authors acknowledge funding support from Huazhong University of Science and Technology, Xinjiang University and the National Natural Science Foundation of China (Grant No. 21571072, 11504313, 61665011, 11264037, and 51362026).
Author Contributions
Wei Li, Rong Wu, Zheshuai Lin and Guoqiang Feng conceived and designed the project; Xingxing Jiang performed the density functional theory calculations; Hongqiang Gao and Wenjuan Wei performed the experiments and analyzed the data; Hongqiang Gao and Wenjuan Wei wrote the paper under the supervision of Wei Li. All authors contributed to discussion of the results and reviewed the manuscript.
Conflicts of Interest
The authors declare no conflicts of interest.
References
- Li, W.; Wang, Z.; Deschler, F.; Gao, S.; Friend, R.H.; Cheetham, A.K. Chemically diverse and multifunctional hybrid organic–inorganic perovskites. Nat. Rev. Mater. 2017, 16099. [Google Scholar] [CrossRef]
- Deng, H.; Doonan, C.J.; Furukawa, H.; Ferreira, R.B.; Towne, J.; Knobler, C.B.; Wang, B.; Yaghi, O.M. Multiple functional groups of varying ratios in metal-organic frameworks. Science 2010, 327, 846–850. [Google Scholar] [CrossRef] [PubMed]
- Fukushima, T.; Horike, S.; Inubushi, Y.; Nakagawa, K.; Kubota, Y.; Takata, M.; Kitagawa, S. Solid Solutions of Soft Porous Coordination Polymers: Fine-Tuning of Gas Adsorption Properties. Angew. Chem. Int. Ed. 2010, 49, 4820–4824. [Google Scholar] [CrossRef] [PubMed]
- Tanaka, D.; Higuchi, M.; Horike, S.; Matsuda, R.; Kinoshita, Y.; Yanai, N.; Kitagawa, S. Storage and Sorption Properties of Acetylene in Jungle-Gym-Like Open Frameworks. Chem. Asian J. 2008, 3, 1343–1349. [Google Scholar] [CrossRef] [PubMed]
- Kleist, W.; Jutz, F.; Maciejewski, M.; Baiker, A. Mixed-Linker Metal-Organic Frameworks as Catalysts for the Synthesis of Propylene Carbonate from Propylene Oxide and CO2. Eur. J. Inorg. Chem. 2009, 2009, 3552–3561. [Google Scholar] [CrossRef]
- Cheetham, A.K.; Rao, C.N.R.; Feller, R.K. Structural diversity and chemical trends in hybrid inorganic–organic framework materials. Chem. Commun. 2006, 4780–4795. [Google Scholar] [CrossRef]
- Taylor-Pashow, K.M.; Rocca, J.D.; Xie, Z.; Tran, S.; Lin, W. Postsynthetic modifications of iron-carboxylate nanoscale metal-organic frameworks for imaging and drug delivery. J. Am. Chem. Soc. 2009, 131, 14261–14263. [Google Scholar] [CrossRef] [PubMed]
- Li, W.; Kiran, M.S.R.N.; Manson, J.L.; Schlueter, J.A.; Thirumurugan, A.; Ramamurty, U.; Cheetham, A.K. Mechanical properties of a metal–organic framework containing hydrogen-bonded bifluoride linkers. Chem. Commun. 2013, 49, 4471–4473. [Google Scholar] [CrossRef] [PubMed]
- Sun, S.; Henke, S.; Wharmby, M.T.; Yeung, H.H.M.; Li, W.; Cheetham, A.K. Mechanical Properties of a Calcium Dietary Supplement, Calcium Fumarate Trihydrate. Inorg. Chem. 2015, 54, 11186–11192. [Google Scholar] [CrossRef] [PubMed]
- Zhang, Z.; Jiang, X.; Feng, G.; Lin, Z.; Hu, B.; Li, W. Mechanical properties and negative thermal expansion of a dense rare earth formate framework. J. Solid State Chem. 2016, 233, 289–293. [Google Scholar] [CrossRef]
- Park, K.S.; Ni, Z.; Cote, A.P.; Choi, J.Y.; Huang, R.; Uribe-Romo, F.J.; Chae, H.K.; O’Keeffe, M.; Yaghi, O.M. Exceptional chemical and thermal stability of zeolitic imidazolate frameworks. Proc. Natl. Acad. Sci. USA 2006, 103, 10186–10191. [Google Scholar] [CrossRef] [PubMed]
- Moggach, S.A.; Bennett, T.D.; Cheetham, A.K. The Effect of Pressure on ZIF-8: Increasing Pore Size with Pressure and the Formation of a High-Pressure Phase at 1.47 GPa. Angew. Chem. 2009, 121, 7221–7223. [Google Scholar] [CrossRef]
- Chapman, K.W.; Halder, G.J.; Chupas, P.J. Pressure-induced amorphization and porosity modification in a metal-organic framework. J. Am. Chem. Soc. 2009, 131, 17546–17547. [Google Scholar] [CrossRef] [PubMed]
- Tan, J.C.; Bennett, T.D.; Cheetham, A.K. Chemical structure, network topology, and porosity effects on the mechanical properties of Zeolitic Imidazolate Frameworks. Proc. Natl Acad. Sci. USA 2010, 107, 9938–9943. [Google Scholar] [CrossRef] [PubMed]
- Tan, J.C.; Civalleri, B.; Lin, C.C.; Valenzano, L.; Galvelis, R.; Chen, P.F.; Bennett, T.D.; Mellot-Draznieks, C.; Zicovich-Wilson, C.M.; Cheetham, A.K. Exceptionally low shear modulus in a prototypical imidazole-based metal-organic framework. Phys. Rev. Lett. 2012, 108, 095502. [Google Scholar] [CrossRef] [PubMed]
- Zhang, J.P.; Zhu, A.X.; Lin, R.B.; Qi, X.L.; Chen, X.M. Pore Surface Tailored SOD-Type Metal-Organic Zeolites. Adv. Mater. 2011, 23, 1268–1271. [Google Scholar] [CrossRef] [PubMed]
- Zhu, A.X.; Lin, R.B.; Qi, X.L.; Liu, Y.; Lin, Y.Y.; Zhang, J.P.; Chen, X.M. Zeolitic metal azolate frameworks (MAFs) from ZnO/Zn(OH)2 and monoalkyl-substituted imidazoles and 1,2,4-triazoles: Efficient syntheses and properties. Microporous Mesoporous Mater. 2012, 157, 42–49. [Google Scholar] [CrossRef]
- Nye, J.F. Physical Properties of Crystals; Clarendon Press: Oxford, UK, 1985; p. 142. [Google Scholar]
- Grimvall, G. Thermophysical Properties of Materials; Elsevier: Amsterdam, The Netherlands, 1999. [Google Scholar]
- Feng, J. Mechanical properties of hybrid organic-inorganic CH3NH3BX3 (B = Sn, Pb; X = Br, I) perovskites for solar cell absorbers. APL Mater. 2014, 2, 081801. [Google Scholar] [CrossRef]
- Marmier, A.; Lethbridge, Z.A.; Walton, R.I.; Smith, C.W.; Parker, S.C.; Evans, K.E. ElAM: A computer program for the analysis and representation of anisotropic elastic properties. Comput. Phys. Commun. 2010, 181, 2102–2115. [Google Scholar] [CrossRef]
- Li, W.; Barton, P.T.; Kiran, M.S.R.N.; Burwood, R.P.; Ramamurty, U.; Cheetham, A.K. Magnetic and Mechanical Anisotropy in a Manganese 2-Methylsuccinate Framework Structure. Chemistry 2011, 17, 12429–12436. [Google Scholar] [CrossRef] [PubMed]
- Feng, G.; Jiang, X.; Wei, W.; Gong, P.; Kang, L.; Li, Z.; Li, Y.; Li, X.; Wu, X.; Lin, Z.; et al. High pressure behaviour and elastic properties of a dense inorganic–organic framework. Dalton Trans. 2016, 45, 4303–4308. [Google Scholar] [CrossRef] [PubMed]
- Lethbridge, Z.A.; Walton, R.I.; Marmier, A.S.; Smith, C.W.; Evans, K. Elastic anisotropy and extreme Poisson’s ratios in single crystals. Acta Mater. 2010, 58, 6444–6451. [Google Scholar] [CrossRef]
- Cliffe, M.J.; Goodwin, A.L. PASCal: A principal axis strain calculator for thermal expansion and compressibility determination. J. Appl. Cryst. 2012, 45, 1321–1329. [Google Scholar] [CrossRef]
- Clark, S.J.; Segall, M.D.; Pickard, C.J.; Hasnip, P.J.; Probert, M.I.; Refson, K.; Payne, M.C. First principles methods using CASTEP. Z. Krist. 2005, 220, 567–570. [Google Scholar] [CrossRef]
- Payne, M.C.; Teter, M.P.; Allan, D.C.; Arias, T.A.; Joannopoulos, J.D. Iterative minimization techniques for ab initio total-energy calculations: Molecular dynamics and conjugate gradients. Rev. Mod. Phys. 1992, 64, 1045. [Google Scholar] [CrossRef]
- Kohn, W.; Sham, L.J. Self-consistent equations including exchange and correlation effects. Phys. Rev. 1965, 140, A1133. [Google Scholar] [CrossRef]
- Perdew, J.P.; Burke, K.; Ernzerhof, M. Generalized gradient approximation made simple. Phys. Rev. Lett. 1996, 77, 3865. [Google Scholar] [CrossRef] [PubMed]
- Perdew, J.P.; Wang, Y. Pair-distribution function and its coupling-constant average for the spin-polarized electron gas. Phys. Rev. B 1992, 46, 12947. [Google Scholar] [CrossRef]
- Grimme, S. Semiempirical GGA-type density functional constructed with a long-range dispersion correction. J. Comput. Chem. 2006, 27, 1787–1799. [Google Scholar] [CrossRef] [PubMed]
- Sanchez-Portal, D.; Artacho, E.; Soler, J.M. Projection of plane-wave calculations into atomic orbitals. Solid State Commun. 1995, 95, 685–690. [Google Scholar] [CrossRef]
- Monkhorst, H.J.; Pack, J.D. Special points for Brillouin-zone integrations. Phys. Rev. B 1976, 13, 5188. [Google Scholar] [CrossRef]
- Pfrommer, B.G.; Côté, M.; Louie, S.G.; Cohen, M.L. Relaxation of crystals with the quasi-Newton method. J. Comput. Phys. 1997, 131, 233–240. [Google Scholar] [CrossRef]
- Deyirmenjian, V.B.; Heine, V.; Payne, M.C.; Milman, V.; Lynden-Bell, R.M.; Finnis, M.W. Ab initio atomistic simulation of the strength of defective aluminum and tests of empirical force models. Phys. Rev. B 1995, 52, 15191. [Google Scholar] [CrossRef]
- Mao, H.K.; Xu, J.A.; Bell, P.M. Calibration of the ruby pressure gauge to 800 kbar under quasi-hydrostatic conditions. J. Geophys. Res. 1986, 91, 4673–4676. [Google Scholar] [CrossRef]
- Coelho, A. TOPAS-Academic v5, Coehlo Software: Brisbane, Australia, 2013.
- Gao, H.; Wei, W.; Li, Y.; Wu, R.; Feng, G.; Li, W. Uniaxial Negative Thermal Expansion and Mechanical Properties of a Zinc-Formate Framework. Materials 2017, 10, 151. [Google Scholar] [CrossRef]
- Li, W.; Thirumurugan, A.; Barton, P.T.; Lin, Z.; Henke, S.; Yeung, H.H.M.; Wharmby, M.T.; Bithell, E.G.; Howard, C.J.; Cheetham, A.K.; et al. Mechanical tunability via hydrogen bonding in metal–organic frameworks with the perovskite architecture. J. Am. Chem. Soc. 2014, 136, 7801–7804. [Google Scholar] [CrossRef] [PubMed]
- Oliver, W.C.; Pharr, G.M. An improved technique for determining hardness and elastic modulus using load and displacement sensing indentation experiments. J. Mater. Res. 1992, 7, 1564–1583. [Google Scholar] [CrossRef]
- Oliver, W.C.; Pharr, G.M. Measurement of hardness and elastic modulus by instrumented indentation: Advances in understanding and refinements to methodology. J. Mater. Res. 2004, 19, 3–20. [Google Scholar] [CrossRef]
Figure 1.
Crystal structures of ZIF-8 and MAF-7. Coordination modes of (a) imidazolate and (b) 1,2,4-triazolate; framework structures of (c) ZIF-8 and (d) MAF-7. The electron-donating effect is indicated by arrows. The yellow surfaces indicate the solvent accessible voids of ZIF-8 and MAF-7 which are 49.8% and 51.7%, respectively [16]. Color codes used: zinc, red; carbon, grey; nitrogen, blue; hydrogen, white.
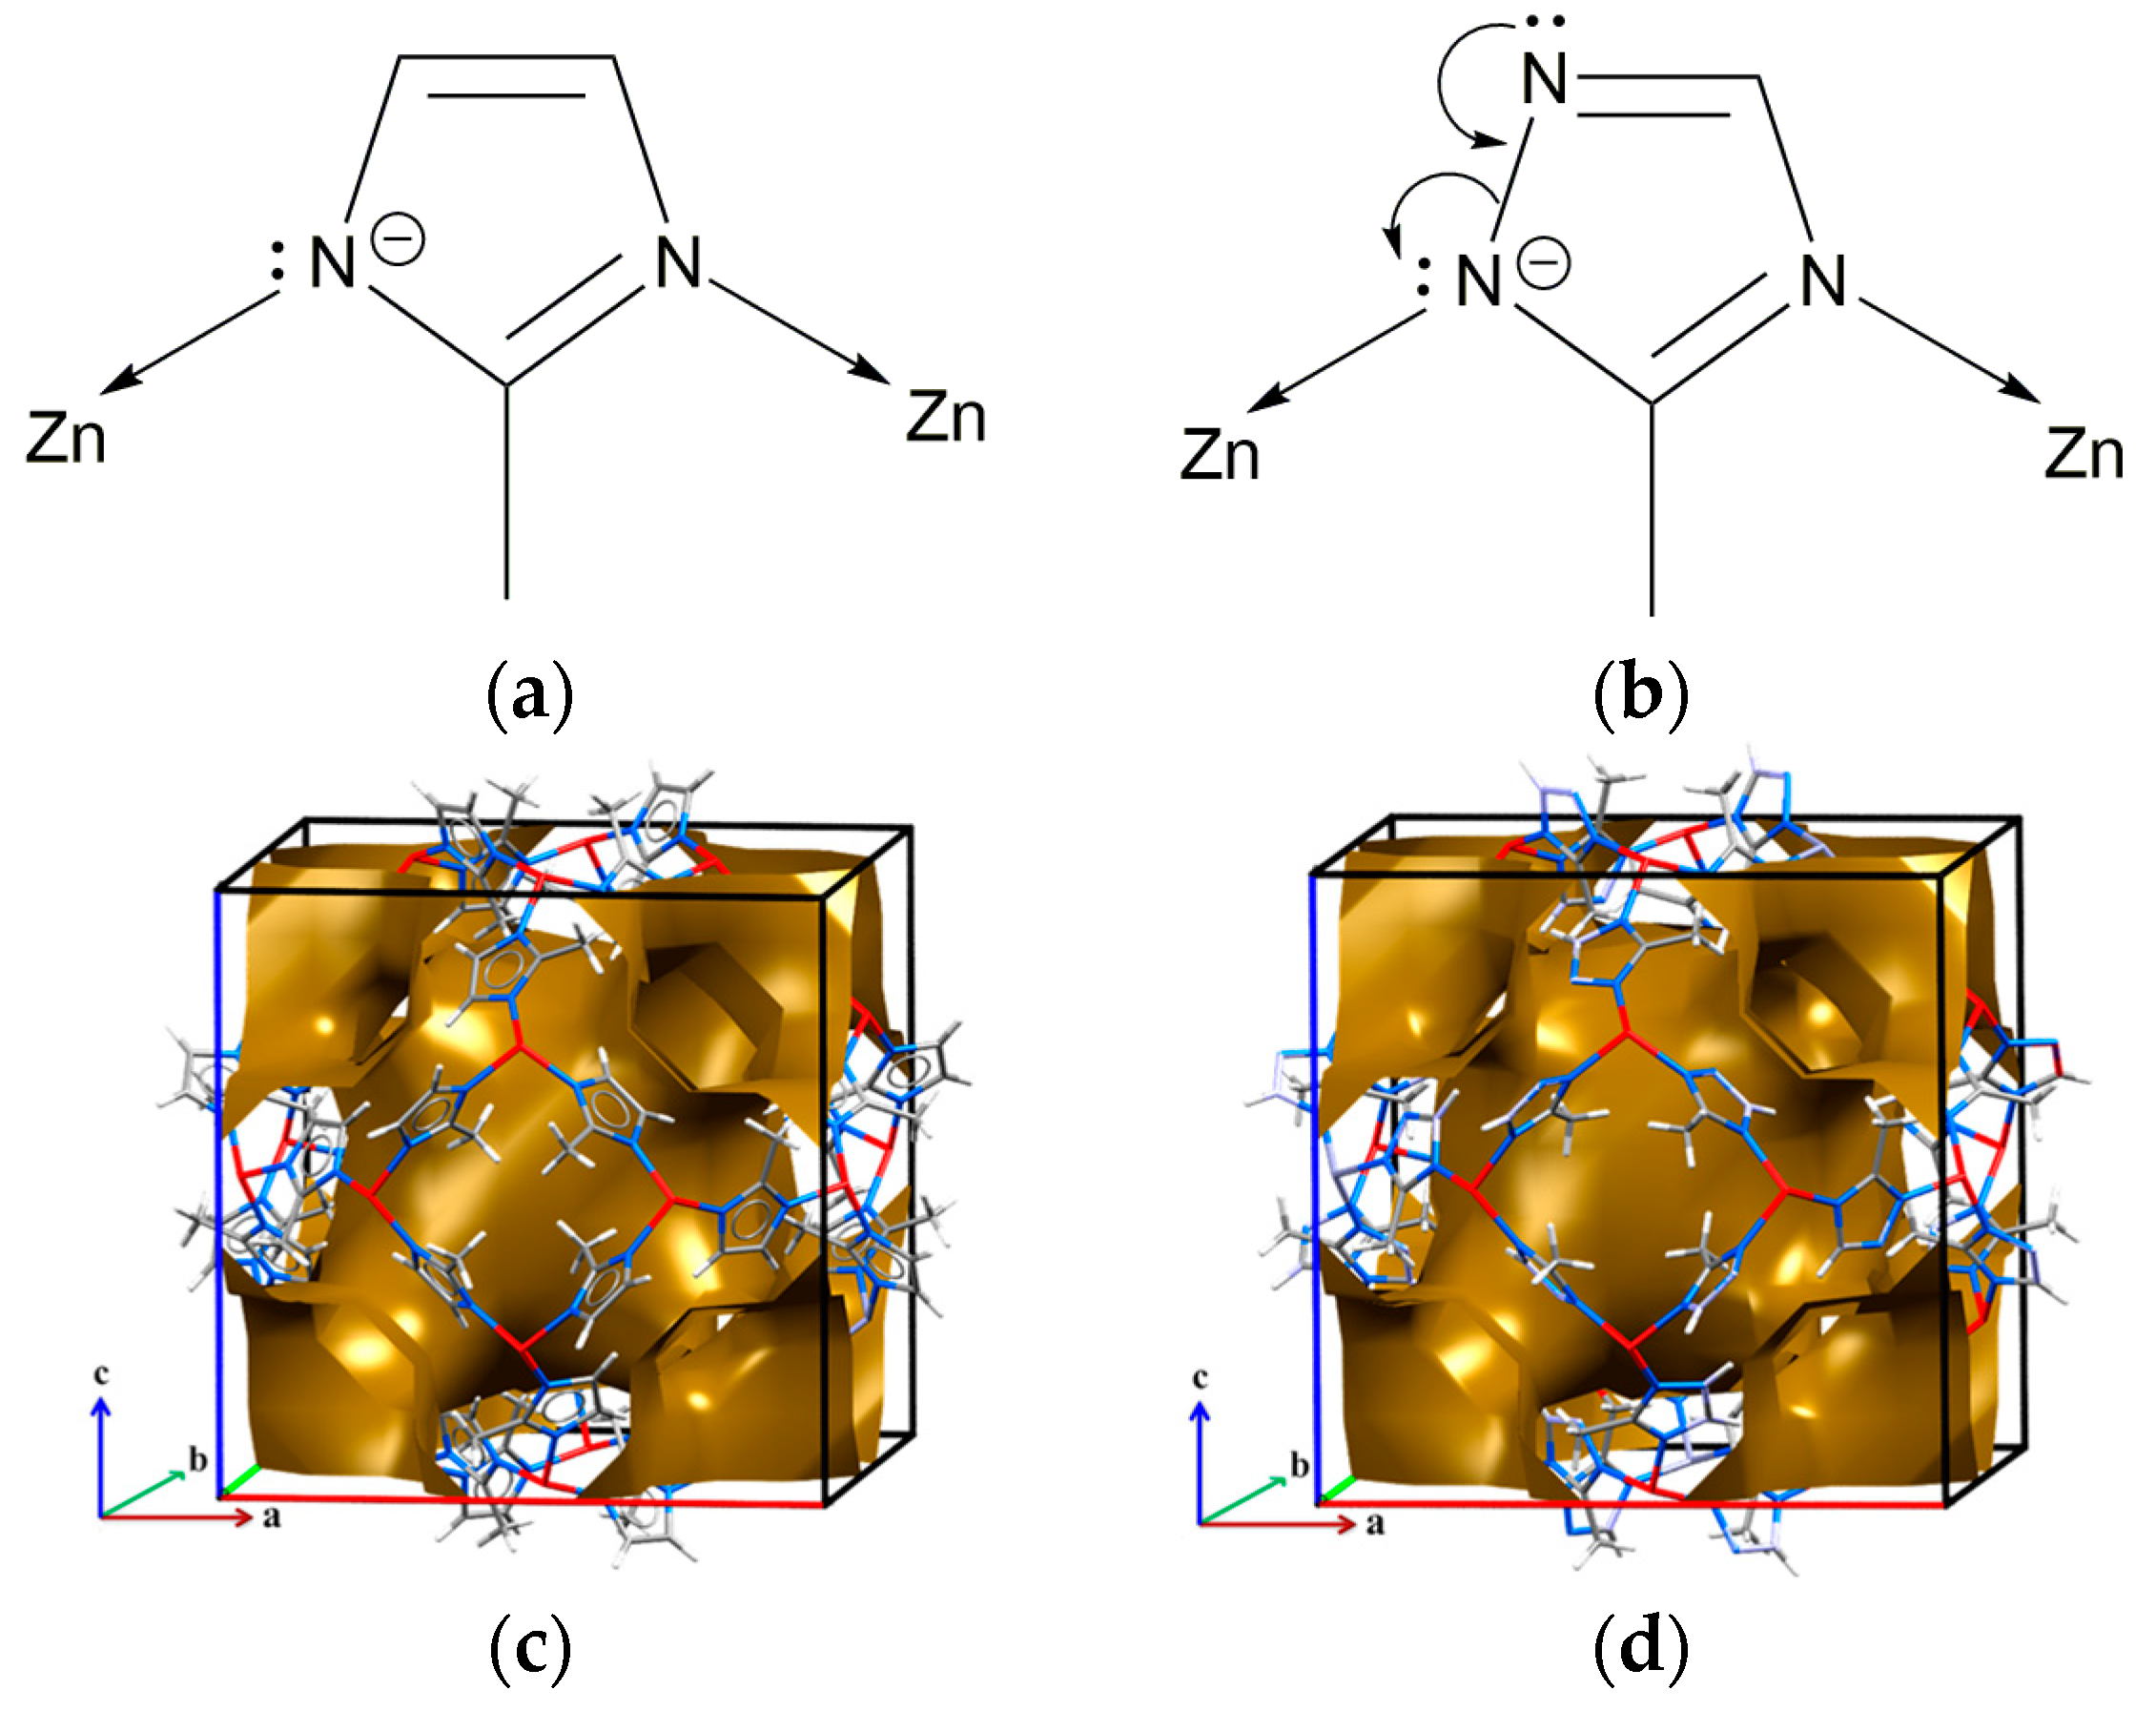
Figure 2.
Young’s modulus (E) representation surfaces. (a) 3D and (b) 2D surface extracted from the calculated elastic constants. (c,d) The schematic of stresses σ applied along [111], [110], [100] directions, corresponding to the maximum, intermediate, and minimum modulus.
Figure 2.
Young’s modulus (E) representation surfaces. (a) 3D and (b) 2D surface extracted from the calculated elastic constants. (c,d) The schematic of stresses σ applied along [111], [110], [100] directions, corresponding to the maximum, intermediate, and minimum modulus.
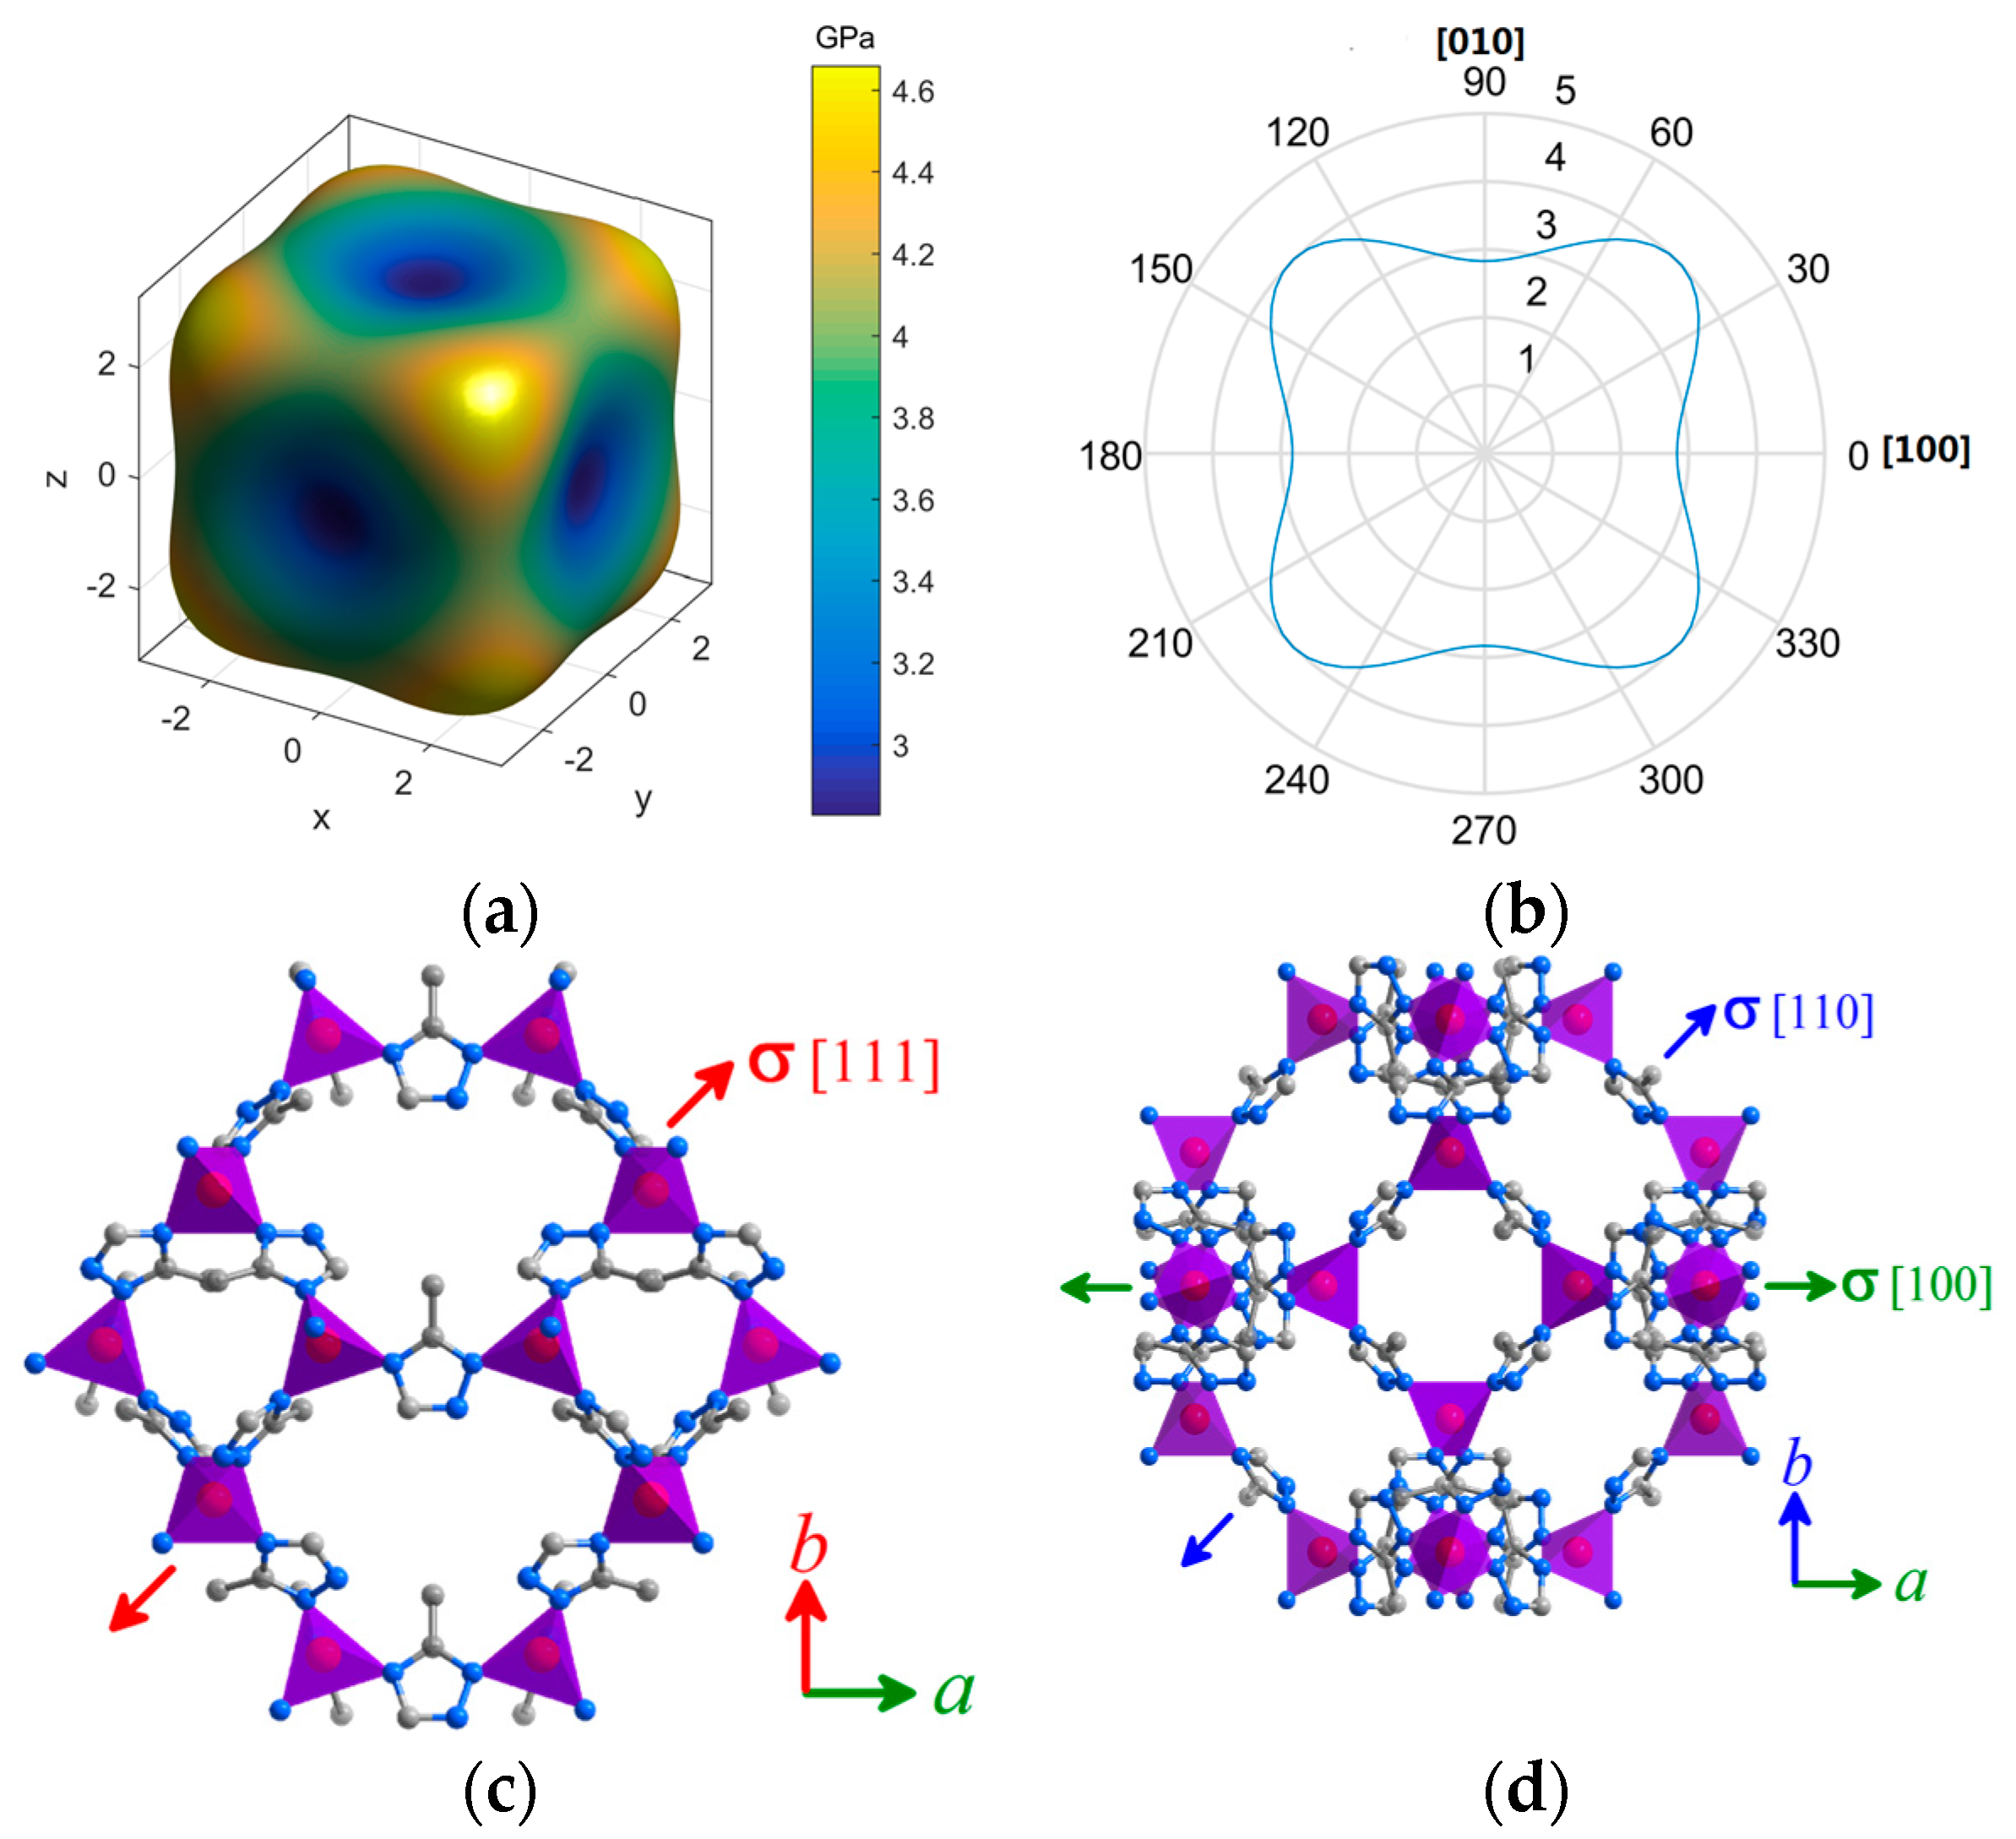
Figure 3.
Representative load-indentation depth (P-h) curves of MAF-7 measured with a Berkovich tip normal to the (110) and (100) planes.
Figure 3.
Representative load-indentation depth (P-h) curves of MAF-7 measured with a Berkovich tip normal to the (110) and (100) planes.
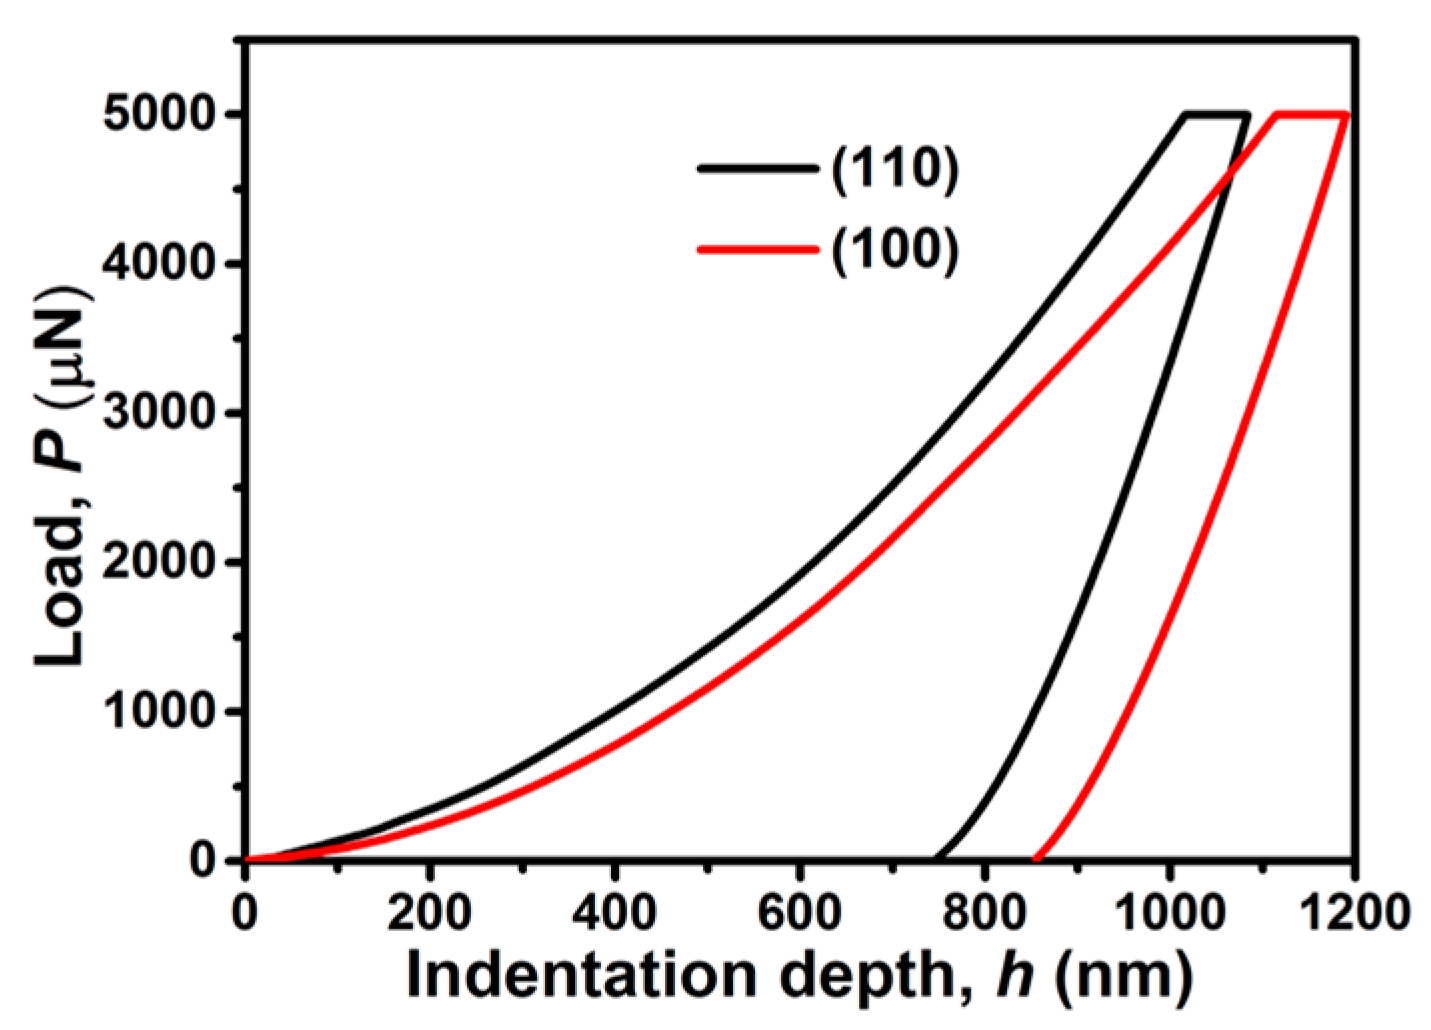
Figure 4.
Shear modulus (G) representation surfaces. (a) 3D and (b) 2D surface based on the calculated elastic constants, The opposing shear stresses τ are applied (c) on the (100) planes along <0kl> directions and (d) on the (110) planes along <> directions, corresponding to the maximum and minimum shear modulus.

Figure 5.
Poisson’s ratio (ν) representation surfaces. (a) and 3D (b) 2D surface based on the calculational Cij and corresponding polar plots obtained via projections through the origin and down the c axis, showing the positions of maximum and minimum modulus. (c) Axial and accompanying lateral directions that generate the positive νmax and νmin. Blue arrows represent the directions of loading, green and yellow arrows indicate contraction.

Figure 6.
The representative synchrotron powder diffraction patterns of MAF-7 at 0, 0.177, 0.460, 0.862, 1.454, 1.848, 2.244, 2.829, 3.313, and 3.755 GPa, respectively. (a) Pressure increases from the bottom (0 GPa) to the top (3.755 GPa); and (b) right shift of the characteristic peak (112) with increasing pressure.
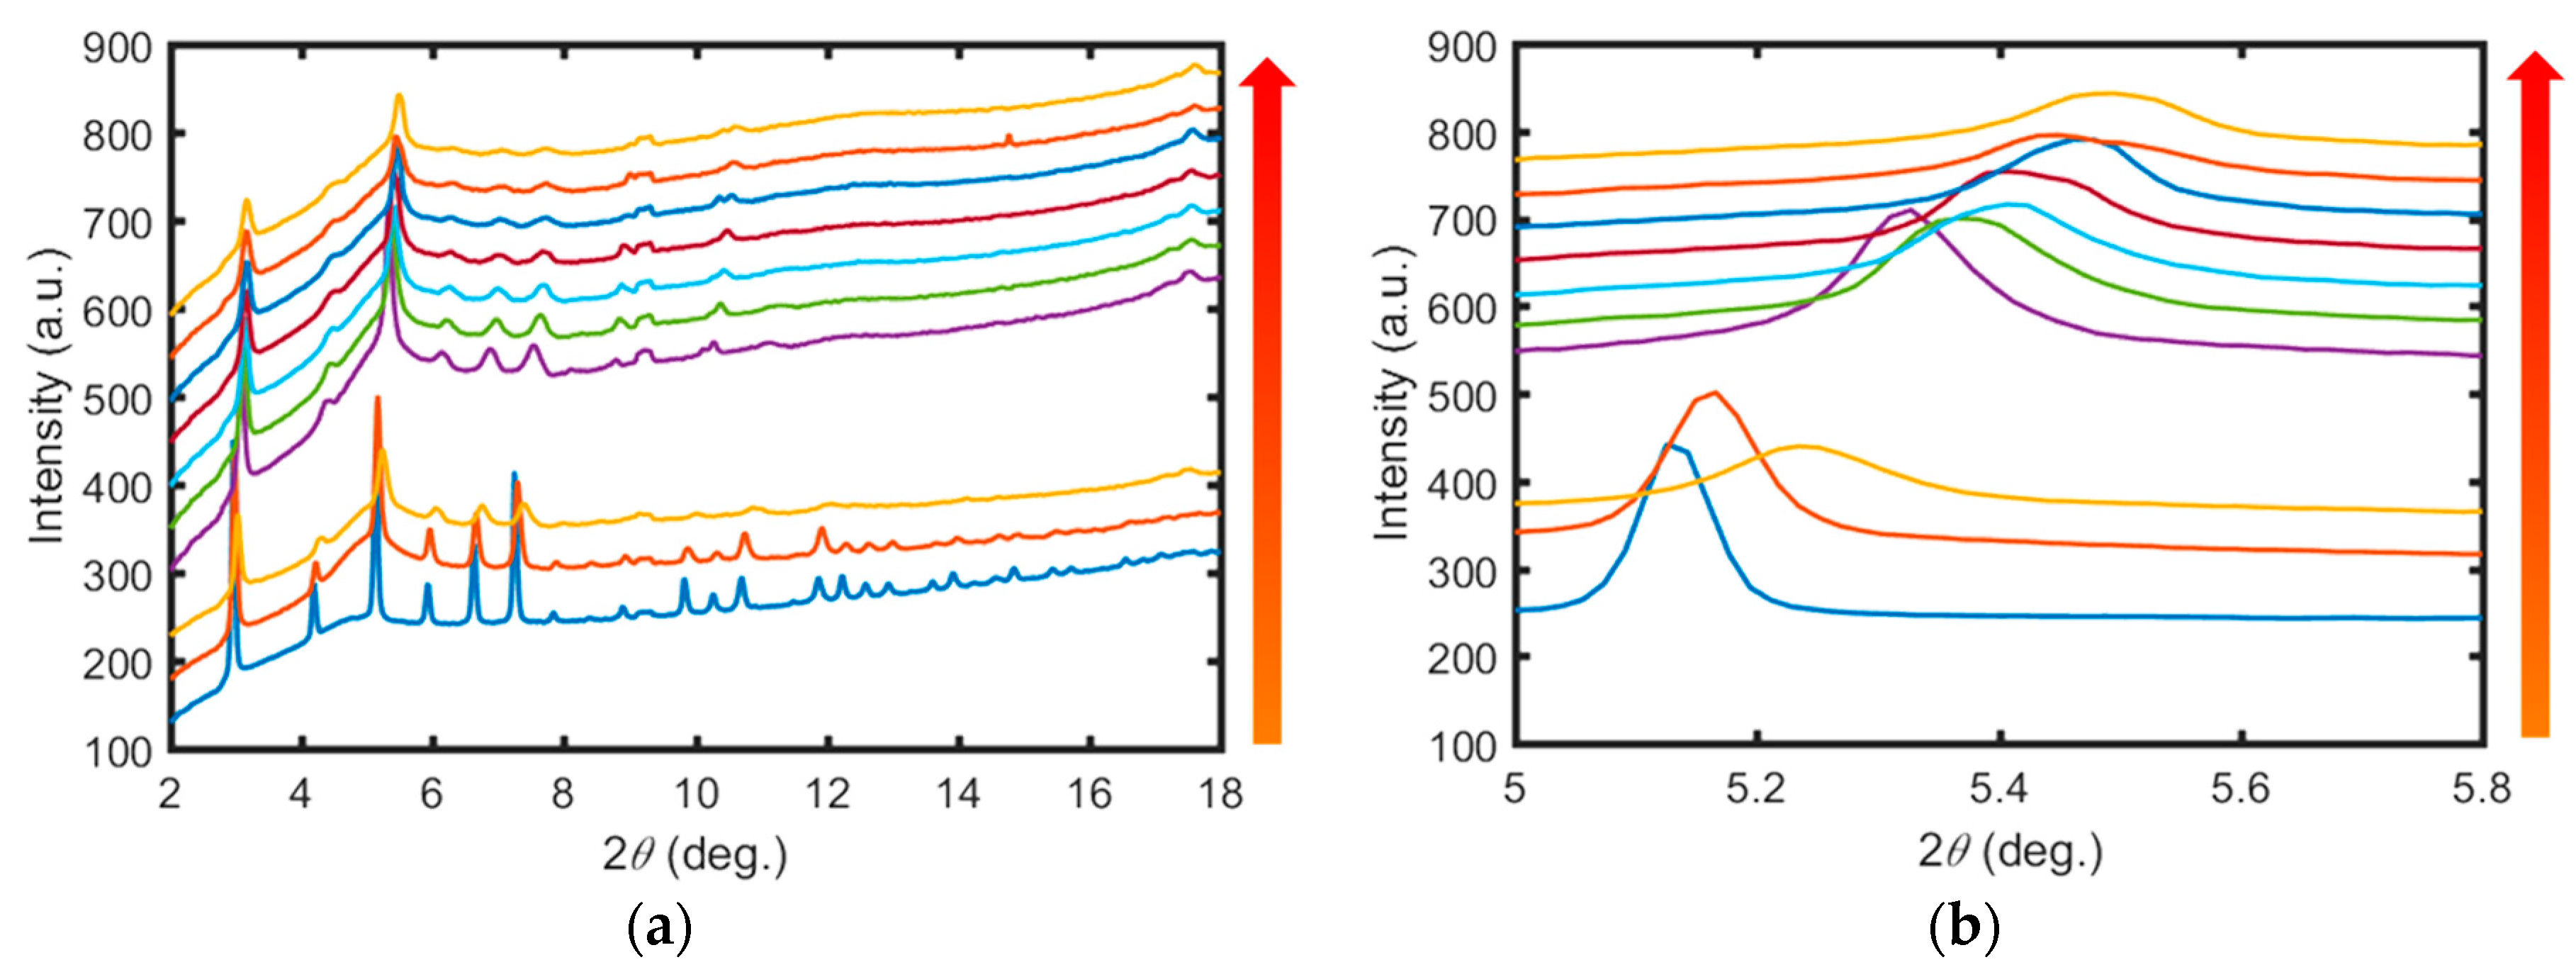
Figure 7.
Pressure-dependent unit cell volume (V, blue) and lattice parameter (a, red). The experimental data are shown with error bars, and the red and blue lines indicate the second-order Birch-Murnaghan fits derived from a PASCAL program [25].
Figure 7.
Pressure-dependent unit cell volume (V, blue) and lattice parameter (a, red). The experimental data are shown with error bars, and the red and blue lines indicate the second-order Birch-Murnaghan fits derived from a PASCAL program [25].

Table 1.
The elastic properties of MAF-7 and ZIF-8 extracted from DFT calculations.
| Elastic Properties | Framework | MAF-7 | ZIF-8 [15] |
|---|---|---|---|
| Stiffness coefficient, Cij (GPa) | C11 | 11.587 | 11.038 |
| C12 | 9.643 | 8.325 | |
| C44 | 1.635 | 0.943 | |
| Young’s modulus, E (GPa) | Emax | E(111) = 4.659 | E(100) = 3.879 |
| E(110) = 4.009 | E(110) = 2.953 | ||
| Emin | E(100) = 2.828 | E(111) = 2.736 | |
| Shear modulus, G (GPa) | Gmax | 1.64 | 1.36 |
| Gmin | 0.97 | 0.94 | |
| Poisson’s ratio, υ | υmax | = 0.64 | = 0.57 |
| υmin | = 0.23 | = 0.33 | |
| Anisotropy measure | Zener, A (=1 if isotropic) | 1.68 | 0.70 |
| Emax/Emin | 1.65 | 1.42 | |
| Bulk modulus K(GPa) | 10.29 | 9.23 |
© 2017 by the authors. Licensee MDPI, Basel, Switzerland. This article is an open access article distributed under the terms and conditions of the Creative Commons Attribution (CC BY) license (http://creativecommons.org/licenses/by/4.0/).
Share and Cite
MDPI and ACS Style
Gao, H.; Wei, W.; Dong, L.; Feng, G.; Jiang, X.; Wu, R.; Lin, Z.; Li, W. Enhanced Framework Rigidity of a Zeolitic Metal-Azolate via Ligand Substitution. Crystals 2017, 7, 99. https://doi.org/10.3390/cryst7040099
AMA Style
Gao H, Wei W, Dong L, Feng G, Jiang X, Wu R, Lin Z, Li W. Enhanced Framework Rigidity of a Zeolitic Metal-Azolate via Ligand Substitution. Crystals. 2017; 7(4):99. https://doi.org/10.3390/cryst7040099
Chicago/Turabian StyleGao, Hongqiang, Wenjuan Wei, Liyuan Dong, Guoqiang Feng, Xingxing Jiang, Rong Wu, Zheshuai Lin, and Wei Li. 2017. "Enhanced Framework Rigidity of a Zeolitic Metal-Azolate via Ligand Substitution" Crystals 7, no. 4: 99. https://doi.org/10.3390/cryst7040099
Note that from the first issue of 2016, this journal uses article numbers instead of page numbers. See further details here.