
Ultrafast Electron and Molecular Dynamics in Photoinduced and Electric-Field-Induced Neutral–Ionic Transitions

1
Department of Advanced Materials Science, University of Tokyo, Chiba 277-8561, Japan
2
AIST-UTokyo Advanced Operando-Measurement Technology Open Innovation Laboratory, National Institute of Advanced Industrial Science and Technology, Chiba 277-8568, Japan
*
Author to whom correspondence should be addressed.
Crystals 2017, 7(5), 132; https://doi.org/10.3390/cryst7050132
Submission received: 1 April 2017
/
Revised: 30 April 2017
/
Accepted: 8 May 2017
/
Published: 11 May 2017
(This article belongs to the Special Issue The Neutral–Ionic Phase Transition)
Abstract
:Mixed-stacked organic molecular compounds near the neutral–ionic phase boundary, represented by tetrathiafulvalene-p-chloranil (TTF-CA), show a unique phase transition from a paraelectric neutral (N) phase to a ferroelectric ionic (I) phase when subjected to decreasing temperature or applied pressure, which is called an NI transition. This NI transition can also be induced by photoirradiation, in which case it is known as a prototypical ‘photoinduced phase transition’. In this paper, we focus on the ultrafast electron and molecular dynamics in the transition between the N and I states induced by irradiation by a femtosecond laser pulse and a terahertz electric-field pulse in TTF-CA. In the first half of the paper, we review the photoinduced N-to-I transition in TTF-CA studied by femtosecond-pump-probe reflection spectroscopy. We show that in the early stage of the transition, collective charge transfers occur within 20 fs after the photoirradiation, and microscopic one-dimensional (1D) I domains are produced. These ultrafast I-domain formations are followed by molecular deformations and displacements, which play important roles in the stabilization of photogenerated I domains. In the photoinduced I-to-N transition, microscopic 1D N domains are also produced and stabilized by molecular deformations and displacements. However, the time characteristics of the photoinduced N-to-I and I-to-N transitions in the picosecond time domain are considerably different from each other. In the second half of this paper, we review two phenomena induced by a strong terahertz electric-field pulse in TTF-CA: the modulation of a ferroelectric polarization in the I phase and the generation of a large macroscopic polarization in the N phase.
1. Introduction
The control of an electronic phase and related macroscopic properties by photoirradiation has recently attracted much attention [1]. This phenomenon is called a photoinduced phase transition (PIPT), and is important not only as a new phenomenon in the fields of solid-state physics and materials science, but also as a useful mechanism applicable to future optical switching and memory devices. When we aim to realize a PIPT in the subpicosecond time scale, promising targets are correlated electron materials, in which a photoexcited state causes a change in the surrounding electron (spin) systems via strong electron–electron (e–e) interactions and gives rise to a conversion to another electronic phase. In real materials, structural changes are sometimes produced through electron–lattice (e–l) or spin–lattice (s–l) interactions. Research on PIPTs occurring on an ultrafast time scale is based upon the development of femtosecond laser technology, in which the photon energy of a femtosecond laser pulse can be widely varied. A pump-probe optical spectroscopy using such a tuneable femtosecond laser system enables the measurement of transient changes in optical absorption or reflectivity spectra induced by photoirradiation, from which we can extract the electronic-state changes and the dynamics of electron, spin, and lattice degrees of freedom during and after the PIPT.
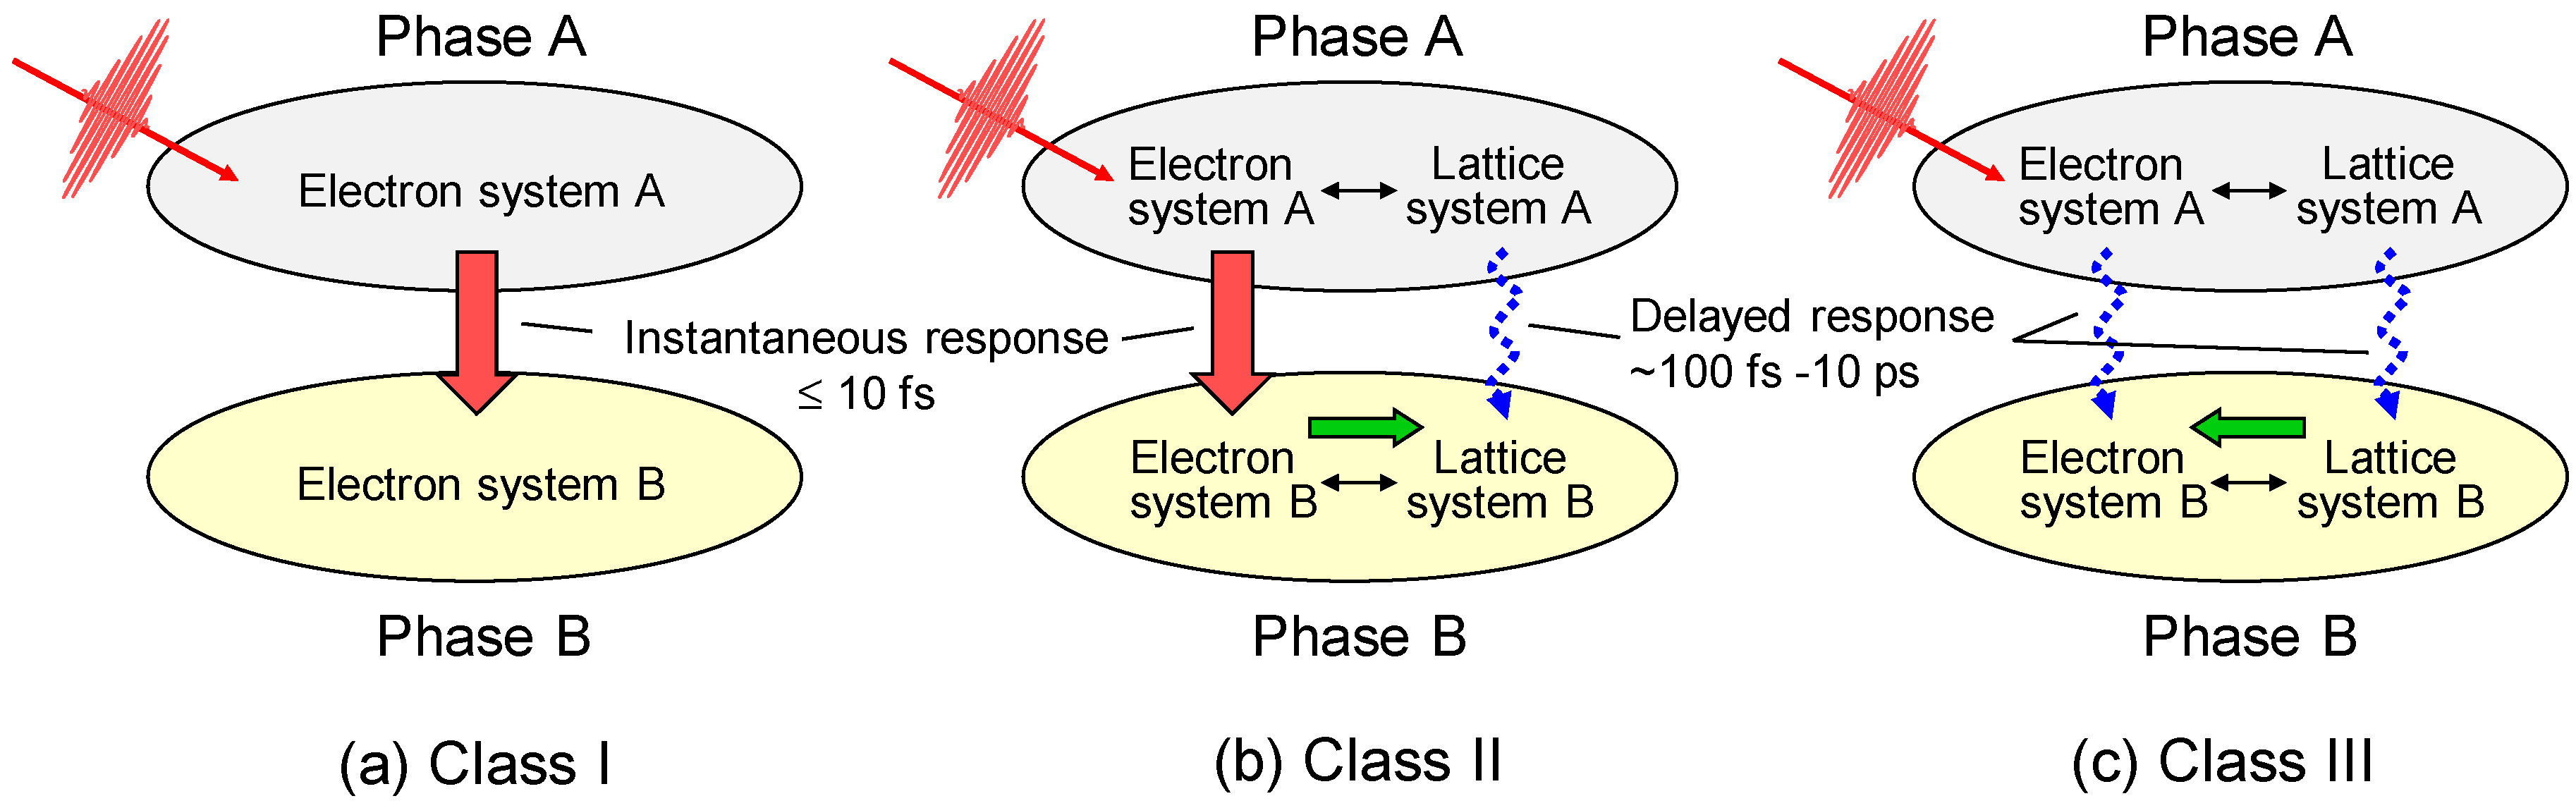
The PIPTs discovered thus far in correlated electron materials can be classified into three classes (I–III), as shown in Figure 1 [2,3]. In this classification scheme, we consider a PIPT from an original phase A with an electron system A and a lattice system A to another phase B with an electron system B and a lattice system B. These three classes of PIPTs are characterized as follows.
Class I: A PIPT in this class is purely electronic, without any structural changes. In this case, e–l and s–l interactions are negligibly small, and this transition is dominated by the change in electron itinerancy or localization. A typical example of this transition is a photoinduced Mott-insulator-to-metal transition as observed in one-dimensional (1D) Mott insulators of a bromine-bridged nickel-chain compound [Ni(chxn)2Br]Br2 (chxn: cyclohexanediamine) [4] and an organic molecular compound, ET-F2TCNQ (ET: bis-(ethylenedithio)-tetrathiafulvalene and F2TCNQ: difluorotetracyano-quinodimethane) [5,6], and two-dimensional (2D) Mott insulators of layered cuprates, Nd2CuO4 and La2CuO4 [7,8]. The time scale of this type of PIPT is considered to be determined by the electron transfer energy t. In the case that t is 0.1–0.5 eV, the time scale of the PIPT is 40–8 fs, that is, on the order of 10 fs.
Class II: A PIPT in this class is dominated by both the e–e interaction and e–l (or s–l) interactions. An initial photoexcited state gives rise to an instability of the electronic system A and converts the electron system A to a new electron system B. This process occurs rapidly, probably on the time scale of t. After that, the lattice system is changed from the original system A to the new system B through the e–l (or s–l) interaction, so that the electron system B is stabilized. The time scale for the change of the lattice system is determined by the frequencies of the specific phonon modes dominating the structural change, typically ranging from 100 fs to 10 ps. Some of PIPTs observed in correlated electron materials such as transition metal oxides and organic molecular compounds are classified into this category.
Class III: A PIPT in this class is dominated by the e–l (or s–l) interaction. The lattice system A is destabilized by photoexcited states through the e–l (or s–l) interaction, converting the lattice system A to the new lattice system B. In this case, the initially produced photoexcited states cannot directly change the electron system A. Following the change in the lattice system, the original electron system A might be changed to the new electron system B through the e–l (or s–l) interaction. That is, the photoinduced change of the electron system is determined by the phonon frequencies. Photoinduced structural phase transitions observed in various materials including some correlated electron materials are classified into this category.
Among the three classes of PIPTs, those in class II in particular show a variety of electron, spin, and lattice dynamics. A prototypical example of this category of PIPTs is a photoinduced transition between the neutral phase and the ionic phase observed in TTF-CA (tetrathiafluvalene-p-chloranil). TTF-CA is one of the most famous organic molecular compounds. At room temperature, it is a van der Waals neutral crystal. By lowering its temperature or applying pressure, a neutral-to-ionic (N-to-I) phase transition occurs [9,10]. In the I phase, TTF-CA exhibits dimerization of molecules and electronic ferroelectricity. As a result, the PIPT between the N and I phases in TTF-CA also shows exotic dynamical properties. The PIPT in TTF-CA was first reported as the photoinduced I-to-N transition in 1990 by Koshihara et al. [11]. Since that report, a number of experimental and theoretical studies about this PIPT have been reported [12,13,14,15,16,17,18,19,20,21,22,23,24,25,26,27,28,29,30,31,32,33,34,35,36,37,38,39,40]. In this paper, we review our studies of the photoinduced transitions from the N phase to the I phase (the NI transition) and from the I phase to the N phase (IN transition) in TTF-CA based upon femtosecond-pump-probe spectroscopy. In addition, as a new topic in the field of PIPTs, we report our recent study using a strong terahertz-electric-field pulse, that is, the modulation and generation of ferroelectric polarization by a strong terahertz-electric-field pulse in TTF-CA [41,42].
This review article is constructed as follows. In Section 2, we describe the fundamental electronic properties of TTF-CA. In Section 3, we briefly introduce the methods of femtosecond-pump-probe spectroscopy to investigate dynamical aspects of photoinduced NI and IN transitions and of terahertz-electric-field-induced polarization changes. In Section 4 and Section 5, we review photoinduced NI and IN transitions, respectively. In Section 6 and Section 7, respectively, we report the control of the ferroelectric polarization in the I phase and the generation of the ferroelectric polarization in the N phase by a strong terahertz-electric-field pulse. This review is summarized in Section 8.
2. Fundamental Properties of TTF-CA
2.1. Neutral-to-Ionic Phase Transition
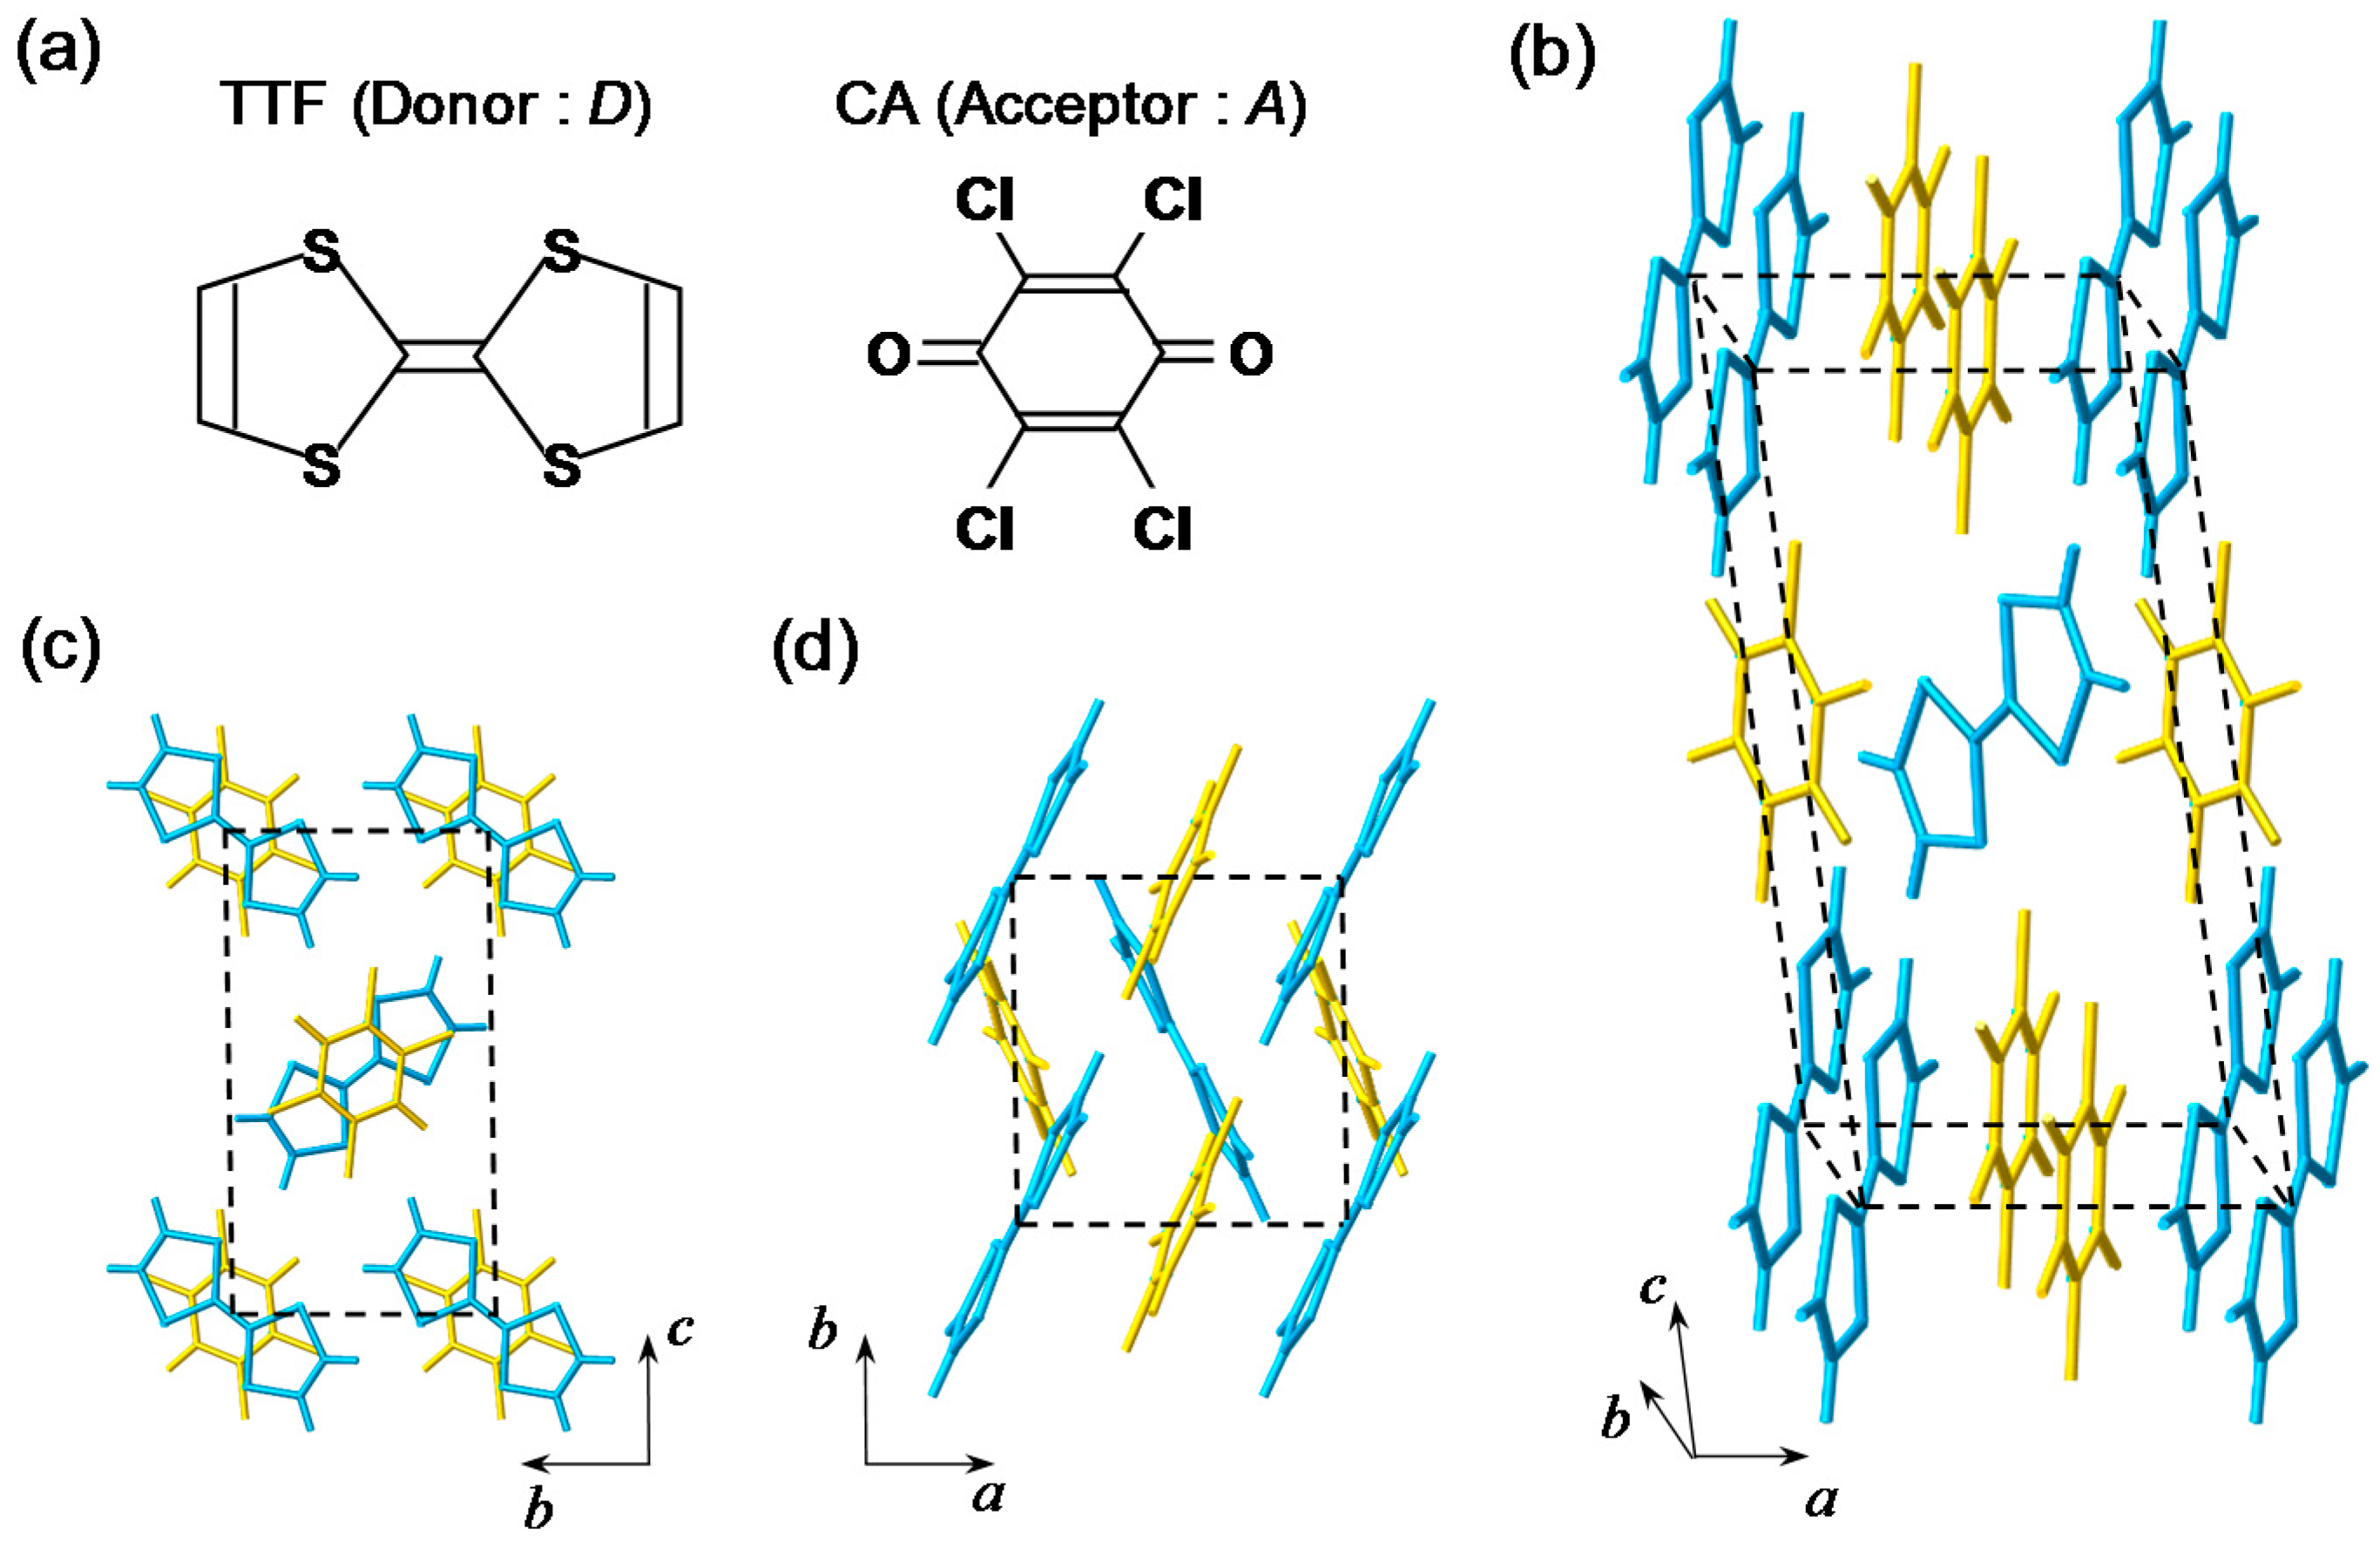
TTF-CA is a mixed-stack organic molecular compound, which is composed of donor (D) TTF molecules and acceptor (A) CA molecules. The molecular structures of TTF and CA are presented in Figure 2a. Figure 2b–d show the crystal structure of TTF-CA. TTF and CA molecules stack along the a axis, forming a quasi-one-dimensional (1D) electronic structure. At room temperature, TTF-CA is a neutral van der Waals crystal, as shown in Figure 3a. However, upon lowering its temperature to Tc = 81 K, it undergoes a phase transition to an ionic crystal via collective electron transfers from TTF to CA molecules (Figure 3b) [10]. This phase transition is called an N-to-I phase transition or simply an NI transition. The I phase is stabilized by the energy gain resulting from the long-range Coulomb attractive interaction, that is, the Madelung potential. Simply put, the lattice contraction caused by lowering temperature increases the Madelung potential, which converts TTF-CA from the N phase to the I phase. The electronic state of TTF-CA is characterized by the degree of charge transfer (CT) ρ from A to D molecules [43] and expressed as […D+ρA−ρD+ρA−ρD+ρA−ρD+ρA−ρ…]. The value of ρ is not equal to 0 or 1, but equal to approximately 0.3 and 0.6 in the N and I phases, respectively [44,45,46,47]. Such partial values of ρ are caused by the hybridization of the neutral and ionic states through overlapping of the molecular orbitals of D and A molecules along the a axis. In this review, however, we sometimes use the more simple expressions, […D0A0D0A0D0A0D0A0…] and […D+A−D+A−D+A−D+A−…], to show the N state and the I state, respectively. It is because such expressions enable intuitive understandings of the NI transition and related photoinduced phenomena. In the I phase, each molecule has a spin (S = 1/2). As a result, DA molecules are dimerized because of the spin-Peierls–like instability, as shown by the ovals in Figure 3b [48,49,50]. That is, in TTF-CA, the N state with regular molecular stacks and the I state with dimerized molecular stacks are nearly degenerate. These two states can be switched by photoirradiation.
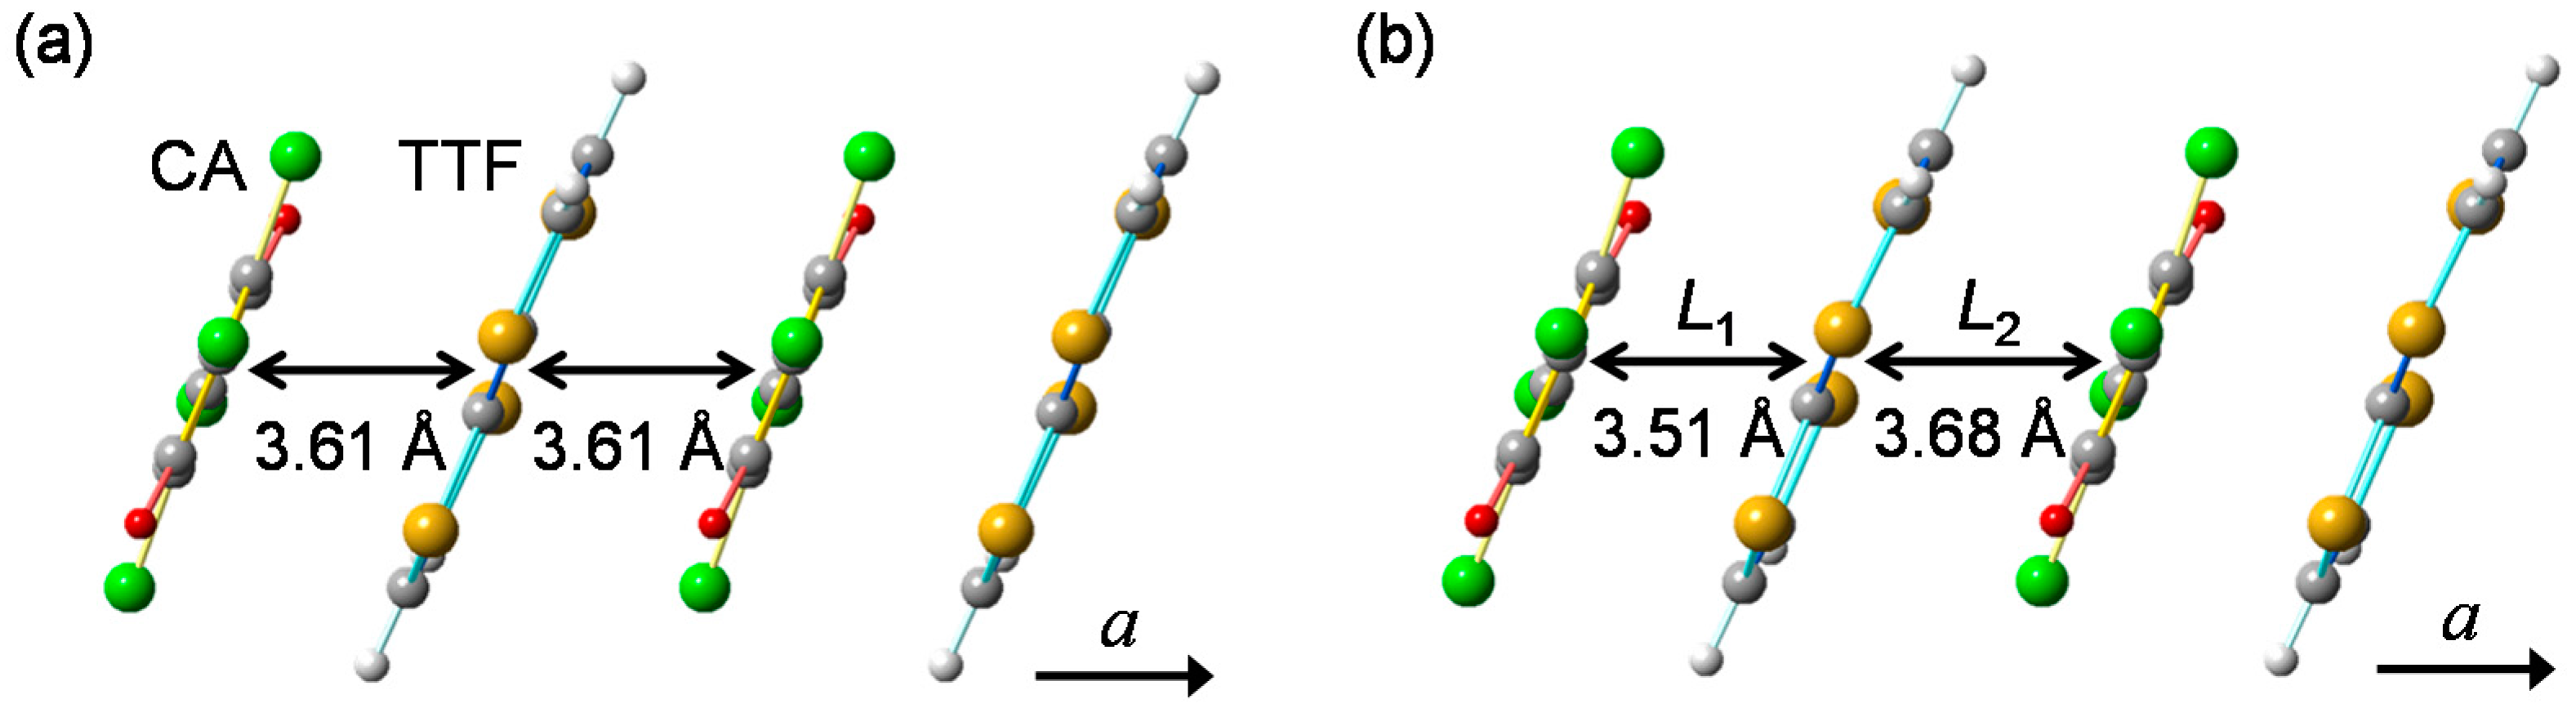
In Figure 4a,b, we show the molecular stacking viewed along the direction perpendicular to the a axis at 90 K in the N phase and at 40 K in the I phase, respectively [41,49]. At 40 K, the difference between the interdimer distance (L2) and the intradimer distance (L1) is approximately 0.17 Å, and the displacement of each D(A) molecule along the a(−a) direction, /2, is approximately 0.085 Å. This value of is approximately 2.4% of the averaged molecular distance (3.60 Å). Thus, the molecular dimerization in the I phase is large, and plays important roles on the photoinduced and electric-field-induced charge and molecular dynamics in TTF-CA.
2.2. Optical Reflectivity Spectra
In this subsection, we review the steady-state optical spectra in TTF-CA, which sensitively reflect the changes in the degree of charge transfer ρ across the NI transition. In several previous studies of PIPTs in TTF-CA, photoinduced changes in the reflectivity spectra were indeed used as probes of both photoinduced NI and IN transitions.
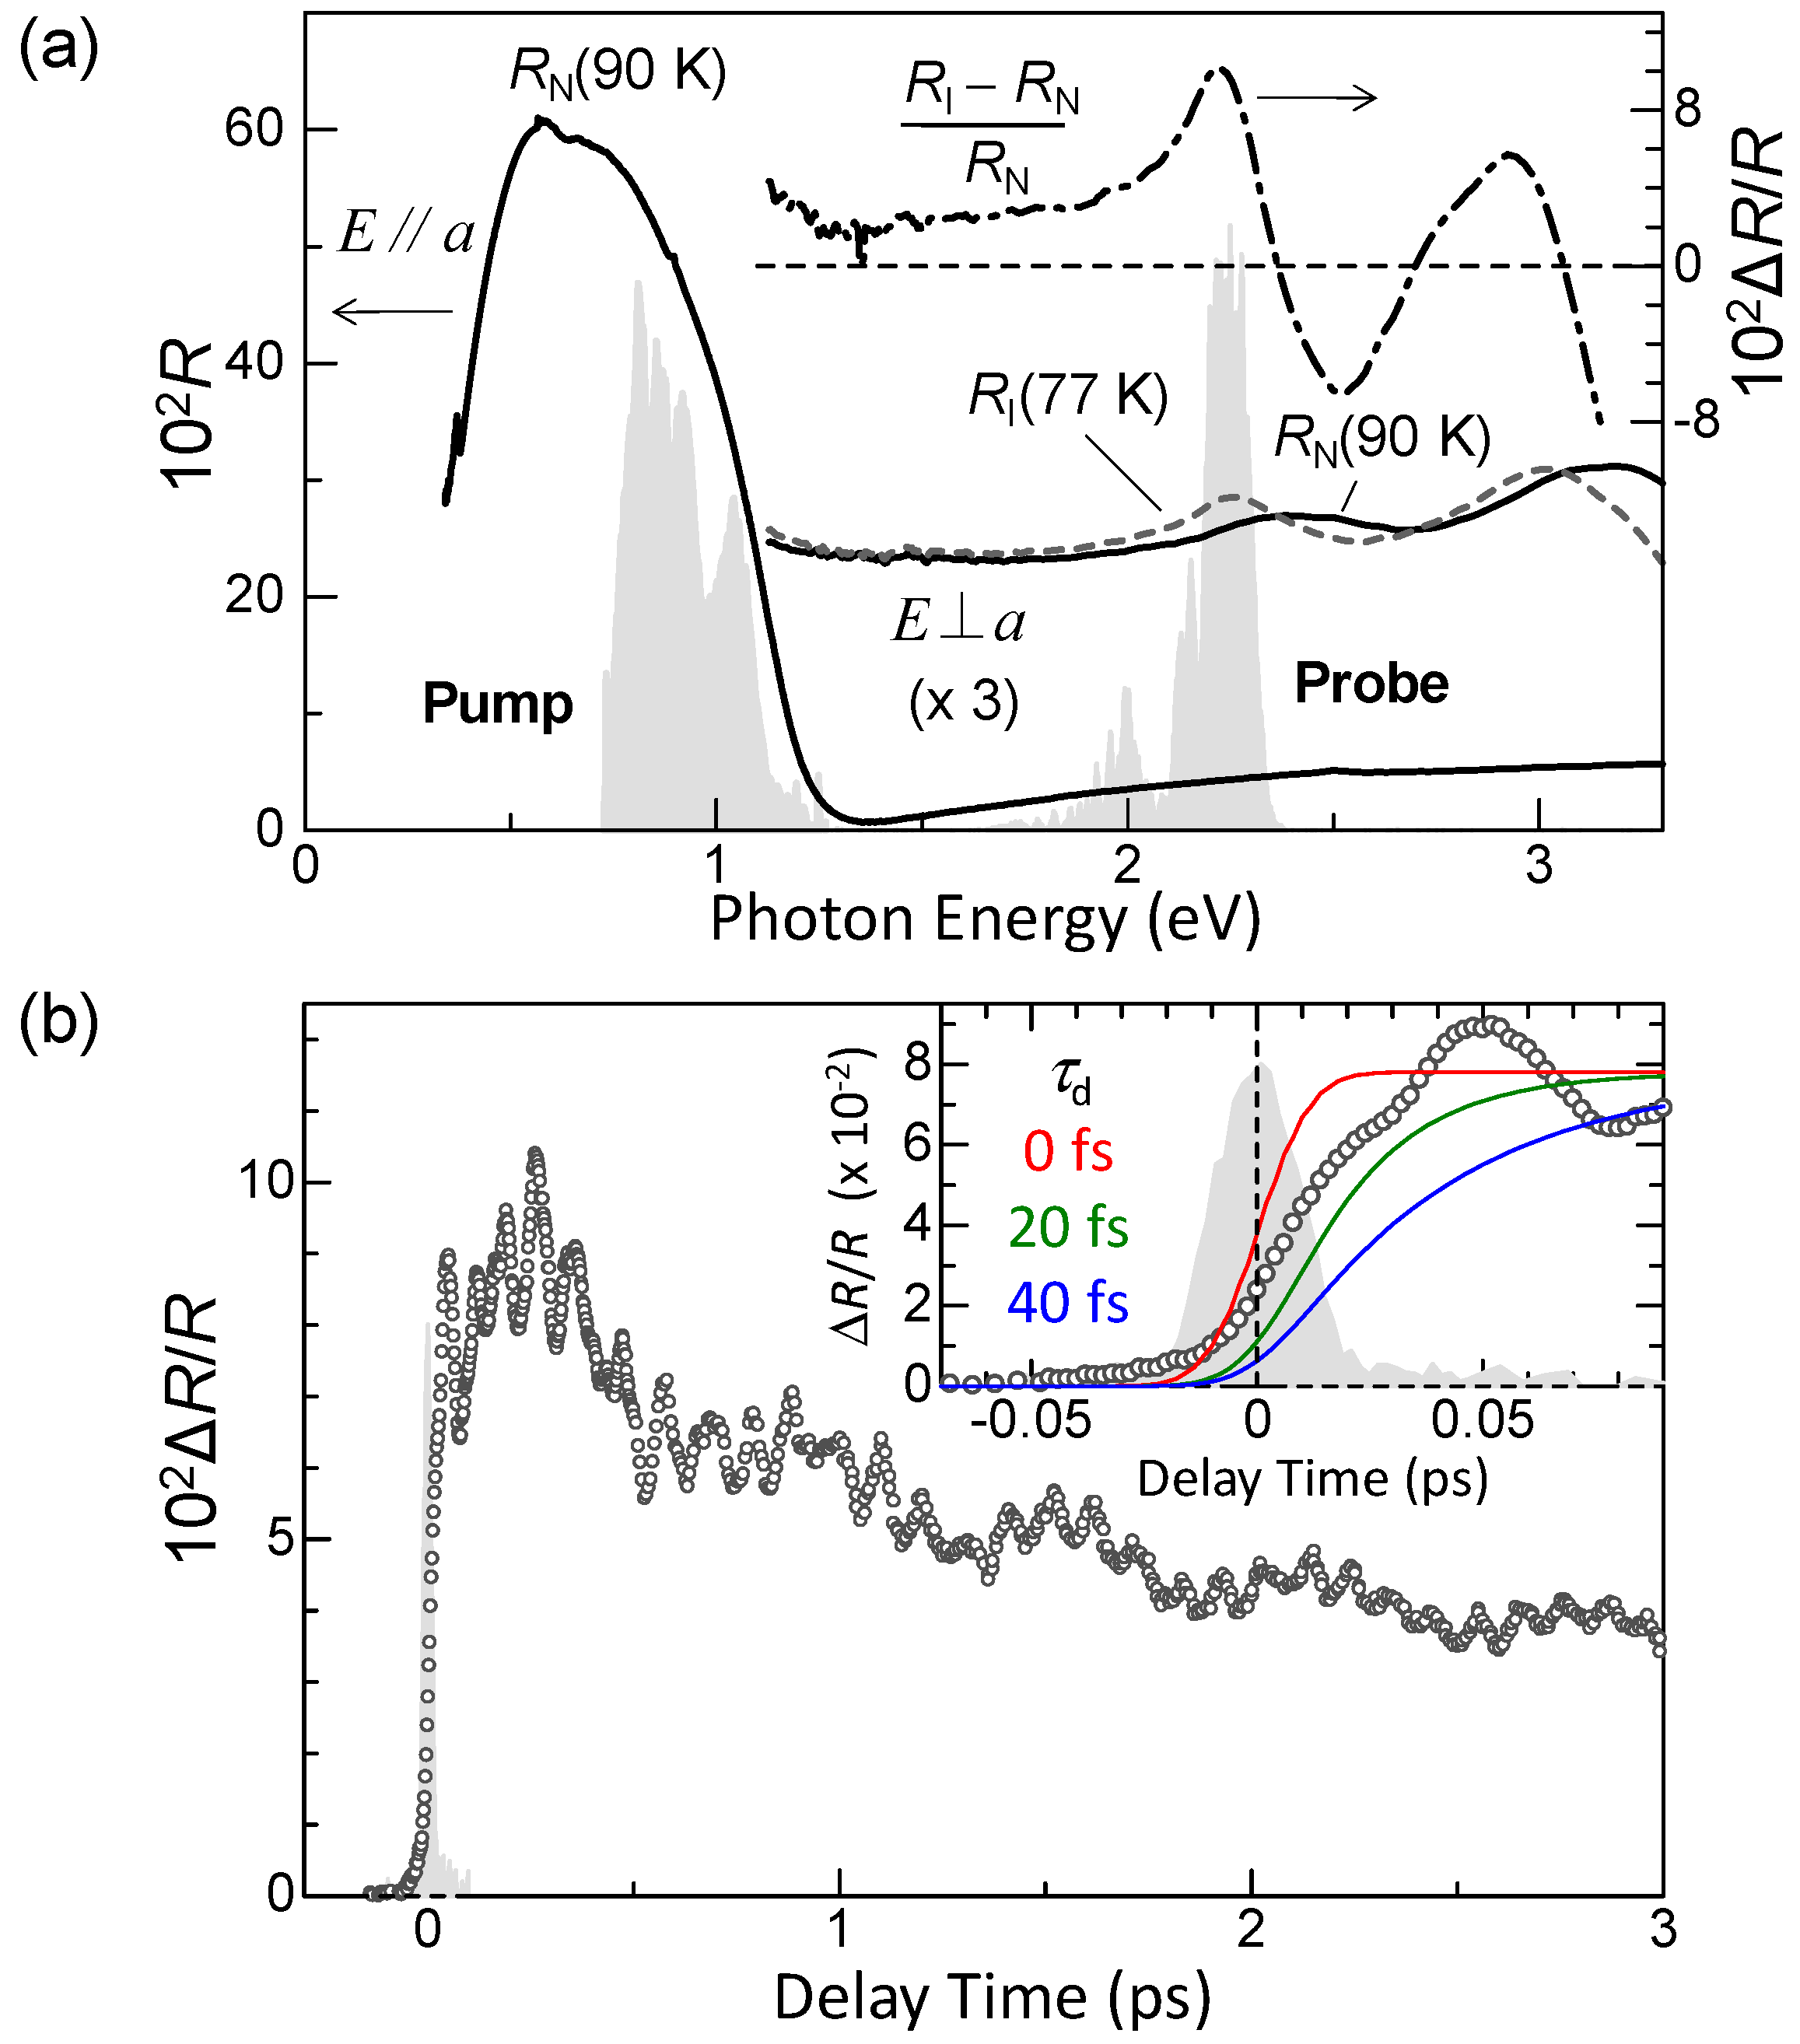
Figure 5a shows the polarized reflectivity spectra in TTF-CA with an electric field of light E parallel (//) and perpendicular (⊥) to the molecular stacking axis a [19]. The red and blue lines show the reflectivity in the N phase at 90 K and in the I phase at 77 K, respectively. The prominent peak around 0.65 eV observed for E//a is attributed to the CT transition between D and A molecules along the a axis [9,10,51,52]. It corresponds to the transition that generates an ionic (D+A−) pair in the N phase or a neutral (D0A0) pair in the I phase. The peaks at 2–2.5 eV and at approximately 3 eV observed for E⊥a are assigned to the intramolecular (IM) transitions of TTF molecules. We show the schematics of CT and IM transitions in Figure 5b,c. The IM transition at approximately 2.2 eV is a transition of a TTF cation, indicated by the blue curved arrow in Figure 5c. It is weakly observed even in the N phase because of the hybridization of neutral and ionic states. The higher-energy peak at approximately 3 eV is another IM transition of TTF from the highest occupied molecular orbital (HOMO) to the lowest unoccupied molecular orbital (LUMO), indicated by the green curved arrows in the Figure 5b,c. As shown in Figure 5a, the spectral shapes of these CT and IM transitions are changed between the N and I phases; the IM transition bands shift to the lower energy and the CT transition band shift to the higher energy with increasing ρ. Therefore, we can use the reflectivity changes in these two energy regions to probe the transient changes in ρ by a photoirradiation and by terahertz-pulse excitation.
2.3. Electronic Ferroelectricity
When a DA stack is dimerized in the I phase, the inversion symmetry is lost within individual stacks and each stack should have a dipole moment. X-ray and neutron diffraction studies on TTF-CA have revealed that the dimeric molecular displacements are three-dimensionally ordered in the I phase [49]. This means that macroscopic polarization can be generated in the I phase.
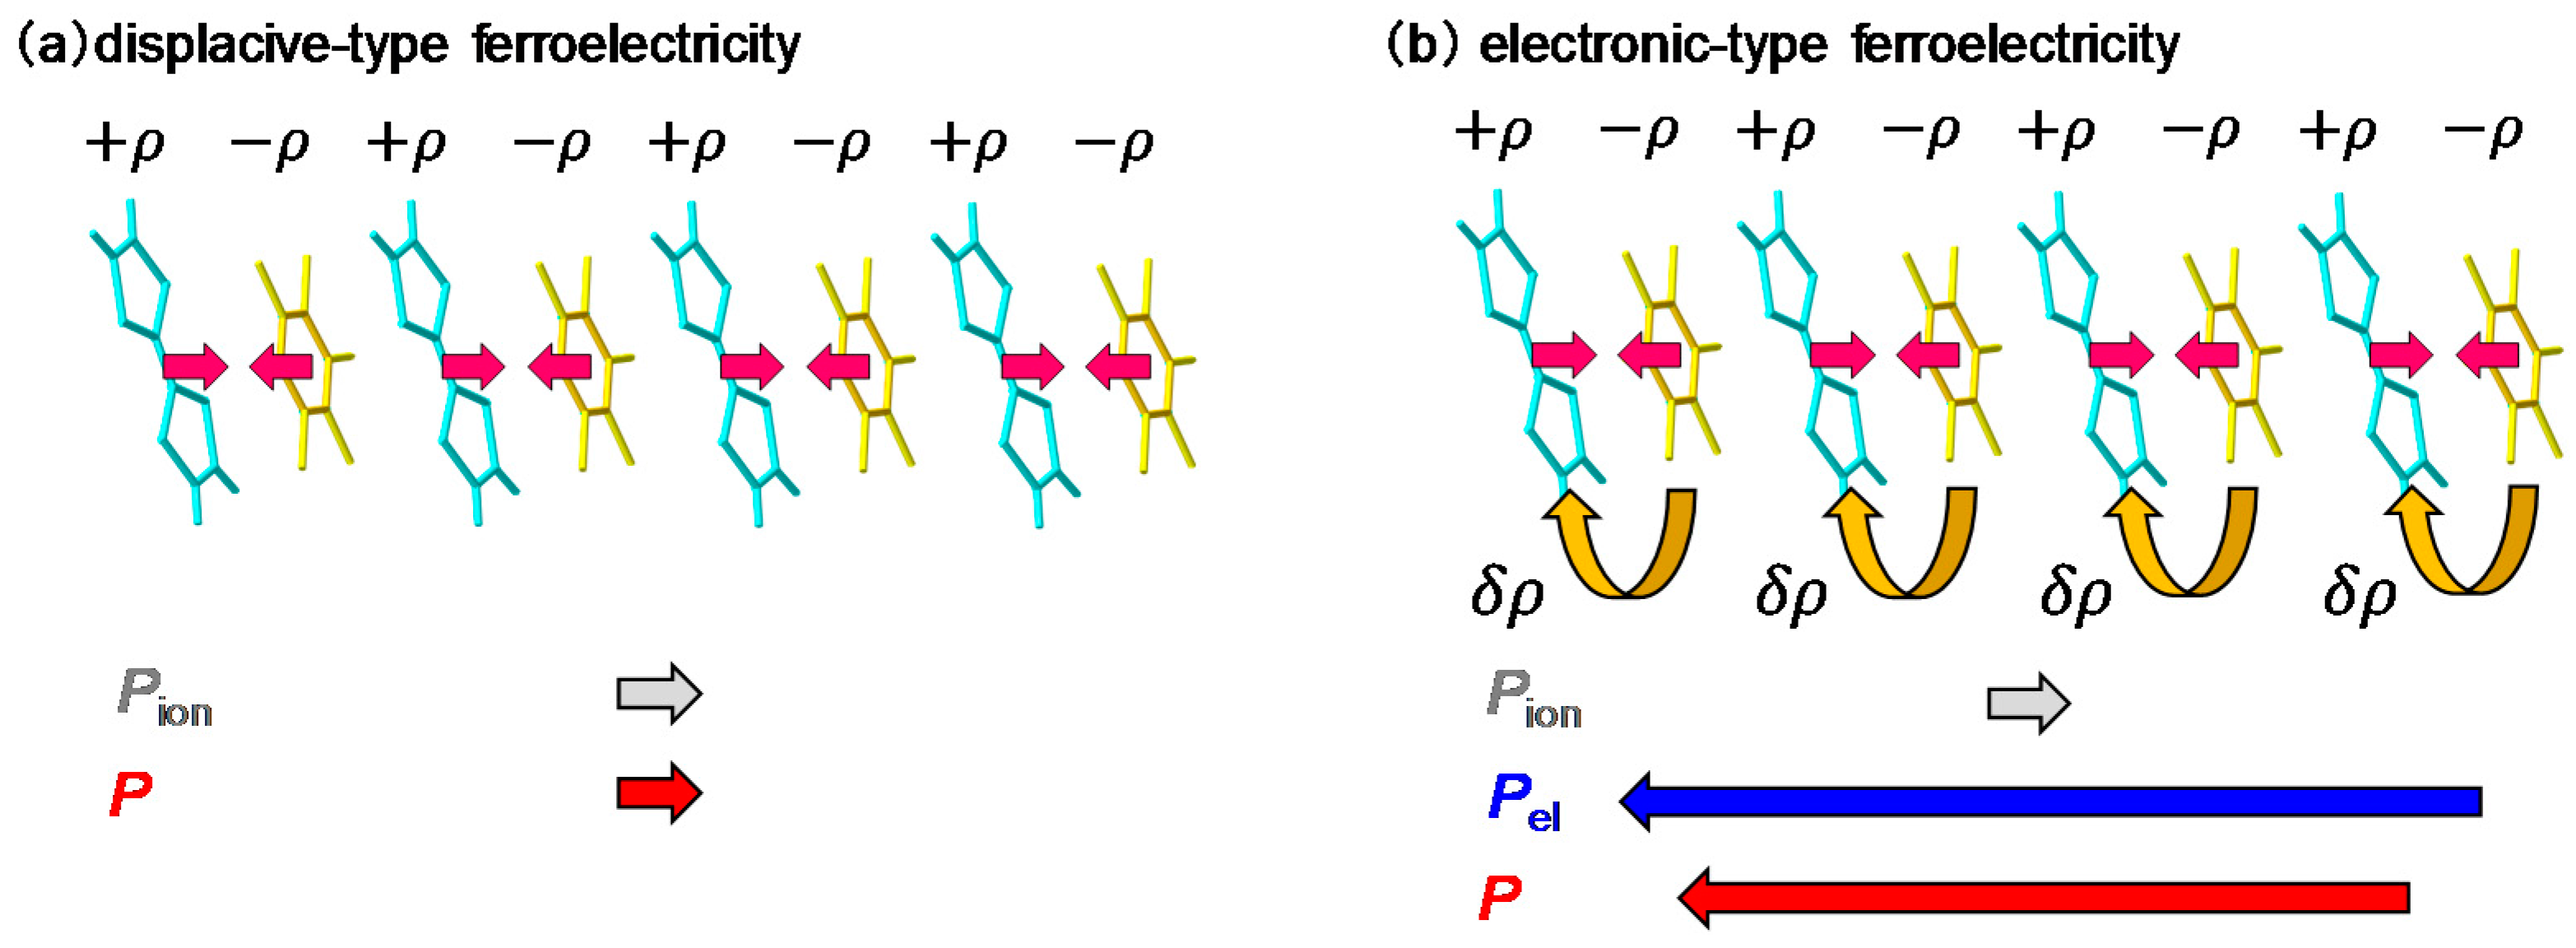
When we consider a displacive-type ferroelectricity in TTF-CA, dimeric molecular displacements of the ionic molecules, D+ and A−, in opposite directions produce a ferroelectric polarization along the a axis, as indicated by the grey arrows in Figure 6a. However, detailed X-ray studies and theoretical simulations have recently revealed that the direction of the net polarization is opposite to that of [53,54,55]. This indicates that the polarization originates not from the displacements of ionic molecules (), but from the additional charge-transfer processes with the magnitude of (~0.2) within each dimer, as shown by the curved arrows in Figure 6b. It is natural to consider that this additional charge transfer (~0.2) is induced at the NI transition. The polarization due to these charge-transfer processes is denoted by . This type of ferroelectricity is called electronic ferroelectricity, since the polarization is dominated by changes of electron transfers or electron redistributions [56]. The magnitude of the polarization is very large, reaching 6.3 μC/cm2, which is 20 times as large as that estimated by the point charge model [53]. A molecular compound, α-ET2I3 [57,58], and a transition metal oxide, LuFe2O4 [59], are also known to show electronic ferroelectricity. Therefore, in TTF-CA, we can expect that the amplitude of the polarization P could be modulated in the subpicosecond time scale by a terahertz-electric-field pulse via intermolecular charge transfers.
2.4. Imaging of Ferroelectric Domains
In the I phase of TTF-CA, second-harmonic generation (SHG) was observed [16,41,42]. This suggests that ferroelectric polarization is indeed formed on a macroscopic scale. However, to study the changes in the polarization as well as in the electron and lattice systems induced by a photoirradiation and by a terahertz-electric-field pulse, it is fundamentally important to know the size and distribution of ferroelectric domains in the I phase in an as-grown single crystal.
Several methods are known to visualize ferroelectric domains in the whole area of a millimetre-size crystal. The most popular method is to use an SHG interference microscope [60]. In this method, ferroelectric domains of a sample can be visualized using the interference of an SH light emitted from the sample with that from a reference in a transmission configuration. However, this method cannot be applied to TTF-CA. A single crystal of TTF-CA is thicker than ~100 μm and the transmittance is almost zero in the near-infrared (IR) and visible regions, such that it is difficult to detect SHG in a transmission configuration. To perform domain imaging in a reflection configuration, Kishida, H. et al. adopted the electro-reflectance (ER) spectroscopy [61]. In this method, two electrodes were put on both sides of a crystal (the bc plane) and the reflectivity changes under the presence of a quasi-static electric field were measured on the ab plane, as shown in Figure 7a. When a polarization P is parallel (antiparallel) to the applied electric field, P is increased (decreased). If the change in P causes a change in reflectivity (R), the direction of P can be determined from the electric-field-induced R change (ΔR). By measuring the spatial distribution of ΔR with microscopic spectroscopy, we can construct ferroelectric domain images over a whole crystal.
When we apply the ER method to TTF-CA, it is effective to measure the electric-field-induced reflectivity changes ΔR at which a value of ΔR depends sensitively on the ρ value, since the ρ value should directly reflect the magnitude of the polarization P, as mentioned in the previous subsection. In our study, we selected the IM transition of TTF. In Figure 7b, we show the polarized reflectivity spectra in the IM transition region of TTF for E⊥a at 90 K in the N phase, and at 77 K and 4 K in the I phase. From the results of the IR molecular vibrational spectroscopy, ρ is estimated to be 0.58 at 4 K and 0.53 at 77 K in the I phase, and 0.32 at 90 K in the N phase [47]. These IM transition bands shift to the lower energy with increasing ρ, as mentioned above. Panel (c) in the same figure indicates the differential reflectivity spectrum between 4 K and 77 K, [RI(4 K) − RI(77 K)]/RI(77 K). This spectrum corresponds to the reflectivity change when ρ is increased by 0.05 at 77 K.
In the ER measurements, an electric field F with a frequency of approximately 1 kHz is applied along the a axis, and the difference ΔR in the reflectivity R for F parallel to a (F//a) and F antiparallel to a (F//−a) were measured with a lock-in technique. Such a difference ΔR appears only in a sample without inversion symmetry. In Figure 7d, we show the spectrum of the reflectivity change ΔR/R, the spectral shape of which is in good agreement with the [RI(4 K) − RI(77 K)]/RI(77 K) spectrum shown in Figure 7c, indicating that ρ is changed by the electric field F. ΔR/R is proportional to F up to F ~ 1 kV/cm. This means that the reflectivity change is a kind of electro-optic effect and is attributed to second-order optical nonlinearity in a broad sense. By comparing the magnitude of ΔR/R and [RI(4 K) − RI(77 K)]/RI(77 K), we evaluated the change in ρ to be approximately 10−4 at 1 kV/cm. The result in Figure 7d shows that ρ is increased by the electric field, suggesting that F is parallel to P. When F is antiparallel to P, ρ should be decreased. Such a feature can be used for the polarization imaging. It should be noted that TTF-CA had been considered a displacive-type ferroelectric when this study was carried out. Therefore, in a paper on the results of this study [61], it was reported that the increase (decrease) of ρ induces the increase (decrease) of Pion.
We measured the positional dependence of ΔR/R at 3.5 eV and at 77 K using an optical microscope. In this measurement, we consider that the ab plane of the crystal, of size 400 × 400 μm, consists of 225 square pieces of size 27 × 27 μm and recorded the value of ΔR/R in each square. In most crystals we measured, the sign of ΔR/R changes depending on the position. A typical resulting polarization image is shown in Figure 7e as a contour map. In this plot, we assumed that P is proportional to ΔR/R and applied a spline interpolation to the ΔR/R data. Two kinds of domains with opposite directions of the polarizations, P//a and P//–a, coexist as indicated by the red and blue regions denoted by IA and IB, respectively. From the measurements of several samples, it was revealed that a typical domain size is 200 × 200 μm or larger. The boundary between the red and blue regions corresponds to a domain wall, which does not move when F is lower than 1 kV/cm. When F exceeds 1 kV/cm, the domain wall starts to move. This electric field is a coercive field at 77 K. According to the result of the P–E characteristic, the coercive field is ~5 kV/cm at 50 K [53]. This indicates that the coercive field increases with decreasing temperature.
3. Time-Resolved Laser Spectroscopy
3.1. Femtosecond-Pump–Probe Spectroscopy and Necessary Time Resolution
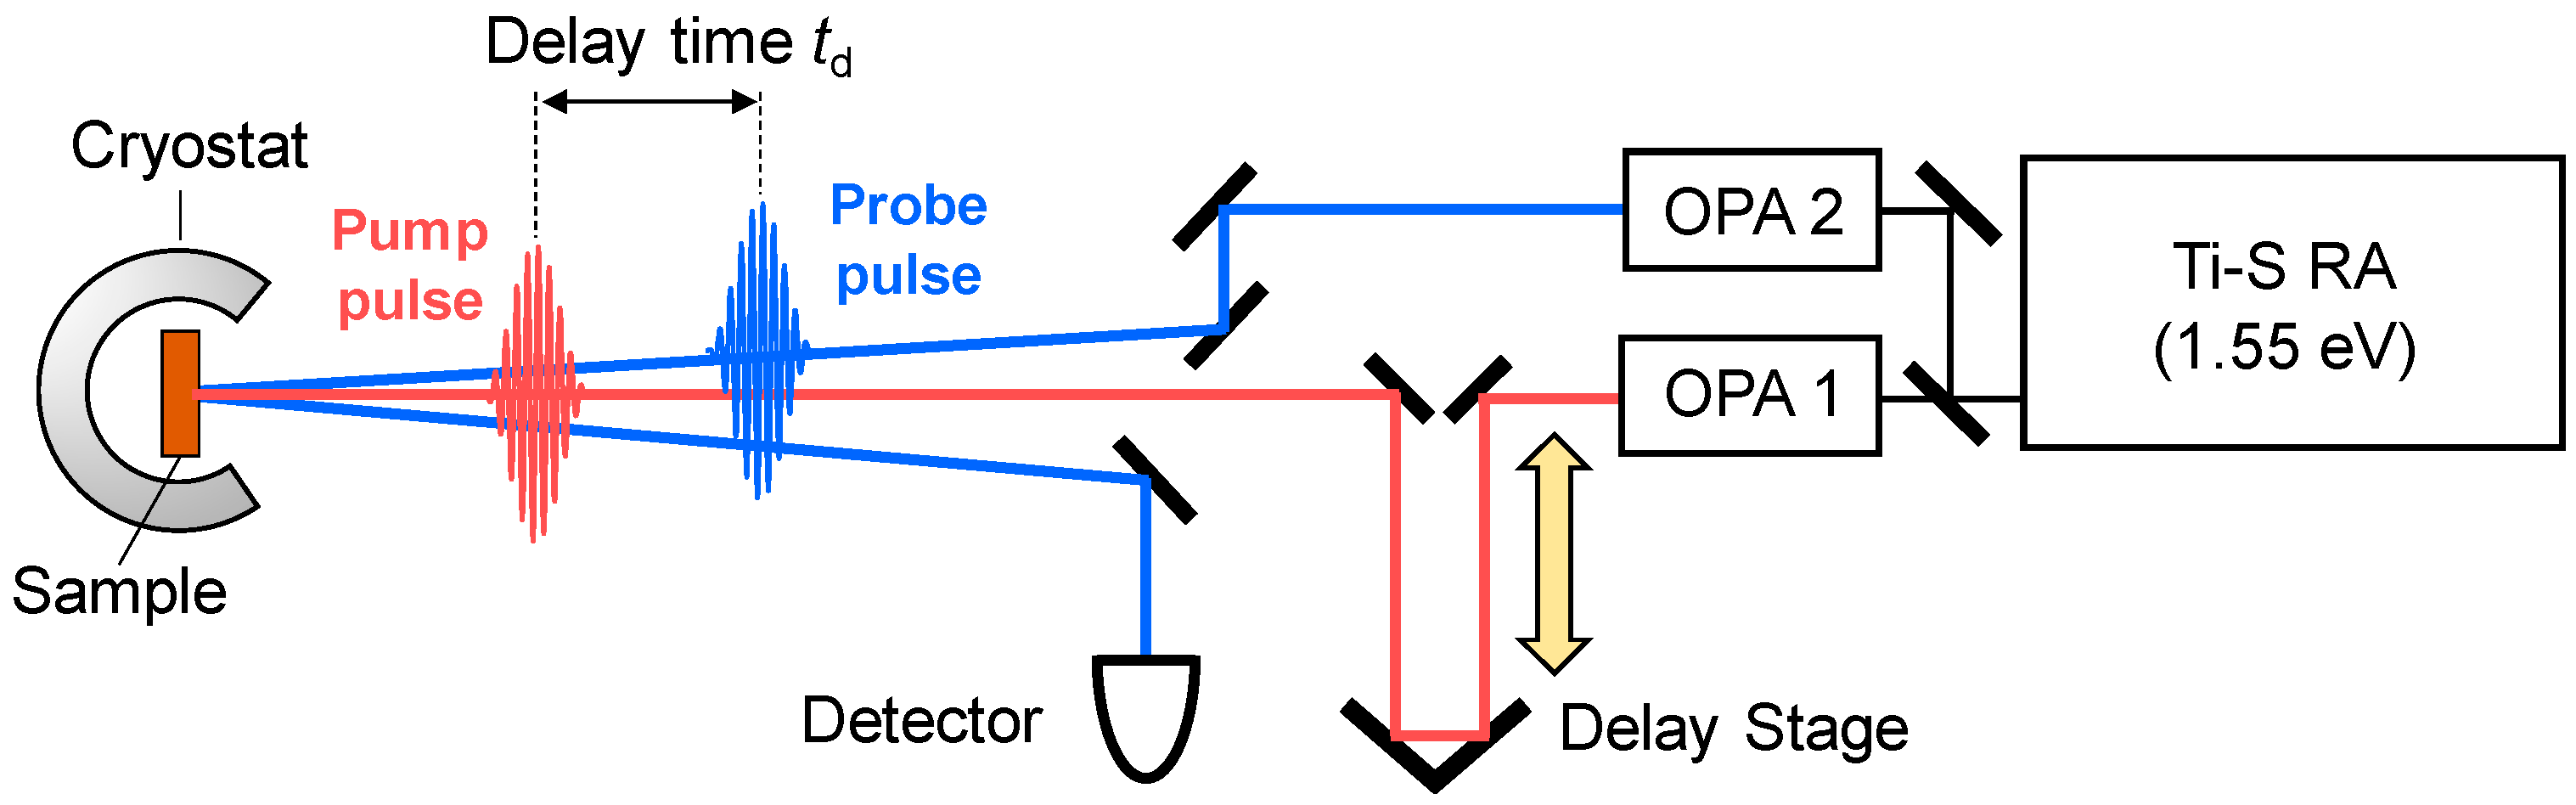
In order to observe a photoinduced transition occurring on an ultrafast time scale, femotosecond (fs) pump-probe optical spectroscopy is a most effective method. In this method, a pump pulse and a probe pulse, the temporal widths of which are ~10–200 fs, are used to excite a solid and to probe its electronic-state changes, respectively. A schematic of this method is shown in Figure 8. In the figure, we show the reflection configuration, in which the change in optical reflectivity of a probe light induced by a pump light is detected. We control the delay time td of the probe pulse relative to the pump pulse by changing the path length of the pump pulse using a delay stage, and measure the time characteristics of the reflectivity changes.
To elucidate photoinduced changes in electronic structures, it is fundamentally important to measure transient changes of reflectivity or absorption spectra over a wide photon-energy region. For this purpose, a Ti-sapphire regenerative amplifier (RA) is widely used as a main laser source. Typical values of the temporal width, photon energy, and repetition rate of a Ti-sapphire RA are 130 fs, 1.55 eV, and 1 kHz, respectively. The output of the RA is divided into two beams, which are used as excitation sources of two optical parametric amplifiers (OPAs). An OPA can convert an incident femtosecond pulse with 1.55 eV from the RA to a pulse with almost the same temporal width and various photon energies (~0.5–1.05 eV) via an optical parametric effect, which is a kind of second-order nonlinear optical effect. Using the output pulses of the two OPAs and further frequency conversions of those pulses by several other kinds of second-order nonlinear optical effects, we can obtain femtosecond laser pulses with a photon energy from 0.1 to 4 eV. The time resolution is determined by a cross-correlation of the pump and probe pulses. In the case in which the pump and probe pulses are Gaussian with a temporal width of 130 fs, the time resolution is approximately 180 fs.
Throughout this review article, the excitation photon density xph is defined as the averaged photon density per pump pulse absorbed within its absorption depth lp (the inverse of the absorption coefficient). xph is evaluated from the equation , in which and are the photon density per unit area and the reflection loss of the pump light, respectively.
Here, we briefly discuss the time resolution necessary to precisely detect photoinduced changes in electronic states, intramolecular deformations, and molecular displacements in organic molecular compounds, respectively. It is reasonable to consider that the time scale of electron dynamics would be dominated by the electron transfer energy t. In organic molecular compounds, t is typically 0.1–0.2 eV, which corresponds to a characteristic time of 40–20 fs. Molecular deformations occur on the time scale of intramolecular vibrations. Their frequencies range from 100 to 1000 cm−1 and their characteristic times range from 300 to 30 fs. In contrast, the frequencies of molecular displacements or, equivalently, the frequencies of so-called lattice modes range from 20 to 100 cm−1 and their characteristic times range from 1.5 ps to 300 fs. Taking these values into consideration, the time resolution of 180 fs, which is obtained in a typical Ti-sapphire RA system, is insufficient to detect electron and molecular dynamics, and a time resolution equal to or better than 20 fs should be necessary. To obtain an ultrashort laser pulse with a temporal width shorter than 15 fs, a noncollinear OPA (NOPA) is sometimes used, in which the temporal width of a pulse can be decreased to 10 fs or shorter. However, such an ultrashort laser pulse has a large spectral width because of the uncertainty relation, such that the spectral resolution becomes worse. In our study, for broadband spectroscopy from 0.1 to 4 eV, we used a pump-probe reflection spectroscopy system with a time resolution of ~180 fs. In cases in which a higher time resolution was necessary, we used a pump–probe system consisting of two NOPAs, in which the temporal width of the pump and probe pulses was approximately 15 fs and the time resolution was approximately 20 fs.
3.2. Terahertz-Pump Optical-Probe Spectroscopy
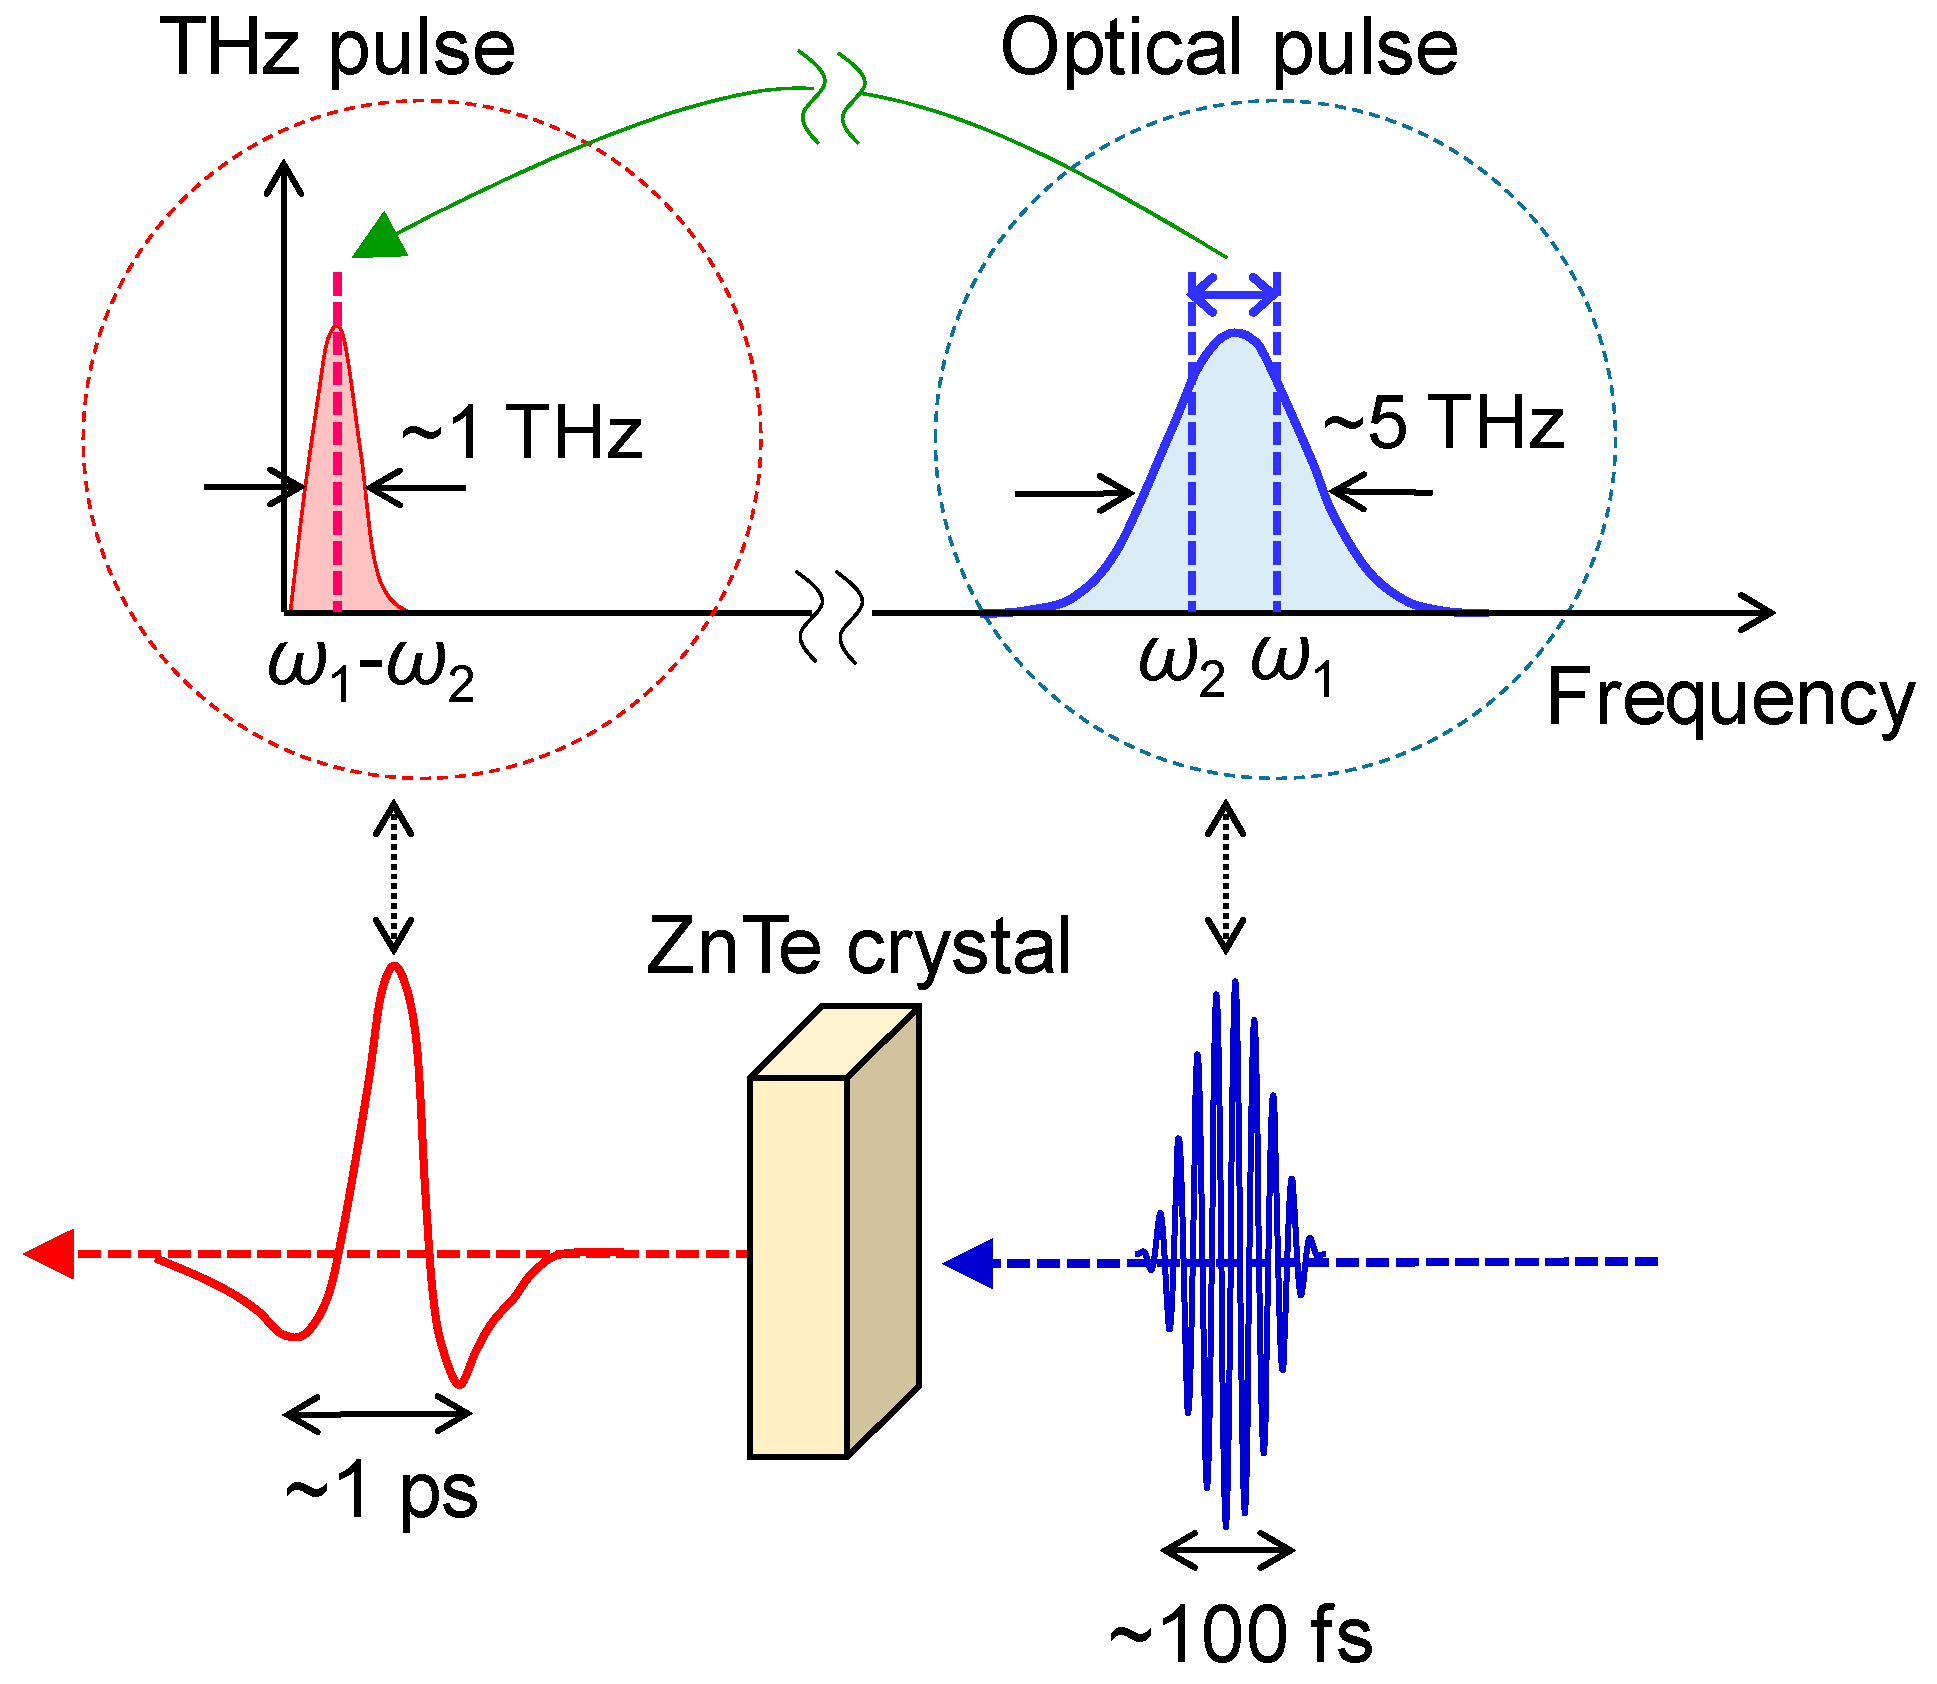
A terahertz pulse usually means a nearly monocyclic electromagnetic wave with a central frequency of approximately 1 THz (a photon energy of ~4 meV, frequency of ~33 cm−1, and wavelength of ~300 μm) and with a temporal width of approximately 1 ps. In this article, we use the term ‘terahertz pulse’ with this meaning. Recent developments of femtosecond laser technology enable us to generate and detect such a terahertz pulse. There are several methods to generate a terahertz pulse. A typical method for this is optical rectification, which is schematically shown in Figure 9. As mentioned in the previous subsection, a typical Ti-sapphire RA generates a pulse with a temporal width of approximately 130 fs, spectral width of ~7 nm and photon energy of ~14 meV. When such a pulse is incident to a second-order nonlinear optical crystal, such as ZnTe, a terahertz pulse is emitted through a differential frequency generation process within the pulse. This process corresponds to an optical rectification within a light pulse with a fixed frequency and as such, this terahertz pulse generation method is called an optical rectification method. The spectral width of a terahertz pulse thus obtained is dominated by the spectral width of the incident pulse.
If a terahertz pulse is used as a pump pulse to control an electronic state of a solid [62,63,64,65,66,67], its electric-field amplitude should be enhanced. In order to strengthen the electric-field amplitude of a terahertz pulse, we should put a strong laser pulse into a second-order nonlinear optical crystal and simultaneously fulfil the phase matching condition of an incident pulse and a terahertz pulse. For this purpose, a pulse-front tilting method using LiNbO3 was developed [68,69]. Using this method, a strong terahertz pulse with an electric-field amplitude far beyond 100 kV/cm can be produced. In our study, we generate a terahertz pulse with an electric-field amplitude as large as 400 kV/cm by the pulse-front tilting method [65] and use it as a pump pulse to control the polarization in TTF-CA. In the terahertz-pump optical-probe measurements, we control the delay time td of the probe pulse relative to the terahertz pump pulse by changing the path length of the probe pulse. The experimental setup for the terahertz-pump optical-probe measurements is shown in Figure 10.
4. Photoinduced Neutral to Ionic Phase Transition in TTF-CA
4.1. Photoinduced Neutral-to-Ionic Transition
In this subsection, we report the dynamics of the photoinduced N-to-I transition investigated by pump-probe reflection spectroscopy, in which the temporal width of each pump and probe pulse was approximately 130 fs, and the time resolution was approximately 180 fs [19].
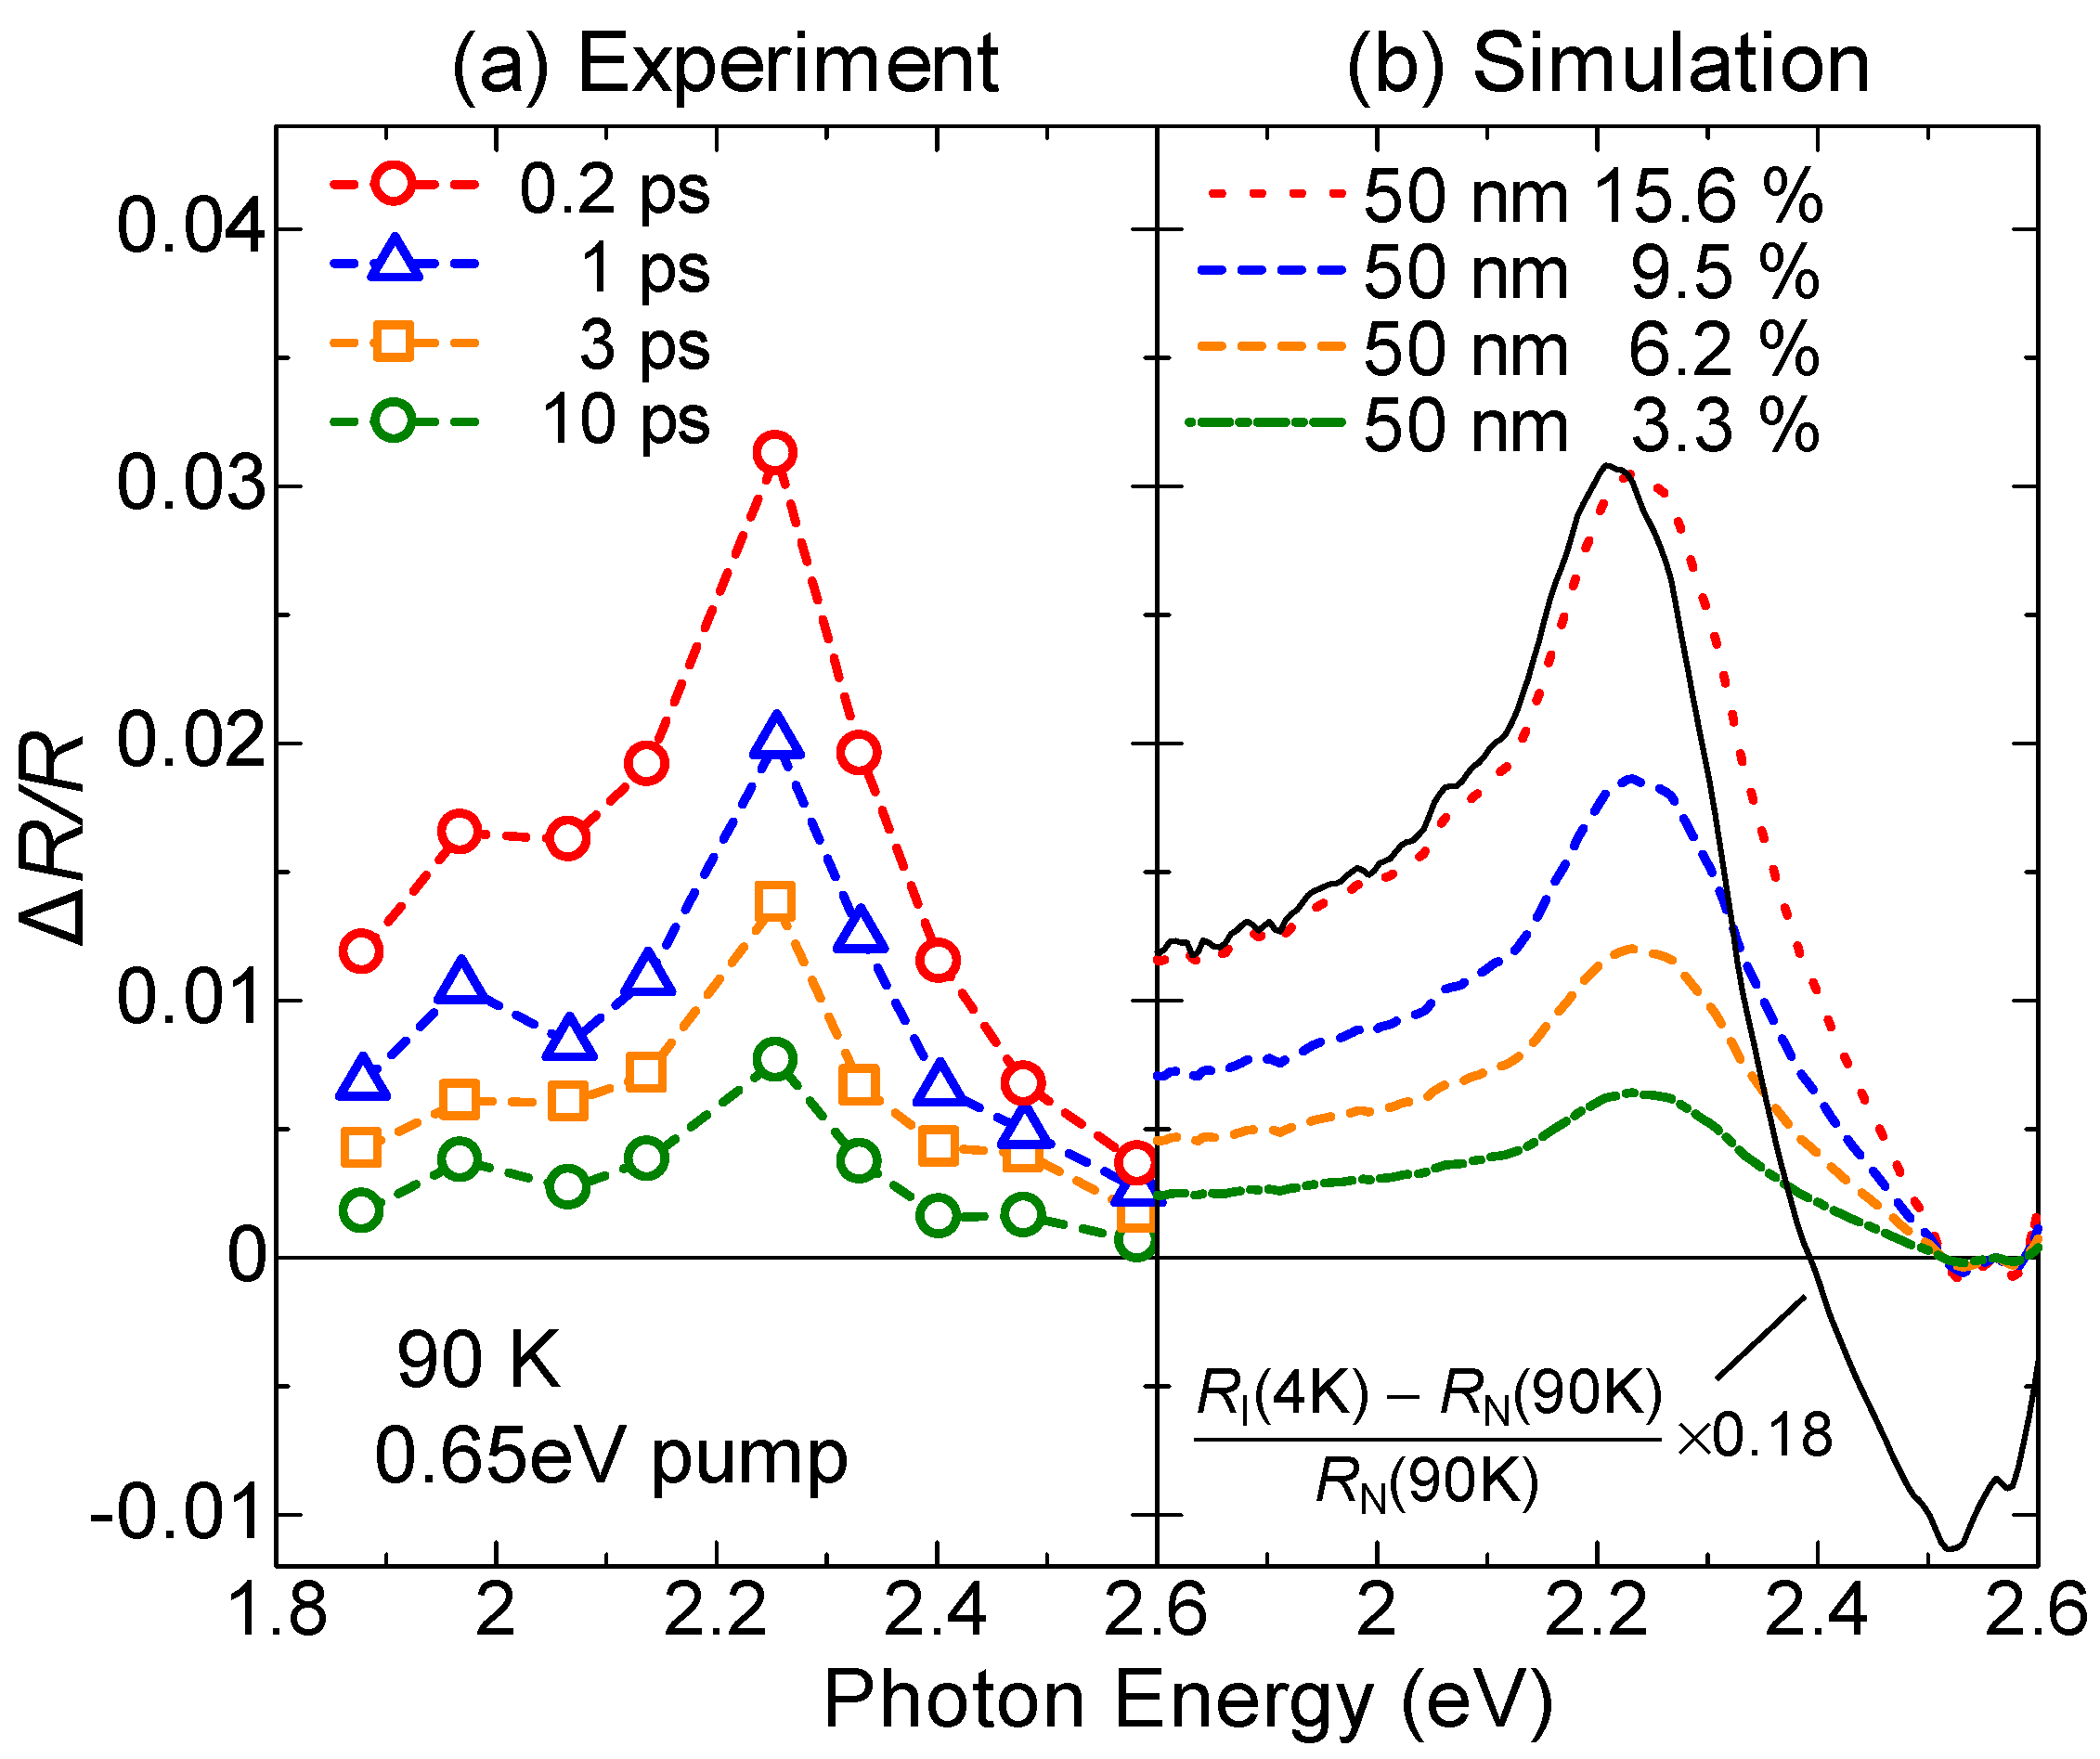
Figure 11a shows the transient change (ΔR/R) in the polarized reflectivity (R) spectrum in the IM transition band of TTF for E⊥a at 90 K just after the resonant excitation of the CT band at 0.65 eV with Eex//a (td ~ 0.2 ps). The excitation photon density xph is approximately 0.15 photon (ph) per DA pair. The spectral shapes of ΔR/R at from td = 0–10 ps are almost unchanged. In Figure 11b, the solid line is the differential reflectivity spectrum, , calculated from the steady-state reflectivity spectra in the I phase at 4 K, ] and the N phase at 90 K, ]. The spectral shape of ΔR/R for td = 0–10 ps below 2.3 eV is almost equal to the spectral shape of . Above 2.3 eV, the experimental ΔR/R and spectra are different from each other. Such differences are related to the fact that the number of photoinduced I states decreases with increasing distance from the crystal surface, depending on the number of absorbed photons of the pump light. In other words, this is because the penetration depth of the pump pulse (~500 Å) is smaller than that of the probe pulse (~1500 Å). To exactly and quantitatively treat such effects on reflectivity changes, we calculated the ΔR/R spectra, assuming that the volume of the photogenerated I states depends on the distance from the crystal surface and is proportional to the absorbed photon number at each position, and that the complex refractive index at each position is the weighted average of the complex refractive indexes of the N state and the photogenerated I state. Here, we also assume that the refractive indexes of the N state and the photogenerated I states are equal to those in the steady state at 90 K and 4 K, respectively. The ΔR/R spectra calculated using the multilayer model, shown in Figure 11b [70], are in excellent agreement with the experimental ΔR/R spectra. From this analysis, we can evaluate the volume ratio of the photogenerated I states at the crystal surface as a function of time, which is shown in Figure 11b.
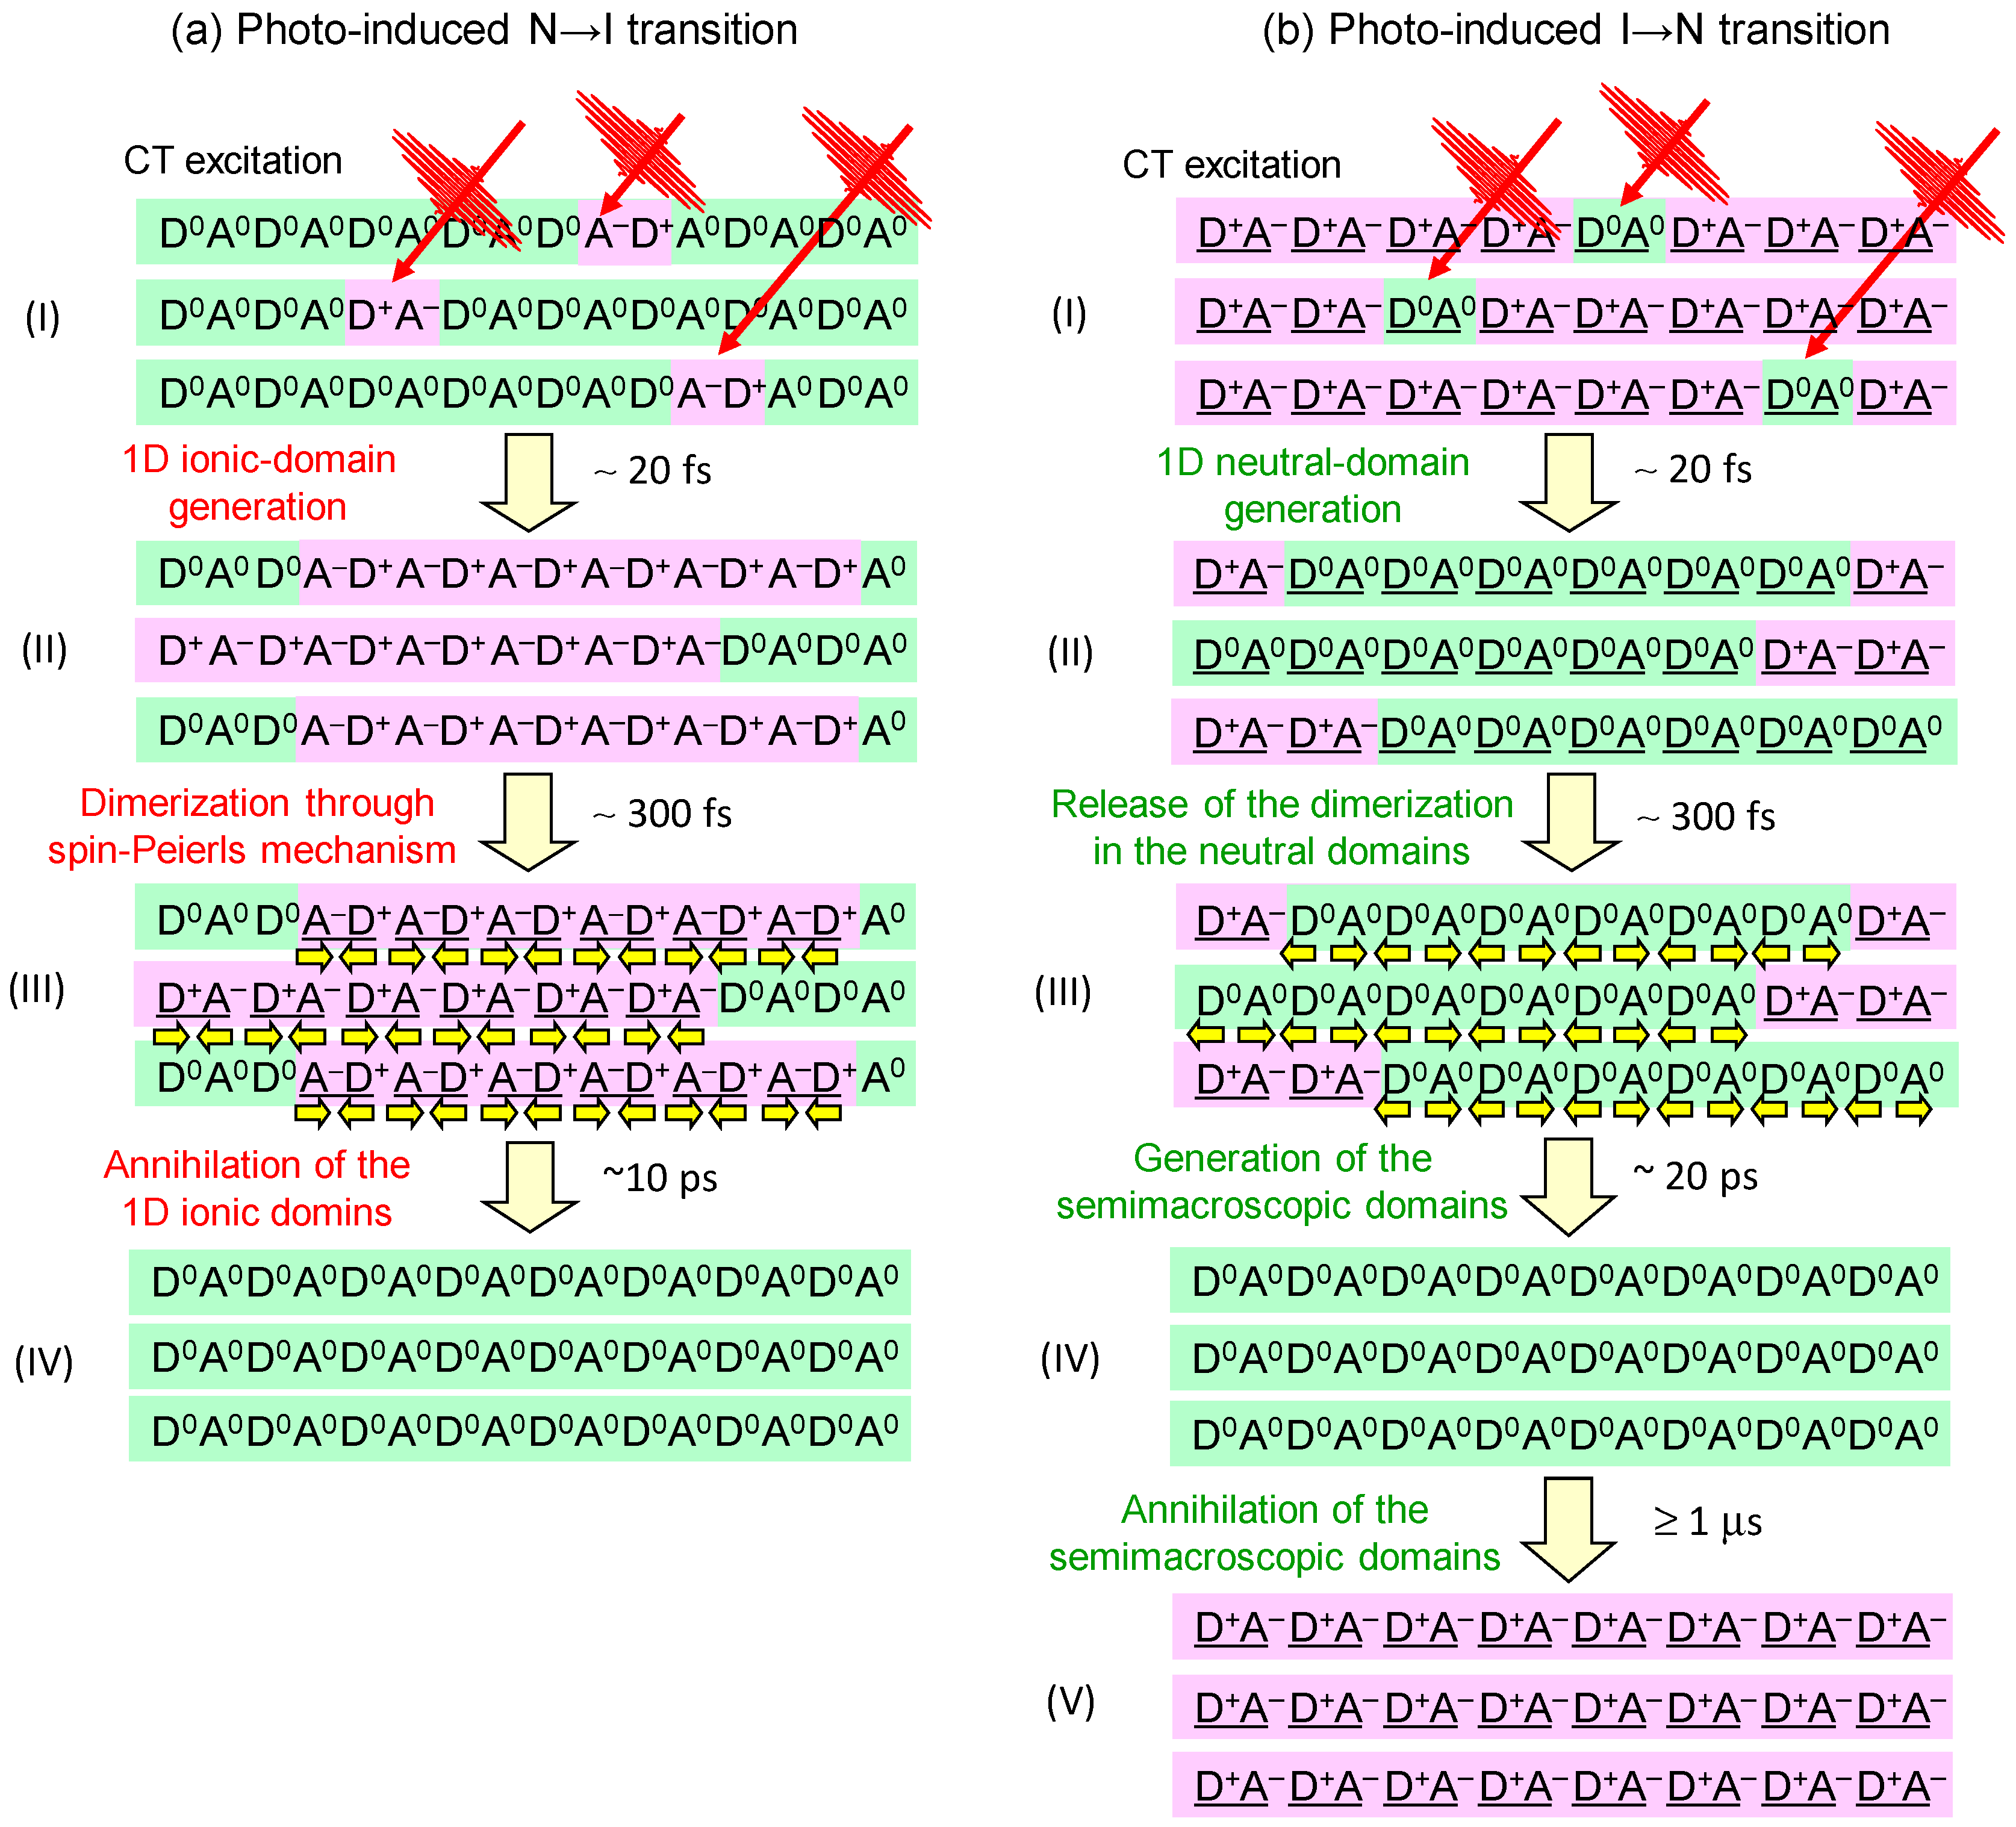
From the magnitudes of the ΔR/R signals just after the photoirradiation, we deduce that approximately 10 D0A0 pairs are converted to D+A− pairs by one photon. That is, an I domain consisting of approximately 10 D+A− pairs is rapidly generated from a CT excited state initially produced by a photoexcitation. A formation process of an I domain is schematically illustrated in Figure 12(aI,II). Such an I domain formation is based upon the fact that the long-range Coulomb attractive interaction decreases the formation energy of the I domain, which is much lower than the formation energy of a CT excited state, that is, an isolated D+A− pair [22,26,28,71]. This causes the collective CT processes illustrated in Figure 12(aI,II) and the resultant I domain formation. Such a collective nature of I states is the most important characteristic of TTF-CA and the reason why it is regarded as a kind of correlated electron system. The macroscopic feature of the photoinduced N-to-I transition is discussed in Section 4.5.
4.2. Ultrafast Dynamics of Ionic Domain Formation
From the pump-probe experiments with an approximate time resolution of 180 fs discussed in the previous subsection, an overall picture of the photoinduced N-to-I transition was revealed. The next important subject is to clarify how an I domain is produced from an initial photoexcited state and how it is stabilized. In the formation and stabilization processes of an I domain, molecular deformations and molecular displacements are expected to play certain roles in addition to the long-range Coulomb attractive interaction. In order to precisely detect the charge and molecular dynamics after photoirradiation, a time resolution much better than 180 fs should be necessary, as discussed in Section 3.1. Considering these facts, we used a pump–probe system based upon two NOPAs [30].
In Figure 13a, we show again the steady-state polarized reflectivity (R) spectra. The dashed-dotted line shows the differential reflectivity (ΔR/R) spectrum between 90 K and 77 K, which is the spectral change expected when the N state is converted to the I state. The shaded areas in the same figure show the spectra of the pump and probe pulses obtained from two NOPAs. Similar to the case of the pump–probe experiments with the 180 fs time resolution discussed in the previous subsection, we set the pump photon energy at the CT transition band and the probe photon energy at the IM transition band of TTF. By measuring the reflectivity changes ΔR/R of the probe pulse, we can obtain information about the ultrafast dynamics of the photoinduced N-to-I transition with a time resolution of approximately 20 fs.
In Figure 13b, we show with open circles the time characteristic of ΔR/R measured with at 90 K. By comparing the magnitude of the signal to , we deduce that an I state generated by one photon consists of ~10 D+A− pairs, which is consistent with the results of the pump–probe experiments with the 180-fs time resolution.
The formation dynamics of an I domain are reflected by the initial time characteristic of ΔR/R. Therefore, we investigated the rise time τd of ΔR/R. In the inset of Figure 13b, we show the expanded time characteristic of ΔR/R around the time origin. The shaded area indicates the cross-correlation profile for the pump and probe pulses, which represents the time resolution (~20 fs) of our measurement system. The solid lines show the simulated time characteristics for τd = 0, 20, and 40 fs, which is a rise time of ΔR/R signals. A comparison of the experimental and simulated time characteristics reveals that the time constant for the I-domain formation is almost equal to or slightly smaller than 20 fs. The time scale of the CT processes estimated from the magnitude of t (~0.2 eV) [72] is ~20 fs in TTF-CA. It is therefore reasonable to consider that the primary I domain is formed via purely electronic processes, without structural changes.
4.3. Stabilization of an Ionic Domain by Molecular Displacements and Deformations
After the initial increase of ΔR/R, complicated oscillatory structures are observed. Such oscillatory structures are sometimes observed in pump–probe experiments on PIPTs and reflect structural dynamics during and after PIPTs [73,74,75,76,77,78,79,80,81,82,83,84,85,86,87].
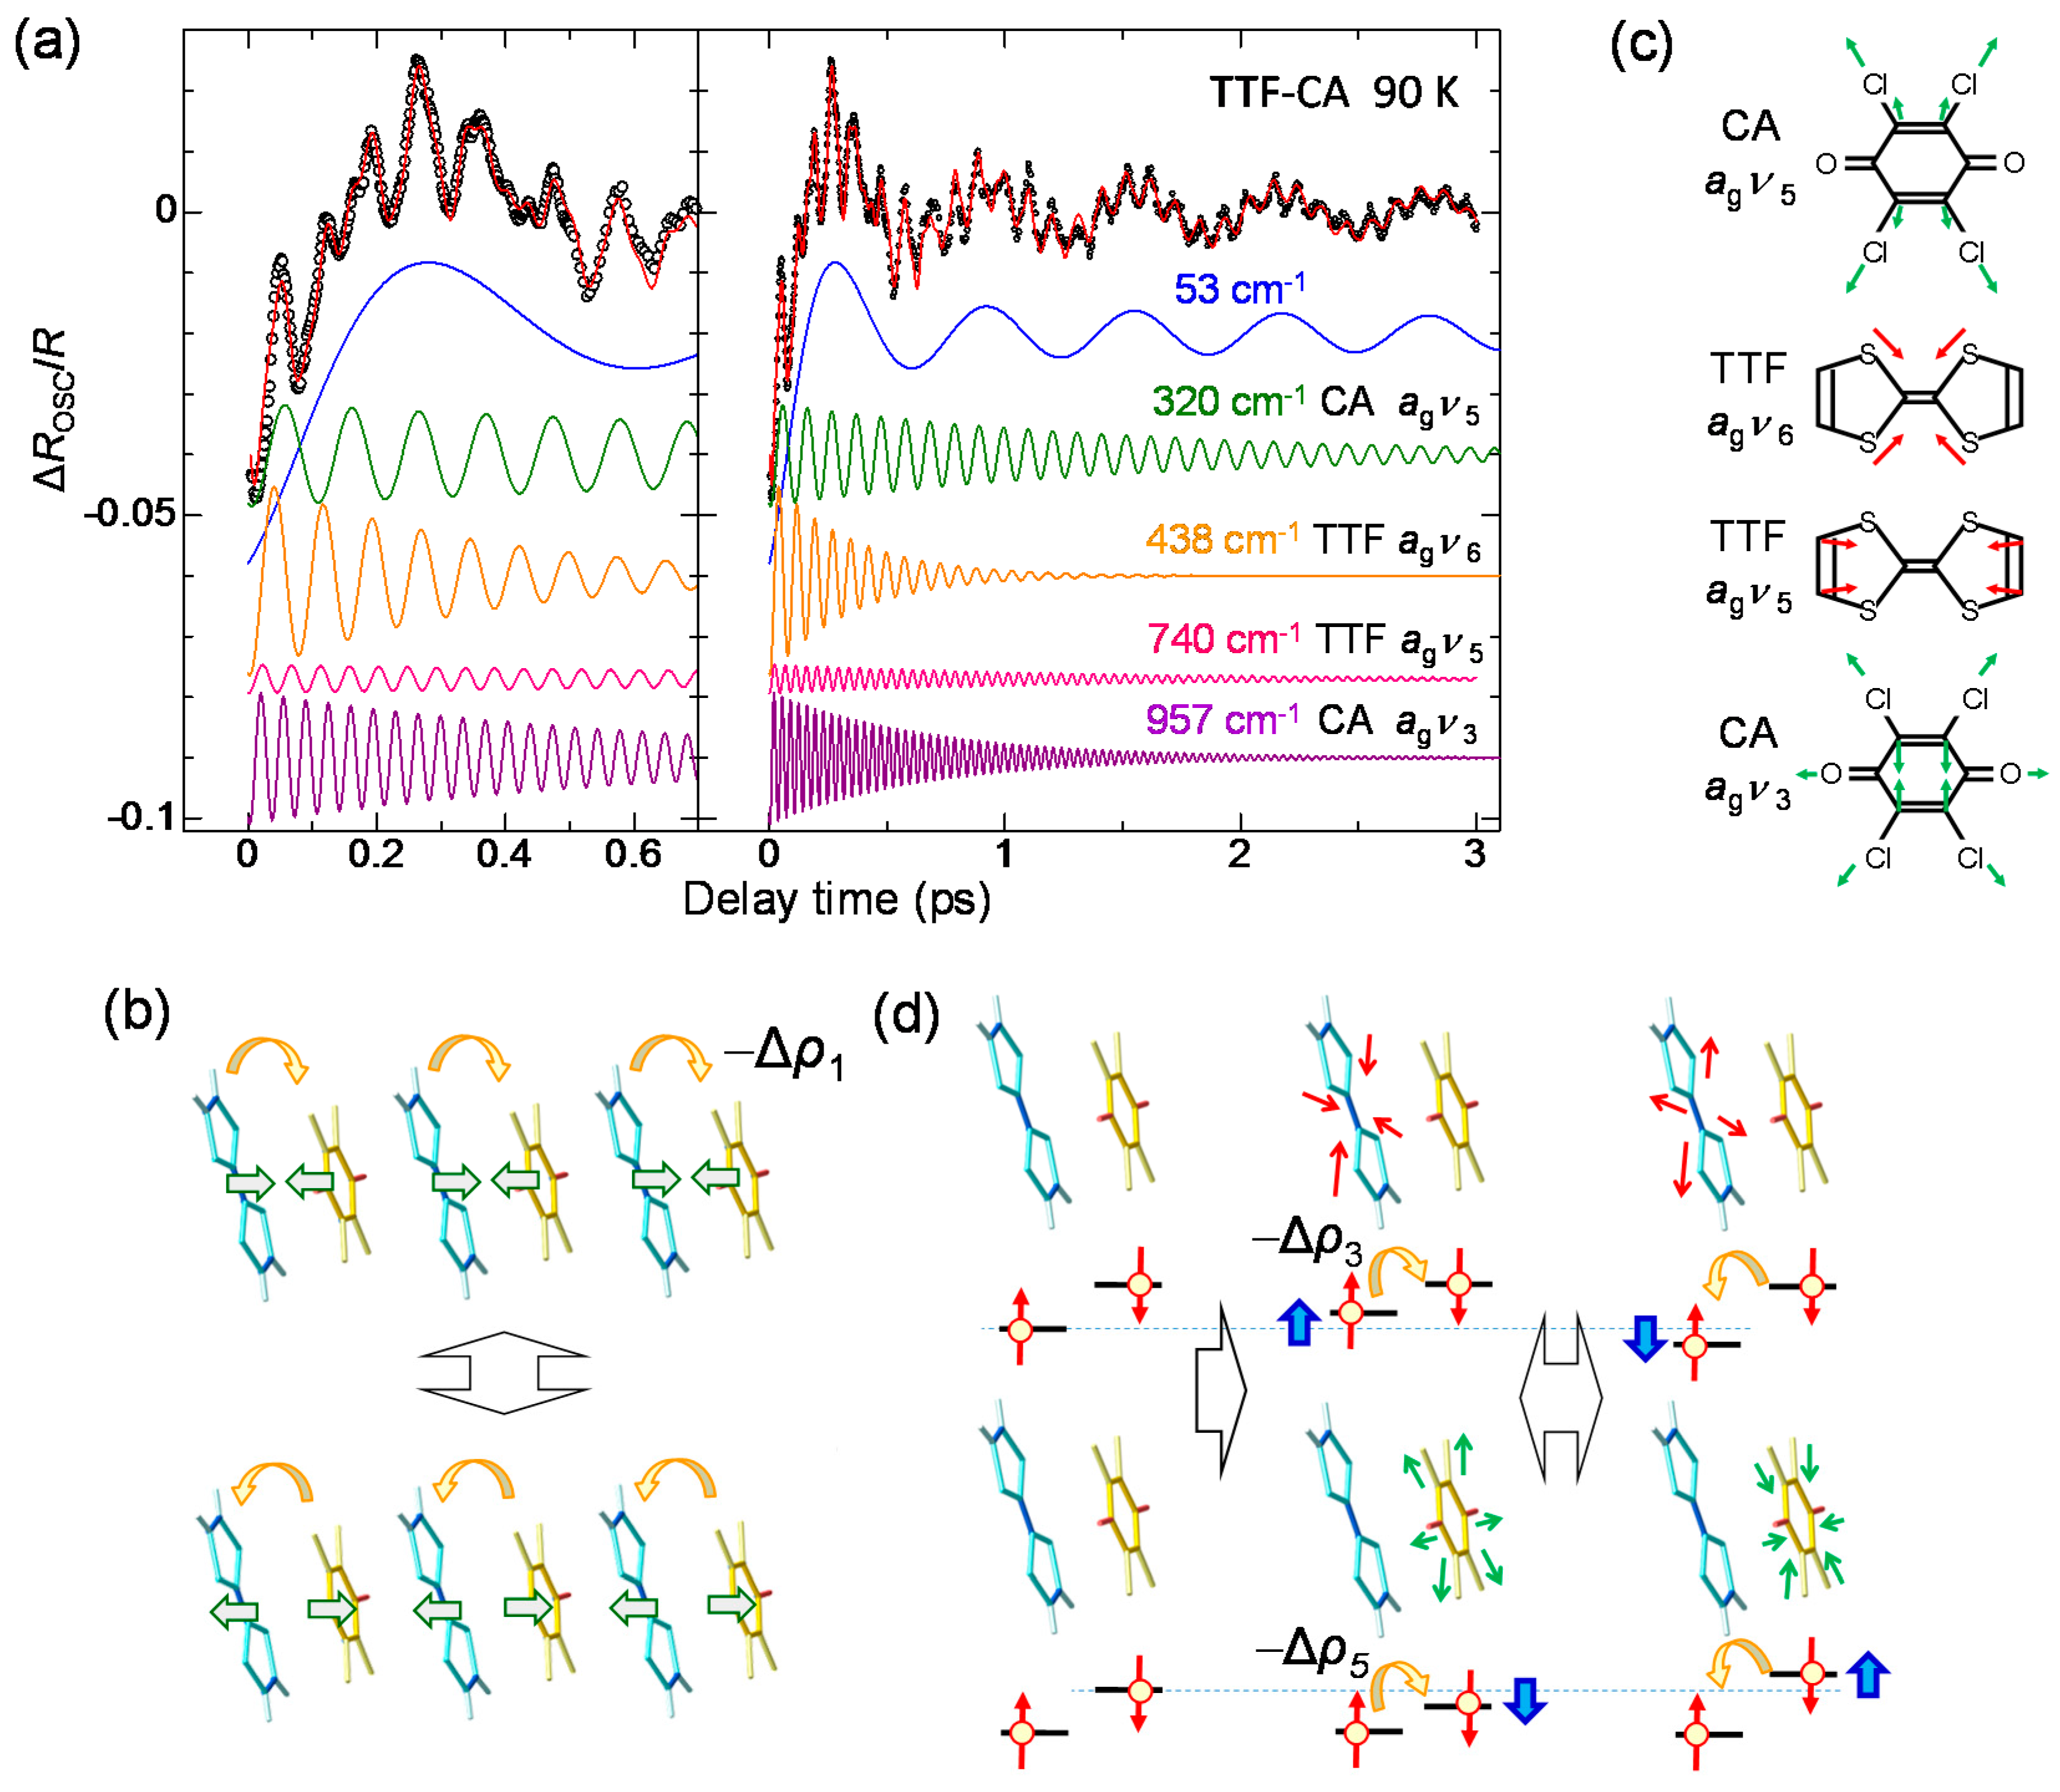
By subtracting the gradual background change of ΔR/R from the original signal, we extracted the oscillatory component, ΔROSC/R, as shown by the open circles in Figure 14a. We analyzed this component using the sum of five damped oscillators (i = 1–5), expressed as follows.
Here, and are the amplitude, frequency, phase, and decay time, respectively, of the oscillation i. The fitting curve is shown by the red line in Figure 14a, which reproduces well the experimental oscillatory profile. Each oscillation component is also shown in the lower part of the same figure. Their frequencies are 53, 320, 438, 740, and 957 cm−1. From the frequency values, we can divide these five oscillations into two categories. The low-frequency oscillation with 53 cm−1 is assigned to a lattice mode associated with the molecular dimerization [19,24,30,33]. This assignment was supported by the polarized Raman spectroscopy [41]. The other oscillations with the frequencies higher than 300 cm−1 are attributable to the intramolecular vibration modes associated with shrinkages (or expansions) and deformations of molecules.
The generation of the 53 cm−1 oscillation can be explained in the following way. The formation of an initial I domain occurs within 20 fs. During this process, the molecular positions never change, since the time scale of the molecular displacements is much slower than 20 fs. In the I domain, each molecule has spin S = 1/2, such that it involves the spin-Peierls instability and the DA molecules in each I domain are dimerized. The transient dimeric molecular displacements give rise to a coherent oscillation corresponding to the dimerization. The dimeric molecular displacements in the I domain enhance the Coulomb attractive interaction within each dimer, which enhances the degree of CT ρ. Therefore, the coherent oscillation of the dimeric molecular displacements also modulates the Coulomb attractive interaction between the neighbouring D and A molecules, which causes the modulation Δρ1 of ρ. Such a modulation of ρ is schematically shown in Figure 14b. As a result, this coherent oscillation is clearly observed as the oscillatory structure in ΔR/R.
By comparing the higher-frequency oscillations with the results of the Raman spectroscopy and theoretical calculations [44,88,89,90,91], we can relate those oscillations with 320, 438, 740, and 957 cm−1 to the totally symmetric (ag) modes of the intramolecular vibrations, CA ag ν5, TTF ag ν6, TTF ag ν5, and CA ag ν3, respectively. Each oscillation mode is schematically illustrated in Figure 14c. The reason why these intramolecular ag modes give rise to the oscillations of ρ and are observed as the coherent oscillations in ΔR/R can be explained by the electron-intramolecular vibration (EIMV) coupling [92,93]. An initially produced I domain is stabilized not only by the dimeric molecular displacements but also by the intramolecular deformations. When an I domain is produced by collective charge transfers, each D+ and A− molecule would be stabilized by atomic displacements within the molecule or, equivalently, by molecular deformations. This is quite reasonable, since the bond lengths within a molecule should largely change depending on the valence of the molecule. Such changes in molecular deformations would be expressed by the combinations of ag modes. For the ag modes of TTF, the molecular deformations related to those modes change the molecular orbital energy, as shown by the blue arrows in the upper part of Figure 14d. These changes in the molecular orbital energy induce the additional intermolecular charge transfers, Δρi. Such molecular deformations also give rise to coherent oscillations of molecular structures and ρ. Similar modulations of ρ can be induced by the ag modes of CA. Note that oscillations of ρ are detected in the IM transition band of TTF. The modulation of ρ in TTF by the vibrations in CA is unambiguous evidence for the intermolecular charge-transfer process driven by EIMV coupling. As seen in Figure 14a, the sum of the amplitudes of the coherent oscillations associated with the ag modes exceeds ~30% of the background ΔR/R signals originating from the initial formation of I domains via the collective charge-transfer processes. This means that ionic (D+ and A−) molecules or I states are largely stabilized by molecular deformations.
4.4. Charge and Molecular Dynamics Deduced from Oscillation Analyses
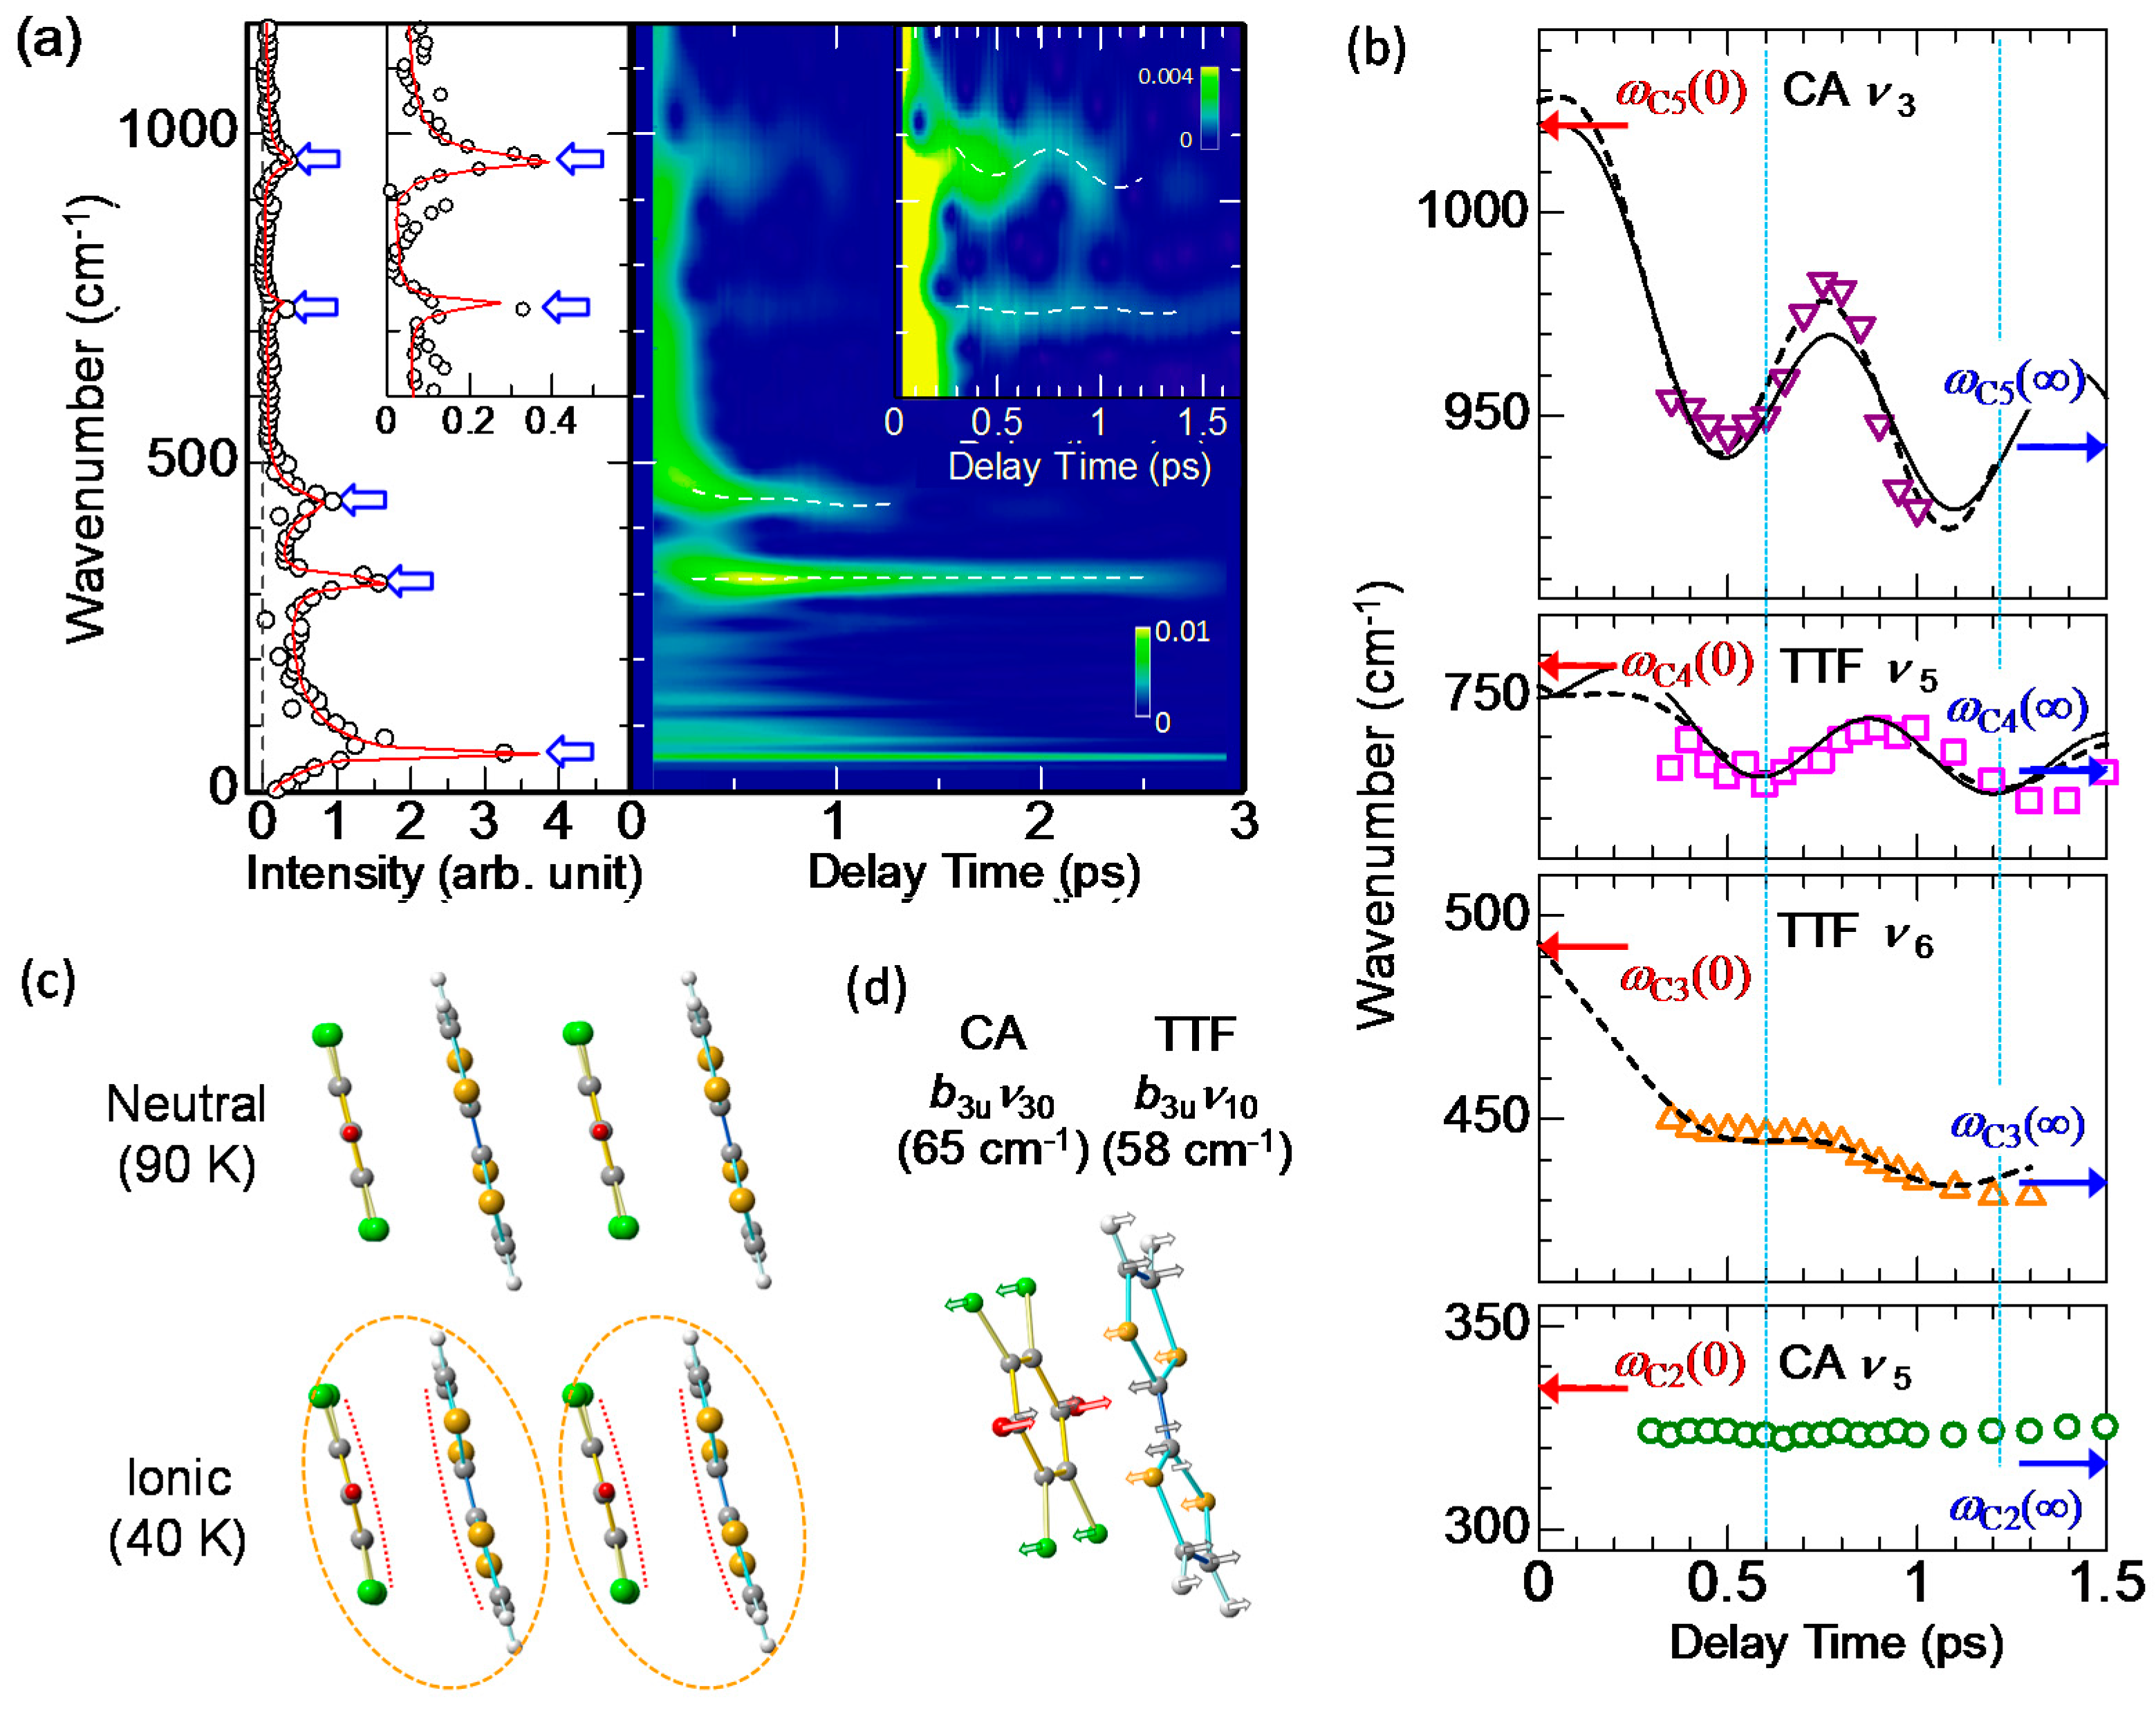
To obtain more detailed information of the molecular dynamics, we analyzed the oscillatory component in Figure 14a with wavelet analysis. Using this method, we can obtain time-dependent Fourier power spectra, from which we can discuss the time dependence of the oscillation frequencies. In the right panel of Figure 15a, we show the results of the wavelet analysis, in which time-dependent Fourier power spectra are shown as a contour map. The left panel of Figure 15a and its inset are the Fourier power spectrum of the whole oscillatory signal up to td = 3 ps. Similar to the results of the fitting analyses discussed above, we can see five oscillations: one dimeric molecular oscillation and four intramolecular vibrations. Scrutiny of the contour map in the right panel reveals that the oscillation frequencies of the four intramolecular vibrations vary with time (see white broken lines in the right panel and its inset).
The time dependences of the frequencies of the four intramolecular vibrations extracted from the contour map in Figure 15a are plotted in Figure 15b. The frequency of CA ν5 is almost unchanged, while those of CA ν3, TTF ν5, and TTF ν6 are periodically modulated. In particular, the frequency modulations are large in the CA ν3 and TTF ν5 modes. The interval between the two neighboring dips in the time evolutions of the frequencies in Figure 15b is common to both oscillations and approximately 600 fs, which is almost equal to the period of the coherent oscillation of the dimeric molecular displacements with the frequency of . This indicates that the modulations of the frequencies in the CA ν3 and TTF ν5 modes are related to the modulations of ρ induced by the coherent oscillation of the dimeric molecular displacements. In general, a frequency of an intramolecular vibration mode depends on the molecular ionicity ρ.
When we compare the frequency modulations of the CA ν3 and TTF ν5 modes in Figure 15b more carefully, we notice that the phases of those modulations are different between the two modes. The blue dotted lines in Figure 15b show the delay times td of 0.6 ps and 1.2 ps, which correspond to the positions with the phase ω1t = 2π and 4π for the case in which a cosine-type oscillation −cos(ω1t) with the frequency is assumed. The positions of the two dips in the time evolution of the frequency for the TTF ν5 mode accord with the two blue lines. On the other hand, those for the CA ν3 mode shift by ~130 fs or ~0.45 π relative to the two blue lines. In addition, the frequencies of the coherent oscillations apart from the CA ν5 mode shift to the lower frequencies with time. The time evolutions of the frequency changes in the CA ν3, TTF ν5, and TTF ν6 modes can be almost reproduced by the sum of a damped oscillator and an exponential function corresponding to a low-frequency shift, as shown by the broken lines in Figure 15b. Each frequency ωCi(0) at the time origin is set at a value of a plane molecule with ρ = 0.7, while each frequency ωCi(∞) at 1.5 ps is set at a value in the I phase of TTF-CA [44,90]. From this analysis, the time constant of the frequency shift was evaluated to be ~0.35 ps. As mentioned above, an I domain is generated within 20 fs after photoirradiation; therefore, the observed frequency shifts much slower than 20 fs cannot be explained by purely electronic processes. The slow frequency shifts suggest that the charge distributions in TTF and CA molecules are changed with the time constant of ~0.35 ps and they are dominated by additional slow molecular deformations, which may cause the phase shifts of the frequency modulations in the coherent oscillations.
With these results in mind, we carefully checked the molecular structures of TTF and CA and found significant differences between the molecular structures of the N and I phases; as shown in Figure 15c, TTF and CA molecules are planar in the N phase, while they are bent in the I phase. We show in Figure 15d the corresponding bending modes of TTF and CA molecules, which were obtained from theoretical calculations [88,89]. The frequencies (periods) of those bending modes are 58 cm−1 (0.58 ps) in TTF and 65 cm−1 (0.52 ps) in CA. These periods of the bending modes are close to the time constant 0.35 ps of the frequency shift. Accordingly, we can consider that the additional molecular deformations responsible for the frequency shifts of coherent oscillations are molecular bendings.
To ascertain the validity this interpretation, we performed a simulation using a simple model. First, we assumed that the dimeric molecular displacement Q1(t) oscillates and converges to a certain value Q1(∞), as expressed by the following formula.
Next, we assumed that a molecular bending QBj(t) is driven by the dimeric molecular displacement. This assumption is reasonable, because the bendings of TTF and CA molecules within a dimer, shown in Figure 15d, strengthen the dimerization. In this case, it is natural to consider that an external force originates from the dimeric molecular displacement Q1(t) and the equation of motion for QBj(t) can be expressed as
Here, j = 1 and 2 indicate the bending modes of TTF and CA, respectively. ωBj and γBj are the frequency and the damping of each bending mode, respectively. FBj is an external force when the dimeric molecular displacement reaches Q1(∞), after a long time has elapsed. The time characteristic of an intramolecular vibration frequency is expressed as
Here, the first term shows the direct frequency modulation by the change of ρ induced by the dimeric molecular displacements. is the amplitude of the frequency modulation. The second term is the frequency change by the charge redistribution within a molecule induced by the molecular bending. i denotes each intramolecular vibration mode. Using this equation, we calculated the time characteristics of the frequencies of the coherent oscillations corresponding to the CA ν3 and TTF ν5 modes, and show them by the solid lines in Figure 15b. As the oscillation frequencies ωBj of the bending modes in TTF and CA, we used the theoretical values calculated in each isolated molecule [88,89], since no values had been obtained in a solid. The calculated curves reproduced both the frequency changes and the phase shifts of the frequency modulations well, although the fitting parameters are only the damping of the bending mode γBj and the amplitude of the frequency modulation . Such a success of the simulation suggests that the used ωBj values are not so different from their actual values in solids. The obtained values of γBj are approximately 0.2 eV in both TTF and CA molecules. Such a large value of the damping gives rise to a monotonic frequency shift and then a monotonic charge redistribution, as observed in Figure 15b. As seen in Figure 14a, the decay times of the coherent oscillations of the intramolecular ag modes differ from each other. A coherent oscillation with a large frequency shift is strongly coupled to the bending mode and decays rapidly. This is explained by the fact that the strong coupling to the bending mode with large energy dissipation shortens the decay time of the oscillation.
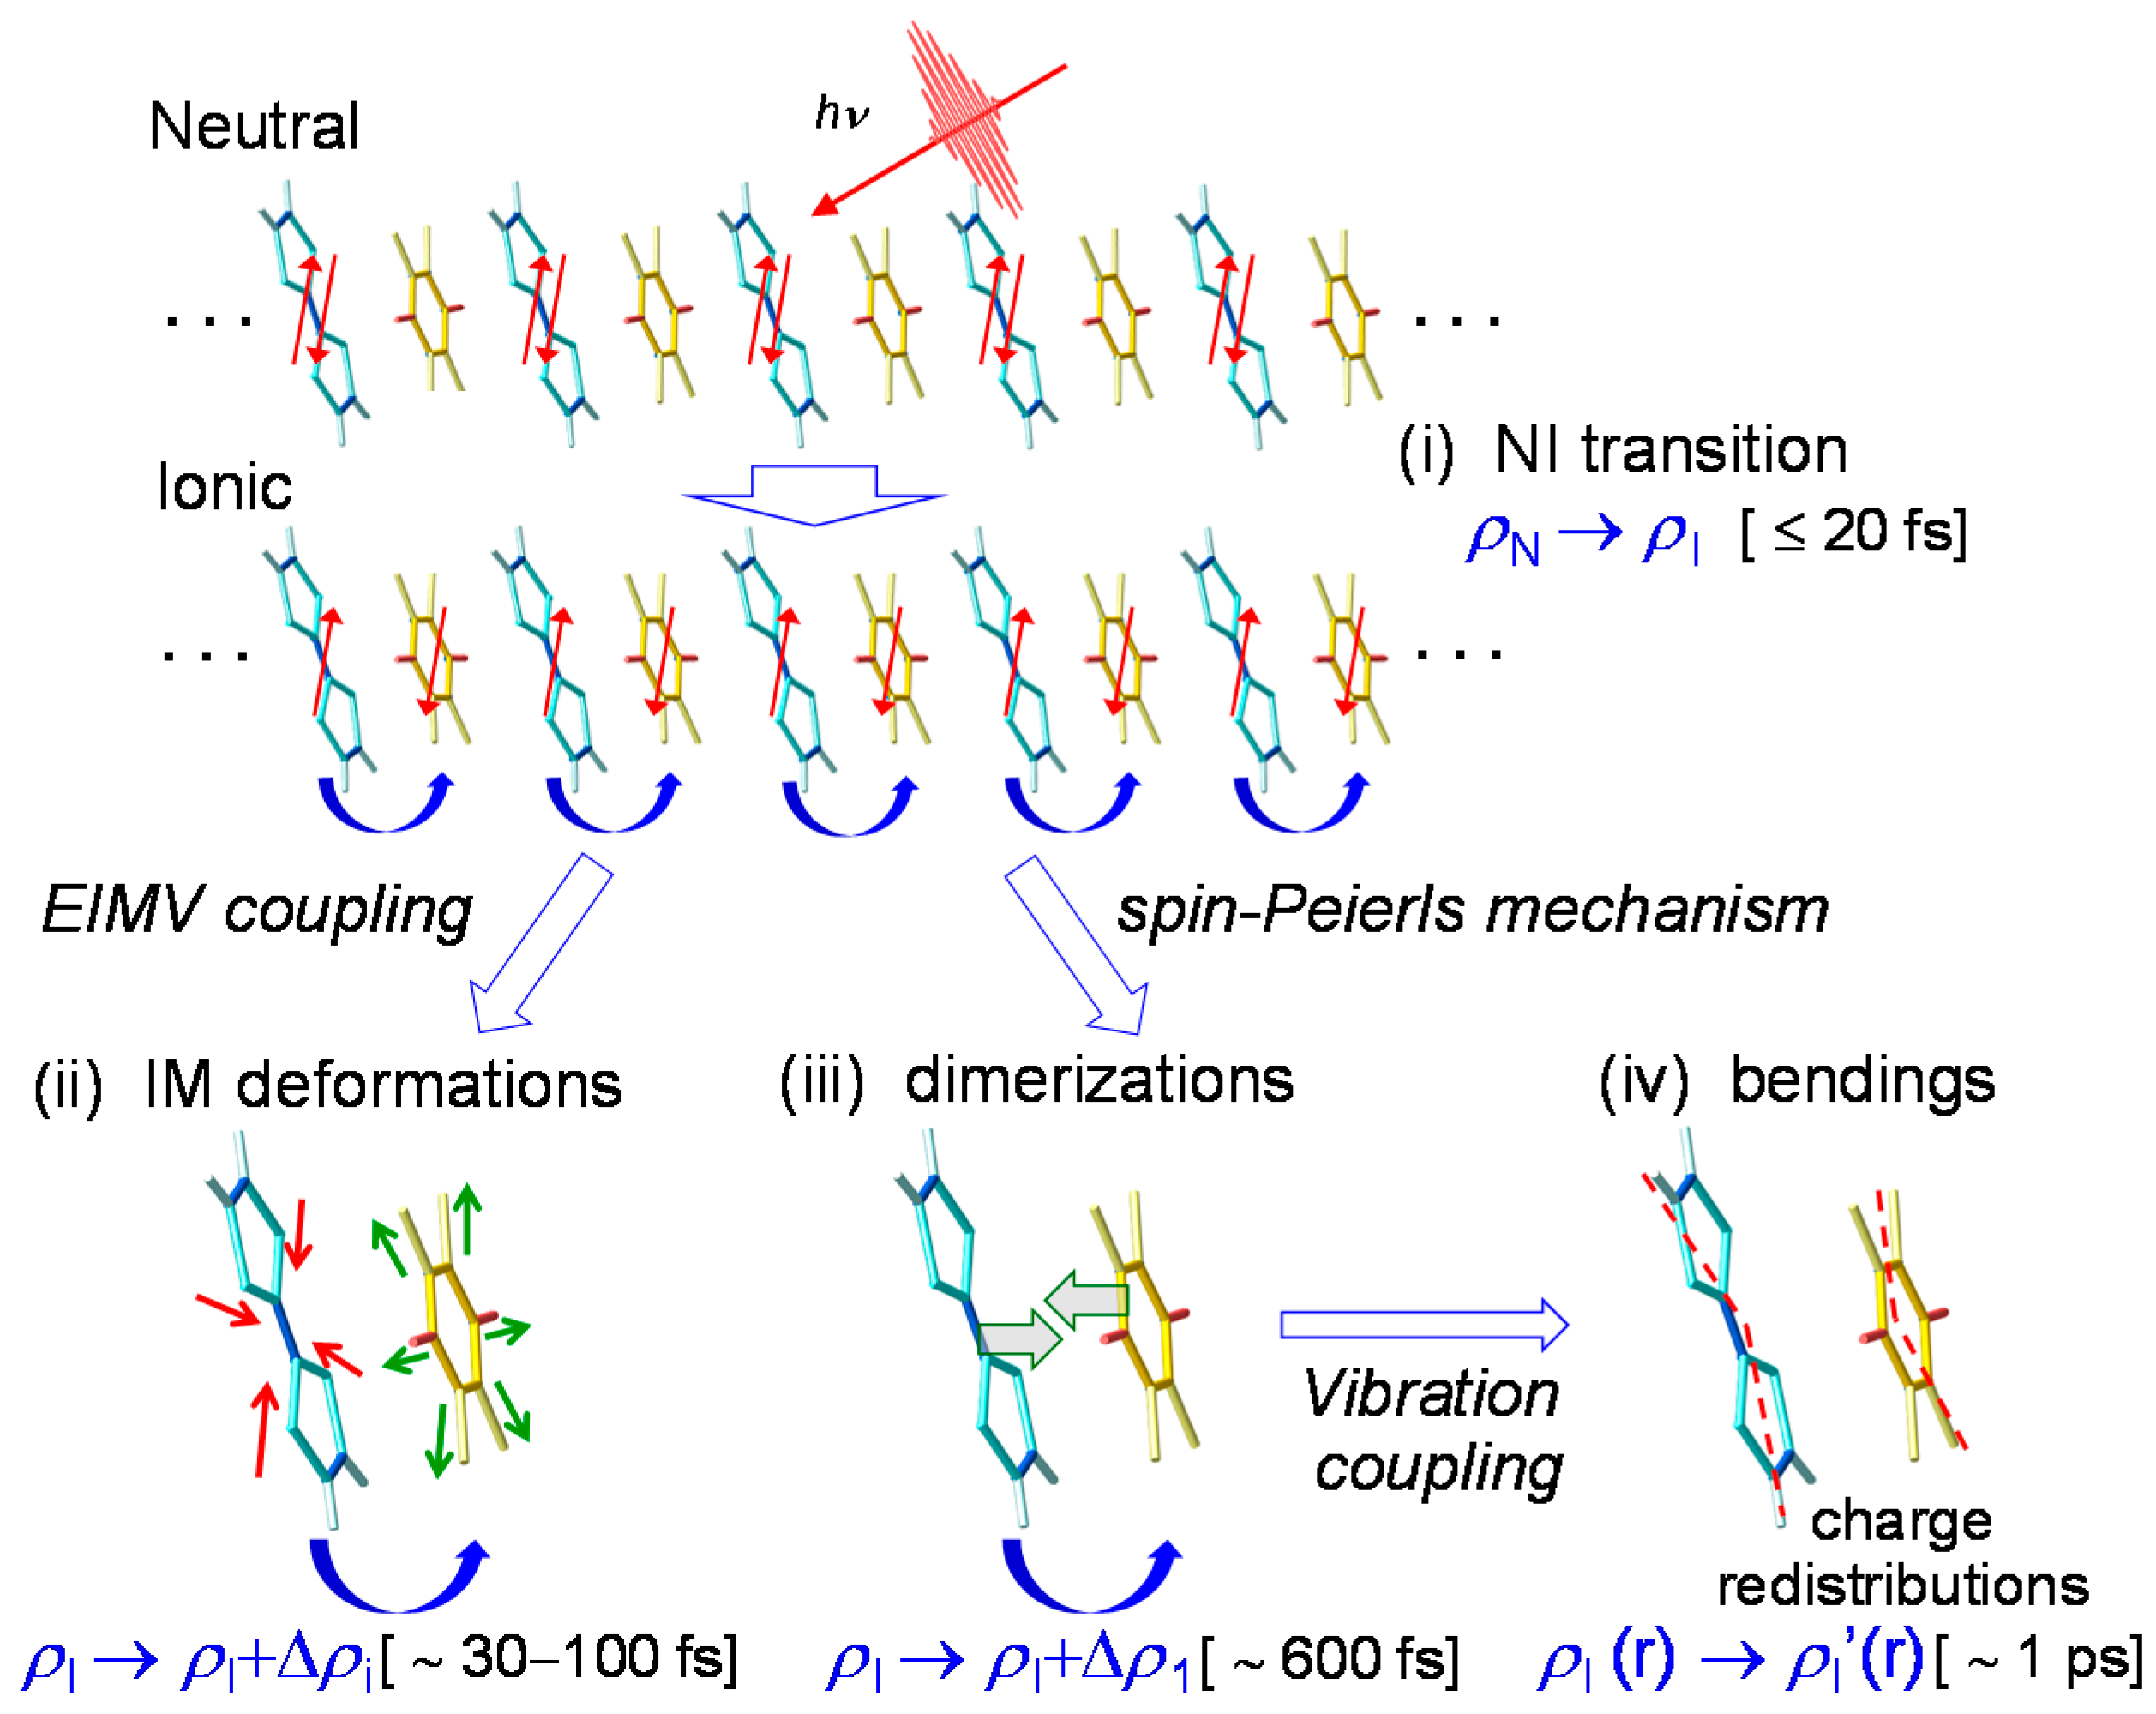
In Figure 16, we show the ultrafast I domain formation and stabilization via the molecular dynamics revealed from the pump–probe reflection spectroscopy with the time resolution of 20 fs. Just after a photoirradiation, an I domain is generated via purely electronic processes, as shown in (i). Subsequently, the I domain is stabilized by molecular deformations (ii) and dimerizations (iii). These structural changes and the subsequent oscillations give rise to the changes in the degree of CT ρ in each molecule within the I domain and the subsequent oscillations in ρ. The dimerization produces subsequent molecular bendings (iv), which cause the charge redistribution in each molecule in the I domain and the resultant complicated frequency changes of the coherent oscillations. Such complex dynamics in photoinduced NI transitions on an ultrafast timescale have also been discussed theoretically [38].
4.5. Macroscopic Feature of Photoinduced Neutral-to-Ionic Transition
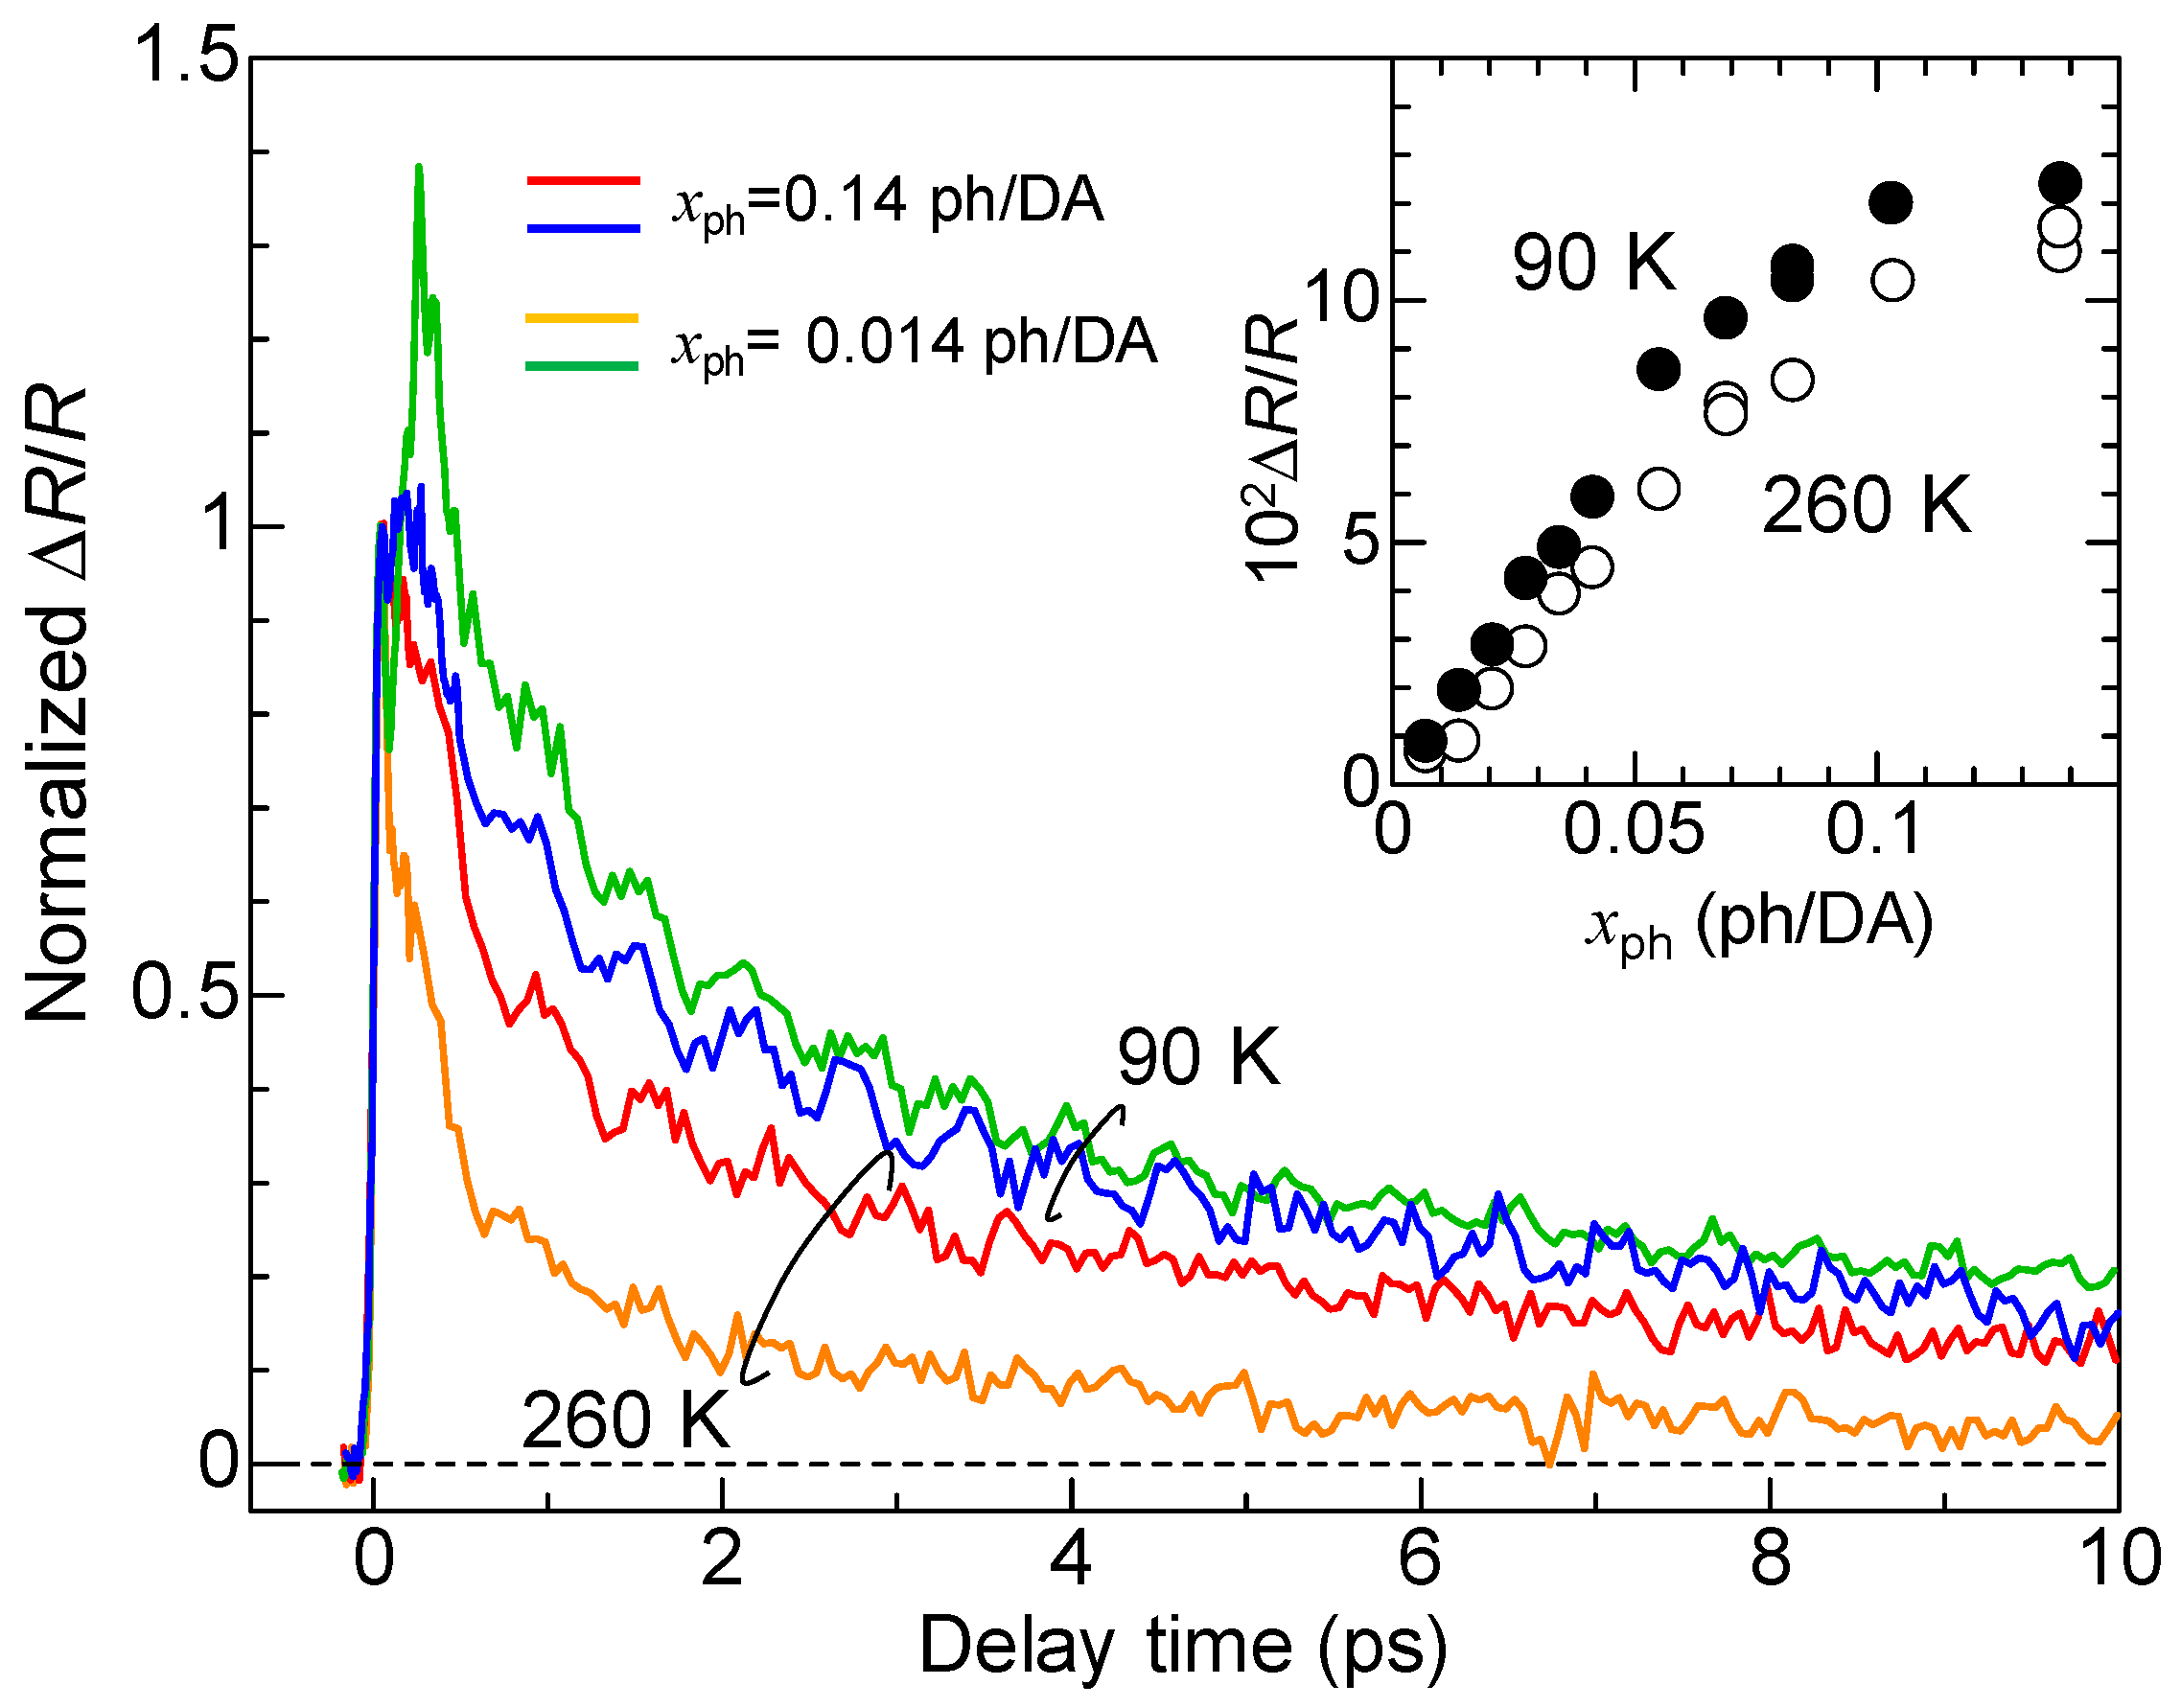
Here, we discuss the macroscopic feature of the photoinduced N-to-I transition. Figure 17 shows the time evolutions of normalized ΔR/R at ~2.2 eV at 90 K and 260 K measured in the NOPA-based pump–probe system [33]. The excitation photon density xph is 0.14 ph/DA pair or 0.014 ph/DA pair. The inset shows the xph dependence of the magnitudes of ΔR/R just after photoirradiation (td = 0.15 ps). By comparing the magnitudes of the signals with the differential reflectivity, , we can estimate the conversion efficiency of the N-to-I transition, which is approximately 10 D+A− pairs per photon at both 90 K and 260 K. The value of is approximately 0.11. The saturation value of ΔR/R also reaches 0.11 at both 90 K and 260 K. This indicates that most of the crystal within the absorption depth of the probe pulse is converted to the I state. Therefore, we can regard the observed photoinduced N-to-I transition as a photoinduced ‘phase transition’.
In the case of the strong excitation (xph = 0.14 ph/DA pair), in which the NI transition is almost complete, the photogenerated I states decay rapidly on a time scale of several picoseconds at both 90 K and 260 K. This suggests that the meta-stable (ferroelectric) I state is not formed. This feature can be explained in the following way. In the I phase below 81 K, a ferroelectric domain is very large, typically 200 × 200 μm, as mentioned in Section 2.4. Therefore, we should regard the I phase as a three-dimensionally ordered ferroelectric phase. In a case in which TTF-CA is irradiated with a femtosecond laser pulse in the N phase, the microscopic I domains are initially generated as mentioned above. We consider that, during the formation process of an I domain, initial molecular deformations or displacements would determine the direction of the dipole moment within each domain. In other words, the two kinds of I domains, […D0A0D+A−D+A−D+A−D+A−D0A0…] or […A0D0A−D+A−D+A−D+A−D+A0D0…], are randomly generated in the initial processes, probably on the time scale of a half-period of the fastest intramolecular deformation, which is close to 20 fs. After those I domains are stabilized by the molecular deformations and displacements, a dipole moment of each I domain is difficult to reverse. As a result, a three-dimensionally ordered ferroelectric I state is difficult to be stabilized. This feature is schematically illustrated in Figure 12(aI–III).
More detailed studies about the excitation photon density dependence of the NI transition efficiency and dynamics revealed the following facts [33]. With increase in the number of photogenerated I states, their decay time is prolonged. This tendency is observed at 260 K, as shown in Figure 17. This can be attributed to the fact that, with the increase in the number of photogenerated I states, the Coulomb attractive interactions among I domains increase, making themselves more stable and prolonging their decay times. At 90 K, the decay time of photogenerated I states is longer than that at 260 K, but the difference in their decay times for the weak excitation case (0.014 ph/DA pair) and strong excitation case (0.14 ph/DA pair) is rather small. At 90 K, the spin-Peierls-like instability working in the photogenerated I states is enhanced as compared to the case at 260 K and the dimeric molecular displacements within the photogenerated I domain are increased, which prolongs the decay time of photogenerated I domains, even if the I domain is isolated. Thus, the prolongation of the decay time at 90 K relative to that at 260 K originates from the increase in the dimeric molecular displacements. At 90 K, this effect overcomes the increase in the decay time with increasing number of I domains via the Coulomb attractive interaction.
5. Photoinduced Ionic-to-Neutral Phase Transition in TTF-CA
5.1. Photoinduced Ionic-to-Neutral Transition
In this subsection, we review the photoinduced I-to-N transition [17,19] and qualitatively compare its transition dynamics to those of the photoinduced N-to-I transition discussed in Section 4.
The transient changes in the reflectivity spectra in the region of the IM transition of TTF have also been investigated in detail by the femtosecond-pump–probe reflection spectroscopy with the time resolution of ~180 fs [17,19]. The dynamics revealed by these studies are schematically shown in Figure 12b. When TTF-CA is irradiated with a femtosecond laser pulse in the I phase, N states are generated. The efficiency of N-state-generation per photon is evaluated to be approximately 8 D0A0 pairs at 4 K and approximately 24 D0A0 pairs at 77 K, just below the NI transition temperature Tc = 81 K. Since the energy of the 1D N domain, […D+A−D+A−D0A0D0A0D0A0D0A0D+A−D+A−…], consisting of 8 (or 24) D0A0 pairs, is much lower than that of 8 (or 24) isolated D0A0 pairs. It is, therefore, reasonable to consider that 1D N domains are formed. The 1D N domain formation is schematically illustrated in Figure 12(bII). The increase in the domain size at 77 K relative to that at 4 K occurs because the energy difference between the I and N states decreases as the temperature increases to Tc. A 1D N domain is formed within 20 fs, similar to the case of the 1D I-domain formation in the N phase. The ultrafast dynamics of the initial N-domain formation is discussed in the following subsection.
At 4 K, the photogenerated N domains disappear with a time constant of approximately 300 ps when the density of N domains is low. When the excitation photon density is increased and the density of photogenerated N domains is enhanced, the surrounding or residual I states become unstable and are converted to N states, as shown in Figure 12(bIV). As a result, a macroscopic N region is generated. The number of N states finally produced is several times larger than that of the N states initially generated. The time constant τm of this multiplication process of the N states is approximately 20 ps, which is very slow as compared to the formation time (~20 fs) of a microscopic N domain. τm is considered a characteristic time for the changes in the lattice constants, that is, the increases in the volume, which are necessary for the stabilization of macroscopic N states. Note that the lattice constants in the N phase are longer than those in the I phase. Accordingly, τm is considered to be dominated by the time scale of acoustic phonons or the corresponding sound velocity. The macroscopic N states thus produced are fairly stable and their decay time is very long, typically being on the time scale of microseconds, although this depends on the excitation photon density and temperature.
Such a multiplication process of N domains and a formation of macroscopic and stable N states in the photoinduced I-to-N transition are in contrast to unstable and short-lived I states in the photoinduced N-to-I transition (see Figure 12a). We can relate this difference to the fact that the I-to-N transition is a destruction of the three-dimensional (3D) ferroelectric order. A destruction process of a 3D ordered state by photoirradiation occurs as a domino phenomenon. On the other hand, the photoinduced N-to-I transition is a reverse process, that is, a formation process of a 3D ordered state, so that it is difficult to induce by photoirradiation, as mentioned in Section 4.5.
5.2. Ultrafast Dynamics of Neutral Domain Formation and Multiplication
In the photoinduced I-to-N transition, 1D N domains are initially produced. To investigate the ultrafast dynamics of this 1D N-domain formation, we also performed pump-probe reflection measurements with a time resolution of ~20 fs using the two-NOPA system. In this subsection, we report the results of these studies.
In Figure 18a, we show the polarized reflectivity spectra with E//a at 4 K as well as with E⊥a at 4 K and 90 K. We also show the spectra of pump and probe pulses by the shaded areas, which are the same as those used in the experiments for the photoinduced N-to-I transition discussed in Section 4.2. The N-domain formation was investigated by probing the IM transition of TTF. In the same figure, we show the differential reflectivity spectrum, , by the dashed-dotted line, which is the spectral change expected when the I state is converted to the N state. The starting point is in the I phase, so that the decrease in the reflectivity for the probe pulse indicates the photogeneration of N states.
In Figure 18b, we show the time evolutions of the photoinduced reflectivity changes ΔR/R at 10 K for the strong excitation case (xph = 0.12 ph/DA pair) (I, II) and the weak excitation case (xph = 0.03 ph/DA pair) (III, IV). In both cases, the initial decrease in the reflectivity is very fast. Their time constant are both estimated to be approximately 20 fs, which is comparable to the time scale of the transfer energy t. This suggests that a 1D N domain is formed via purely electronic processes, or equivalently, collective charge transfers, similar to the case of the photoinduced 1D I-domain formation in the N phase.
We measured the time evolutions of ΔR/R at various excitation densities xph at 10 K. In Figure 19a, we plot ΔR/R values at td = 0.1 ps with squares as a function of xph, which reflects the number of photogenerated I states. ΔR/R is roughly proportional to xph for xph < 0.07 ph/DA pair. Assuming a linear relation for xph < 0.07 ph/DA pair and the value of , we estimated the size of the 1D N domain generated per photon to be approximately 7 D0A0 pairs, which is consistent with the result (8 D0A0 pairs) of the pump–probe experiments with the time resolution of 180 fs at 4 K (see Section 5.1). The saturation of the signal at approximately xph ~ 0.08 ph/DA is due to the space filling of the photogenerated N states.
5.3. Collective Molecular Dynamics
As shown in Figure 18b, after the initial rapid decrease in ΔR/R reflecting the photoinduced 1D N-domain formation, complicated oscillatory structures appear, which are attributable to the molecular deformations and molecular displacements, similar to the case of the photoinduced 1D I-domain formation in the N phase [30]. Here, we focus on the slow oscillations with the period of approximately 0.6 fs. This oscillation is proportional to −cos(ωt) with a frequency of 55 cm−1, as shown by the green lines in Figure 18(bII,IV).
Owing to the similarity of this oscillation to that with 53 cm−1 observed in the photoinduced N-to-I transition, it is natural to consider that this oscillation is related to the dissolution of the dimeric molecular displacements within 1D N domains. Since a 1D N domain is formed very fast (~20 fs) via the collective charge back transfer processes, dimeric molecular displacements do not change at all during this process. In the 1D N domain, each molecule has no spin; therefore, the dimeric molecular displacements should disappear, which gives rise to the coherent oscillation of the optical mode corresponding to the dimerization. This oscillation is expressed by −cos(ωt), such that the reflectivity starts to increase from the time origin. This means that the degree of CT ρ initially increases by the decrease in the dimeric molecular displacements. Considering that the oscillation occurs in the N state, this change in ρ is attributable to the increase of the effective transfer energy t by the dissolution of the dimeric molecular displacements. This means that the effect of the increase in the interdimer transfer energy is more important than that of the decrease in the intradimer transfer energy.
In the weak excitation case, the initial dynamics shown in Figure 18(bIV) cannot be reproduced only by the minus-cosine-type oscillation. The phase of the oscillation seems to be reversed only at td < 0.7 ps. This behavior suggests that in the weak excitation case, the oscillatory component proportional to cos(ωt) exists in addition to the long-lived oscillation proportional to −cos(ωt), and that the decay time of the former is very short. Considering these two kinds of damped oscillators, we adopt the fitting function F(t)
where the first and second terms correspond to the long-lived oscillation and short-lived oscillations, respectively. By using this function, the oscillatory component for the weak excitation case can be well reproduced, as shown by the red line in Figure 19b. In this fitting, we adopted a simple exponential-decay function to express the background signal. Two oscillatory components are also shown in the same figure. The obtained parameters are ω = 55 cm−1, τ1 >> 10 ps, and τ2 = 0.22 ps.
We carried out similar analyses on the oscillatory components at several excitation photon densities xph and extracted the xph dependence of the amplitudes A2 of the short-lived oscillation, which is plotted using circles in Figure 19a. A2 is saturated at xph ~ 0.02 ph/DA pair and rather decreased at xph > 0.05 ph/DA pair. We explain such peculiar behaviors by attributing the short-lived oscillation to the oscillation in the I state. After the initial formation of a 1D N domain, the I state surrounding the N domain destabilized and the dimeric molecular displacements in the I state would also be slightly decreased, as shown in Figure 19c. The I state is a 3D ordered ferroelectric state. Therefore, the decrease in the dimerization would be induced over a wide spatial region through the interchain interactions. Assuming a space filling of the oscillating region [35] and using the saturation value of xph = 0.02 ph/DA pair, the oscillating region is estimated to be ~50 DA pairs per photon. This short-lived oscillation is of the plus-cosine type and the reflectivity starts to decrease at the time origin, as seen in Figure 19b. This indicates that the decrease in the dimerization gives rise to the decrease in ρ. Such a decrease in ρ by the decrease in the dimeric molecular displacements is attributable to the decrease in the intradimer Coulomb attractive interaction. This interpretation is consistent with that of the coherent oscillation in the photogenerated I domains discussed in Section 4.3.
6. Control of Ferroelectric Polarization by Terahertz Electric Field in the Ionic Phase of TTF-CA
6.1. Rapid Modulation of Ferroelectric Polarization
Important applications of ferroelectrics in the field of optics are based upon the Pockels effect and second-order optical nonlinearity. By using the Pockels effect, we can rotate the polarization of light via an anisotropic change in refractive index by an electric field. Second-order optical nonlinearity is indispensable for SHG and various other kinds of light frequency conversion. If the amplitude or direction of a macroscopic polarization in ferroelectrics could be rapidly changed, advanced control of light, which is difficult in conventional nonlinear optical materials, would be achieved. As discussed in Section 2.3, TTF-CA is a typical electronic ferroelectric, in which the ferroelectric polarization is produced by intermolecular collective electron transfers from D to A molecules. Therefore, we can expect that its ferroelectric polarization can be controlled on the subpicosecond time scale by an external stimulus, as well as via the collective intermolecular electron transfers. When TTF-CA in the I phase is irradiated with a femtosecond laser pulse at above the CT transition peak, the I-to-N transition occurs and the SHG is suppressed [16]. In this phenomenon, however, the recovery of the original polarization takes 300 ps or longer [19]. For the rapid control of the ferroelectric polarization, it is useful to use an electric-field component of light. In this section, we review the study aiming to control the ferroelectric polarization in TTF-CA by a nearly monocyclic terahertz electric-field pulse [41].
6.2. Terahertz-Pulse-Pump Second-Harmonic-Generation-Probe Measurements in the Ionic Phase
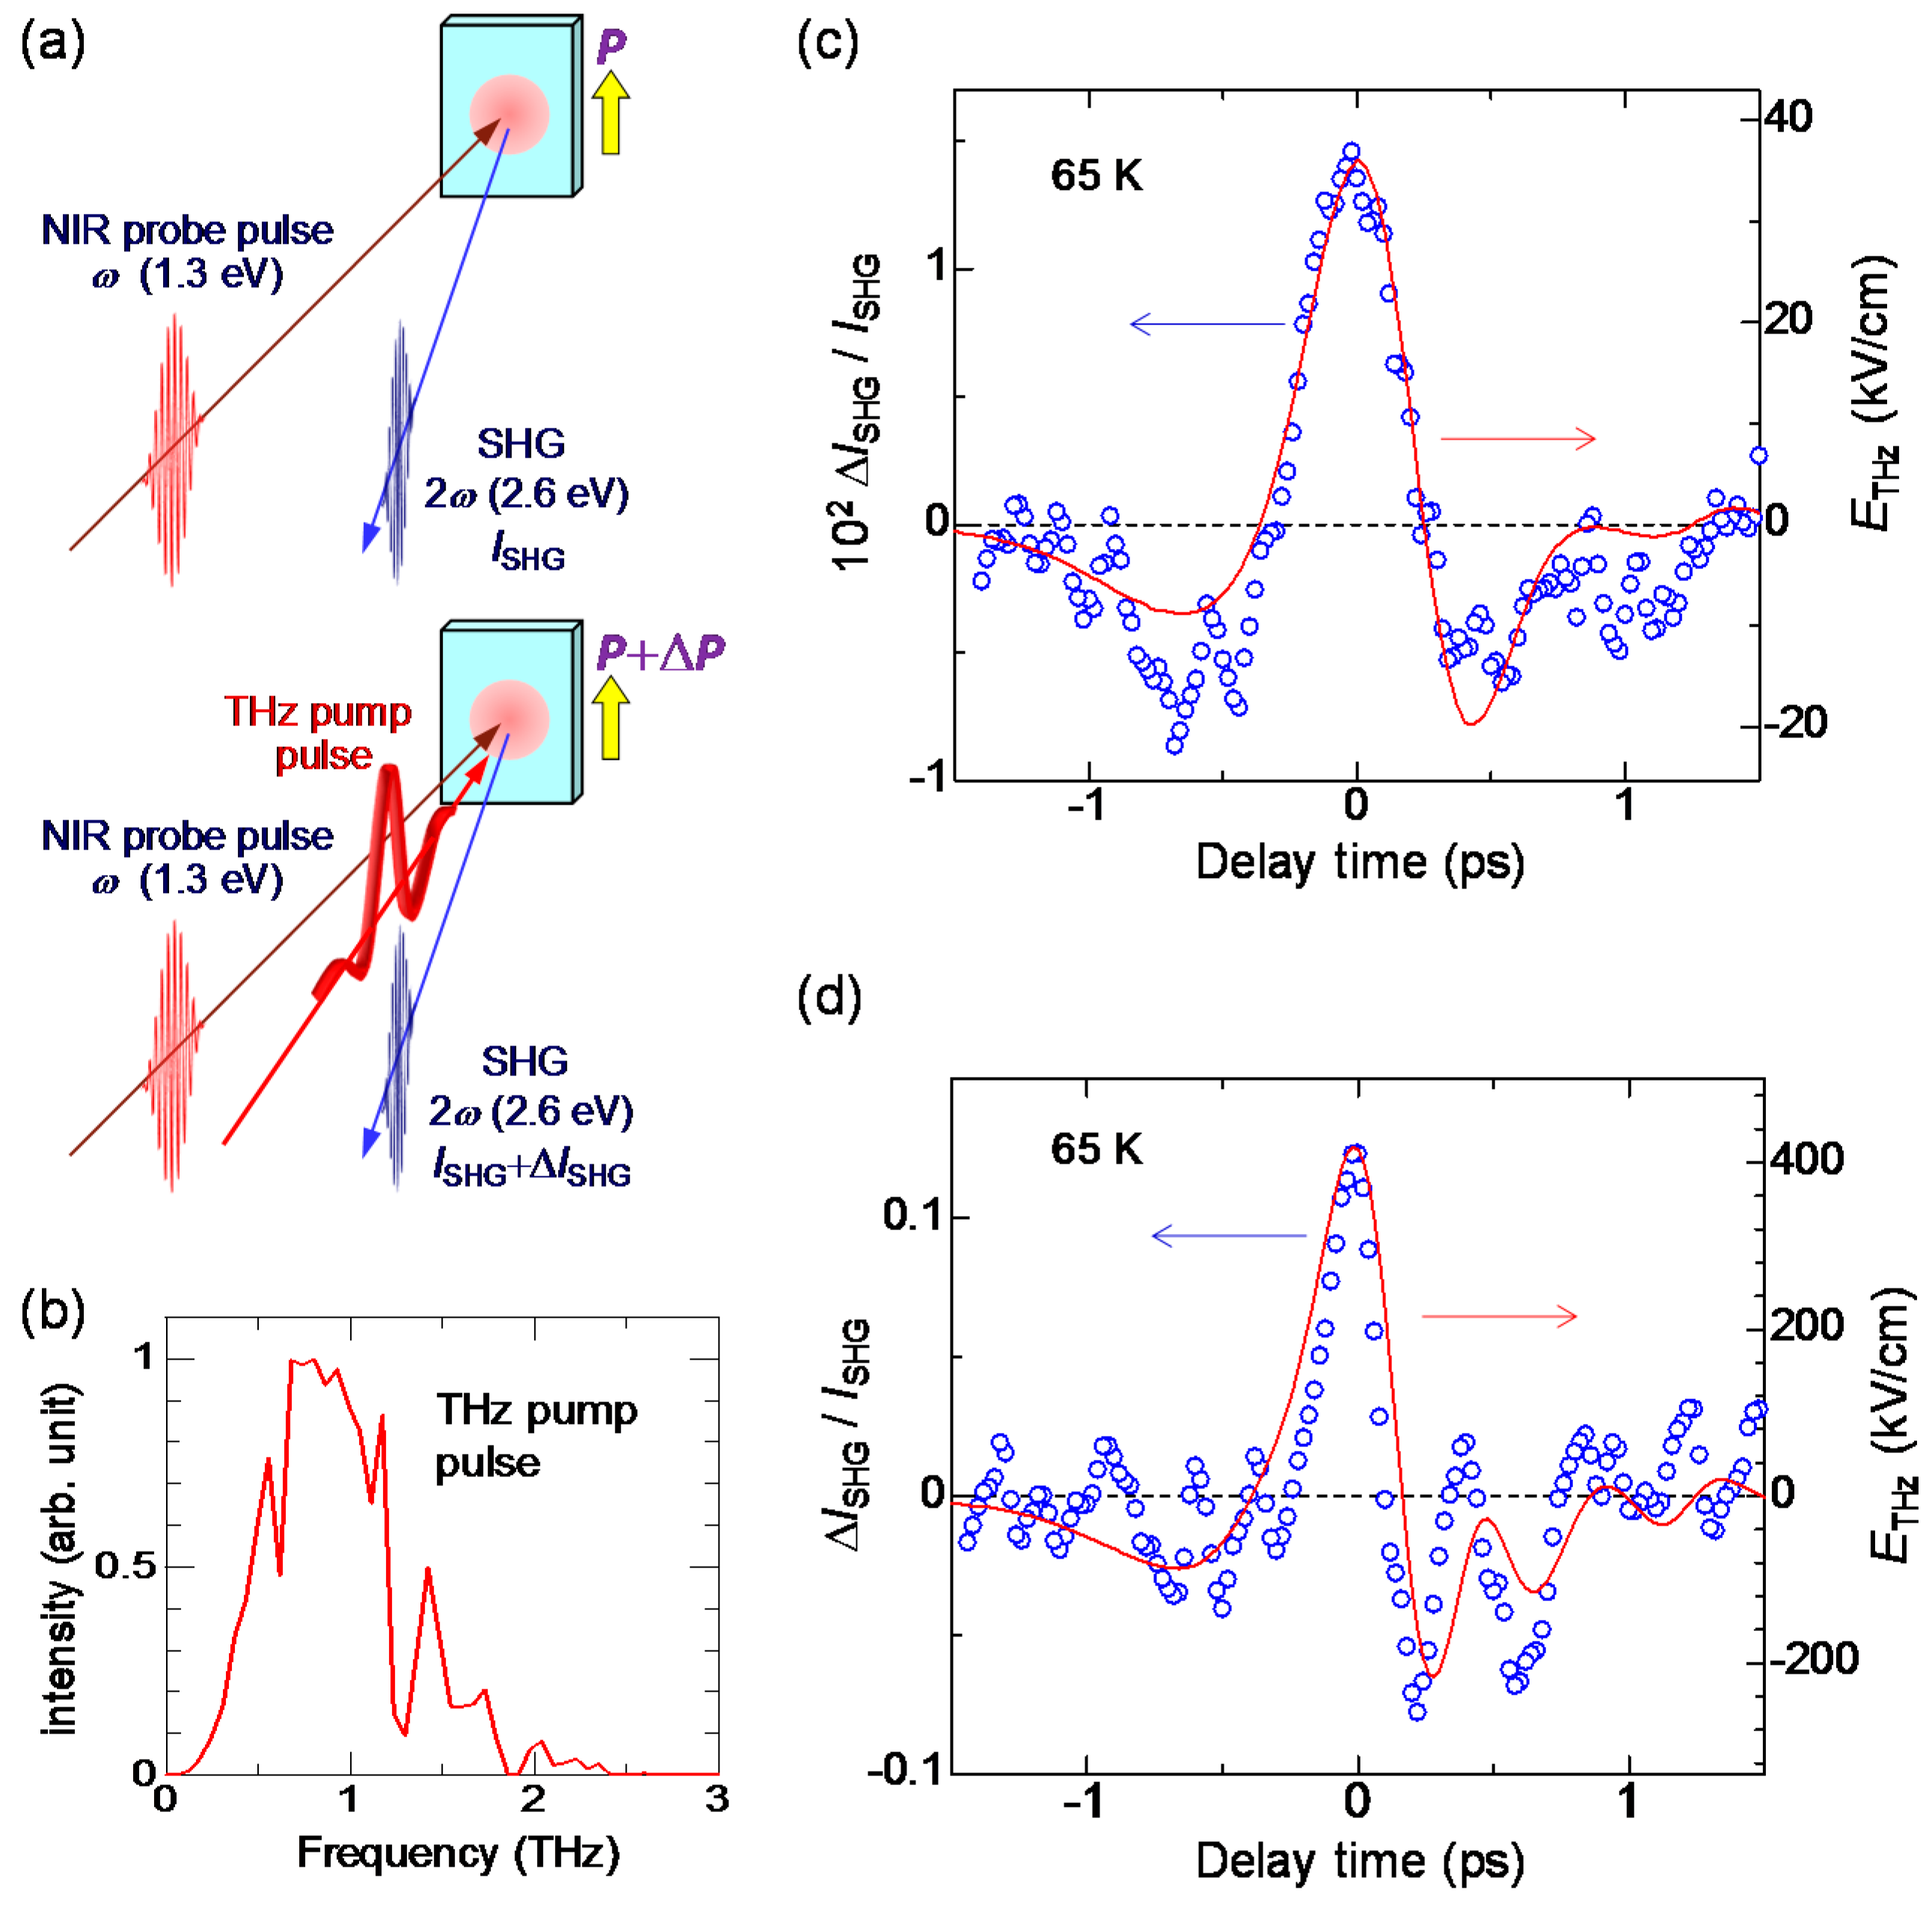
In order to detect a change in a macroscopic polarization P, it is effective to use SHG. As mentioned in Section 2.4, a ferroelectric domain in the I phase is large, typically 200 × 200 μm in size. This domain size is comparable to or larger than the spot size of a probe pulse (diameter of 100–200 μm) in pump-probe experiments. Therefore, we can detect changes in the macroscopic polarization by probing the change in SHG intensity. The terahertz-pulse-pump SHG-probe measurement on TTF-CA was performed in a reflection configuration, the schematic of which is shown in Figure 20a. The electric fields of both the pump and probe pulses are parallel to the a axis. The red line in Figure 20b shows the electric field waveform [] of a terahertz pulse. The amplitude of the terahertz electric field is approximately 36 kV/cm. The Fourier power spectrum of the terahertz electric field is shown in Figure 20c. The peak frequency is ~0.75 THz (~25 cm−1).
When the probe light with the photon energy of 1.3 eV was incident to a single crystal of TTF-CA at 65 K, the SH light with the photon energy of 2.6 eV was observed. Both the incident probe light and the SH light were polarized parallel to the a axis. It was ascertained that the intensity of the SH light, , was proportional to the square of the intensity of the incident probe light. This confirmation is important to avoid the saturation of SH light intensity and to execute accurate measurements. In Figure 20c, we show the time characteristic of the terahertz-electric-field-induced change [] in the SHG intensity () by open circles, which is in good agreement with the electric-field waveform [] of the terahertz pulse (the red line). This demonstrates that the macroscopic polarization P is modulated by the terahertz electric-field , as .
6.3. Terahertz-Pulse-Pump Optical-Reflectivity-Probe Measurements in the Ionic Phase
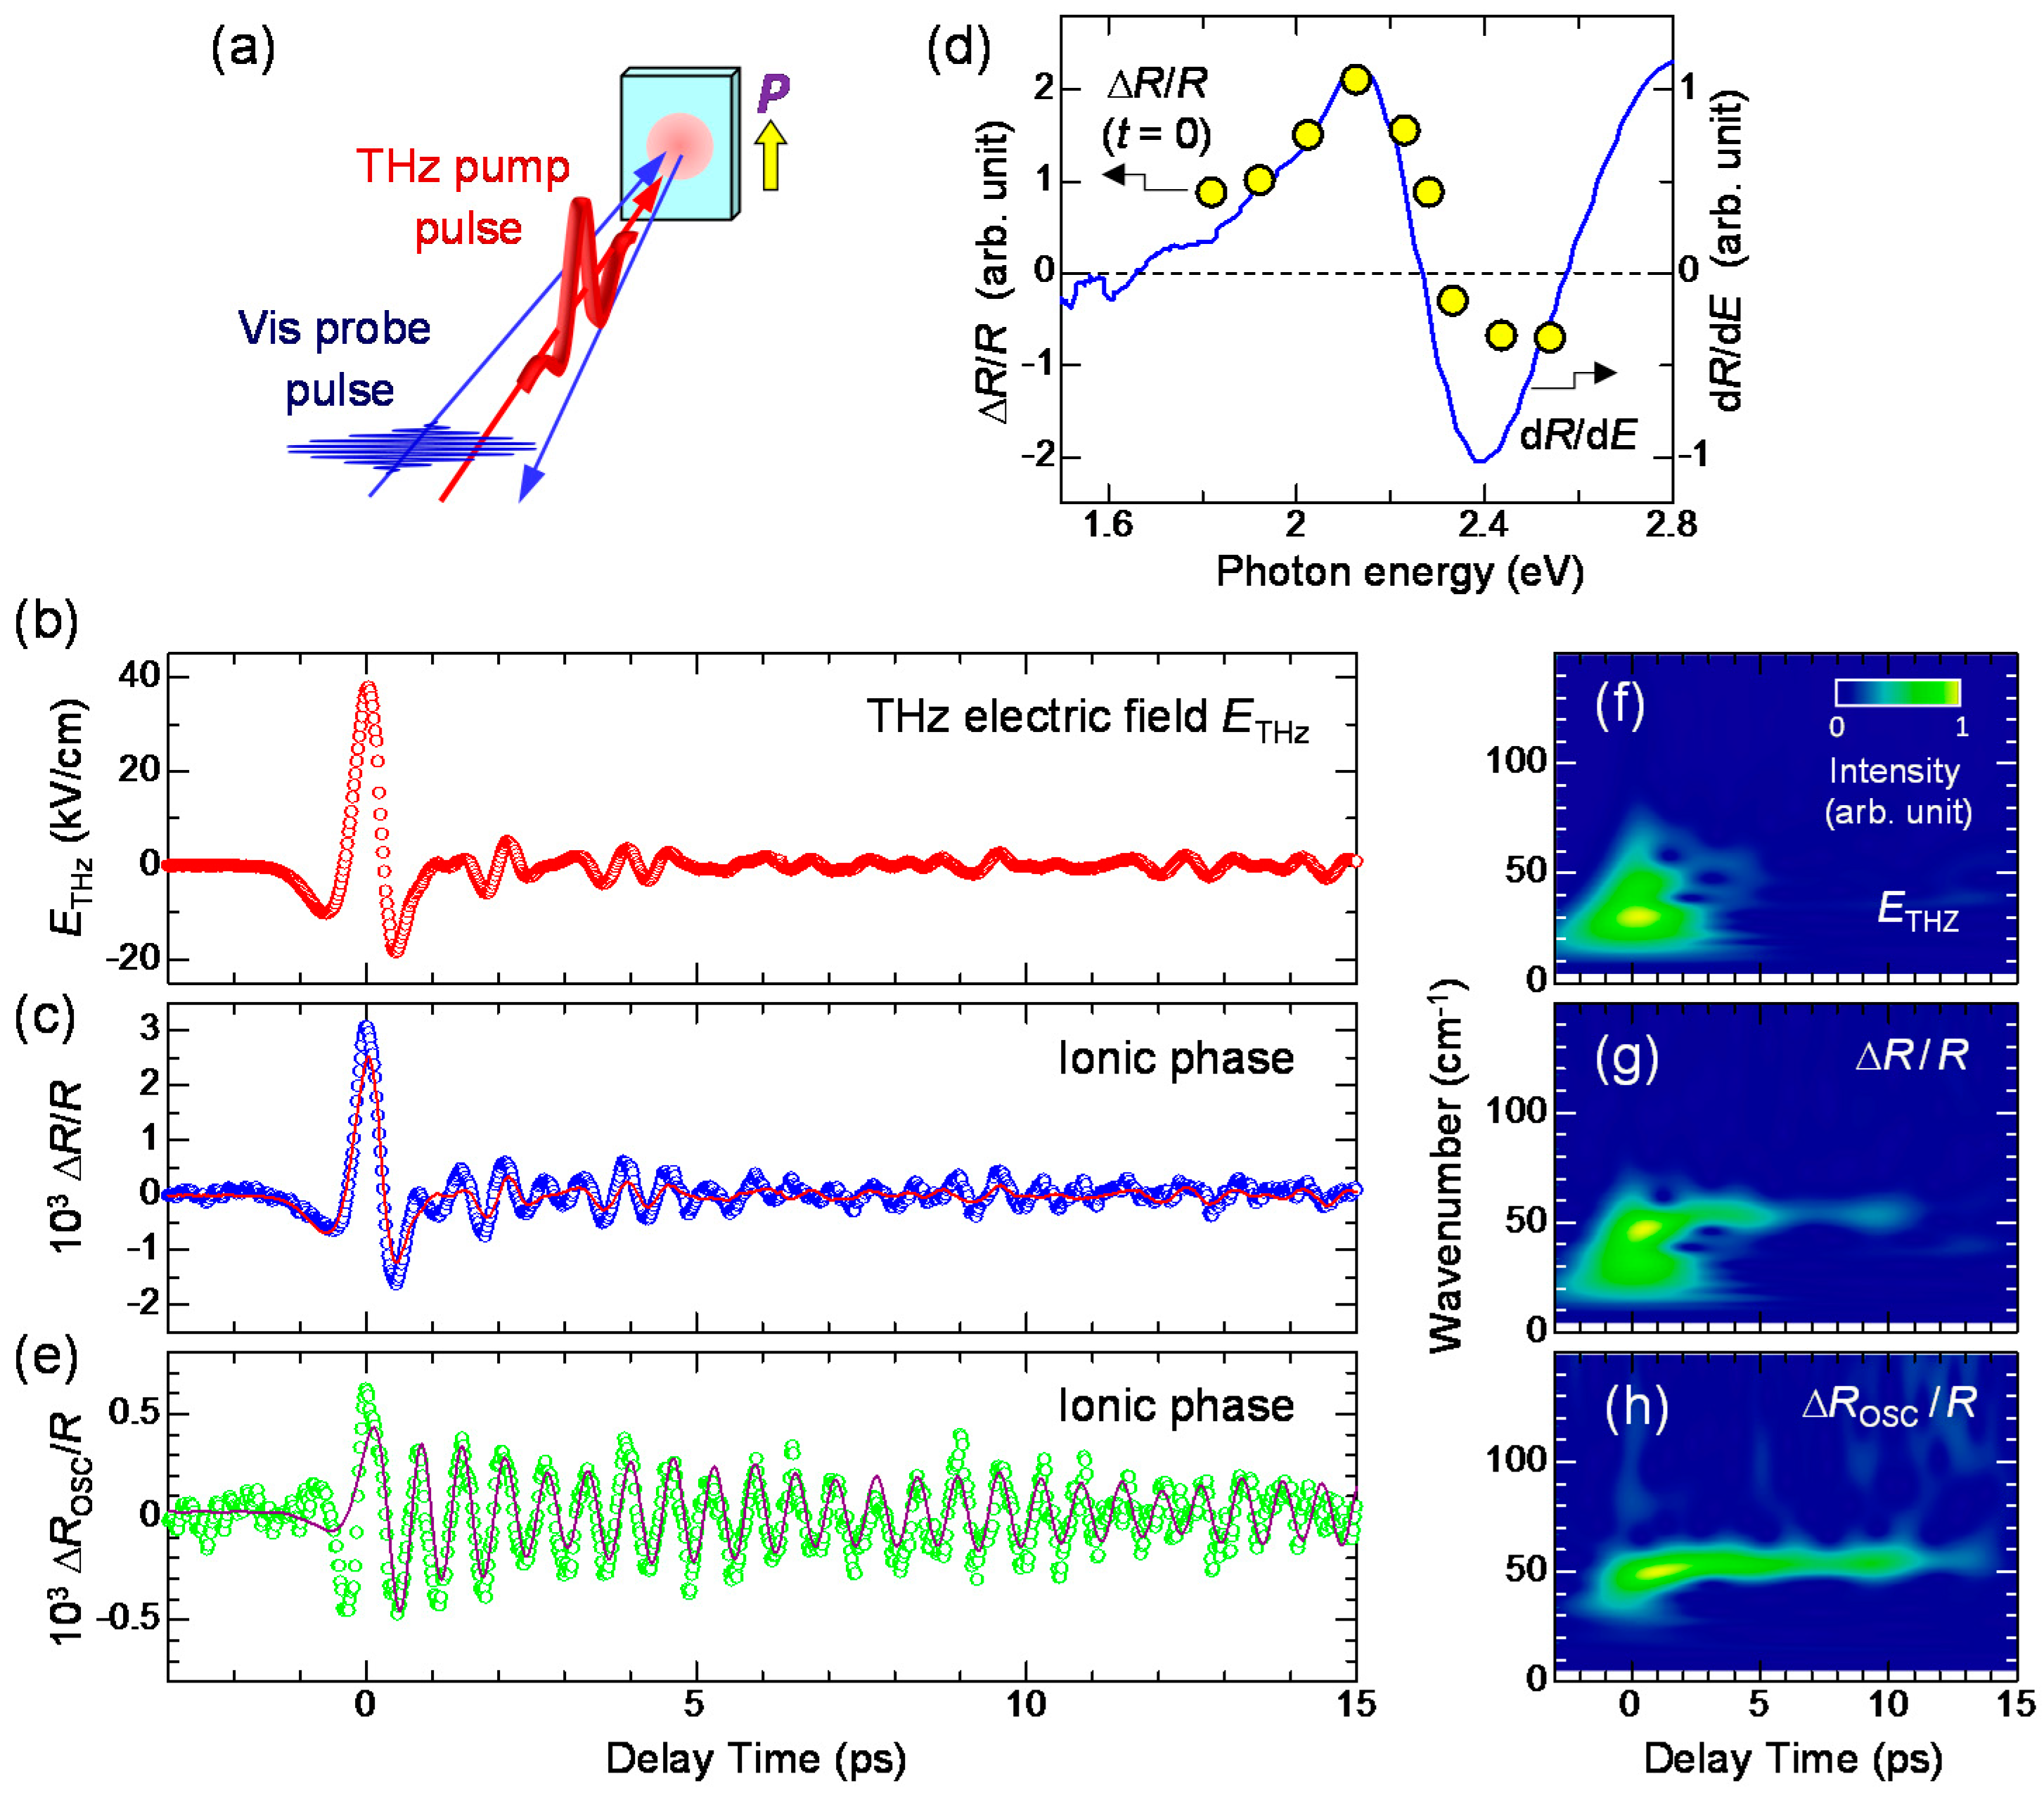
As mentioned in Section 2.3, the origin for the ferroelectric polarization in the I phase is the increase in ρ across the NI transition at 81 K. Therefore, we expect that the electric-field-induced change in may be attributed to the change in via a partial charge transfer between D and A molecules. To ascertain this, we investigated the electric-field-induced change in , using the reflectivity change of the IM transition band of TTF. This is the terahertz version of the ER spectroscopy reported in Section 2.4 [61]. Figure 21a shows the schematic of the terahertz-pump optical-reflectivity-probe spectroscopy. The probe energy is set at 2.2 eV. The polarization of the probe pulse is perpendicular to the a axis (E⊥a) and its temporal width is approximately 130 fs. By measuring the reflectivity change in this region, we can observe the electric-field-induced changes in ρ.
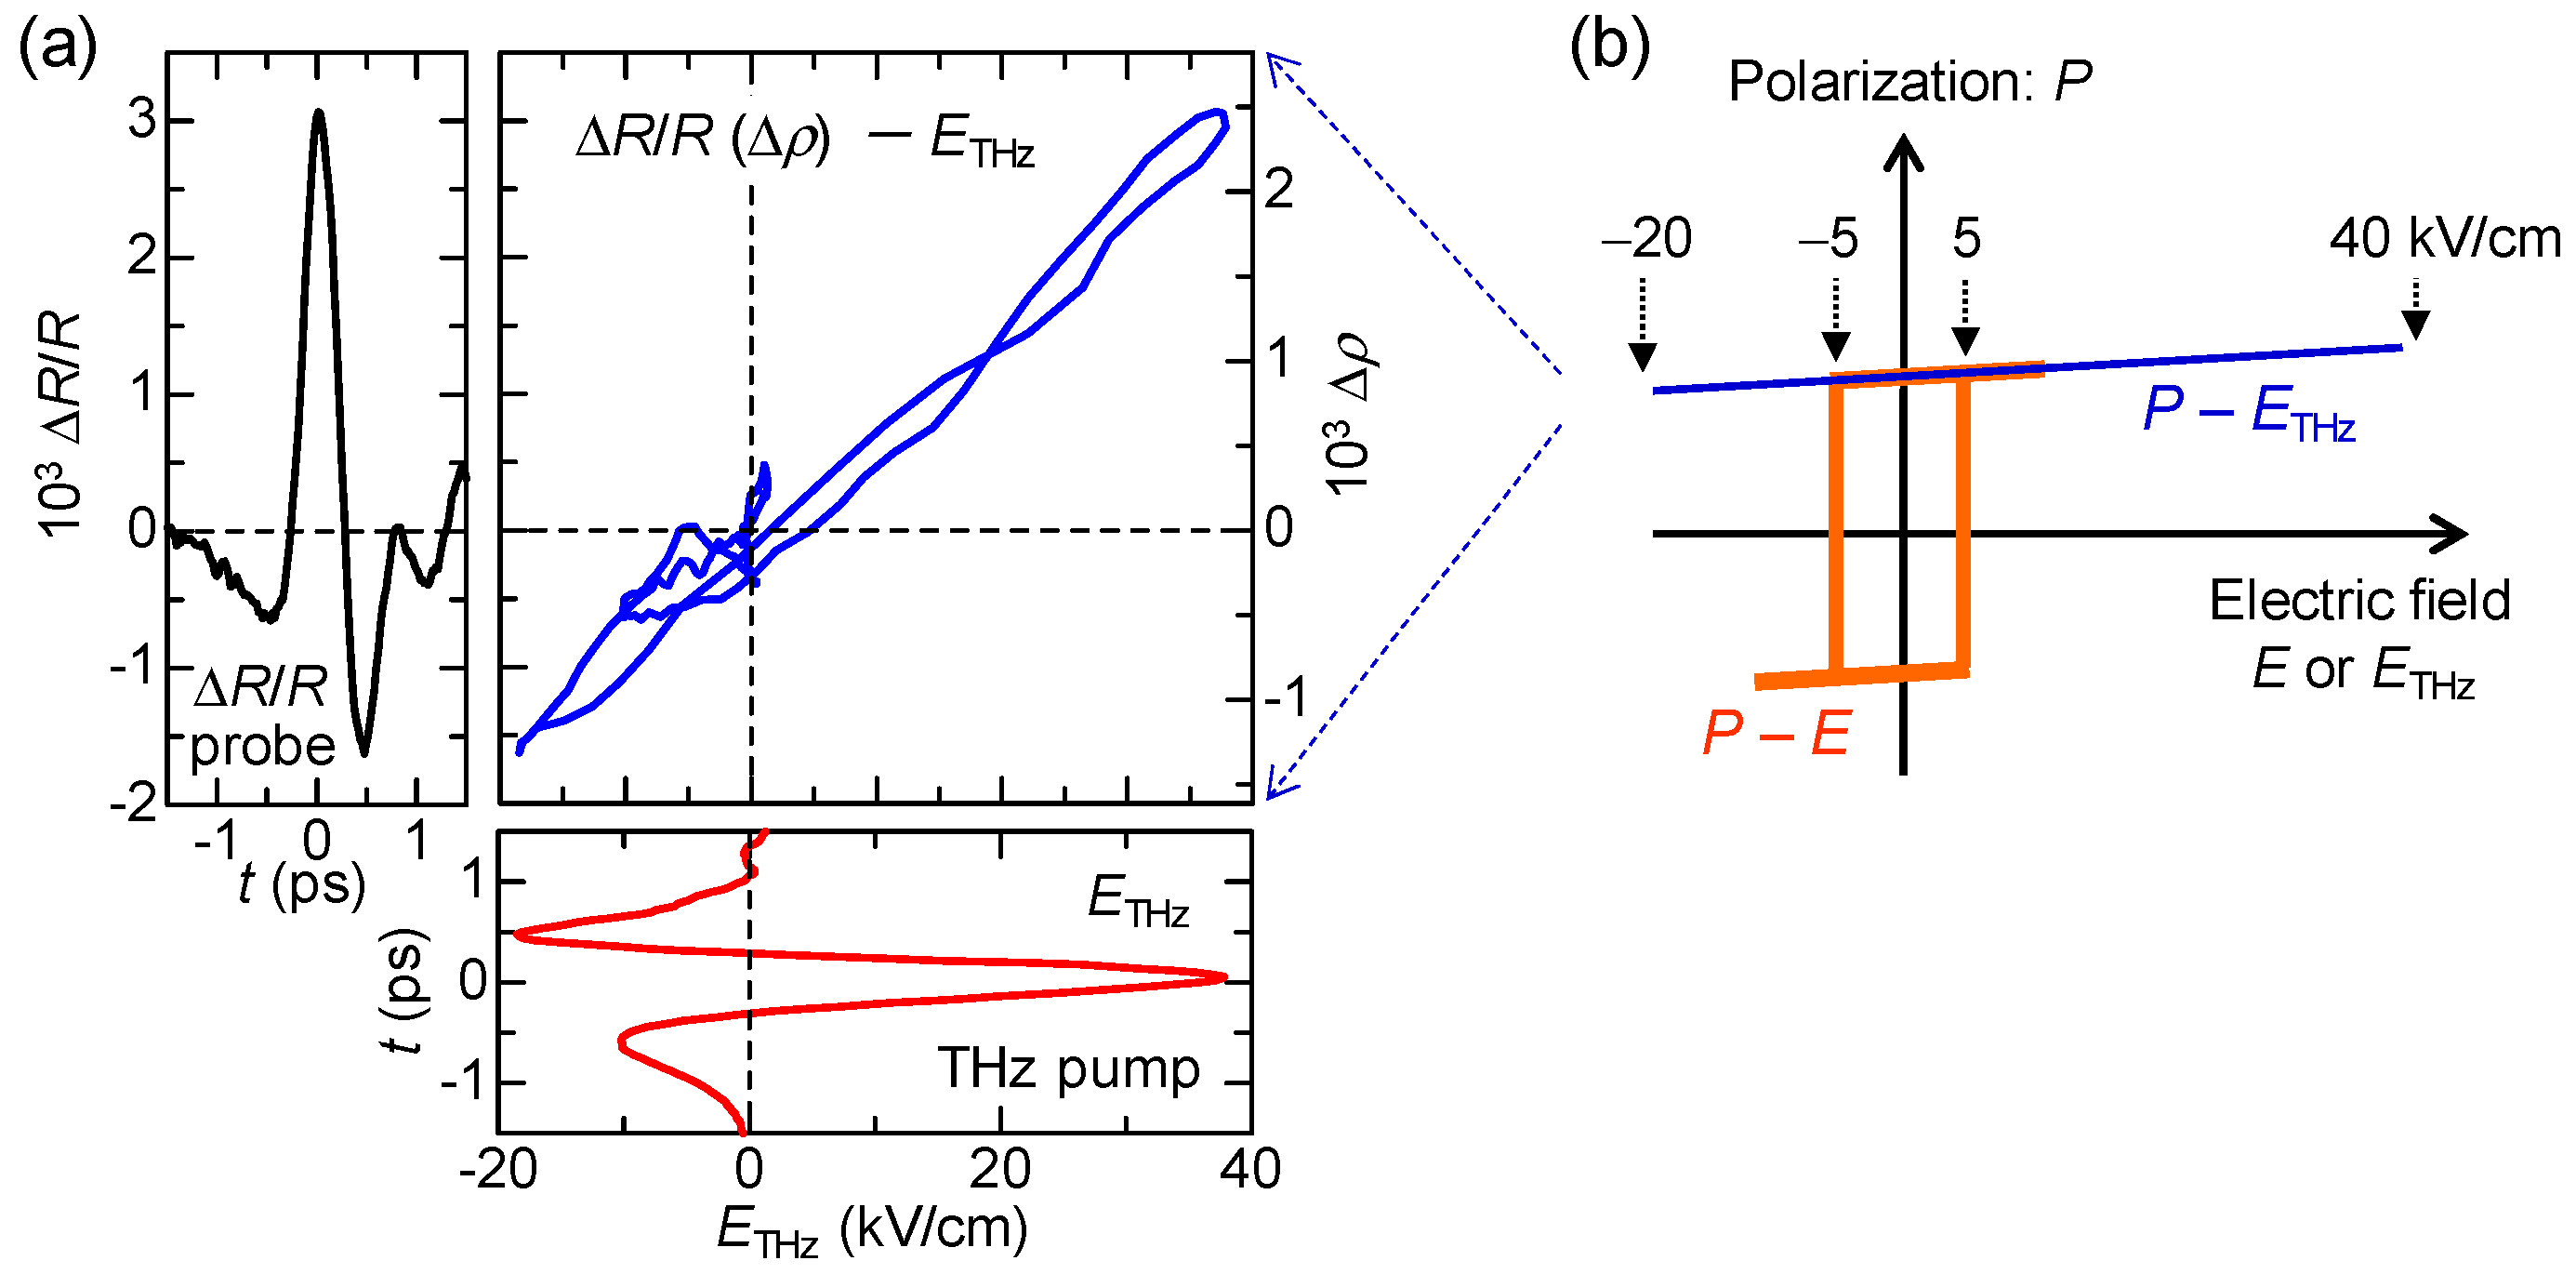
In Figure 21c, we show by open circles the time evolution of at 2.2 eV measured at 78 K. The reflectivity increase (decrease) at this energy indicates the increase (decrease) in ρ. The red circles in Figure 21b and the red line in Figure 21c show the electric-field waveform, . The latter is shown on a normalized scale. at around the time origin accords with . In Figure 21d, we show the probe energy dependence of by yellow circles, which are in good agreement with the first energy derivative of the reflectivity (the blue line). The latter shows a reflectivity change by the lower energy shift of the IM transition band of TTF, which corresponds to an increase in ρ. This indicates that ρ is increased by the electric field of the terahertz pulse. In Figure 22a, we plot in the range of td = −1.5 to 1.5 ps as a function of . This plot clearly shows that and ρ are proportional to and that the change in ρ follows the change of the electric field with no time delay. These results suggest that the electric-field-induced change in ρ occurs via electronic processes without structural changes and is attributable to the intermolecular fractional CTs within each dimeric DA pair.
In Figure 23, we show schematically the observed response to the terahertz electric field ((a→b) and (a→c)). In Figure 21c, at the time origin is positive, indicating that and ΔP are positive. This means that the original polarization P is parallel to the terahertz electric field at the time origin as shown in Figure 23b. We performed similar experiments on several samples. In some of the samples, was negative at the time origin, indicating that and are negative. In those samples, P is anti-parallel to , as shown in Figure 23c.
6.4. Magnitudes of Polarization Modulation
In this subsection, we discuss the magnitude of the electric-field-induced change in the degree of CT ρ and ΔP in the polarization P. From the magnitude of , is evaluated to be ~2.5 × 10⁻³ at = 38 kV/cm. ΔP can also be calculated from the electric-field change in the SHG intensity . Assuming that the second-order nonlinear susceptibility χ(2) is proportional to the magnitude of P, we obtain = 2 using the relation, . From the value of , is estimated to be ~0.75% at = 36 kV/cm. is produced by the collective charge transfers, , from A to D molecules, which occur across Tc. Therefore, we can also calculate from the magnitude of obtained by the terahertz-pump optical-reflectivity-probe measurements. In this case, is evaluated to be ~1.25% at = 38 kV/cm, which is consistent with the value obtained from the SHG measurements (~0.75% at = 36 kV/cm).
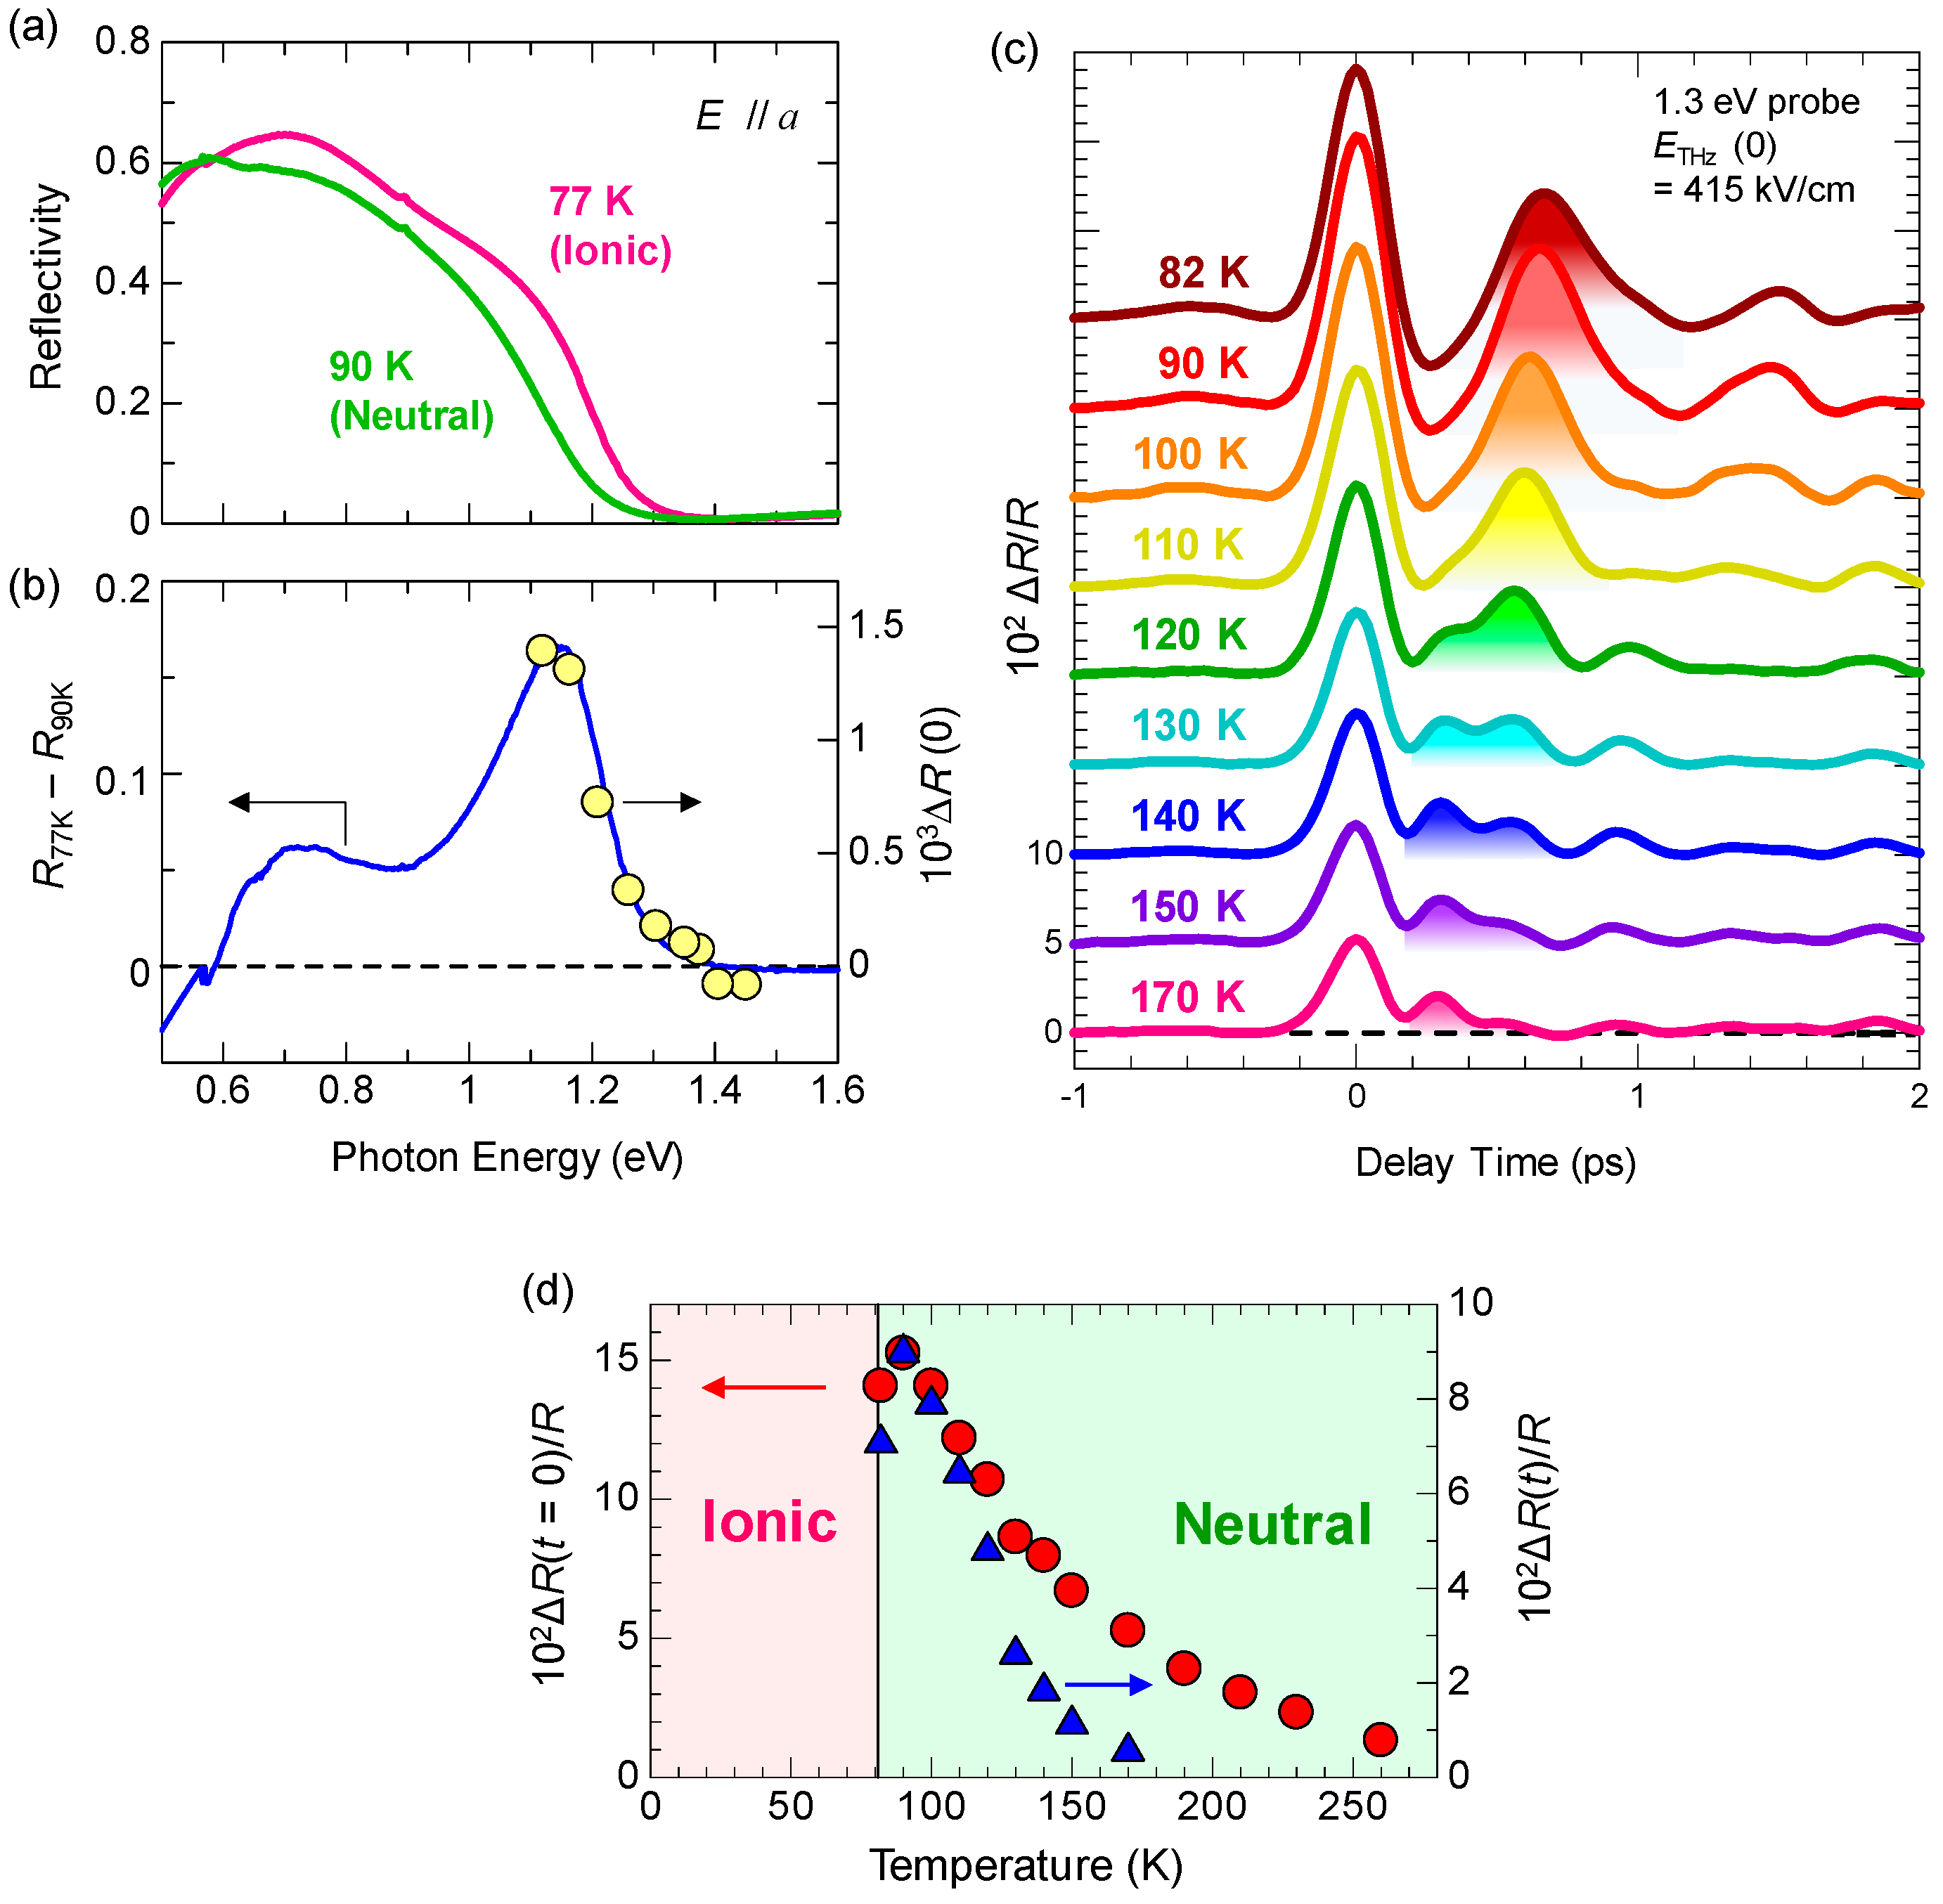
Next, we compare the observed response to the terahertz electric field with the polarization electric-field () characteristic previously reported [53]. The characteristic is schematically shown by the orange line in Figure 22b. The coercive field is approximately 5 kV/cm at 50 K. By an application of a static electric field larger than , the polarization is reversed probably via domain-wall motions. The response to the terahertz electric field is essentially different from that to the static electric field. The curve in Figure 22a can also be regarded as the curve (see the right vertical scale). Considering that the magnitude of the charge transfer, ~ 0.2, across the NI transition determines the magnitude of the original polarization , is proportional to . Namely, the curve corresponds to the curve. This curve is schematically shown by the blue line in Figure 22b. As a motion of a ferroelectric domain wall is slow and its time scale is in the millisecond range [53], it never moves by a subpicosecond change in an electric field within a terahertz pulse. This means that we can apply a large electric field only to the electronic system without inducing any motions of ferroelectric domain walls and, therefore, we can cause a large and ultrafast polarization modulation through electronic-state changes. Such a feature has also been theoretically demonstrated by H. Gomi, A. Takahashi, et al. [94]. In fact, the recent terahertz-pump SHG-probe measurement with the higher electric field ( = 415 kV/cm) revealed that the increase in SHG, , reaches 14%, as shown in Figure 20d. In this case, the increase in the polarization, , reaches 7%. Thus, we have successfully achieved ultrafast and large polarization modulation in TTF-CA by using a strong terahertz electric-field pulse.
6.5. Coherent Oscillation Generated by Electric-Field-Induced Polarization Modulation
In this subsection, we discuss the reflectivity change for td > 0.5 ps. in this time domain cannot be reproduced by ETHz(t) alone, as seen in Figure 21c. An additional oscillatory component seems to exist in ΔR/R. By subtracting the normalized terahertz waveform [ETHz(t)] from ΔR/R, we extracted the oscillatory component ΔROSC/R and showed it with open circles in Figure 21e. The period of the oscillation is approximately 0.6 ps. We also performed a wavelet analysis and obtained the time dependence of the Fourier power spectra of the terahertz waveform ETHz(t), the reflectivity change ΔR/R(t), and the oscillatory component ΔROSC/R(t), which are shown as the contour maps in Figure 21f–h, respectively. ETHz(t) ranges from 5 to 60 cm-1 and is localized around the time origin. Conversely, ΔROSC(t)/R shows a monochromatic component at 54 cm−1, which is observed even at td > 10 ps. The same component is also clearly observed in ΔR(t)/R. This oscillation mode with 54 cm−1 modulates the degree of charge transfer ρ, so that it is reasonable to assign it to the lattice mode associated with the dimerization. The similar coherent oscillation of this mode is observed in the photoinduced N-to-I transition, as detailed in Section 4 [19].
Detailed studies of infrared (IR) vibrational spectroscopy on TTF-CA have been reported by A. Girlando et al. [95]. According to them, several IR-active lattice modes were observed below 100 cm−1 in the I phase. In the terahertz-pump optical-reflectivity-probe experiment, we observed only a mode with a frequency of 54 cm−1 as a coherent oscillation. This result supports our interpretation that this mode corresponds to the dimerization and coupled strongly with intermolecular charge transfers.
Next, we discuss the generation mechanism of this coherent oscillation more in detail. A possible mechanism is the direct generation of the oscillation by the terahertz electric field. However, this possibility is excluded, because the directions of the field-induced displacements of D and A molecules are opposite to those expected for displacive-type ferroelectricity, as mentioned in Section 2.3 (see Figure 6). Note that the first cycle of the oscillatory change in in Figure 21e is in good agreement with the initial rapid change in (Figure 21c) directly driven by the terahertz electric field. This suggests that is parallel to P (Figure 23b) as seen in Figure 22a and that D (A) molecules move antiparallel (parallel) to the original polarization P, as shown in Figure 23d.
The most plausible mechanism for the generation of the coherent oscillation is the modulation of the spin-Peierls dimerization via the rapid modulation of . When the direction of is parallel to the ferroelectric polarization (Figure 23b), should be increased first to via electronic processes, such that is increased as mentioned above. The increase in induces an increase in the spin moment of each molecule, as illustrated by the red arrows in Figure 23b. Then, the spin-Peierls mechanism works more effectively, and the molecular dimerization is strengthened (Figure 23d). The resultant increase in the molecular displacements further increases the degree of charge transfer from to ′ by the increase in the Coulomb attractive interaction within each dimer. Thus, the terahertz field gives rise to a forced molecular oscillation of the spin-Peierls mode via the change in . Then, an additional oscillation in the degree of charge transfer with amplitude ′ and in the polarization with amplitude ΔP’ occurs, synchronized with the molecular oscillation, as (d) ↔ (e) in Figure 23. When the direction of is antiparallel to the original polarization , as shown in Figure 23c, should first decrease and then oscillate coherently as (e) ↔ (d) in Figure 23, triggered by the decrease in the dimeric molecular displacements (Figure 23e).
In this mechanism, the time evolution of is expressed by the following formula, which is the convolution of and a sine-type damped oscillator.
Here, and Ω are the decay time and frequency of the oscillation, respectively. One may regard this formula as the forced oscillation of the optical mode driven directly by the terahertz electric field. However, we can show that the oscillation driven by the electric-field-induced modulation of is also expressed by the same formula [41]. By using this formula, the time evolution of was reproduced well with values of ~ 8.7 ps and Ω ~ 54 cm−1, as shown by the solid line in Figure 21e. From these results, we conclude that the coherent oscillation of the degree of charge transfer originates from the modulation of the spin-Peierls dimerizations due to the rapid change in , which is induced by the terahertz electric field.
It is valuable to quantitatively evaluate the terahertz-field-induced change in the dimeric molecular displacement. This is possible by assuming that the change of the displacement along the a axis is proportional to the additional increase in the degree of charge transfer, which is reflected by the amplitude of . At 40 K, the dimeric molecular displacement is 0.085 Å, as mentioned in Section 2.1. Comparing the initial amplitude of the oscillation 5×10⁻⁴ with the normalized reflectivity change between 77 K (ionic phase) and 90 K (neutral phase), 0.1, the change of the displacement induced by the terahertz electric field was evaluated to be 5 × 10⁻³ at 38 kV/cm.
7. Generation of Ferroelectric Polarization by Terahertz Electric-Field Pulse in the Neutral Phase of TTF-CA
7.1. Rapid Generation of Large Polarization
A large change in a macroscopic polarization in a solid will cause large changes in refractive index and absorption coefficient. If we generate a large polarization in a paraelectric material in an impulsive manner, we will be able to realize an ultrafast optical switching via instantaneous changes in refractive index or absorption coefficient. It has been one of the most important subjects in modern optical technology for a long time to accomplish such an ultrafast optical switching without real carrier excitations. Electronic-type dielectrics will be good target materials to pursue such a control of polarization for the achievement of ultrafast optical switching. In this section, we review the recent study, which aimed at the ultrafast generation of large polarization by a terahertz electric field in the N phase of TTF-CA [42].
7.2. Terahertz-Pulse-Pump Second-Harmonic-Generation-Probe Measurements in the Neutral Phase
To detect the polarization generation, we performed a terahertz-pump SHG-probe experiment, which is schematically shown in Figure 24a. In the N phase, TTF-CA has inversion symmetry and does not show SHG. To precisely detect terahertz-electric-field-induced SHG, we carried out the experiment in the following way. First, the sample was cooled down to 65 K and brought to the ferroelectric I phase. At 65 K, the probe light (1.3 eV) with E//a was incident to the crystal and the intensity of the SH light (2.6 eV), , was measured in the reflection configuration. The SH light was polarized parallel to the a axis. Next, the temperature was increased to 90 K and the sample was returned to the N phase. At 90 K, we executed the terahertz-pump SHG-probe measurements with the same intensity of the incident probe light as that used at 65 K. In this procedure, we can quantitatively compare the terahertz-field-induced SH intensity in the N phase with in the I phase.
When the maximum electric field of the terahertz pulse, , was not large [], we could not find SHG signals. By increasing to approximately 400 kV/cm, we successfully detected the SHG signal at 90 K, which is shown in Figure 24c. The electric-field waveform and the Fourier power spectrum of the terahertz pulse are shown in Figure 24b,d, respectively. The maximum of the electric field, , is 415 kV/cm. The observation of the SHG demonstrates that the macroscopic polarization is generated by the terahertz electric field.
As shown in Figure 24c, exhibits a pulsed response at around the time origin and is almost in agreement with the square of the terahertz electric field (the shaded area). A quadratic dependence of on is reasonable, since inversion symmetry exists in the N phase. The initial SH intensity at 90 K, , is approximately 2.9% of the SH intensity, , measured at 65 K. Using the relation, , we can deduce that the electric-field-induced polarization reaches 17% of the polarization at 65 K in the I phase. The pulsed response of at around the time origin leads us to expect that the electric-field-induced charge transfers are responsible for the initial polarization generation. For td > 0.3 ps, however, the time evolution of deviates from the waveform of and an oscillatory structure appears, which is discussed in the next subsection.
7.3. Terahertz-Pulse-Pump Optical-Reflectivity-Probe Measurements in the Neutral Phase
To ascertain the charge-transfer mechanism of the pulsed response of around the time origin mentioned in the previous subsection, we carried out a terahertz-pulse-pump optical-reflectivity-probe experiment, focusing on the CT band in the near-IR region. The reflectivity spectra of the CT band at 77 K in the I phase and at 90 K in the N phase, and the differential reflectivity spectrum, , are shown in Figure 25a,b, respectively. The spectral shape of the CT band is sensitive to , similar to the IM transition bands of TTF; the reflectivity at 0.6–1.35 eV increases with increasing . In this experiment, we first set the probe energy at 1.3 eV, which was used in the SHG probe experiment. Using the same probe photon energy is appropriate to directly compare the time evolutions of and . In Figure 24e, we show the time evolution of the reflectivity change at 90 K. The increase in reflectivity indicates that is increased by the terahertz electric field. The shaded area shows the square of the terahertz electric field, . The observed at around the time origin completely follows , as well as . This result indicates that the electric-field-induced change in occurs with no delay and that the fractional charge transfers [] from A to D molecules are responsible for the polarization generation . Such a mechanism of the polarization generation by the terahertz electric field is similar to that of the spontaneous polarization generation across the NI transition. For td > 0.3 ps, the time evolution of deviates from the waveform of and an oscillatory structure appears, similar to .
To clarify the characteristic time evolutions of and , we investigated the temperature dependence of , which is shown in Figure 25c. The pulsed response around the time origin appears in common at all the temperatures from 260 K to 82 K. Its intensity gradually increases as the temperature approaches Tc. The second peak characterizing the oscillation shows a more prominent temperature dependence. In Figure 25d, the magnitudes of the first peak [] and the second peak are shown by circles and triangles, respectively. is enhanced with decreasing temperature. Simultaneously, the second peak in (colored regions) characterizing the oscillation not only increases, but also shifts to the longer times. These results suggest that the instantaneous change in by the terahertz electric field is coupled with the specific lattice mode and the oscillation frequency of the mode shifts to lower frequency as the temperature approaches Tc. The detailed analyses of the time evolutions of revealed that the oscillation frequency of the mode decreases from 33 cm−1 at 170 K to 18 cm−1 at 81 K (just above Tc) and is much smaller than the dimerization-mode frequency (~54 cm−1) related to the NI transition [42]. Such a feature of the oscillation cannot be explained by a simple critical behavior associated with the dimerization transition. In fact, it was ascertained from the Raman studies that the frequency of the dimerization mode does not depend strongly on temperature, which is in contrast to the observed oscillation. The coherent oscillation due to the dimerization mode (~54 cm−1) was indeed observed in our experiments, but its oscillation amplitude was very small and does not contribute to the signals in the time domain shown in Figure 25c. The details of those results are reported in Morimoto, T. et al. [42].
To interpret the anomalous temperature dependence of the second peak in , we consider microscopic 1D I domains, as shown in Figure 26a,b. Previous optical, dielectric, and transport measurements suggest that such I domains are generated even in the N phase because of the valence instability (or the instability of the NI transition), and fluctuate in time and space [96,97,98,99,100,101]. To accurately evaluate the number of such microscopic I domains, we performed infrared molecular vibrational spectroscopy very carefully and revealed that approximately 20% of molecules are ionized and exist as I domains at 90 K (just above Tc) [42].
Taking the presence of 1D microscopic I domains into account, we explain the observed responses to the terahertz electric field in the following way. We simply consider two I domains, and , with opposite directions of dipole-moments, and , respectively (Figure 26b). The moment is large, since an I domain consists of approximately 10 DA pairs [30,101]. In the absence of electric field, and cancel. When applying a right-handed field, a fractional charge transfer occurs in each DA pair, increasing (decreasing) by within the domain. Although a finite dipole moment is generated, the changes in ρ in the two I domains () cancel, which does not agree with the experimental result; that is, the reflectivity change showing the electric-field-induced increase in ρ.
The observed field-induced increase in the values of and can be explained in terms of the motions of microscopic domain walls between the N and I states, which are called neutral–ionic domain walls (NIDWs) [71]. When the N and I states are almost degenerate, an I domain is regarded as an excitation of an NIDW pair. Just above , TTF-CA shows anomalous enhancements of the dielectric response and nonlinear electronic current, which are interpreted as being due to motions of NIDWs [96,98]. If the domain, polarized parallel to , expands and the domain, polarized antiparallel to , shrinks as shown in Figure 26c,d, the total values of and increase. Such microscopic changes in in a number of I domains generate the large macroscopic polarization—the right panel of Figure 26e. Indeed, the and responses around the time origin accurately follow the changes in on the subpicosecond time scale, as shown by the shaded areas in Figure 24c,e, suggesting that the initial NIDW motions are purely electronic processes brought about by intermolecular charge transfers.
Based on the qualitative interpretations of the results presented above, we can derive a formula for . When the electric field is applied, the number of DA pairs included in the I domain, (the domain size), changes as (or ) and changes as (or ) in the (or ) domain (Figure 26b,c). Assuming that is proportional to the change in the total value of within I domains, we obtain the following relation.
The enhancement of as the temperature approaches (Figure 25c,d) can be attributed to the increase in the number of 1D I domains and/or to the increase in originating from the enhancement of the valence instability. Both and are proportional to , resulting in around the time origin, as observed in the experiments.
The subsequent oscillatory responses observed in and can be attributed to the breathing oscillation of NIDW pairs as shown in Figure 26d [102]. After the initial rapid NIDW motions by charge-transfer processes, the altered I domains are stabilized by molecular displacements within a few picoseconds. In the photoinduced N-to-I transition in TTF-CA, such transient molecular displacements are observed, as discussed in Section 4. When the terahertz electric field disappears, the I domain returns to the original state; the expanded I domain shrinks and the shrunken I domain expands, giving rise to the coherent breathing oscillation of the NIDW pair. The molecular displacements slow down the dynamics of the NIDW pairs and decrease the breathing oscillation frequency into the terahertz region.
7.4. Dynamical Aspects of Electric-Field-Induced Polarization Generation
Based upon the qualitative interpretation discussed in the previous subsection, we constructed a phenomenological model of the NIDW dynamics and carried out quantitative analyses of the time evolutions of and , which were reported in detail [42]. According to these analyses, the complicated time characteristics of and can be almost reproduced. In this subsection, we summarize the main results of these analyses and discuss the important physical aspects of the electric-field-induced polarization generation.
The main results of the analyses of and are as follows.
- (1)
- The large polarization generation by the terahertz electric field around the time origin originates from the expansions and shrinkages of microscopic I domains via the charge transfer processes shown by the red arrows in Figure 26c, as well as the intermolecular fractional charge transfers within the original I domains shown by the yellow arrows in the same figure. These charge transfer processes are electronic and the responses in and around the time origin are very fast.
- (2)
- We estimated the change in the degree of charge transfer within the DA molecules in an I domain and the change in the size of a microscopic I domain by the terahertz electric field to be and , respectively, at and 90 K. That is, the terahertz electric-field pulse increases by ~27% and the I-domain size by ~43%. This causes the formation of the large macroscopic polarization reaching 17% of the ferroelectric polarization in the ferroelectric I phase.
- (3)
- The expanded or shrunken I domains are stabilized by molecular displacements and also probably by molecular deformations. In their recovery processes after the electric field disappears, the coherent breathing oscillations of NIDW pairs occur and their frequency is in the terahertz region. The frequency of the oscillation changes from 32 cm−1 at 170 K to 19 cm−1 at 82 K. Such a softening can be explained by the fact that the energy difference between the N and I states decreases as the temperature approaches Tc.
In the N phase of TTF-CA, Far-IR vibrational spectroscopy was performed [103,104,105,106,107]. According to that, several lattice modes are observed below 100 cm−1 and show softening as the temperature approaches Tc. Characteristic time evolution of induced by a terahertz electric-field pulse and its temperature dependence could not be explained by simple IR-active lattice mode [42]. Assuming NIDW motions as well as instantaneous charge transfers induced by a terahertz electric field, we succeeded in effectively reproducing the time evolutions not only of but also .
We would like to emphasize two important aspects of the observed phenomena. One concerns the viewpoint of optical nonlinearity. The observed ultrafast response around the time origin can be considered as a kind of third-order optical nonlinearity. However, the observed phenomenon is considerably different from conventional third-order optical nonlinearity characterized by coherent electronic processes, since the former includes intermolecular charge transfers. As a result, a large response to the electric field occurs. Although the dynamics include such real charge-transfer processes, the response occurs very fast. Thus, we expect that a mechanism of this phenomenon, that is, the ultrafast valence change and polarization generation by the terahertz electric field associated with the instability of the NI transition will be applicable to ultrafast optical switching in the future. The other concerns the dynamics of NIDWs. We succeeded in the real-time detection of the breathing motions of NIDW pairs for the first time. This is crucial, since the NIDW dynamics dominates dielectric and transport properties in the donor–acceptor-type molecular compounds. Real-time detection of such microscopic dynamics of the NIDWs is difficult to achieve by other methods.
8. Summary
In this paper, we review the photoinduced and electric-field-induced electronic state changes in a mixed-stack organic molecular compound, TTF-CA, investigated by femtosecond-pump–probe reflection spectroscopy and SHG measurements. TTF-CA shows an NI transition at 81 K, which originates from the long-range Coulomb attractive interaction. This mechanism gives a collective nature of both ionic and neutral states and gives rise to a variety of exotic photoinduced and electric-field-induced phenomena.
In Section 2, we report the nature of electronic ferroelectricity in the I phase and the imaging of ferroelectric domains using electro-reflectance spectroscopy. In Section 3, we introduce the experimental methods of transient optical reflectivity and SHG spectroscopy.
In Section 4 and Section 5, we review the photoinduced N-to-I and I-to-N transitions, respectively. In the N-to-I transition induced by the resonant excitation of the CT band, it was demonstrated that microscopic 1D I domains consisting of approximately 10 DA pairs are initially produced within ~20 fs via purely electronic processes, and subsequently, several kinds of coherent oscillations with subpicosecond periods are observed in the photoinduced reflectivity changes. They are reasonably assigned to the dynamical dimeric displacements of molecules associated with the spin-Peierls instability and the intramolecular deformations. We would like to emphasize that several molecular degrees of freedom cooperatively stabilize the photogenerated microscopic I domains and that their detailed dynamics can be observed by using pump–probe spectroscopy with high time resolution (~20 fs). These I domains decay within several picoseconds and the three-dimensionally ordered I state is never formed. In the I-to-N transition induced by the resonant excitation of the CT band, the microscopic 1D N domains are also initially produced within ~20 fs via purely electronic processes, which are stabilized by the release of dimeric molecular displacements and molecular deformations. They are converted to a semi-macroscopic N state within 20 ps through their cooperative multiplication, which has a very long lifetime. The difference between the N-to-I and I-to-N transitions can be explained by the fact that the I-to-N transition is a destruction of the three-dimensional ferroelectric order by photoirradiation, which can occur as a domino phenomenon, while the N-to-I transition is a reverse process; that is, it is a formation process of a 3D ordered state, which is difficult to induce by photoirradiation.
In Section 6, we review the control of ferroelectric polarization by a terahertz electric field in the I phase. The observed polarization modulation originates from the modulation of the degree of charge transfer ρ within each DA dimer, and is characteristic of electronic ferroelectrics. The increase in ρ increases a spin moment on each molecule, which enhances the spin-Peierls instability and the dimeric molecular displacements. Such an enhancement of dimeric molecular displacements gives rise to the additional increases in ρ by the increase in the Coulomb attractive interaction within each dimer through the electron–lattice interaction. Thus, by using a terahertz electric-field pulse, we can not only achieve ultrafast polarization modulation, but also distinguish the effects of the spin–lattice and electron–lattice interactions involved in materials. Such a polarization modulation in electronic ferroelectrics has also been successfully performed in a 2D ET-based molecular compound, α-(ET)2I3 [58].
In Section 7, we review the large polarization generation in the paraelectric N phase by a strong terahertz pulse. The magnitude of the electric-field-induced polarization reaches 17% of the ferroelectric polarization in the I phase, which can be regarded as macroscopic polarization generation. We also succeeded in the real-time observations of the motions of neutral–ionic domain walls (NIDWs) for the first time. This is crucial because the NIDWs dominate the anomalous dielectric responses and nonlinear transport near the NI transition, as well as photoresponses in TTF-CA. The analyses of the NIDW dynamics are not discussed in detail in this review article, but have been reported in our recent paper [42].
Finally, we would like to comment on a couple of future subjects. One concerns the formation dynamics of a 1D I domain or a 1D N domain. An initial photoexcited state is a Bloch state spread over a crystal. It is not correct to express the initial photoexcited state as a D+A− pair in the N phase or D0A0 pair in the I phase, as shown in Figure 12(aI,bI), respectively. The formation of such a D+A− pair or D0A0 pair is realistic when the initial photoexcited state is localized by some relaxation processes. Accordingly, it is an important subject, from both theoretical and experimental viewpoints, to clarify the formation process of a 1D I domain or a 1D N domain from the initial photoexcited state spread over a crystal.
Another subject concerns the formation of a more ordered state from a less ordered state, or equivalently, the formation of a lower-symmetry state from a higher-symmetry state by light. In most of the previously reported photoinduced phase transitions, a lower-symmetry phase is broken or melted by light. It is usually difficult to form a lower-symmetry state by light. This fact is also shown in the photoinduced N-to-I transition discussed in Section 4. To overcome this problem, it is necessary to use a strong cooperative interaction in a material, which can grow a lower-symmetry state from a photoexcited state and stabilize that order. As such an attempt, we recently investigated the photo-responses in 4,4′-dimethyltetrathiafulvalene(DMTTF)-2,6-dichlorodbromo-p-benzoquinone (2,6QBr2Cl2) [35], which is also a mixed-stack organic molecular compound in the N phase and shows quantum paraelectricity at low temperatures. When this compound is irradiated with a femtosecond laser pulse, microscopic I domains are also generated, as in TTF-CA. We found that a large coherent oscillation related to electronic ferroelectricity is generated over a wide region in a crystal, although a macroscopic ferroelectric order is not formed. We consider that each I domain with a large dipole moment restores the ferroelectric nature suppressed by quantum lattice fluctuations [35]. If we could align the dipole moments of the initially photogenerated microscopic 1D I domains, a wide region of a crystal might be converted to a transient ferroelectric state. In the studies using a terahertz pulse as a pump pulse to control electronic states, the enhancement of an electric-field amplitude might realize an ultrafast polarization reversal in the ferroelectric phase and an ultrafast paraelectric-to-ferroelectric transition using collective charge transfer processes.
Acknowledgments
The studies presented in this review have been done in collaboration with a number of researchers and graduate students in H. Okamoto’s laboratory in the University of Tokyo. We would like to thank H. Uemura, H. Yamakawa, S. Tanaka, Y. Ishige, T. Hamamoto, K. Kimura, H. Takamatsu, K. Fujinuma, T. Terashige, H. Yada, N. Kida, (Univ. of Tokyo), H. Kishida (Nagoya Univ.), S. Iwai (Tohoku Univ.), Y. Tokura (RIKEN), H. Matsuzaki, and S. Horiuchi (AIST). We also thank S. Brazovski and N. Kirova (CNRS Orsey) for enlightening discussions. This work was partly supported by Grants-in-Aid for Scientific Research from the Japan Society for the Promotion of Science (JSPS) (Project Numbers 20110005, 25247049, and 15H06130) and CREST, Japan Science and Technology Agency. Takeshi Morimoto was supported by the JSPS through the Program for Leading Graduate School (MERIT).
Author Contributions
All of the authors contributed to writing this review paper.
Conflicts of Interest
The authors declare no conflict of interest.
References
- Nasu, K. Photoinduced Phase Transitions; World Scientific: Singapore, 2004. [Google Scholar]
- Iwai, S.; Okamoto, H. Ultrafast Phase Control in One-Dimensional Correlated Electron Systems. J. Phys. Soc. Jpn. 2006, 75, 011007:1–011007:21. [Google Scholar] [CrossRef]
- Okamoto, H. Molecular Electronic and Related Materials-Control and Probe with Light; Naito, T., Ed.; Transworld Research Network: Trivandrum, India, 2010; pp. 59–97. [Google Scholar]
- Iwai, S.; Ono, M.; Maeda, A.; Matsuzaki, H.; Kishida, H.; Okamoto, H.; Tokura, Y. Ultrafast Optical Switching to a Metallic State by Photoinduced Mott Transition in a Halogen-Bridged Nickel-Chain Compound. Phys. Rev. Lett. 2003, 91, 057401:1–057401:4. [Google Scholar] [CrossRef] [PubMed]
- Okamoto, H.; Matsuzaki, H.; Wakabayashi, T.; Takahashi, Y.; Hasegawa, T. Photoinduced Metallic State Mediated by Spin-Charge Separation in a One-Dimensional Organic Mott Insulator. Phys. Rev. Lett. 2007, 98, 037401:1–037401:4. [Google Scholar] [CrossRef] [PubMed]
- Uemura, H.; Matsuzaki, H.; Takahashi, Y.; Hasegawa, T.; Okamoto, H. Ultrafast Charge Dynamics in One-Dimensional Organic Mott Insulators. J. Phys. Soc. Jpn. 2008, 77, 113714:1–113714:4. [Google Scholar] [CrossRef]
- Okamoto, H.; Miyagoe, T.; Kobayashi, K.; Uemura, H.; Nishioka, H.; Matsuzaki, H.; Sawa, A.; Tokura, Y. Ultrafast Charge Dynamics in Photoexcited Nd2CuO4 and La2CuO4 Cuprate Compounds Investigated by Femtosecond Absorption Spectroscopy. Phys. Rev. B 2010, 82, 060513(R):1–060513(R):4. [Google Scholar] [CrossRef]
- Okamoto, H.; Miyagoe, T.; Kobayashi, K.; Uemura, H.; Nishioka, H.; Matsuzaki, H.; Sawa, A.; Tokura, Y. Photoinduced Transition from Mott Insulator to Metal in the Undoped Cuprates Nd2CuO4 and La2CuO4. Phys. Rev. B 2011, 83, 125102:1–125102:10. [Google Scholar] [CrossRef]
- Torrance, J.B.; Vazquez, J.E.; Mayerle, J.J.; Lee, V.Y. Discovery of a Neutral-to-Ionic Phase Transition in Organic Materials. Phys. Rev. Lett. 1981, 46, 253–257. [Google Scholar] [CrossRef]
- Torrance, J.B.; Girlando, A.; Mayerle, J.J.; Crowley, J.I.; Lee, V.Y.; Batail, P.; LaPlaca, S.J. Anomalous Nature of Neutral-to-Ionic Phase Transition in Tetrathiafulvalene-Chloranil. Phys. Rev. Lett. 1981, 47, 1747–1750. [Google Scholar] [CrossRef]
- Koshihara, S.; Tokura, Y.; Mitani, T.; Saito, G.; Koda, T. Photoinduced Valence Instability in the Organic Molecular Compound Tetrathiafulvalene-p-Chloranil (TTF-CA). Phys. Rev. B 1990, 42, 6853–6856. [Google Scholar] [CrossRef]
- Toyozawa, Y. Condensation of Relaxed Excions in Static and Dynamic Phase Transitions. Solid State Commun. 1992, 84, 255–257. [Google Scholar] [CrossRef]
- Suzuki, T.; Sakamaki, T.; Tanimura, K.; Koshihara, S.; Tokura, Y. Ionic-to-Neutral Phase Transformation Induced by Photoexcitation of the Charge-Transfer Band in Tetrathiafulvalene-p-Chloranil Crystals. Phys. Rev. B 1999, 60, 6191–6193. [Google Scholar] [CrossRef]
- Koshihara, S.; Takahashi, Y.; Sakai, H.; Tokura, Y.; Luty, T. Photoinduced Cooperative Charge Transfer in Low-Dimensional Organic Crystals. J. Phys. Chem. B 1999, 103, 2592–2600. [Google Scholar] [CrossRef]
- Huai, P.; Zheng, H.; Nasu, K. Theory for Photoinduced Ionic-Neutral Structural Phase Transition in Quasi One-Dimensional Organic Molecular Crystal TTF-CA. J. Phys. Soc. Jpn. 2000, 69, 1788–1800. [Google Scholar] [CrossRef]
- Luty, T.; Cailleau, H.; Koshihara, S.; Collet, E.; Takesada, M.; Lemée-Cailleau, M.H.; Cointe, M.B.L.; Nagaosa, N.; Tokura, Y.; Zienkiewicz, E.; et al. Static and Dynamic Order of Cooperative Multi-Electron Transfer. Europhys. Lett. 2002, 59, 619–625. [Google Scholar] [CrossRef]
- Iwai, S.; Tanaka, S.; Fujinuma, K.; Kishida, H.; Okamoto, H.; Tokura, Y. Ultrafast Optical Switching from an Ionic to a Neutral State in Tetrathiafulvalene-p-Chloranil (TTF-CA) Observed in Femtosecond Reflection Spectroscopy. Phys. Rev. Lett. 2002, 88, 057402:1–057402:4. [Google Scholar] [CrossRef] [PubMed]
- Collet, E.; Lemée-Cailleau, M.H.; Cointe, M.B.L.; Cailleau, H.; Wulff, M.; Luty, T.; Koshihara, S.; Meyer, M.; Toupet, L.; Rabiller, P.; et al. Laser-Induced Ferroelectric Structural Order in an Organic Charge-Transfer Crystal. Science 2003, 300, 612–615. [Google Scholar] [CrossRef] [PubMed]
- Okamoto, H.; Ishige, Y.; Tanaka, S.; Kishida, H.; Iwai, S.; Tokura, Y. Photoinduced Phase Transition in Tetrathiafulvalene-p-Chloranil Observed in Femtosecond Reflection Spectroscopy. Phys. Rev. B 2004, 70, 165202:1–165202:18. [Google Scholar] [CrossRef]
- Guérin, L.; Collet, E.; Lemée-Cailleau, M.H.; Cointe, M.B.L.; Cailleau, H.; Plech, A.; Wulff, M.; Koshihara, S.Y.; Luty, T. Probing Photoinduced Phase Transition in a Charge-Transfer Molecular Crystal by 100 Picosecond X-Ray Diffraction. Chem. Phys. 2004, 299, 163–170. [Google Scholar] [CrossRef]
- Tanimura, K. Femtosecond Time-Resolved Reflection Spectrescopy of Photoinduced Ionic-Neutral Phase Transition in TTF-CA Crystals. Phys. Rev. B 2004, 70, 144112:1–144112:11. [Google Scholar] [CrossRef]
- Yonemitsu, K. Phase Transition in a One-Dimensional Extended Peierls-Hubbard Model with a Pulse of Oscillating Electric Field: II. Linear Behavior in Neutral-to-Ionic Transition. J. Phys. Soc. Jpn. 2004, 73, 2879–2886. [Google Scholar] [CrossRef]
- Yonemitsu, K.; Nasu, K. Theory of Photoinduced Phase Transitions. J. Phys. Soc. Jpn. 2006, 75, 011008:1–011008:8. [Google Scholar] [CrossRef]
- Iwai, S.; Ishige, Y.; Tanaka, S.; Okimoto, Y.; Tokura, Y.; Okamoto, H. Coherent Control of Charge and Lattice Dynamics in a Photoinduced Neutral-to-Ionic Transition of a Charge-Transfer Compound. Phys. Rev. Lett. 2006, 96, 057403:1–057403:4. [Google Scholar] [CrossRef] [PubMed]
- Yonemitsu, K. Interchain Coupling Effects on Photoinduced Phase Transitions between Neutral and Ionic Phases in an Extended Hubbard Model with Alternating Potentials and an Electron–lattice Coupling. Phys. Rev. B 2006, 73, 155120:1–155120:7. [Google Scholar] [CrossRef]
- Iwano, K. Direct Photoexcitation of Appreciable Size of Domains without Lattice Motion in Neutral–Ionic Transition Systems. Phys. Rev. Lett. 2006, 97, 226404:1–226404:4. [Google Scholar] [CrossRef] [PubMed]
- Iwano, K. Detection of Domain Dynamics by High Energy Photons: Proposals in One-Dimensional Photoinduced Phase Transition Systems. Phys. Rev. Lett. 2009, 102, 106405:1–106405:4. [Google Scholar] [CrossRef] [PubMed]
- Nasu, K. sp3 Domain in Graphite by Visible Light and Photoinduced Phase Transitions. Eur. Phys. J. B 2010, 75, 415–430. [Google Scholar] [CrossRef]
- Guerin, L.; Hebert, J.; Cointe, M.B.L.; Adachi, S.; Koshihara, S.; Cailleau, H.; Collet, E. Capturing One-Dimensional Precursors of a Photoinduced Transformation in a Material. Phys. Rev. Lett. 2010, 105, 246101:1–246101:4. [Google Scholar] [CrossRef] [PubMed]
- Uemura, H.; Okamoto, H. Direct Detection of the Ultrafast Response of Charges and Molecules in the Photoinduced Neutral-to-Ionic Transition of the Organic Tetrathiafulvalene-p-Chloranil Solid. Phys. Rev. Lett. 2010, 105, 258302:1–258302:4. [Google Scholar] [CrossRef] [PubMed]
- Yonemitsu, K. Effects of Lattice and Molecular Phonons on Photoinduced Neutral-to-Ionic Transition Dynamics in Tetrathiafulvalene-p-Chloranil. J. Phys. Soc. Jpn. 2011, 80, 084707:1–084707:7. [Google Scholar] [CrossRef]
- Matsubara, Y.; Okimoto, Y.; Yoshida, T.; Ishikawa, T.; Koshihara, S.; Onda, K. Photoinduced Neutral-to-Ionic Phase Transition in Tetrathiafulvalene-p-Chloranil Studied by Time-Resolved Vibrational Spectroscopy. J. Phys. Soc. Jpn. 2011, 80, 124711:1–124711:5. [Google Scholar] [CrossRef]
- Miyamoto, T.; Uemura, H.; Okamoto, H. Role of Coulomb Interactions and Spin-Peierls Dimerizations in Neutral-to-Ionic Phase Transition Investigated by Femtosecond Reflection Spectroscopy. J. Phys. Soc. Jpn. 2012, 81, 073703:1–073703:4. [Google Scholar] [CrossRef]
- Hoshino, M.; Nozawa, S.; Sato, T.; Tomita, A.; Adachi, S.; Koshihara, S. Time-Resolved X-Ray Crystal Structure Analysis for Elucidating the Hidden “over-Neutralized” Phase of TTF-CA. RSC Adv. 2013, 3, 16313–16317. [Google Scholar] [CrossRef]
- Miyamoto, T.; Kimura, K.; Hamamoto, T.; Uemura, H.; Yada, H.; Matsuzaki, H.; Horiuchi, S.; Okamoto, H. Measurement of a Photoinduced Transition from a Nonordered Phase to a Transient Ordered Phase in the Organic Quantum-Paraelectric Compound Dimethyltetrathiafulvalene-Dibromodichloro-p-Benzoquinone Using Femtosecond Laser Irradiation. Phys. Rev. Lett. 2013, 111, 187801:1–187801:5. [Google Scholar] [CrossRef] [PubMed]
- Brazovskii, S.; Kirova, N. Excitonic Mechanism of Local Phase Transformations by Optical Pumping. J. Supercond. Nov. Magn. 2014, 27, 1009–1013. [Google Scholar] [CrossRef]
- Yi, T.; Kirova, N.; Brazovskii, S. Dynamical patterns of phase transformations from self-trapping of quantum excitons. Phys. B 2015, 460, 73–78. [Google Scholar] [CrossRef]
- Cavatorta, L.; Painelli, A.; Soos, Z.G. Coherent Excitations at the Neutral–ionic Transition: Femtosecond Dynamics on Diabatic Potential Energy Surfaces. Phys. Rev. B 2015, 91, 174301:1–174301:10. [Google Scholar] [CrossRef]
- Kirova, N.; Brazovskii, S. Electronic ferroelectricity in carbon based materials. Synth. Met. 2016, 216, 11–22. [Google Scholar] [CrossRef]
- Brazovskii, S.; Kirova, N. Dynamical phase transitions and pattern formation induced by a pulse pumping of excitons to a system near a thermodynamic instability. Phy. Rev. B 2016, 94, 054302:1–054302:7. [Google Scholar] [CrossRef]
- Miyamoto, T.; Yada, H.; Yamakawa, H.; Okamoto, H. Ultrafast Modulation of Polarization Amplitude by Terahertz Fields in Electronic-Type Organic Ferroelectrics. Nat. Commun. 2013, 4, 2586:1–2586:9. [Google Scholar] [CrossRef] [PubMed]
- Morimoto, T.; Miyamoto, T.; Yamakawa, H.; Terashige, T.; Ono, T.; Kida, N.; Okamoto, H. Terahertz-Field-Induced Large Macroscopic Polarization and Domain-Wall Dynamics in an Organic Molecular Dielectric. Phys. Rev. Lett. 2017, 118, 107602:1–107602:6. [Google Scholar] [CrossRef] [PubMed]
- McConnell, H.M.; Hoffman, B.M.; Metzger, R.M. Charge Transfer in Molecular Crystals. Proc. Natl. Acad. Sci. USA 1965, 53, 46–50. [Google Scholar] [CrossRef] [PubMed]
- Girlando, A.; Marzola, F.; Pecile, C.; Torrance, J.B. Vibrational Spectroscopy of Mixed Stack Organic Semiconductors: Neutral and Ionic Phases of Tetrathiafulvalene-chloranil (TTF-CA) Charge Transfer Complex. J. Chem. Phys. 1983, 79, 1075–1085. [Google Scholar] [CrossRef]
- Tokura, Y.; Kaneko, Y.; Okamoto, H.; Tanuma, S.; Koda, T.; Mitani, T.; Saito, G. Spectroscopic Study of the Neutral-to-Ionic Phase Transition in TTF-Chloranil. Mol. Cryst. Liq. Cryst. 1985, 125, 71–80. [Google Scholar] [CrossRef]
- Takaoka, K.; Kaneko, Y.; Okamoto, H.; Tokura, Y.; Koda, T.; Mitani, T.; Saito, G. Infrared Molecular-Vibration Spectra of Tetrathiafulvalene-Chloranil Crystal at Low Temperature and High Pressure. Phys. Rev. B 1987, 36, 3884–3887. [Google Scholar] [CrossRef]
- Horiuchi, S.; Okimoto, Y.; Kumai, R.; Tokura, Y. Anomalous Valence Fluctuation near a Ferroelectric Transition in an Organic Charge-Transfer Complex. J. Phys. Soc. Jpn. 2000, 69, 1302–1305. [Google Scholar] [CrossRef]
- Kanai, Y.; Tani, M.; Kagoshima, S.; Tokura, Y.; Koda, T. X-Ray Evidence for the Molecular Dimerization in TTF-Chloranil. Synth. Met. 1984, 10, 157–160. [Google Scholar] [CrossRef]
- Cointe, M.L.; Lemée-Cailleau, M.H.; Cailleau, H.; Toudic, B.; Toupet, L.; Heger, G.; Moussa, F.; Schweiss, P.; Kraft, K.H.; Karl, N. Symmetry Breaking and Structural Changes at the Neutral-to-Ionic Transition in Tetrathiafulvalene-p-Chloranil. Phys. Rev. B 1995, 51, 3374–3386. [Google Scholar] [CrossRef]
- Lemée-Cailleau, M.H.; Cointe, M.B.L.; Cailleau, H.; Luty, T.; Moussa, F.; Roos, J.; Brinkmann, D.; Toudic, B.; Ayache, C.; Karl, N. Thermodynamics of the Neutral-to-Ionic Transition as Condensation and Crystallization of Charge-Transfer Excitations. Phys. Rev. Lett. 1997, 79, 1690–1693. [Google Scholar] [CrossRef]
- Tokura, Y.; Koda, T.; Mitani, T.; Saito, G. Neutral-to-Ionic Transition in Tetrathiafulvalene-p-Chloranil as Investigated by Optical Reflection Spectra. Solid State Commun. 1982, 43, 757–760. [Google Scholar] [CrossRef]
- Tokura, Y.; Koda, T.; Saito, G.; Mitani, T. Effect of Substitutional Impurities on the Neutral-to-Ionic Phase Transition in TTF-p-Chloranil Crystal. J. Phys. Soc. Jpn. 1984, 53, 4445–4455. [Google Scholar] [CrossRef]
- Kobayashi, K.; Horiuchi, S.; Kumai, R.; Kagawa, F.; Murakami, Y.; Tokura, Y. Electronic Ferroelectricity in a Molecular Crystal with Large Polarization Directing Antiparallel to Ionic Displacement. Phys. Rev. Lett. 2012, 108, 237601:1–237601:5. [Google Scholar] [CrossRef] [PubMed]
- Giovannetti, G.; Kumar, S.; Stroppa, A.; Van Den Brink, J.; Picozzi, S. Multiferroicity in TTF-CA Organic Molecular Crystals Predicted through Ab Initio Calculations. Phys. Rev. Lett. 2009, 103, 266401:1–266401:4. [Google Scholar] [CrossRef] [PubMed]
- Ishibashi, S.; Terakura, K. First-Principles Study of Spontaneous Polarization in Tetrathiafulvalene-p-Chloranil (TTF-CA). Phys. B 2010, 405, S338–S340. [Google Scholar] [CrossRef]
- Portengen, T.; Östreich, T.; Sham, L.J. Theory of Electronic Ferroelectricity. Phys. Rev. B 1996, 54, 17452–17463. [Google Scholar] [CrossRef]
- Yamamoto, K.; Iwai, S.; Boyko, S.; Kashiwazaki, A.; Hiramatsu, F.; Okabe, C.; Nishi, N.; Yakushi, K. Strong Optical Nonlinearity and its Ultrafast Response Associated with Electron Ferroelectricity in an Organic Conductor. J. Phys. Soc. Jpn. 2008, 77, 074709:1–074709:6. [Google Scholar] [CrossRef]
- Yamakawa, H.; Miyamoto, T.; Morimoto, T.; Yada, H.; Kinoshita, Y.; Sotome, M.; Kida, N.; Yamamoto, K.; Iwano, K.; Matsumoto, Y.; et al. Novel Electronic Ferroelectricity in an Organic Charge-Order Insulator Investigated with Terahertz-Pump Optical-Probe Spectroscopy. Sci. Rep. 2016, 6, 20571:1–20571:10. [Google Scholar] [CrossRef] [PubMed]
- Ikeda, N.; Ohsumi, H.; Ohwada, K.; Ishii, K.; Inami, T.; Kakurai, K.; Murakami, Y.; Yoshii, K.; Mori, S.; Horibe, Y.; et al. Ferroelectricity from Iron Valence Ordering in the Charge-Frustrated System LuFe2O4. Nature 2005, 436, 1136–1138. [Google Scholar] [CrossRef] [PubMed]
- Uesu, Y.; Kurimura, S.; Yamamoto, Y. Optical Second Harmonic Images of 90° Domain Structure in BaTiO3 and Periodically Inverted Antiparallel Domains in LiTaO3. Appl. Phys. Lett. 1995, 66, 2165–2167. [Google Scholar] [CrossRef]
- Kishida, H.; Takamatsu, H.; Fujinuma, K.; Okamoto, H. Ferroelectric Nature and Real-Space Observations of Domain Motions in the Organic Charge-Transfer Compound Tetrathiafulvalene-p-Chloranil. Phys. Rev. B 2009, 80, 205201:1–205201:7. [Google Scholar] [CrossRef]
- Kampfrath, T.; Sell, A.; Klatt, G.; Pashkin, A.; Mährlein, S.; Dekorsy, T.; Wolf, M.; Fiebig, M.; Leitenstorfer, A.; Huber, R. Coherent Terahertz Control of Antiferromagnetic Spin Waves. Nat. Photonics 2011, 5, 31–34. [Google Scholar] [CrossRef]
- Liu, M.; Hwang, H.Y.; Tao, H.; Strikwerda, A.C.; Fan, K.; Keiser, G.R.; Sternbach, A.J.; West, K.G.; Kittiwatanakul, S.; Lu, J.; et al. Terahertz-Field-Induced Insulator-to-Metal Transition in Vanadium Dioxide Metamaterial. Nature 2012, 487, 345–348. [Google Scholar] [CrossRef] [PubMed]
- Kampfrath, T.; Tanaka, K.; Nelson, K.A. Resonant and Nonresonant Control over Matter and Light by Intense Terahertz Transients. Nat. Photonics 2013, 7, 680–690. [Google Scholar] [CrossRef]
- Yada, H.; Miyamoto, T.; Okamoto, H. Terahertz-Field-Driven Sub-Picosecond Optical Switching Enabled by Large Third-Order Optical Nonlinearity in a One-Dimensional Mott Insulator. Appl. Phys. Lett. 2013, 102, 091104:1–091104:4. [Google Scholar] [CrossRef]
- Kubacka, T.; Johnson, J.A.; Hoffmann, M.C.; Vicario, C.; de Jong, S.; Beaud, P.; Grübel, S.; Huang, S.W.; Huber, L.; Patthey, L.; et al. Large-Amplitude Spin Dynamics Driven by a THz Pulse in Resonance with an Electromagnon. Science 2014, 343, 1333–1337. [Google Scholar] [CrossRef] [PubMed]
- Matsunaga, R.; Tsuji, N.; Fujita, H.; Sugioka, A.; Makise, K.; Uzawa, Y.; Terai, H.; Wang, Z.; Aoki, H.; Shimano, R. Light-Induced Collective Pseudospin Precession Resonating with Higgs Mode in a Superconductor. Science 2014, 345, 1145–1149. [Google Scholar] [CrossRef] [PubMed]
- Hebling, J.; Almasi, G.; Kozma, I.Z.; Kuhl, J. Velocity Matching by Pulse Front Tilting for Large Area THz-Pulse Generation. Opt. Express 2002, 10, 1161–1166. [Google Scholar] [CrossRef] [PubMed]
- Hirori, H.; Doi, A.; Blanchard, F.; Tanaka, K. Single-Cycle Terahertz Pulses with Amplitudes Exceeding 1 MV/cm Generated by Optical Rectification in LiNbO3. Appl. Phys. Lett. 2011, 98, 091106:1–091106:3. [Google Scholar] [CrossRef]
- Ma, H.M.; Liu, Y.X.; Fei, Y.; Li, F.M. The Influence of Electron-Hole Density Profile on the Picosecond Time-Resolved Reflectivity Measurement in Silicon. J. Appl. Phys. 1989, 65, 5031–5034. [Google Scholar] [CrossRef]
- Nagaosa, N.; Takimoto, J. Theory of Neutal-Ionic Transition in Organic Crystals. II. Effect of the Intersite Coulomb Interaction. J. Phys. Soc. Jpn. 1986, 55, 2745–2753. [Google Scholar] [CrossRef]
- Jacobsen, C.S.; Torrance, J.B. Behavior of Charge-Transfer Absorption upon Passing through the Neutral–Ionic Phase Transition. J. Chem. Phys. 1983, 78, 112–115. [Google Scholar] [CrossRef]
- Cavalleri, A.; Dekorsy, T.; Chong, H.H.W.; Kieffer, J.C.; Schoenlein, R.W. Evidence for a Structurally-Driven Insulator-to-Metal Transition in VO2: A View from the Ultrafast Timescale. Phys. Rev. B 2004, 70, 161102(R):1–161102(R):4. [Google Scholar] [CrossRef]
- Chollet, M.; Guerin, L.; Uchida, N.; Fukaya, S.; Shimoda, H.; Ishikawa, T.; Matsubara, K.; Hasegawa, T.; Ota, A.; Yamochi, H.; et al. Gigantic Photoresponse in 1/4-Filled-Band Organic Salt (EDO-TTF)2PF6. Science 2005, 307, 86–89. [Google Scholar] [CrossRef] [PubMed]
- Matsuzaki, H.; Yamashita, M.; Okamoto, H. Ultrafast Photoconversion from Charge Density Wave State to Mott-Hubbard State in One-Dimensional Extended Peierls-Hubbard System of Br-Bridged Pd Compound. J. Phys. Soc. Jpn. 2006, 75, 123701–123704. [Google Scholar] [CrossRef]
- Okamoto, H.; Ikegami, K.; Wakabayashi, T.; Ishige, Y.; Togo, J.; Kishida, H.; Matsuzaki, H. Ultrafast Photoinduced Melting of a Spin-Peierls Phase in an Organic Charge-Transfer Compound, K-Tetracyanoquinodimethane. Phys. Rev. Lett. 2006, 96, 037405:1–037405:4. [Google Scholar] [CrossRef] [PubMed]
- Perfetti, L.; Loukakos, P.A.; Lisowski, M.; Bovensiepen, U.; Berger, H.; Biermann, S.; Cornaglia, P.S.; Georges, A.; Wolf, M. Time Evolution of the Electronic Structure of 1T-TaS2 through the Insulator-Metal Transition. Phys. Rev. Lett. 2006, 97, 067402:1–067402:4. [Google Scholar] [CrossRef] [PubMed]
- Iwai, S.; Yamamoto, K.; Kashiwazaki, A.; Hiramatsu, F.; Nakaya, H.; Kawakami, Y.; Yakushi, K.; Okamoto, H.; Mori, H.; Nishio, Y. Photoinduced Melting of a Stripe-Type Charge-Order and Metallic Domain Formation in a Layered BEDT-TTF-Based Organic Salt. Phys. Rev. Lett. 2007, 98, 097402:1–097402:4. [Google Scholar] [CrossRef] [PubMed]
- Ikegami, K.; Ono, K.; Togo, J.; Wakabayashi, T.; Ishige, Y.; Matsuzaki, H.; Kishida, H.; Okamoto, H. Ultrafast Photoinduced Melting of Spin-Peierls Phase in the Organic Charge-Transfer Compounds Alkali-Tetracyanoquinodimethane. Phys. Rev. B 2007, 76, 085106:1–085106:12. [Google Scholar] [CrossRef]
- Polli, D.; Rini, M.; Wall, S.; Schoenlein, R.W.; Tomioka, Y.; Tokura, Y.; Cerullo, G.; Cavalleri, A. Coherent Orbital Waves in the Photo-Induced Insulator-Metal Dynamics of a Magnetoresistive Manganite. Nat. Mater. 2007, 6, 643–647. [Google Scholar] [CrossRef] [PubMed]
- Kubler, C.; Ehrke, H.; Huber, R.; Lopez, R.; Halabica, A.; Haglund, R.F.; Leitenstorfer, A. Coherent Structural Dynamics and Electronic Correlations during an Ultrafast Insulator-to-Metal Phase Transition in VO2. Phys. Rev. Lett. 2007, 99, 116401:1–116401:4. [Google Scholar] [CrossRef] [PubMed]
- Tomeljak, A.; Schäfer, H.; Städter, D.; Beyer, M.; Biljakovic, K.; Demsar, J. Dynamics of Photoinduced Charge-Density-Wave to Metal Phase Transition in K0.3MoO3. Phys. Rev. Lett. 2009, 102, 066404:1–066404:4. [Google Scholar] [CrossRef] [PubMed]
- Kimura, K.; Matsuzaki, H.; Takaishi, S.; Yamashita, M.; Okamoto, H. Ultrafast Photoinduced Transitions in Charge Density Wave, Mott Insulator, and Metallic Phases of an Iodine-Bridged Platinum Compound. Phys. Rev. B 2009, 79, 075116:1–075116:5. [Google Scholar] [CrossRef]
- Matsuzaki, H.; Uemura, H.; Matsubara, M.; Kimura, T.; Tokura, Y.; Okamoto, H. Detecting Charge and Lattice Dynamics in Photoinduced Charge-Order Melting in Perovskite-Type Manganites Using a 30-Femtosecond Time Resolution. Phys. Rev. B 2009, 79, 235131:1–235131:7. [Google Scholar] [CrossRef]
- Yusupov, R.; Mertelj, T.; Kabanov, V.V.; Brazovskii, S.; Kusar, P.; Chu, J.-H.; Fisher, I.R.; Mihailovic, D. Coherent Dynamics of Macroscopic Electronic Order through a Symmetry-Breaking Transition. Nat. Phys. 2010, 6, 681–684. [Google Scholar] [CrossRef]
- Matsuzaki, H.; Iwata, M.; Miyamoto, T.; Terashige, T.; Iwano, K.; Takaishi, S.; Takamura, M.; Kumagai, S.; Yamashita, M.; Takahashi, R.; et al. Excitation-Photon-Energy Selectivity of Photoconversions in Halogen-Bridged Pd-Chain Compounds: Mott Insulator to Metal or Charge-Density-Wave State. Phys. Rev. Lett. 2014, 113, 096403:1–096403:6. [Google Scholar] [CrossRef] [PubMed]
- Uemura, H.; Iwasawa, K.; Yamakawa, H.; Miyamoto, T.; Yada, H.; Okamoto, H. Photoinduced Complete Melting of Spin-Peierls Phase in Na-Tetracyanoquinodimethane Revealed by Frequency Doubling of Coherent Molecular Oscillations. Phys. Rev. B 2015, 91, 125111:1–125111:6. [Google Scholar] [CrossRef]
- Katan, C.; Blöchl, P.E.; Margl, P.; Koenig, C. First-Principles Molecular-Dynamics Simulations for Neutral p-Chloranil and its Radical Anion. Phys. Rev. B 1996, 53, 12112–12120. [Google Scholar] [CrossRef]
- Katan, C. First-Principles Study of the Structures and Vibrational Frequencies for Tetrathiafulvalene TTF and TTF-d4 in Different Oxidation States. J. Phys. Chem. A 1999, 103, 1407–1413. [Google Scholar] [CrossRef]
- Moreac, A.; Girard, A.; Delugeard, Y.; Marqueton, Y. The Neutral-to-Ionic Phase Transition of TTF-CA: A Raman and Infrared Study versus Temperature at Atmospheric Pressure. J. Phys. Condens. Matter 1996, 8, 3553–3567. [Google Scholar] [CrossRef]
- Moreac, A.; Girard, A.; Delugeard, Y. The Neutral-to-Ionic Phase Transition of TTF-CA: A Raman Study of the Influence of Temperature and Hydrostatic Pressure. J. Phys. Condens. Matter 1996, 8, 3569–3580. [Google Scholar] [CrossRef]
- Rice, M.J.; Lipari, N.O. Electron-Molecular-Vibration Coupling in Tetrathiafulvalene-tetracyanoquinodimethane (TTF-TCNQ). Phys. Rev. Lett. 1977, 38, 437–439. [Google Scholar] [CrossRef]
- Painelli, A.; Girlando, A. Electron-Molecular Vibration (E-MV) Coupling in Charge-Transfer Compounds and its Consequences on the Optical Spectra: A Theoretical Framework. J. Chem. Phys. 1986, 84, 5655–5671. [Google Scholar] [CrossRef]
- Gomi, H.; Yamagishi, N.; Mase, T.; Inagaki, T.J.; Takahashi, A. Instantaneous Charge and Dielectric Response to Terahertz Pulse Excitation in TTF-CA. Phys. Rev. B 2017, 95, 094116:1–094116:9. [Google Scholar] [CrossRef]
- Masino, M.; Girlando, A.; Brillante, A.; Della Valle, R.G.; Venuti, E.; Drichko, N.; Dressel, M. Lattice Dynamics of TTF-CA across the Neutral–Ionic Transition. Chem. Phys. 2006, 325, 71–77. [Google Scholar] [CrossRef]
- Tokura, Y.; Okamoto, H.; Koda, T.; Mitani, T.; Saito, G. Nonlinear Electric Transport and Switching Phenomenon in the Mixed-Stack Charge-Transfer Crystal Tetrathiafulvalene-p-Chloranil. Phys. Rev. B 1988, 38, 2215–2218. [Google Scholar] [CrossRef]
- Tokura, Y.; Koshihara, S.; Iwasa, Y.; Okamoto, H.; Komatsu, T.; Koda, T.; Iwasawa, N.; Saito, G. Domain-Wall Dynamics in Organic Charge-Transfer Compounds with One-Dimensional Ferroelectricity. Phys. Rev. Lett. 1989, 63, 2405–2408. [Google Scholar] [CrossRef] [PubMed]
- Okamoto, H.; Mitani, T.; Tokura, Y.; Koshihara, S.; Komatsu, T.; Iwasa, Y.; Koda, T.; Saito, G. Anomalous Dielectric Response in Tetrathiafulvalene-p-Chloranil as Observed in Temperature- and Pressure-Induced Neutral-to-Ionic Phase Transition. Phys. Rev. B 1991, 43, 8224–8232. [Google Scholar] [CrossRef]
- Collet, E.; Lemée-Cailleau, M.H.; Cointe, M.B.L.; Cailleau, H.; Ravy, S.; Luty, T.; Bérar, J.F.; Czarnecki, P.; Karl, N. Direct Evidence of Lattice-Relaxed Charge Transfer Exciton Strings. Europhys. Lett. 2002, 57, 67–73. [Google Scholar] [CrossRef]
- Matsuzaki, H.; Takamatsu, H.; Kishida, H.; Okamoto, H. Valence Fluctuation and Domain-Wall Dynamics in Pressure-Induced Neutral-to-Ionic Phase Transition of Organic Charge-Transfer Crystal. J. Phys. Soc. Jpn. 2005, 74, 2925–2928. [Google Scholar] [CrossRef]
- Cointe, M.B.L.; Lemée-Cailleau, M.H.; Cailleau, H.; Ravy, S.; Bérar, J.F.; Rouzière, S.; Elkaïm, E.; Collet, E. One-Dimensional Fluctuating Nanodomains in the Charge-Transfer Molecular System TTF-CA and Their First-Order Crystallization. Phys. Rev. Lett. 2006, 96, 205503:1–205503:4. [Google Scholar]
- Okimoto, Y.; Horiuchi, S.; Saitoh, E.; Kumai, R.; Tokura, Y. Far-Infrared Optical Response of Neutral–ionic Phase Transition in an Organic Charge-Transfer Complex. Phys. Rev. Lett. 2001, 87, 187401:1–187401:4. [Google Scholar] [CrossRef]
- Masino, M.; Girlando, A.; Soos, Z.G. Evidence for a Soft Mode in the Temperature Induced Neutral–Ionic Transition of TTF-CA. Chem. Phys. Lett. 2003, 369, 428–433. [Google Scholar] [CrossRef]
- Girlando, A.; Painelli, A.; Bewick, S.A.; Soos, Z.G. Charge Fluctuations and Electron-Phonon Coupling in Organic Charge-Transfer Salts with Neutral–Ionic and Peierls Transitions. Synth. Met. 2004, 141, 129–138. [Google Scholar] [CrossRef]
- D’Avino, G.; Girlando, A.; Painelli, A.; Lemée-Cailleau, M.H.; Soos, Z.G. Anomalous Dispersion of Optical Phonons at the Neutral–Ionic Transition: Evidence from Diffuse X-Ray Scattering. Phys. Rev. Lett. 2007, 99, 156407:1–156407:4. [Google Scholar] [CrossRef] [PubMed]
- Girlando, A.; Masino, M.; Painelli, A.; Drichko, N.; Dressel, M.; Brillante, A.; Della Valle, R.G.; Venuti, E. Direct Evidence of Overdamped Peierls-Coupled Modes in the Temperature-Induced Phase Transition in Tetrathiafulvalene-Chloranil. Phys. Rev. B 2008, 78, 045103:1–045103:12. [Google Scholar] [CrossRef]
- Tomić, S.; Dressel, M. Ferroelectricity in Molecular Solids: A Review of Electrodynamic Properties. Rep. Prog. Phys. 2015, 78, 096501:1–096501:26. [Google Scholar] [CrossRef] [PubMed]
Figure 1.
Classification of photoinduced phase transition dynamics from A phase to B phase. (a) Class I: purely electronic PIPT (photoinduced phase transition) dominated by electron–electron interaction; (b) Class II: PIPT dominated by both electron–electron and electron (spin)–lattice interactions; (c) Class III: PIPT dominated by electron (spin)–lattice interaction [2].

Figure 2.
(a) Molecular structures of TTF and CA; (b) Three-dimensional crystal structure of TTF-CA; (c,d) Crystal structure of TTF-CA projected on (c) bc plane and (d) ab plane. Classification of photoinduced phase transition dynamics from A phase to B phase.
Figure 2.
(a) Molecular structures of TTF and CA; (b) Three-dimensional crystal structure of TTF-CA; (c,d) Crystal structure of TTF-CA projected on (c) bc plane and (d) ab plane. Classification of photoinduced phase transition dynamics from A phase to B phase.

Figure 3.
(a,b) Schematic of electronic structures in (a) the neutral phase and (b) the ionic phase of TTF-CA. Ovals in (b) show dimers.
Figure 3.
(a,b) Schematic of electronic structures in (a) the neutral phase and (b) the ionic phase of TTF-CA. Ovals in (b) show dimers.
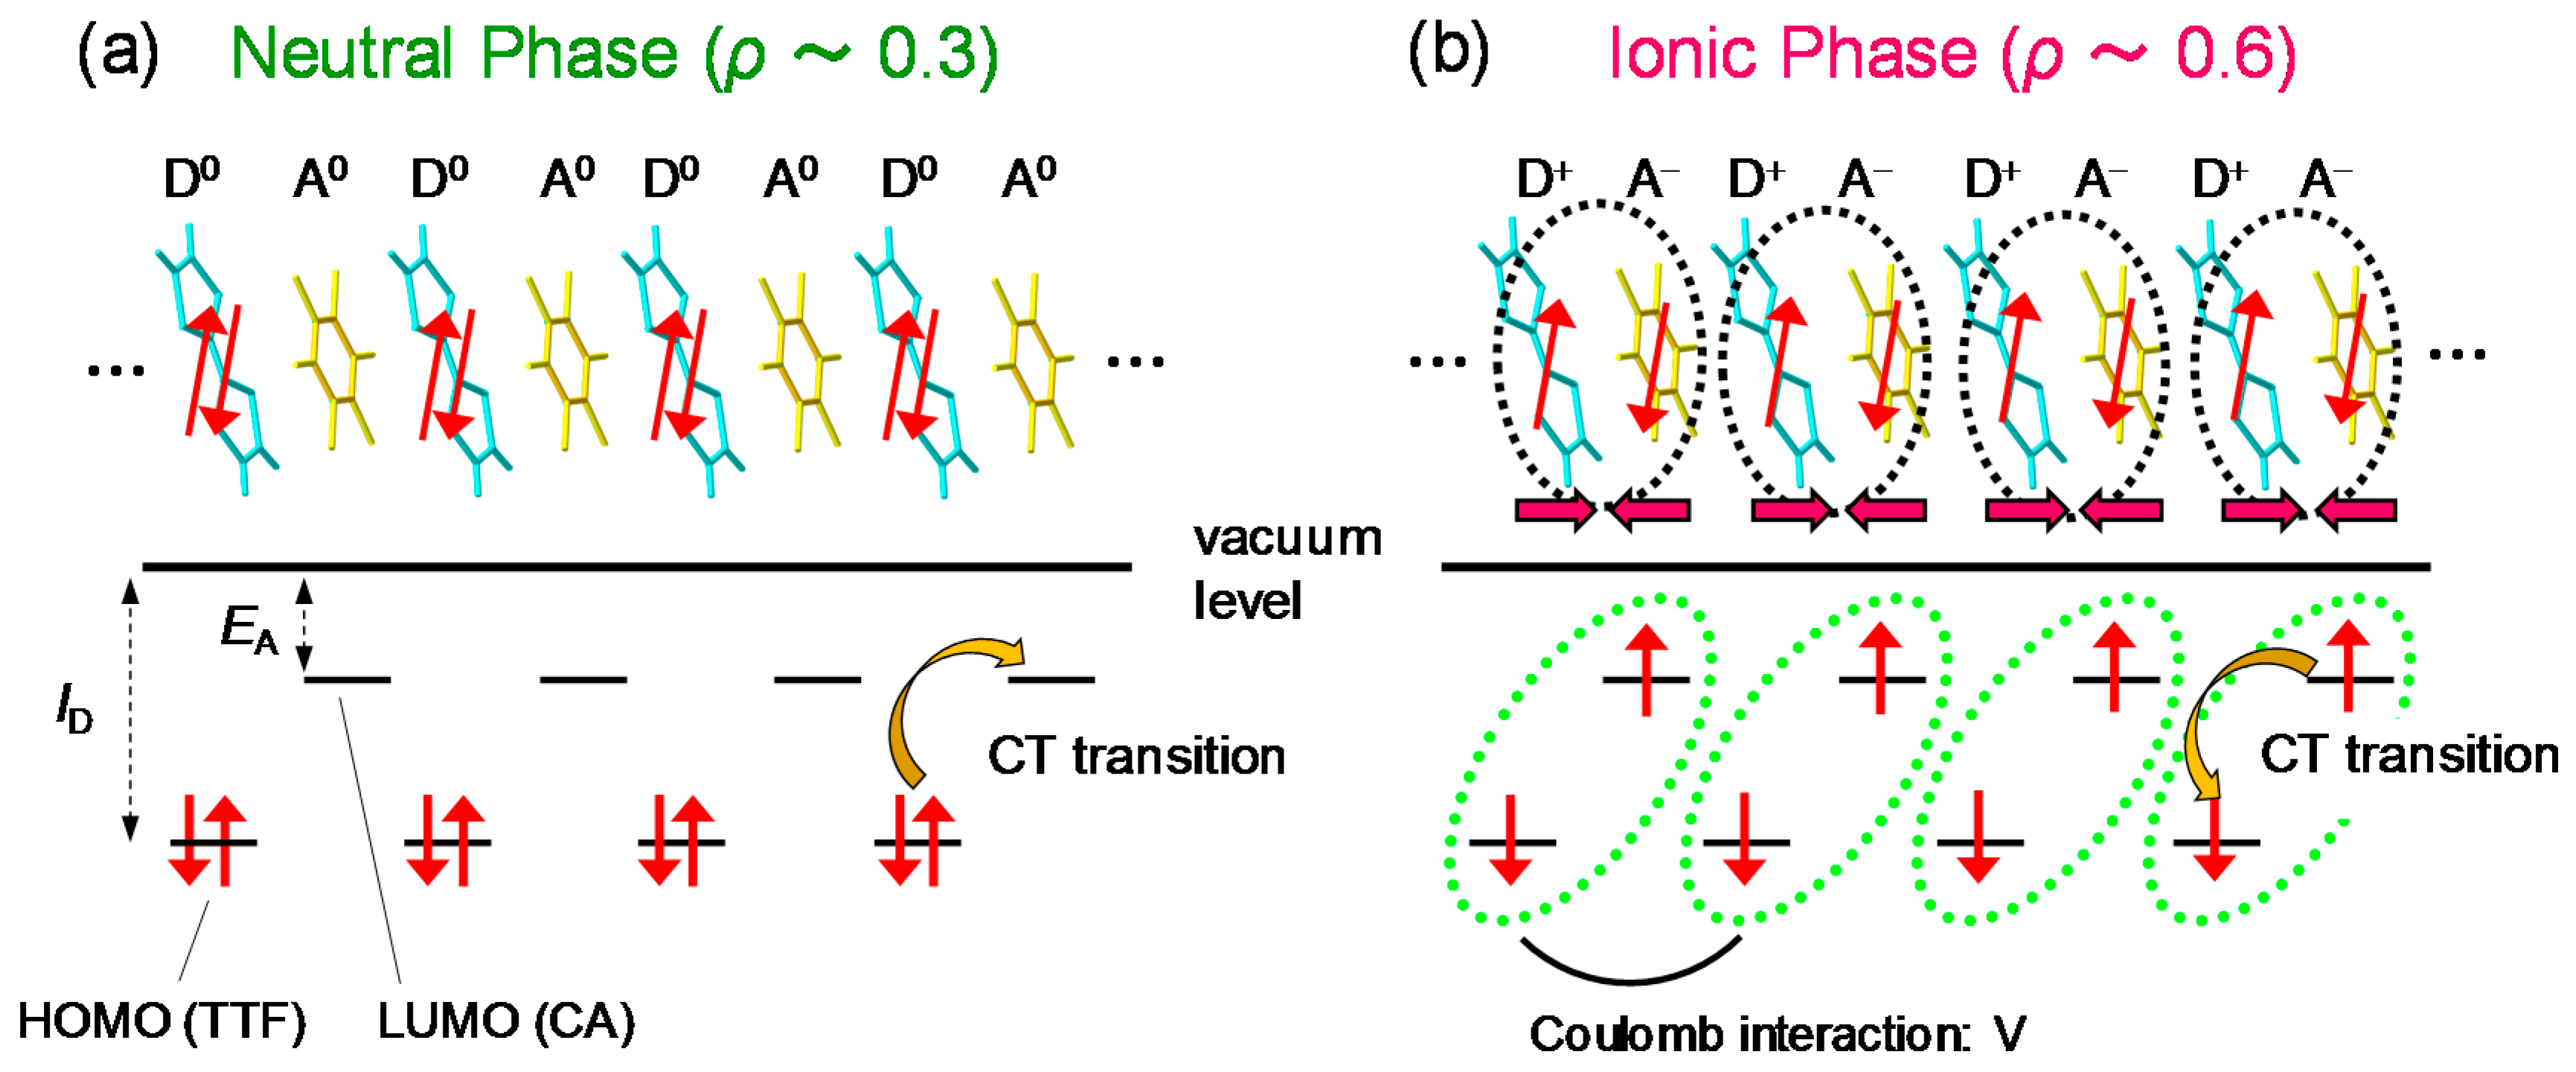
Figure 4.
(a,b) Molecular arrangements viewed along the direction perpendicular to the stacking axis (a axis) at (a) 90 K (the neutral phase) and (b) 40 K (the ionic phase) in TTF-CA [41]. L1 and L2 in (b) denote the intradimer and interdimer distances, respectively.
Figure 4.
(a,b) Molecular arrangements viewed along the direction perpendicular to the stacking axis (a axis) at (a) 90 K (the neutral phase) and (b) 40 K (the ionic phase) in TTF-CA [41]. L1 and L2 in (b) denote the intradimer and interdimer distances, respectively.

Figure 5.
(a) Polarized reflectivity spectra at 90 K in the neutral phase and at 77K in the ionic phase of TTF-CA [19]; (b,c) Schematic of optical transitions in the neutral phase (b) and in the ionic phase (c).
Figure 5.
(a) Polarized reflectivity spectra at 90 K in the neutral phase and at 77K in the ionic phase of TTF-CA [19]; (b,c) Schematic of optical transitions in the neutral phase (b) and in the ionic phase (c).
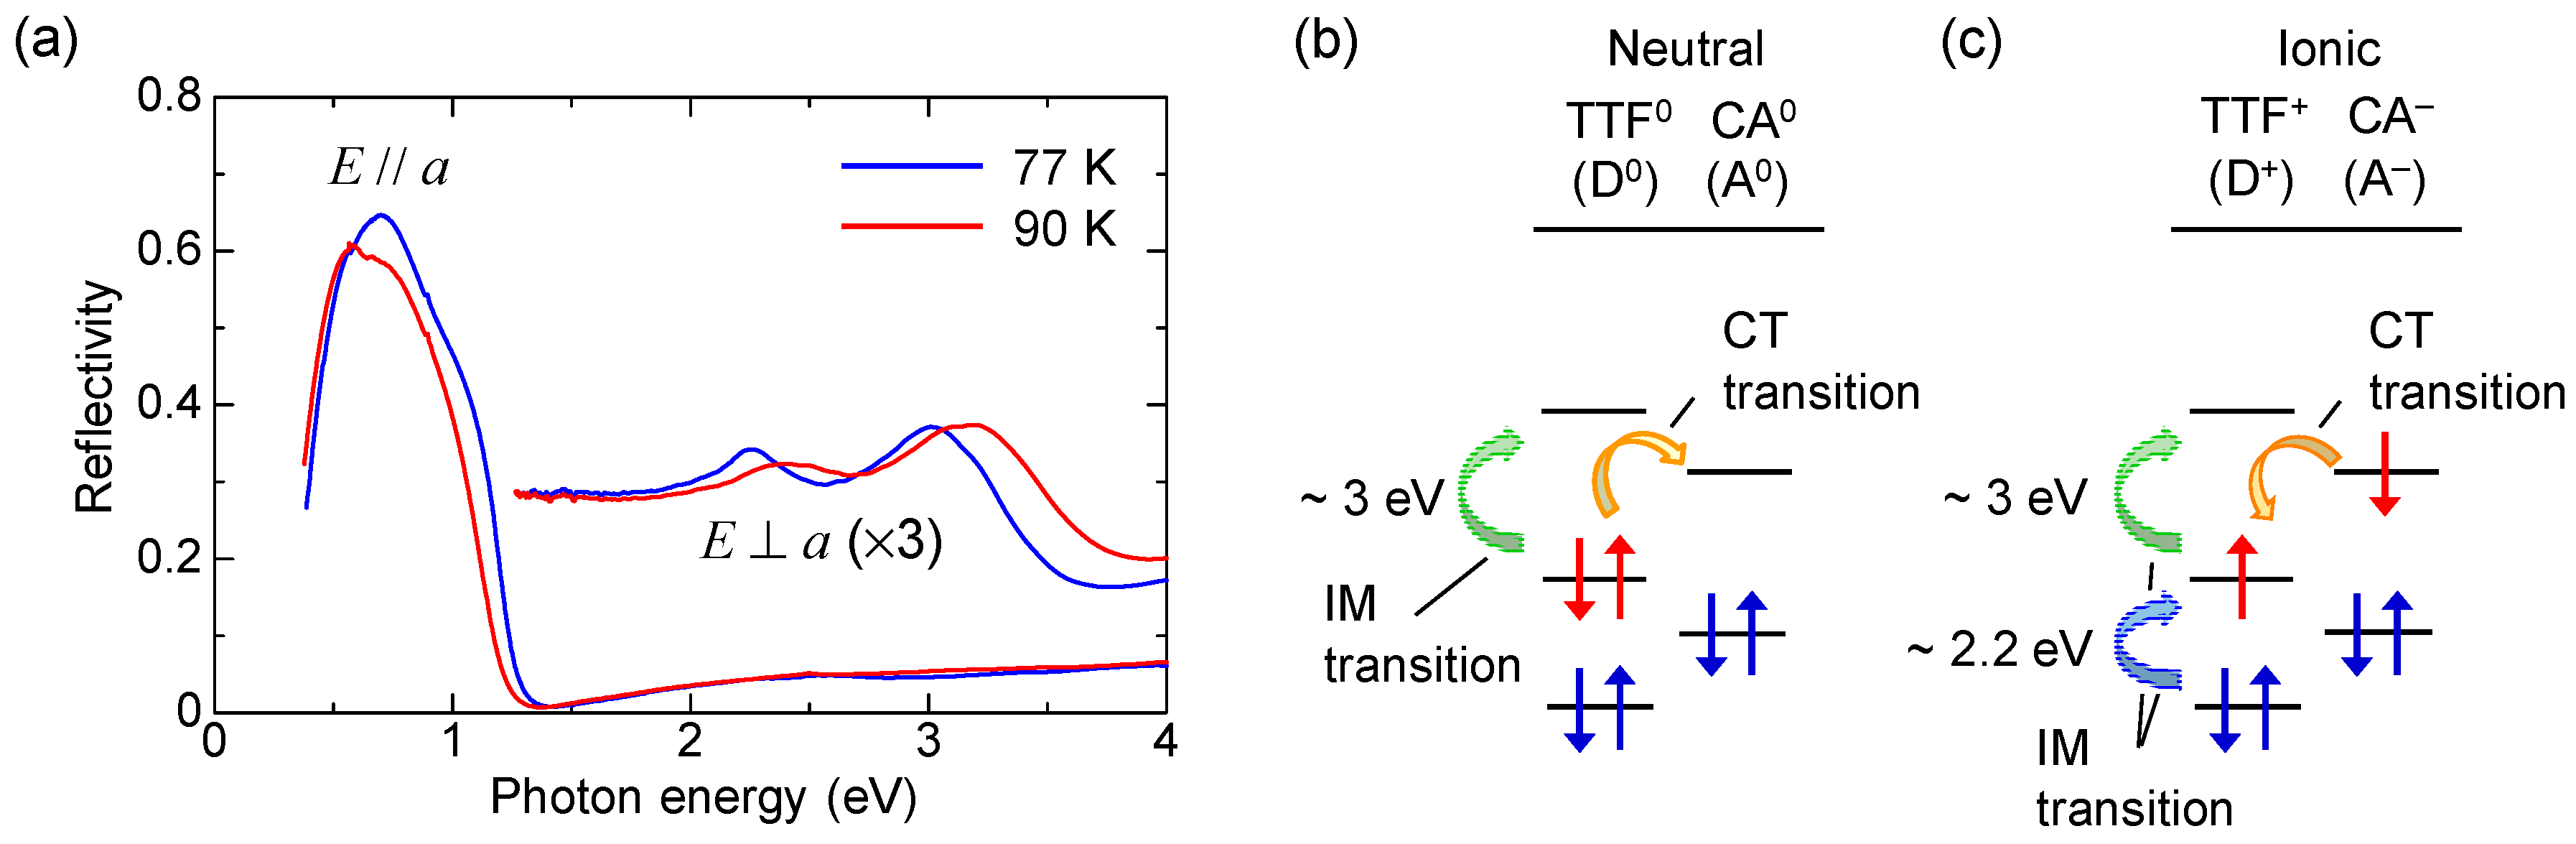
Figure 6.
(a,b) Direction of ferroelectric polarization in the case of (a) displacive-type ferroelectricity and (b) electronic-type ferroelectricity. Pion and Pel are polarizations originating from molecular displacements and from fractional intermolecular charge transfers, respectively. P is a net polarization (P = Pion + Pel).

Figure 7.
Polarization-domain imaging by electro-reflectance (ER) spectroscopy in TTF-CA [61]. (a) Schematic of a polarization-domain imaging method; (b) Polarized reflectivity spectra with E⊥a at 90 K (the neutral phase) and at 77 K and 4 K (the ionic phase); (c) A differential reflectivity spectrum between 4 K and 77 K, [RI(4 K) − RI(77 K)]/RI(77 K); (d) A spectrum of reflectivity changes ΔR/R induced by external electric fields F (//a) with an amplitude of 1.56 kV/cm; (e) A polarization domain image shown as a contour map of electric-field-induced reflectivity changes ΔR/R at the photon energy indicated by the arrow in (c). Red regions (IA) and blue regions (IB) have opposite directions of polarizations.
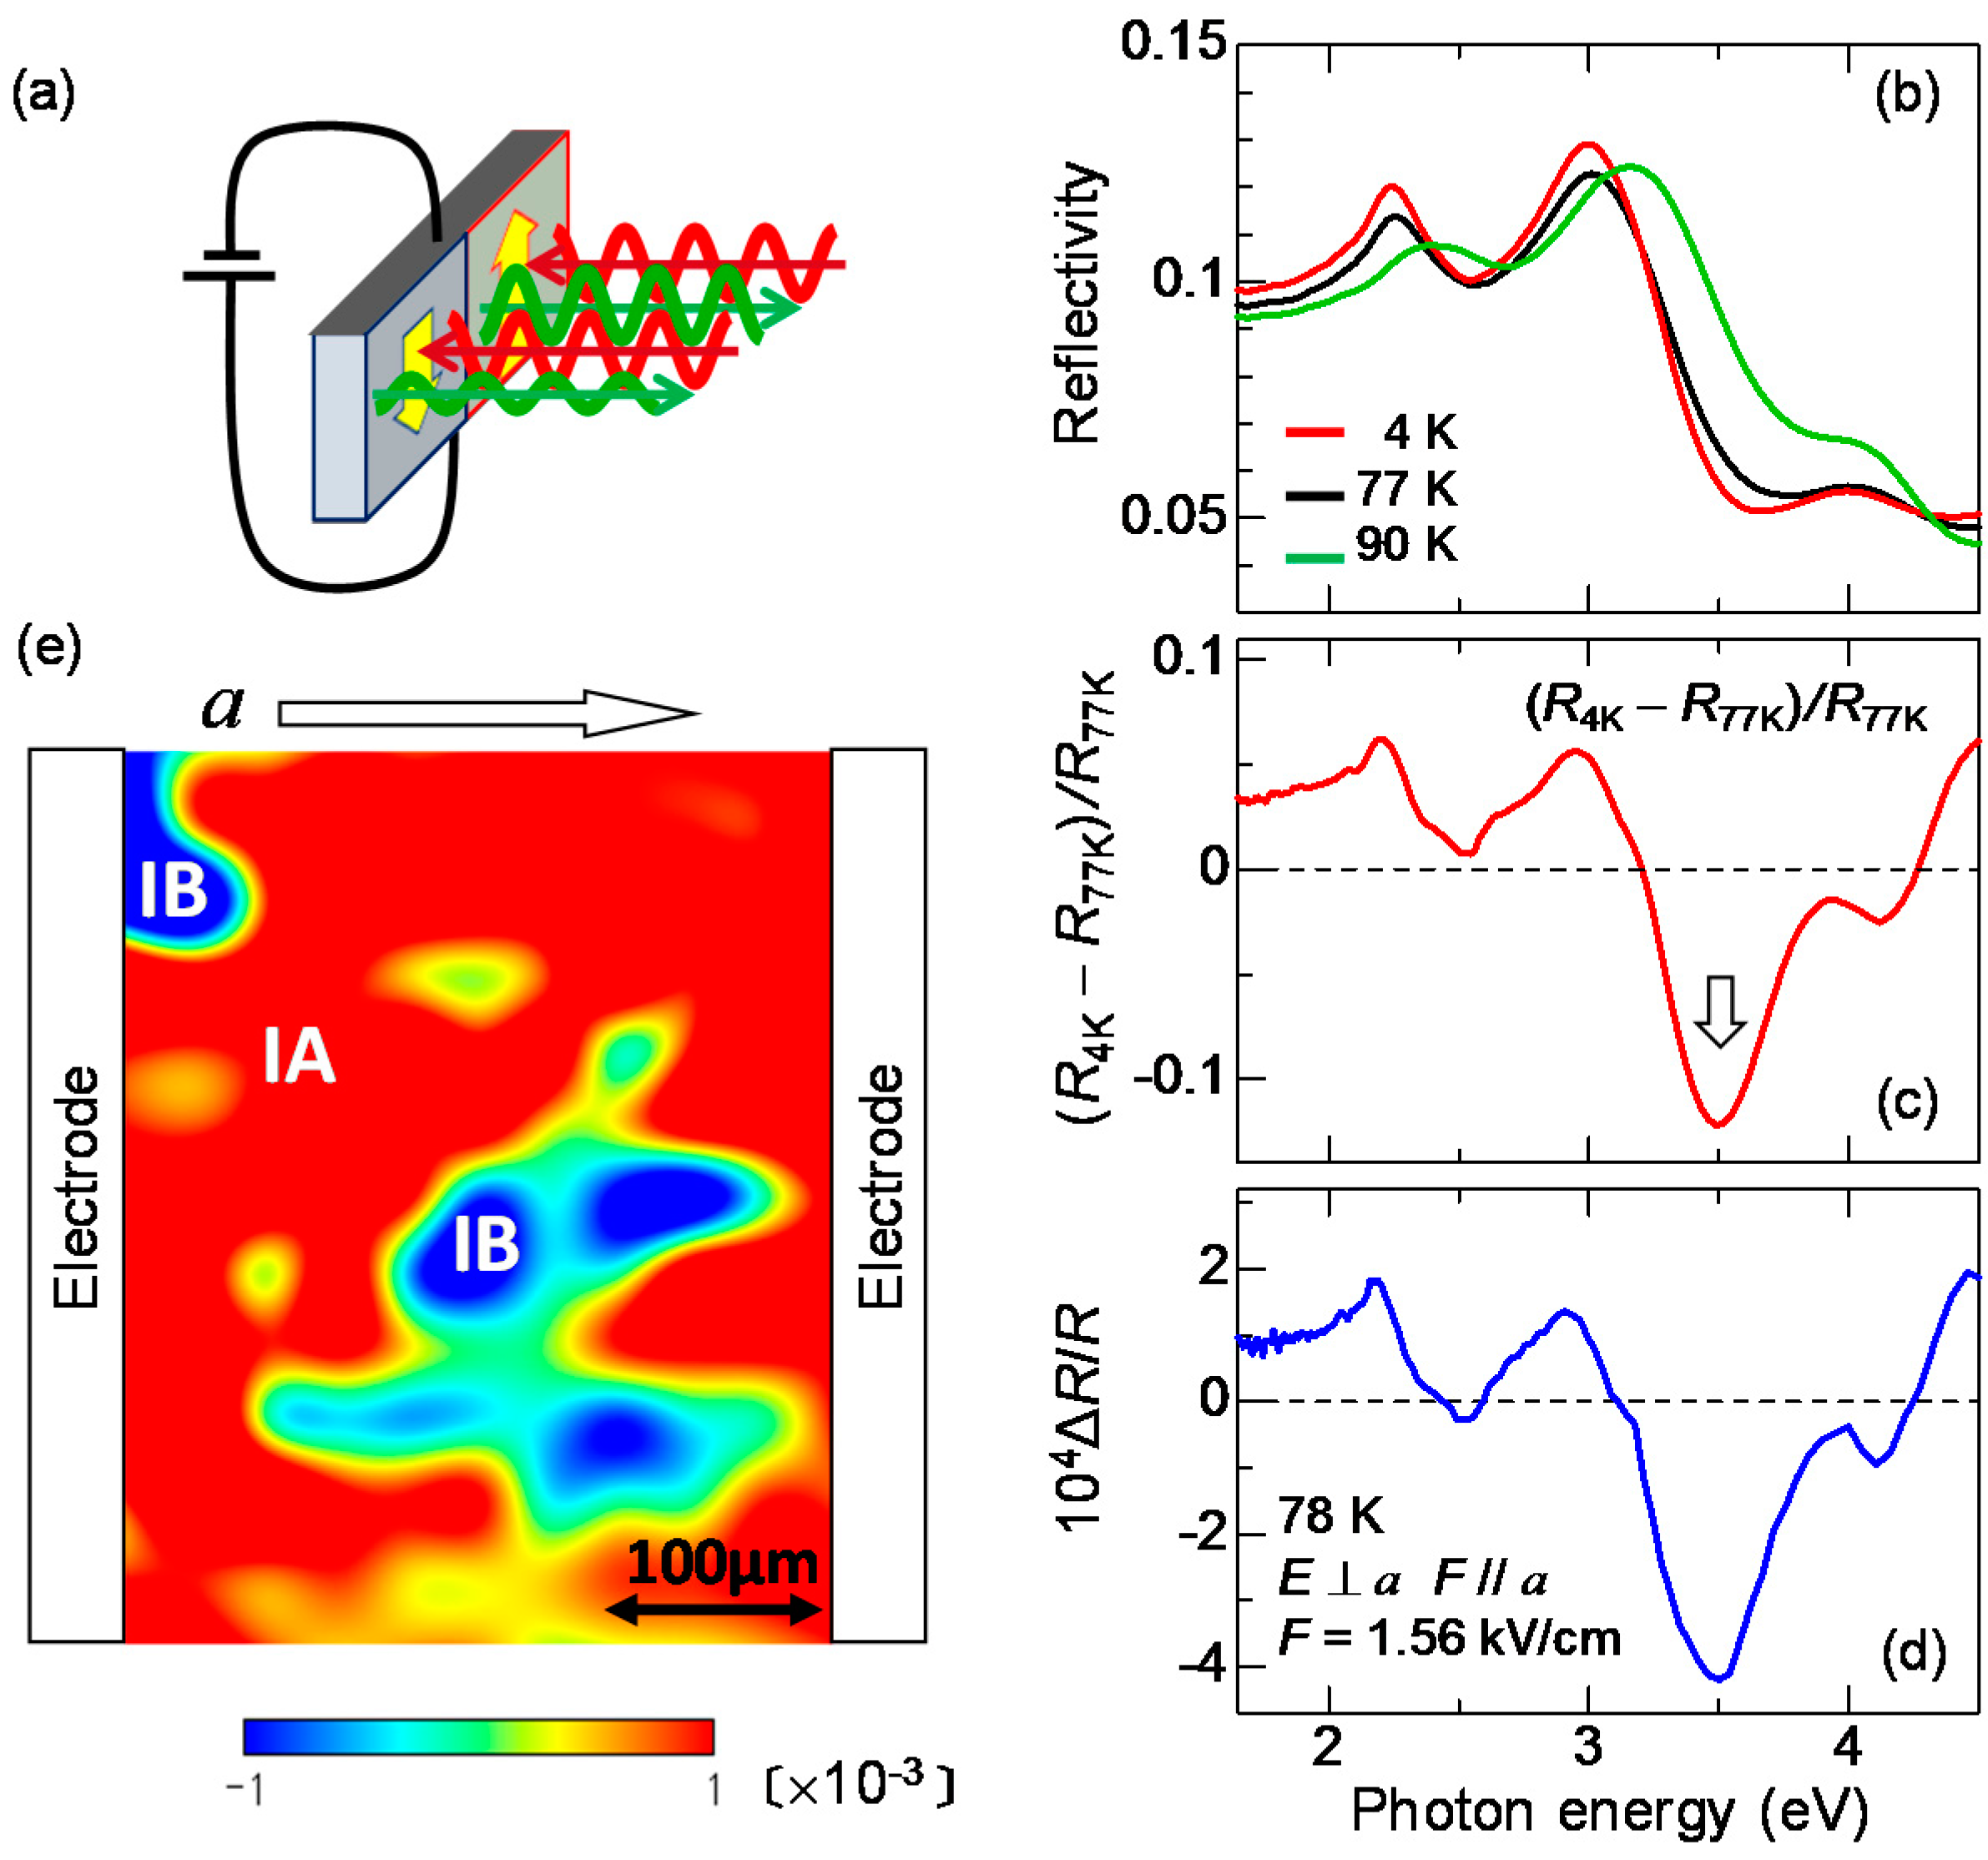
Figure 8.
Schematic of optical-pump optical-reflectivity-probe measurement system. Ti-S RA: Ti-sapphire regenerative amplifier; OPA: optical parametric amplifier.
Figure 8.
Schematic of optical-pump optical-reflectivity-probe measurement system. Ti-S RA: Ti-sapphire regenerative amplifier; OPA: optical parametric amplifier.

Figure 9.
Schematic of a terahertz-pulse generation by an optical rectification (differential frequency generation) process in a ZnTe crystal.
Figure 9.
Schematic of a terahertz-pulse generation by an optical rectification (differential frequency generation) process in a ZnTe crystal.

Figure 10.
Schematic of terahertz-pump optical-reflectivity-probe measurement system. A terahertz-pump pulse is generated by a pulse-front-tilting method in a LiNbO3 crystal. Ti-S RA: Ti-sapphire regenerative amplifier; OPA: optical parametric amplifier.
Figure 10.
Schematic of terahertz-pump optical-reflectivity-probe measurement system. A terahertz-pump pulse is generated by a pulse-front-tilting method in a LiNbO3 crystal. Ti-S RA: Ti-sapphire regenerative amplifier; OPA: optical parametric amplifier.
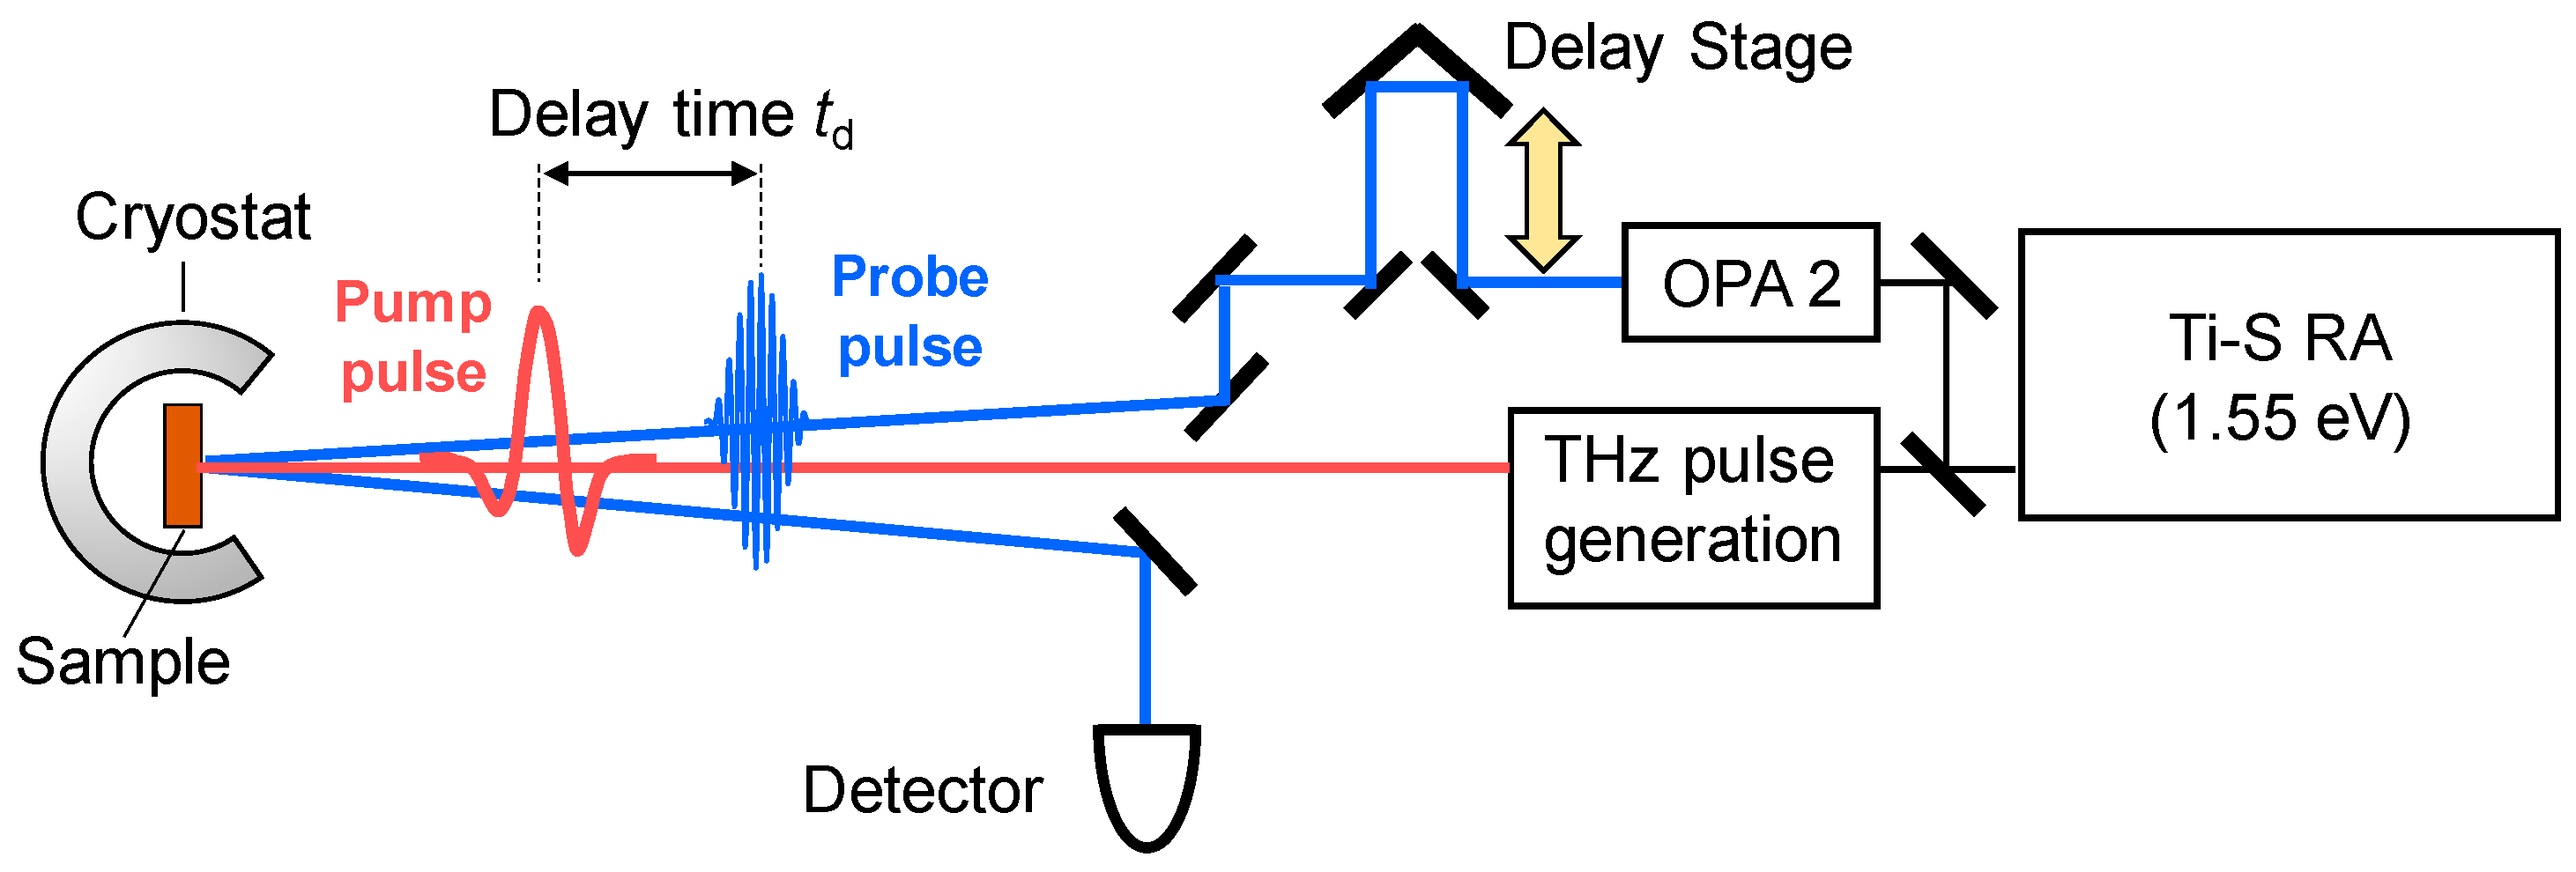
Figure 11.
Results of optical-pump optical-reflectivity-probe spectroscopy with the time resolution of ~180 fs in the N phase of TTF-CA [19]. (a) Spectra of photoinduced reflectivity changes (ΔR/R) around the intramolecular transition band of TTF at 90 K reflecting photoinduced N to I transition. Electric field of a probe pulse E is perpendicular to a (E⊥a). Photon energy of a pump pulse is 0.65 eV and an excitation photon density is 0.15 ph/DA pair; (b) Spectra of ΔR/R calculated with the multilayer model. The solid line shows a differential reflectivity spectrum between 90 K and 4 K, [RI(4 K) − RN(90K)]/RN(90K).

Figure 12.
(a,b) Schematics of (a) photoinduced N-to-I transition and (b) photoinduced I-to-N transition in TTF-CA. D0 (A0) and D+ (A−) represent neutral and ionic donor (acceptor) molecules, respectively. Underlines show dimers.
Figure 12.
(a,b) Schematics of (a) photoinduced N-to-I transition and (b) photoinduced I-to-N transition in TTF-CA. D0 (A0) and D+ (A−) represent neutral and ionic donor (acceptor) molecules, respectively. Underlines show dimers.

Figure 13.
Results of optical-pump optical-reflectivity-probe spectroscopy with the time resolution of ~20 fs in the N phase of TTF-CA [30]. (a) Polarized reflectivity spectra at 90 K (solid lines) and at 77 K (the broken line). A differential reflectivity spectrum, [RI(77 K) − RN(90K)]/RN(90K), is shown by the dashed-dotted line. Shaded areas show spectra of pump and probe pulses; (b) Time evolution of reflectivity changes ΔR/R. The gray shaded area in the inset shows a cross-correlation profile of pump and probe pulses. Solid lines in the inset are simulated time characteristics with different time constant (rise time) τd of ΔR/R signals.

Figure 14.
Fitting analyses of the oscillatory component obtained in optical-pump optical-reflectivity-probe spectroscopy with the time resolution of ~20 fs in the N phase of TTF-CA [30]. (a) Oscillatory component ΔROSC/R (circles) which is extracted from ΔR/R (Figure 13b). The red solid line is a fitting curve, which is obtained by summing up below five oscillation components and convoluting it with the instrumental function; (b) The lattice mode of dimeric molecular displacements which is the origin of the 53 cm−1 oscillation mode. Oscillation of electron transfer −Δρ1 indicated by yellow arrows is induced by this lattice mode; (c) Intramolecular ag modes which are origins of high-frequency oscillatory components; (d) Schematic of the electron-intramolecular vibration (EIMV) coupling. Intramolecular ag modes induce electron transfers −Δρ3 and −Δρ5 indicated by yellow arrows.

Figure 15.
Wavelet analyses of the oscillatory component obtained in optical-pump optical-reflectivity-probe spectroscopy with the time resolution of ~20 fs in the N phase of TTF-CA [30]. (a) Left panel: Fourier transform of the oscillatory component (circles) and the fitting function (solid lines) shown in Figure 14a. Right panel: Wavelet transform of the oscillatory component. Broken lines show peaks in transient Fourier spectra; (b) Time dependence of oscillation frequencies of intramolecular ag modes. Broken lines show fitting curves obtained by assuming an exponential shift and a periodic oscillation. Solid lines show results of the analyses by equation (4); (c) Changes in molecular structures in the neutral and ionic phases. TTF and CA molecules are plane in the neutral phase and bent in the ionic phase; (d) Bending modes of TTF and CA.

Figure 16.
Schematic of photoinduced N-to-I transition dynamics in TTF-CA [30]. Blue curved arrows indicate electron transfers.
Figure 16.
Schematic of photoinduced N-to-I transition dynamics in TTF-CA [30]. Blue curved arrows indicate electron transfers.

Figure 17.
Normalized time evolutions of ΔR/R signals at different temperatures and excitation densities in the ionic phase of TTF-CA [33]. Spectra of pump and probe pulses are shown in Figure 13a. The green line: 90 K and 0.014 ph/DA. The blue line: 90 K and 0.14 ph/DA. The orange line: 260 K and 0.014 ph/DA. The red line: 260 K and 0.14 ph/DA. The inset shows excitation photon density (xph) dependence of ΔR/R at 90 K (solid circles) and 260 K (open circles).

Figure 18.
Results of optical-pump optical-reflectivity-probe spectroscopy with the time resolution of ~20 fs in the I phase of TTF-CA. (a) Polarized reflectivity spectra at 4 K (solid lines) and at 90 K (the broken line). A differential reflectivity spectrum, [RN(90 K) − RI(4 K)]/RI(4 K), is shown by the dashed-dotted line. Shaded areas show spectra of pump and probe pulses; (b) Time evolutions of reflectivity changes (ΔR/R) at around 2.2 eV by a strong excitation with xph = 0.12 ph/DA [(I) and (II)] and by a weak excitation with xph = 0.03 ph/DA [(III) and (IV)]. Green lines in (II) and (IV) show waveforms of −cos(ωt) with ħω = 55 cm−1.
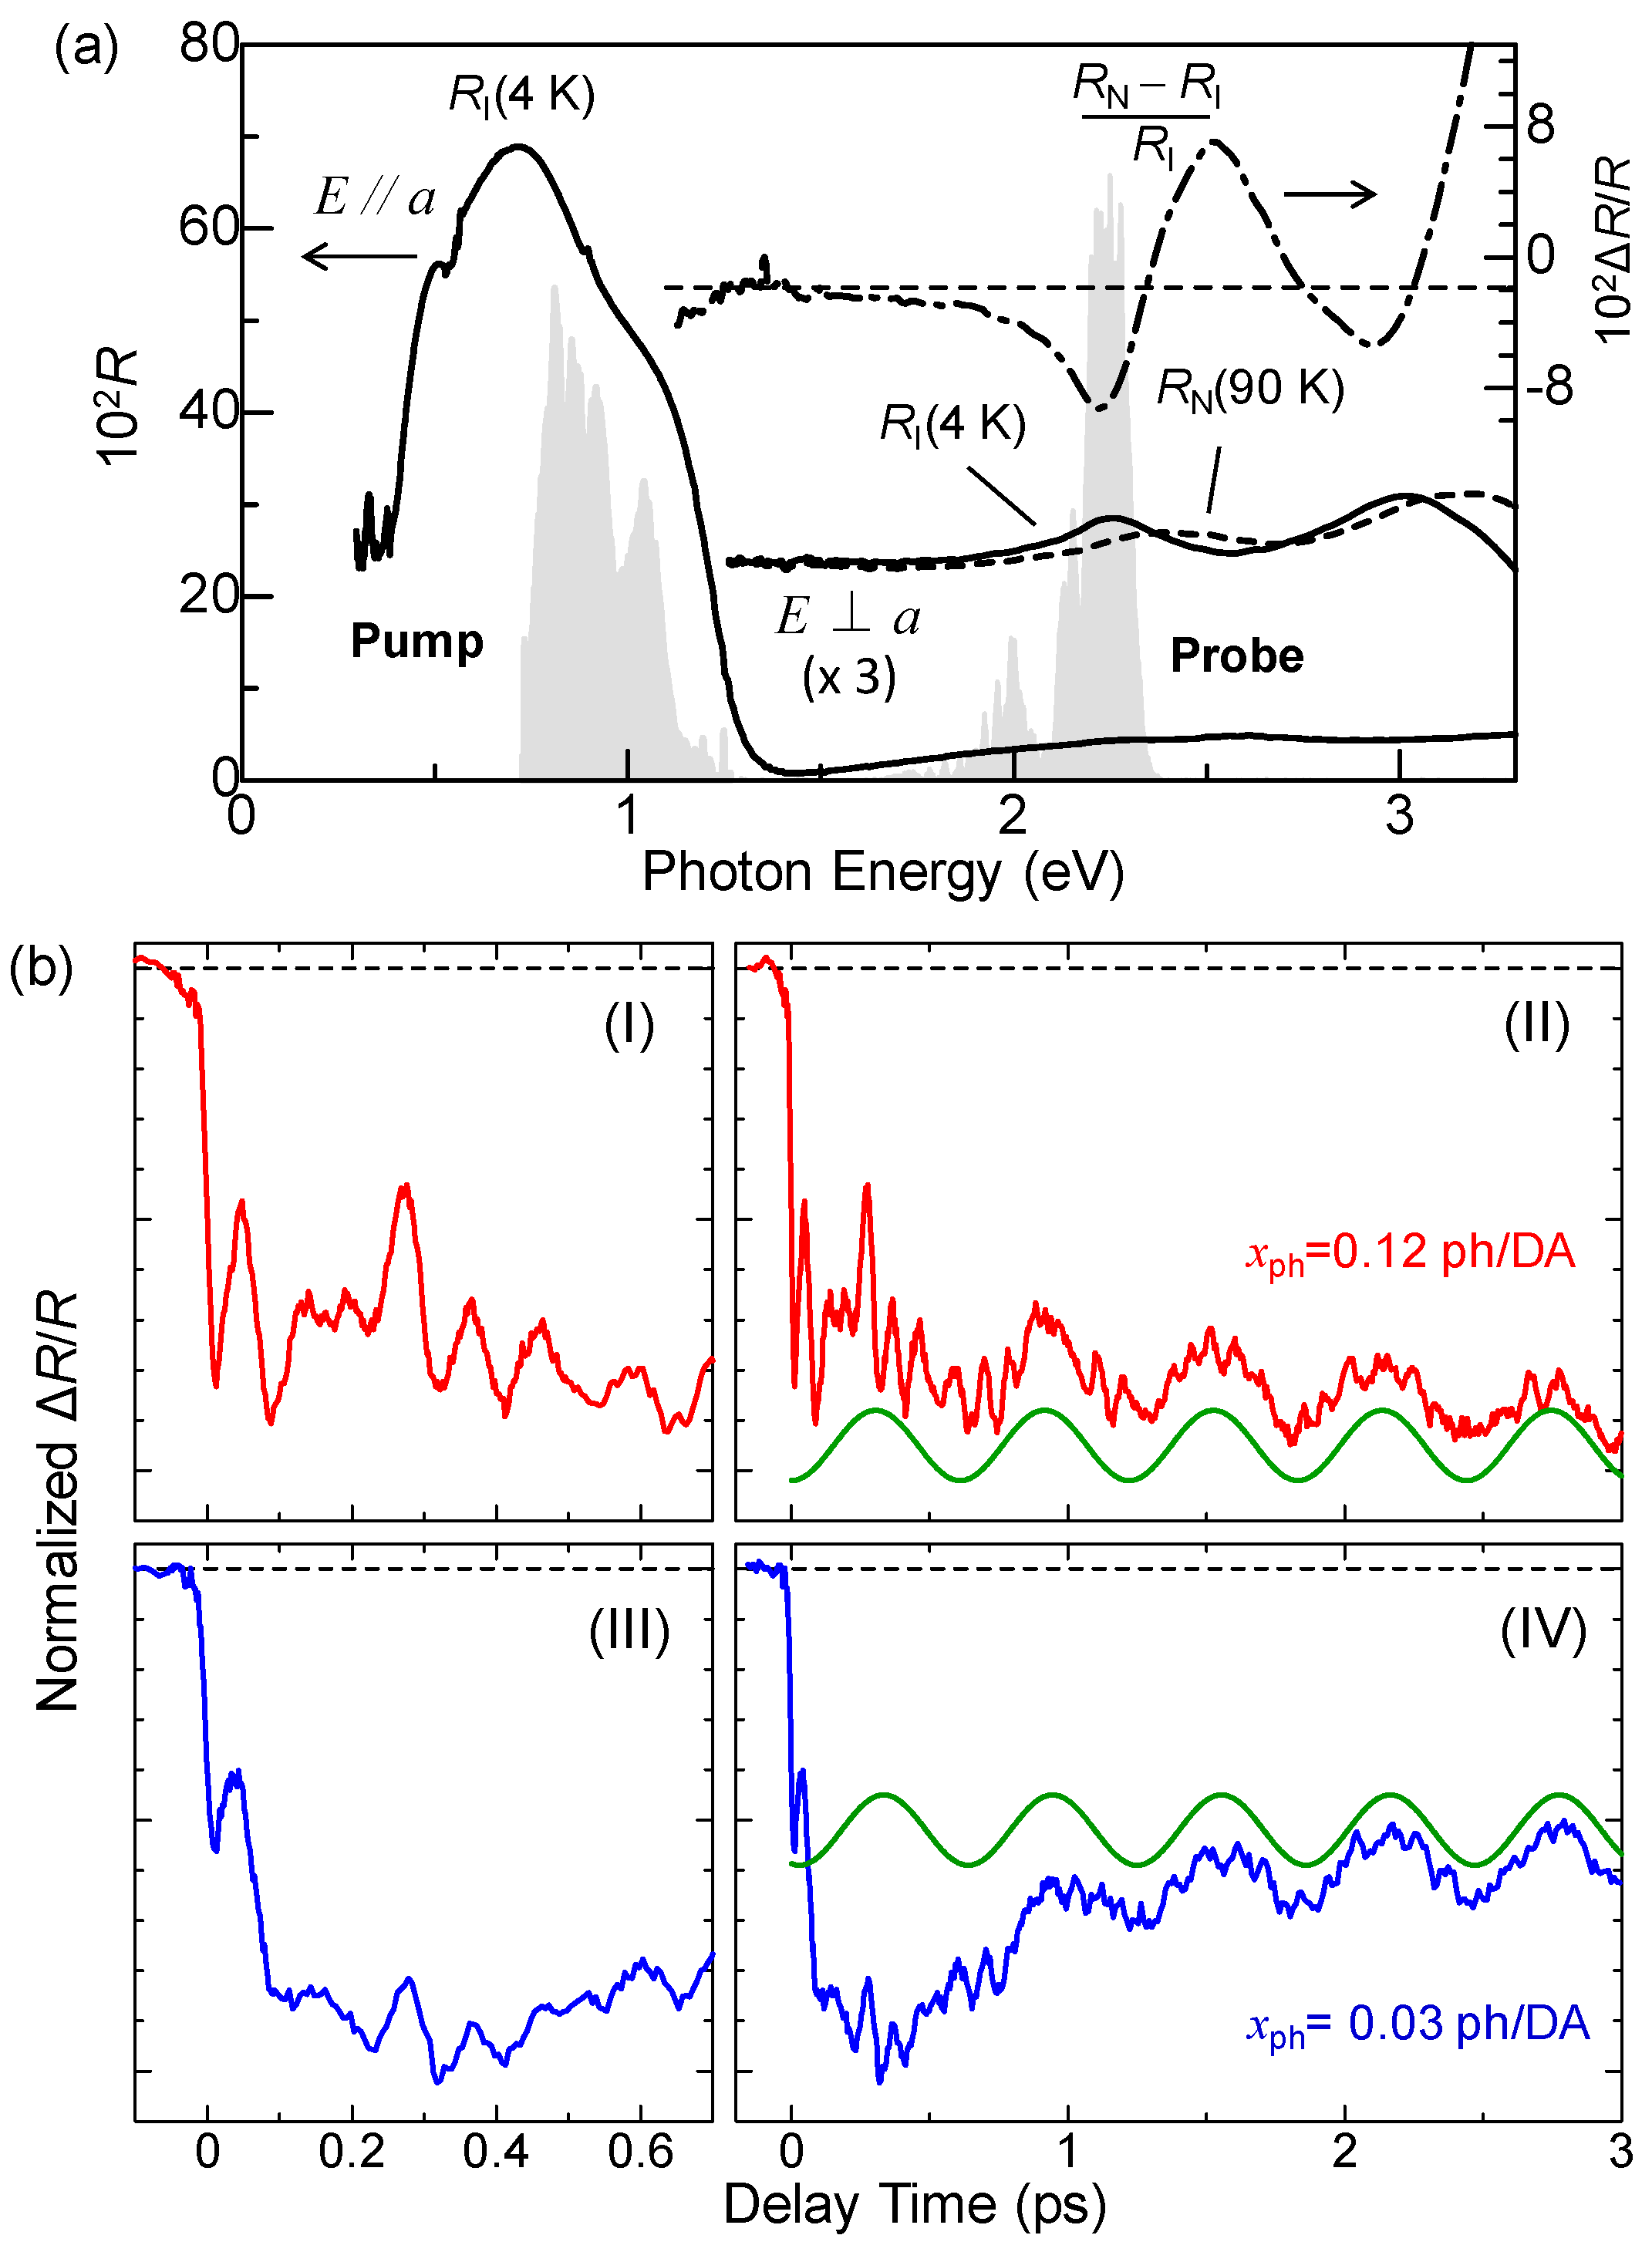
Figure 19.
Analyses of the results of optical-pump optical-reflectivity-probe spectroscopy with the time resolution of ~20 fs in the I phase of TTF-CA. (a) Excitation photon density (xph) dependence of reflectivity changes ΔR/R at around 2.2 eV (squares) and initial amplitudes of +cosine-type oscillations (circles) shown by the orange line in (b); (b) Normalized time evolutions of ΔR/R (the blue line). The red line shows a fitting curve. Two components of the fitting curve are shown by green and orange lines; (c) Schematic illustrations of coherent oscillations. −cosine-type oscillation and +cosine-type oscillation are generated in a neutral domain and in a surrounding ionic region, respectively.
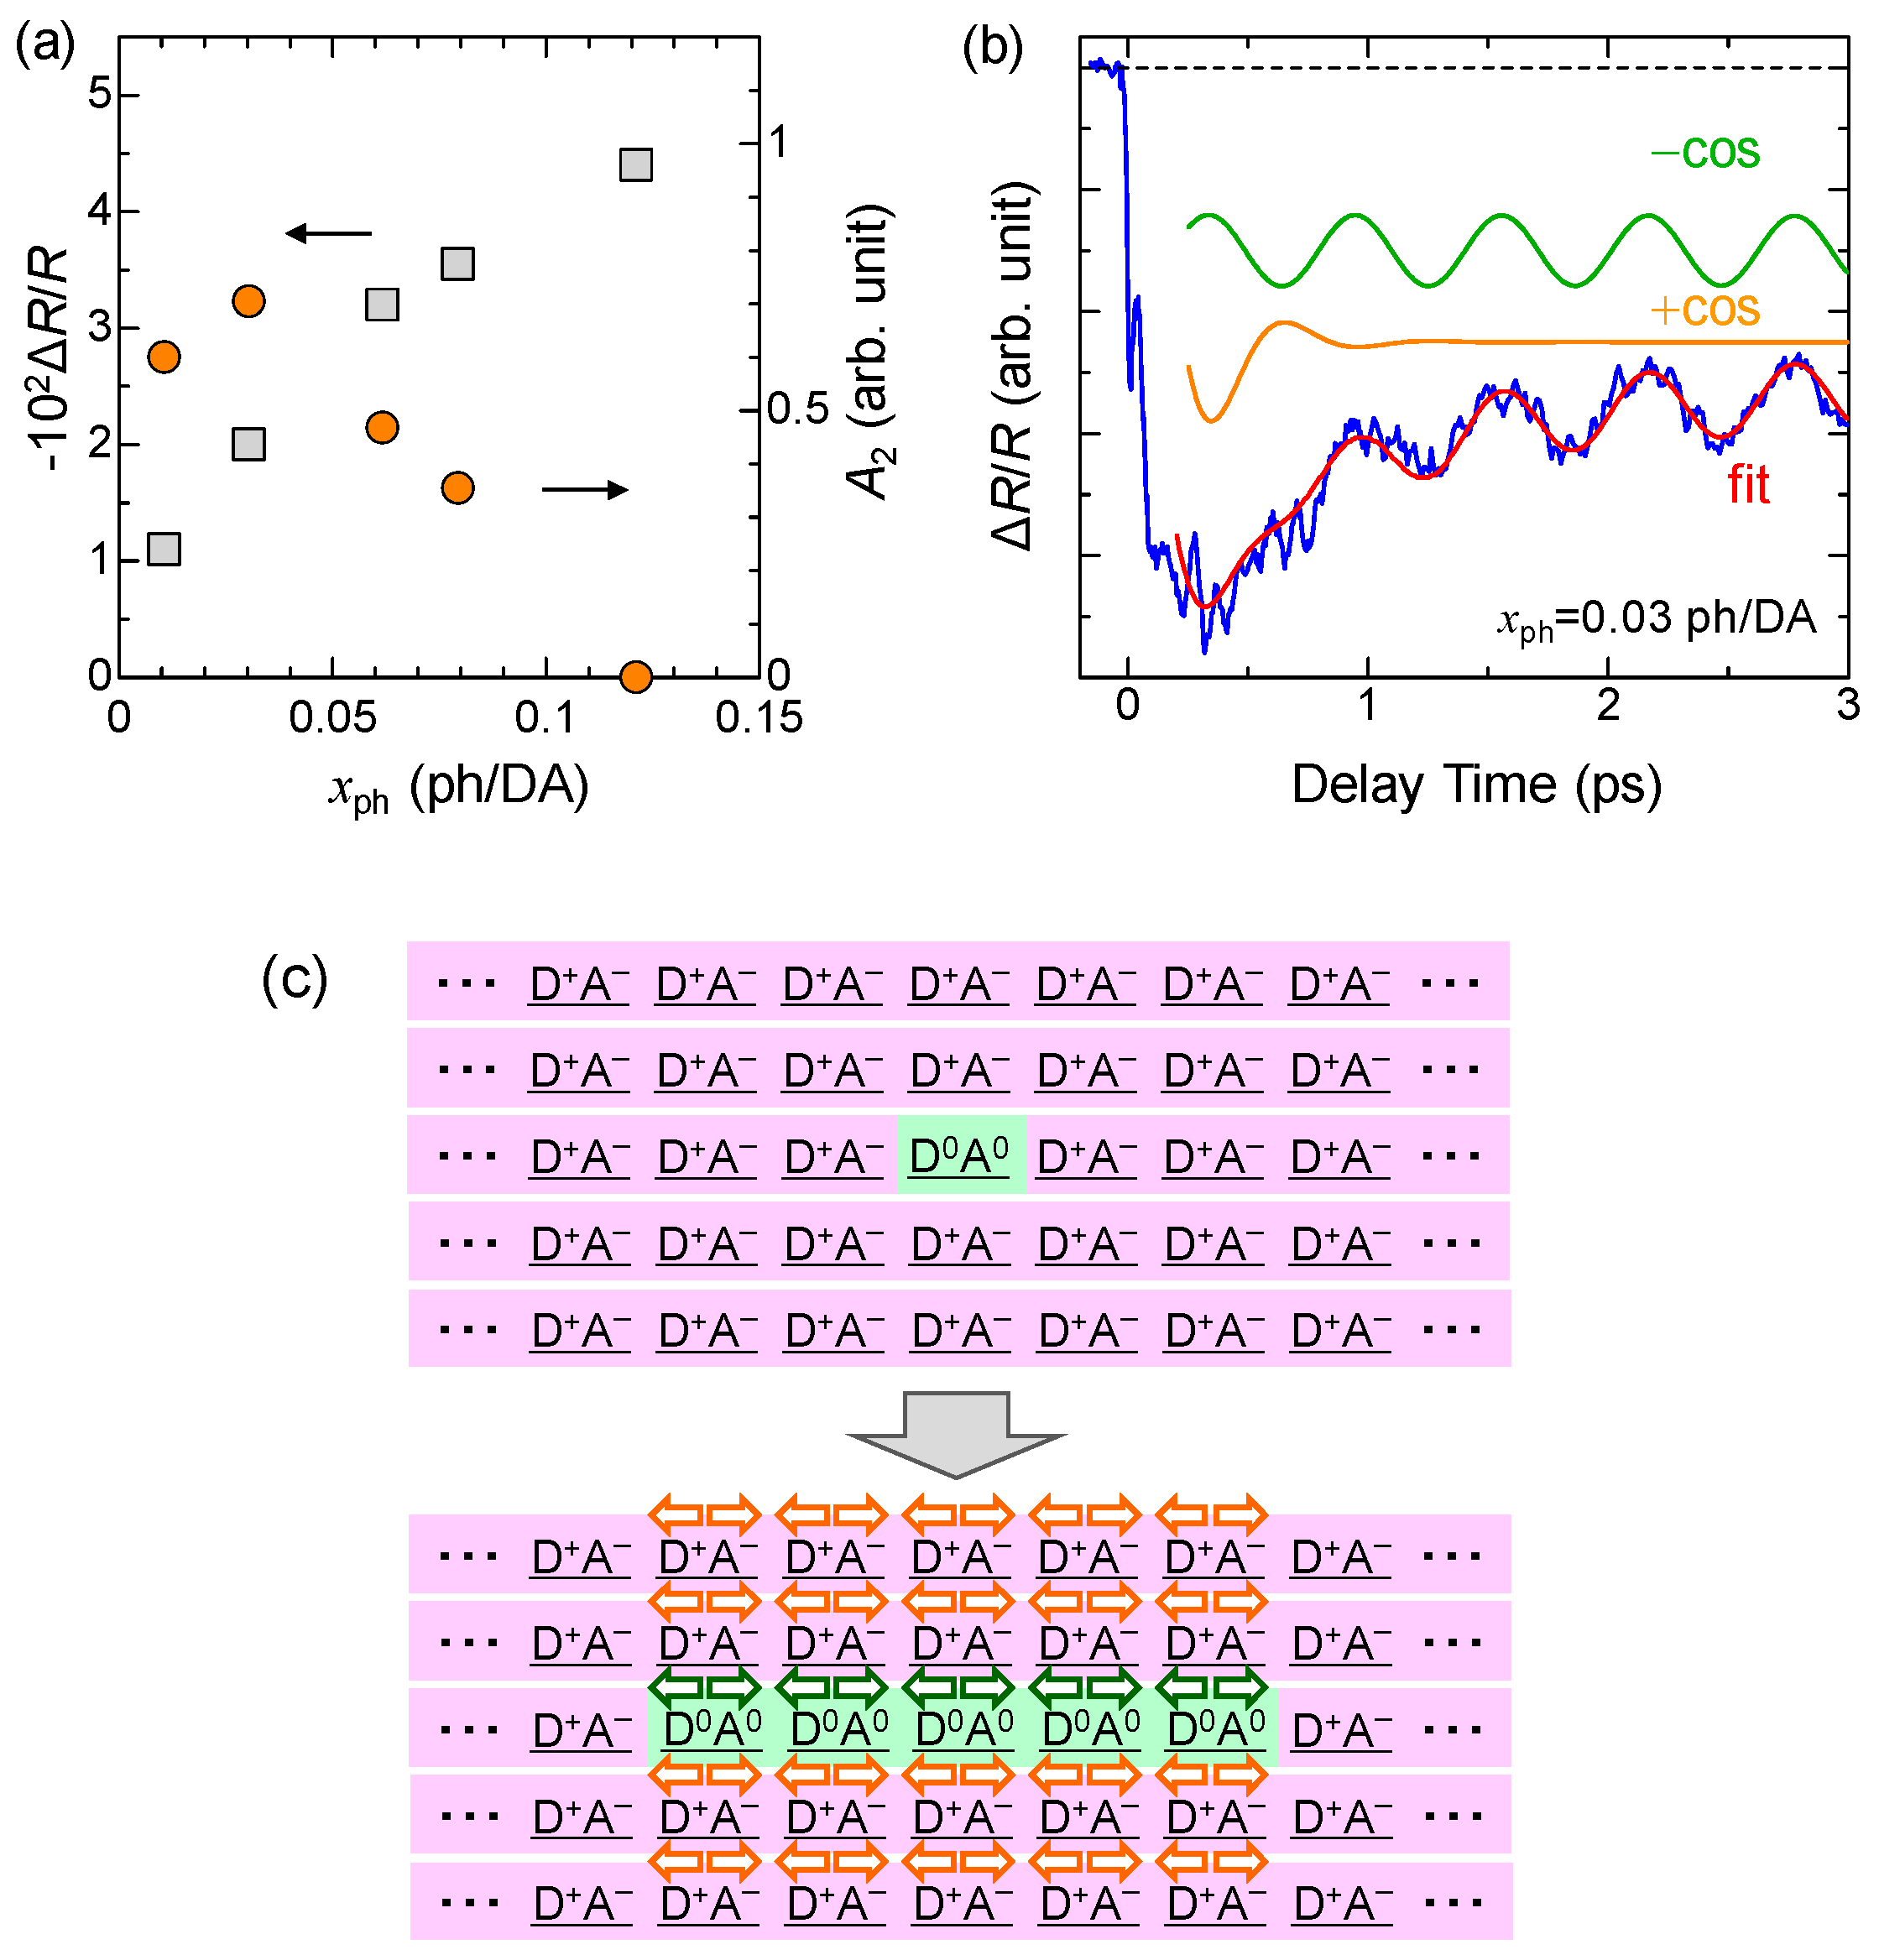
Figure 20.
Results of terahertz-pump SHG-probe measurements in the ferroelectric I phase of TTF-CA [41]. (a) Schematics of terahertz-pump SHG-probe measurement in the ionic phase; (b) a Fourier power spectrum of a terahertz electric-field pulse shown by the red line in; (c) time evolutions of changes in an SH intensity at 65 K, , by a terahertz electric field (blue circles), with the electric-field amplitude of (c) 36 kV/cm; and (d) 415 kV/cm. Red lines show electric-field waveforms of terahertz pulses ().

Figure 21.
Results of terahertz-pump optical-reflectivity-probe measurements in the ferroelectric I phase of TTF-CA [41]. (a) Schematic of terahertz-pump optical-reflectivity-probe measurement; (b) an electric-field waveform of a terahertz pulse (ETHz); (c) time evolution of reflectivity changes ΔR/R at 78 K in the ionic phase (circles) and the normalized ETHz(t) (the solid line) in TTF-CA [41]; (d) probe energy dependence of ΔR/R at the delay time td = 0 ps and at 78 K (yellow circles). The solid line shows the first derivative (dR/dE) of a reflectivity spectrum at 77 K with respect to the photon energy E, which shows the reflectivity change due to a slight increase in ρ; (e) an oscillatory component ΔROSC(t)/R (circles) and fitting curve (solid line); (f–h) time-dependent Fourier power spectra (wavelet transforms) of (b), ETHz(t) (c), ΔR/R(t), and (e) ΔROSC/R(t), respectively.

Figure 22.
Comparison of ferroelectric polarization P and terahertz electric field ETHz in TTF-CA [41]. (a) Interrelation in time evolutions of a reflectivity change ΔR/R (Δρ) and ETHz at 65 K; (b) Schematic of a polarization–electric field curve (P–E curve) and a polarization–terahertz-electric-field curve (P–ETHz curve).

Figure 23.
Schematics of observed responses to a terahertz electric-field pulse in the ionic phase of TTF-CA [41]. (a) Ionic phase with ferroelectric polarization P; (b,c) Direct modulation of charge transfers and polarization by a terahertz electric field with ETHz(0) directed to the left (b) and right (c), respectively. Amplitude of ferroelectric polarization increases in the case of (b) and decreases in (c); (d,e) Additional modulation of charge transfer and polarization via dimeric molecular oscillations; (d) increases and (e) decreases dimeric molecular displacements, charge transfers, and polarization. Straight green arrows represent dimeric molecular displacements; Curved arrows in (b–d) indicate induced charge transfers.
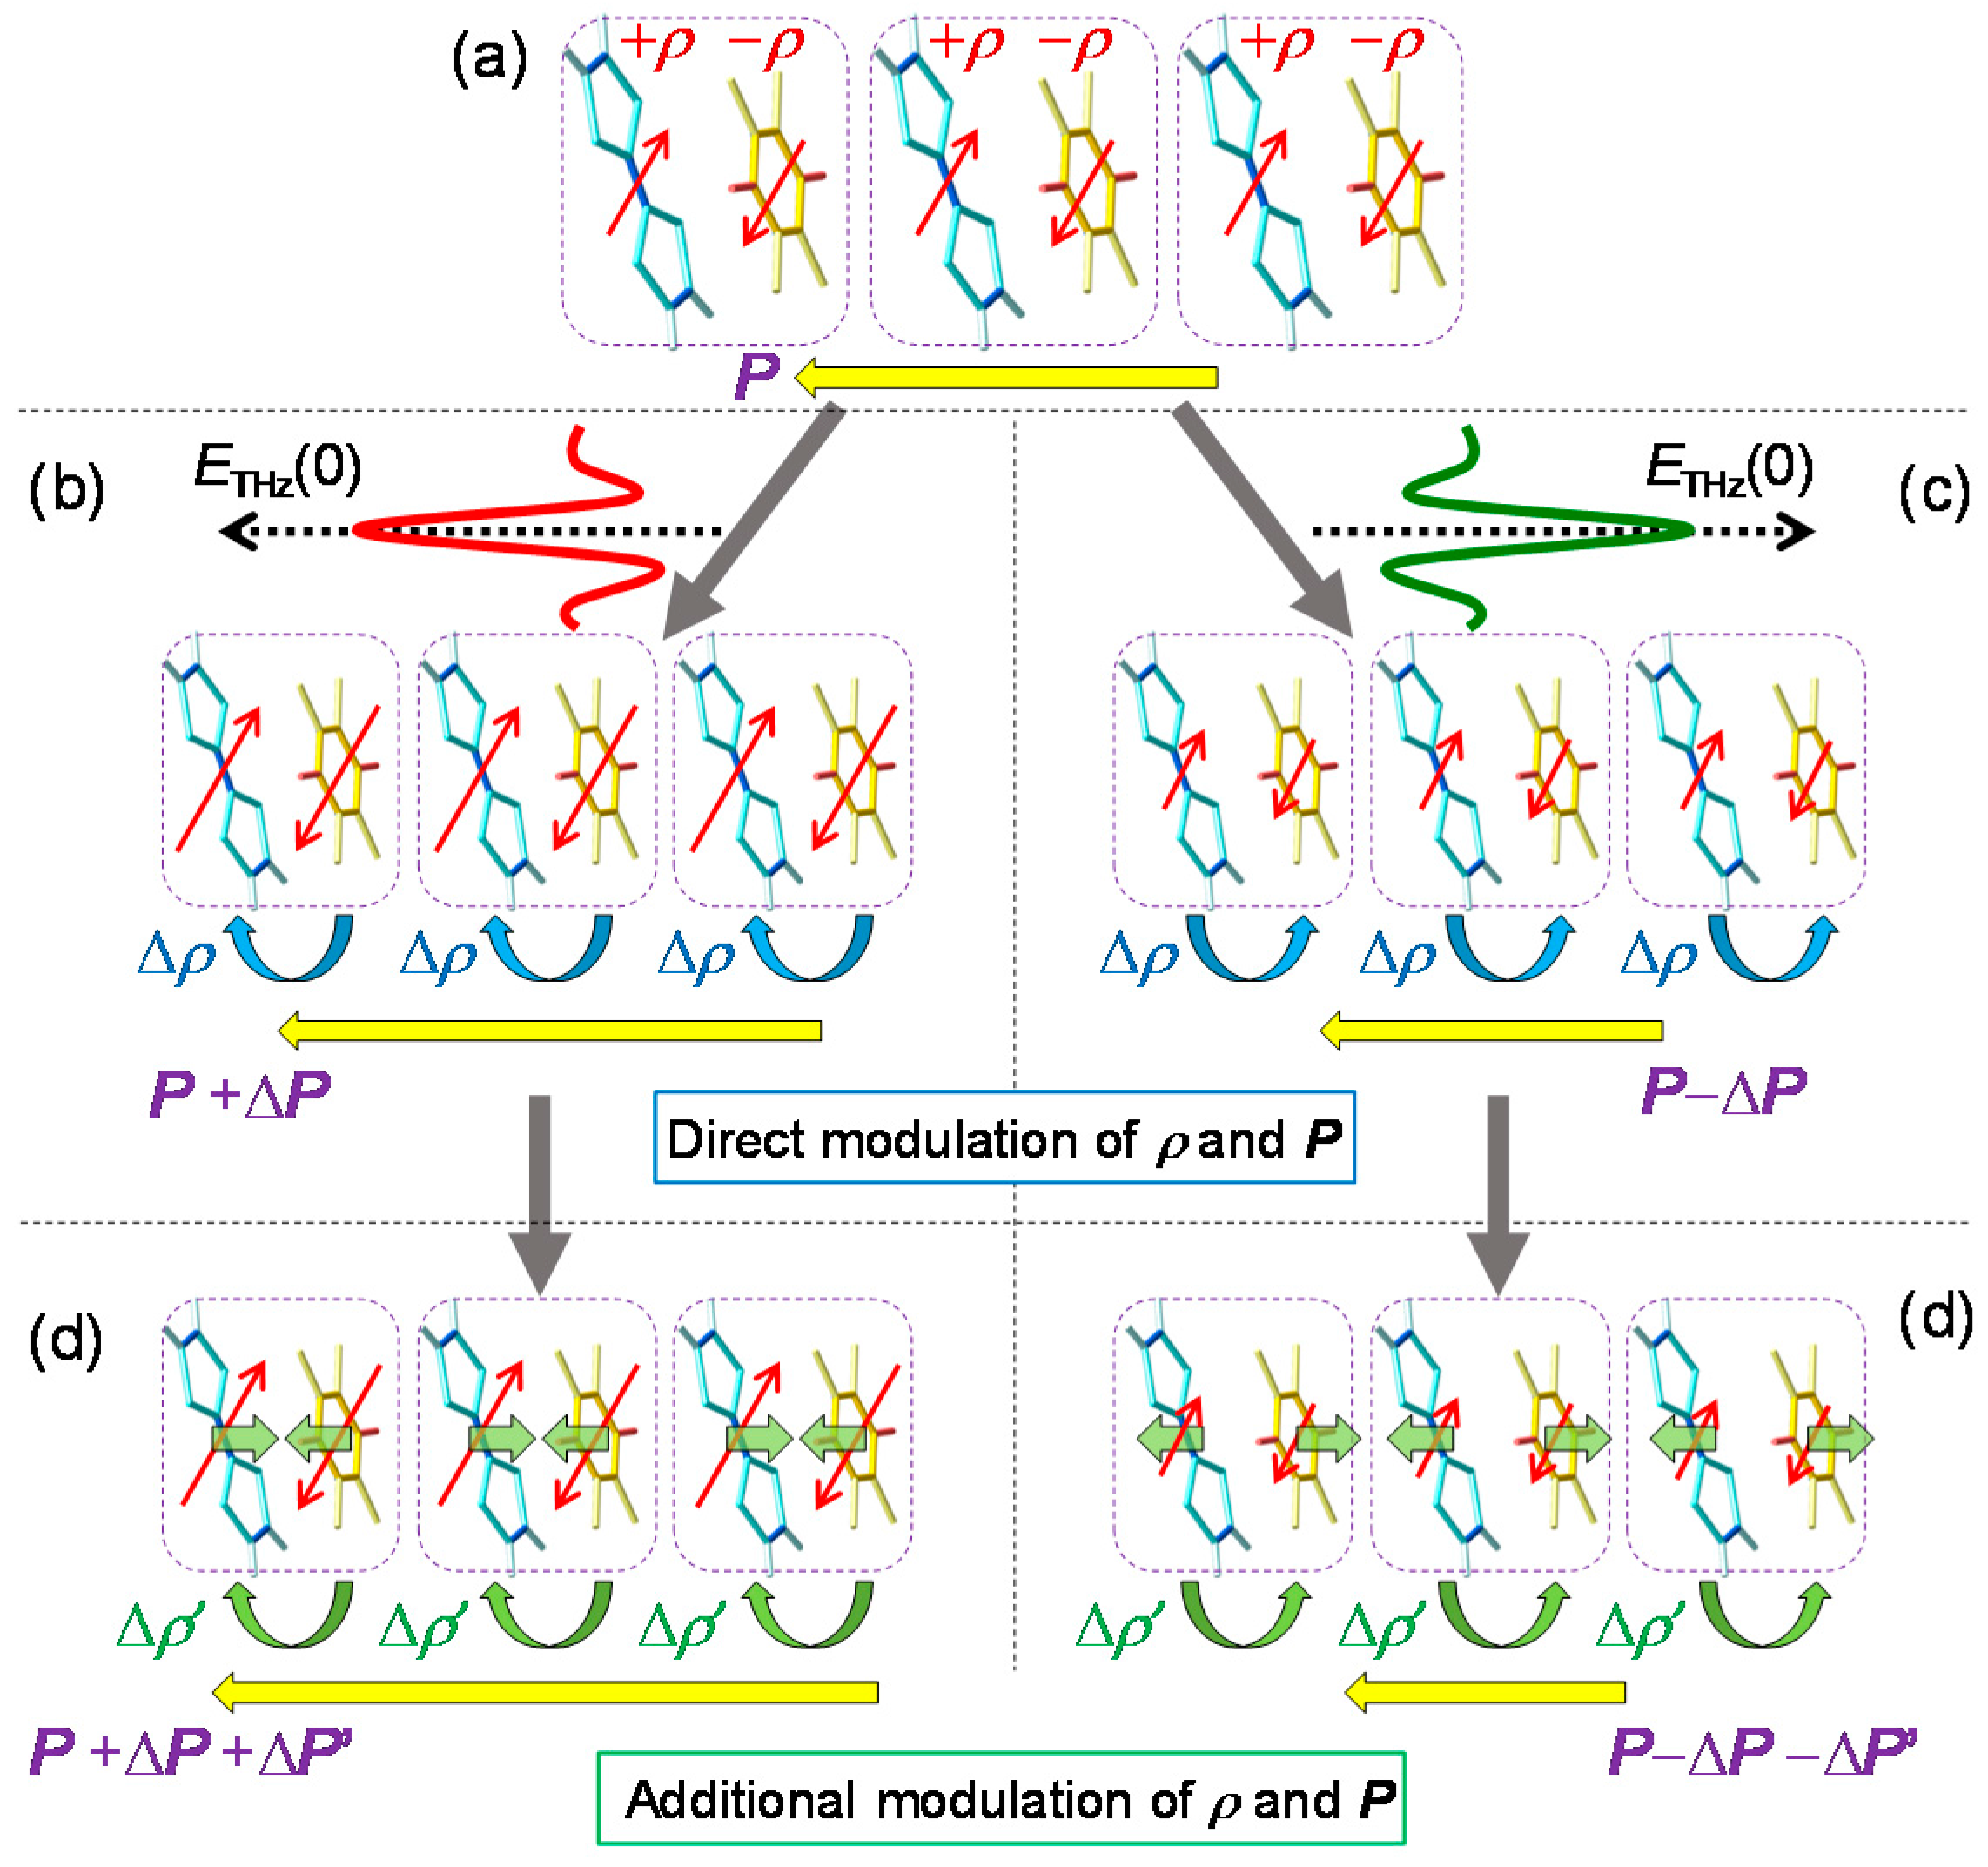
Figure 24.
Results of terahertz-pump SHG-probe and optical-reflectivity-probe measurements in the paraelectric N phase (90 K) of TTF-CA [42]. (a) Schematics of terahertz-pump SHG-probe measurement in the neutral phase; (b) Electric-field waveform of a terahertz pulse (ETHz); (c) Time evolution of an SH intensity at 90 K by a terahertz electric-field pulse shown in (b); (d) Fourier power spectrum of a terahertz electric-field pulse shown in (b); (e) The time evolution of reflectivity change at 1.3 eV and at 90 K. Shaded area in (c,e) shows a waveform of the square of a terahertz electric field .
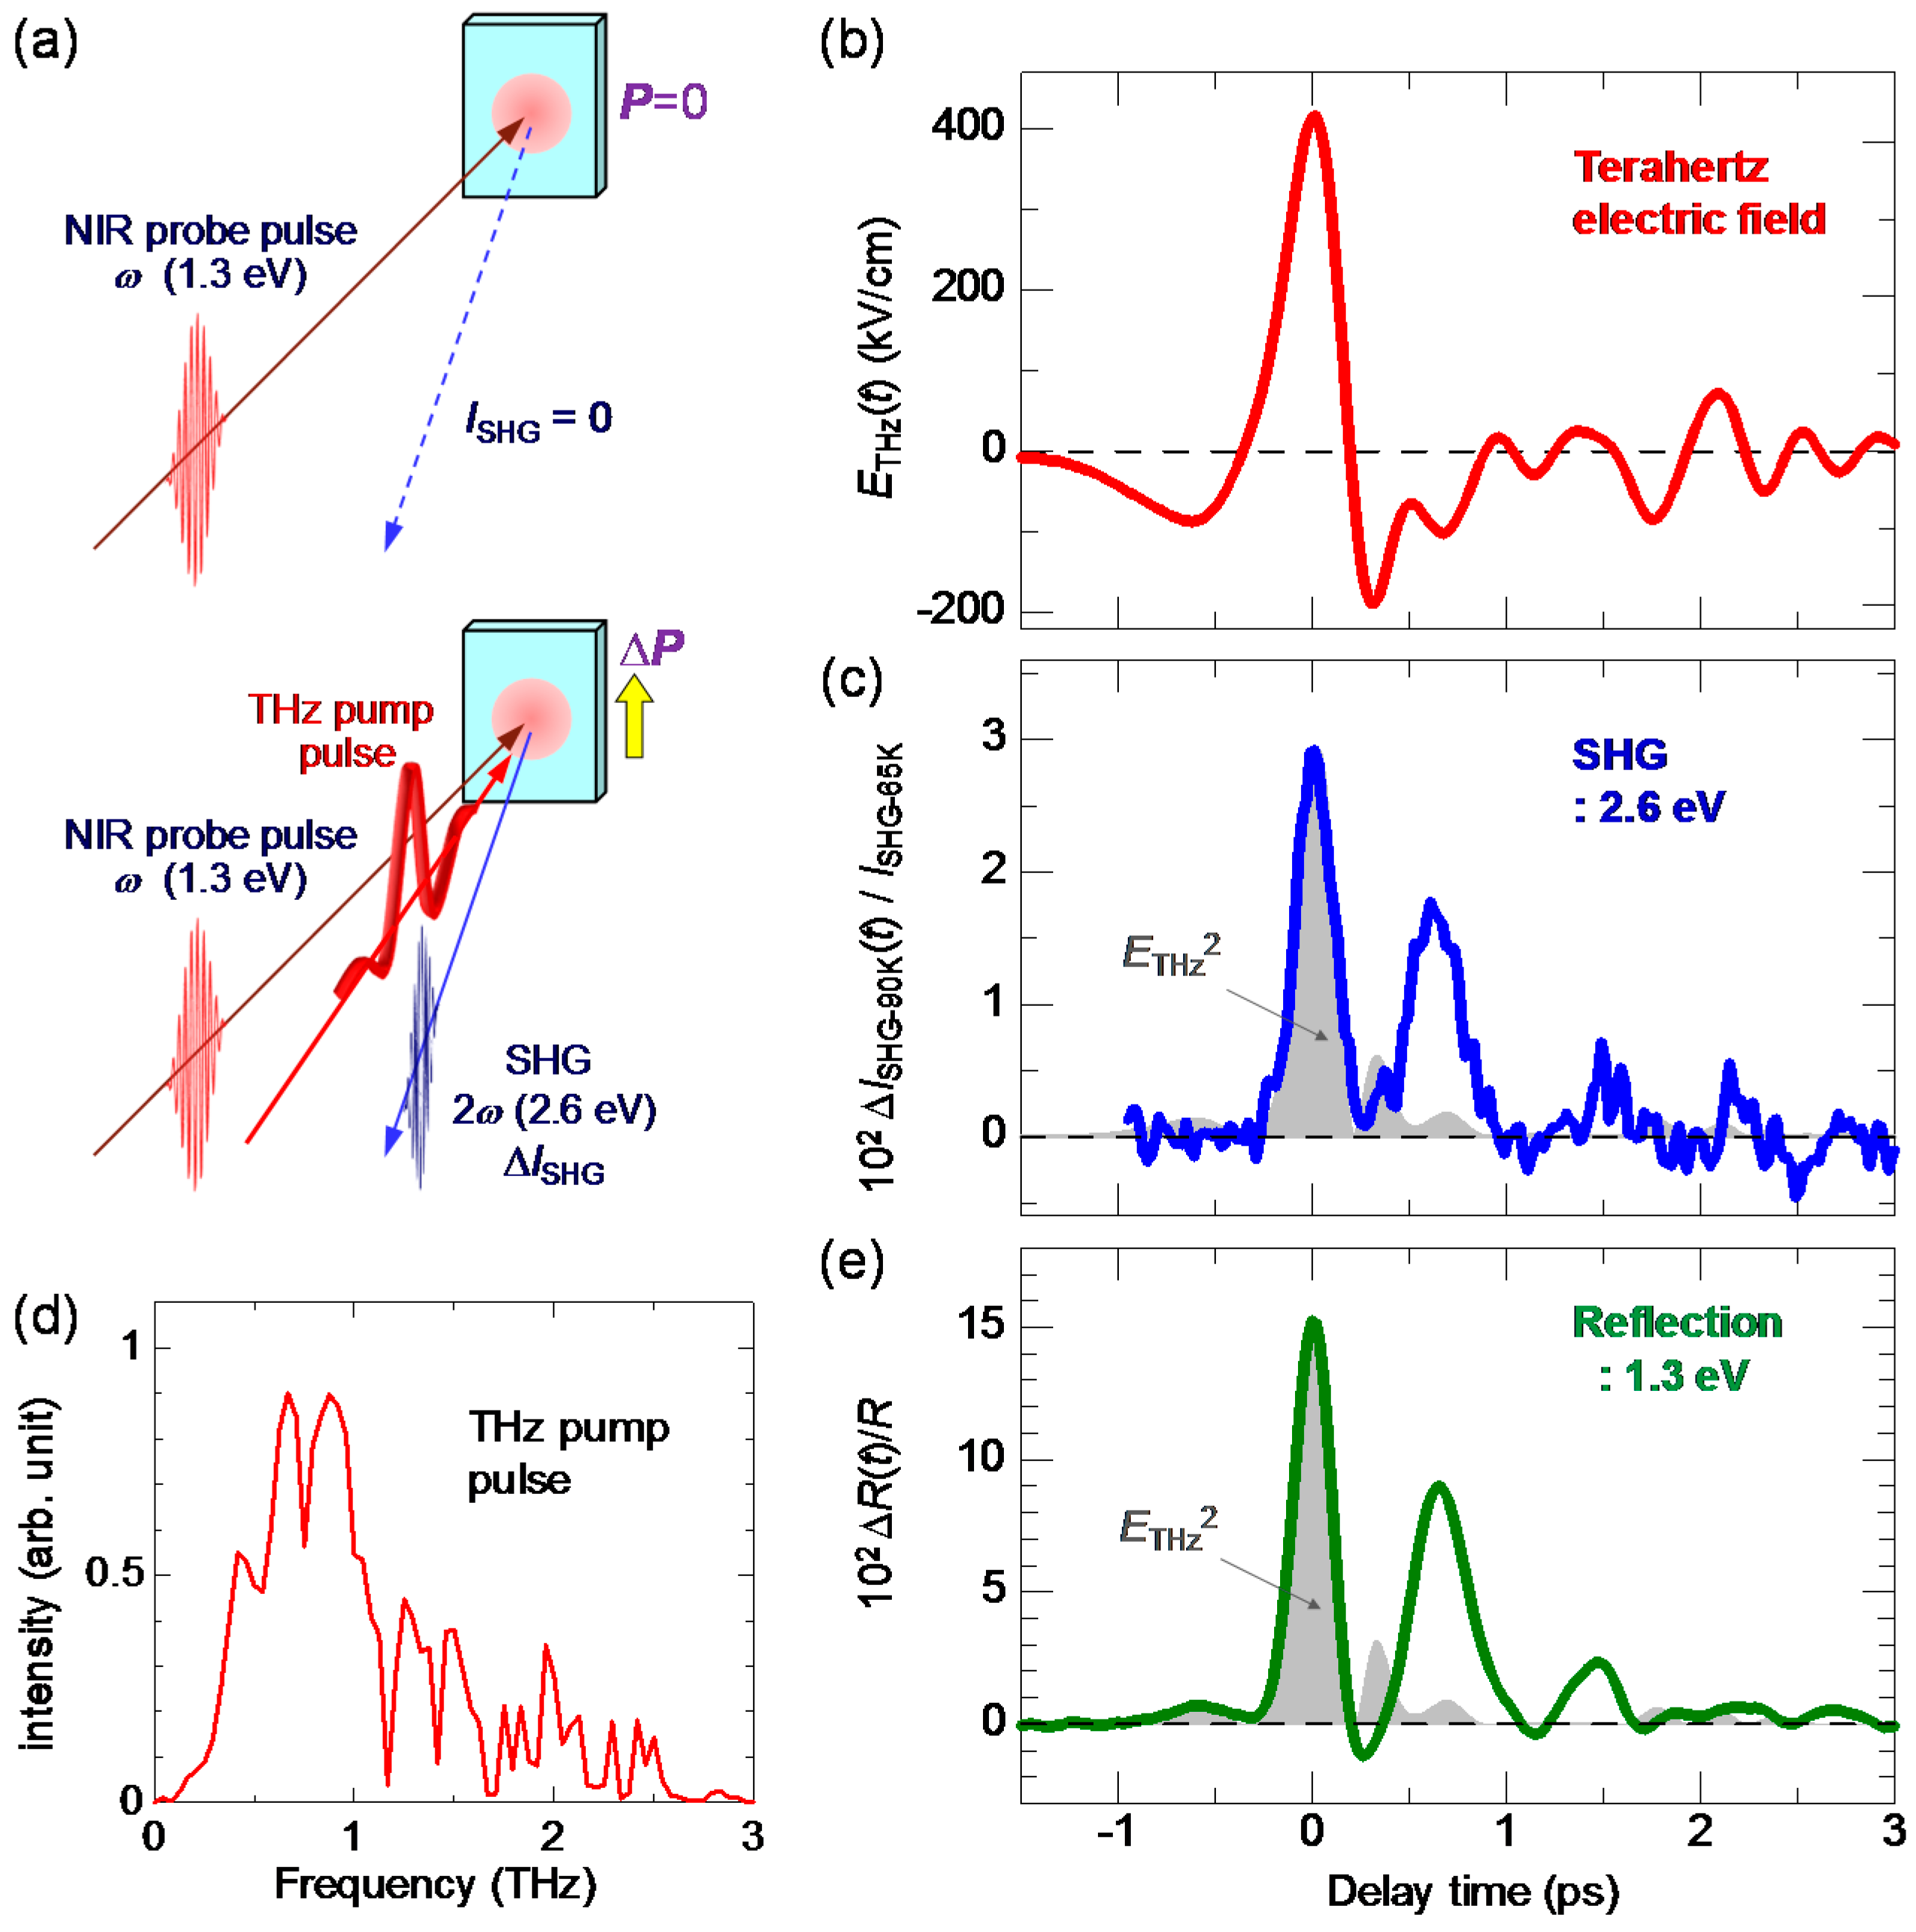
Figure 25.
Temperature dependence of transient optical-reflectivity change by a terahertz electric field in the paraelectric N phase of TTF-CA [42]. (a) Polarized reflectivity spectra in the CT transition region at 90 K (the neutral phase) and at 77 K (the ionic phase); (b) Probe energy dependence of terahertz-electric-field-induced reflectivity changes at the time origin (yellow circles). The blue line shows the differential reflectivity spectrum, [RI(77 K) − RN(90 K)]; (c) Time evolutions of terahertz-field-induced reflectivity changes at various temperatures. Shaded areas show second peaks; (d) Temperature dependence of reflectivity changes at the first peak (the time origin) (circles) and the second peak (triangles).

Figure 26.
Schematics of observed responses to a terahertz electric-field pulse in the paraelectric neutral phase of TTF-CA [42]. (a,b) 1D microscopic ionic domains fluctuating in the neutral region. An I+ domain has a dipole moment +μ and an I− domain has a dipole moment −μ; (c) Terahertz-electric-field-induced changes of 1D ionic domains. A terahertz electric field with the right-hand direction increases (decreases) the size of an I+ (I−) domain via intermolecular charge transfers at domain boundaries (red curved arrows) and changes ρ by Δρ(−Δρ) within the ionic domain (yellow curved arrows); (d) Coherent oscillations of NIDW pairs. (e) A large macroscopic polarization produced by microscopic changes of 1D ionic domains.
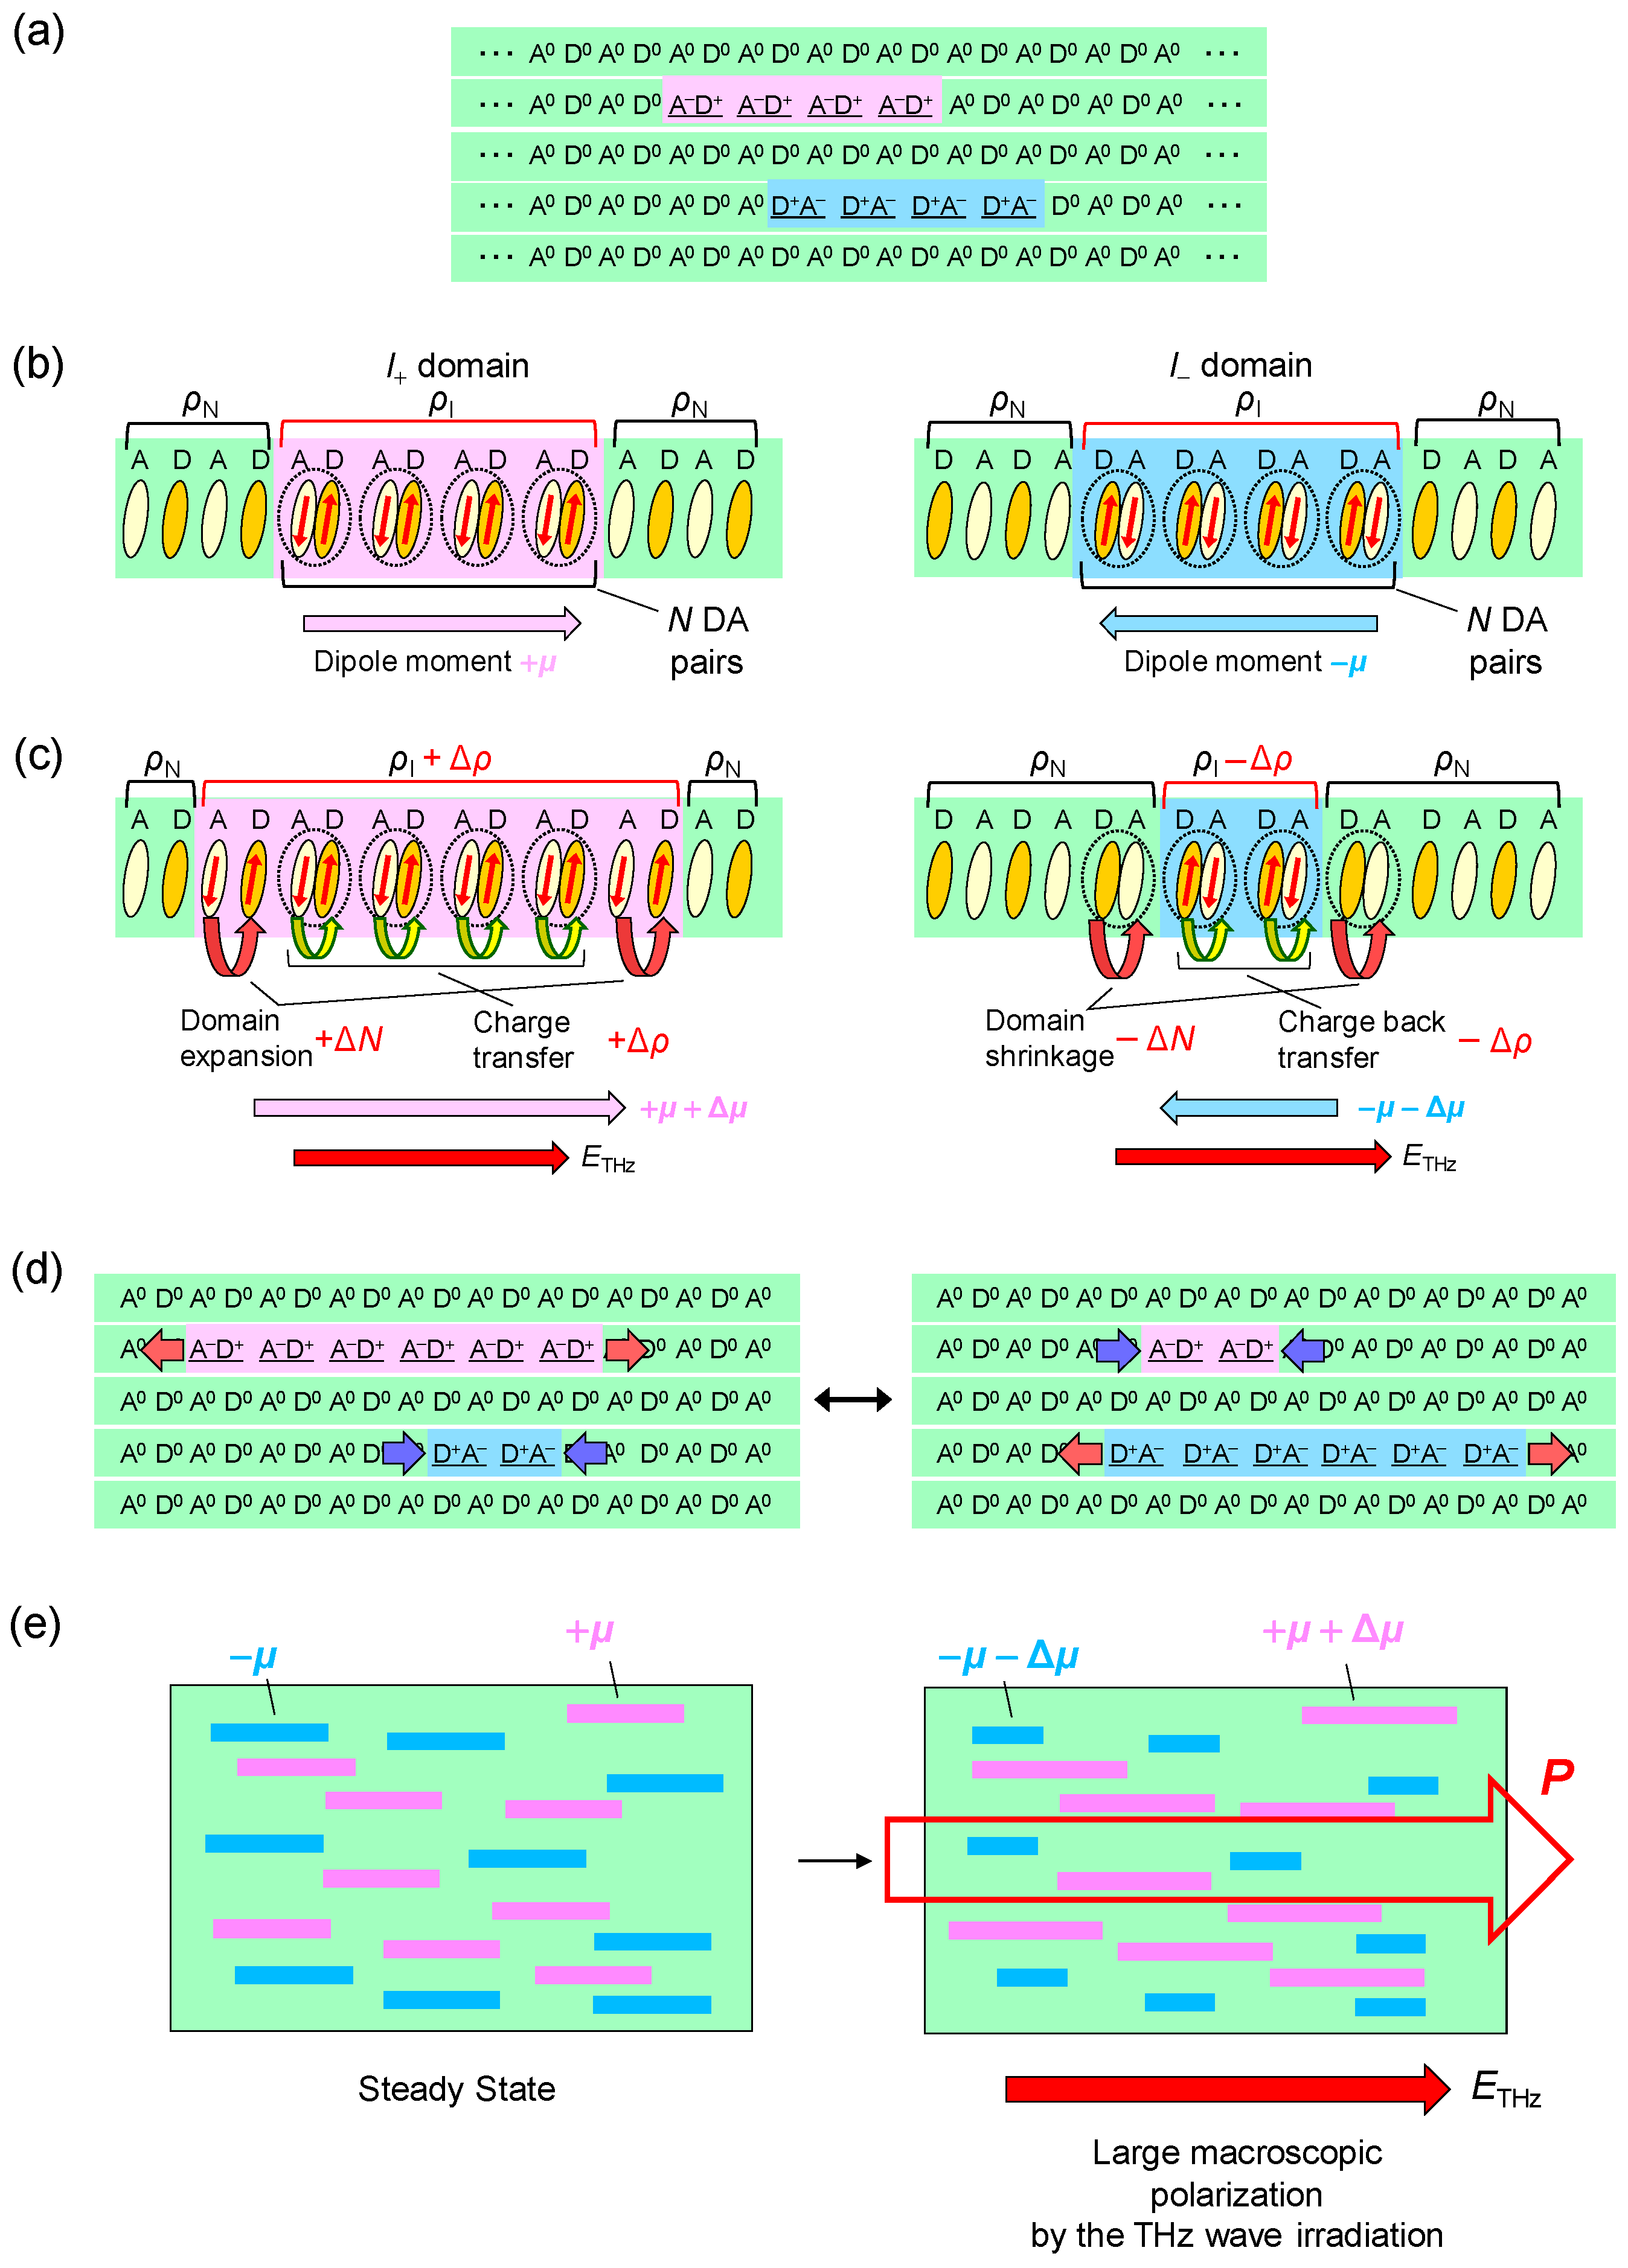
© 2017 by the authors. Licensee MDPI, Basel, Switzerland. This article is an open access article distributed under the terms and conditions of the Creative Commons Attribution (CC BY) license (http://creativecommons.org/licenses/by/4.0/).
Share and Cite
MDPI and ACS Style
Morimoto, T.; Miyamoto, T.; Okamoto, H. Ultrafast Electron and Molecular Dynamics in Photoinduced and Electric-Field-Induced Neutral–Ionic Transitions. Crystals 2017, 7, 132. https://doi.org/10.3390/cryst7050132
AMA Style
Morimoto T, Miyamoto T, Okamoto H. Ultrafast Electron and Molecular Dynamics in Photoinduced and Electric-Field-Induced Neutral–Ionic Transitions. Crystals. 2017; 7(5):132. https://doi.org/10.3390/cryst7050132
Chicago/Turabian StyleMorimoto, Takeshi, Tatsuya Miyamoto, and Hiroshi Okamoto. 2017. "Ultrafast Electron and Molecular Dynamics in Photoinduced and Electric-Field-Induced Neutral–Ionic Transitions" Crystals 7, no. 5: 132. https://doi.org/10.3390/cryst7050132
Note that from the first issue of 2016, this journal uses article numbers instead of page numbers. See further details here.