
Phase Transition Behavior of the Layered Perovskite CsBi0.6La0.4Nb2O7: A Hybrid Improper Ferroelectric
by
 ,
,
Charlotte A. L. Dixon
1, 
Jason A. McNulty
1,
Kevin S. Knight
2,3,
Alexandra S. Gibbs
4 and
Philip Lightfoot
1,* 1
School of Chemistry and EaStCHEM, University of St Andrews, St Andrews KY16 9ST, UK
2
Department of Earth Sciences, University College London, Gower Street, London WC1E 6BT, UK
3
Department of Earth Sciences, The Natural History Museum, Cromwell Road, London SW7 5BD, UK
4
ISIS Facility, Rutherford Appleton Laboratory, Chilton, Oxon OX11 0QX, UK
*
Author to whom correspondence should be addressed.
Crystals 2017, 7(5), 135; https://doi.org/10.3390/cryst7050135
Submission received: 20 April 2017
/
Revised: 9 May 2017
/
Accepted: 10 May 2017
/
Published: 13 May 2017
(This article belongs to the Special Issue Crystal Structure of Electroceramics)
Abstract
:The phase behavior of the layered perovskite CsBi0.6La0.4Nb2O7, of the Dion-Jacobson family, has been studied by high-resolution powder neutron diffraction between the temperatures of 25 < T < 850 °C. At ambient temperature, this material adopts the polar space group P21am; this represents an example of hybrid improper ferroelectricity caused by the interaction of two distinct octahedral tilt modes. Within the limits of our data resolution, the thermal evolution of the crystal structure is consistent with a first-order transition between 700 and 750 °C, with both tilt modes vanishing simultaneously, leading to the aristotype space group P4/mmm. This apparent “avalanche transition” behavior resembles that seen in the related Aurivillius phase SrBi2Nb2O9.
1. Introduction
Recent theoretical work has revealed novel mechanisms for designing non-centrosymmetric, polar and potentially ferroelectric materials, based on the coupling of two or more distinct structural distortions (“modes”) [1,2,3,4]. So-called “hybrid improper ferroelectrics” (HIFs) have now been postulated for several families of layered perovskites, by the coupling of two distinct “octahedral tilt” modes with a polar mode. Although octahedral tilting has been a well-established phenomenon in perovskite crystallography for many years [5,6,7], in simple three-dimensional ABX3 perovskites all the simple octahedral tilt schemes (as classified by Howard and Stokes [7]) give rise to strictly centrosymmetric crystals. It is now recognized that in more complex cases, for example cation-ordered or layered perovskites, inversion symmetry may be broken directly by particular combinations of octahedral tilt modes. The concept of HIFs has been typically applied by theorists to mean the imposition of a stable polar ground state in a crystal via the coupling of two or more intrinsically non-polar modes with a polar mode (“tri-linear coupling”), with no requirement for an experimentally-realized polarization reversal. However, such experimental demonstrations of polarization-field hysteresis have now been reported, for example in the Ruddlesden-Popper (RP) phase Ca3Ti2O7 [8] and the Dion-Jacobson (DJ) phase RbBiNb2O7 [9].
Prior to the recent flurry of work from the theoretical standpoint, it was known that ferroelectricity, or at least polarity, co-existed with octahedral tilting in several layered perovskites, the most well-established being the Aurivillius family, exemplified by SrBi2Ta2O9 and Bi4Ti3O12 [10]. Snedden et al. [11] later made the intuitive link between the nature of octahedral tilting in the DJ phase CsBiNb2O7 and that in SrBi2Ta2O9; both have a tilt system analogous to that described by the Glazer notation a−a−c+ in ABX3 perovskites. This leads to related superlattices and space groups in both SrBi2Ta2O9 and CsBiNb2O7, viz. superlattices of ~√2at x √2at x ct relative to the aristotype tetragonal phase in each case, and polar space groups A21am and P21am in SrBi2Ta2O9 and CsBiNb2O7, respectively. The nature of these superlattices and the allowed space groups of the possible distorted structures may be systematized by considering which particular distortion modes give rise to the specific tilts within each family of layered perovskites. So, for example, the “out-of-phase tilt”, a−a−c0, and the “in-phase tilt”, a0a0c+, correspond to the modes with irreducible representations M5− and M2+, respectively, for the DJ phases of the type AA’B2O7, for which the parent phase is described in space group P4/mmm (these are “n = 2” examples of the generic DJ composition AA’n−1BnO3n+1, with n representing the number of octahedral layers per perovskite-like block). The coupling of the two modes leads naturally to the polar space group P21am for CsBiNb2O7 and, in principle, permits ferroelectricity. These ideas have been described in more detail by Benedek et al. [3,4].
Although the a−a−c+ tilt system is predicted to be a stable option for DJ phases of the type AA’B2O7, recent experimental work has shown that other related polymorphs are possible, and a tilt system a−b0c+, in polar space group Amm2, has been reported in CsLaNb2O7 in the range 350 < T < 550 K [12] (curiously an earlier single crystal X-ray study of CsLaNb2O7 reported the adoption of the aristotype tetragonal structure, P4/mmm at 296 K [13]). Moreover, a recent experimental and theoretical study of the triple-layer DJ phase CsBi2Ti2NbO10 has suggested that a proper rather than improper mechanism drives the polarity of the ambient temperature phase [14]. It is therefore of interest to explore more fully the phase behavior of further examples of the DJ family in order to map out the occurrence of the possible tilt systems, especially those giving rise to polarity, and also the nature of phase transitions in these systems as a function of T.
In our earlier work [11], it was established that both CsBiNb2O7 and CsNdNb2O7 adopted the polar P21am space group at ambient temperature, with the latter composition displaying a much reduced orthorhombic distortion relative to the former. Later, Fennie and Rabe predicted ferroelectricity in CsBiNb2O7 from a first-principles DFT study [15]. Our follow-up experimental studies [16] on CsBiNb2O7 suggested that ferroelectricity was hindered by moisture uptake, leading to proton conductivity and leakage. Nevertheless, a more recent work by Chen et al. [17] did provide experimental evidence for ferroelectricity in this compound. Goff et al. [16], attempted to determine any high temperature phase transitions in CsBiNb2O7 using powder neutron diffraction: no evidence for phase transitions was identified up to 900 °C, above which sample deterioration precluded further study. By analogy with CsNdNb2O7, we speculated that La-doping of CsBiNb2O7 would reduce the orthorhombic distortion such that any phase transition to higher symmetry might be brought down in temperature relative to that of CsBiNb2O7, and make this transition more amenable to experimental study.
In this paper, we report the phase behavior of CsBi0.6La0.4Nb2O7; this composition was chosen since CsBiNb2O7 and CsLaNb2O7 have been shown to adopt different phases at ambient temperature, and it was anticipated that a phase transition(s) might be observable within a reasonable temperature regime.
2. Results
Ambient temperature structure: Preliminary studies focused on the solid solution CsBi1−xLaxNb2O7 (see Supplementary Information), which is confirmed to exist for all compositions, 0 < x < 1. The x = 0.4 composition, i.e., CsBi0.6La0.4Nb2O7, was chosen for further study by high-resolution powder neutron diffraction. Initial analysis of the room-temperature powder neutron diffraction (PND) data assumed the P21am model previously identified for CsBiNb2O7 [11]. Rietveld refinement suggested this model to be correct, with an excellent fit, accounting for all observed peak splittings and superlattice peaks (Figure 1). However, in order for this assignment to be unambiguous, other options need to be considered. There are two aspects to this: first, the unit cell metrics need to be determined and second, the nature of any characteristic superlattice peaks (especially those arising from octahedral tilting) needs to be established.
Considering the unit cell metrics first: the possible superlattice options to be considered are either an approximate doubling or quadrupling of the unit cell in the ab plane; i.e., a ~ b ~ √2at or a ~ b ~ 2at. Superlattices along the c-axis are not considered in the simplest scheme (and are not necessary in this case). These two options can easily be distinguished based on related peak splittings observed in the experimental PND data: the √2at metric splits peaks of the type (hhl) in the parent tetragonal phase, whereas the 2at metric splits peaks of the type (h0l/0kl). Specific peaks labelled in Figure 1 confirm unambiguously that an orthorhombic (or lower) symmetry unit cell of metrics a ~ b ~ √2at, c ~ ct, is required to account for all the observed peak splittings.
Strayer et al. [12] listed all models corresponding to the simple combinations of octahedral tilts for this structural family (see Supplementary information in Reference [12]). Specifically, the definition of simple combinations here means that there are four distinct octahedral tilts modes to be considered, viz. in-phase and out-of-phase tilts of two adjacent octahedra along the a (and/or b) and c axes of the parent tetragonal unit cell. These four modes are given the Glazer-like symbols a+ (or b+) and c+ for the respective in-phase tilts and a− (b−) and c− for the out-of-phase tilts. In turn, these distortions give rise to superlattice peaks in the diffraction pattern at characteristic points, labelled M (k = ½, ½, 0) or X (k = 0, ½, 0) relative to the parent tetragonal reciprocal lattice. The specific modes corresponding to each of the four possible tilts are X1+ (a+), M5− (a−) M2+ (c+) and M4− (c−). The nature of these modes and their effect on the diffraction pattern can be probed using the on-line software ISODISTORT [18]. The X-point mode can be easily ruled out (no peaks are visible at the relevant positions), but the M-point modes provide some ambiguity, as they may contribute to many of the same superlattice peaks. In fact, closer inspection of the allowed superlattice intensities from each of the M-point modes reveals that the M4− mode can also be ruled out: we also note that neither the X1+ nor the M4− modes were considered in the earlier theoretical studies [3,15]. The M5− mode is certainly required, as it is the only contributor to certain peaks (for example the one near d ~ 2.5 Å). The M2+ mode contributes to several observed peaks (for example those near d ~ 2.4 Å), but the M5− mode may also contribute to those. Table 1 lists an abbreviated selection of the possible octahedral-rotation-induced superlattices of Strayer et al. Taking into account the requirement of a √2at x √2at x ct orthorhombic metric and the presence of at least the M5− mode (and also possibly the M2+ mode) reveals the only plausible models are the P21am and Pmam ones, as suggested by Snedden et al. [11] for CsBiNb2O7. In particular, the Amm2 model observed for CsLaNb2O7 can be ruled out in the present case. In order to confirm P21am as the correct model for CsBi0.6La0.4Nb2O7 at ambient temperature, a comparative refinement against the Pmam model was carried out. This led to agreement factors of χ2 ~ 5.870 and 9.081, for the P21am and Pmam models. P21am is therefore selected as the best model at ambient T. The corresponding crystal structure is shown in Figure 2, refined atomic parameters are given in Table 2 and selected bond lengths in Table 3.
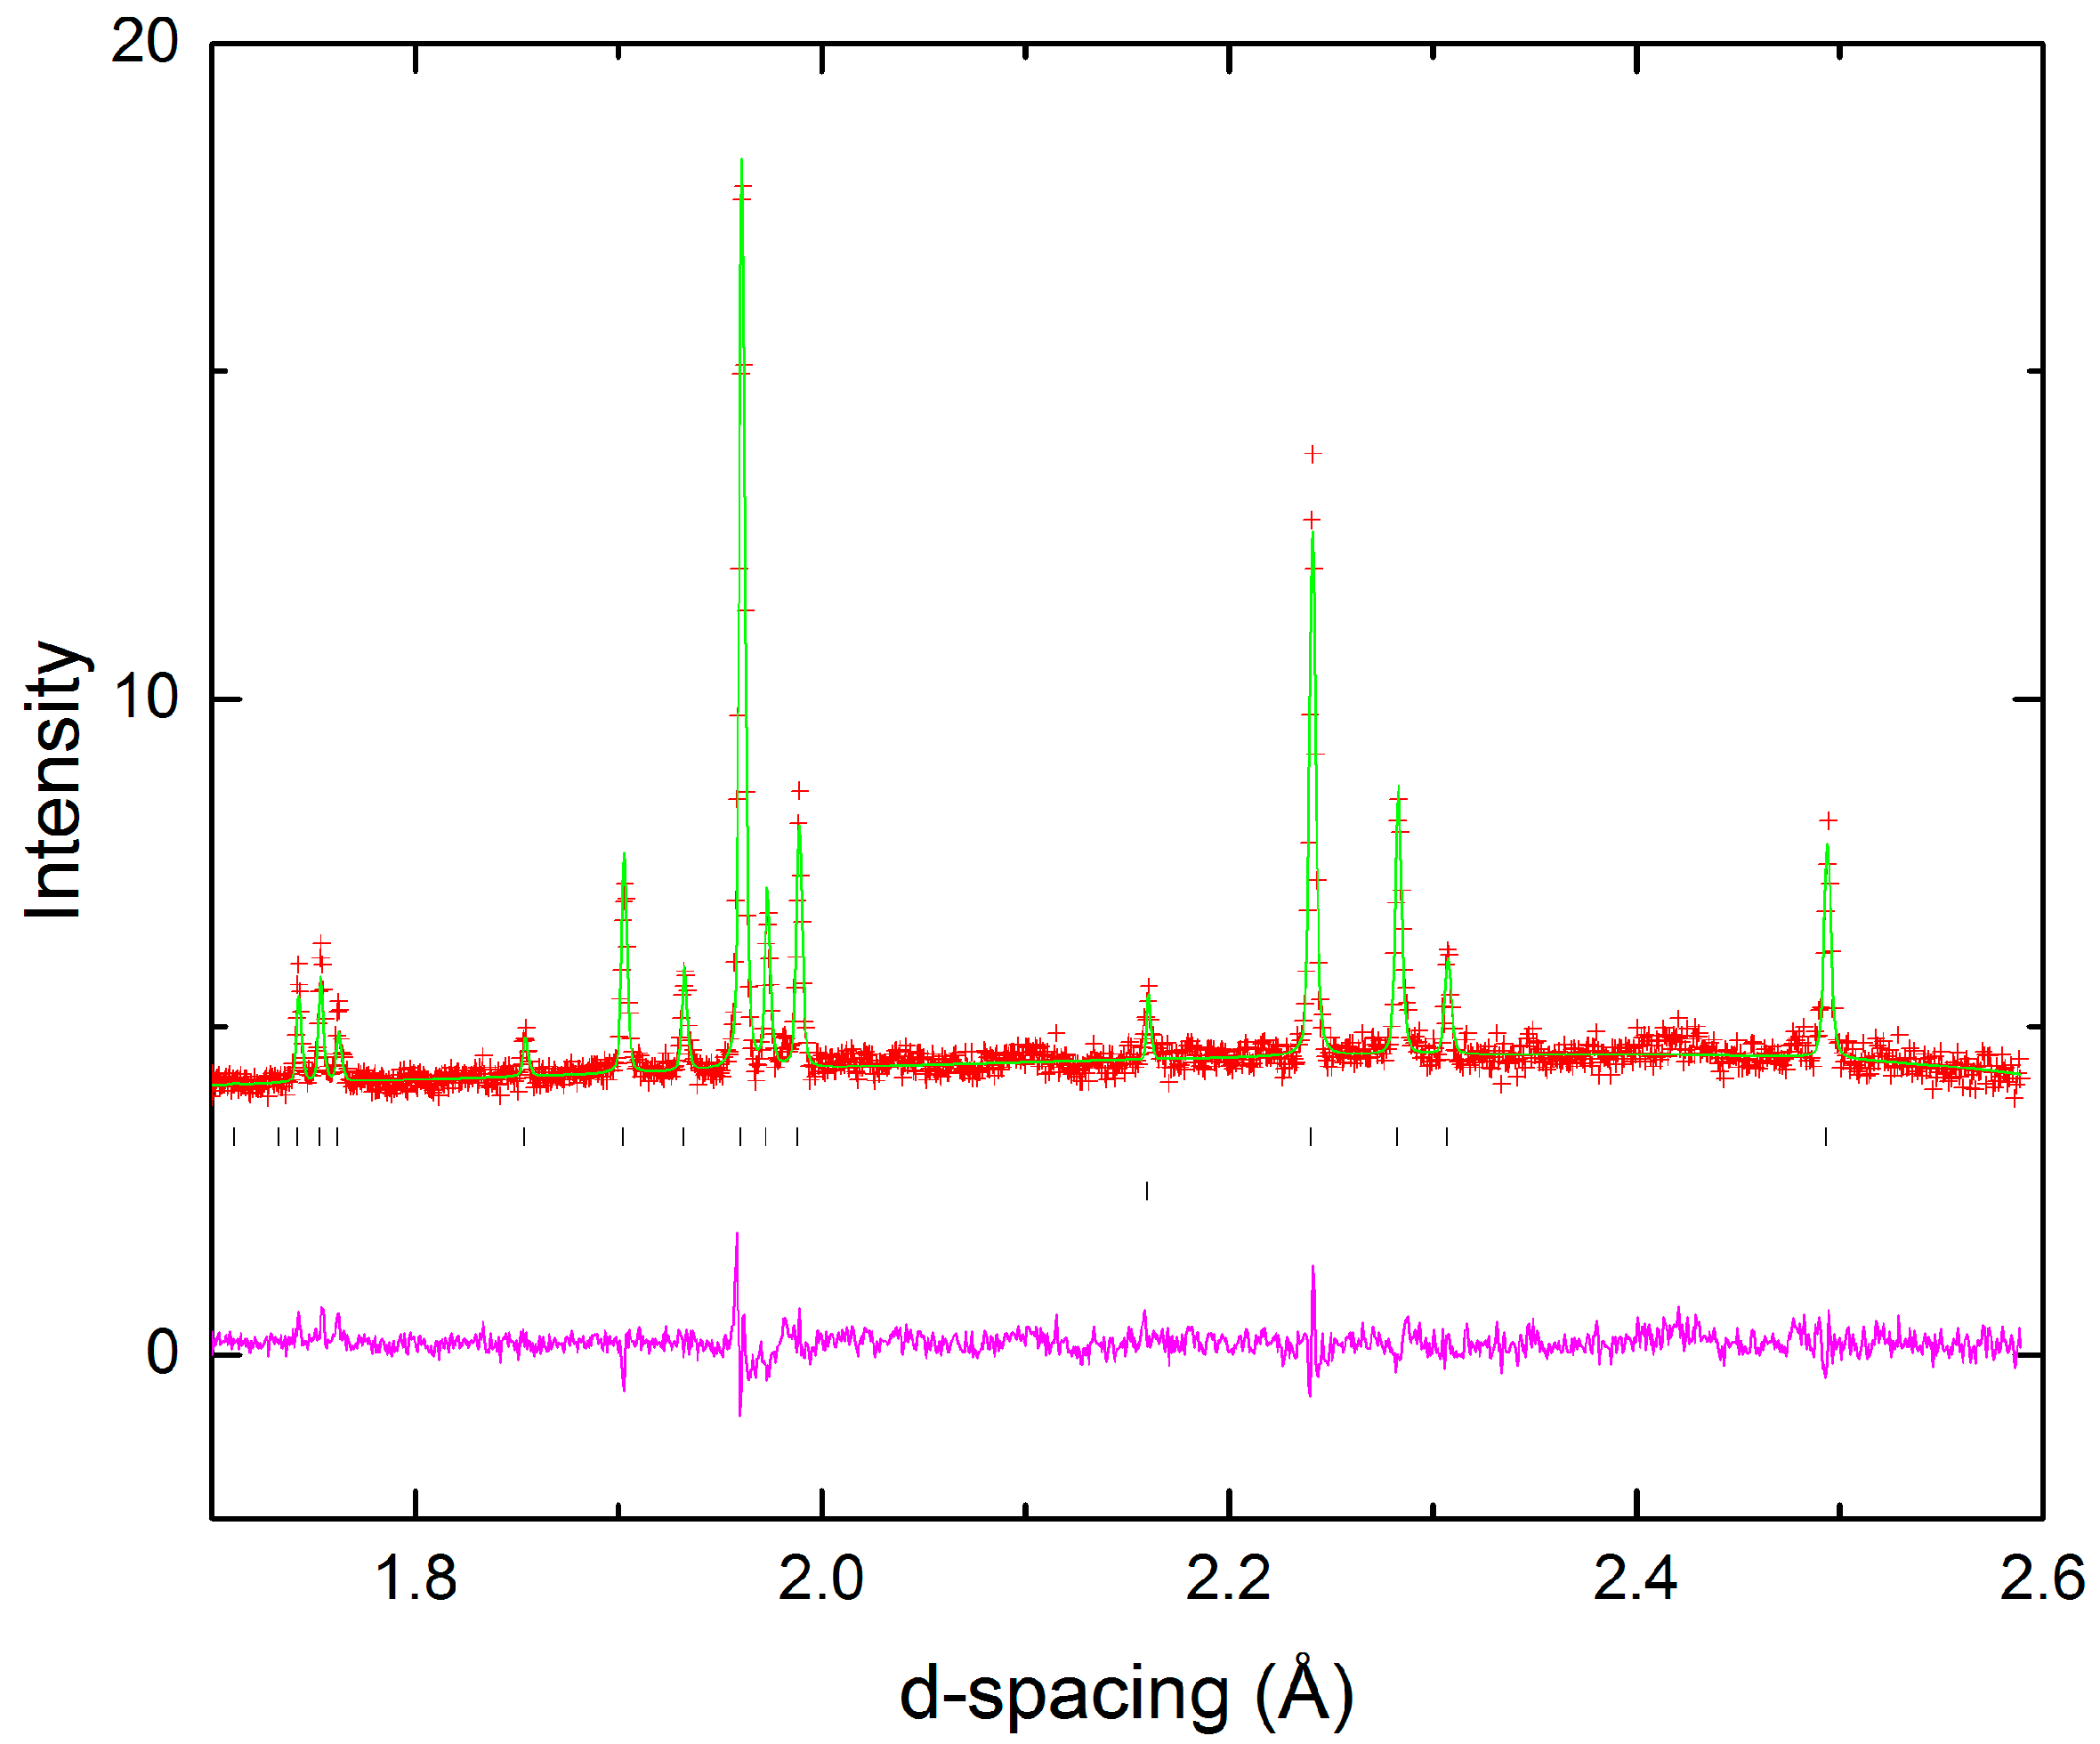
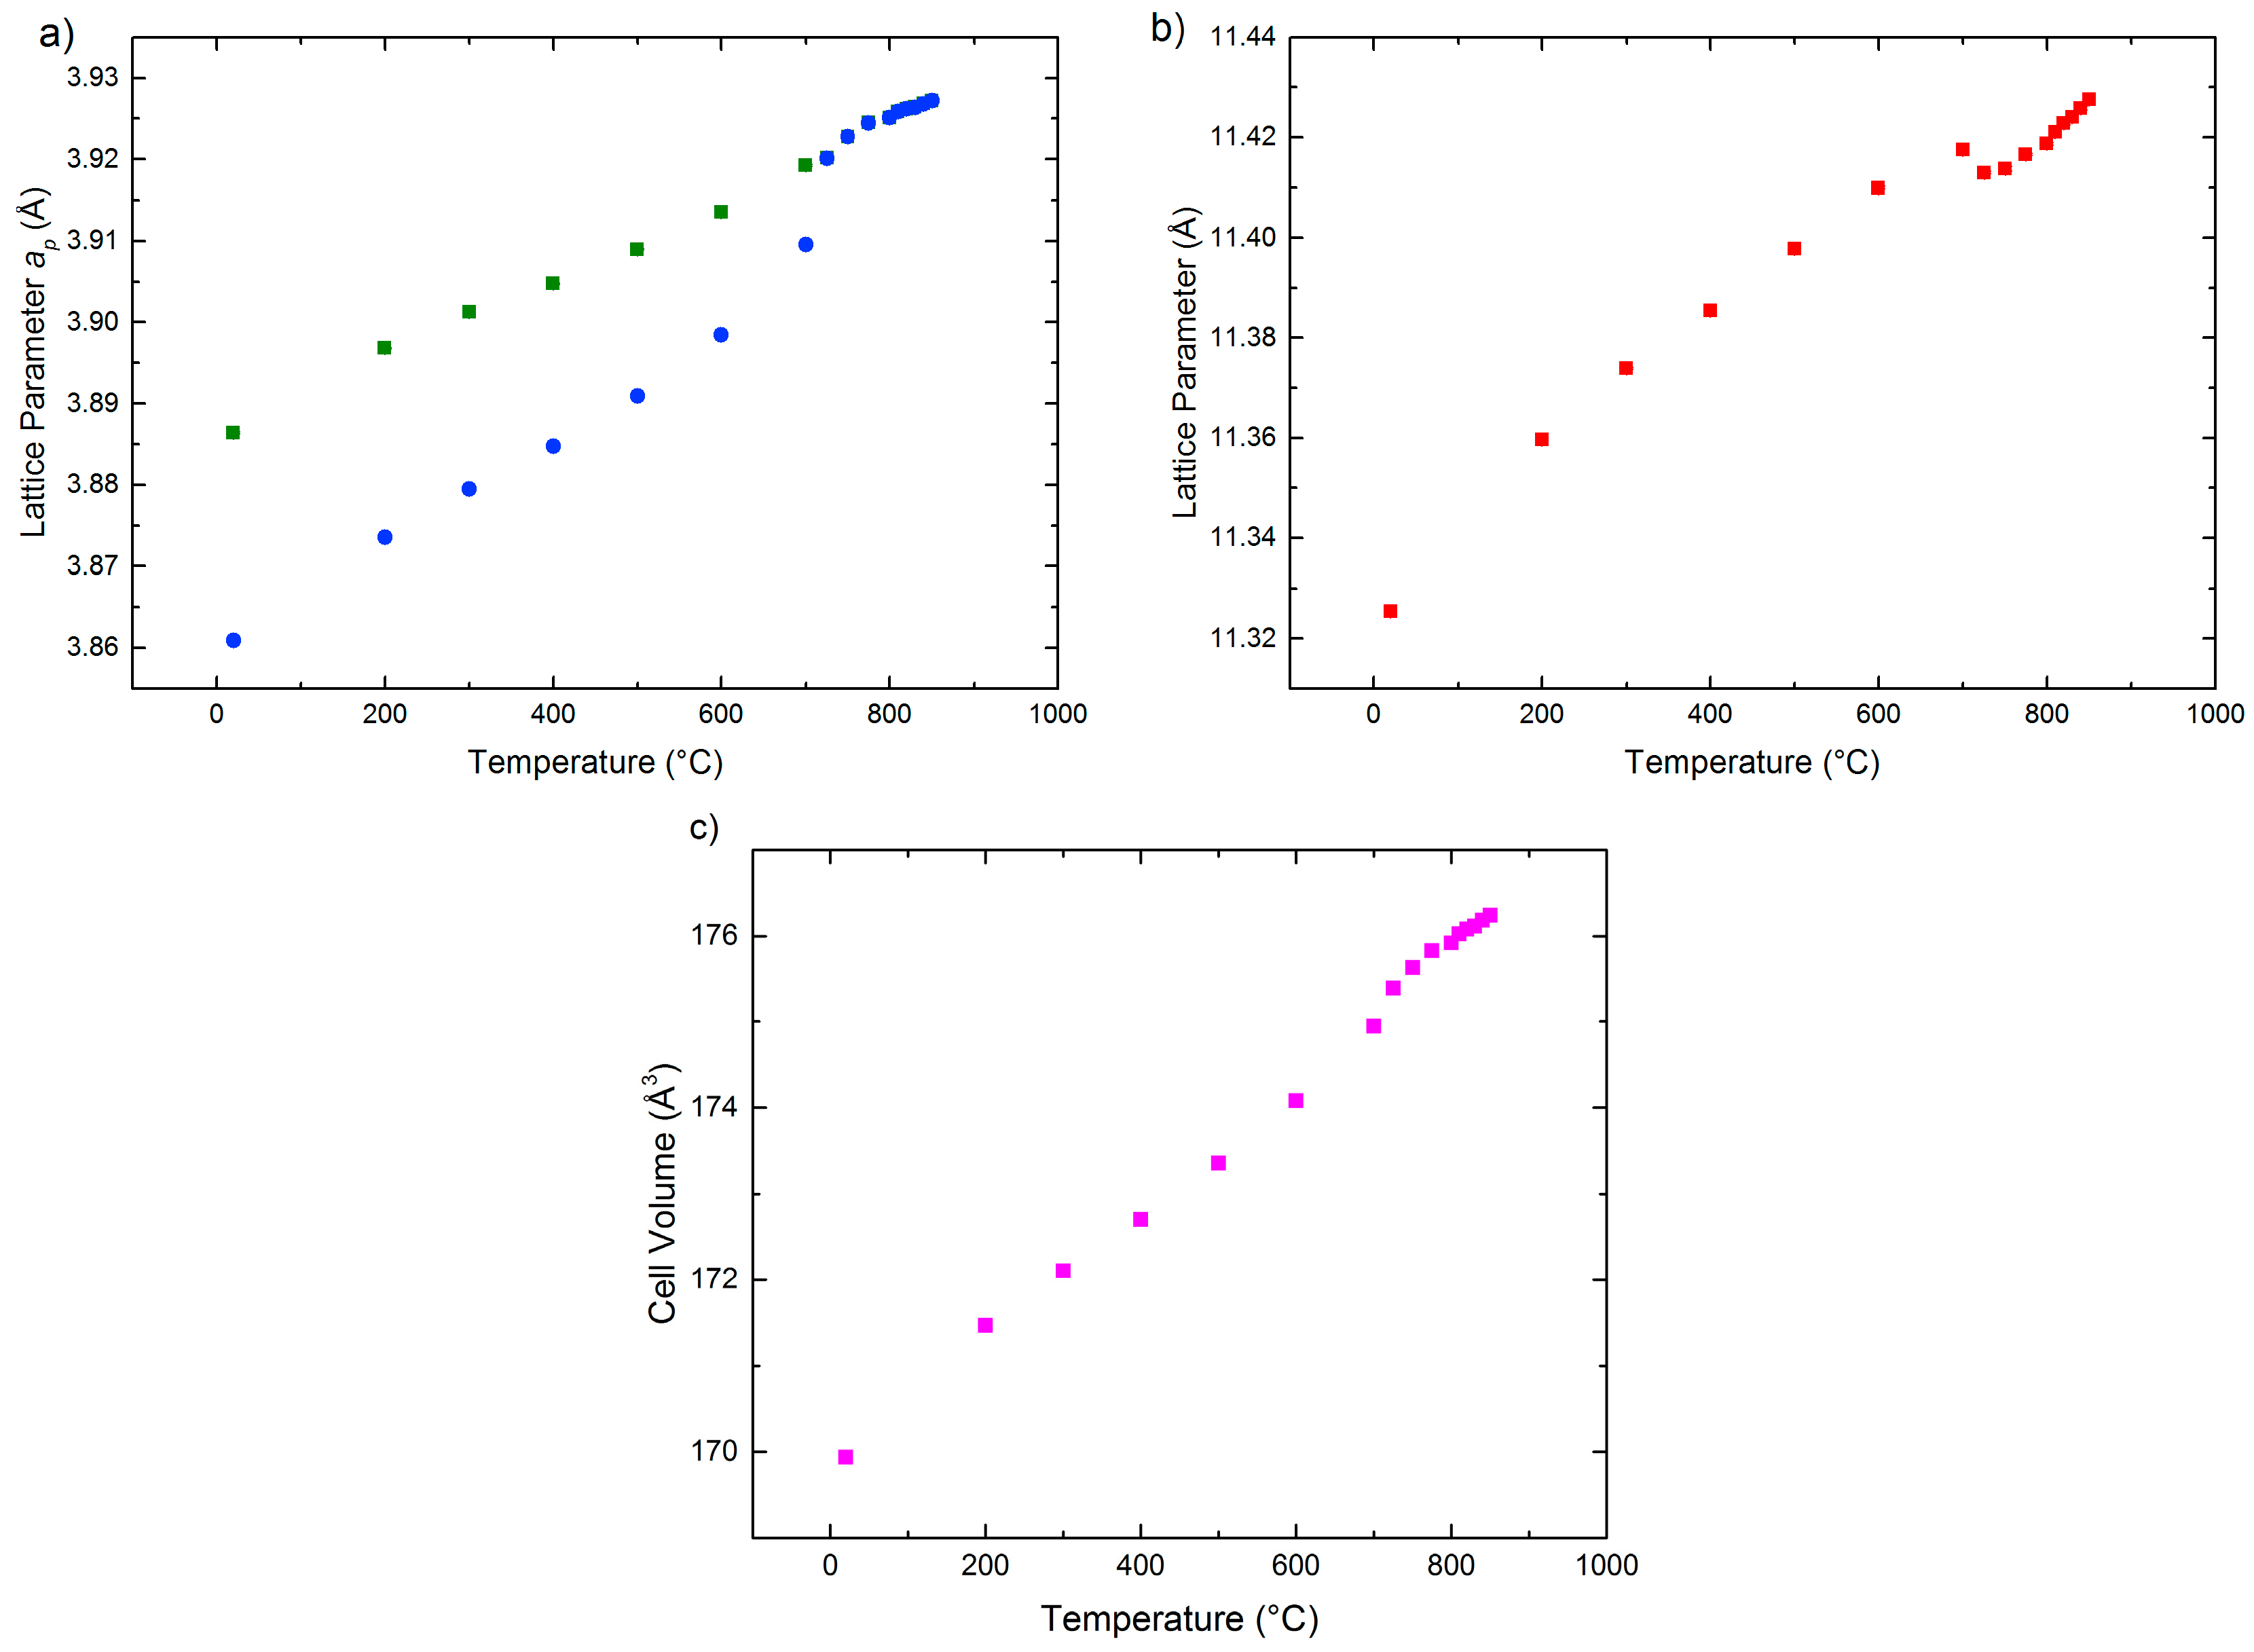
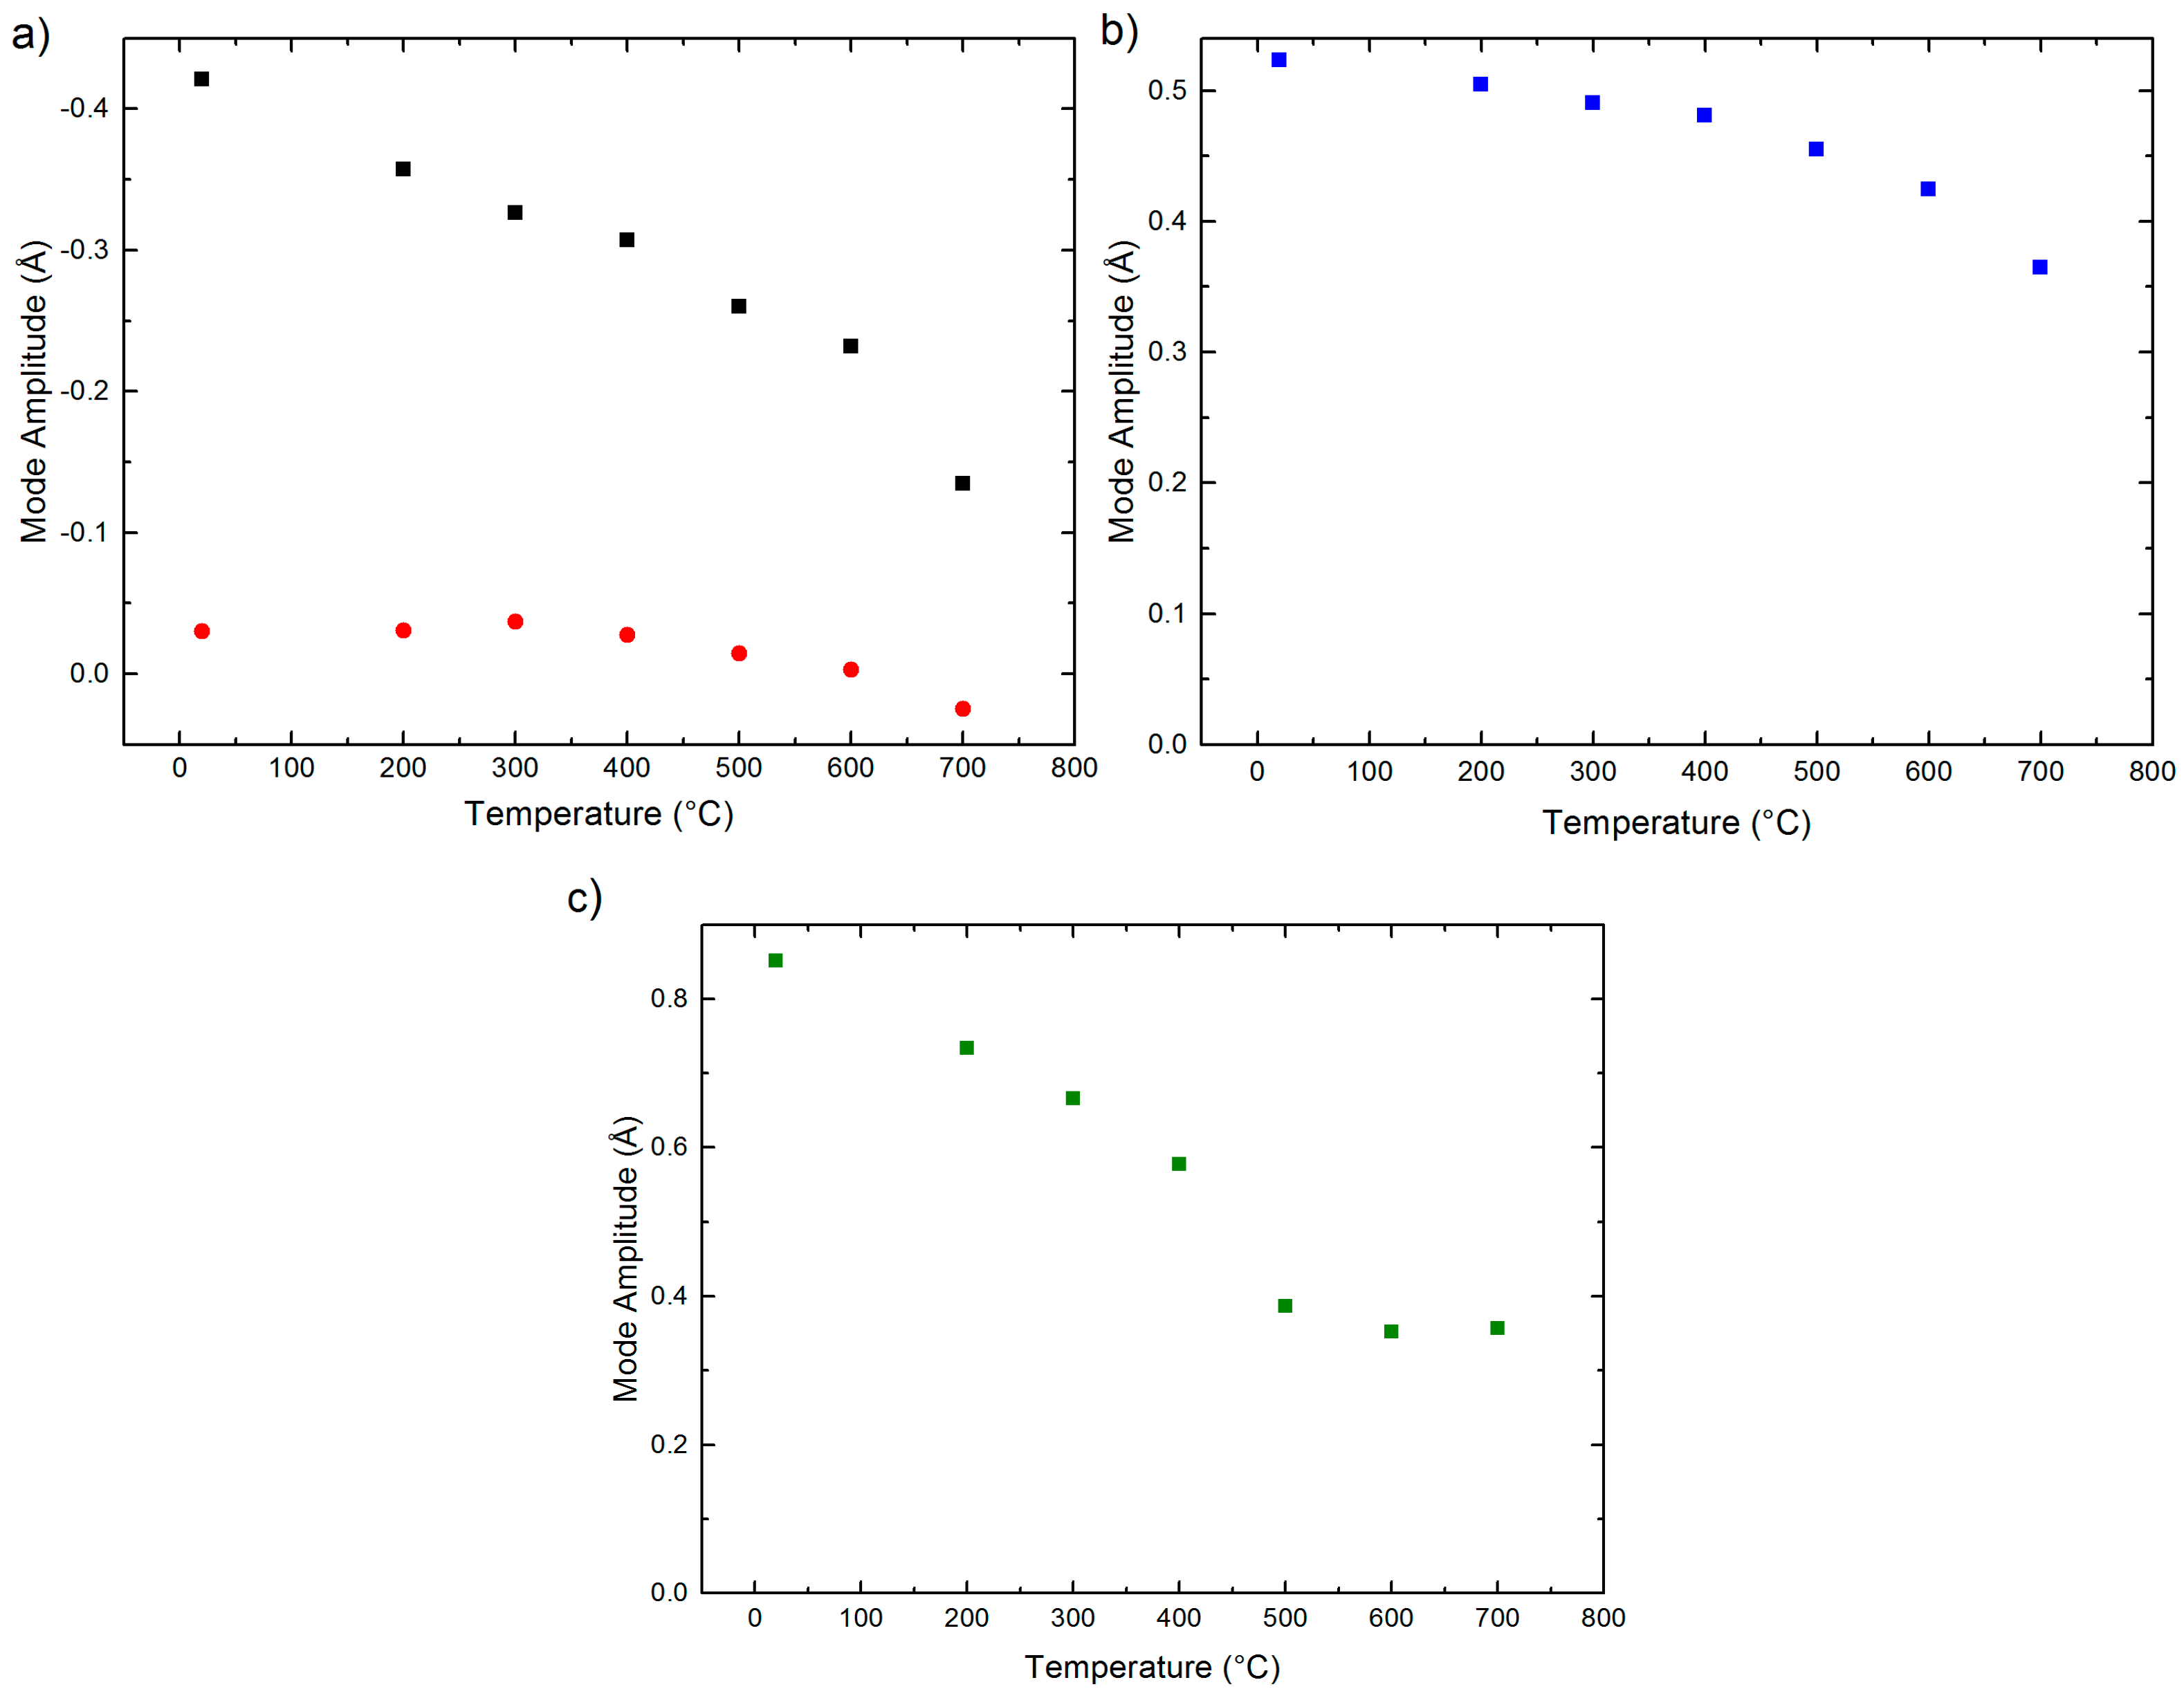
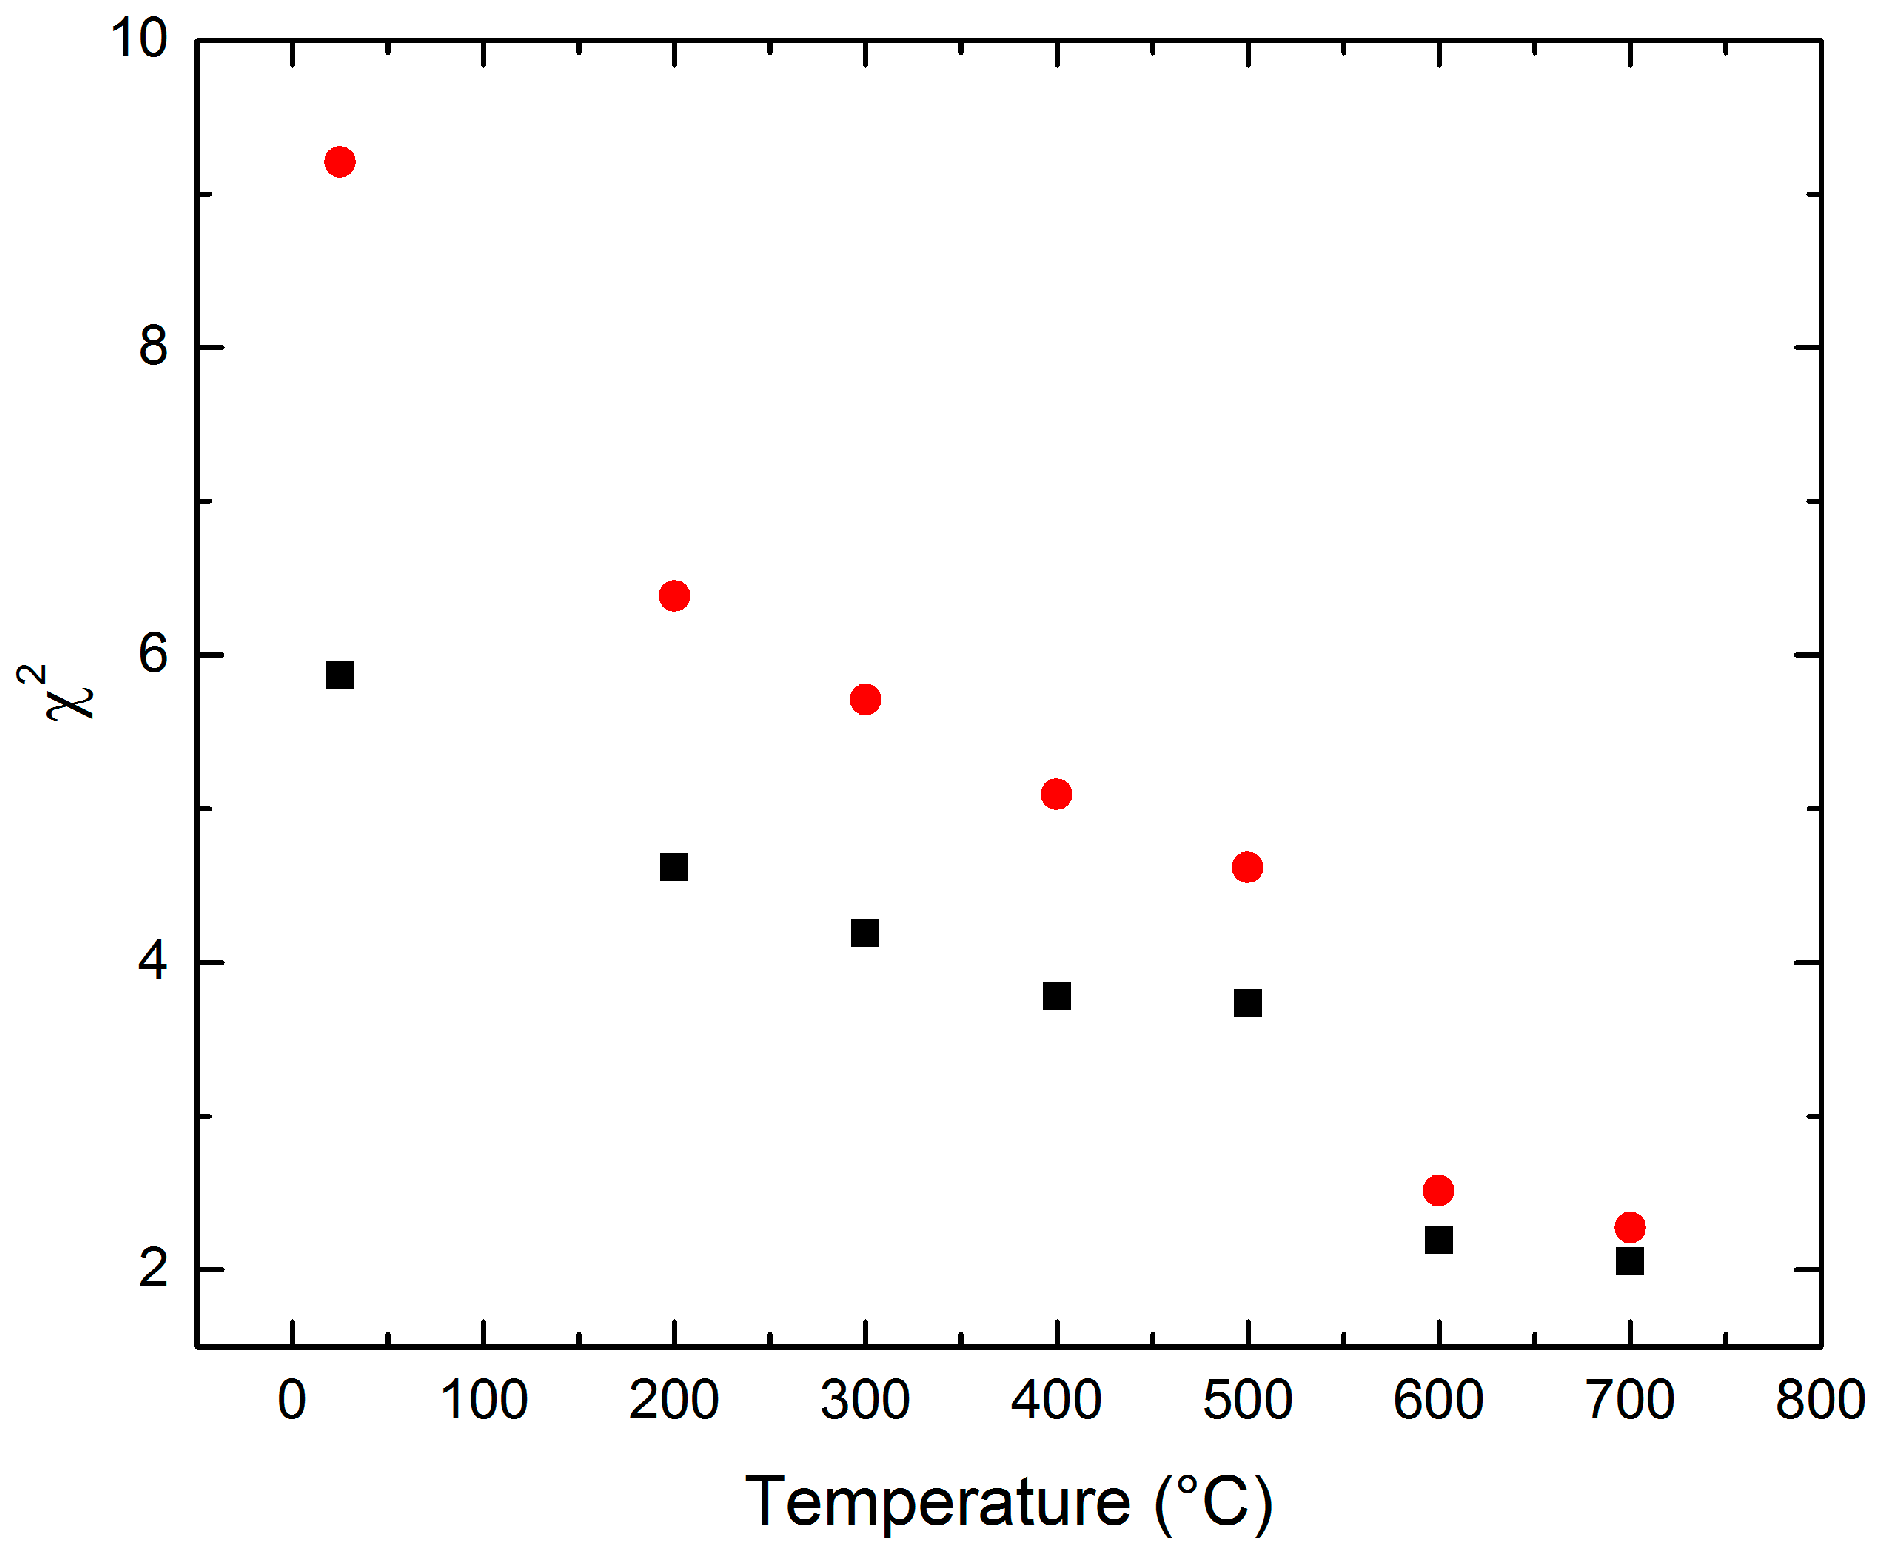
Structural Evolution Versus T: The continued presence of orthorhombic distortion can easily be determined on raising the temperature, by tracking the O peak splittings highlighted in Figure 1. However, since the M-point superlattice peaks are very weak, even at ambient temperature, it is problematic to use a simple qualitative visual observation of these as a single reliable measure of the structural distortions versus T. Instead, full comparative Rietveld refinement of the structure in both P21am and Pmam models is the preferred method of discrimination (since the tilts significantly affect the intensities of the subcell peaks, in addition to the supercell peaks). Both models were therefore refined against each data set up to 725 °C, taking care to use a consistent set of parameters throughout (see Experimental). At 700 °C the orthorhombic splitting is still clearly seen in the raw data, but at 725 °C the splitting disappears, and the unit cell becomes metrically tetragonal (Figure 3). The parent P4/mmm model was therefore trialed at 725 °C and above, with a further check on the alternative possible tetragonal model, P4/mbm (a0a0c+, Table 1) at 725 °C only. In addition to tracking the comparative fit quality for the two orthorhombic models, ISODISTORT was used to derive the mode amplitudes versus T. Thermal evolution of the unit cell parameters is given in Figure 4, and for the distortion modes in Figure 5. Comparative goodness-of-fit parameters (χ2) for the P21am and Pmam models are given in Figure 6.
The difference in χ2 values clearly supports the assignment of the P21am rather than the Pmam model up to 700 °C (χ2 values are 2.055 and 2.273 for P21am and Pmam, respectively, at 700 °C). In addition, the tilt mode amplitudes (Figure 5) tend towards zero, but do not become zero, at 700 °C. The negligible difference in fit quality between the four models tested at 725 °C (χ2 values 2.065, 2.054, 2.041 and 1.883 for P4/mmm, P4/mbm, Pmam and P21am, respectively) supports the absence of both tilt modes at this temperature (we note that the refinement in the P21am model was unstable to the refinement of thermal parameters, thus a direct comparison is not possible). Although the unit cell volume has no clear discontinuity within the temperature resolution of our datasets, the fact that the polar mode Γ5− seems to have a step-like change at the transition may indicate the existence of a first-order component.
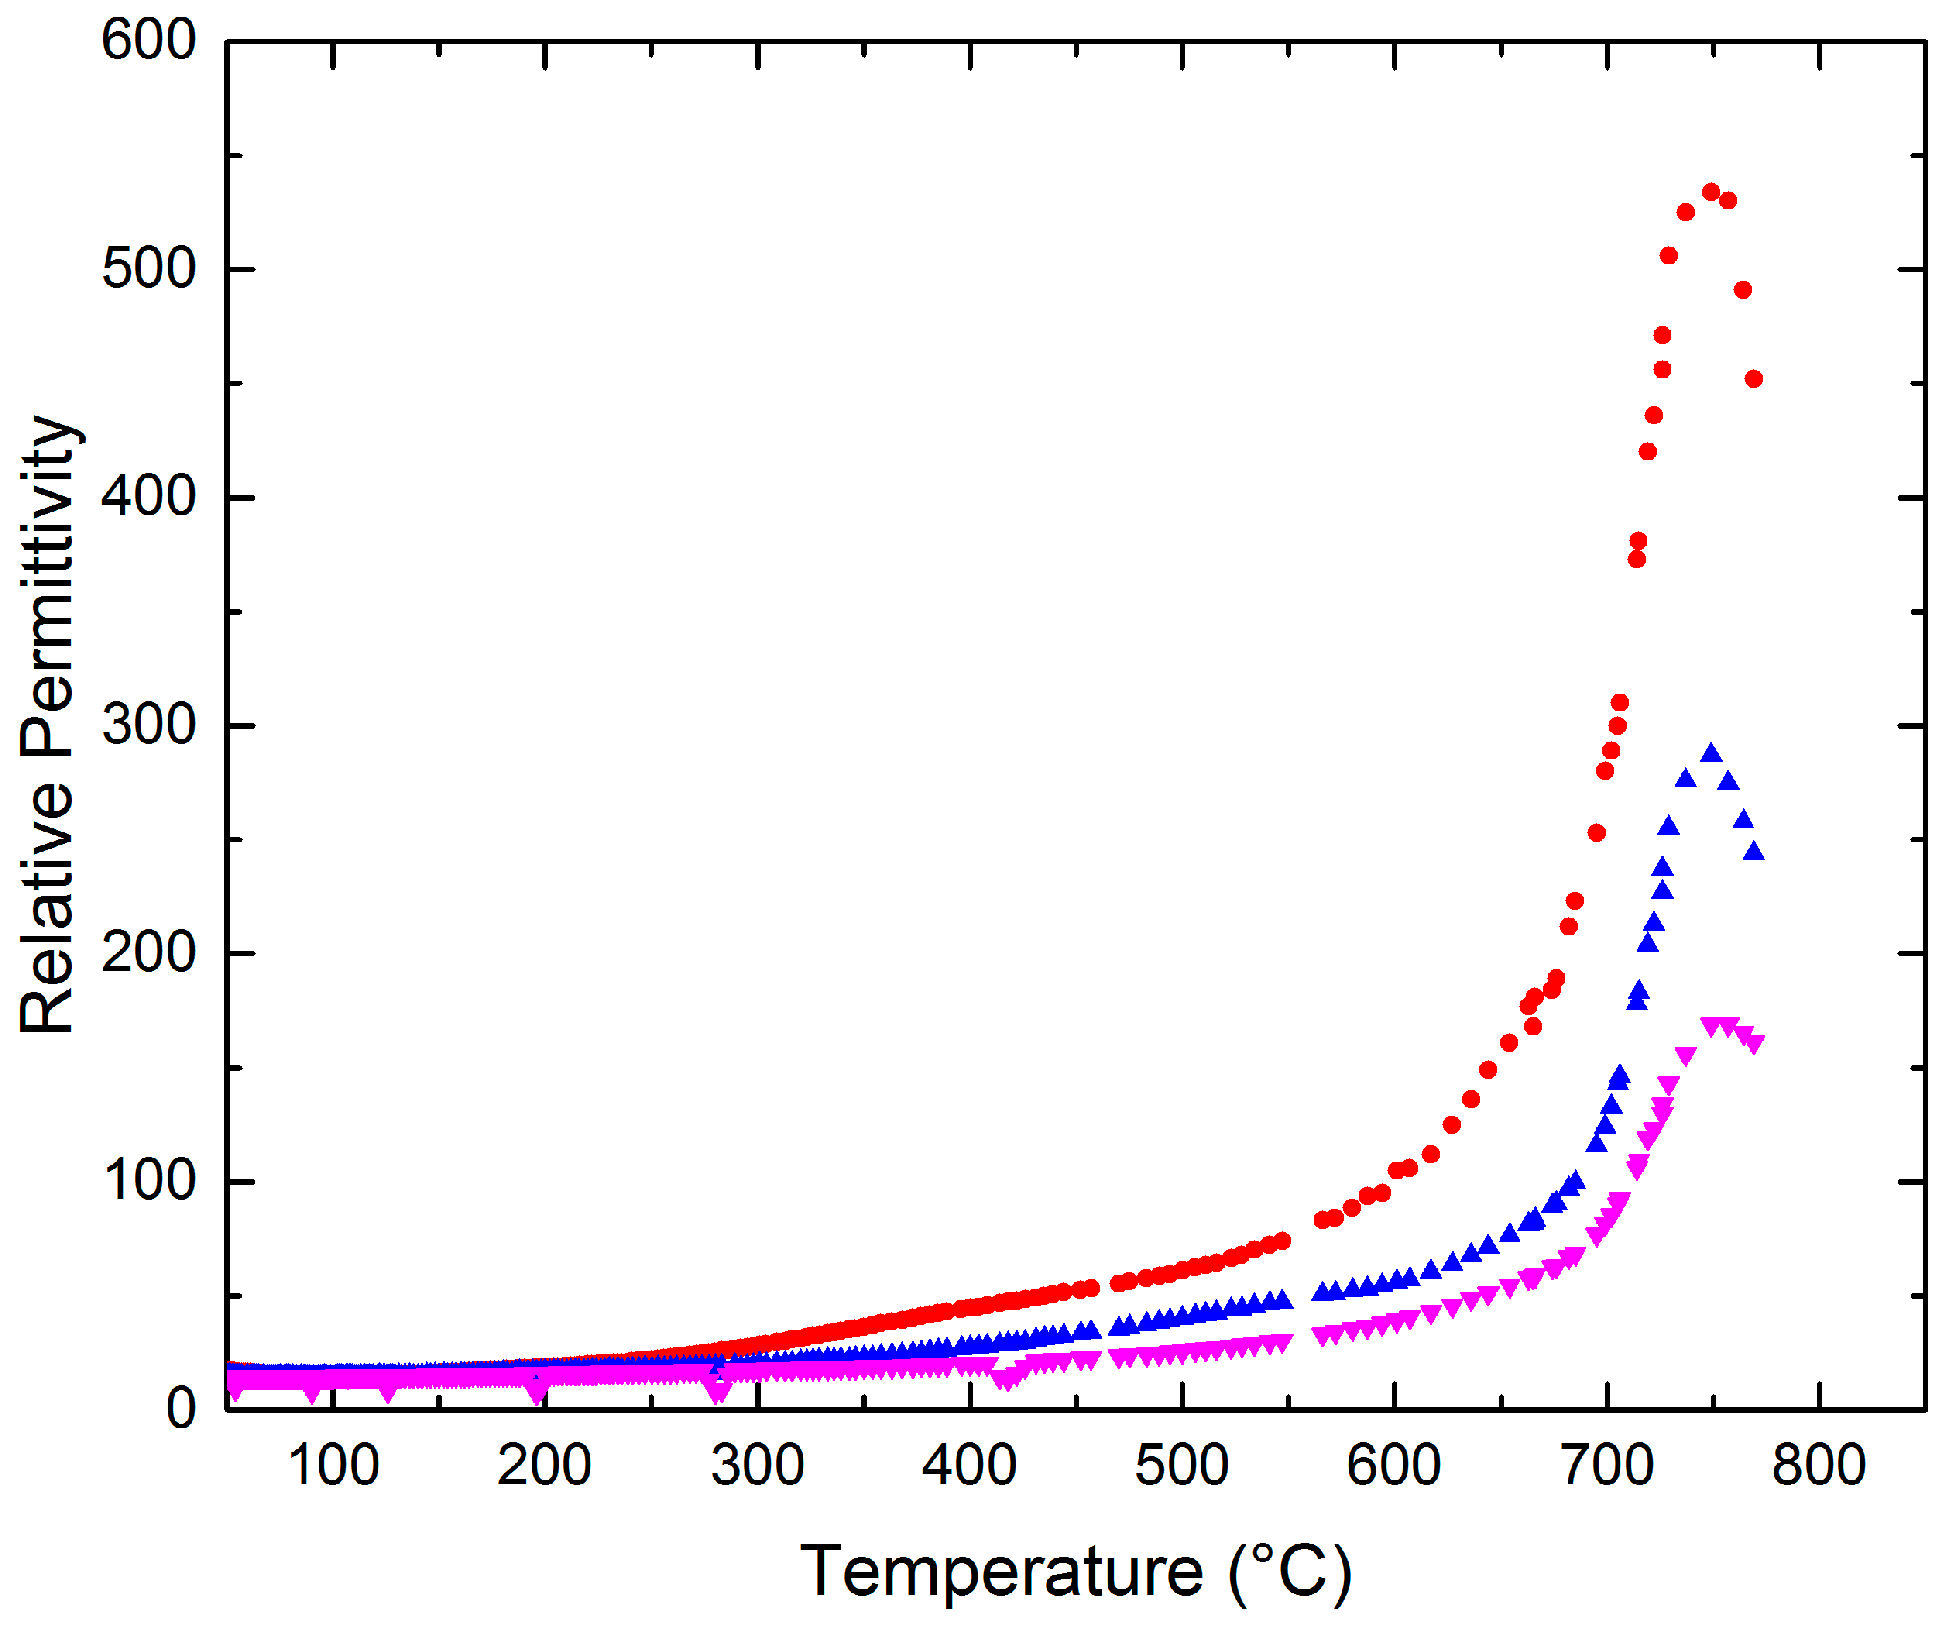
We attempted to fit the thermal evolution of the tilt modes, M2+ and M5−, to critical behavior of the form: amplitude = A (Tc − T)β. This produced the fit parameters of A = 0.0292, 0.227; TC = 749, 742 °C; β = 0.401, 0.127 for the M2+ and M5− modes, respectively. The key observation here is that the derived value of TC is approximately equal for the two modes, implying that they condense simultaneously. Unfortunately, the paucity of data in the vicinity of TC prohibits a definitive conclusion about the exact TC and β values, and also the specific mode which drives the transition. However, further support for our crystallographic model comes from a measurement of dielectric properties versus T. Figure 7 shows a single dielectric maximum just below 750 °C, with no evidence of any lower temperature anomalies. This supports an abrupt, single phase transition, as was observed crystallographically.
Taken together, these observations suggest a direct to transition from P21am to P4/mmm in the vicinity of 700–750 °C; we note that Landau theory requires the direct P21am to P4/mmm transition to be first-order, whereas the Pmam to P4/mmm transition is allowed to be continuous. Hence, the most likely scenario, which is also compatible with the present data, is that both tilt modes are lost simultaneously, with no substantial evidence for an intermediate phase of symmetry Pmam or P4/mbm (Table 1). The final refined model in P4/mmm at 750 °C is given in Table 4 and Table 5.
3. Discussion and Conclusions
The present study indicates, within the temperature resolution of our data, a direct first-order transition from the parent, untilted phase, P4/mmm, to the observed ambient temperature phase, P21am (tilt system a−a−c+). This requires the simultaneous condensation of the two tilt modes M5− (a−a−c0) and M2+ (a0a0c+), which couple with the polar mode, Γ5−. This special case of tri-linear coupling has been termed an “avalanche transition” [19]. Due to the temperature increments used in this experiment, we cannot fully rule out a possible intermediate phase of symmetry Pmam or P4/mbm but, if present, this must only exist in a narrow temperature interval around 700 to 750 °C. Avalanche transitions are rare, but such a transition has been confirmed in the Aurivillius phase ferroelectric, SrBi2Nb2O9 [20,21], which also displays the tilt system a−a−c+. It has been suggested that SrBi2Nb2O9 differs from its analogue SrBi2Ta2O9, which does display an intermediate phase (tilt system a−a−c0), because the magnitudes of the three necessary distortion modes in the ground state (i.e., ambient temperature) polar phase are relatively similar, rather than one tilt mode being dominant [21]. In their detailed study of CsLaNb2O7, Strayer et al. [12], reported a tilt system a−b0c+ (space group Amm2, Table 1) between 550 and 350 K. This phase also requires the condensation of both the M2+ and M5− tilt modes, but differs from the present P21am phase in the direction of the M5− mode. It might also be expected that an intermediate phase would be observed in the P4/mmm to Amm2 pathway seen in CsLaNb2O7; i.e., via the sequential loss of either M5− then M2+, or vice versa. The corresponding intermediate phases (Table 1) in that case would be a0a0c+ (P4/mbm) or a−b0c0 (Cmmm). Strayer et al. ruled out these pathways by the observation of a clear SHG signal, signifying non-centrosymmetricity, and thus implying an avalanche transition in this composition also. As the present study represents the only detailed crystallographic study so far of the tilt transitions concerning a verified P21am phase (a−a−c+) in the n = 2 DJ family, it remains to be seen whether such avalanche transitions are common in the DJ family.
4. Experimental Section
4.1 Synthesis
A phase pure sample of CsBi0.6La0.4Nb2O7 was prepared using traditional ceramic methods. Stoichiometric amounts of La2O3 (99.9% Sigma-Aldrich, Dorset, UK, Nb2O5 (99.9% Alfa Aesar, Lancashire, UK) and a 20% excess of Cs2CO3 (99% Alfa Aesar, Lancashire, UK) were dried at 100 °C for 24 h. The loose powders were ground for a period of 30 min and pressed into pellets of approximately 10 mm diameter and 5 mm thickness. The pellets were annealed at 1000 °C for a period of 24 h with a cooling rate of 10 min−1.
4.2 Powder Diffraction
Sample purity was gauged by preliminary X-ray diffraction using a PANalytical Empyrean (Cu Kα1 radiation).
Neutron powder diffraction (NPD) was performed at beamline HRPD (High resolution powder diffractometer), ISIS facility, Oxfordshire, UK. A sample of approximately 5 g was placed in an 8-mm cylindrical vanadium can before loading into the diffractometer vacuum furnace. Patterns were collected at room temperature, and then at 100 intervals between 200–800 °C with a final data collection at 850 °C, each data collection lasting approximately 3.5 h, with the exception of the data collections at 600 and 700 °C (which lasted approximately 2 h). Intermediate patterns were collected at intervals of 10 between 810 and 840 °C, and 25 intervals between 725 and 775 °C, each data collection lasting approximately 25 min.
Rietveld refinement was performed using GSAS [22] and the EXPGUI interface [23]. The same set of standard parameters were used, including 3, 3, 21 and 5 parameters to model instrumental variables, scale factors, background and peak-shape for each dataset in the region of RT to 700 °C. The same refinement strategy was employed for the remaining high temperature datasets, except that the number of background terms was decreased from 21 to 18. A significant contribution from the vanadium sample can was seen throughout and this was fitted as a secondary phase at each temperature.
4.3 Dielectric Measurements
Pellets were electroded with sputtered Au before being coated with Ag paste (RS components). Dielectric measurements were made using a Wayne Kerr 6500B impedance analyzer with the sample mounted in a tube furnace. Capacitance and loss data were recorded in the frequency range of 100–10 MHz at a heating and cooling at a rate of 2 K min−1 over the temperature range of 50 to approximately 750 °C. Data collected on the cooling cycle are described here, since the heating cycle showed an additional anomaly due to the failure of the Ag paste (which is used to protect the Au electrode). Nevertheless, there was no evidence for hysteresis during the heating/cooling cycle.
Supplementary Materials
The following are available online at https://www.mdpi.com/2073-4352/7/5/135/s1, Figure S1: (a) normalised a (black squares) and b (red circles) lattice parameters obtained for varying values of x across the solid solution CsBi1−xLaxNb2O7, (b) c lattice parameter for varying values of x and (c) (normalized) unit cell volume for varying values of x.
Acknowledgments
We thank EPSRC for a Ph.D. studentship to CALD (EP/P505097/1). We thank undergraduate students William Skinner and Adam Smyth for some preliminary work on the CsBi1−xLaxNb2O7 solid solution and Finlay D. Morrison for guidance on the dielectric measurements.
Author Contributions
Charlotte A. L. Dixon carried out the synthesis and diffraction measurements. Kevin S. Knight and Alexandra S. Gibbs assisted with collection of neutron diffraction data and Jason A. McNulty carried out the dielectric measurements. Charlotte A. L. Dixon carried out the crystallographic analysis, with the assistance of Philip Lightfoot. Philip Lightfoot coordinated the project and wrote the paper, with the approval of all authors.
Conflicts of Interest
The authors declare no conflict of interest.
Appendix A
Further details of the crystal structures at selected temperatures may be obtained from Fachinformationszentrum (FIZ) Karlsruhe, 76344 Eggenstein-Leopoldshafen, Germany (e-mail: [email protected]) on quoting deposition numbers 432943-432945. The research data (raw neutron diffraction data) pertaining to this paper are available at http://dx.doi.org/10.17630/404e3a8f-3346-4dcc-b90a-62795097b1eb.
References
- Benedek, N.A.; Fennie, C.J. Hybrid improper ferroelectricity: A mechanism for controllable polarization-magnetization coupling. Phys. Rev. Lett. 2011, 106, 107204. [Google Scholar] [CrossRef] [PubMed]
- Bousquet, E.; Dawber, M.; Stucki, N.; Lichtensteiger, C.; Hermet, P.; Gariglio, S.; Triscone, J.-M.; Ghosez, P. Improper ferroelectricity in perovskite oxide artificial superlattices. Nature 2008, 452, 732–736. [Google Scholar] [CrossRef] [PubMed]
- Benedek, N.A. Origin of Ferroelectricity in a Family of Polar Oxides: The Dion—Jacobson Phases. Inorg. Chem. 2014, 53, 3769–3777. [Google Scholar] [CrossRef] [PubMed]
- Benedek, N.A.; Rondinelli, J.M.; Djani, H.; Ghosez, P.; Lightfoot, P. Understanding ferroelectricity in layered perovskites: New ideas and insights from theory and experiments. Dalton Trans. 2015, 44, 10543–10558. [Google Scholar] [CrossRef] [PubMed]
- Glazer, A.M. The classification of tilted octahedra in perovskites. Acta Crystallogr. 1972, B28, 3384–3392. [Google Scholar] [CrossRef]
- Woodward, P.M. Octahedral Tilting in Perovskites. I. Geometrical Considerations. Acta Crystallogr. 1997, B53, 32–43. [Google Scholar] [CrossRef]
- Howard, C.J.; Stokes, H.T. Group-theoretical analysis of octahedral tilting in perovskites. Acta Crystallogr. 1998, B54, 782–789. [Google Scholar] [CrossRef]
- Oh, Y.S.; Luo, X.; Huang, F.-T.; Wang, Y.; Cheong, S.-W. Experimental demonstration of hybrid improper ferroelectricity and the presence of abundant charged walls in (Ca, Sr) 3Ti2O7 crystals. Nat. Mater. 2015, 14, 407–413. [Google Scholar] [CrossRef] [PubMed]
- Li, B.-W.; Osada, M.; Ozawa, T.C.; Sasaki, T. RbBiNb2O7: A New Lead-Free High-T c Ferroelectric. Chem. Mater. 2012, 24, 3111–3113. [Google Scholar] [CrossRef]
- Withers, R.L.; Thompson, J.G.; Rae, A.D. The crystal chemistry underlying ferroelectricity in Bi4Ti3O12, Bi3TiNbO9, and Bi2WO6. J. Solid State Chem. 1991, 94, 404–417. [Google Scholar] [CrossRef]
- Snedden, A.; Knight, K.S.; Lightfoot, P. Structural distortions in the layered perovskites CsANb2O7 (A= Nd, Bi). J. Solid State Chem. 2003, 173, 309–313. [Google Scholar] [CrossRef]
- Strayer, M.E.; Gupta, A.S.; Akamatsu, H.; Lei, S.; Benedek, N.A.; Gopalan, V.; Mallouk, T.E. Emergent Noncentrosymmetry and Piezoelectricity Driven by Oxygen Octahedral Rotations in n = 2 Dion–Jacobson Phase Layer Perovskites. Adv. Funct. Mater. 2016, 26, 1930. [Google Scholar] [CrossRef]
- Kumada, N.; Kinomura, N.; Sleight, A.W. CsLaNb2O7. Acta Crystallogr. 1996, C52, 1063–1065. [Google Scholar] [CrossRef]
- McCabe, E.E.; Bousquet, E.; Stockdale, C.P.J.; Deacon, C.A.; Tran, T.T.; Halasyamani, P.S.; Stennett, M.C.; Hyatt, N.C. Proper Ferroelectricity in the Dion–Jacobson Material CsBi2Ti2NbO10: Experiment and Theory. Chem. Mater. 2015, 27, 8298–8309. [Google Scholar] [CrossRef]
- Fennie, C.J.; Rabe, K.M. Ferroelectricity in the Dion-Jacobson CsBiNb2O7 from first principles. Appl. Phys. Lett. 2006, 88, 262902. [Google Scholar] [CrossRef]
- Goff, R.J.; Keeble, D.; Thomas, P.A.; Ritter, T.; Morrison, F.D.; Lightfoot, P. Leakage and proton conductivity in the predicted ferroelectric CsBiNb2O7. Chem. Mater. 2009, 21, 1296–1302. [Google Scholar] [CrossRef]
- Chen, C.; Ning, H.; Lepadatu, S.; Cain, M.; Yan, H.; Reece, M.J. Ferroelectricity in Dion–Jacobson ABiNb2O7 (A= Rb, Cs) compounds. J. Mater. Chem. 2015, 3, 19–22. [Google Scholar] [CrossRef]
- Campbell, B.J.; Stokes, H.T.; Tanner, D.E.; Hatch, D.M. ISODISPLACE: A web-based tool for exploring structural distortions. J. Appl. Crystallogr. 2006, 39, 607. [Google Scholar] [CrossRef]
- Etxebarria, I.; Perez-Mato, J.M.; Boullay, P. The role of trilinear couplings in the phase transitions of Aurivillius compounds. Ferroelectrics 2010, 401, 17–23. [Google Scholar] [CrossRef]
- Snedden, A.; Hervoches, C.H.; Lightfoot, P. Ferroelectric phase transitions in SrBi2Nb2O9 and Bi5Ti3FeO15: A powder neutron diffraction study. Phys. Rev. B 2003, 67, 092102. [Google Scholar] [CrossRef]
- Boullay, P.; Tellier, J.; Mercurio, D.; Manier, M.; Zuñiga, F.J.; Perez-Mato, J.M. Phase transition sequence in ferroelectric Aurivillius compounds investigated by single crystal X-ray diffraction. Solid State Sci. 2012, 14, 1367–1371. [Google Scholar] [CrossRef]
- Larson, A.C.; von Dreele, R.B. General Structure Analysis System (GSAS); Los Alamos National Laboratory Report No. 88-748; Los Alamos National Laboratory: Los Alamos, NM, USA, 1994.
- Toby, B.H. EXPGUI, a graphical user interface for GSAS. J. Appl. Crystallogr. 2001, 34, 210–213. [Google Scholar] [CrossRef]
Figure 1.
Portion of the Rietveld plot for the P21am model at ambient temperature. Peaks marked ‘M’ represent superlattice peaks at the M-point; peaks marked “O” are subcell peaks that split into doublets in this superlattice (a ~ b ~ √2at), whereas the peak marked “A” represents a peak that would be split if the alternative supercell (a ~ b ~ 2at) was present. The peak at d ~ 2.14 Å is from the vanadium sample holder.
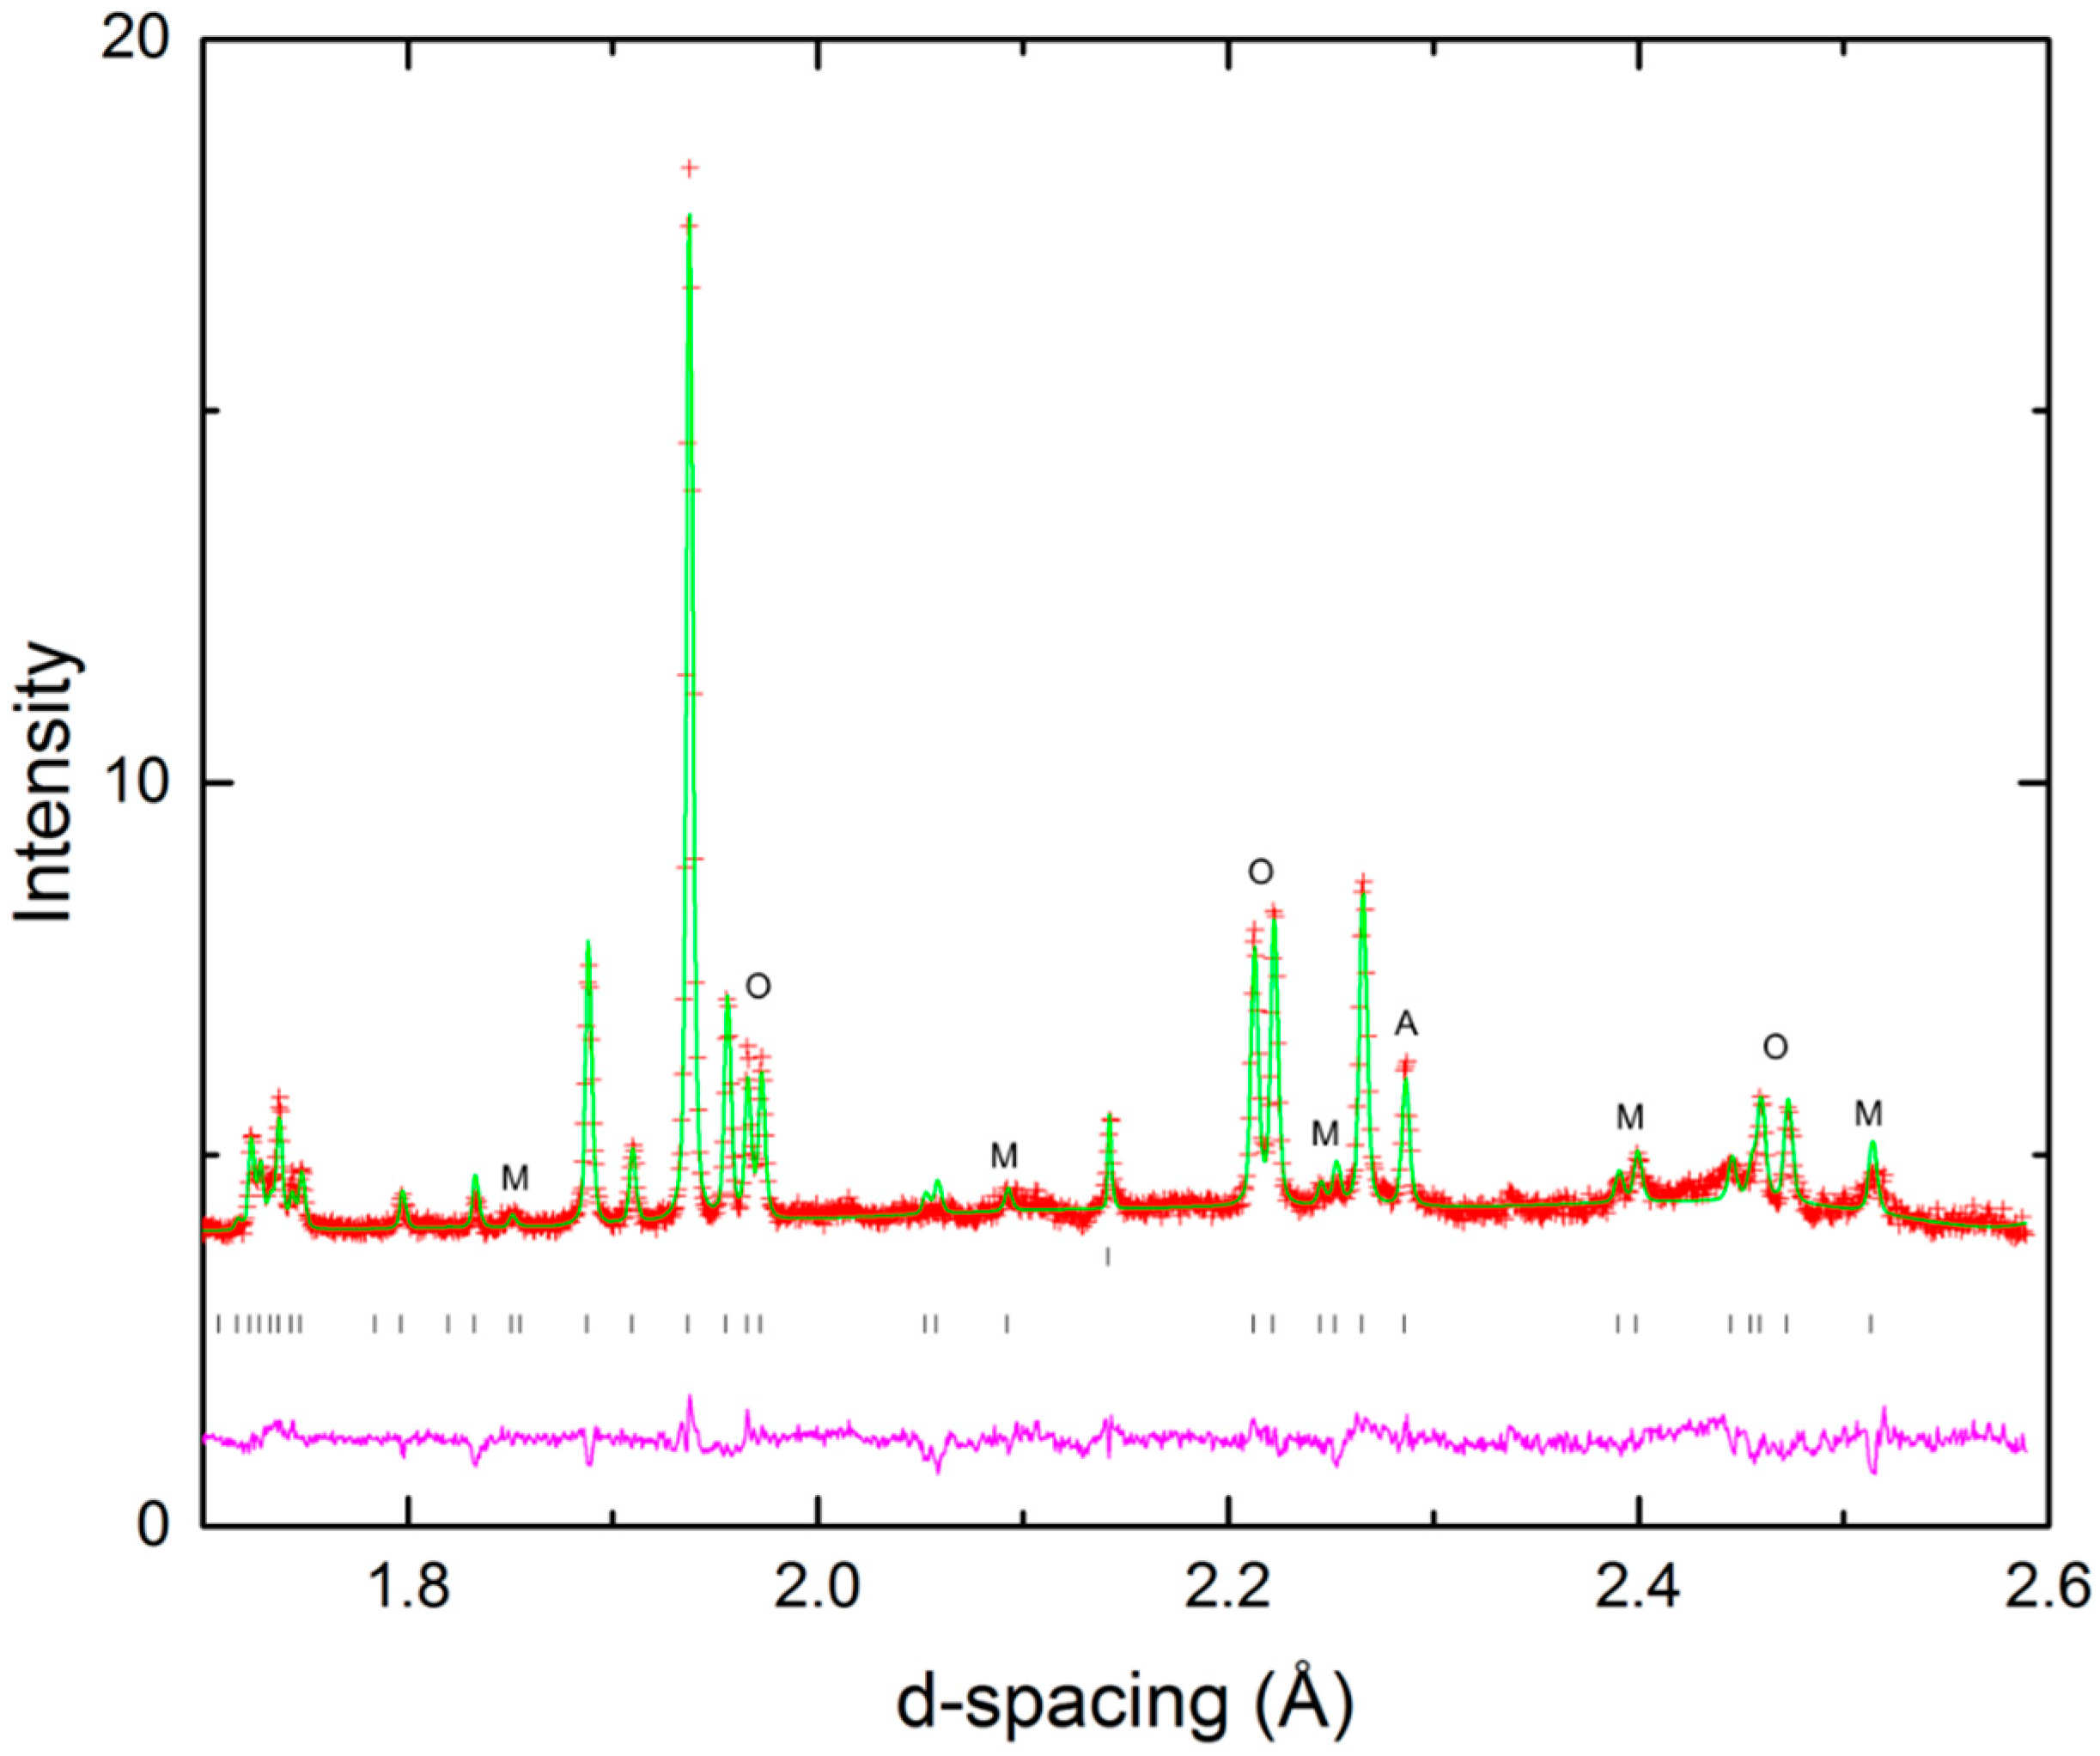
Figure 2.
Crystal structure of CsBi0.6La0.4Nb2O7 at ambient temperature (a) down the c-axis, showing the in-phase (M2+) tilt and (b) perpendicular view, showing the out-of-phase (M5−) tilt.
Figure 2.
Crystal structure of CsBi0.6La0.4Nb2O7 at ambient temperature (a) down the c-axis, showing the in-phase (M2+) tilt and (b) perpendicular view, showing the out-of-phase (M5−) tilt.
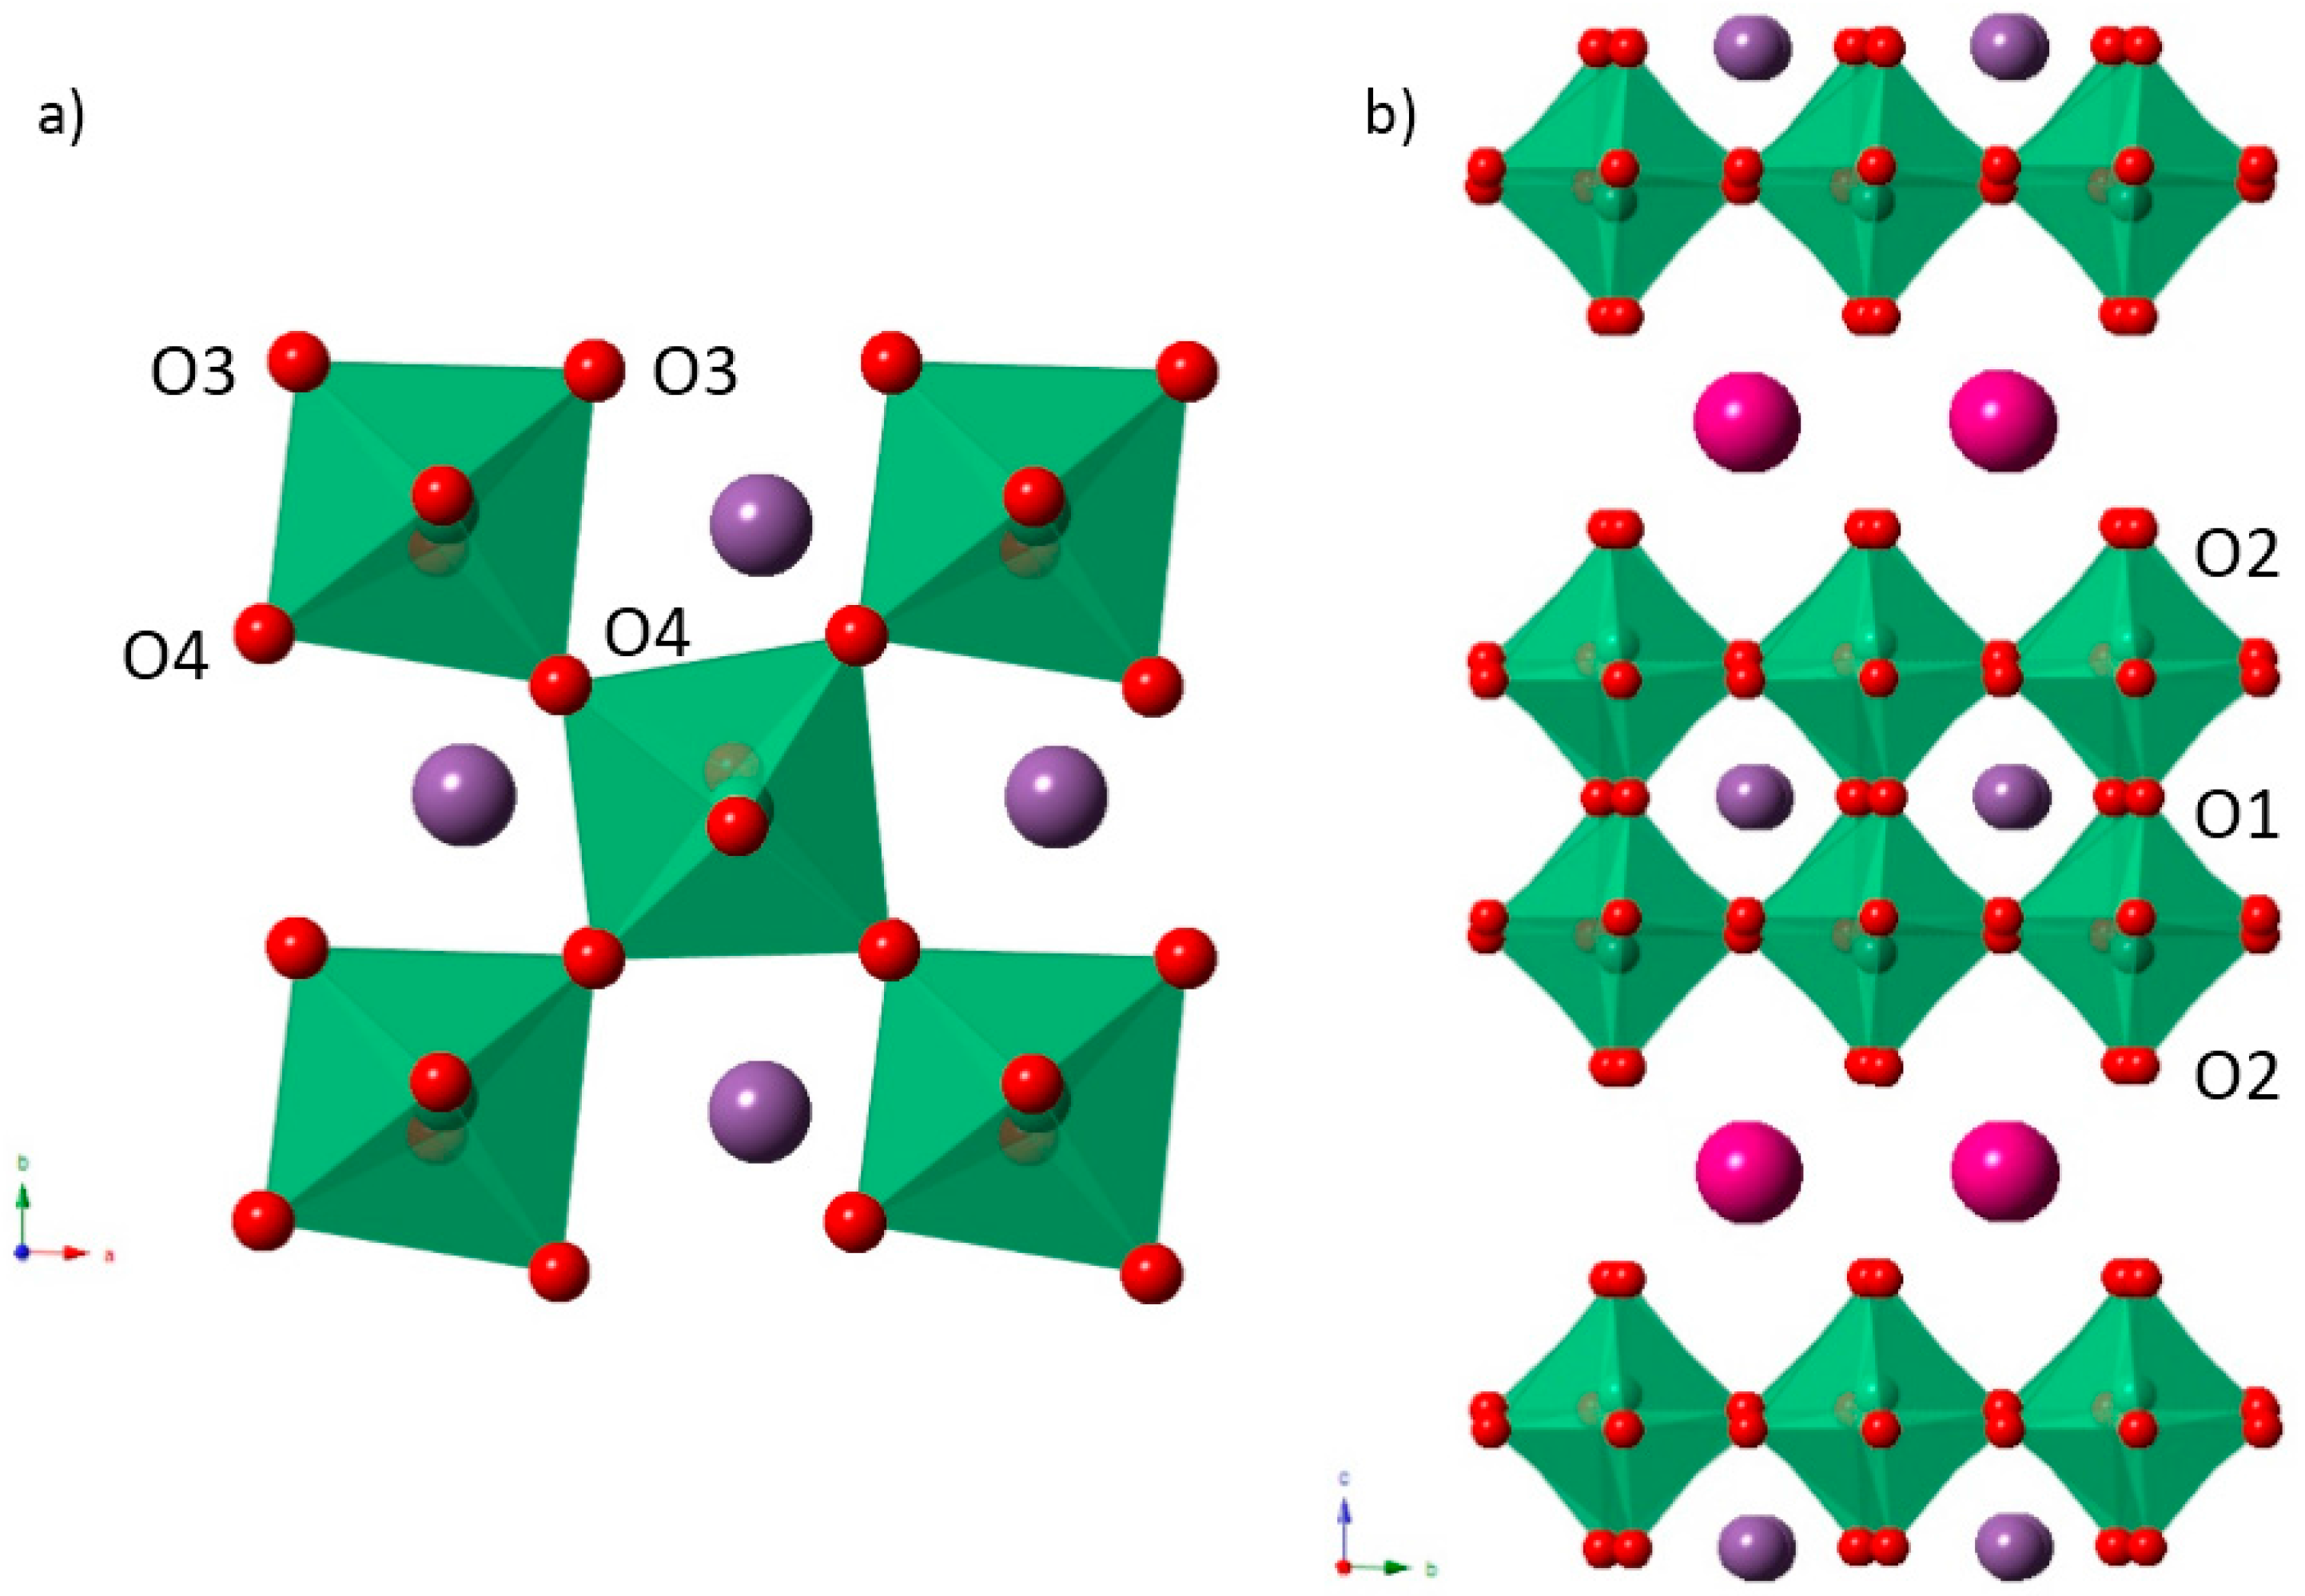
Figure 3.
Portion of the Rietveld plot for the P4/mmm model at 725 °C. Note the absence of both M superlattice peaks and O splittings, compared to Figure 1.
Figure 3.
Portion of the Rietveld plot for the P4/mmm model at 725 °C. Note the absence of both M superlattice peaks and O splittings, compared to Figure 1.

Figure 4.
Thermal evolution of the unit cell parameters. (a) a (squares) and b (circles) parameters; (b) c parameter; (c) unit cell volume, suggesting a first-order orthorhombic-tetragonal phase transition near 725 °C. Note that the a and b parameters in the orthorhombic phase are normalized to the tetragonal subcell (i.e., divided by √2).

Figure 5.
Thermal evolution of the mode amplitudes (from ISODISTORT). (a) M2+ (squares) and M3+ (circles) modes: M2+ is the in-phase tilt around c, M3+ is a minor octahedral distortion mode; (b) M5− mode: this mode is largely composed of contributions from the out-of-phase tilt around the ab plane, but also incorporates minor contributions from antiferrodistortive cation displacements along b; (c) Γ5− mode: this is the polar mode (i.e., polar displacive contributions from all atoms along the a-axis).

Figure 6.
Comparison of Rietveld goodness-of-fit parameters (χ2) for the P21am and Pmam models up to a temperature of 700 °C.
Figure 6.
Comparison of Rietveld goodness-of-fit parameters (χ2) for the P21am and Pmam models up to a temperature of 700 °C.

Figure 7.
Relative permittivity data for CsBi0.6La0.4Nb2O7 at selected frequencies, obtained on cooling. Data collected at a frequency of 10 kHz are shown by red circles, 100 kHz by blue triangles and 1 MHz by pink triangles.
Figure 7.
Relative permittivity data for CsBi0.6La0.4Nb2O7 at selected frequencies, obtained on cooling. Data collected at a frequency of 10 kHz are shown by red circles, 100 kHz by blue triangles and 1 MHz by pink triangles.

Table 1.
Example models based on combinations of octahedral tilt modes (adapted from Strayer et al. [12].)
Table 1.
Example models based on combinations of octahedral tilt modes (adapted from Strayer et al. [12].)
| Glazer Notation | Active Modes | Space Group | Metrics |
|---|---|---|---|
| a0a0c0 | None | P4/mmm | at x at x ct |
| a0a0c+ | M2+ | P4/mbm | √2at x √2at x ct |
| a0a0c− | M4− | P4/nbm | √2at x √2at x ct |
| a+a+c0 | X1+ | P4/mmm | 2at x 2at x ct |
| a−a−c0 | M5− | Pmam | √2at x √2at x ct |
| a−a−c+ | M2+ M5− | P21am | √2at x √2at x ct |
| a−b0c0 | M5− | Cmmm | 2at x 2at x ct |
| a−b0c+ | M2+ M5− | Amm2 * | ct x 2at x 2at |
| a−b−c0 | M5− | P2/m | √2at x ct x √2at |
| a−b−c+ | M2+ M5− | Pm | √2at x ct x √2at |
* C2mm setting for c corresponding to ct.
Table 2.
Refined structural model for CsBi0.6La0.4Nb2O7 at 25 °C. Space group P21am, a = 5.49618 (14), b = 5.46012 (14), c = 11.3254 (3) Å.
Table 2.
Refined structural model for CsBi0.6La0.4Nb2O7 at 25 °C. Space group P21am, a = 5.49618 (14), b = 5.46012 (14), c = 11.3254 (3) Å.
| Atom | Wyckoff Position | x | y | z | 100 * Uiso (Å2) |
|---|---|---|---|---|---|
| Cs1 | 2b | 0.3349 (17) | 0.2579 (12) | 0.5 | 2.08 (10) |
| Bi/La1 * | 2a | 0.367 | 0.2692 (8) | 0.0 | 2.91 (11) |
| Nb1 | 4c | 0.3334 (10) | 0.7540 (6) | 0.20533 (14) | 0.56 (7) |
| O1 | 2a | 0.321 (2) | 0.6892 (9) | 0.0 | 2.83 (15) |
| O2 | 4c | 0.3272 (12) | 0.7812 (7) | 0.3574 (2) | 1.66 (9) |
| O3 | 4c | 0.0869 (15) | 0.0104 (12) | 0.1589 (3) | 3.10 (13) |
| O4 | 4c | 0.5290 (11) | 0.4590 (8) | 0.1840 (3) | 2.25 (13) |
* fixed occupancy Bi0.6La0.4; the x-coordinate is fixed to define the origin of the polar axis.
Table 3.
Selected bond lengths (Å) for CsBi0.6La0.4Nb2O7 at 25 °C in the P21am model.
| Cs-O | Bond Length (Å) | Bi/La-O | Bond Length (Å) | Nb-O | Bond Length (Å) |
|---|---|---|---|---|---|
| Cs1-O2 × 2 | 3.063 (7) | Bi1-O1 | 2.307 (7) | Nb1-O1 | 2.3531 (19) |
| Cs1-O2 × 2 | 3.158 (10) | Bi1-O1 | 2.508 (12) | Nb1-O2 | 1.730 (3) |
| Cs1-O2 × 2 | 3.231 (10) | Bi1-O3 × 2 | 2.651 (6) | Nb1-O3 | 1.968 (9) |
| Cs1-O2 × 2 | 3.282 (7) | Bi1-O3 × 2 | 2.758 (6) | Nb1-O3 | 2.018 (8) |
| Bi1-O4 × 2 | 2.492 (4) | Nb1-O4 | 1.952 (6) | ||
| Nb1-O4 | 2.052 (6) |
Table 4.
Refined structural model for CsBi0.6La0.4Nb2O7 at 750 °C. Space group P4/mmm, a = 3.92282 (16), c = 11.4138 (5) Å.
Table 4.
Refined structural model for CsBi0.6La0.4Nb2O7 at 750 °C. Space group P4/mmm, a = 3.92282 (16), c = 11.4138 (5) Å.
| Atom | Wyckoff Position | x | y | z | 100 * Uiso (Å2) |
|---|---|---|---|---|---|
| Cs1 | 1b | 0.0 | 0.0 | 0.5 | 7.09 (13) |
| Bi/La1 * | 1a | 0.0 | 0.0 | 0.0 | 7.17 (16) |
| Nb1 | 2h | 0.5 | 0.5 | 0.20414 (16) | 2.13 (9) |
| O1 | 4i | 0.0 | 0.5 | 0.17054 (17) | 5.56 (10) |
| O2 | 2h | 0.5 | 0.5 | 0.3555 (3) | 6.44 (13) |
| O3 | 1c | 0.5 | 0.5 | 0.0 | 7.20 (17) |
* fixed occupancy Bi0.6La0.4.
Table 5.
Selected bond lengths (Å) for CsBi0.6La0.4Nb2O7 at 750 °C in the P4/mmm model.
| Cs-O | Bond Length (Å) | Bi/La-O | Bond Length (Å) | Nb-O | Bond Length (Å) |
|---|---|---|---|---|---|
| Cs1-O2 × 8 | 3.2273 (14) | Bi1-O1 × 8 | 2.7634 (14) | Nb1-O1 × 4 | 1.9985 (5) |
| Bi1-O3 × 4 | 2.77385 (11) | Nb1-O2 | 1.727 (4) | ||
| Nb1-O3 | 2.3300 (18) |
© 2017 by the authors. Licensee MDPI, Basel, Switzerland. This article is an open access article distributed under the terms and conditions of the Creative Commons Attribution (CC BY) license (http://creativecommons.org/licenses/by/4.0/).
Share and Cite
MDPI and ACS Style
Dixon, C.A.L.; McNulty, J.A.; Knight, K.S.; Gibbs, A.S.; Lightfoot, P. Phase Transition Behavior of the Layered Perovskite CsBi0.6La0.4Nb2O7: A Hybrid Improper Ferroelectric. Crystals 2017, 7, 135. https://doi.org/10.3390/cryst7050135
AMA Style
Dixon CAL, McNulty JA, Knight KS, Gibbs AS, Lightfoot P. Phase Transition Behavior of the Layered Perovskite CsBi0.6La0.4Nb2O7: A Hybrid Improper Ferroelectric. Crystals. 2017; 7(5):135. https://doi.org/10.3390/cryst7050135
Chicago/Turabian StyleDixon, Charlotte A. L., Jason A. McNulty, Kevin S. Knight, Alexandra S. Gibbs, and Philip Lightfoot. 2017. "Phase Transition Behavior of the Layered Perovskite CsBi0.6La0.4Nb2O7: A Hybrid Improper Ferroelectric" Crystals 7, no. 5: 135. https://doi.org/10.3390/cryst7050135
Note that from the first issue of 2016, this journal uses article numbers instead of page numbers. See further details here.