Article

Crystal Growth of High-Quality Protein Crystals under the Presence of an Alternant Electric Field in Pulse-Wave Mode, and a Strong Magnetic Field with Radio Frequency Pulses Characterized by X-ray Diffraction

by
Adela Rodríguez-Romero
*,
Nuria Esturau-Escofet
,
Carina Pareja-Rivera
and
Abel Moreno
*
Instituto de Química, Universidad Nacional Autónoma de México, Av. Universidad 3000, UNAM, Ciudad de México 04510, Mexico
*
Authors to whom correspondence should be addressed.
Crystals 2017, 7(6), 179; https://doi.org/10.3390/cryst7060179
Submission received: 29 April 2017 / Revised: 12 June 2017 / Accepted: 15 June 2017 / Published: 19 June 2017
(This article belongs to the Special Issue Protein Crystallization under the Presence of an Electric Field)

Abstract

:
The first part of this research was devoted to investigating the effect of alternate current (AC) using four different types of wave modes (pulse-wave) at 2 Hz on the crystal growth of lysozyme in solution. The best results, in terms of size and crystal quality, were obtained when protein crystals were grown under the influence of electric fields in a very specific wave mode (“breathing” wave), giving the highest resolution up to 1.34 Å in X-ray diffraction analysis compared with controls and with those crystals grown in gel. In the second part, we evaluated the effect of a strong magnetic field of 16.5 Tesla combined with radiofrequency pulses of 0.43 μs on the crystal growth in gels of tetragonal hen egg white (HEW) lysozyme. The lysozyme crystals grown, both in solution applying breathing-wave and in gel under the influence of this strong magnetic field with pulses of radio frequencies, produced the larger-in-size crystals and the highest resolution structures. Data processing and refinement statistics are very good in terms of the resolution, mosaicity and Wilson B factor obtained for each crystal. Besides, electron density maps show well-defined and distinctly separated atoms at several selected tryptophan residues for the crystal grown using the “breathing wave pulses”.

1. Introduction

The new trend in protein crystallography has been focused on finding new strategies to obtain crystals of different sizes for different bio-structural projects at very high resolution via X-ray diffraction (powder and single-crystal), neutron diffraction, and recently using X-ray free electron lasers (XFEL) methods. Particularly, neutron crystallography is an emerging research area in which we can follow the details of precise mechanisms of chemical interactions and the new strategies for solving the structure of macromolecular complexes. This is a powerful complementary technique for X-ray structural studies that explicitly determines the location and orientation of deuterium atoms in proteins [1,2,3,4,5]. However, this technique requires larger protein crystals than those used for conventional X-ray crystallography due to the low flux of neutron beams, though longer data collection (time varying from days to weeks) are also needed. That is why just a few 3D structures using neutron diffraction have been deposited in the Protein Data Bank (PDB). Despite these apparent disadvantages, there have been recent significant advances, not only in the beam lines and the detectors technology, but also in the sample preparation (perdeuteration), though the second via to obtain the 3D structure from nanocrystals is the free-electron lasers to perform X-ray crystallography of macromolecular complexes [6,7,8,9,10,11,12]. Additionally, magnetic fields [13,14,15,16,17,18], electric fields [16,19,20] or a combination of both [21] have proven to be efficient in obtaining bigger and higher-quality protein single crystals for X-ray crystallography. The use of alternate currents (AC), has also been explored in protein crystallization focused on the size of protein and on the quality of the crystals, using X-ray topography [20]. There are also other novel strategies and ad hoc devices that have been used in electric (DC & AC) [22,23,24,25,26,27,28,29,30] and ultrasonic fields [31] applied to protein crystallization techniques. The pioneering contributions about the use of electric fields applied to protein crystallization were proposed by Professor Christo Nanev and his group more than a decade ago [31,32,33] followed by a research on the kinetics of the process by Professor Aubry and his group [34,35]. In this line of research, we found additional related ideas using pulses such as femto-lasers instead of electric fields for controlling the nucleation [36]. The use of lasers permitted to observe the area where the laser struck produced the formation of just crystalline nuclei (this can be explained by the formation of small fragments of protein serving as seeds for growing nucleation centers produced by the focalized laser radiation) [37]. An alternative method would be the use of agarose for growing high-quality crystals. These crystals would be suitable not only for high resolution X-ray crystallography, but also for soaking ligands analogs in enzymes related to protein biosynthesis. This gel-growth technique or the counter-diffusion in capillary tubes method can also be combined with different devices using electromagnetic fields [18,21]. In the last decade, agarose was the most popular gel for protein crystallization, however other gels were also used in protein crystallization and in crystal growth of inorganic and organic compounds [38,39,40,41,42,43,44].
In this contribution, we evaluated the effect of four types of pulse waves when applying an AC current of 2 Hz to the crystal growth of lysozyme in solution. The best crystals, in terms of size and quality, were grown in solution with the pulse wave called “breathing wave”. Additionally, a strong magnetic field of 16.5 Tesla combined with radiofrequency pulses of 0.43 μs were applied also on the crystal growth of lysozyme in gels. The lysozyme crystals grown both in solution (with AC in breathing wave mode) and in gel under the influence of this strong magnetic field, produced large-sized crystals and high-resolution crystallographic structures. Data processing and refinement statistics are very good in terms of the crystal quality, as well as the electron density maps of the best crystals.

2. Results and Discussion

The crystal growth cell (as shown in Figure 1) used in these experiments for applying electric field (AC) in four types of wave modes was based on the batch method for proteins crystallization that we had previously published using DC, though with some modifications [16]. In the current experiments, we have tried to investigate the effect of alternate current (AC) in dense-disperse wave mode (usually called pulse-wave) at 2 Hz in four different modes on the crystal growth of lysozyme in solution.
The device used for these alternating current experiments was a KWD-808 (Jiangsu, China) I Multi-purpose health device (usually recommended for acupuncture treatment). This device allows to apply five types of waves in alternant current (AC) at different frequencies (f): the first pulse wave corresponds to the continues-wave, it contains repeated pulses ranging from 0.5 Hz up to 100 Hz, the maximum output amplitude pulse is from 40 V ± 10 V. This type of continues pulse related to AC has been used in several other publications elsewhere.
In our case, Figure 2 shows the effect of alternate current (AC) by using four types of pulse waves:
Type I (scheme shown below Figure 2A), this pulse is called dense- and scattered-wave; the second type II (scheme shown below Figure 2B) is called intermittent-wave; the third type III (scheme shown below Figure 2C) is called ripple-wave, which reminds us of the waves on the surface of water, especially caused by an object dropping into it; the fourth type IV (scheme shown below Figure 2D) is called breathing pulse, which implies that the wave first rises its amplitude and then falls to the ground level. From our results, crystals obtained under pulse wave type I were very tiny, which made these crystals hard to characterize using our rotating anode X-ray generator. Nonetheless, the left three types of pulse waves (Figure 2B–D) produced suitable crystals for X-ray diffraction. When applying these four pulse waves, each of them presented a variation on the number and on the size of the crystals along the cell. The best crystals (in terms of size and number) were obtained when wave pulse type IV (called “breathing wave”) produced the smallest number of crystals, but larger in size (Figure 2D).
We statistically measured the number of crystals attached to the type of electrode (cathode or anode) versus the pulse wave as shown in Figure 3. It was remarkable to see that the type IV of pulse wave (Figure 2D called “breathing wave”) produced the smallest number of crystals, though statistically larger in size as shown in Figure 4. The size of these crystals was very regular compared to the other types of waves.
In Figure 4, we see that the standard deviation (error bar) of pulse wave 4P is higher than the one of pulse wave 1P. This is due to the bigger size of the crystals though fewer in number, which pulse wave 4P produced. Therefore, in terms of the crystals number for pulses 1P and 4P, we must refer to Figure 3. Here we see that pulse wave 4P, called breathing wave, had fewer number of crystals distributed on the surface of each of the electrodes (anode and cathode), whereas pulse wave 1P had a greater number of crystals on the electrodes. However, 1P crystals were a lot smaller and unevenly distributed (400 on the anode and 50 on the cathode). The statistical measurement of the size of crystals (Figure 4) showed a more homogeneous size distribution of crystals per square centimeter in pulse wave 4P than in 1P, even though the error bar in 1P is smaller than in the rest. In this Figure 4, we see that pulse wave 2P, 3P and 4P also have different size error bars. Again, this is due to the crystals size variations (from 75 to 116 microns) in these pulse waves, whereas the size variation in pulse wave 1P is only around 15 microns. There is one order of magnitude of difference for each of the comparable sizes (1P compared to 2P, 3P and 4P). The fact that the error bar is lower for 1P than for the rest is due to the tiny size of the crystals that 1P produced, regardless of their number. The only difference between the crystals in 2P, 3P and 4P was the refinement statistics and the crystal quality (see Table 1).
We applied a statistical analysis by using the Student’s test. In this test, we compared the crystal sizes of 1P with the ones obtained using pulse waves (2P, 3P and 4P). For each of these comparisons we obtained different values of variance: 1P and 2P (variance: 3.0909 × 10⁻⁶ and 1.5832 × 10⁻⁴); 1P and 3P (variance: 3.0909 × 10⁻⁶ and 4.0621 × 10⁻⁵); 1P and 4P (variance: 3.0909 × 10⁻⁶ and 2.1781 × 10⁻⁴). This means that the samples are independent. The p-value for all samples was less than 0.05, which means that there is a statistically significant difference between 1P and 2P or 1P and 3P or 1P and 4P. These results were already discussed in the previous paragraph. The mean size values are also different when comparing 1P (0.015 mm) with 2P (0.103 mm), 3P (0.075 mm) or 4P (0.116 mm). The degrees of freedom 34 (2P), 20 (3P) and 15 (4P) are related to the number of measured crystals with a confidence of 95%.
Recent publications have revealed that the use of related types of e-crystallization growth cells applied to proteins by using direct current (DC) made crystals grow better oriented to the cathode (when the protein molecule was positively charged) compared to those crystals grown on the anode (when the protein molecule was negatively charged) showing also high crystal quality [16,17,18,19,20]. Along the crystal growth process, four different regimes are usually obtained: (1) induction/equilibration; (2) transient nucleation; (3) steady-state nucleation & crystal growth; and (4) depletion [45]. However, from the present results we observed that AC in a pulse-wave mode produced better results when a specific pulse wave was used (“breathing-wave”).
Nonetheless, it has been observed that a homogeneous magnetic field, when applied for a long time, reduces the gravity forces on the solution through the action of the magnetic force. This has a positive effect on the crystal growth [16,18]. The convection is practically nullified, generating a situation like the one found under the conditions of microgravity. Based on this assumption, we decided to grow lysozyme crystals in gels, under the presence of a strong magnetic field applying pulses of radio frequency at different angles.
The experimental setup for these results using a strong magnetic field on the crystallization of lysozyme is shown in Figure 5. For this case, we used a magnetic field of 16.5 Tesla combined with crystal growth in gels and cycles of rectangular radiofrequency pulses of 0.43 μs followed by a delay time of 4.3 s. This is the first time that short radio frequency pulses have been applied for growing crystals in gels and inside the NMR spectrometer of 700 MHz (16.5 Tesla). The lysozyme crystals were larger and of a better quality than those of the controls (see Table 1), improving even the results obtained in our most recent publication [16]. It is important to remark that these lysozyme crystals not only showed the typical crystal orientation along the c-axis, but they also were larger compared with the best controls of crystals grown in solution and in gels. Compared to the results of reference [18], where only seven Tesla were applied, the size of the crystals was comparable to the direction of the “C” axis, but the crystals in our experiments were much more elongated.
We collected full datasets of the best crystals, obtained by testing electric and magnetic fields, to get their 3D structures, so they could be compared with control crystals. Analysis of data collection and refinement statistics clearly showed that the crystal obtained when applying the “breathing pulse wave” improved the internal order of crystals and thus gave the better statistics in terms of resolution, mosaicity and B factor (Wilson Plot) (Table 1) and a more precise three-dimensional structure at 1.34 Å resolution. As shown in Table 1, crystal structures show slightly higher B factor value for those crystals grown in gels and NMR, indicating that they exhibit higher flexibility compared to those grown using pulses. Conversely, mosaicity values for the crystal grown using magnetic field was slightly lower (Lys-Gel 0.45°) than those obtained for the crystals grown using electric fields (0.81°, 0.55° and 0.50° for Lys2HzP2, Lys2HzP3 and Lys2HzP4, respectively).
Figure 6A–D shows the electron density map of the best crystals obtained from these experiments. The selected area was a relatively interior region that contains tryptophan residues 28 and 108 to show the crystal quality in terms of the definition of the indole rings. The crystals grown in gel, used as controls, also showed a good crystal quality as seen in the statistics table of the X-ray analysis (Table 1). However, the crystal obtained when applying the breathing pulse wave (see the electron density map on Figure 6B) corresponding to the Lys2HzP4 data in Table 1, presented the highest crystal quality compared to all analyzed crystals. These crystals diffracted up to 1.34 Å resolution. Nonetheless, several residues exposed to the solvent, such as Lys97 and Arg125, did show a dynamically disordered end of the side chain and not interpretable electron density and several showed double conformations (Arg45, Ser85, Ser86) in all the structures. This is the first time that this type of experiment shows a practical method for obtaining high-quality crystals using different types of pulse waves in solution.
The analyses of the crystal structure by X-ray diffraction showed the highest crystal quality for those crystals grown using the pulse wave called breathing pulse type (see Figure 6B and X-ray data on Table 1 column Lys2HzP4. Not only were the crystals bigger, they were also remarkably reduced in number. These crystals showed the higher resolution limits (1.34 Å), lower Wilson B factors values, (15.7 Å2) and low mosaicity values (0.50°). Unfortunately, there are not at the moment similar experiments in the literature to be compared with our results on protein crystallization, neither in electric fields (AC) using pulse waves nor using magnetic fields of 16.5 Tesla with radio frequencies pulses. There is just another crystallographic approach, in the same line, that uses a strong magnetic field of 10 Tesla applied to the crystallization of orthorhombic lysozyme with space group P212121 [46]. This orthorhombic lysozyme structure was refined to a resolution of 1.13 Å and an R factor of 17%. The crystallographic analysis showed that few residues were shifted (Arg68, Arg73, Arg128) resulting in significant structural fluctuations, which can have large effects on the crystallization process and properties of lysozyme. What the authors claimed was that the strong magnetic field of 10 Tesla contributed to the stabilization of the dihedral angles. The significant difference between our results applied to tetragonal lysozyme with a space group P43212 and those of Saijo et al. [46] was that they obtained a Mean B factor of 17.8 Å2 after applying 10 Tesla (19.5 Å2 for 0 Tesla), whereas we obtained a Mean B factor of 17.43 Å2 after applying 16.5 Tesla (20 Å2 for 0 Tesla). Nonetheless, the best Mean B factor in our work was the one obtained for the breathing pulse (4P) crystals (15.7 Å2). The resolution in Saijo et al. [46] was improved from 1.33 to 1.13 Å (R factor of 17%), whereas in our case, the resolution factor was improved from 1.82 to 1.39 Å (23%). The mosaicity values for crystals grown using magnetic field of 10 Tesla was better than the lysozyme controls. In our case, we obtained similar results, the mosaicity was better when using 16.5 Tesla (0.45°) than those values obtained for the control (0.81°). From the structural point of view at 10 Tesla, Saijo et al. [46] observed the displacement of the charged side chains of Arg68 and Arg73 in the flexible loop and of Arg128 at the C-terminus. In our crystallographic analysis for tetragonal lysozyme grown applying 16.5 Tesla in gels with radio frequencies pulses, these displacements were almost the same although both structures have two different crystallographic space groups. However, in our case several residues exposed to the solvent, such as Lys97, Arg125, Arg128 and even the benzene ring of Trp62 showed a dynamically disordered end of the side chain and not interpretable electron density. Besides, several side chains showed double conformations (Arg45, Ser85, Ser86) in all the structures. Overall, both the magnetic field of 16.5 Tesla and the use of AC using the pulse wave called breathing pulse (4P), improved the crystal quality of tetragonal lysozyme. In both cases, the diffracted intensities increased significantly with these two approaches, leading to a higher resolution and better 3D crystallographic structures.

3. Materials and Methods

3.1. Gel Preparation

Agarose gel 1.0 % (w/v) stock solution of low melting point agarose (Tgel = 297–298 K, Hampton Research Cod. HR8-092) can be prepared following the current procedure: Dissolve 0.1 g agarose in 10 mL of water heated at 363 K stirring it constantly until obtaining a transparent solution. This solution is then passed through a 0.22 μm porosity membrane filter to remove all dust particles or insoluble fibers of agarose. The get-ready gel-solution can be stored into 1.0 mL aliquots in Eppendorf tubes in the fridge. Prior to crystallizing proteins in the agarose, the Eppendorf tube of 1.0 mL can be heated at 363 K by using a heating plate. This is done to melt the gel of 1.0% (w/v) concentration. The mixture of precipitant and then agarose will allow to reach a proper temperature to be mixed with the protein avoiding any denaturation problems.

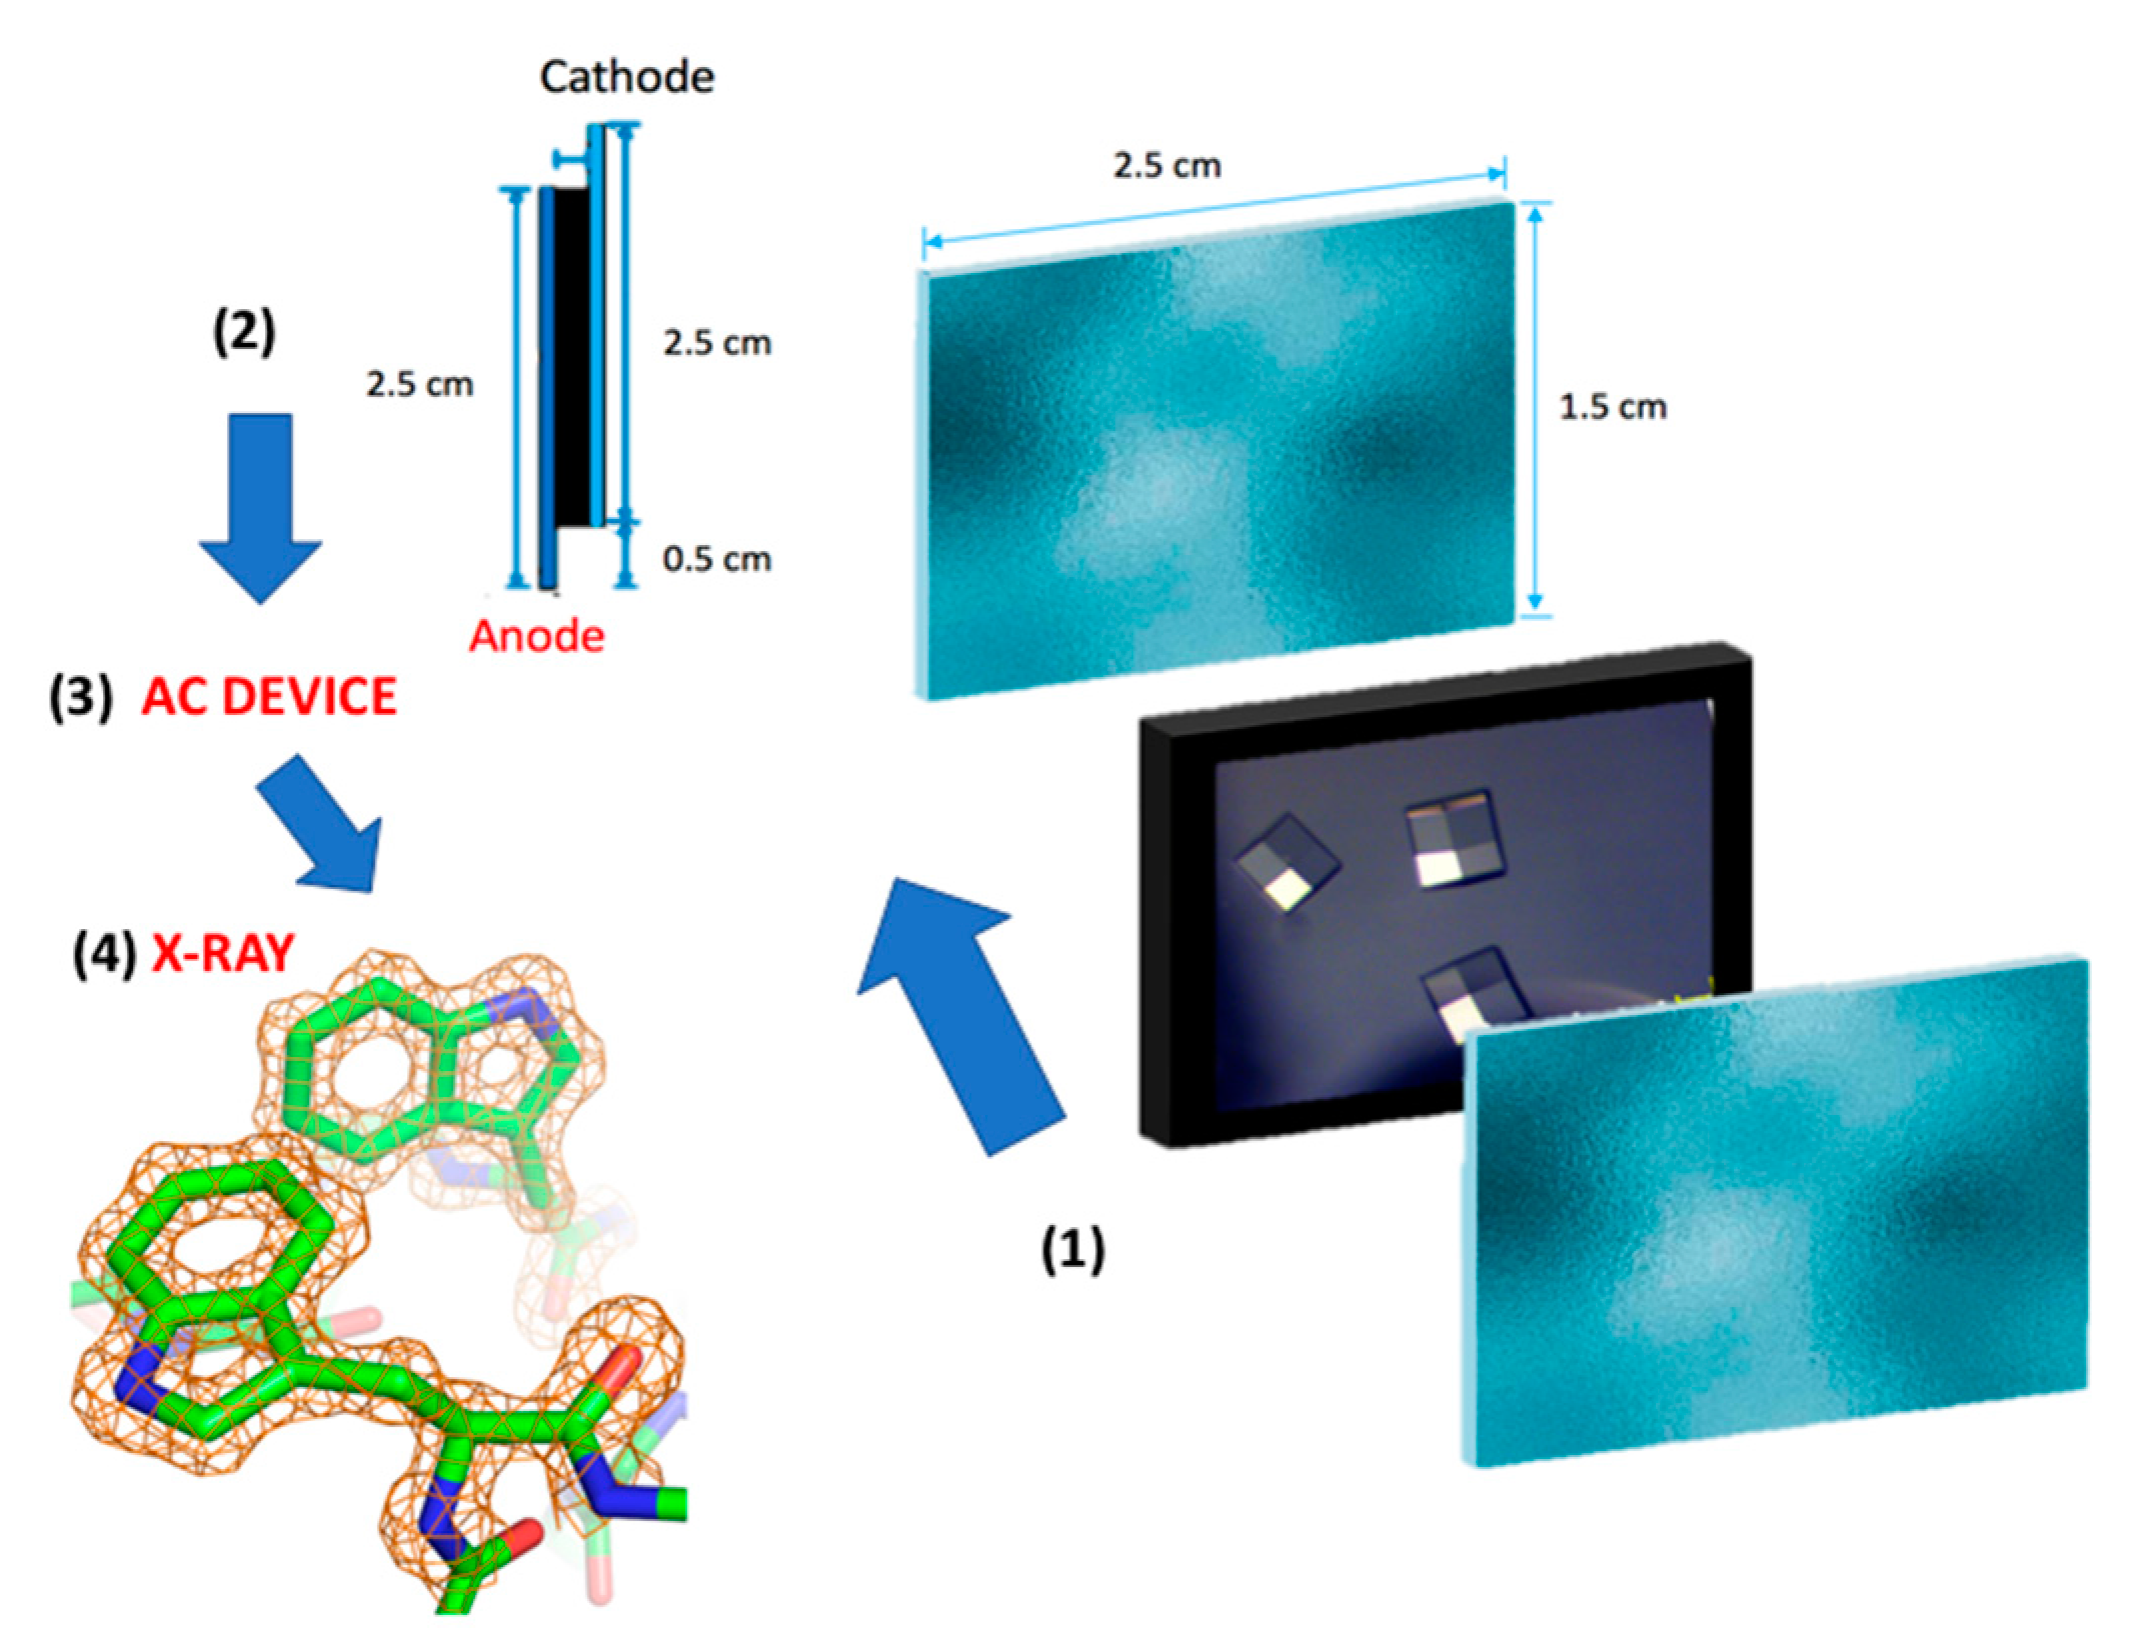
3.2. Electric Field Setup

The growth cell as that shown in Figure 1 was based on that previously published [22] with some modifications for the application of AC currents. It consisted of two polished float conductive indium tin oxide electrodes (usually called ITO) made in glass of dimensions 2.5 × 1.5 cm2, with a resistance ranging from 4 to 8 Ohms (Delta Technologies, Loveland, CO, USA). The two electrodes (ITO glasses) are placed parallel to each other. The cell is prepared using a rectangular frame as shown in Figure 1 made of elastic black rubber material sealed with vacuum grease to avoid leakage. The closing of the growth cell can be done with a gun for silicone bar melting. The conductive parts of the electrodes surfaces were placed inwards, facing each other. Each of the ITO electrodes is displaced 0.5 cm from one another. This was done to provide the appropriate connection area with the electric alligators to the electrodes (anode/cathode), when an AC current was applied in wave pulse mode. Each cell had a volume capacity of approximately 100 μL by using the batch method.
The batch crystallization conditions for the studied protein must be known before applying the AC current experiments. After closing the growth cell with a cover of melted silicone (Figure 1), the system is connected to the AC apparatus that supplies an alternant current in a pulse-wave mode for testing the four types of waves (at 2 Hz each). The applied AC during the nucleation had to be turned off after 48 h to fix the nuclei on the surface of the ITO electrodes. From here on, the AC growth cell had to be kept at a constant temperature for the rest of the experiment, in order to reach the equilibrium in a maximum time of three days. The device used for these alternating current experiments was a KWD-808 I Multi-purpose health device (usually recommended for acupuncture treatment). One of the purposes of using AC currents for the crystallization of proteins in solution was to demonstrate the efficiency of the procedure in obtaining high-quality protein crystals using all types of precipitants (salts, organic solvents, polyethylene glycols, etc.) and the second is to make it reproducible anywhere. There are two possibilities for growing high-quality protein crystals, one is the mentioned AC current in the breathing-wave pulse mode, and the other is the growing of crystals in agarose inside the strong magnetic field applying radio frequency pulses. However, this second method has a limitation when using polyethylene glycols (PEGs) and agarose together (we must remember that a considerable number of proteins crystallize in PEGs); however, polyethylene glycols will not allow the polymerization of agarose properly.

3.3. Magnetic Field Setup

The setup and the sequence of the experimental steps (from obtaining crystals up to the 3D structure) applying the magnetic field are shown in Figure 6. This setup was based on our previous publication with some modifications [16]. In this case, we have additionally introduced a gel-growth with radio frequency pulses at different angles. For these experiments, the batch crystallization conditions are needed in advance. Once sealed, the capillary pipettes were introduced into an NMR glass tube (5 mm in diameter) and left for at least 68 h under the presence of a magnetic field of 16.5 Tesla (Brucker NMR Advance III HD 700 MHz spectrometer equipped with a 5 mm broadband probe head and a variable temperature unit (VTU). The standard pulse sequence for proton NMR acquisition was used to apply pulses of radio frequencies (56,320 cycles) that systematically vary by 90° the phase of pulses (0, 270°, 270°, 0°, 90°, 180°, 180°, 90°). Each cycle was a rectangular radiofrequency with a gated pulse width of 0.43 μs followed by a delay time of 4.3 s. All experiments were performed at the temperature of 293 K controlled by a unit of the VTU of the NMR spectrometer. After finishing the experiment, the NMR tube was recovered from the magnet, and the capillary pipettes were carefully extracted from the NMR tube. All crystals were immediately mounted and flash-cooled for X-ray data collection.

3.4. X-ray Data Diffraction and Data Processing

Once the protein crystals were harvested from the solution or from the gel, they were cryo-protected for X-ray data collection. For lysozyme, a mixture of 30% (v/v) glycerol or PEG-1000 with mother liquor of NaCl (precipitating agent) can be used as cryo-protectant. The control crystals grown from the solution reached dimensions of 0.25 × 0.25 × 0.25 mm after three days, while crystals grown in gel reached 0.35 × 0.35 × 0.35 mm in about the same time. X-ray diffraction datasets were collected using the in-house Rigaku/MSC Micromax-007 HF diffractometer, with a rotating anode generator and a DECTRIS-PILATUS 3R/200K-A detector, under cryogenic conditions at 100 K. The crystal-to-detector distance was 40 mm, and 2θ was set to get maximum resolution. Data collection strategies included high redundancy data and each sample was rotated about its omega axis in 0.25° increments. The HKL3000 suite [47] was used to process, merge and scale all datasets.
Initial phases for all the tetragonal (P43212) lysozyme crystals were determined by the molecular replacement method with the program MOLREP [48] (in HKL-3000), using the atomic coordinates of hen egg-white lysozyme determined at a resolution of 1.45 Å (PDB 5T3F), after ligands, alternative conformations, hetero atoms and water molecules were removed. The initial molecular replacement was done at 3.0 Å and rigid-body refinement was performed at the 1.7 Å [49]. Map inspection and model building were done with Coot [50] and the resulting models were refined with Refmac (CCP4) [49] against the full dataset up to the maximum resolution for each crystal. The asymmetric unit of the tetragonal space group P43212 was composed of one chain. The stereochemistry of the structures was checked with PROCHECK [51] and the Ramachandran plot. The processing, scaling and final structures statistics are given in Table 1. Figure 6A–D were produced using the program PyMOL [52].

4. Conclusions

Though crystals grown in gels are usually of a very high quality, unfortunately the agarose cannot be polymerized in the presence of polyethylenglycols (PEGs), which is a major issue as PEGs are a popular precipitating agent for obtaining high-quality crystals. An alternative possibility is the use of magnetic fields with pulses inside to induce the nucleation. Although these types of experiments could give us very good results, they are very expensive to perform. The experiment using AC in solution in a pulse-wave mode is a practical way for obtaining high-quality protein crystals in solution using a variety of precipitating agents without any limitations. Our next research will be focused on the application of this procedure to different types of proteins with different space groups at different crystallization conditions.
Based on these results, we can finally conclude, that the fourth type of pulse wave called “breathing wave”, was the most promising one for producing high-quality single crystals in solution (as shown in the X-ray crystallographic analysis). However, further experiments applying this procedure to a variety of proteins from soluble to membrane proteins, need to be performed.

Acknowledgments

One of the authors (Abel Moreno) acknowledges the support of DGAPA UNAM project PAPIIT No. IT200215 for this research. Adela Rodriguez-Romero acknowledges the support of CONACYT (Grant 221169). Carina Pareja-Rivera acknowledges the sponsorship by Sistema Nacional de Investigadores (SNI) CONACYT by the scholarship as an assistant of researcher level 3. All authors acknowledge LANEM-IQ UNAM for the X-ray facilities and data collection help to Ms. Georgina Espinosa. This study made use of UNAM’s NMR Lab: LURMN at IQ-UNAM, which is funded by CONACYT Mexico (Project: 0224747). Abel Moreno acknowledges Antonia Sanchez for the English revision of this manuscript.

Author Contributions

Adela Rodriguez-Romero analyzed the crystallographic data; Carina Pareja-Rivera performed the experiments and the analyses of crystal size; Nuria Esturau-Escofet contributed with NMR facilities and the idea of applying pulses; Adela Rodriguez-Romero and Abel Moreno conceived and designed the experiments as well as wrote the manuscript.

Conflicts of Interest

The authors declare no conflict of interest. Additionally, we state that “The founding sponsors had no role in the design of the study; in the collection, analyses, or interpretation of data; in the writing of the manuscript, and in the decision to publish the results”.

References

  1. Niimura, N.; Bau, R. Neutron protein crystallography: Beyond the folding structure of biological macromolecules. Acta Crystallogr. A 2008, 64, 12–22. [Google Scholar] [CrossRef] [PubMed]
  2. Blakeley, M.P.; Langan, P.; Niimura, N.; Podjarny, A. Neutron crystallography: Opportunities, challenges, and 
limitations. Curr. Opin. Struct. Biol. 2008, 18, 593–600. [Google Scholar] [CrossRef] [PubMed]
  3. Myles, D.A.A.; Dauvergne, F.; Blakeley, M.P.; Meilleur, F. Neutron protein crystallography at ultra-low (<15 k) temperatures. J. Appl. Cryst. 2012, 45, 686–692. [Google Scholar] [CrossRef]
  4. Yokoyama, T.; Ostermann, A.; Mizuguchi, M.; Niimura, N.; Schader, T.E.; Tanaka, I. Crystallization and preliminary neutron diffraction experiment of human farnesyl pyrophosphate synthase complexed with risedronate. Acta Crystallogr. F Struct. Biol. Commun. 2014, 70, 470–472. [Google Scholar] [CrossRef] [PubMed]
  5. Blakeley, M.P.; Hasnain, S.S.; Antonyuk, S.V. Sub-atomic resolution X-ray crystallography and neutron crystallography: Promise, challenges and potential. IUCrJ 2015, 2, 464–474. [Google Scholar] [CrossRef] [PubMed]
  6. Baxter, E.L.; Aguila, L.; Alonso-Mori, R.; Barnes, C.O.; Bonagura, C.A.; Brehmer, W.; Brunger, A.T.; Calero, G.; Caradoc-Davis, T.T.; Chaterjee, R.; et al. High-density grids for efficient data collection from multiple crystals. Acta Crystallogr. D Struct. Biol. 2016, 72, 2–11. [Google Scholar] [CrossRef] [PubMed]
  7. Cohen, A.E.; Soltis, S.M.; González, A.; Aguila, L.; Alonso-Mori, R.; Barnes, C.O.; Baxter, E.L.; Brehmer, W.; Brewster, A.S.; Brunger, A.T.; et al. Goniometer-based femtosecond crystallography with X-ray free electron lasers. Proc. Natl. Acad. Sci. USA 2014, 111, 17122–17127. [Google Scholar] [CrossRef] [PubMed]
  8. Calero, G.; Cohen, A.E.; Luft, J.R.; Newman, J.; Snell, E.H. Identifying, studying and making good use of macromolecular crystals. Acta Crystallogr. F Struct. Biol. Commun. 2014, 70, 993–1008. [Google Scholar] [CrossRef] [PubMed]
  9. Boutet, S.; Lomb, L.; Williams, G.J.; Barends, T.R.M.; Aquil, A.; Doak, R.B.; Weierstall, U.; DePonte, D.P.; Steinbrener, J.; Shoeman, R.L.; et al. High-Resolution Protein Structure Determination by Serial Femtosecond Crystallography. Science 2012, 337, 362–364. [Google Scholar] [CrossRef] [PubMed]
  10. Hunter, M.S.; Fromme, P. Toward structure determination using membrane-protein nanocrystals and microcrystals. Methods 2011, 55, 387–404. [Google Scholar] [CrossRef] [PubMed]
  11. Fromme, R.; Ishchenko, A.; Metz, M.; Chowdhury, S.R.; Basu, S.; Boutet, S.; Fromme, P.; White, T.A.; Barty, A.; Spence, J.C.H. Serial femtosecond crystallography of soluble proteins in lipidic cubic phase. IUCrJ 2015, 2, 545–551. [Google Scholar] [CrossRef] [PubMed]
  12. Takayama, Y.; Inui, Y.; Sekiguchi, Y.; Kobayashi, A.; Oroguchi, T.; Yamamoto, M.; Matsunaga, S.; Nakasako, M. Coherent X-ray Diffraction Imaging of Chloroplasts from Cyanidioschyzon merolae by Using X-ray Free Electron Laser. Plant Cell Physiol. 2015, 56, 1272–1286. [Google Scholar] [CrossRef] [PubMed]
  13. Sazaki, G.; Yoshida, E.; Komatsu, H.; Nakada, T.; Miyashita, S.; Watanabe, K. Effects of a magnetic field on the nucleation and growth of protein crystals. J. Cryst. Growth 1997, 173, 231–234. [Google Scholar] [CrossRef]
  14. Wakayama, N.I. Effects of a Strong Magnetic Field on Protein Crystal Growth. Cryst. Growth Des. 2003, 3, 17–24. [Google Scholar] [CrossRef]
  15. Yin, D.-C. Protein crystallization in a magnetic field. Prog. Cryst. Growth Charact. Mater. 2015, 61, 1–26. [Google Scholar] [CrossRef]
  16. Pareja-Rivera, C.; Cuéllar-Cruz, M.; Esturau-Escofet, N.; Demitri, N.; Polentarutti, M.; Stojanoff, V.; Moreno, A. Recent advances in the Understanding of the Influence of Electric and Magnetic Fields on Protein Crystal Growth. Cryst. Growth Des. 2017, 17, 135–145. [Google Scholar] [CrossRef]
  17. Yan, E.K.; Zhang, C.Y.; He, J.; Yin, D.-C. An Overview of Hardware for Protein Crystallization in a Magnetic Field. Int. J. Mol. Sci. 2016, 17, E1906. [Google Scholar] [CrossRef] [PubMed]
  18. Gavira, J.A.; García-Ruiz, J.M. Effects of a Magnetic Field on Lysozyme Crystal Nucleation and Growth in a Diffusive Environment. Cryst. Growth Des. 2009, 9, 2610–2615. [Google Scholar] [CrossRef]
  19. Hammadi, Z.; Veesler, S. New approaches on crystallization under electric fields. Prog. Biophys. Mol. Biol. 2009, 101, 38–44. [Google Scholar] [CrossRef] [PubMed]
  20. Koizumi, H.; Uda, S.; Fujiwara, K.; Tachibana, M.; Kojima, K.; Nozawa, J. Crystallization of high-quality protein crystals using an external electric field. J. Appl. Cryst. 2015, 48, 1507–1513. [Google Scholar] [CrossRef]
  21. Sazaki, G.; Moreno, A.; Nakajima, K. Novel coupling effects of the magnetic and electric fields on protein crystallization. J. Cryst. Growth 2004, 262, 499–502. [Google Scholar] [CrossRef]
  22. Gil-Alvaradejo, G.; Ruiz-Arellano, R.R.; Owen, C.; Rodríguez-Romero, A.; Rudiño-Piñera, E.; Antwi, M.K.; Stojanoff, V.; Moreno, A. Novel Protein Crystal Growth Electrochemical Cell For Applications In X-ray Diffraction and Atomic Force Microscopy. Cryst. Growth Des. 2011, 11, 3917–3922. [Google Scholar] [CrossRef]
  23. Nieto-Mendoza, E.; Frontana-Uribe, B.A.; Sazaki, G.; Moreno, A. Investigations on electromigration phenomena for protein crystallization using crystal growth cells with multiple electrodes: Effect of the potential control. J. Cryst. Growth 2005, 275, e1437–e1446. [Google Scholar] [CrossRef]
  24. Frontana-Uribe, B.A.; Moreno, A. On Electrochemically Assisted Protein Crystallization and Related Methods. Cryst. Growth Des. 2008, 8, 4194–4199. [Google Scholar] [CrossRef]
  25. Pérez, Y.; Eid, D.; Acosta, F.; Marin-Garcia, L.; Jakoncic, J.; Stojanoff, V.; Frontana-Uribe, B.A.; Moreno, A. Electrochemically Assisted Protein Crystallization of Commercial Cytochrome c without Previous Purification. Cryst. Growth Des. 2008, 8, 2493–2496. [Google Scholar] [CrossRef]
  26. Koizumi, H.; Uda, S.; Fujiwara, K.; Nozawa, J. Control of Effect on the Nucleation Rate for Hen Egg White Lysozyme Crystals under Application of an External AC Electric Field. Langmuir 2011, 27, 8333–8338. [Google Scholar] [CrossRef] [PubMed]
  27. Flores-Hernandez, E.; Stojanoff, V.; Arreguin-Espinosa, R.; Moreno, A.; Sanchez-Puig, N. An electrically assisted device for protein crystallization in a vapor-diffusion setup. J. Appl. Crystallogr. 2013, 46, 832–834. [Google Scholar] [CrossRef] [PubMed]
  28. Koizumi, H.; Uda, S.; Fujiwara, K.; Tachibana, M.; Kojima, K.; Nozawa, J. Improvement of crystal quality for tetragonal hen egg white lysozyme crystals under application of an external alternating current electric field. J. Appl. Crystallogr. 2013, 46, 25–29. [Google Scholar] [CrossRef]
  29. Uda, S.; Koizumi, H.; Nozawa, J.; Fujiwara, K. Crystal Growth under External Electric Fields. In Proceedings of the 2014 International Conference of Computational Methods in Sciences and Engineering (ICCMSE 2014), Athens, Greece, 4–7 April 2014; Volume 1618, pp. 261–264. [Google Scholar]
  30. De la Mora, E.; Flores-Hernandez, E.; Jakoncic, J.; Stojanoff, V.; Siliqi, D.; Sanchez-Puig, N.; Moreno, A. SdsA polymorph isolation and improvement of their crystal quality using nonconventional crystallization techniques. J. Appl. Crystallogr. 2015, 48, 1551–1559. [Google Scholar] [CrossRef]
  31. Nanev, C.N.; Penkova, A. Nucleation of lysozyme crystals under external electric and ultrasonic fields. J. Cryst. Growth 2001, 232, 285–293. [Google Scholar] [CrossRef]
  32. Nanev, C.N.; Penkova, A. Nucleation and growth of lysozyme crystals under external electric field. Coll. Surf. A Physicochem. Eng. Asp. 2002, 209, 139–145. [Google Scholar] [CrossRef]
  33. Penkova, A.; Gliko, O.; Dimitrov, I.L.; Hodjaoglu, F.V.; Nanev, C.; Vekilov, P.G. Enhancement and suppression of protein crystal nucleation due to electrically driven convection. J. Cryst. Growth 2005, 275, e1527–e1532. [Google Scholar] [CrossRef]
  34. Taleb, M.; Didierjean, C.; Jelsch, C.; Mangeot, J.P.; Capelle, B.; Aubry, A. Crystallization of proteins under an external electric field. J. Cryst. Growth 1999, 200, 575–582. [Google Scholar] [CrossRef]
  35. Taleb, M.; Didierjean, C.; Jelsch, C.; Mangeot, J.P.; Aubry, A. Equilibrium kinetics of lysozyme crystallization under an external electric field. J. Cryst. Growth 2001, 232, 250–255. [Google Scholar] [CrossRef]
  36. Yoshikawa, H.Y.; Murai, R.; Sugiyama, S.; Sazaki, G.; Kitatani, T.; Takahashi, Y.; Adachi, H.; Matsumura, H.; Murakami, S.; Inoue, T.; et al. Femtosecond laser-induced nucleation of protein in agarose gel. J. Cryst. Growth 2009, 311, 956–959. [Google Scholar] [CrossRef]
  37. Yoshikawa, H.Y.; Murai, R.; Adachi, H.; Sugiyama, S.; Maruyama, M.; Takahashi, Y.; Takano, K.; Matsumura, H.; Inoue, T.; Murakami, S.; et al. Laser ablation for protein crystal nucleation and seeding. Chem. Soc. Rev. 2014, 43, 2147–2158. [Google Scholar] [CrossRef] [PubMed]
  38. Gavira, J.A.; Garcia-Ruiz, J.M. Agarose as crystallisation media for proteins II: Trapping of gel fibres into the crystals. Acta Crystallogr. D Biol. Crystallogr. 2002, D58, 1653–1656. [Google Scholar] [CrossRef]
  39. Charron, C.; Robert, M.C.; Capelle, B.; Kadri, A.; Jenner, G.; Giegé, R.; Lorber, B. X-ray diffraction properties of protein crystals prepared in agarose gel under hydrostatic pressure. J. Cryst. Growth 2002, 245, 321–333. [Google Scholar] [CrossRef]
  40. Sauter, C.; Balg, C.; Moreno, A.; Dhouib, K.; Theobald-Dietrich, A.; Chenevert, R.; Giege, R.; Lorber, B. Agarose gel facilitates enzyme crystal soaking with a ligand analog. J. Appl. Crystallogr. 2009, 42, 279–283. [Google Scholar] [CrossRef]
  41. Gonzalez-Ramirez, L.A.; Caballero, A.G.; Garcia-Ruiz, J.M. Investigation of the Compatibility of Gels with Precipitating Agents and Detergents in Protein Crystallization Experiments. Cryst. Growth Des. 2008, 8, 4291–4296. [Google Scholar] [CrossRef]
  42. Gavira, J.A.; Van Driessche, A.E.S.; Garcia-Ruiz, J.M. Growth of Ultrastable Protein-Silica Composite Crystals. Cryst. Growth Des. 2013, 13, 2522–2529. [Google Scholar] [CrossRef]
  43. Choquesillo-Lazarte, D.; Garcia-Ruiz, J.M. Poly (ethylene) oxide for small-molecule crystal growth in gelled organic solvents. J. Appl. Crystallogr. 2011, 44, 172–176. [Google Scholar] [CrossRef]
  44. Pietras, Z.; Lin, H.-T.; Surade, S.; Luisi, B.; Slattery, O.; Pos, K.M.; Moreno, A. The use of novel organic gels and hydrogels in protein crystallization. J. Appl. Crystallogr. 2010, 43, 58–63. [Google Scholar] [CrossRef]
  45. Chayen, N.E.; Saridakis, E. Protein crystallization: From purified protein to diffraction-quality crystal. Nat. Methods 2008, 5, 147–153. [Google Scholar] [CrossRef] [PubMed]
  46. Saijo, Sh.; Yamada, Y.; Sato, T.; Tanaka, N.; Matsui, T.; Sazaki, G.; N.akajima, K.; Matsuura, Y. Structural consequences of the hen egg-white lysozyme orthorhombic crystal growth in a high magnetic field: Validation of X-ray diffraction intensity, conformational energy searching and quantitative analysis of B factors and mosaicity. Acta Crystallogr. D Biol. Crystallogr. 2005, D61, 207–217. [Google Scholar] [CrossRef] [PubMed]
  47. Minor, W.; Cymborowski, M.; Otwinowski, Z.; Chruszcz, M. HKL-3000: The integration of data reduction and structure solution-from diffraction images to an initial model in minutes. Acta Crystallogr. D Biol. Crystallogr. 2006, D62, 859–866. [Google Scholar] [CrossRef] [PubMed]
  48. Vagin, A.; Teplyakov, A. Molecular replacement with MOLREP. Acta Crystallogr. 2010, D66, 22–25. [Google Scholar]
  49. Mushudov, G.N.; Vagin, A.A.; Dodson, E.J. Refinement of macromolecular structures by the maximum-likelihood method. Acta Crystallogr. D Biol. Crystallogr. 1997, D53, 240–255. [Google Scholar] [CrossRef] [PubMed]
  50. Emsley, P.; Cowtan, K. Coot: Model-building tools for molecular graphics. Acta Crystallogr. D Biol. Crystallogr. 2004, 60, 2126–2132. [Google Scholar] [CrossRef] [PubMed]
  51. Laskowski, R.A.; MacArthur, M.W.; Thornton, J.M. PROCHECK: Validation of protein structure coordinates. In International Tables of Crystallography, Volume F. Crystallography of Biological Macromolecules; Rossmann, M.G., Arnold, E., Eds.; Kluwer Academic Publishers: Dordrecht, The Netherlands, 2001; pp. 722–725. [Google Scholar]
  52. De Lano, W.L. The PyMOL Molecular Graphics System; DeLano Scientific LLC: San Carlos, CA, USA, 2002. [Google Scholar]
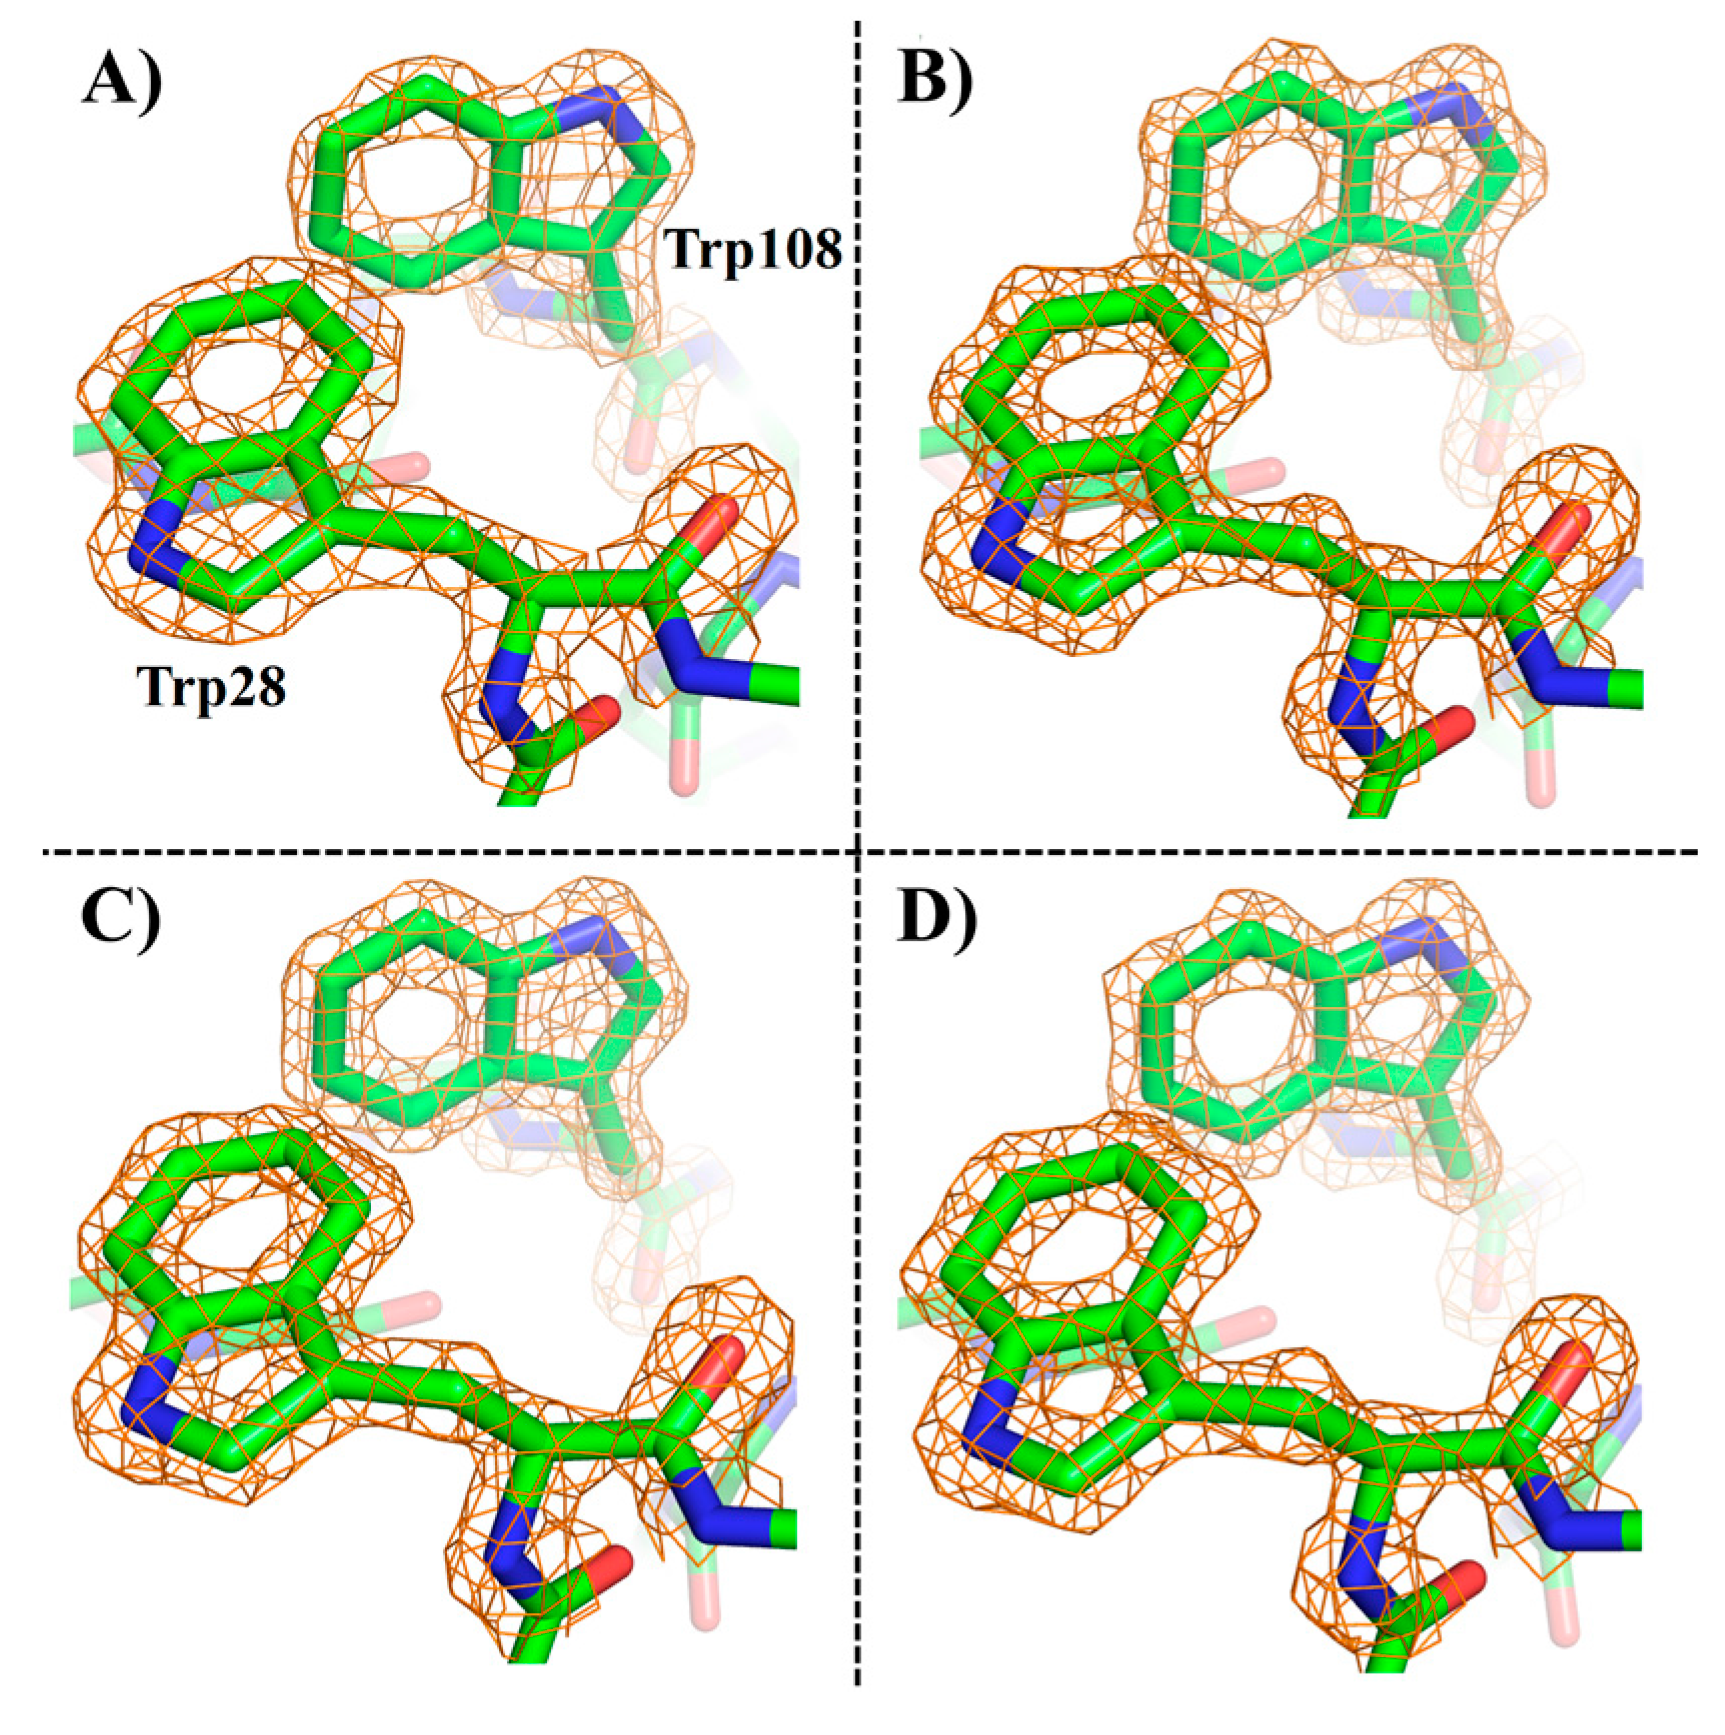
Figure 1. The growth cell (1) and the setup used along these experiments for the electric field approach (2,3) up to the 3D structure by X-ray crystallography (4). The electrodes are made of Indium Tin Oxide (ITO) glass. The electron density maps (2Fo-Fc) of the best crystals at a contour level of 1σ is shown after X-ray crystallographic analysis.
Crystals 07 00179 g001
Figure 2. Four types of pulse waves were tested (AD) as shown underneath each picture. The last pulse wave, where better crystals are obtained, is called breathing pulse wave.
Crystals 07 00179 g002aCrystals 07 00179 g002b
Figure 3. The pulse (P) wave number corresponds to the type of wave-pulse (I to IV mentioned in the text). This shows the number of crystals attached to the anode (A) or to the cathode (C).
Crystals 07 00179 g003
Figure 4. The crystals size is plotted versus type of pulse (which corresponds to type I to IV in the text) on the surface of the electrode, where the smallest number of crystals were observed.
Crystals 07 00179 g004
Figure 5. Experimental setup for the crystal growth in gels under the influence of magnetic field of 16.5 Tesla applying radio frequency pulses. The numbers represent the sequence of experiments (14) until obtaining the 3D structure (5). The capillary tube between (3) and (4) is 1 mm in diameter. The 3D structure shown after (5) is the electron density maps (2Fo-Fc) of the best crystals at a contour level of 1σ. This selected area comprises tryptophan residues (Trp 28 and 108) showing the crystal quality.
Crystals 07 00179 g005
Figure 6. Comparison of electron density maps (2Fo-Fc) of the best crystals at a contour level of 1σ. This selected area is for side chains of tryptophan residues (Trp 28 and 108) showing the crystal quality: (A) control crystals in solution; (B) breathing pulse wave (pulse number 4, see the text); (C) crystal growth in gel (control); and (D) crystals grown in gel and magnetic field with radio frequencies pulses.
Crystals 07 00179 g006
Table 1. Data collection and refinement statistics of the best crystals obtained by using these methods compared with controls.
Control (Solution)Control (gel)Lys-Gel (16.5 Tesla)Lys2HzP2 (Figure 2B)Lys2HzP3 (Figure 2C)Lys2HzP4 (Figure 2D)
Data collection and processing statistics
Wavelength (Å)1.541.541.541.541.541.54
Space groupP43212P43212P43212P43212P43212P43212
Unit-cell parameters (Å, °)a = 77.43a = 78.27a = 78.27a = 77.36a = 78.44a = 78.31
b = 77.43b = 78.27b = 78.27b = 77.36b = 78.44b = 78.31
c = 37.38c = 37.21c = 37.21c = 37.85c = 37.08c = 37.44
Reflections (unique)10,72119,48122,48218,16722,59625,225
Resolution limits (Å)24.5–1.8239.16–1.4939.22–1.3938.79–1.4939.25–1.3939.15–1.34
Completeness (%)99.9 (100.0)99.40 (90.0)99.40 (86.0)99.9 (99.9)99.9 (99.2)100 (99.7)
Rmerge (%)3.1 (12)4.1 (19)4.3 (19)4.4 (39)3.5 (20)3.4 (34)
I/σ(I)77 (4.5)76.8 (3.6)79 (3.1)68 (3.9)70 (5.2)72 (4.2)
Average multiplicity13.7 (4.0)15.1 (7.3)15.1 (7.3)14.6 (8.1)3.3 (3.1)14 (4.1)
B factor from Wilson plot (Å2)18.718.215.117.214.614.1
Refinement statistics
R/Rfree0.17/0.210.181/0.210.178/0.2170.172/0.2210.177/0.220.169/0.193
No. of protein atoms103210021032119710341199
No. of water molecules129127163190176181
No. of other atoms 31261219
R.m.s. deviations
Bonds lengths (Å)0.0170.0180.0180.0210.0170.014
Bonds angles (°)1.7441.9911.8901.9601.591.401
Average B factor (Å2)18.7020.0017.4321.2816.6015.70

