Phenomenological Consideration of Protein Crystal Nucleation; the Physics and Biochemistry behind the Phenomenon

Rostislaw Kaischew Institute of Physical Chemistry, Bulgarian Academy of Sciences, 1113 Sofia, Bulgaria
Crystals 2017, 7(7), 193; https://doi.org/10.3390/cryst7070193
Submission received: 23 May 2017
/
Revised: 19 June 2017
/
Accepted: 21 June 2017
/
Published: 27 June 2017
(This article belongs to the Special Issue Biological and Biogenic Crystallization)
Abstract
:Physical and biochemical aspects of protein crystal nucleation can be distinguished in an appropriately designed experimental setting. From a physical perspective, the diminishing number of nucleation-active particles (and/or centers), and the appearance of nucleation exclusion zones, are two factors that act simultaneously and retard the initially fast heterogeneous nucleation, thus leading to a logistic time dependence of nuclei number density. Experimental data for protein crystal (and small-molecule droplet) nucleation are interpreted on this basis. Homogeneous nucleation considered from the same physical perspective reveals a difference—the nucleation exclusion zones lose significance as a nucleation decelerating factor when their overlapping starts. From that point on, a drop of overall system supersaturation becomes the sole decelerating factor. Despite the different scenarios of both heterogeneous and homogeneous nucleation, S-shaped time dependences of nuclei number densities are practically indistinguishable due to the exponential functions involved. The biochemically conditioned constraints imposed on the protein crystal nucleation are elucidated as well. They arise because of the highly inhomogeneous (patchy) protein molecule surface, which makes bond selection a requisite for protein crystal nucleation (and growth). Relatively simple experiments confirm this assumption.
1. Introduction
Biomolecule structures are essential when it comes to understanding the mechanisms of life and human genomes, and developing novel protein-based pharmaceuticals. The most powerful method for structure-function studies of biomolecules is X-ray diffraction (with complementary neutron diffraction) and Nuclear Magnetic Resonance, considered as an ancillary tool only. Both X-ray and neutron diffraction require well-diffracting crystals [1]. Growing such crystals of newly-expressed proteins is, however, the major obstacle in protein structure determination. There is no recipe for their growth. It is usually the trial-and-error approach that is applied. Despite the numerous state-of-the-art crystallization tools employed (such as robots, automation and miniaturization of crystallization trials, Dynamic Light Scattering, crystallization screening kits, etc.), researchers’ creativeness and acumen remain indispensable.
Protein crystal nucleation is a prerequisite for the crystal growth of newly-expressed proteins. However, there is no theory that could help predict adequately crystallization conditions. Quite often, the classical nucleation theory (CNT) is employed to give a (physical) rendition of protein crystal nucleation process. While providing a logical explanation of the fluctuation-based mechanism and the origin of nucleation barrier, CNT fails to predict correctly nucleation rates. In some cases, the deviations are of many orders of magnitude, e.g., [2]. In this work, applying microfluidics technologies, localized DC electric field, and gel crystallization, the authors studied the spatial and temporal location of the nucleation event. They used a confinement effect coupled to an external localized DC electric field to evoke a desired nucleation and growth of lysozyme crystals, in 20 mg/mL lysozyme, 0.7 M NaCl in agarose gel 1%.
A reason for the inadequacy between some experiments and the CNT could be the uncertainty in determining the energy of the interface arising between the new phase and the mother phase—interface energy variation of only 10% can alter the nucleation rate substantially because it depends exponentially on the nucleation energy barrier, which in turn is determined by the interface free energy in power three. The issue with CNT lies in the assumption that an emerging nucleus already has the order and density of the bulk crystal. The interface is described as a sharp surface with a specific (per unit area) free energy, usually not available from direct measurements. However, Wölk et al. [3] have shown that in cases for which CNT was devised originally, such as homogeneous nucleation of water droplets, a simple empirical modification to the CNT-nucleation rate (expressed by Becker–Doering formula) yields a robust function for predicting water nucleation rates over broad ranges of temperature and supersaturation.
The so-called two-step nucleation mechanism (TSNM) denies the simultaneous densification and ordering during a single nucleation event. While preserving the CNT basic concept for a fluctuation-based nucleation mechanism, TSNM assumes nucleation initiation via an intermediate condensed liquid appearing in the bulk solution. Being only densified, the intermediate phase preserves some similarity to the mother phase. Therefore, the phase-transition energy barrier is lowered bellow the one needed for direct transition mother-phase-to-crystal occurring via the CNT mechanism. The second step in TSNM is the formation of crystal nuclei inside the highly-concentrated regions. Thus, TSNM resembles the Ostwald’s rule of stages, which stipulates that a thermodynamically less-stable phase appears first, then a polymorphic transition toward a stable phase occurs. Ten Wolde and Frenkel [4] have predicted theoretically the existence of amorphous precursors that have been further confirmed experimentally by Vivares et al. [5], Sauter et al. [6], and Schubert et al. [7]. Sleutel and Van Driessche [8] have observed a non-classical nucleation for the 3D liquid-to-crystal transition of glucose isomerase—local increase in density and crystallinity do not occur simultaneously, but rather sequentially. They have demonstrated that at high concentrations (~100 mg/mL), glucose isomerase can form mesoscopic liquid-like aggregates (the molecules in them retain enough mobility), which are potential precursors of crystalline clusters. These aggregates are stable with respect to the parent liquid, and metastable compared with the crystalline phase. In contrast, glucose isomerase 2D crystal nucleation proceeds classically [9] and they proved the existence of a critical crystal size. They also observed that the interior of all clusters is in the crystalline state and the cluster dynamics are determined by single molecular attachment and detachment events. Whitelam presents a molecular model designed to study crystallization in the presence and absence of amorphous intermediates [10]. Based on computer simulation, he suggests tuning the relative strengths of the specific and nonspecific interactions. Thus, the relative efficiencies of the various pathways leading towards the final crystalline state have been studied. Most recently, direct transition electron microscopic observations of Yamazaki et al. [11] have suggested a significant departure from the initial TSNM assumption. The authors have never observed formation of crystalline phases inside amorphous solid particles consisting of lysozyme molecules, which are like those previously assumed to consist of a dense liquid.
Although governed by physical laws established previously for small molecule crystallization, protein crystal nucleation is an extremely complex process. The complexity arises from the subtle interplay between process physics and biochemistry. It is the large size of the protein molecules and their highly inhomogeneous and patchy surface [12] that make the molecular-kinetic mechanism of protein crystal nucleation so specific. Protein crystal nucleation rate is reduced by a biochemical constraint associated with the strict selection of crystalline bonds. Based on experiments, this paper differentiates physical from biochemical protein crystal nucleation aspects.
2. Results and Discussion
2.1. Experimental Results
Any attempt to formulate accurate predictions by amending and overcoming CNT limitations should rest upon interpretation of some basic experimental observations. For instance, experimental data show that nuclei number density (n) of a new phase (crystals, droplets) depends simultaneously on both time (t) and supersaturation (Δμ), i.e., n = n(t, Δμ). S-shaped dependences of n vs. t at constant supersaturation have been known to cause electrochemical new-phase nucleation for a long time e.g., [13,14]. But they remained unelucidated [15] until recently, when it was shown that they obey logistic functional dependence [16]. The same function also governs insulin crystal nucleation—large amounts of data for which can be found in [17]. Using custom-made quasi-two-dimensional all-glass cells with intentionally introduced air bubbles, n vs. t dependences were measured in this study simultaneously at four typical places: in solution bulk, at the glass support, at the air/solution interface, and at the three-phase boundary solution/glass/air. Stationary nucleation rates were determined from the linear parts of the corresponding plots, and energy barriers for nucleus formation and nucleus sizes were estimated. By simply focusing the microscope on the upper glass plate of the cell, heterogeneous on-glass crystal nucleation is differentiated from the one in the bulk solution. It is also argued that the latter proceeds heterogeneously, on some (unknown) foreign particles of biological origin. Seven different supersaturations have been studied with BioChemika-insulin, showing that crystal nucleation in bulk solution prevails greatly [17].
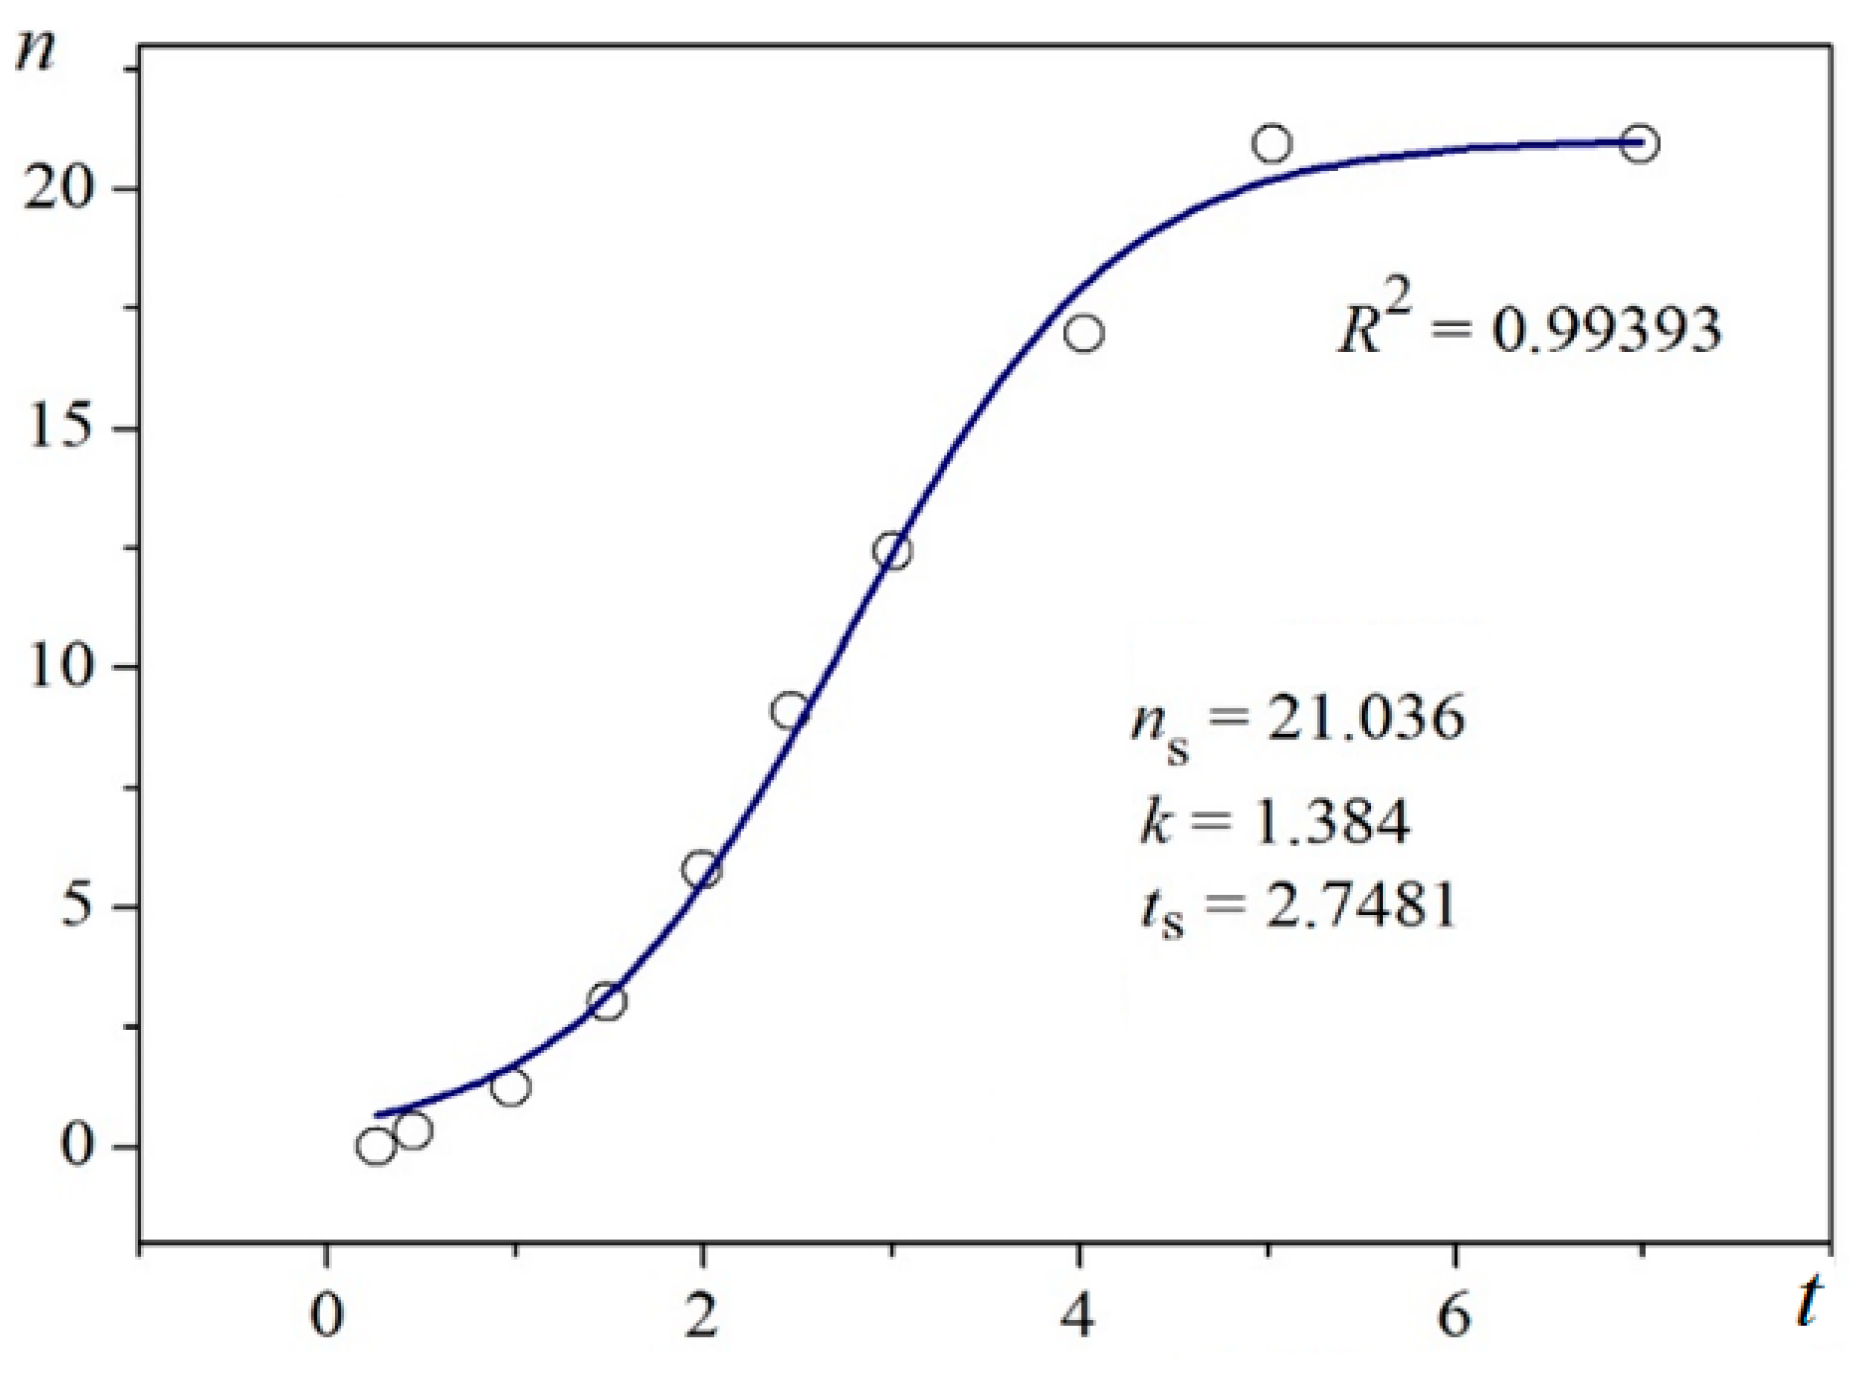
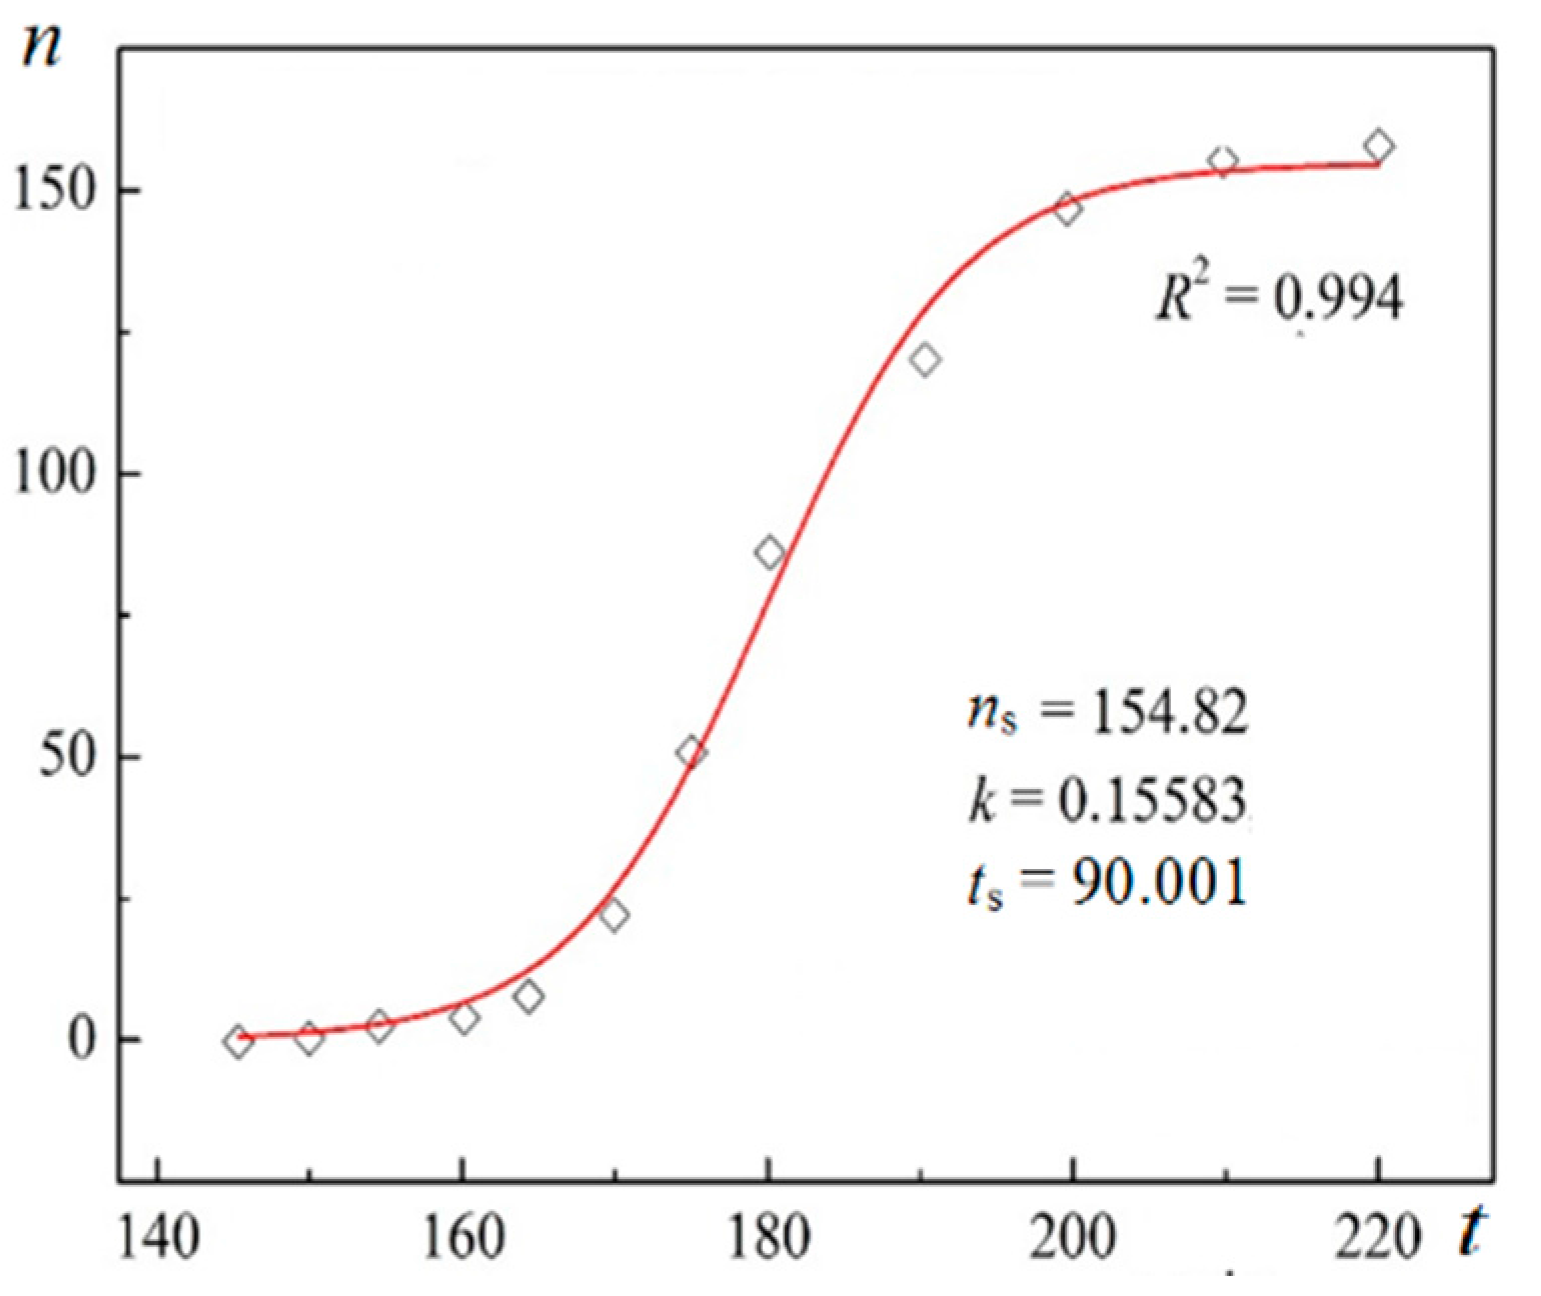
Using digitalized original experimental data from [14,18], logistic dependences (with very high goodness of fit, R2) are presented in Figure 1 and Figure 2. Such time dependence has also been established for bovine β-lactoglobulin crystal nucleation which proceeds by a TSNM [6]. Good logistic fits of insulin crystal nucleation data for seven different supersaturations are shown in Figure 3, where appropriate (supersaturation dependent) parameters are used. The relations, showing the degrees to which saturated crystal-nuclei number densities (ns) are neared, (n/ns), are plotted vs. t/tp (using Equation (2); here tp is the time for reaching ns; tp = 2tc, and tc is the time when the half of ns is reached (namely the mid-point of the corresponding sinusoid). Plots in Figure 4a are for bulk insulin crystal nucleation, and in Figure 4b—for on-glass crystal nucleation. This issue will be considered below.
In conclusion, being common for both small inorganic molecules and large bio-molecules, the S-shaped dependences of nuclei number densities on time underline a common physical aspect of the nucleation processes.
2.2. Logistic Time Dependence of Protein and Small Molecule Crystal Nucleation
The fluctuation-based concept of CNT supposes that a new distribution of larger clusters starts replacing the equilibrium one immediately after establishing supersaturation in the system. Since the larger the cluster is, the longer it takes for it to emerge, the critically sized cluster should appear the latest. Importantly, the nucleus is the cluster of maximum energy and minimum concentration. Therefore, many subcritical clusters, smaller than the critical nucleus by a single molecule only, are formed in the meantime. However, the rearrangement of cluster size distribution does not end with the emergence of the very first critical cluster. Accommodation of the supersaturated system state continues gradually, leading to an enhanced supply of nuclei. Thus, the nucleation rate increases throughout the initial non-steady-state nucleation period.
As per definition, the momentary nucleation rate (dn/dt) during the initial non-steady-state nucleation period, i.e., the rate at any point of the n vs. t graph, is given by the number (n) of nuclei formed in a unit volume (1 cm3) divided by the (infinitesimally short) nucleation time (t). Denoting the frequency of molecule attachments leading to formation of nuclei by k (s−1), gives dn/dt = kn. Here, the attachment frequency k is defined as the frequency of molecule attachments to clusters which are smaller than the critical nucleus by a single molecule, minus the frequency of molecule detachments.
The attachment frequency k depends on supersaturation, which, however, remains constant during the whole nucleation process. The reason is that the extremely small nucleus volume (typically about 10−19 cm3) and nucleation per se does not change the overall supersaturation—even during the most intensive nucleation (e.g., n approaching 106 cm−3). Thus, beginning with a single nucleus, the nucleation process advances in an exponential manner with time. Nonetheless, no unlimited nuclei augmentation is physically feasible. Experimental results show that after a rapid initial increase, the nucleation process gradually decelerates to an almost constant nucleation rate up to reaching saturated nuclei number densities (ns) in the plateau regions of the n vs. t dependences (Figure 3). Nucleation rate changes have been attributed [16] to two retardation factors acting simultaneously for heterogeneous nucleation (different for homogeneous nucleation).
A basic assumption of CNT is the supposition of continuous cluster size changes, which is a good approximation to reality only for large critical clusters. The consideration presented here does not suffer from such a limitation—irrespective of the mechanism involved, either CNT or TSNM, it is capable of accounting for discrete cluster size changes as well.
2.2.1. Heterogeneous Nucleation
During solution crystallization, heterogeneous nucleation is the pervasive process. It is the energy barrier that makes it the preferred nucleation process—heterogeneous nucleation energy barrier is only a fraction of the energy barrier of homogenous nucleation. Two nucleation retardation factors acting simultaneously during heterogeneous nucleation have been anticipated in [16]: (1) occupation of nucleation-active particles and/or centers (generally known as nucleants), associated with the nucleation process itself; and (2) appearance of nucleation exclusion zones (NEZ) formed around growing nuclei. NEZ gradually engulf some of the active nucleants, such that are situated close enough to the formed nuclei, lie in the arising NEZ and are deactivated. This process starts soon after nucleation onset. However, as seen, NEZ do not change the overall system supersaturation.
Accounting for the two retardation factors acting in parallel, and under constant supersaturation, the rate of new-phase heterogeneous nucleation (dn/dt) is expressed by the following single first-order non-linear ordinary differential equation [16]:
Depending on the k-values, nucleation processes can be categorized into the following groups: (1) fast kinetics, e.g., electrochemical nucleation, characterized by very large k-values (of orders 103 to 104 (s−1)); (2) slow kinetics, e.g., protein crystal nucleation (insulin, bovine β-lactoglobulin), k-values of order 10−3 to 10−4 (s−1); and (3) extremely slow kinetics, e.g., crystallization of cordierite glass, k ≈ 10−5 (s−1); see in [16].
Integration of Equation (1) gives [16]:
n/ns = 1/[1 + exp[(−k(t − tc)]
In fact, Equation (1) is a special case of Bernoulli differential equation. Substituting the dimensionless functions y(x) = n/ns and x = k(t − tc) in it, and with tc = const. we have:
dy/dx = (n/ns)[(ns − n)/ns] = y(x)[1 − y(x)]
The solution of Equation (3) is the standard logistic function:
y(x) = exp (x)/[exp (x) + C]
f (x) = e x e x + C {\displaystyle f(x) = {\frac {e^{x}}{e^{x} + C}}}
f (x) = e x e x + C {\displaystyle f(x) = {\frac {e^{x}}{e^{x} + C}}}
With constant of integration C = 1 {\displaystyle C = 1} C = 1, this gives the logistic curve definition: y(x) = exp (x)/[exp (x) + 1] = 1/[1 + exp (−x)], which is Equation (2).
Equation (1) shows that the maximum nucleation rate is reached when nucleation acceleration and deceleration tendencies equilibrate, at time tc, when n = ns/2:
which is the (quasi-)stationary nucleation rate, mentioned above.
(dn/dt)max = kns/4
Unambiguity of the Logistic Nucleation Time-Dependence
Figure 1 and Figure 2 exemplify the high goodness (R2 > 0.99) of logistic plots. Considered from a physical perspective (as presented above), the good fit of experimental n/ns vs. t/tc data for insulin crystal nucleation (Figure 4a,b) shows more stringently the logistic nucleation time-dependence. Firstly, recalling that n = ns when t = 2tc, x = k (t − tc) results in xns = ktc = const., this explains the self-adjustment between k and tc occurring for all supersaturations. Secondly, the (orange) logistic curves in Figure 4a,b result from the logistic equation with 2ktc = 10 (see the inserts in the figures). Hence, these are standard logistic functional plots with ±ktc = 5. Due to the function exponential nature, the standard logistic function obtains its real values in the range of x = ± 5 on both sides of its midpoint (Figure 5); in the case under consideration, the latter being at ns/2. It is logical to conclude that an x-value from −6 to −5 can be attributed to the so-called nucleation induction time.
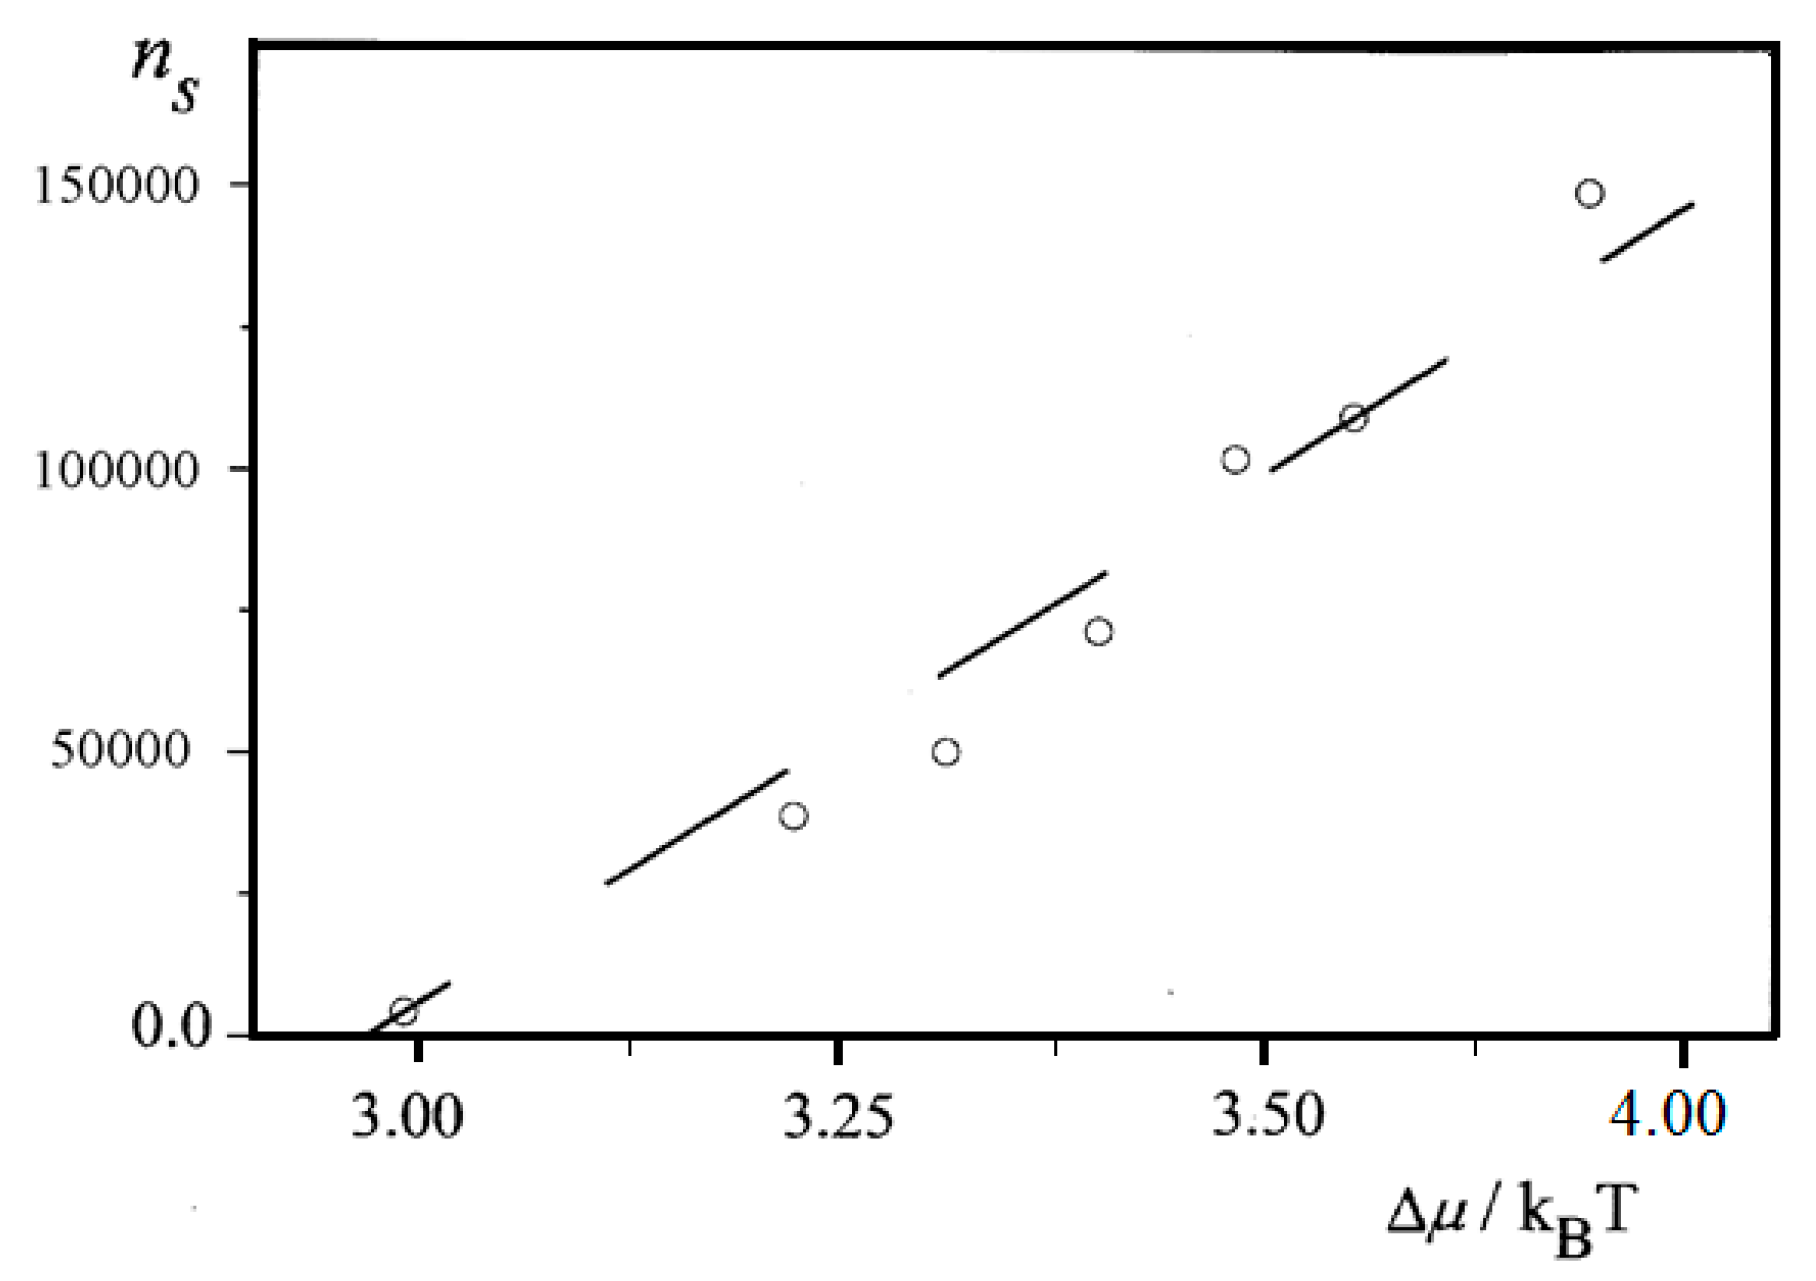
Further, an almost linear increase of ns on Δμ is observed for insulin (BioChemika, ≥85% (GE), ~24 IU/mg) crystal nucleation in bulk solution, Figure 6. However, it is highly improbable that sets of nucleants possessing nucleation-promoting abilities which correspond exactly to each supersaturation used are present. It is rather a situation where lesser nucleants are engulfed by NEZ (and thus, deactivated) at higher supersaturations.
2.2.2. Rate of Homogeneous Nucleation
Notwithstanding the substantially higher supersaturation required, homogeneous nucleation is indispensable in systems without nucleants. Removal of all nucleants from a protein solution is not an easy task, albeit achievable in the vapor phase. For instance, liquid droplets nucleate homogeneously by rapidly expanding and cooling exceptionally pure water vapors. An exponential increase in water droplet nucleation rate has been measured by means of different techniques [19]. However, homogeneous nucleation could also pose an issue because no unlimited nuclei augmentation is physically feasible. An evident obstacle for observing nucleation rate limits may be the uncountable number of the nucleated droplets. Additional experimental work is needed to compare nucleation rate measurement data to theoretical considerations. Until then, a theoretical approach to the issue is worth attempting.
Like the heterogeneous case, homogeneous nucleation should be a self-limiting process. Again, there are two factors decelerating it. The first one is like the one in heterogeneous nucleation, namely, increase in the number of NEZ appearing around some nuclei and diminishing the volume where nucleation can still occur. The second decelerating factor, namely, a drop in system’s overall supersaturation, is different. It is enacted only during prolonged nuclei growth and consumption of a noticeable molecule amount. Furthermore, while the two retardation factors act in parallel in a heterogeneous nucleation, in a homogeneous process they act consecutively, being interrupted by an intermediate period. This constitutes the substantial difference between both processes.
Effect of NEZ
As already mentioned (see Section 2.2), the overall supersaturation remains constant initially. Thus, the probability (n/α) for NEZ appearance, where α (s) is the time needed for the formation of the very first NEZ, also remains constant. The initial nucleation rate (dn/dt)init can be expressed as:
where K (s−1) ≠ k and K’ = K − 1/α are new coefficients.
(dn/dt)init = K’n
Preserving the exponential character during the initial nucleation stage, the graphical n vs. t track of the homogeneous nucleation is indistinguishable from the corresponding part of the heterogeneous nucleation curve. However, knowing that merely one decelerating factor is acting, the homogeneous n vs. t dependence should be steeper and relatively longer.
Effect of Decreasing Supersaturation
Increasing in number, soon or latter, the NEZ start overlapping. This indicates that the first nucleation decelerating factor is of no importance on the account of the second one—decrease in system’s overall supersaturation. Intermediately, new nuclei appear in the remaining interstitials between NEZ, but there is a substantial deceleration in the exponential increase of n. When Δμ decreases bellow the nucleation-limiting threshold, n vs. t dependence should reach a plateau, corresponding to a zero nucleation rate. Supersaturation dependence of nucleation rate is given by the well-known equation of Volmer. For the second homogeneous nucleation stage, it should be written as:
where A is a pre-exponential coefficient which denotes the number of nuclei that appear in a unit volume (1 cm3) per unit time (1 s); ΔG* is the thermodynamic energy barrier for nucleus formation; the constant B for homogeneously formed spherical nucleus is B = 16πΩ2γ3/3 (because ΔG* = 16πΩ2γ3/3Δμ2); and Ω is the volume of a crystal building block. Qualitatively, this behavior of the system gives a S-shaped dependence of n on time elapsed, t. However, despite the different scenarios involved in heterogeneous and homogeneous nucleation, the exponential functions make their S-shaped time dependent nuclei number densities indistinguishable.
(dn/dt)second = Aexp(−ΔG*/kBT) = Aexp(−B/Δμ2)
Equation (7) shows that a symmetric S-shape (logistic) curve may describe the homogeneous nucleation, only provided Δμ depends linearly on t, i.e., Δμ = −st, where −s is the line slope. Under constant temperature, however, supersaturation decrease results from nuclei growth itself, making the linear dependence physically infeasible. Since the new-phase particles nucleate at different time-points, they grow in different sizes and the size difference is amplified due to the Gibbs-Thomson effect [20]—smaller crystals grow slower than larger crystals; the reason being that the larger the crystal, the lower the saturation with which it stands in equilibrium. That is why, along with an increase in number, nucleated crystals accelerate their growth with the time and increase the rate of supersaturation depletion. In view of the extremely high sensitivity of (dn/dt)second on Δμ-value expressed by Equation (7), only the precise function of Δμ on t (but not its linear substitute) is meaningful. Thus, in contrast to the symmetric S-shaped (logistic) curve describing heterogeneous nucleation, a non-symmetric S-shaped curve should describe the n vs. t dependence for homogeneous nucleation.
2.3. Biochemical Specificity of the Protein Crystal Nucleation
In proteins, it is only the molecule surface structure that dictates protein ability to bind to partners. This is attributed to the molecular interactions in protein bulk concealed under amino acid residues situated on the molecular surface. Because of millions of years of natural selection, physiological protein-protein bonds are highly specific. Proteins operate within the cellular context with typical concentrations of up to 300 mg/mL. Therefore, any non-specific inter-protein interaction may be fatal. It is known that physiological protein-protein bonds result from strong hydrophobic interactions via which contacting areas occupy relatively large portions on the protein molecule surface.
In contrast, the protein crystal lattice contacts are hydrophilic, polar and smaller in size [21]. Yet again, it is only the molecular surface structure that dictates proteins’ ability to bind to partners in a crystallization setting. In such a setting, a limited number of discrete patches, that are the only attractive molecule portions, appear on the protein surface. If supersaturation is extremely high, amorphous precipitation will occur even under crystallization conditions; such a disordered aggregation is a result of very strong hydrophobic protein-protein interactions. Therefore, it is logical to assume that attraction strength between crystallizing protein molecules should be fine-tuned. Attraction should be large enough to promote crystallization, while not being too large to provoke amorphous precipitation. This means that also protein crystal lattice contacts are formed by a selection of the most appropriate patches on the protein molecule surface. Selection preferences have been revealed using X-ray diffraction data for protein crystal lattice contacts available in Protein Data Bank [21,22].
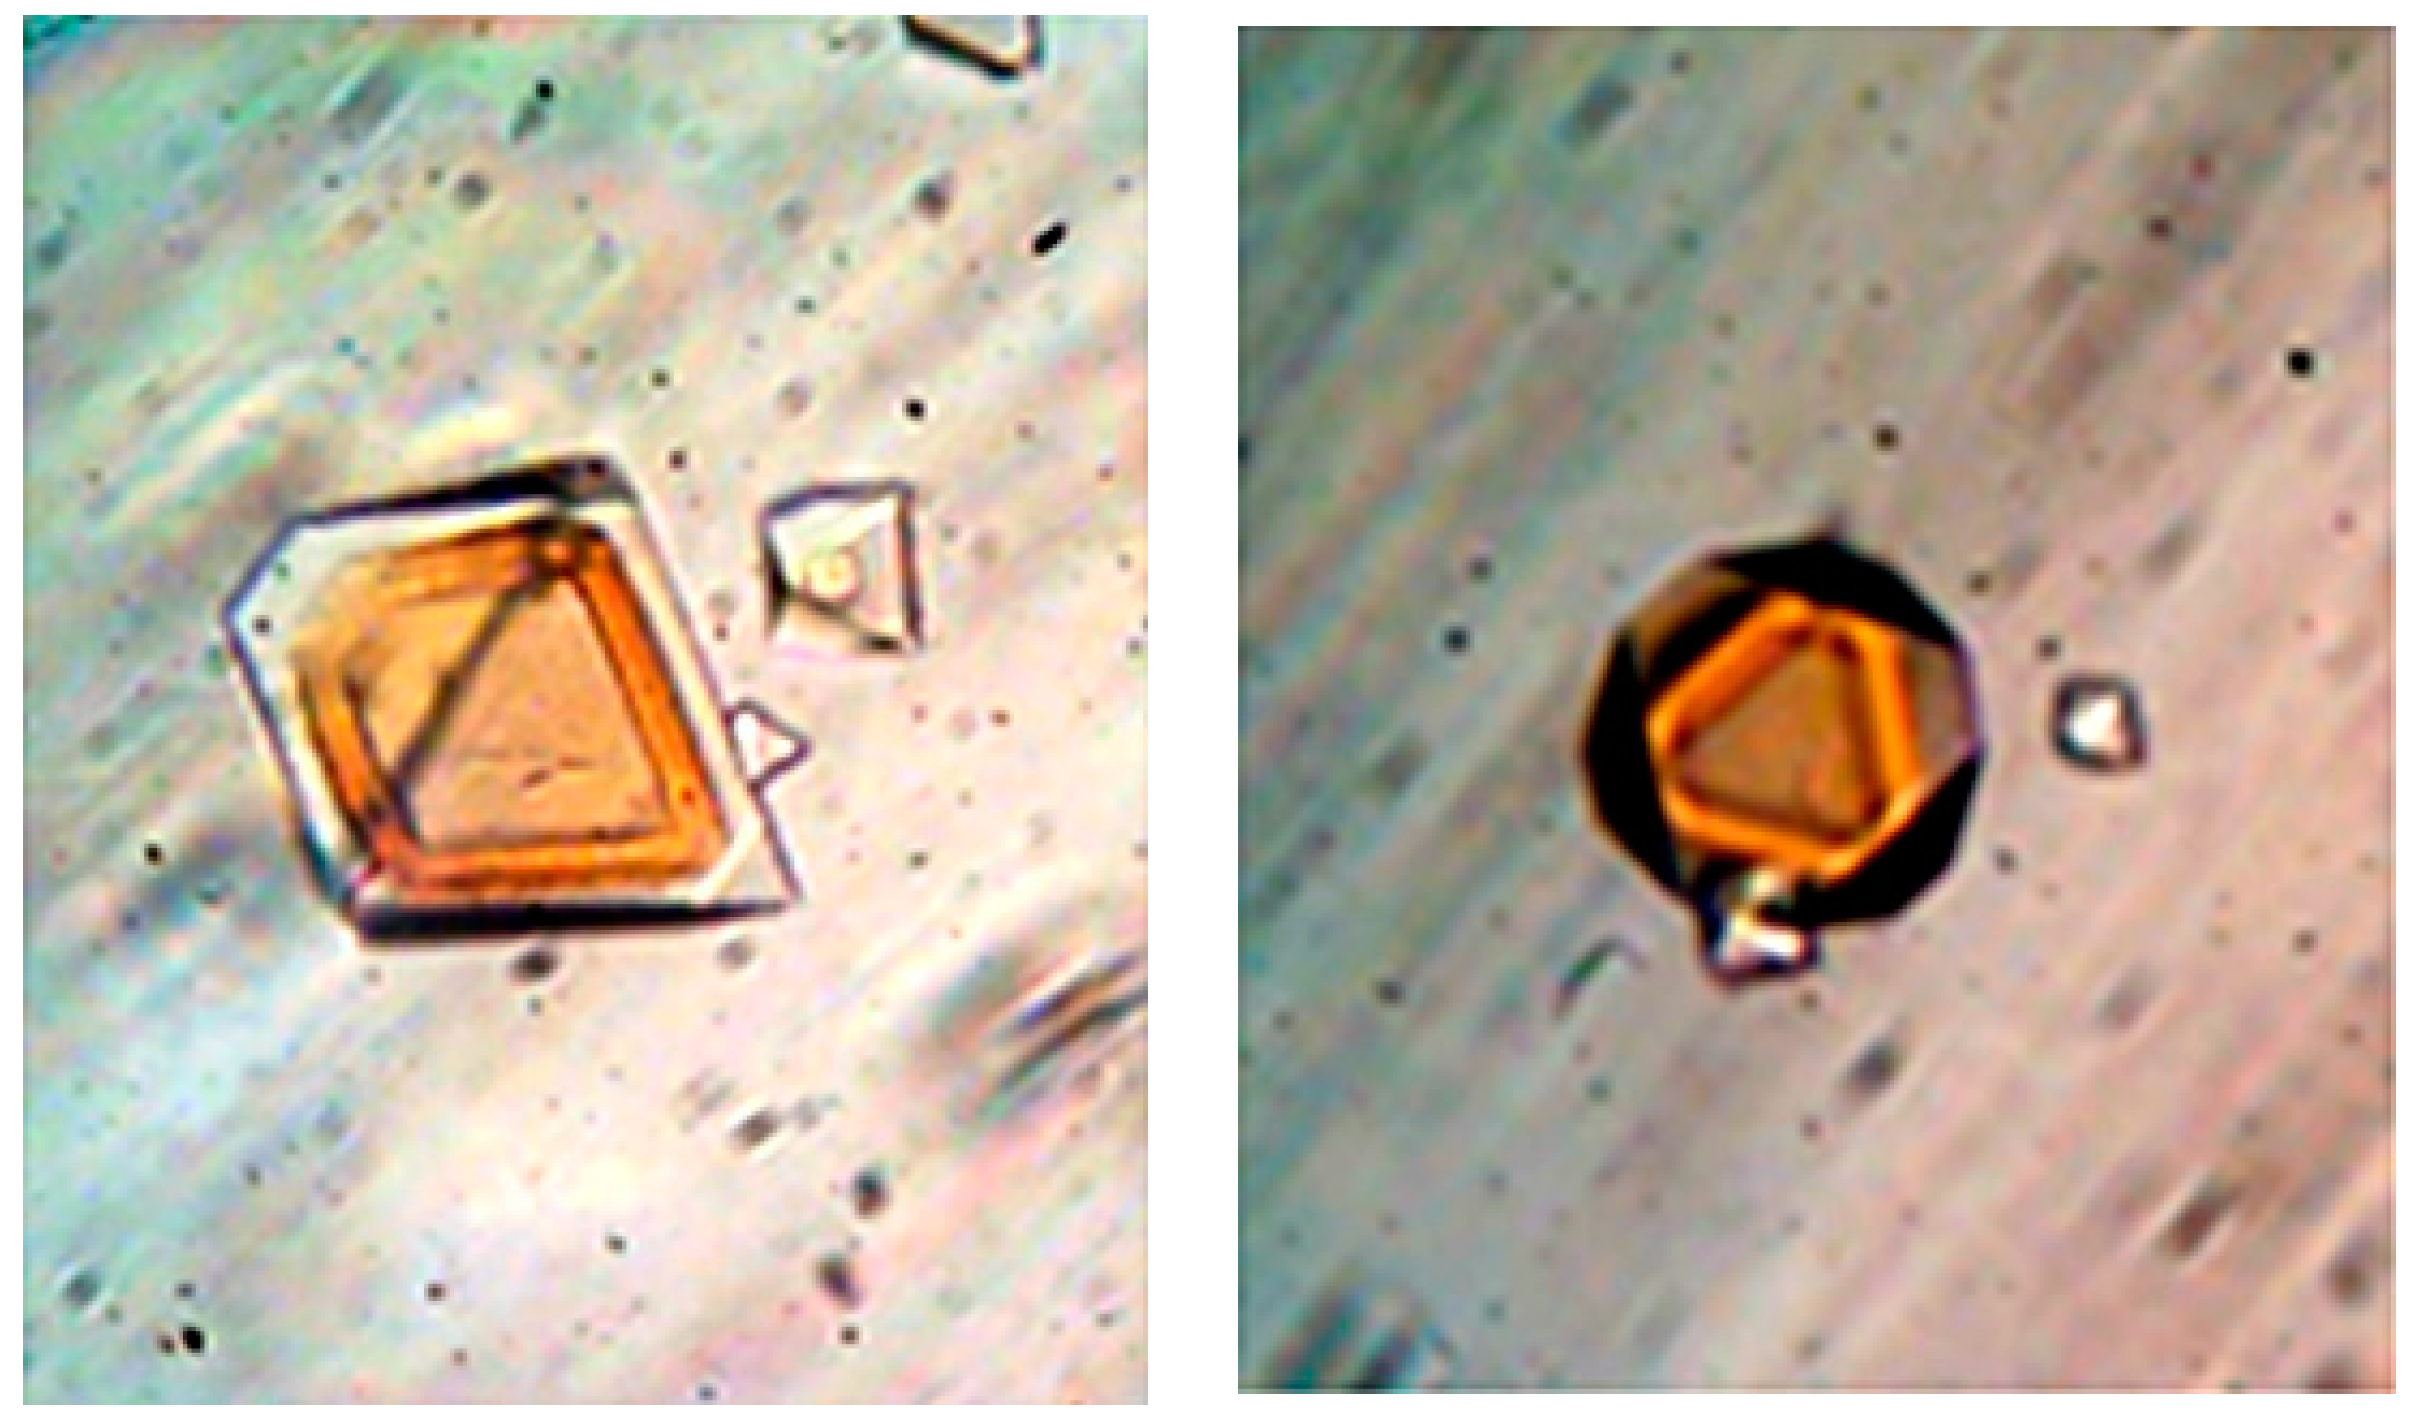
Strict selection of crystal lattice contacting patches is also evidenced by relatively simple experiments [23]. Periodically alternated layer-by-layer crystal overgrowth has been observed with the unique protein couple apo- and holoferritin. Despite the dramatically different core, their surface structure is identical. Uniform in thickness overlaying crystal layers have been deposited using equimolar protein concentrations under the same solution conditions, рН-value, CdSO4, and buffer concentrations. Since no reentrant corners have been observed (Figure 7), those crystals should be single-crystals composed of alternating apo- and holoferritin layers, rather than poly-crystals. Crystals of each protein are used as substrates for a sequential in contiguity crystallization of the counterpart protein in a completely repeatable process. A monocrystalline overgrowth of three to four alternating layers apo- on holoferritin, and vice versa, was achieved [23]. A clear distinction is allowed as the layers are of different color (apoferritin crystals are yellowish; holoferritin crystals—reddish-brown).
In contrast, no homoepitaxial monocrystalline overgrowth is possible with proteins possessing differing molecule surfaces. Apoferritin crystals have been purposefully introduced in solutions designed for lysozyme crystallization. No single-crystalline overgrowth, but merely formation of poly-crystalline lysozyme-apoferritin aggregates, has been observed [23]. This shows that a molecule attachment to the protein crystal lattice does not occur at random. It requires selection of the binding partner. It is worth noting that no binding selection is needed for small-molecule crystallization, e.g., by electrodeposition of metal alloys.
Selection of protein-protein patchy interactions has been accounted for by the so-called bond selection mechanism (BSM) [24]. It assumes that a successful collision between protein molecules, leading to formation of a crystalline connection, requires not only sufficiently close proximity of the protein molecules (respectively molecules to clusters), but also their proper spatial orientation. Because relatively small fractions of molecule surface are occupied by contacting patches, the arising steric restriction to protein-protein association postpones the nucleation process significantly. Thus, based on the biochemical specificity of proteins, BSM explains the slow protein crystal nucleation kinetics [25]. Although requiring unusually high supersaturation, it is orders of magnitude slower in comparison to the process with small molecule substances, e.g., during electrochemical nucleation [13,14]. Recalling that crystal nucleation rate changes with process stages, one can only compare the (quasi)-stationary nucleation rates expressed by Equation (5). As seen in Section 2.2.1, k-values determining nucleation frequency are 6 to 8 orders of magnitude lower for protein crystallization than k-values for small molecule new-phase nucleation, e.g., electrochemical nucleation (also proceeding in solutions). So, due to BSM, a much lower attachment frequency (νR*) of molecules to the critical cluster must be in place in the pre-exponential coefficient of Volmer’s equation:
where c1 is solute concentration, and Z is known as Zeldovich factor.
(dn/dt)st = c1νR*Z exp(−ΔG*/kBT)
3. Materials and Methods
Insulin crystal nucleation kinetics was studied via the so-called nucleation and growth separation principle. Two different insulin sorts, from BioChemika (BioChemika, ≥85% (GE), ~24 IU/mg) and from SIGMA, Denmark, Lot # 080M1589V, were used under identical crystallization conditions. BioChemika-insulin was shown to be more prone to crystal nucleation than SIGMA-insulin. Because more crystals ensure better statistics, BioChemika-insulin was preferred in our studies. Sufficient details allowing replication of the experimental studies are provided in the original paper [17].
4. Conclusions
The early stages of crystal nucleation dictate crystal polymorph selection, which is of great interest to the pharmaceutical industry. Unfortunately, our understanding of these stages remains insufficient [26]. Because of the molecular-scale involved, numerous specifics of nucleation remain largely unknown. Even with state-of-the-art measurements, it is exceptionally challenging to probe the processes in real time. Moreover, new-phase embryos are not labeled, making it impossible to distinguish them in the vast ensemble of constantly growing and decaying clusters of different sizes. The aim of this paper is to shed some additional light on the problem.
A physical aspect of crystal nucleation is considered from the fluctuation-based perspective to cover both CNT and TSNM. Logistic functional dependences according to Equations (1) and (2), symmetric S-shaped curves, characterize the heterogeneous nucleation, while homogeneous nucleation obeys non-symmetric S-shaped functional dependences. Due to the highly inhomogeneous (patchy) surface, proteins are characterized by highly directional interactions which postpone substantially protein crystal nucleation. This is a biochemical constraint imposed on the process. Provided molecule surface patches enabling crystal lattice formation are known, the so-called BSM hypothesis may help in offering clues to proper polymorph selection. Suitable crystal polymorphs can be grown by changing adequately solution conditions (and/or protein molecule surface residues), thus, activating or deactivating different surface patches. However, it is worth also noticing that the precipitants used as crystallizing agents play a specific role [27].
Acknowledgments
The author would like to acknowledge networking support by the COST Action CM1402 “Crystallize”. This work is co-financed by a grant from the National Science Fund of the Bulgarian Ministry of Science and Education, contract DCOST 01/22. The experimental help of F. Hodzhaoglu is gratefully acknowledged. The author is grateful to V. Tonchev for drawing the plots.
Conflicts of Interest
The author declares no conflict of interest.
References and Notes
- Neutron crystallography requires growth of substantially larger protein crystals, greater than 0.1 mm3 in size are preferred, i.e., 4–5 orders of magnitude larger than those used in synchrotron X-ray data collection [28]. The power of neutron crystallography consists in higher precision by visualization of H-atoms (which play essential roles in macromolecular structure and catalysis), thus helping scientists to understand enzyme reaction mechanisms and hydrogen bonding.
- Hammadi, Z.; Grossier, R.; Zhang, S.; Ikni, A.; Candoni, N.; Morin, R.; Veesler, S. Localizing and Inducing Primary Nucleation. Farad. Discuss. 2015, 179, 489–501. [Google Scholar] [CrossRef] [PubMed]
- Wölk, J.; Strey, R.; Heath, C.H.; Wyslouzil, B.E. Empirical function for homogeneous water nucleation rates. J. Chem. Phys. 2016, 117, 4954–4960. [Google Scholar] [CrossRef]
- Ten Wolde, P.R.; Frenkel, D. Enhancement of protein crystal nucleation by critical density fluctuations. Science 1997, 277, 1975–1978. [Google Scholar] [CrossRef] [PubMed]
- Vivares, D.; Kaler, E.; Lenhoff, A. Quantitative imaging by confocal scanning fluorescence microscopy of protein crystallization via liquid-liquid phase separation. Acta Crystallogr. D Biol. Crystallogr. 2005, 61, 819–825. [Google Scholar] [CrossRef] [PubMed]
- Sauter, A.; Roosen-Runge, F.; Zhang, F.; Lotze, G.; Jacobs, R.M.J.; Schreiber, F. Real-Time Observation of Nonclassical Protein Crystallization Kinetics. J. Am. Chem. Soc. 2015, 137, 1485–1491. [Google Scholar] [CrossRef] [PubMed]
- Schubert, R.; Meyer, A.; Baitan, D.; Dierks, K.; Perbandt, M.; Betzel, C. Real-Time Observation of Protein Dense Liquid Cluster Evolution during Nucleation in Protein Crystallization. Cryst. Growth Des. 2017, 17, 954–958. [Google Scholar] [CrossRef]
- Sleutel, M.; Van Driessche, A.E.S. Role of clusters in nonclassical nucleation and growth of protein crystals. Proc. Natl. Acad. Sci. USA 2014, 111, E546–E553. [Google Scholar] [CrossRef] [PubMed]
- Sleutel, M.; Lutsko, J.; Van Driessche, A.E.S.; Duran-Olivencia, M.A.; Maes, D. Observing classical nucleation theory at work by monitoring phase transitions with molecular precision. Nat. Commun. 2014, 5, 5598. [Google Scholar] [CrossRef] [PubMed]
- Whitelam, S. Control of Pathways and Yields of Protein Crystallization through the Interplay of Nonspecific and Specific Attractions. Phys. Rev. Lett. 2010, 105, 088102. [Google Scholar] [CrossRef] [PubMed]
- Yamazaki, T.; Kimura, Y.; Vekilov, P.G.; Furukawa, E.; Shirai, M.; Matsumoto, H.; Van Driessche, A.E.S.; Tsukamoto, K. Two types of amorphous protein particles facilitate crystal nucleation. Proc. Natl. Acad. Sci. USA 2017, 114, 2154–2159. [Google Scholar] [CrossRef] [PubMed]
- The patchy character of the protein surfaces is essential for their biological role.
- Kaischew, R.; Mutaftschiew, B. Ueber die Elektrolytische Keimbildung des Quecksilbers. Electrochim. Acta 1965, 10, 643–650. [Google Scholar] [CrossRef]
- Toschev, S.; Gutzow, I. Nichtstationäre Keimbildung: Theorie und Experiment. Cryst. Res. Technol. 1972, 7, 43–73. [Google Scholar] [CrossRef]
- Interested merely in measuring stationary nucleation rates determined from the slopes of the linear parts of n vs. t dependences at fixed Δμ, many researchers disregard the maximum crystal number density (ns) because sometimes it is difficult to measure it. Complete functional dependences from n = 0 till n = ns are relatively rare, though in virtually all cases they are S-shaped.
- Nanev, C.N.; Tonchev, V.D. Sigmoid Kinetics of Protein Crystal Nucleation. J. Cryst. Growth 2015, 427, 48–53. [Google Scholar] [CrossRef]
- Nanev, C.N.; Hodzhaoglu, F.V.; Dimitrov, I.L. Kinetics of Insulin Crystal Nucleation, Energy Barrier, and Nucleus Size. Cryst. Growth Des. 2011, 11, 196–202. [Google Scholar] [CrossRef]
- Kertis, F.; Khurshid, S.; Okman, O.; Kysar, J.W.; Govada, L.; Chayen, N.E.; Erlebacher, J. Heterogeneous nucleation of protein crystals using nanoporous gold nucleants. J. Mater. Chem. 2012, 22, 21928–21934. [Google Scholar] [CrossRef]
- Wyslouzil, B.E.; Wölk, J. Overview: Homogeneous nucleation from the vapor phase—The experimental science. J. Chem. Phys. 2016, 145, 211702. [Google Scholar] [CrossRef]
- The newly nucleated crystals are small enough to obey it.
- Dasgupta, S.; Iyer, G.H.; Bryant, S.H.; Lawrence, C.E.; Bell, J.A. Extent and Nature of Contacts between Protein Molecules in Crystal Lattices and between Subunits in Protein Oligomers. Proteins Struct. Funct. Genet. 1997, 28, 494–514. [Google Scholar] [CrossRef]
- Sergeyev, I.V.; McDermott, A.E. ACCEPT-NMR: A New Tool for the Analysis of Crystal Contacts and Their Links to NMR Chemical Shift Perturbations. J. Crystalliz. Process Technol. 2013, 3, 12–27. [Google Scholar] [CrossRef]
- Nanev, C.N.; Dimitrov, I. Layered crystals of apo- and holoferritin grown by alternating crystallization. Cryst. Res. Technol. 2009, 44, 908–914. [Google Scholar] [CrossRef]
- Nanev, C.N. Kinetics and Intimate Mechanism of Protein Crystal Nucleation. Prog. Cryst. Growth Charact. Mater. 2013, 59, 133–169. [Google Scholar] [CrossRef]
- Alternatively, the latter has been attributed to TSNM [29].
- Tahri, Y.; Kozisek, Z.; Gagnière, E.; Chabanon, E.; Bounahmidi, T.; Mangin, D. Modeling the competition between polymorphic phases: Highlights on the effect of Ostwald Ripening. Cryst. Growth Des. 2016, 16, 5689–5697. [Google Scholar] [CrossRef]
- Fudo, S.; Qi, F.; Nukaga, M.; Hoshino, T. Influence of Precipitants on Molecular Arrangements and Space Groups of Protein Crystals. Cryst. Growth Des. 2017, 17, 534–542. [Google Scholar] [CrossRef]
- Chen, J.C.-H.; Unkefer, C.J. Fifteen years of the Protein Crystallography Station: The coming of age of macromolecular neutron crystallography. IUCrJ 2017, 4, 72–86. [Google Scholar] [CrossRef] [PubMed]
- Vekilov, P.G. Nucleation of protein crystals. Prog. Cryst. Growth Charact. Mater. 2016, 62, 136–154. [Google Scholar] [CrossRef]

Figure 2.
Logistic plot for lysozyme crystal nucleation on nanoporous gold; n (cm−3) vs. t (min); Figure 4a in [18].
Figure 2.
Logistic plot for lysozyme crystal nucleation on nanoporous gold; n (cm−3) vs. t (min); Figure 4a in [18].

Figure 3.
Experimental data for insulin crystal nucleation in bulk solution, n vs. t at series of dimensionless supersaturations, ln(c/ce), where c is the actual insulin concentration, and ce is the equilibrium concentration. The corresponding dimensionless supersaturations are given on the right-hand side. For the color references, refer to the web version of this article.
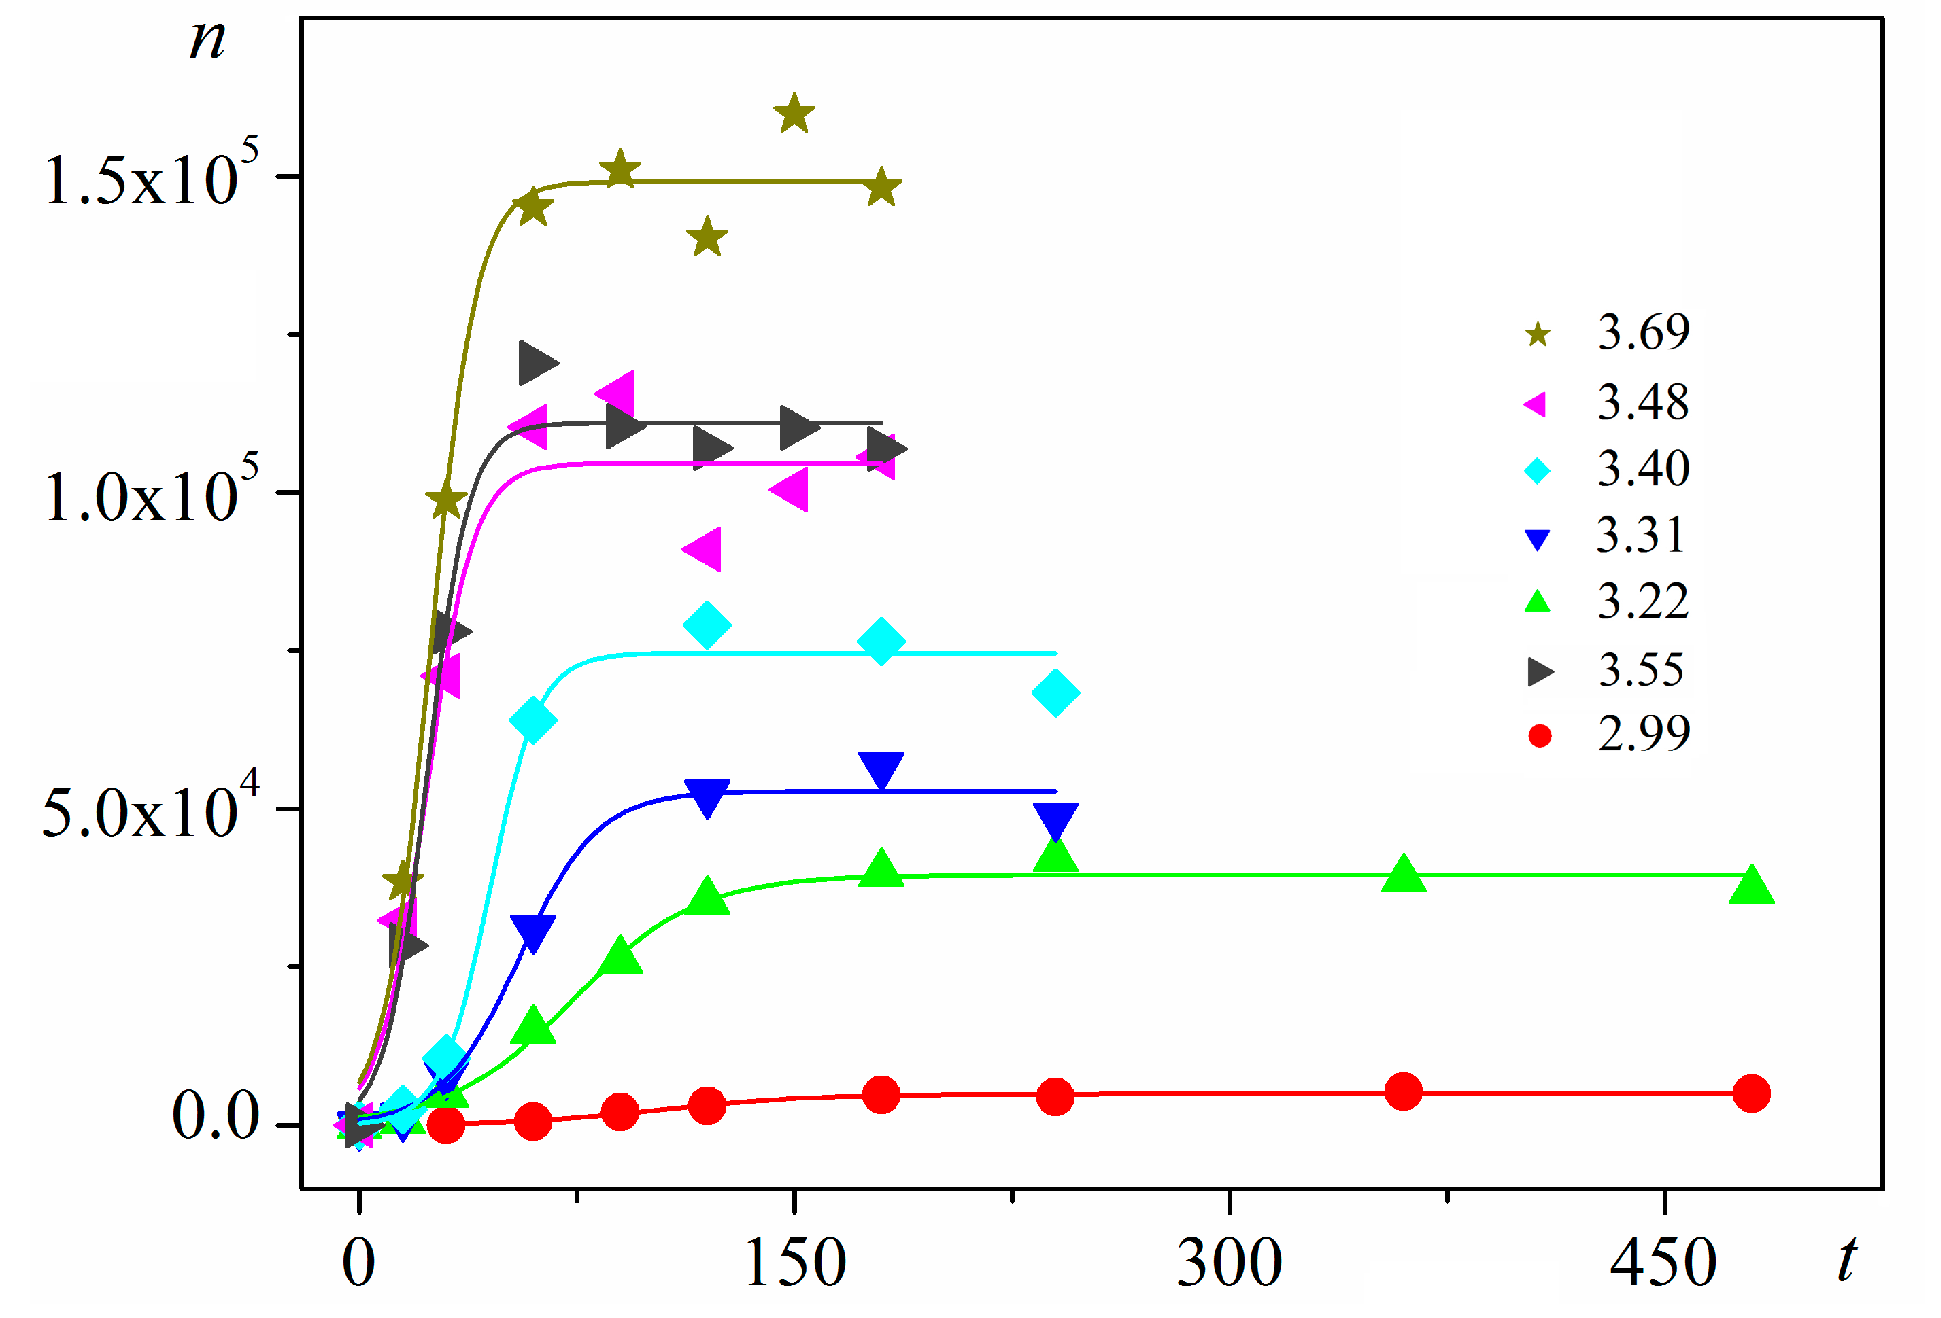
Figure 4.
Logistic functional plots of n/ns vs. t/tp for insulin crystal nucleation. All experimental data for the dimensionless supersaturations studied (numbers on right-hand side) fall on the orange logistic curves (for the color references, refer to the web version of this article). The dashed straight lines with coordinates (00), (11) are a guide for the eye only; it is seen that the experimental points less than t/tp = 0.5 are situated below the dashed straight line, while the points for greater t/tp values (up to 1) lie above this line. Experimental data are plotted for: (a) bulk nucleation; (b) on-glass nucleation.
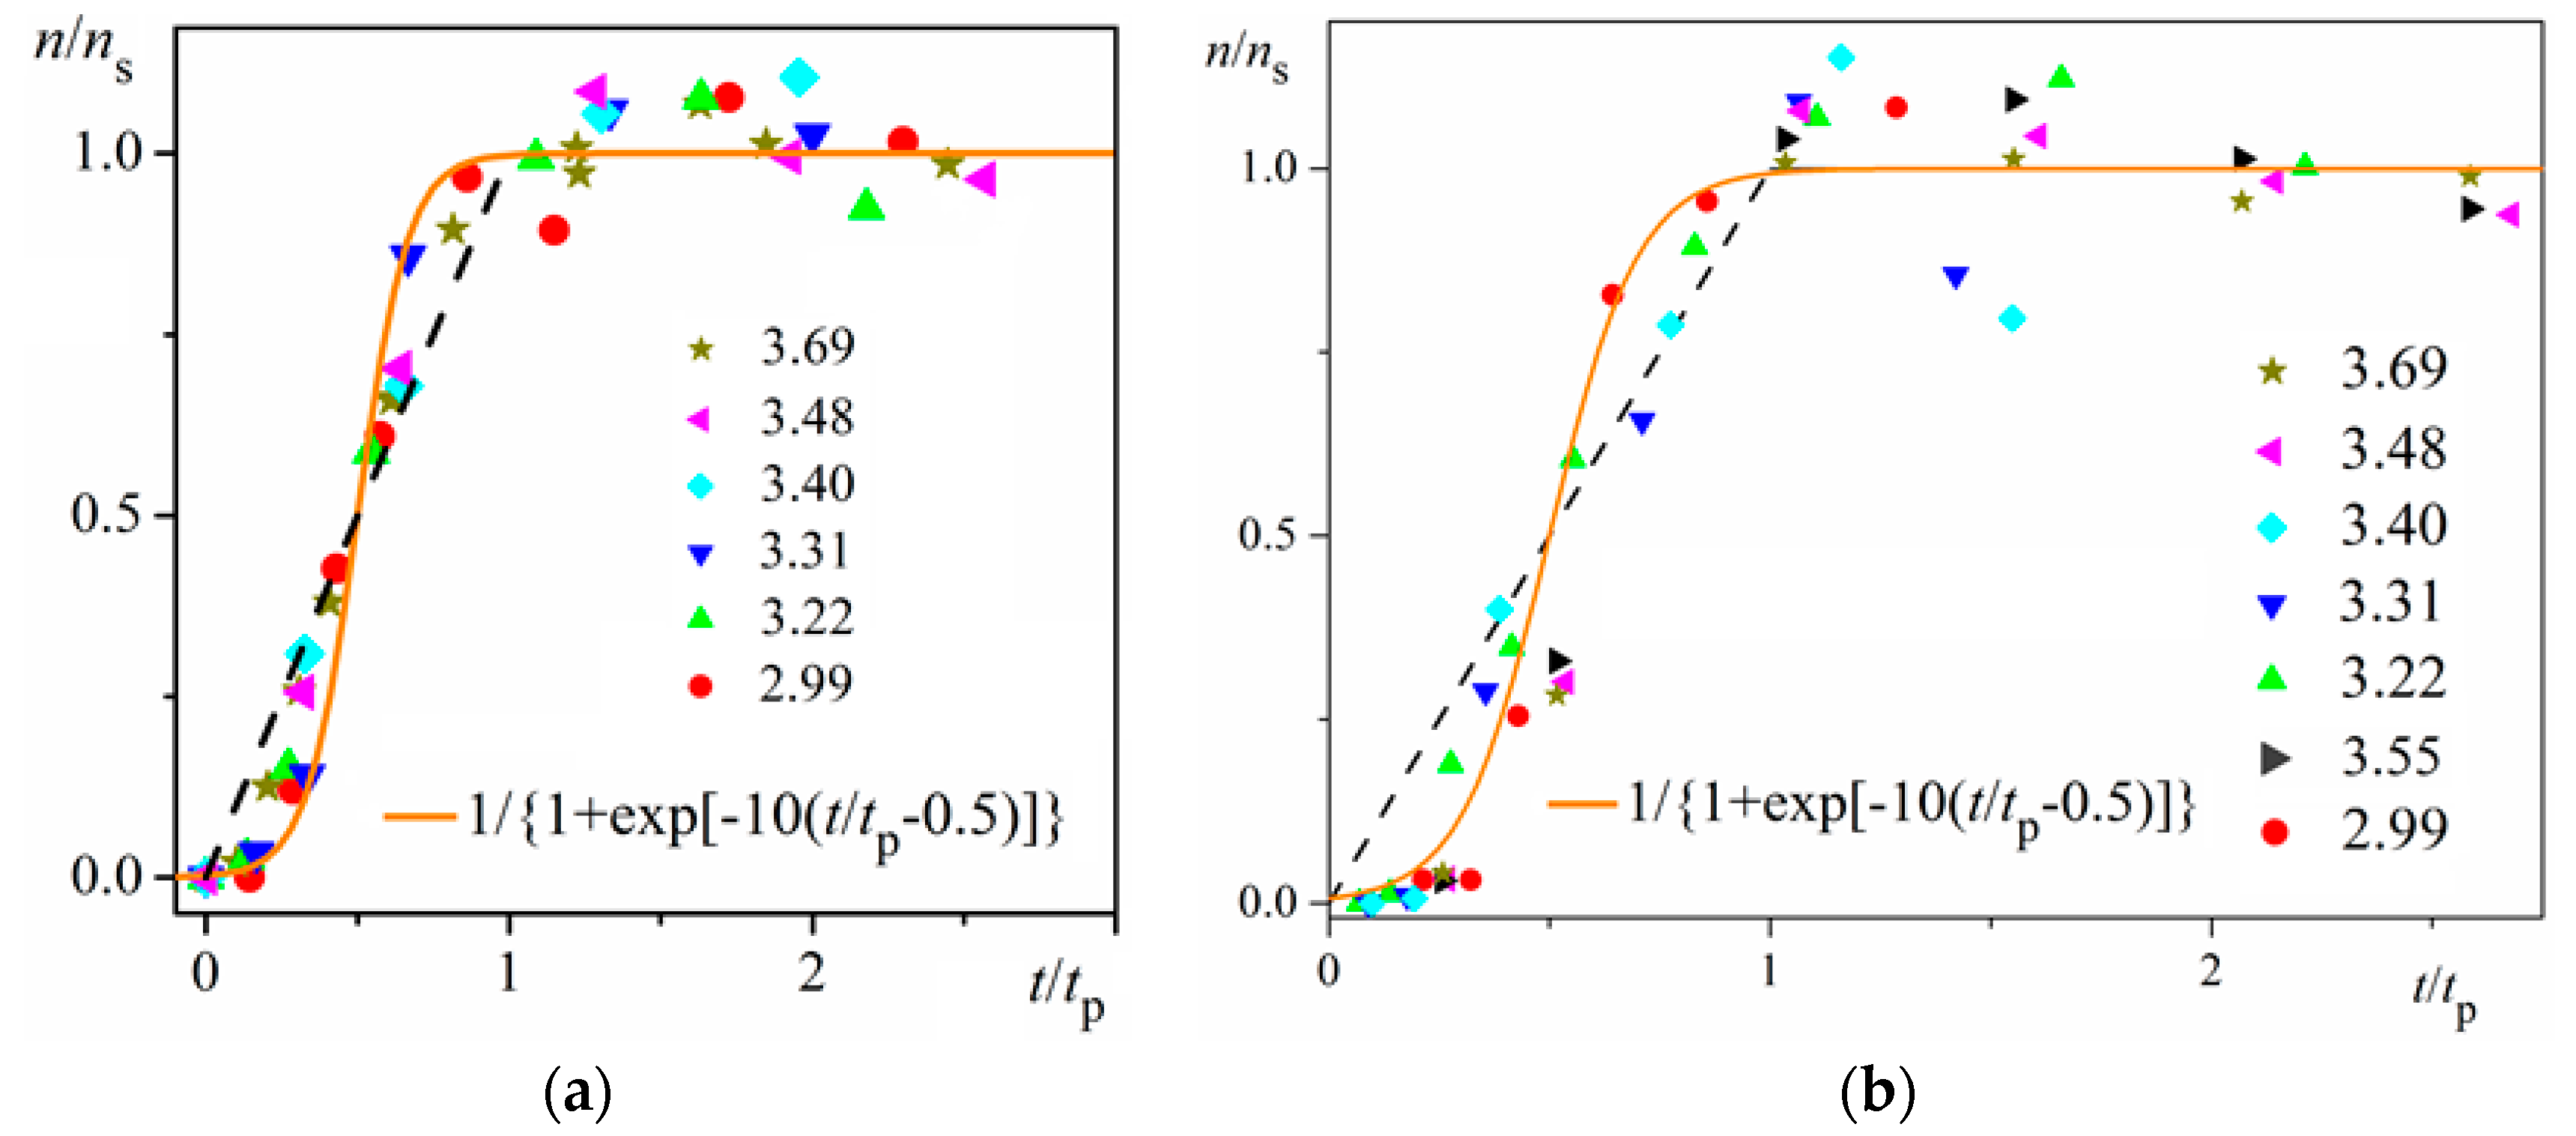
Figure 5.
Standard logistic function; (0), (0.5) are the coordinates of the midpoint; in the case considered, it is ns/2.
Figure 5.
Standard logistic function; (0), (0.5) are the coordinates of the midpoint; in the case considered, it is ns/2.
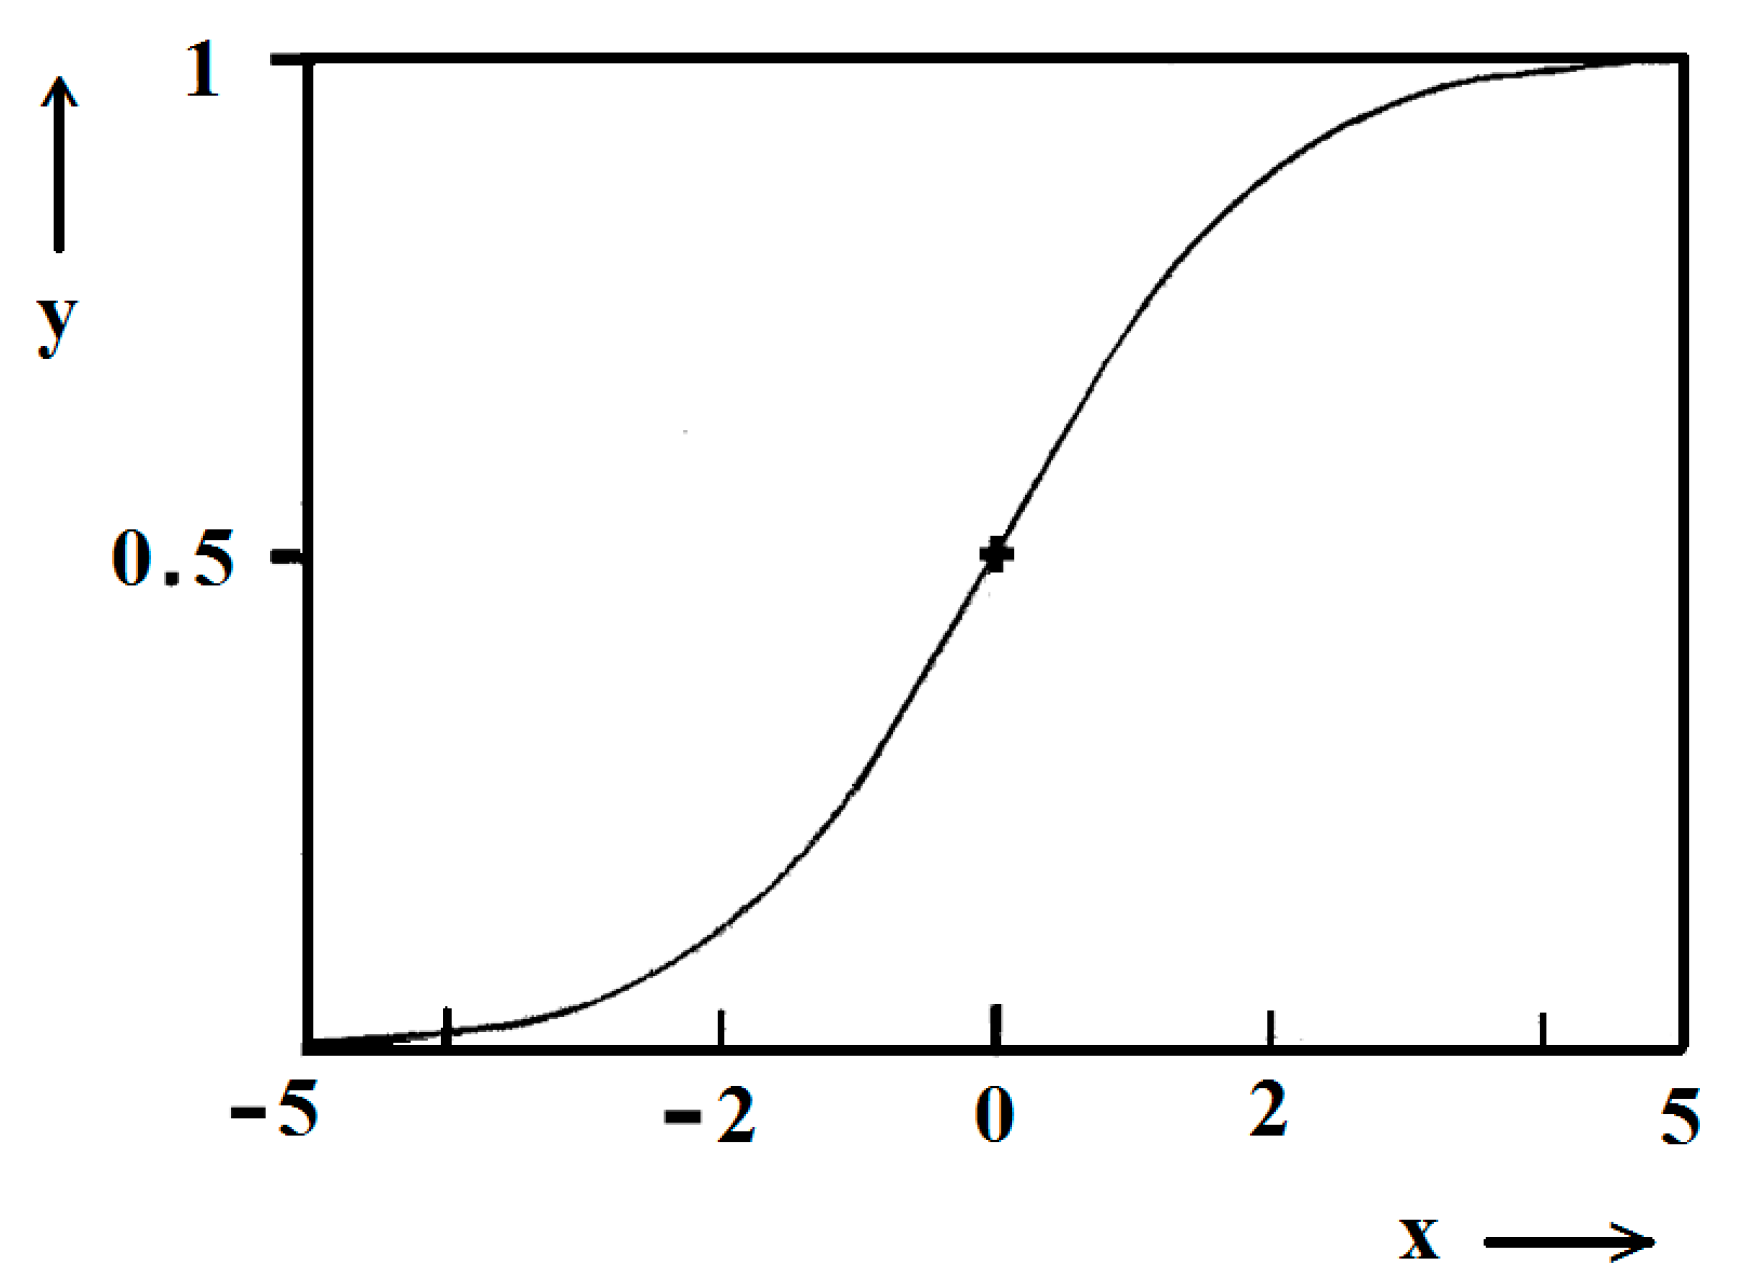
Figure 6.
Dependence of ns in bulk insulin solution vs. dimensionless supersaturation, Δμ/kBT = ln(c/ce).
Figure 6.
Dependence of ns in bulk insulin solution vs. dimensionless supersaturation, Δμ/kBT = ln(c/ce).

Figure 7.
Different orientation of layered monocrystals of apoferritin and holoferritin. Crystal sizes ~200 μm and ~100 μm, respectively.
Figure 7.
Different orientation of layered monocrystals of apoferritin and holoferritin. Crystal sizes ~200 μm and ~100 μm, respectively.

© 2017 by the author. Licensee MDPI, Basel, Switzerland. This article is an open access article distributed under the terms and conditions of the Creative Commons Attribution (CC BY) license (http://creativecommons.org/licenses/by/4.0/).
Share and Cite
MDPI and ACS Style
Nanev, C.N. Phenomenological Consideration of Protein Crystal Nucleation; the Physics and Biochemistry behind the Phenomenon. Crystals 2017, 7, 193. https://doi.org/10.3390/cryst7070193
AMA Style
Nanev CN. Phenomenological Consideration of Protein Crystal Nucleation; the Physics and Biochemistry behind the Phenomenon. Crystals. 2017; 7(7):193. https://doi.org/10.3390/cryst7070193
Chicago/Turabian StyleNanev, Christo N. 2017. "Phenomenological Consideration of Protein Crystal Nucleation; the Physics and Biochemistry behind the Phenomenon" Crystals 7, no. 7: 193. https://doi.org/10.3390/cryst7070193
Note that from the first issue of 2016, this journal uses article numbers instead of page numbers. See further details here.