Crystal Structure of 17α-Dihydroequilin, C18H22O2, from Synchrotron Powder Diffraction Data and Density Functional Theory

1
Illinois Institute of Technology, Chicago, IL 60616, USA
2
North Central College, Naperville, IL 60540, USA
3
International Centre for Diffraction Data, Newtown Square, PA 19073, USA
*
Author to whom correspondence should be addressed.
Crystals 2017, 7(7), 218; https://doi.org/10.3390/cryst7070218
Submission received: 9 April 2017
/
Revised: 4 June 2017
/
Accepted: 22 June 2017
/
Published: 13 July 2017
(This article belongs to the Special Issue Structural Analysis of Crystalline Materials from Powders)
Abstract
:The crystal structure of 17α-dihydroequilin has been solved and refined using synchrotron X-ray powder diffraction data, and optimized using density functional techniques. 17α-dihydroequilin crystallizes in space group P212121 (#19) with a = 6.76849(1) Å, b = 8.96849(1) Å, c = 23.39031(5) Å, V = 1419.915(3) Å3, and Z = 4. Both hydroxyl groups form hydrogen bonds to each other, resulting in zig-zag chains along the b-axis. The powder diffraction pattern has been submitted to ICDD for inclusion in the Powder Diffraction File™ as the entry 00-066-1608.
1. Introduction
17α-dihydroequilin is a naturally-occurring steroidal estrogen found in the urine of female horses. Its 3-sulfate ester sodium salt is one of the components of Premarin®, a mixture of conjugated estrogens which is used to treat symptoms of menopause and for the prevention of osteoporosis. Premarin is administered in oral, intravenous, and cream forms. The systematic name (CAS Registry number 651-55-8) is estra-1,3,5(10),7-tetraene-3,17α-diol. A two-dimensional molecular diagram is shown in Figure 1.
The presence of high-quality reference powder patterns in the Powder Diffraction File™ (PDF®) [1] is important for phase identification—particularly by pharmaceutical, forensic, and law enforcement scientists. The crystal structures of a significant fraction of the largest dollar volume pharmaceuticals have not been published, and thus calculated powder patterns are not present in the PDF-4 databases. Sometimes experimental patterns are reported, but they are generally of low quality. This crystal structure is a result of a collaboration among the International Centre for Diffraction Data (ICDD®), Illinois Institute of Technology (IIT), Poly Crystallography Inc., and Argonne National Laboratory to measure high-quality synchrotron powder patterns of commercial pharmaceutical ingredients, include these reference patterns in the PDF, and determine the crystal structures of these active pharmaceutical ingredients (APIs).
Even when the crystal structure of an API is reported, the single crystal structure was often determined at low temperature. Most powder measurements are performed at ambient conditions. Thermal expansion (generally anisotropic) means that the peak positions calculated from a low-temperature single crystal structure often differ significantly from those measured at ambient conditions. These peak shifts can result in the failure of default search/match algorithms to identify a phase, even when it is present in the sample. High-quality reference patterns measured at ambient conditions are thus critical for straightforward identification of APIs using standard powder diffraction practices.
2. Results and Discussion
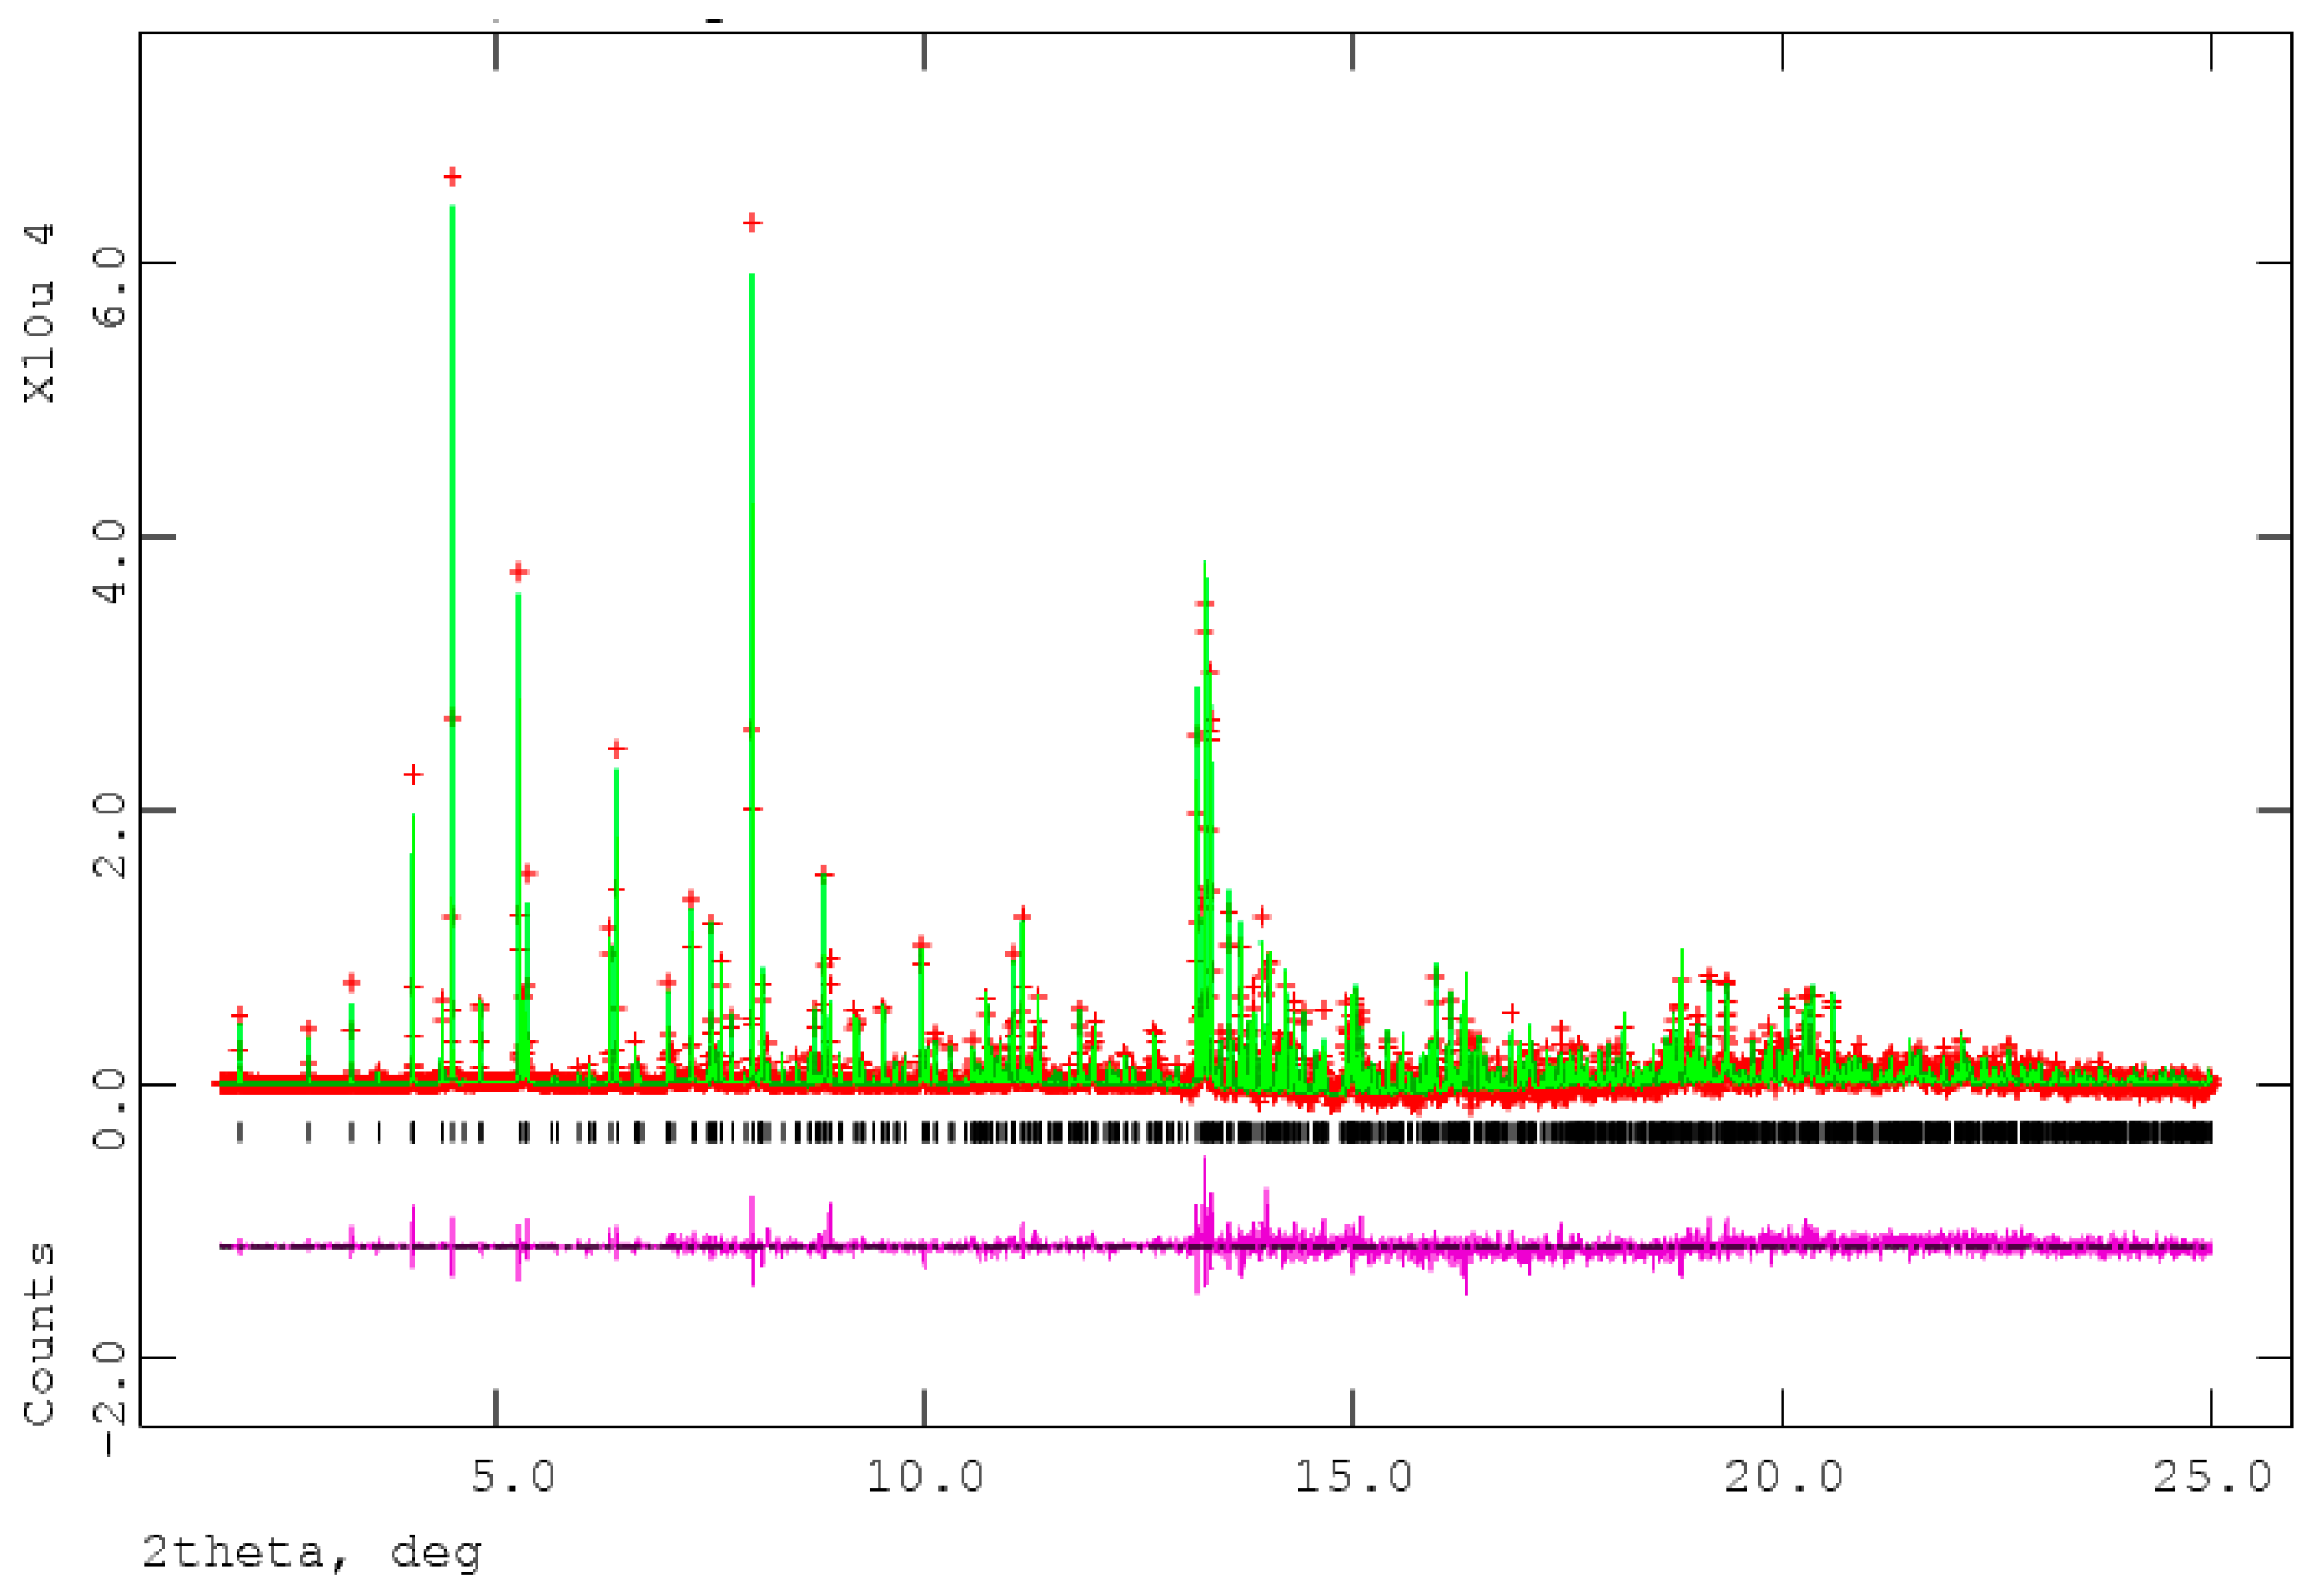
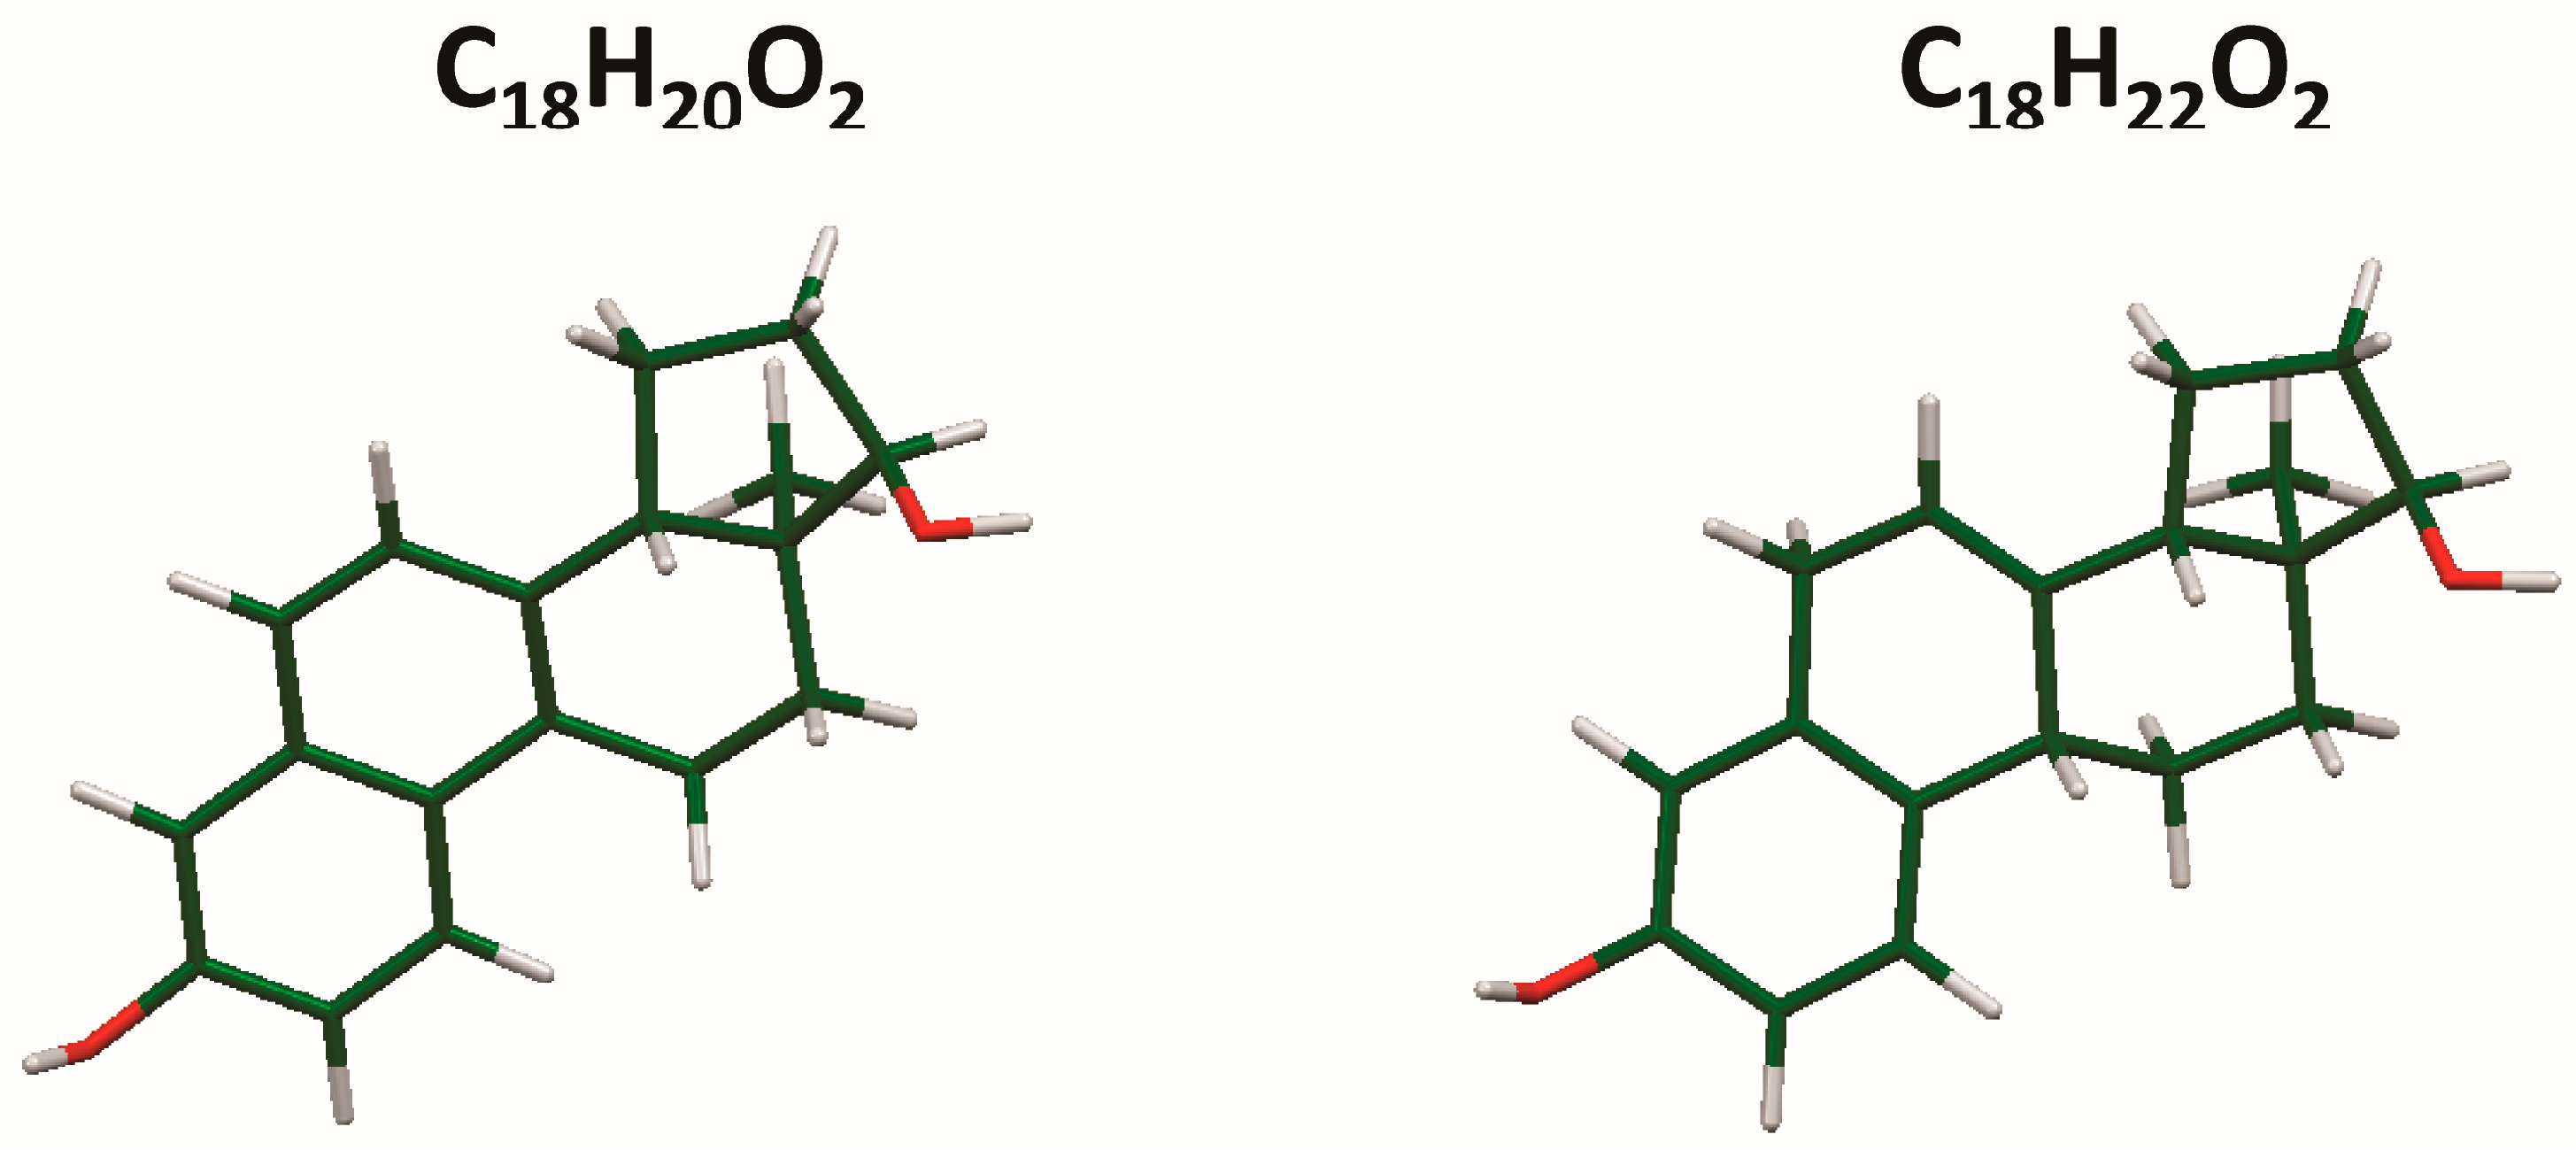
The process of solving the crystal structure of 17α-dihydroequilin provides a cautionary tale. Even though good Rietveld residuals (Rwp = 0.0987, χ2 = 2.851, see Figure 2) were obtained for C18H20O2, the agreement of the refined and DFT-optimized structures was poor, indicating that something was wrong. Once we realized that the true formula of 17α-dihydroequilin was C18H22O2, the source of the problem became clear. Although the two molecular structures look similar when viewed perpendicular to the ring system (Figure 3), a side view (Figure 4) shows that the extra hydrogen atoms buckle the ring system. Using the correct molecular formula C18H22O2 resulted in lower residuals (Rwp = 0.0902, χ2 = 2.221, see Figure 5), but support that this was the correct molecule was provided by the excellent agreement between the Rietveld-refined and DFT-optimized structures (Figure 6). The root-mean-square Cartesian displacement of the non-hydrogen atoms in the two structures is only 0.109 Å, indicating that the Rietveld refined structure is probably correct [2]. This discussion uses the density functional theory (DFT)-optimized structure. The asymmetric unit (with atom numbering) is illustrated in Figure 7, and the crystal structure is presented in Figure 8.
All of the bond distances, bond angles, and torsion angles (bond distances and angles were restrained during the Rietveld refinement) fall within the normal ranges indicated by a Mercury Mogul Geometry check [3]. Quantum chemical geometry optimization (Hartree–Fock/6-31G*/water) using Spartan ’14 (Wavefunction, Inc., Irvine, CA, USA) [4] indicated that the observed conformation of 17α-dihydroequilin in the solid state is 9.2 kcal/mol higher in energy than a local minimum energy conformation of an isolated molecule. A molecular mechanics conformational analysis also using Spartan ’14 indicated that the global minimum energy conformation (7.4 kcal/mol lower in energy than that observed in the solid state) is more compact, and thus intermolecular interactions are important in determining the solid-state conformation.
Analysis of the contributions to the total crystal energy using the Forcite module of Materials Studio [5] suggests that bond angle, bond distance, and torsion distortion terms are significant in the intramolecular deformation energy, as might be expected for a fused ring system. The intermolecular energy contains significant contributions from van der Waals and electrostatic attractions, which in this force-field-based analysis include hydrogen bonds. The hydrogen bonds are better analyzed using the results of the DFT calculation.
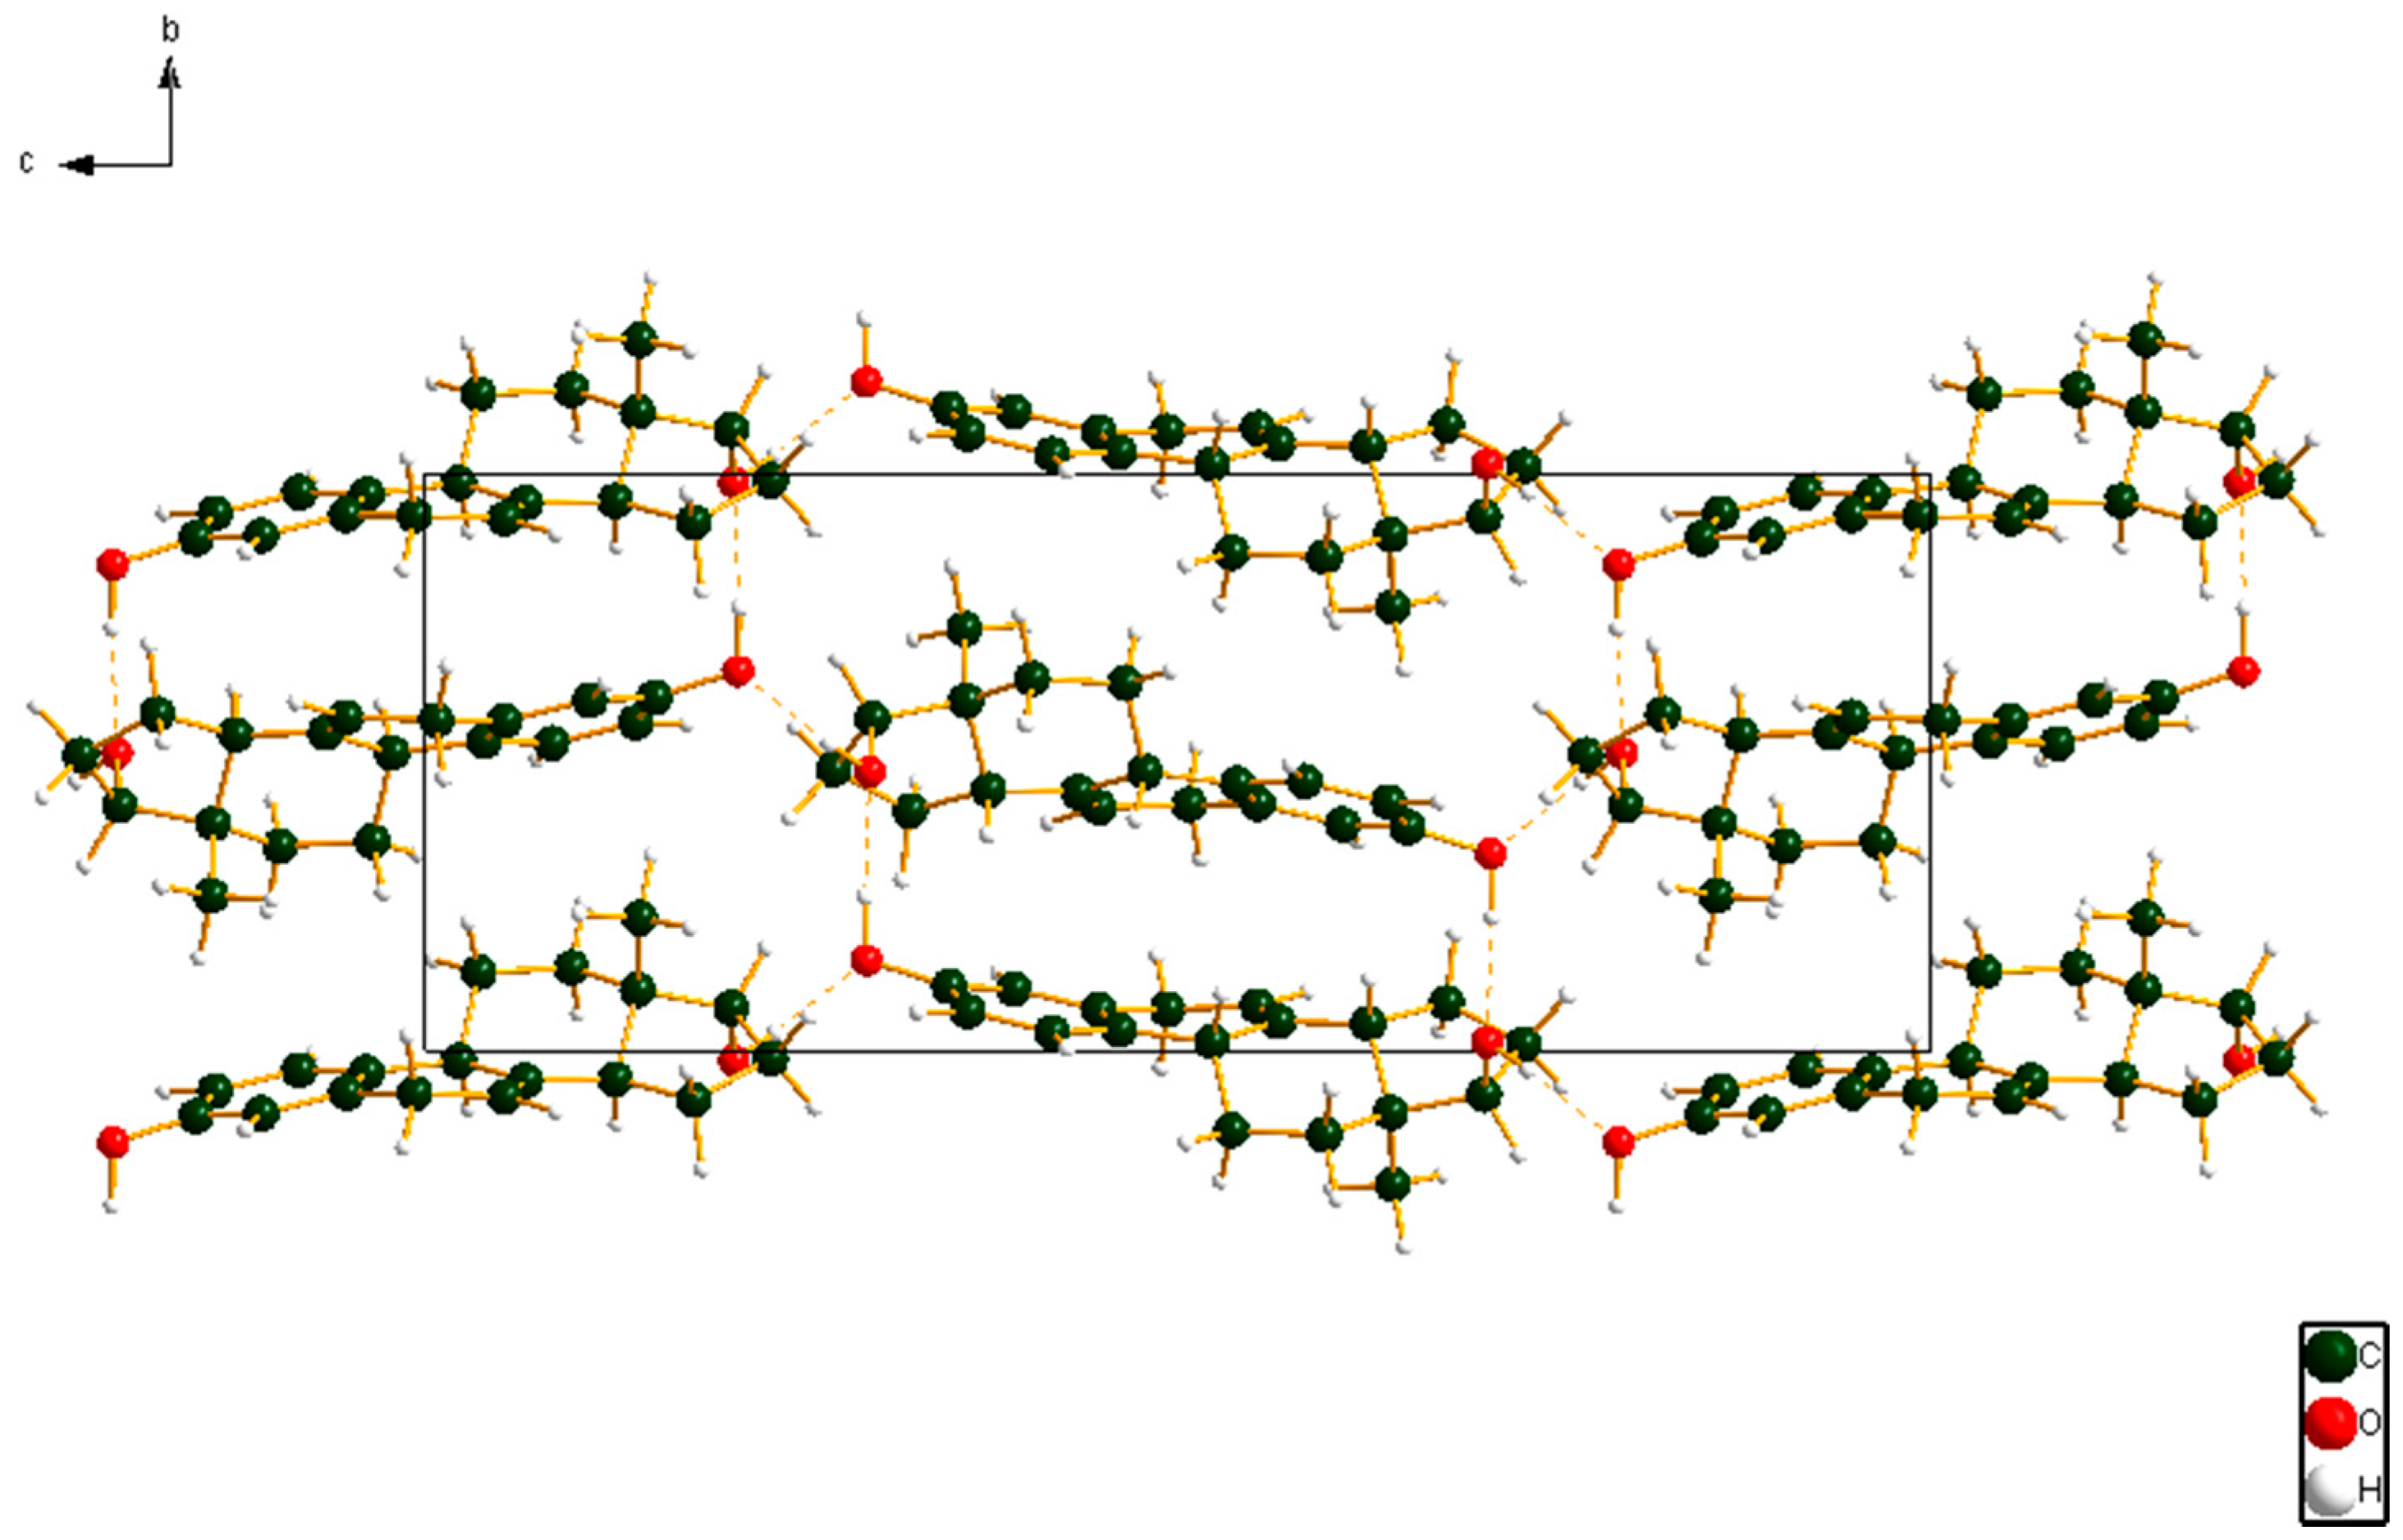
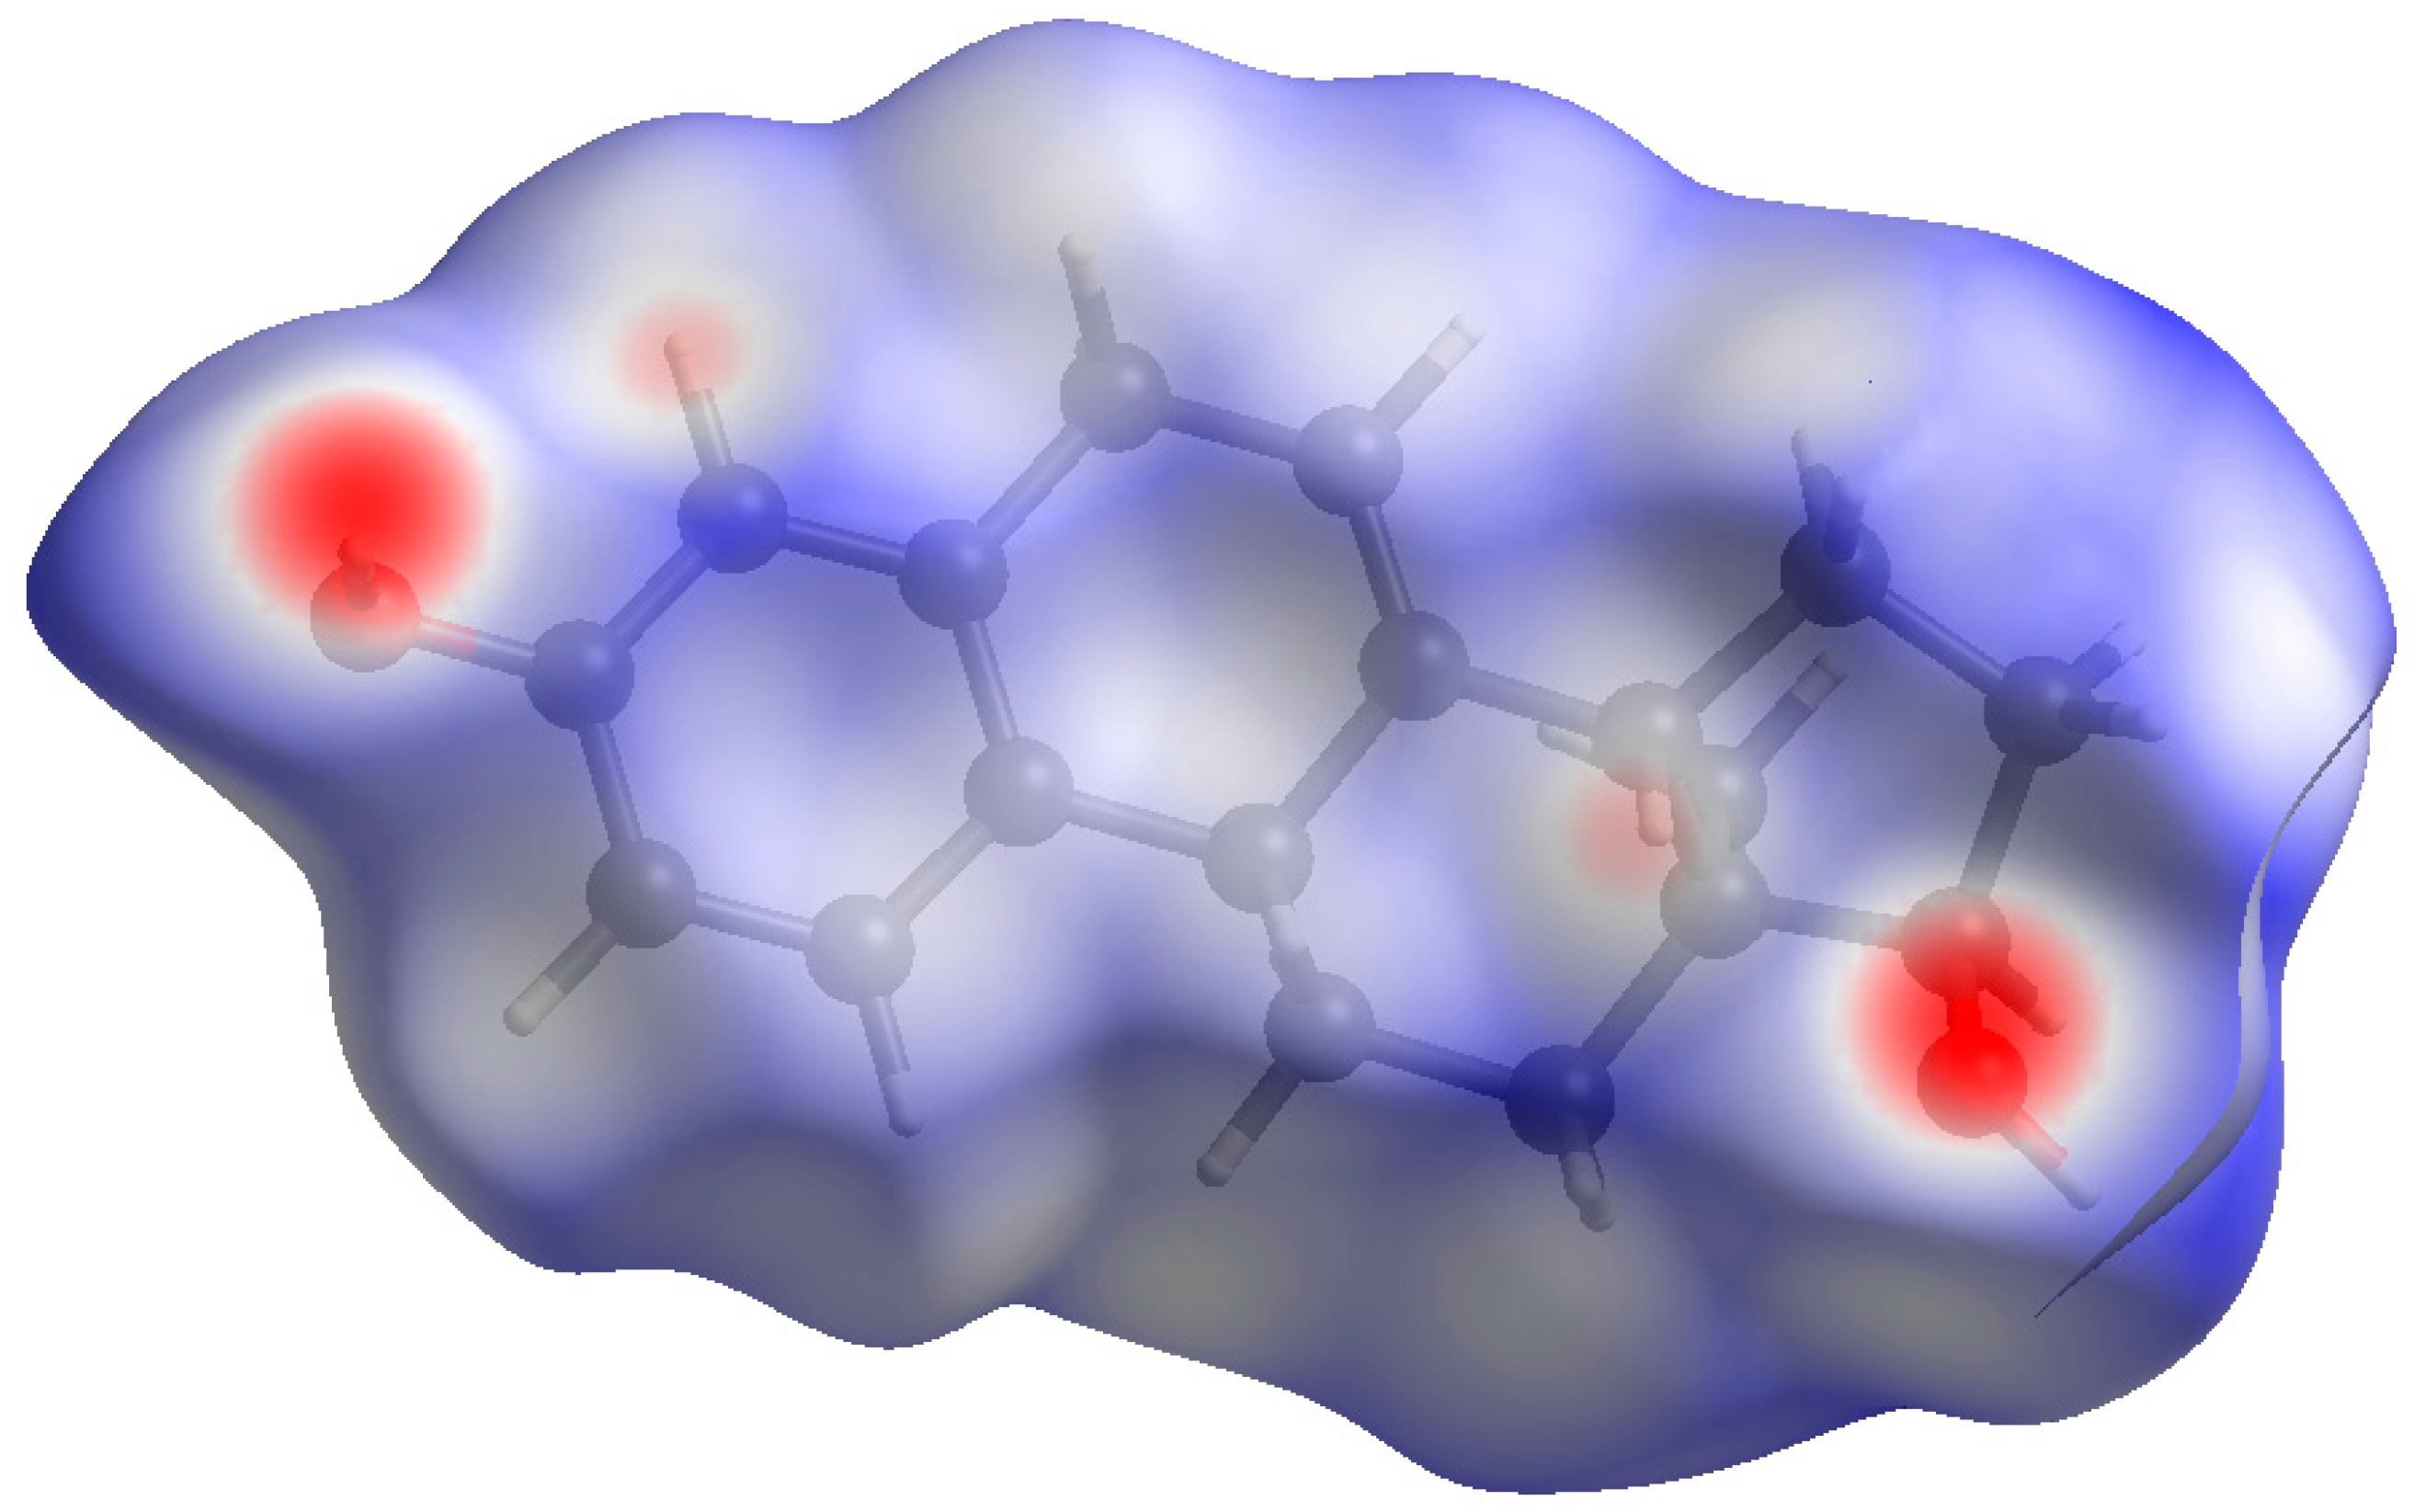
Both hydroxyl groups form fairly strong hydrogen bonds to each other (Table 1). These hydrogen bonds result in zig-zag chains along the b-axis (Figure 8). The volume enclosed by the Hirshfeld surface (Figure 9) [6,7,8,9] is 348.55 Å3, 98.2% of 1/4 the unit cell volume. The molecules are thus not tightly packed. The only significant close contacts (shown in red in Figure 9) involve the hydrogen bonds. Other close contacts are consistent with some small positive Mulliken overlap populations in H···A distances, particularly involving the ring hydrogen atom H25, and the methyl hydrogens H35, H36, and H37.
The Bravais–Friedel–Donnay–Harker [10,11,12] morphology suggests that we might expect a platy morphology for 17α-dihydroequilin, with {002} as the principal faces. A 6th-order spherical harmonic preferred orientation model was included in the Rietveld refinement; however, the texture index was only 1.011, indicating that preferred orientation was not significant in this rotated capillary specimen. The powder pattern of 17α-dihydroequilin is included in the Powder Diffraction File as the entry 00-066-1608.
3. Materials and Methods
17α-Dihydroequilin was a commercial reagent purchased from US Pharmacopeia (Lot JOL148), and was used as-received. The white powder was packed into a 1.5 mm diameter Kapton capillary, and rotated during the measurement at ~50 cycles·s−1. The powder pattern was measured at 295 K at beam line 11-BM [13,14] of the Advanced Photon Source at Argonne National Laboratory using a wavelength of 0.413342 Å, from 0.5–50° 2θ with a step size of 0.001° and a counting time of 0.1 sec/step. The pattern was indexed on a primitive orthorhombic unit cell with a = 6.765 Å, b = 8.965 Å, c = 23.384 Å, V = 1418.2 Å3, and Z = 4, using Jade [15]. The suggested space group was P212121, which was confirmed by successful solution and refinement of the structure. A reduced cell search in the Cambridge Structural Database [16] (increasing the tolerance on the longest dimension to 2.0%) combined with the chemistry “C H O only” yielded 15 hits, but no crystal structure for dihydroequilin.
The formula for 17α-dihydroequilin is reported in some sources (such as Chemical Book) as C18H20O2, and in others as C18H22O2. The molecular structure C18H22O2 contains additional hydrogen atoms on C2 and C5 (see Figure 7). For the initial structure solution, a C18H20O2 molecule was built and optimized in Spartan ’14 [4]. The resulting “mol2” file was converted into a Fenske–Hall Z-matrix file using OpenBabel [17]. The structure was solved with FOX [18], using a maximum sinθ/λ = 0.25 Å−1. A Rietveld refinement using GSAS [19] yielded good residuals (Rwp = 0.097 and χ2 = 2.851 for 87 variables) and an excellent fit (Figure 2). A density functional geometry optimization (fixed experimental cell) was carried out using CRYSTAL09 [20]. The root-mean-square Cartesian displacement of the non-hydrogen atoms was 0.415 Å, indicating that the experimental structure was likely incorrect [2].
The molecular structure of C18H22O2 contains additional hydrogen atoms on C2 and C5 (see Figure 7). The hydrogen atoms H41 and H42 were added using Materials Studio [5] (after appropriate modifications to the bond types). This model was then subjected to geometry optimization (fixing the unit cell parameters to the experimentally-determined values) using CRYSTAL14 [21]. The 6-31G** basis sets for the H, C, and O atoms were those of Gatti et al. [22]. The calculation was run on eight 2.1 GHz Xeon cores (each with 6 Gb RAM) of a 304-core Dell Linux cluster at IIT, using 8 k-points and the B3LYP functional, and took ~47 h. The optimized structure was the basis of the final Rietveld refinement.
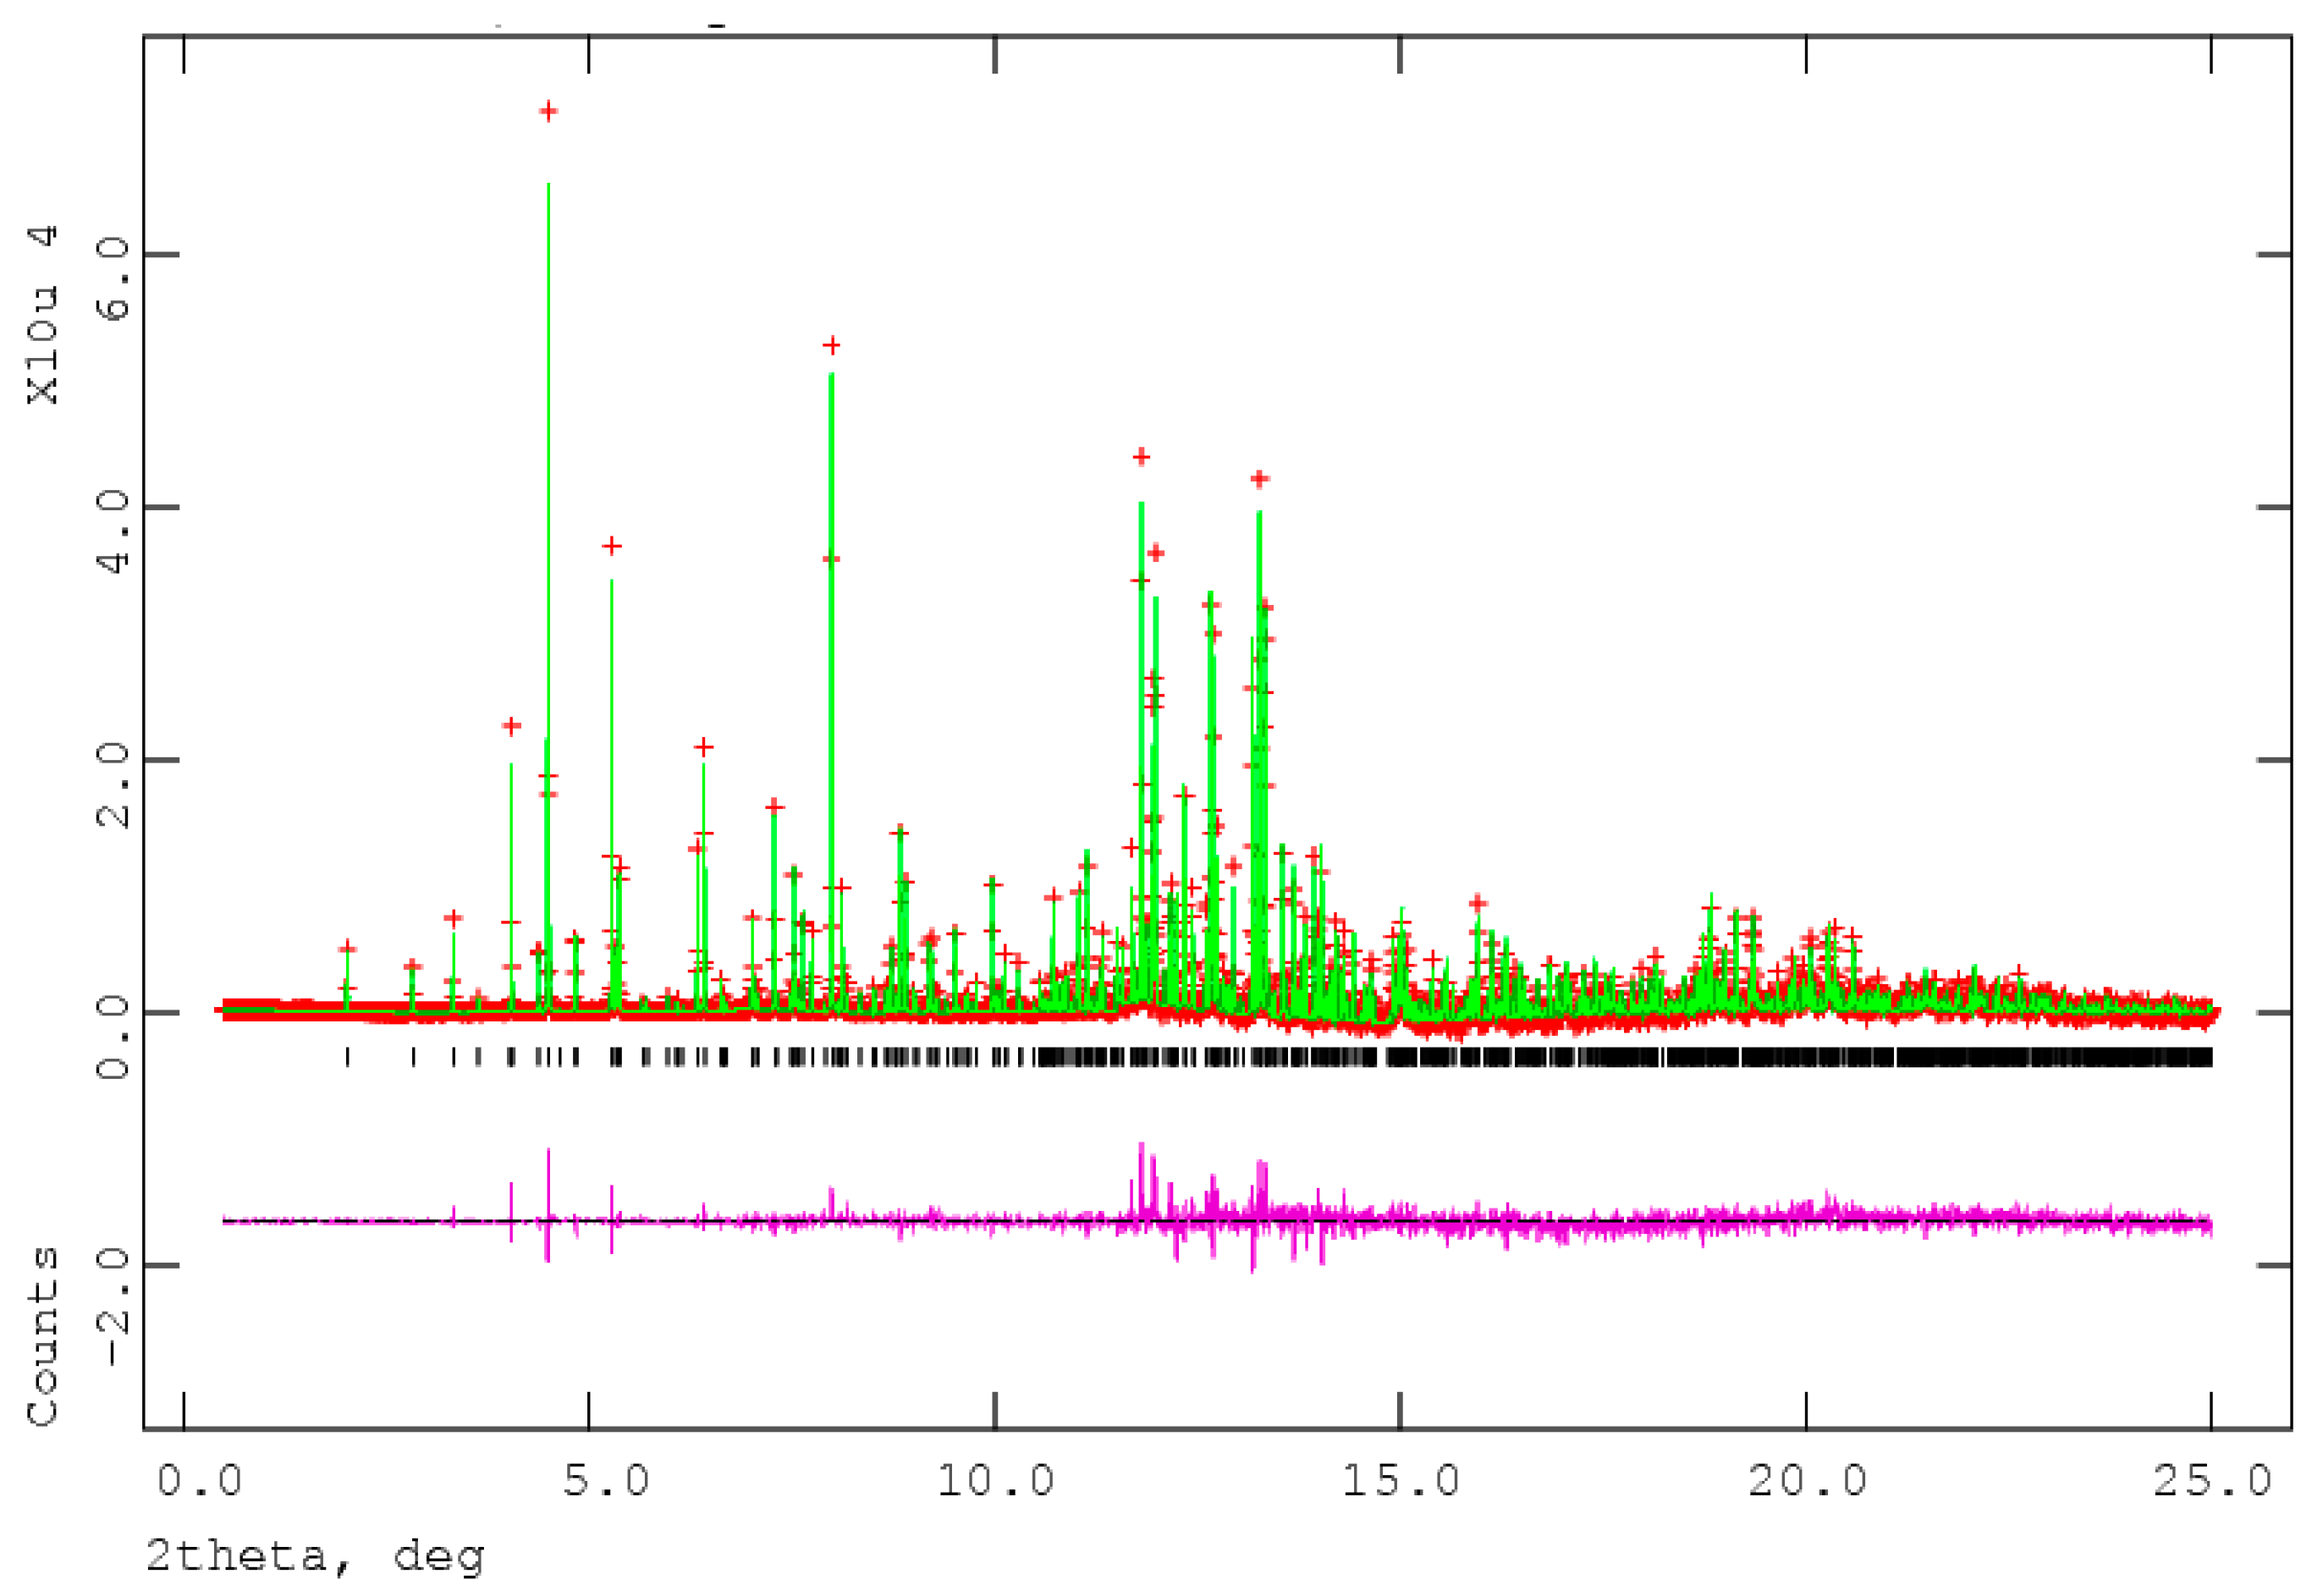
Rietveld refinement was carried out using GSAS/EXPGUI [19,23]. Only the 1.8–25.0° portion of the pattern was included in the refinement (dmin = 0.955 Å). All non-H bond distances and angles were subjected to restraints, based on a Mercury/Mogul Geometry Check [24,25]. The Mogul average and standard deviation for each quantity were used as the restraint parameters. The restraints contributed 4.2% to the final χ2. A common Uiso was refined for the atoms of the steroid ring system, and a second Uiso was refined for the substituent atoms. The hydrogen atoms were included in calculated positions, which were recalculated during the refinement using Materials Studio. The Uiso of each hydrogen atom was constrained to be 1.3× that of the non-hydrogen atom to which it was attached. The peak profiles were described using the profile function #4 [26,27], which includes the Stephens [28] anisotropic strain broadening model. The background was modeled using a three-term shifted Chebyshev polynomial, with a six-term diffuse scattering function to model the X-ray scattering of the Kapton capillary and any amorphous component. The final refinement of 87 variables using 23,264 observations (23,201 data points and 63 restraints) yielded the residuals Rwp = 0.0902, Rp = 0.0732, and χ2 = 2.221. The largest peak (1.25 Å from C11) and hole (0.80 Å from C19) in the difference Fourier map were 0.59 and −0.55 e.Å−3, respectively. The Rietveld plot is included as Figure 5. The largest errors in the fit are in the shapes of some of the strong low-angle peaks.
4. Conclusion
The crystal structure of 17α-dihydroequilin has been solved and refined using synchrotron X-ray powder diffraction data, and optimized using density functional techniques. The agreement of the refined and optimized structures provided a strong indication that an apparently correct experimental structure was wrong.
Supplementary Materials
The following files are available online at https://www.mdpi.com/2073-4352/7/7/218/s1: dihydroequilin_H22.cif (Rietveld refined crystal structure), dihydroequilin_H22_DFT.cif (DFT-optimized crystal structure).
Acknowledgments
Use of the Advanced Photon Source at Argonne National Laboratory was supported by the U. S. Department of Energy, Office of Science, Office of Basic Energy Sciences, under Contract No. DE-AC02-06CH11357. This work was partially supported by the International Centre for Diffraction Data Grant-in-Aid 09-03). We thank Lynn Ribaud for his assistance in data collection, and Andrey Rogachev for the use of computing resources at IIT.
Author Contributions
James A. Kaduk solved and refined the crystal structure, and carried out the DFT calculations. Amy M. Gindhart and Thomas N. Blanton prepared the specimen for synchrotron data collection, confirmed powder diffraction pattern indexing, and prepared the reference diffraction data for addition to the PDF.
Conflicts of Interest
The authors declare no conflict of interest.
References
- Kabekkodu, S. PDF-4+ 2016 (Database); International Centre for Diffraction Data: Newtown Square, PA, USA, 2016. [Google Scholar]
- Van de Streek, J.; Neumann, M.A. Validation of molecular crystal structures from powder diffraction data with dispersion-corrected density functional theory (DFT-D). Acta. Cryst. Sect. B Struct. Sci. Cryst. Eng. Mater. 2014, 70, 1020–1032. [Google Scholar]
- Macrae, C.F.; Bruno, I.J.; Chisholm, J.A.; Edington, P.R.; McCabe, P.; Pidcock, E.; Rodriguez-Monge, L.; Taylor, R.; van de Streek, J.; Wood, P.A. Mercury CSD 2.0-new features for the visualization and investigation of crystal structures. J. Appl. Crystallogr. 2008, 41, 466–470. [Google Scholar] [CrossRef]
- Wavefunction, Inc. Spartan ’14 Version 1.1.0; Wavefunction Inc.: Irvine, CA, USA, 2013. [Google Scholar]
- Dassault Systèmes. Materials Studio 8.0; BIOVIA: San Diego, CA, USA, 2014. [Google Scholar]
- Hirshfeld, F.L. Bonded-atom fragments for describing molecular charge densities. Theor. Chem. Acta. 1977, 44, 129–138. [Google Scholar] [CrossRef]
- McKinnon, J.J.; Spackman, M.A.; Mitchell, A.S. Novel tools for visualizing and exploring intermolecular interactions in molecular crystals. Acta. Cryst. Sect. B 2004, 60, 627–668. [Google Scholar] [CrossRef] [PubMed]
- Spackman, M.A.; Jayatilaka, D. Hirshfeld surface analysis. Cryst. Eng. Comm. 2009, 11, 19–32. [Google Scholar] [CrossRef]
- Wolff, S.K.; Grimwood, D.J.; McKinnon, M.J.; Turner, M.J.; Jayatilaka, D.; Spackman, M.A. Crystal Explorer Version 3.1; University of Western Australia: Crawley, Australia, 2012. [Google Scholar]
- Bravais, A. Etudes Cristallographiques; Gauthier Villars: Paris, France, 1866. [Google Scholar]
- Friedel, G. Etudes sur la loi de Bravais. Bull. Soc. Fr. Mineral. 1907, 30, 326–455. [Google Scholar]
- Donnay, J.D.H.; Harker, D. A new law of crystal morphology extending the law of Bravais. Am. Mineral. 1938, 22, 446–467. [Google Scholar]
- Lee, P.L.; Shu, D.; Ramanathan, M.; Preissner, C.; Wang, J.; Beno, M.A.; Von Dreele, R.B.; Ribaud, L.; Kurtz, C.; Antao, S.M.; et al. A twelve-analyzer detector system for high-resolution powder diffraction. J. Synch. Rad. 2008, 15, 427–432. [Google Scholar] [CrossRef] [PubMed]
- Wang, J.; Toby, B.H.; Lee, P.L.; Ribaud, L.; Antao, S.M.; Kurtz, C.; Ramanathan, M.; Von Dreele, R.B.; Beno, M.A. A dedicated powder diffraction beamline at the Advanced Photon Source: Commissioning and early operational results. Rev. Sci. Inst. 2008, 79, 085105. [Google Scholar] [CrossRef] [PubMed]
- MDI. Jade 9.5; Materials Data. Inc.: Livermore, CA, USA, 2010. [Google Scholar]
- Groom, C.R.; Bruno, I.J.; Lightfoot, M.P.; Ward, S.C. The Cambridge Structural Database. Acta Crystallogr. Sect. B Struct. Sci. Cryst. Eng. Mater. 2016, 72, 171–179. [Google Scholar] [CrossRef] [PubMed]
- O’Boyle, N.; Banck, M.; James, C.A.; Morley, C.; Vandermeersch Hutchison, G.R. Open Babel: An open chemical toolbox. J. Chem. Informatics 2011, 3, 33. [Google Scholar] [CrossRef] [PubMed]
- Favre-Nicolin, V.; Černý, R. FOX, ‘free objects for crystallography’: A modular approach to ab initio structure determination from powder diffraction. J. Appl. Crystallogr. 2002, 35, 734–743. [Google Scholar] [CrossRef]
- Larson, A.C.; Von Dreele, R.B. General Structure Analysis System, (GSAS); Los Alamos National Laboratory Report LAUR: Los Alamos, NM, USA, 2004. [Google Scholar]
- Dovesi, R.; Orlando, R.; Civalleri, B.; Roetti, C.; Saunders, V.R.; Zicovich-Wilson, C.M. CRYSTAL: A computational tool for the ab initio study of the electronic properties of crystals. Zeit. Kristallogr. 2005, 220, 571–573. [Google Scholar] [CrossRef]
- Dovesi, R.; Orlando, R.; Erba, A.; Zicovich-Wilson, C.M.; Civalleri, B.; Casassa, S.; Maschio, L.; Ferrabone, M.; De La Pierre, M.; D-Arco, P.; et al. A program for the ab initio investigation of crystalline solids. Int. J. Quantum Chem. 2014, 114, 1287–1317. [Google Scholar] [CrossRef]
- Gatti, C.; Saunders, V.R.; Roetti, C. Crystal-field effects on the topological properties of the electron-density in molecular crystals—The case of urea. J. Chem. Phys. 1994, 101, 10686–10696. [Google Scholar] [CrossRef]
- Toby, B.H. EXPGUI, a graphical user interface for GSAS. J. Appl. Crystallogr. 2001, 34, 210–213. [Google Scholar] [CrossRef]
- Sykes, R.A.; McCabe, P.; Allen, F.H.; Battle, G.M.; Bruno, I.J.; Wood, P.A. New software for statistical analysis of Cambridge Structural Database data. J. Appl. Crystallogr. 2011, 44, 882–886. [Google Scholar] [CrossRef] [PubMed]
- Bruno, I.J.; Cole, J.C.; Kessler, M.; Luo, J.; Motherwell, W.D.S.; Purkis, L.H.; Smith, B.R.; Taylor, R.; Cooper, R.I.; Harris, S.E.; et al. Retrieval of crystallographically-derived molecular geometry information. J. Chem. Inf. Sci. 2004, 44, 2133–2144. [Google Scholar] [CrossRef] [PubMed]
- Thompson, P.; Cox, D.E.; Hastings, J.B. Rietveld refinement of Debye-Scherrer synchrotron X-ray data from Al2O3. J. Appl. Crystallogr. 1987, 20, 79–83. [Google Scholar] [CrossRef]
- Finger, L.W.; Cox, D.E.; Jephcoat, A.P. A correction for powder diffraction peak asymmetry due to axial divergence. J. Appl. Crystallogr. 1994, 27, 892–900. [Google Scholar] [CrossRef]
- Stephens, P.W. Phenomenological model of anisotropic peak broadening in powder diffraction. J. Appl. Crystallogr. 1999, 32, 281–289. [Google Scholar] [CrossRef]
Figure 1.
The molecular structure of 17α-dihydroequilin.
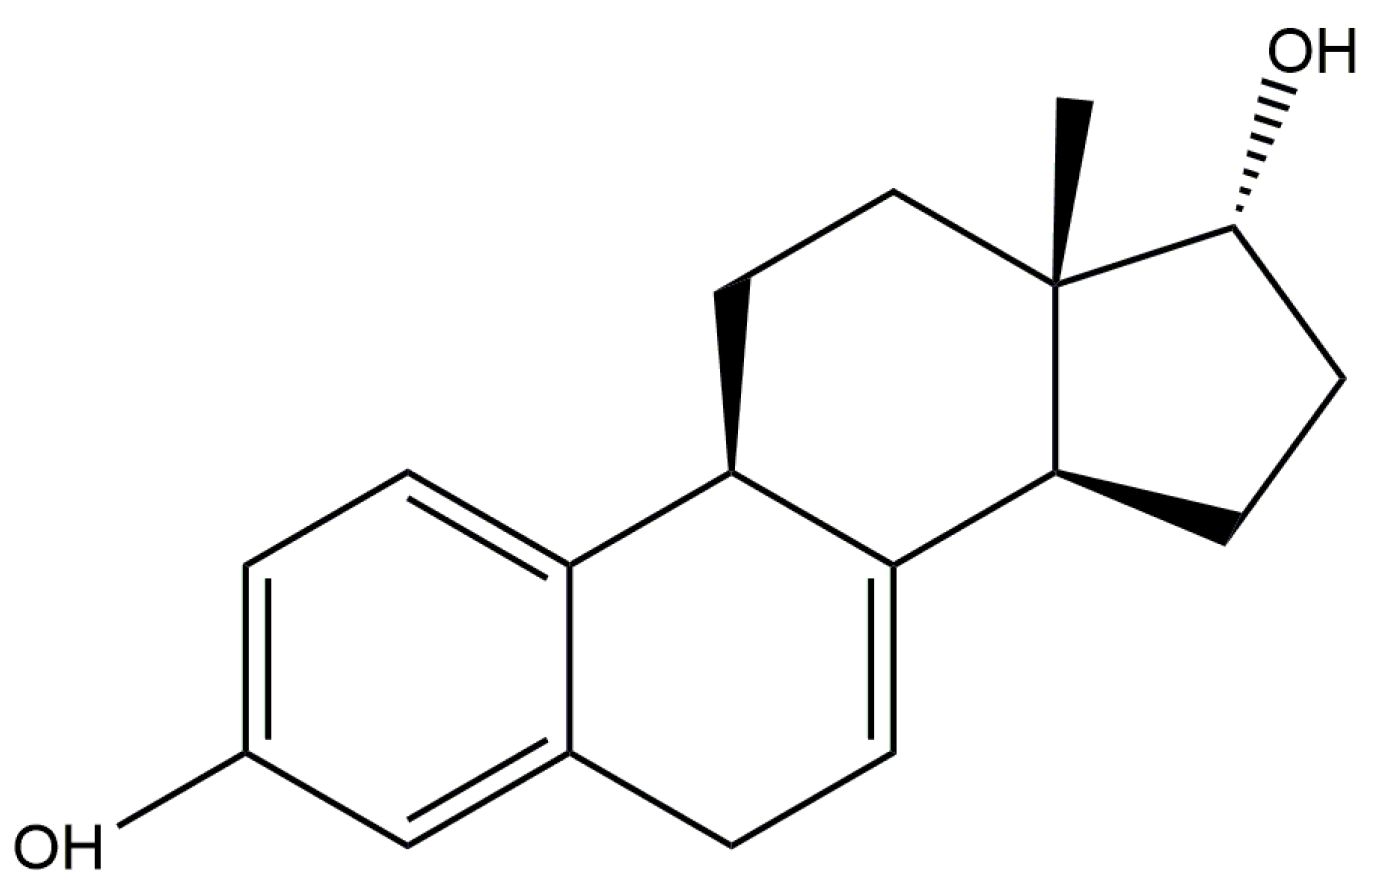
Figure 2.
The Rietveld plot for the refinement of 17α-dihydroequilin, using the incorrect molecular formula C18H20O2. The red crosses represent the observed data points, and the green line is the calculated pattern. The magenta curve is the difference pattern, plotted at the same vertical scale as the other patterns. The vertical scale has been multiplied by a factor of 5 for 2θ > 7.0°, and by a factor of 40 for 2θ > 13.0°. X-ray wavelength of 0.413342 Å.

Figure 3.
Comparison of the molecular structures of C18H20O2 and C18H22O2, viewed approximately perpendicular to the ring system.
Figure 3.
Comparison of the molecular structures of C18H20O2 and C18H22O2, viewed approximately perpendicular to the ring system.

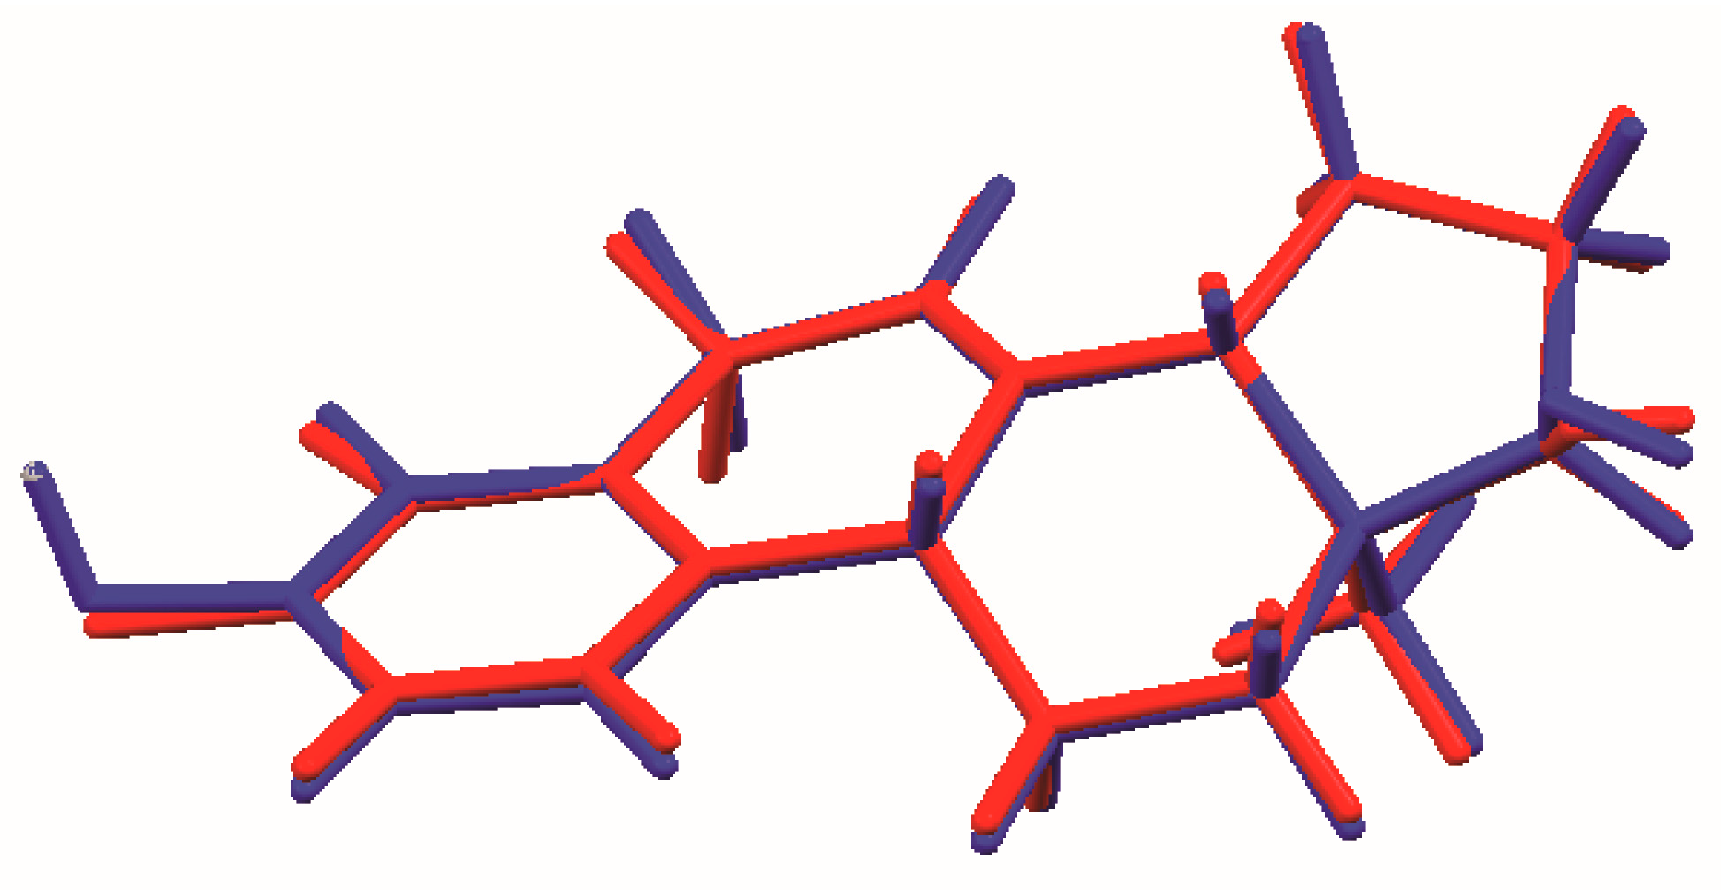
Figure 4.
Comparison of the molecular structures of C18H20O2 (red) and C18H22O2 (green), viewed approximately in the plane of the ring system.
Figure 4.
Comparison of the molecular structures of C18H20O2 (red) and C18H22O2 (green), viewed approximately in the plane of the ring system.
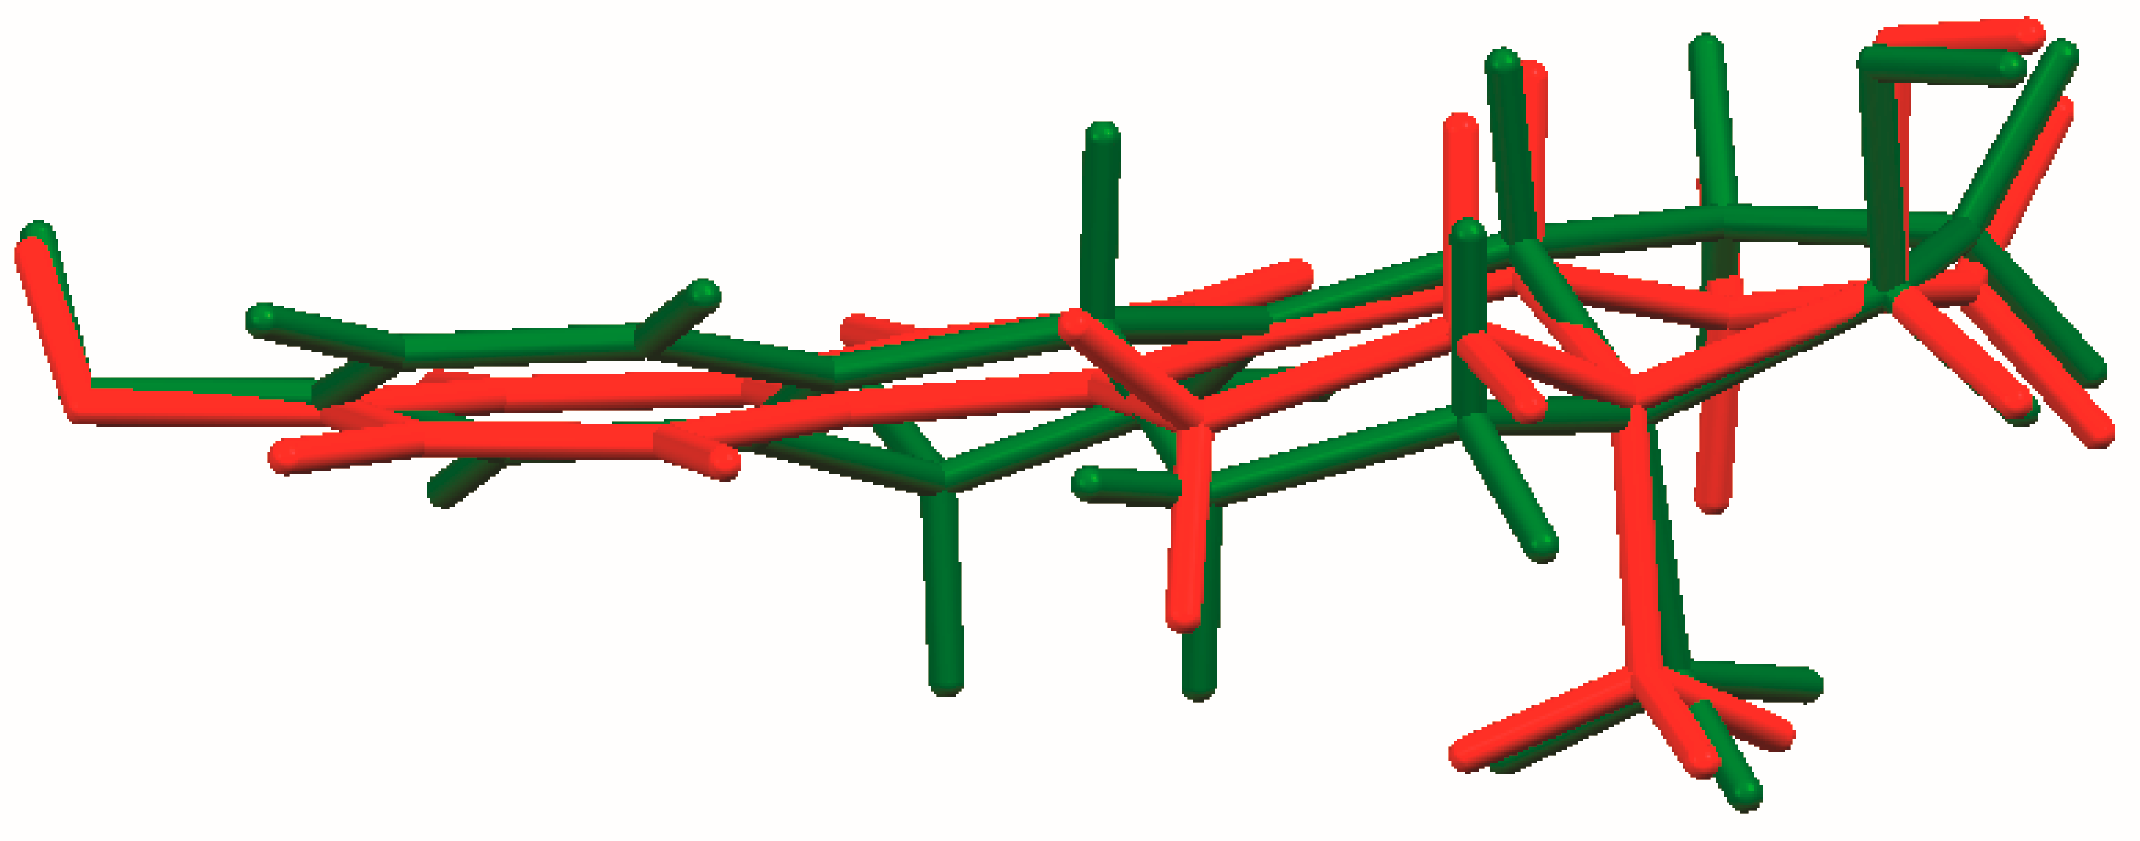
Figure 5.
The Rietveld plot for the refinement of 17α-dihydroequilin, using the correct molecular formula C18H22O2. The red crosses represent the observed data points, and the green line is the calculated pattern. The magenta curve is the difference pattern, plotted at the same vertical scale as the other patterns. The vertical scale has been multiplied by a factor of 5 for 2θ > 6.80°, and by a factor of 40 for 2θ > 11.5°. X-ray wavelength of 0.413342 Å.

Figure 6.
Comparison of the Rietveld refined (red) and DFT optimized (blue) structures of 17α-dihydroequilin.
Figure 6.
Comparison of the Rietveld refined (red) and DFT optimized (blue) structures of 17α-dihydroequilin.

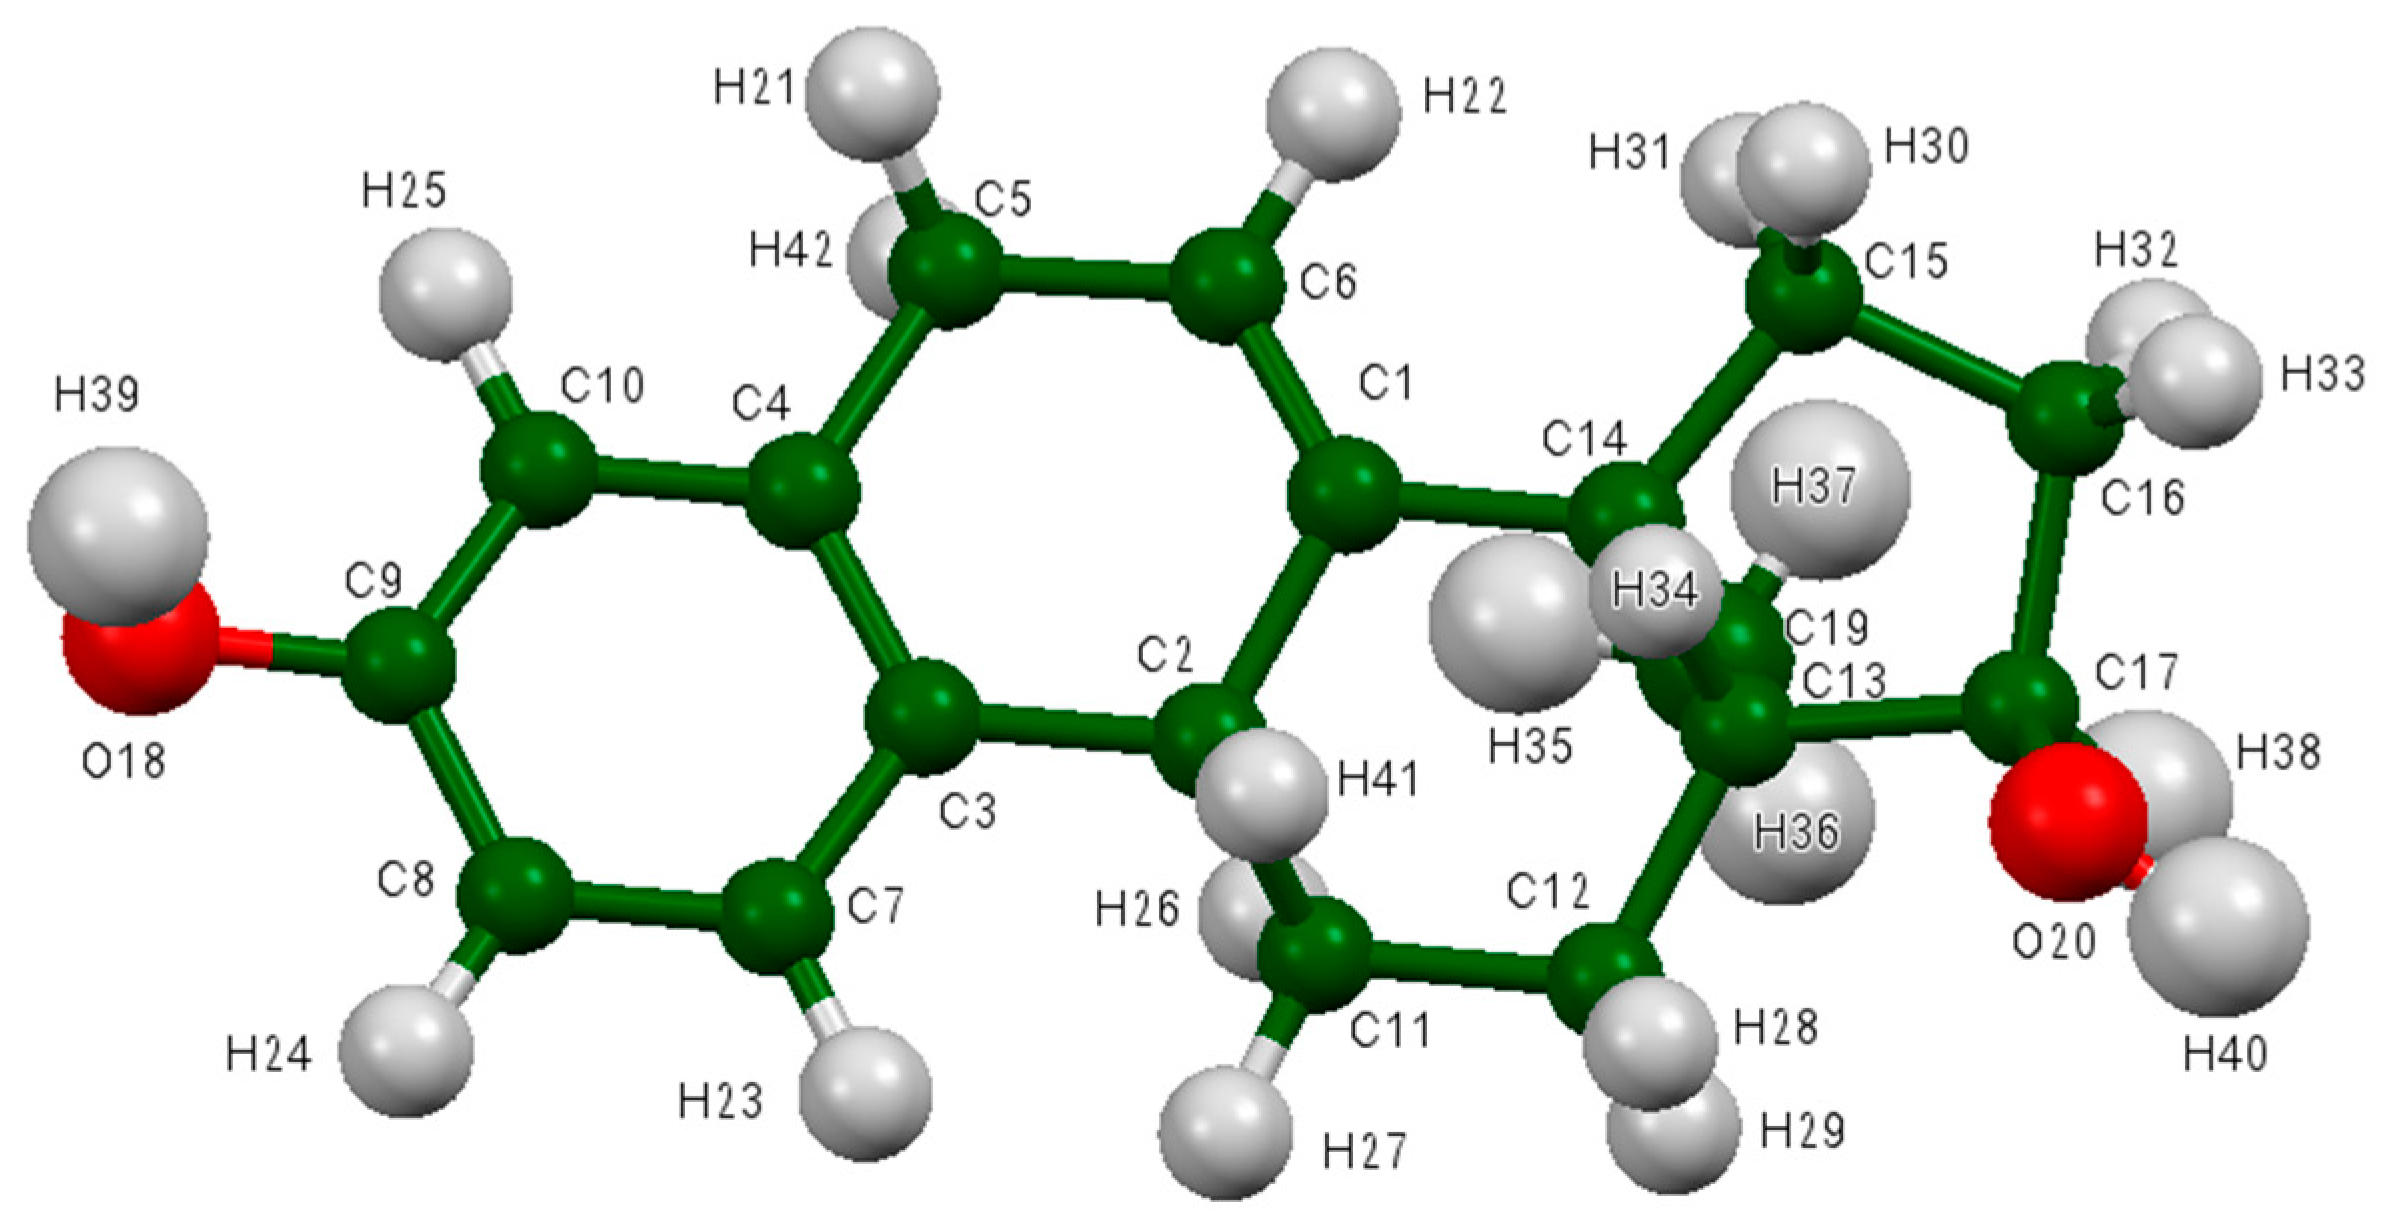
Figure 7.
The asymmetric unit of 17α-dihydroequilin, showing the atom numbering. The atoms are represented by 50% probability spheroids. C is shown in dark green, O in red, and H in light grey.
Figure 7.
The asymmetric unit of 17α-dihydroequilin, showing the atom numbering. The atoms are represented by 50% probability spheroids. C is shown in dark green, O in red, and H in light grey.

Figure 8.
The crystal structure of 17α-dihydroequilin, viewed down the a-axis. The hydrogen bonds are indicated by dashed lines.
Figure 8.
The crystal structure of 17α-dihydroequilin, viewed down the a-axis. The hydrogen bonds are indicated by dashed lines.

Figure 9.
Hirshfeld surface of 17α-dihydroequilin. Intermolecular contacts longer than the sums of the van der Waals radii are colored blue, and contacts shorter than the sums of the radii are colored red. Contacts equal to the sums of radii are white.
Figure 9.
Hirshfeld surface of 17α-dihydroequilin. Intermolecular contacts longer than the sums of the van der Waals radii are colored blue, and contacts shorter than the sums of the radii are colored red. Contacts equal to the sums of radii are white.


Table 1.
Hydrogen bonds in 17α-dihydroequilin (as calculated by CRYSTAL14).
| H-Bond | D-H, Å | H···A, Å | D···A, Å | D-H···A, ° | Overlap, e | E, kcal/mol |
|---|---|---|---|---|---|---|
| O18-H39···O20 | 0.986 | 1.943 | 2.927 | 174.9 | 0.061 | 13.5 |
| O20-H40-O18 | 0.976 | 1.952 | 2.902 | 163.6 | 0.043 | 11.3 |
© 2017 by the authors. Licensee MDPI, Basel, Switzerland. This article is an open access article distributed under the terms and conditions of the Creative Commons Attribution (CC BY) license (http://creativecommons.org/licenses/by/4.0/).
Share and Cite
MDPI and ACS Style
Kaduk, J.A.; Gindhart, A.M.; Blanton, T.N. Crystal Structure of 17α-Dihydroequilin, C18H22O2, from Synchrotron Powder Diffraction Data and Density Functional Theory. Crystals 2017, 7, 218. https://doi.org/10.3390/cryst7070218
AMA Style
Kaduk JA, Gindhart AM, Blanton TN. Crystal Structure of 17α-Dihydroequilin, C18H22O2, from Synchrotron Powder Diffraction Data and Density Functional Theory. Crystals. 2017; 7(7):218. https://doi.org/10.3390/cryst7070218
Chicago/Turabian StyleKaduk, James A., Amy M. Gindhart, and Thomas N. Blanton. 2017. "Crystal Structure of 17α-Dihydroequilin, C18H22O2, from Synchrotron Powder Diffraction Data and Density Functional Theory" Crystals 7, no. 7: 218. https://doi.org/10.3390/cryst7070218
Note that from the first issue of 2016, this journal uses article numbers instead of page numbers. See further details here.