1. Introduction
Point defects influencing the physical properties of lithium niobate crystals have been the subject of a vast number of papers presented since their first growth in 1960’s [
1]. Hydroxyl ions (OH
−) always present in LiNbO
3 crystals grown in air have proved to be excellent probes of crystal defects [
2]. The OH
− stretching vibration frequency and the shape of the corresponding absorption band significantly depend on the ion’s surroundings. This fact has allowed for a long series of defect studies: the compositional changes in the crystal (Li/Nb ratio) [
3], the changed incorporation of a number of dopants above a threshold concentration [
4], and quite recently the trapping of polarons in the OH
− ion’s immediate vicinity [
5] were able to be investigated in considerable detail.
The structure of LiNbO
3 at room temperature belongs to the trigonal R3c space group [
6]. The oxygen arrangement can be described as distorted hexagonal close packing. Along the ferroelectric axis, the cation sequence in the oxygen octahedra is Li Nb V
i Li Nb V
i, where V
i denotes an empty octahedron. In contrast to stoichiometric LiNbO
3 (sLN) with Li/Nb = 1, its congruent counterpart (cLN) with Li/Nb ≈ 0.945 contains high amounts of intrinsic defects such as antisite niobium ions (Nb on Li site, Nb
Li) and their charge-compensating lithium vacancies (V
Li), which modify the cation sequence.
SLN crystals have a number of specific properties not shown by cLN [
7]. This comes first of all from the strongly reduced number of intrinsic defects. Dopants are often used to obtain new or improved capabilities of the crystal. Among them, rare-earth ions (RE) are introduced to LiNbO
3 to serve as laser activators [
8] or, more recently, as active scattering centers in coherent quantum optical experiments [
9]. Their spectroscopic properties in sLN significantly differ from those observed in cLN; in particular, the linewidths of the optical absorption and luminescence signals are much narrower, due to the more regular crystal structure of sLN [
10].
It is well-known that the optical damage resistance of LiNbO
3 can be increased by special dopants called ODR ions, like Mg
2+, Zn
2+, In
3+, Sc
3+, Hf
4+, Zr
4+, and Sn
4+ (see, e.g., Ref. [
7] and references therein). Above a threshold concentration that depends on crystal stoichiometry and the valence state of the dopants, the photorefractive damage is strongly suppressed. While this concentration is in the range of several (2–7) mol% for cLN it is usually only 0.1–0.2 mol% for closely stoichiometric LiNbO
3 [
4,
7]. According to the widely-accepted defect model, Nb
Li ions are absent in over-threshold LN and the ODR dopants, incorporating only at Li sites below the threshold, start occupying also Nb sites.
In undoped stoichiometric LiNbO
3 crystals (Li/Nb = 1), a single narrow absorption band (full width at half maximum, FWHM < 3 cm
−1) can be observed at 300 K at about 3466 cm
−1 due to the stretching vibration of hydroxyl ions [
3]. Theoretical ab initio calculations showed this band to belong to an OH
− ion substituting for an O
2− ion close to a Li vacancy [
11]. In nearly stoichiometric LiNbO
3 (Li/Nb ≈ 1), a weak satellite band appears at about 3480 cm
−1 and an even weaker one at about 3490 cm
−1, attributed to some remaining defects related to non-stoichiometry (e.g., Nb
Li and/or V
Li) perturbing the hydroxyl vibration [
3]. In stoichiometric or nearly stoichiometric crystals containing ODR dopants above the photorefractive threshold concentration new OH
− absorption bands appear at vibrational frequencies between 3470 and 3540 cm
−1, depending on the valence state of the dopants [
4]. These bands have been attributed to the vibration of hydroxyl ions in defect complexes containing the ODR dopants at Nb sites (M
n+Nb-OH
−, where M
n+ = Mg
2+, Zn
2+, In
3+, Sc
3+, Hf
4+, Zr
4+ or Sn
4+) that are charge compensated by M
n+Li ions. In Mg
2++RE
3+ and Mg
2++TR
3+ double-doped cLN (where TR
3+ = Fe
3+ or Cr
3+ transition metal ions), additional OH
− bands have been observed between 3500 and 3525 cm
−1 and interpreted as hydroxyl vibration in defect complexes where the second dopant occupies a Nb site [
12,
13]. To our knowledge, no systematic investigations of the hydroxyl defects have been carried out for double-doped stoichiometric LN crystals. Rare examples are Mg
2++Nd
3+ and Zn
2++Nd
3+ doped near-sLN [
14,
15] where no OH
− band corresponding to the presence of Nd
3+ has been detected, and Mg
2++Er
3+ doped sLN [
16] where the OH
− band at about 3489 cm
−1 has been attributed to an Er
3+Li − OH
− defect. In RE
3+-doped cLN, apart from the well-known broadened intrinsic OH
− band at about 3485 cm
−1, no dopant-related additional OH-bands have been reported.
In the present work, sLN crystals doped only with RE3+ ions have been investigated using OH− vibrations as a probe of dopant incorporation to test assumptions concerning threshold behavior and defect models of RE dopants. The obtained results are discussed based on the comparison with previous experimental findings for both RE and ODR ion doped LiNbO3.
2. Experimental
Er
3+, Yb
3+ or Nd
3+ doped sLN crystals were grown by the high-temperature top-seeded solution growth (HTTSSG) method [
3], using a computer controlled resistance heated crystal growth apparatus from flux containing Nb
2O
5, Li
2O, K
2O, and RE
2O
3, with molar ratios [K
2O]/[Nb
2O
5] = 0.31, [Li
2O]/[Nb
2O
5] = 1 and [RE
2O
3]/[Nb
2O
5] between 0.001–0.02; therefore, the amount of RE oxides in the flux was between 0.04 and 0.87 mol%, with the upper limit well above the expected threshold concentrations for trivalent ODR ions in sLN. Nb
2O
5 Starck LN grade, Li
2CO
3 Alfa Puratronic, K
2CO
3 Merck p.a. and RE
2O
3 Alfa Puratronic were used as raw materials. Crystals were grown along the
Z direction with a diameter of 16 mm. The pulling and rotation rates were 0.1 mm/h and 20–40 rpm, respectively. Yb
3+ and Nd
3+ doped sLN crystals were also grown by the Czochralski method, starting from melt characterized by Li/Nb = 1.38. Both the HTTSSG and Czochralski techniques resulted in nearly stoichiometric crystals with Li/Nb ratio close to 1, as determined by the method described in Ref. [
17]. In both cases, the crystals were grown in air at about 1050–1250 °C, allowing for the incorporation of hydroxyl ions [
2].
Table 1 lists the rare-earth doped crystals grown for the experiments. Beside the concentration of RE
2O
3 in mol%, the [RE]/[Nb] molar ratio in the solution/melt is also given to facilitate an easy comparison with the RE concentration in the crystal which is given in atomic% relative to the number of LiNbO
3 molecules (it is practically equal to the [RE]/[Nb] × 100 ratio in the crystal). The real Er content incorporated in the lattice has been determined by two independent methods: (i) the transition strength for the
4I
15/2-
4I
13/2 transition at 6529 cm
−1 taken from Ref. [
18] has been used to calculate the Er concentration from the absorption spectrum measured at 300 K, and (ii) a high-resolution continuum source flame atomic absorption spectrometer (HR-CS-FAAS, ContrAA-700, Analytik Jena AG, Jena, Germany) has been applied using pneumatic nebulization of the solutions obtained by the digestion of the crystal samples, as described in detail in Ref. [
19]. The two methods supplied very similar data within a factor of two for all four crystals. In spite of some scattering of the atomic absorption spectroscopic data due to the inhomogeneities of the crystals, a saturation of the Er content could be observed as a function of the Er concentration in the solution for both methods. Such saturation has been reported for the incorporation of Er into cLN crystals at a much higher doping level [
20]. The concentrations of the Er
3+ ions in our sLN crystals listed in
Table 1 are averages of the values obtained by the two methods. The incorporation of Yb
3+ and Nd
3+ ions has also been checked by measuring the transition strengths for the
2F
5/2 and
4I
13/2 excited levels, respectively, and a behavior essentially similar to that of the Er dopant has been observed.
Oriented (Z-cut) samples of about 3–5 mm thickness were prepared both for RE and hydroxyl absorption measurements. The crystals were placed in the vacuum chamber of a BRUKER IFS 66v/S FTIR spectrophotometer (Ettlingen, Germany) to avoid interference with the surrounding water molecules. The spectra were recorded in transmission mode at 300 K with a resolution of 0.5 cm−1. The polarization dependence was measured on Y-cut samples using a KRS-5 wire grid polarizer (Graseby Specac, Orpington, England).
3. Results and Discussion
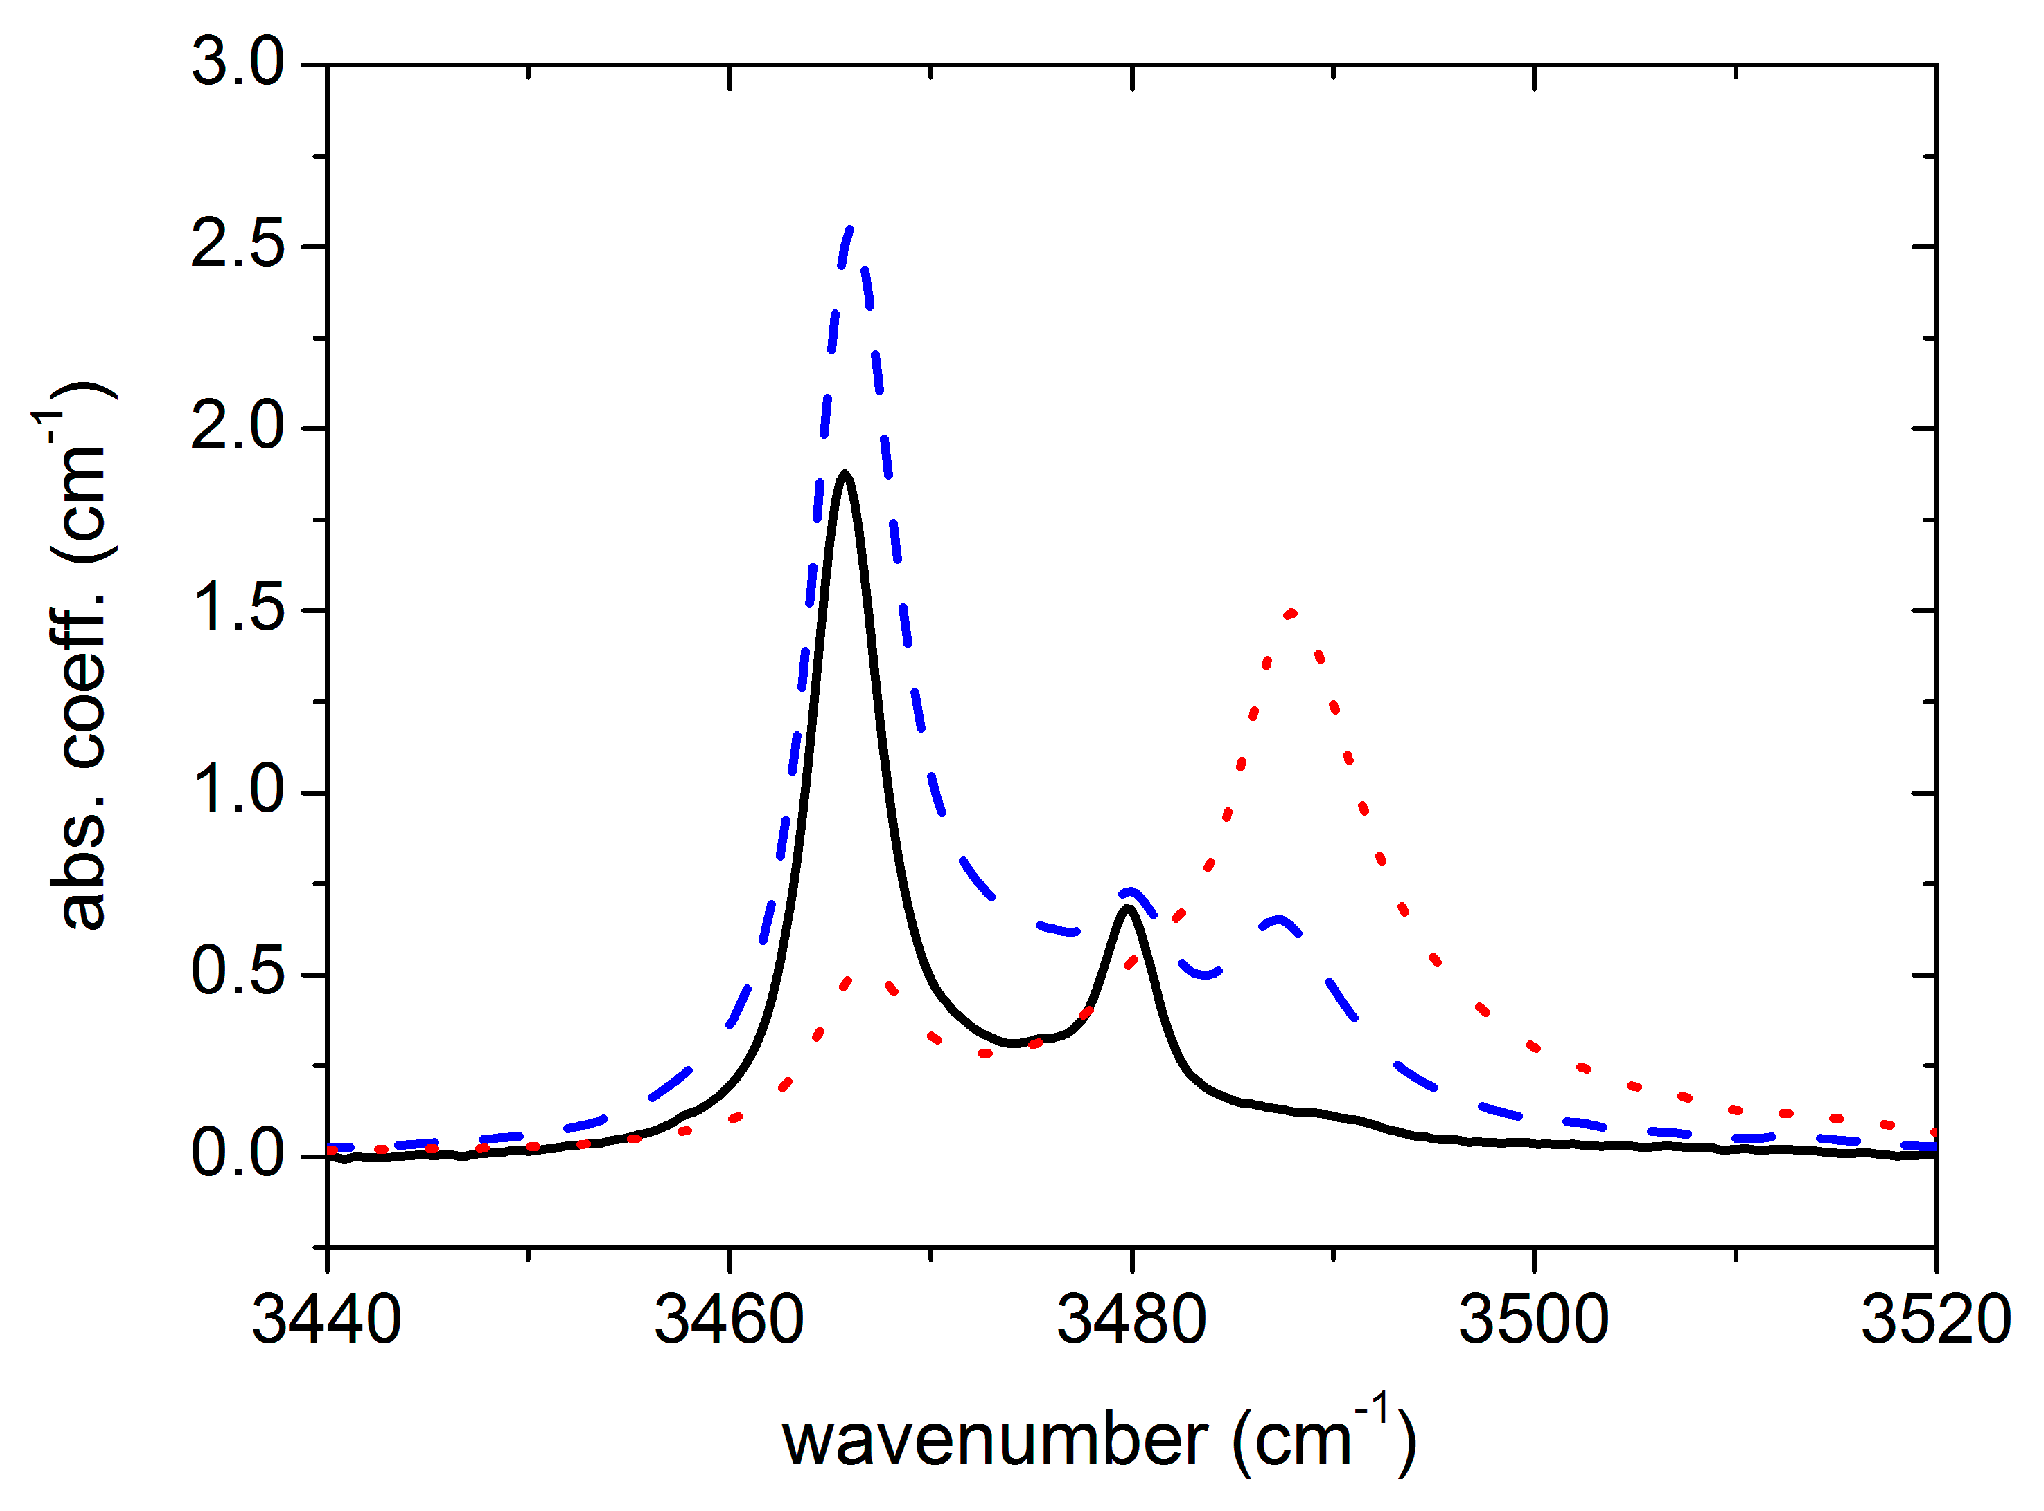
Figure 1 shows the OH
− absorption spectra of sLN crystals doped with various amounts of erbium. At low concentrations (0.24 atomic% Er
3+) the spectrum resembles that of the undoped crystal, with the main absorption band peaking at about 3466 cm
−1 with two satellites at ≈3480 and ≈3490 cm
−1, as described above. At about 0.4–0.5 atomic% nominal Er concentration, a new OH
− absorption band appears at about 3488 cm
−1. The sum of the new and the main band corresponds to the full number of OH
− molecules in the crystal, which may vary from sample to sample. The higher the erbium concentration in the crystal, the more intense the absorption band found at 3488 cm
−1. An OH
− absorption band at 3489.4 cm
−1 has already been detected for an 0.5 mol% Er
2O
3-doped sLN crystal grown by the Czochralski method from a melt containing 59 mol% Li
2CO
3 and 41 mol% Nb
2O
5 [
16]. Though the method of crystal growth was different from ours, the OH
− band observed seems to be the same. The vibrational frequency of the new OH
− band is close to those observed in trivalent ODR ion doped sLN crystals at 3505 cm
−1 for In
3+ and Sc
3+ [
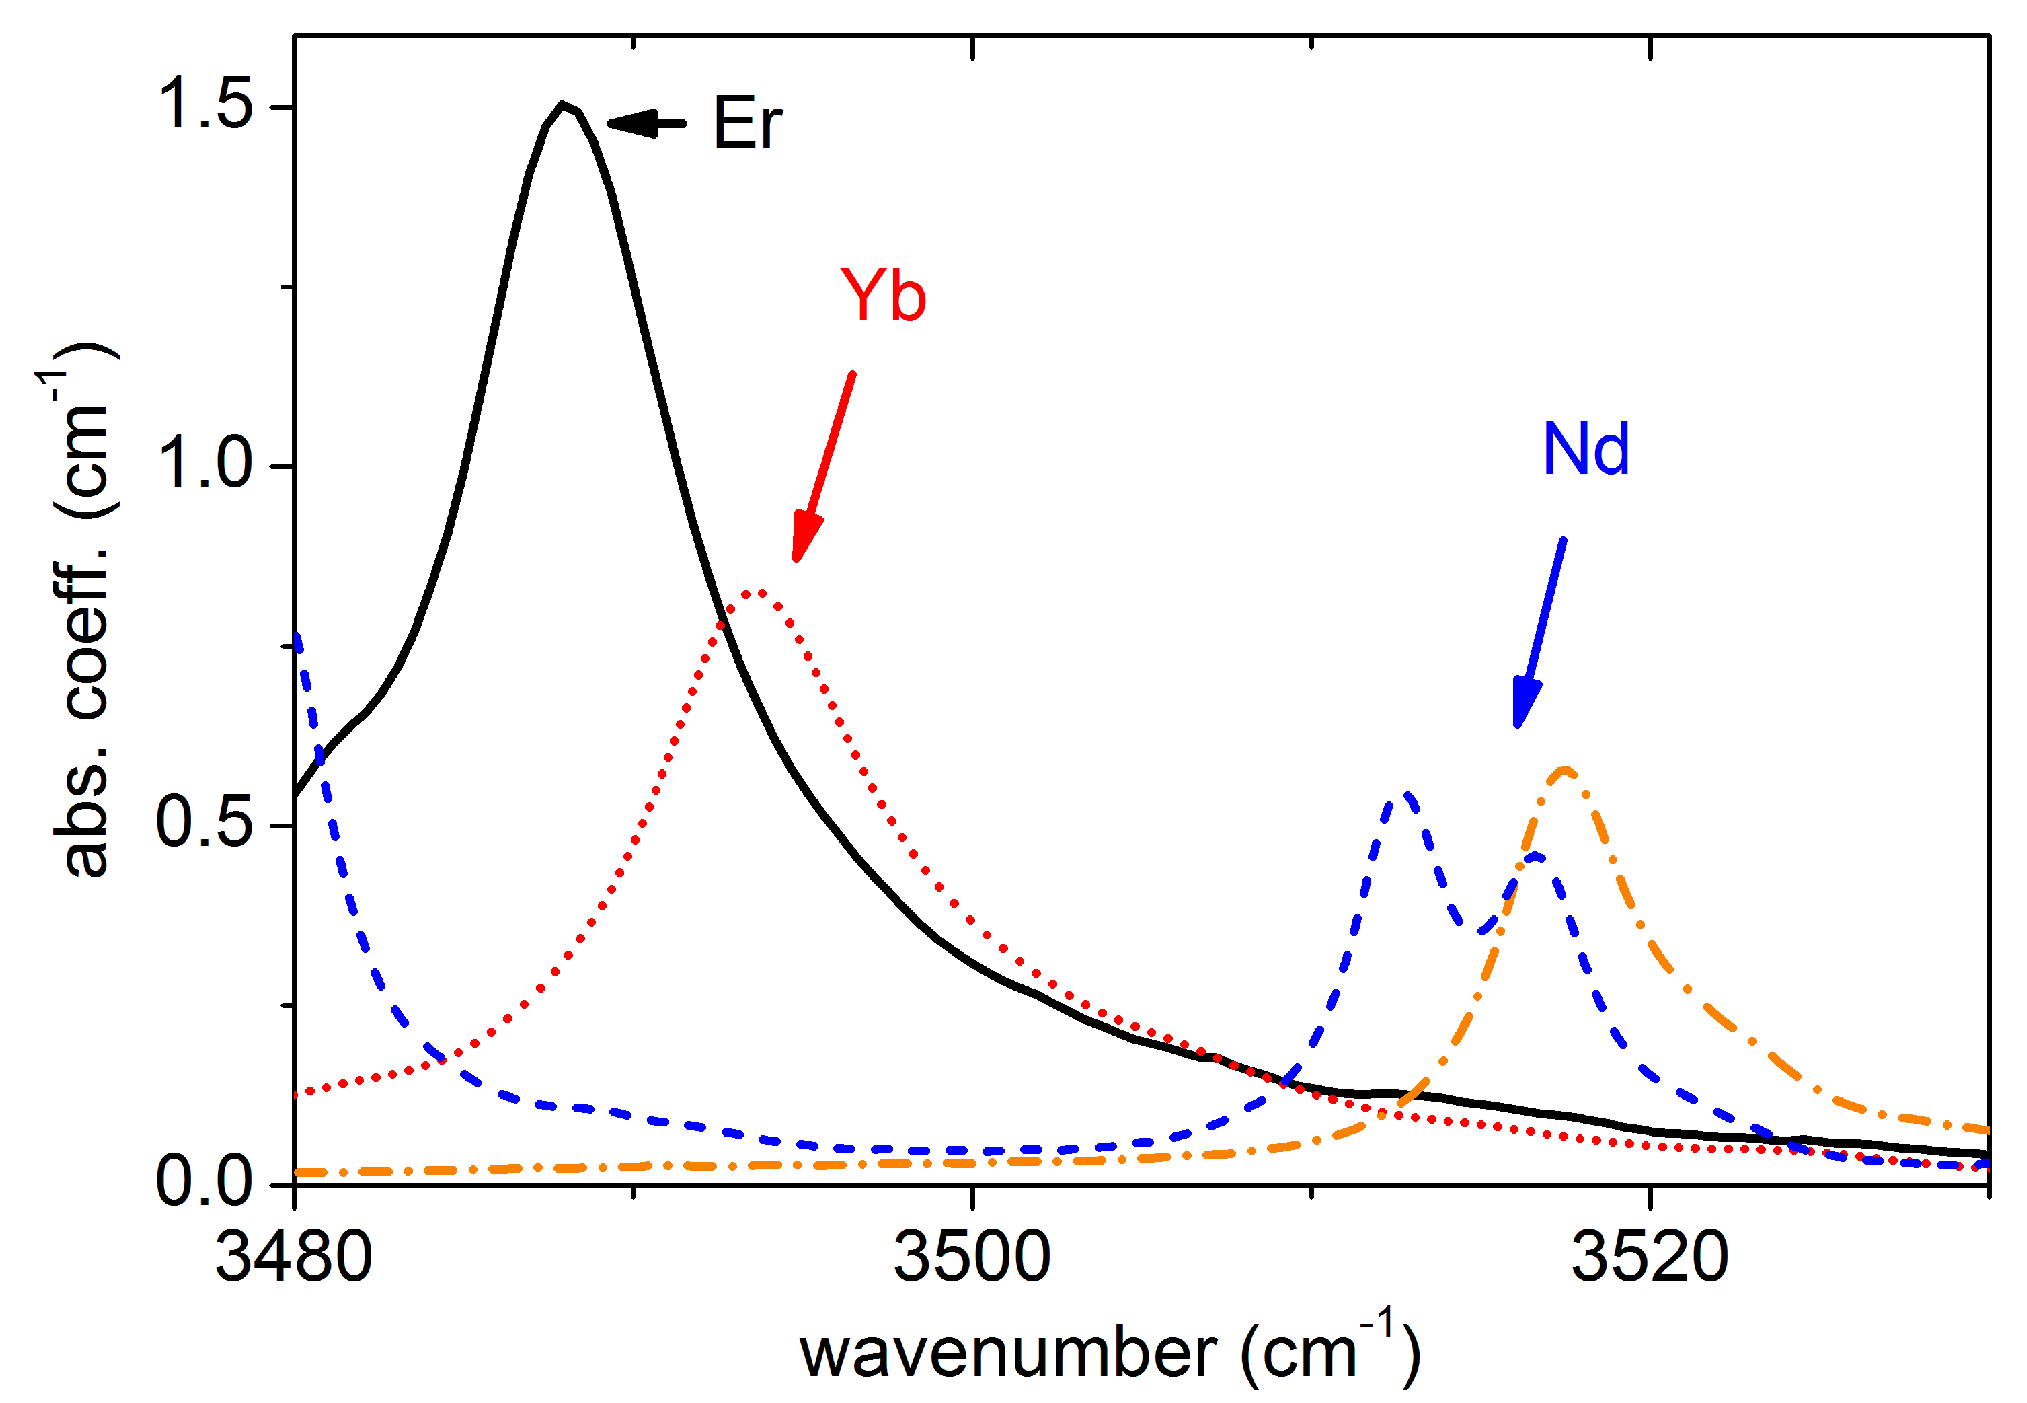
4]. New bands have also been observed for the other two rare-earth ion-doped sLN crystals, at 3494 cm
−1 for Yb
3+ and at 3513–3518 cm
−1 for Nd
3+ as seen in
Figure 2. While the OH
− bands for Yb
3+ doped sLN grown by the Czochralski and HTTSSG methods were similar, the Nd
3+ doped crystal grown by the HTTSSG technique showed a double OH peak, which will be discussed later. The observed OH
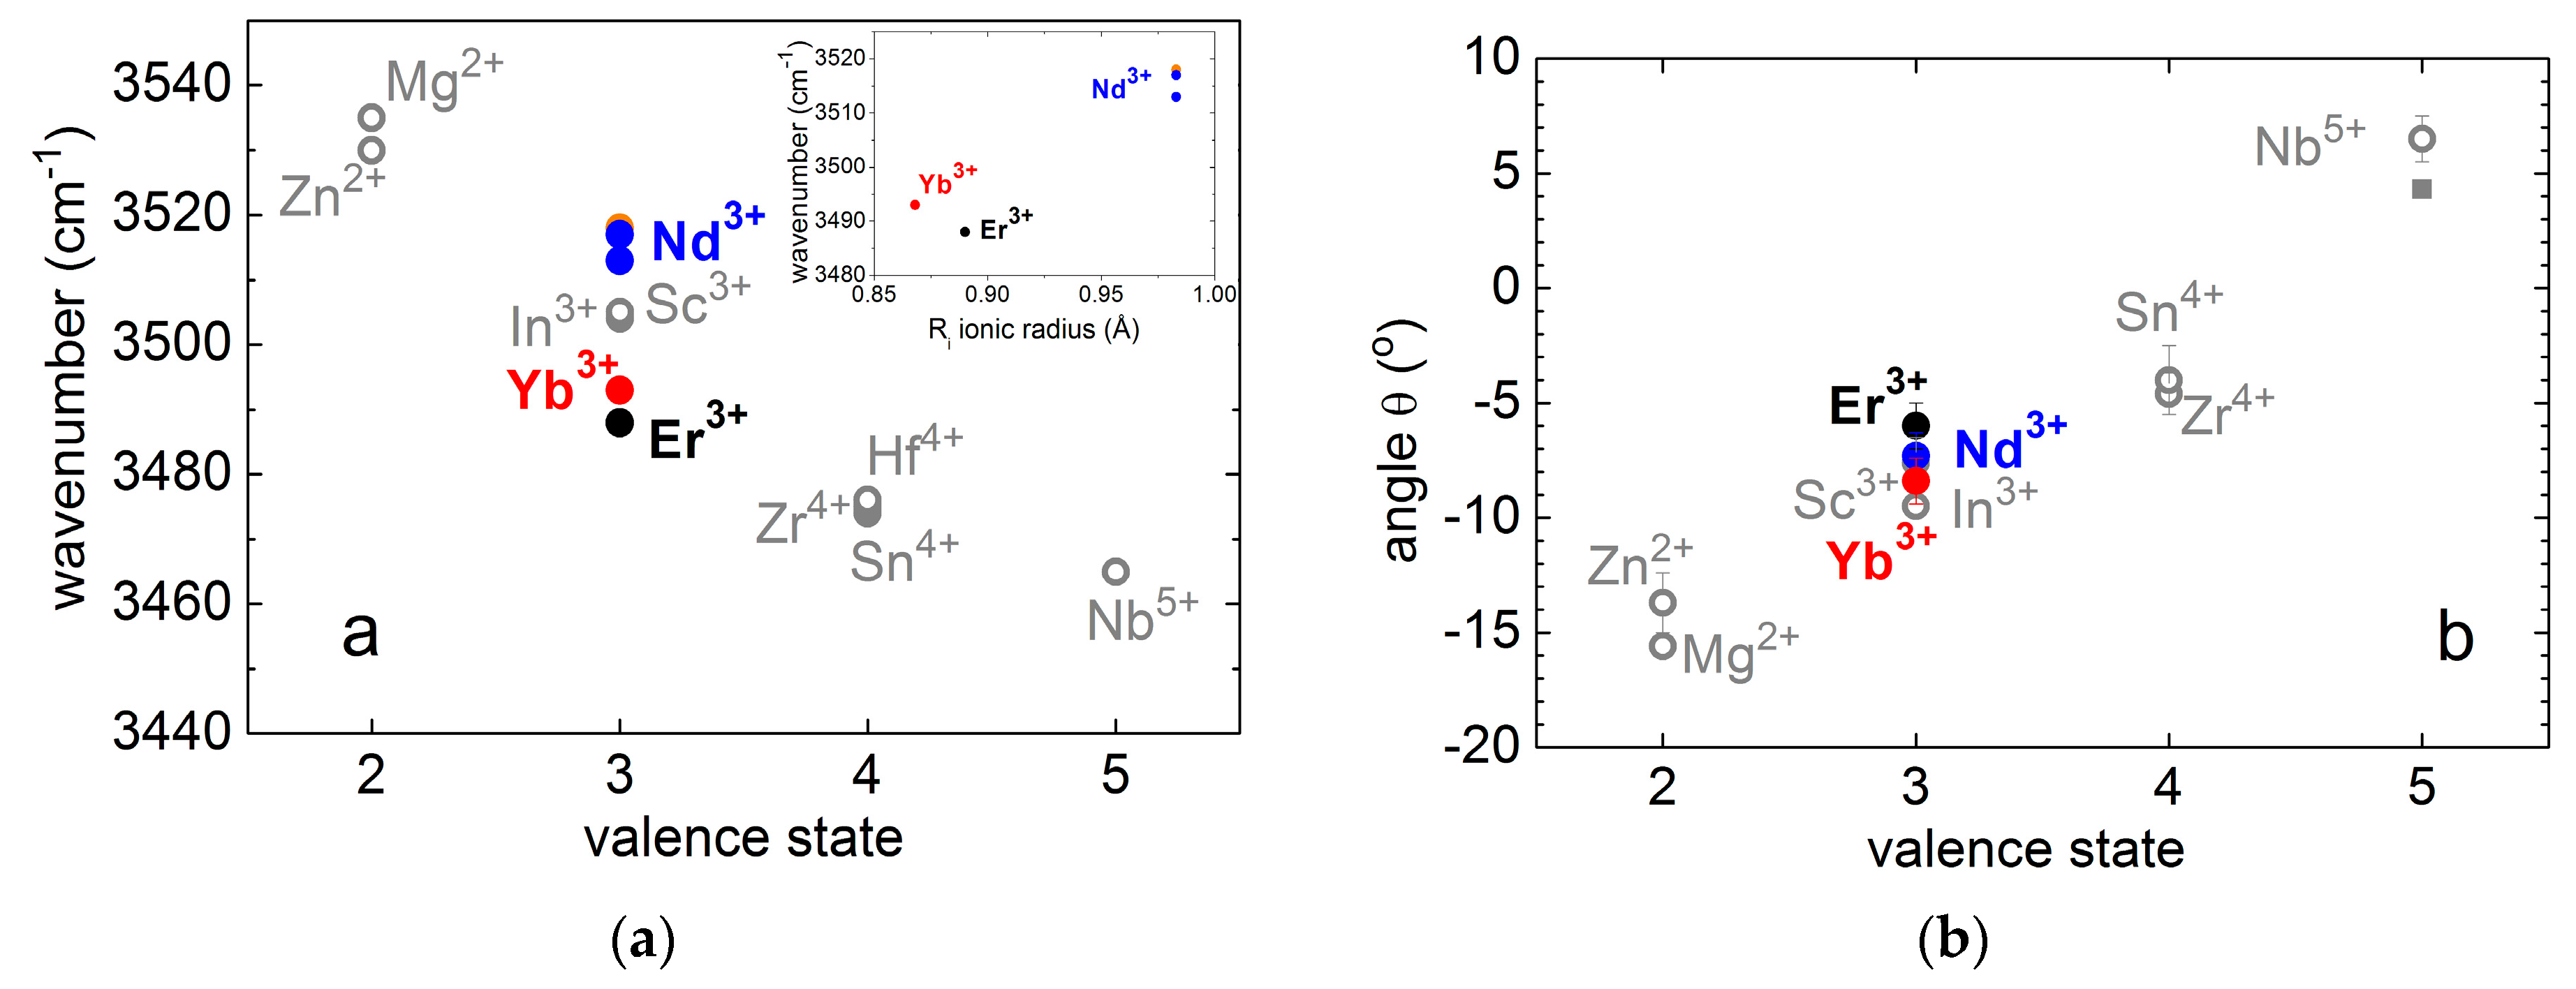
− vibrational frequencies of the RE doped sLN crystals fit into the general decreasing trend found earlier for ODR ion doped sLN with increasing valence state of the dopants (see
Figure 3a).
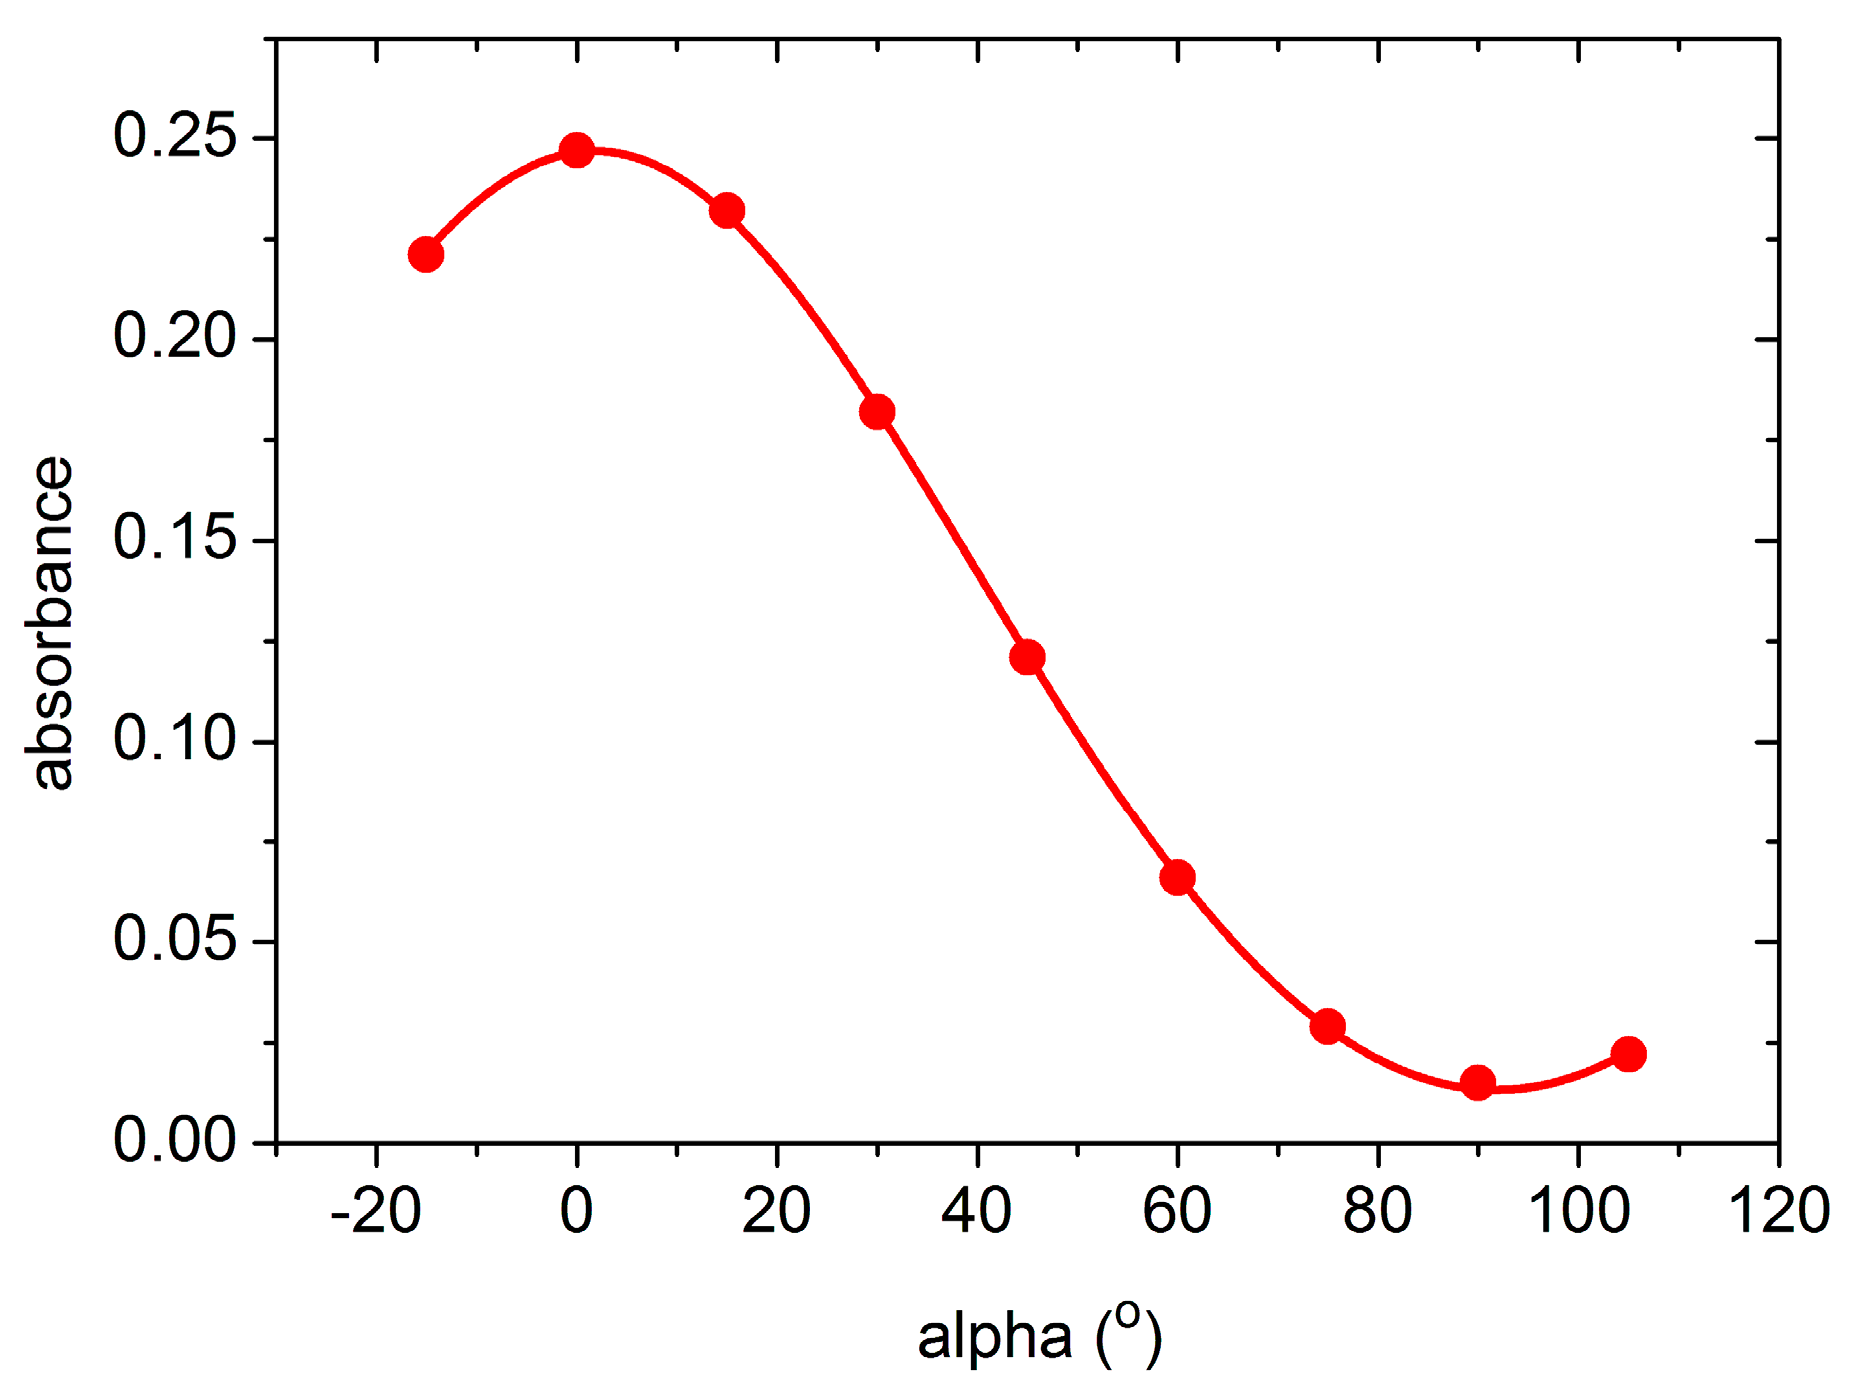
From the polarization dependence of the OH
− band, the direction of the O-H dipole can be determined with respect to the oxygen plane perpendicular to the ferroelectric
Z axis of LN crystals. As an example, the polarization dependence of the intensity of the new band observed in Yb-doped sLN crystals is shown in
Figure 4, where alpha is the angle between the oxygen plane perpendicular to the
Z axis and the electric field vector E of the incident light. The angle θ between the O-H bond and the oxygen plane can be determined from the a
X/a
Z absorbance ratio using Equation (1) from Ref. [
21]:
Fitting this equation to the experimental data, the angle θ
3493 = 8.4° has been obtained. This value, together with θ
3488 = 6° and θ
3518 = 8° determined for the O-H bond in the Er
3+ and Nd
3+ doped sLN crystal, respectively, follow the trend observed for the ODR ions, as shown in
Figure 3b.
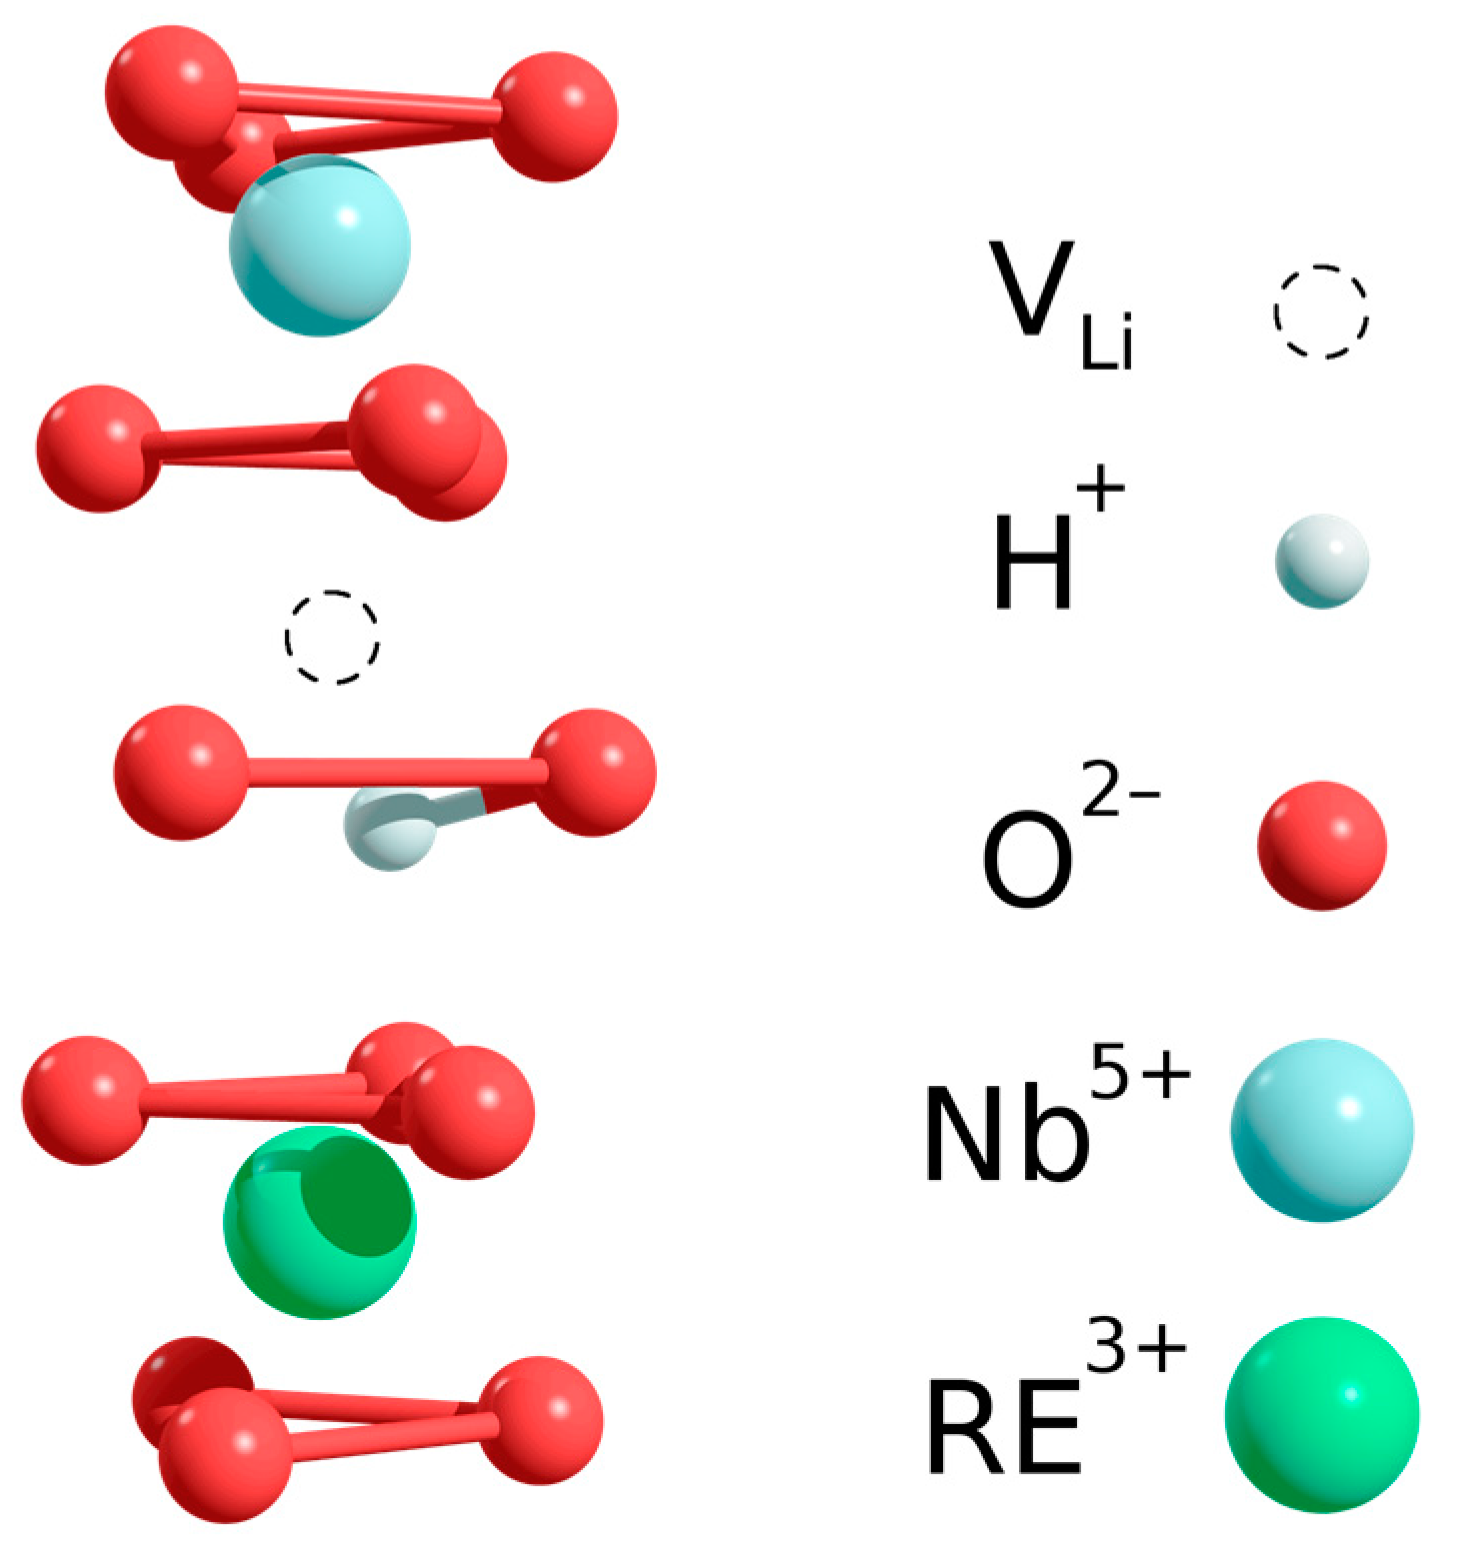
The excellent fit of both vibrational frequency and O-H bond angle to the trend already observed for ODR ions in sLN:RE as a function of valence state suggests that the OH
− ions in sLN:RE form similar defect complexes to those in ODR ion doped sLN crystals, i.e., the hydroxyl ions are close to the rare-earth ions occupying Nb site (RE
3+Nb-OH
−). A schematic drawing of the defect complex is shown in
Figure 5: the rare-earth ion occupies a Nb site while the proton is bound to an oxygen shared by two octahedra containing in turn a structural and a Li vacancy, the O-H bond being directed along a bisector plane of the oxygen triangle and tilted by about 6–8 degrees out of the oxygen plane towards the structural vacancy.
These RE
3+Nb-OH
− complexes are present in sLN crystals above a given concentration of rare-earth dopants (threshold effect), as has also been observed for ODR ions. This concentration for rare-earth ions is similar to the threshold value for ODR ions, i.e., several tenths of atomic% in sLN crystals [
4]. For rare-earth ions, the term “threshold” possibly doesn’t mean a photorefractive damage threshold, but implies the concentration of the dopant above which the rare-earth ions can occupy Nb sites in the lattice. The threshold concentration can hardly be determined more precisely, since the dopants present in the melt or solution during growth may diversely influence the actual Li/Nb ratio; accordingly, the crystal cannot be regarded as perfectly stoichiometric any more. The extent of non-stoichiometry can also vary for different RE dopants. In any case, we stick to the assumption that the new OH
− bands appear in the crystal when the rare-earth dopants start to occupy Nb sites. Due to the missing positive charges (compared to the perfect lattice) the RE
3+Nb defect attracts protons, i.e., RE
3+Nb-OH
− complexes can easily be formed. Since the hydroxyl ion concentration (≈10–100 ppm [
2]) is typically lower by orders of magnitude than the rare-earth concentration in these crystals, only a small proportion of the incorporated rare-earth ions are involved in the complex; the others are assumed to preferentially occupy Li sites, as is generally concluded from results obtained by other techniques [
7] (a trend valid for other dopants as well). It should be noted that both OH
− bands (those which characterize the undoped and heavily RE-doped crystals) can be seen in the absorption spectra of the sLN crystals grown from flux containing 0.44 mol% RE oxides. It can be assumed that OH
− centers preferentially associate with RE
3+Nb ions, as already shown for LN:Mg in [
22], so the amount of RE
3+ on Nb sites may be estimated to be of the same order as the OH
− content of these samples.
Although the vibrational frequencies of the hydroxyl ions in RE
3+Nb-OH
− complexes follow the trend observed for ODR ions as shown in
Figure 3a, their values differ by about 20–30 cm
−1. This difference may come from the different ionic radii of the rare-earth ions. The frequencies of OH
− forming complexes with erbium or ytterbium having similar ionic radii (0.89 and 0.87 Å, respectively) are close to each other, but for the large Nd
3+ ion (r = 0.98 Å) [
23] the OH
− vibrational frequencies are significantly higher. This can qualitatively be understood taking into account the longer O-O distances in the oxygen octahedron containing the large Nd
3+ ion and the concomitant smaller extension of the nearby oxygen octahedra, resulting in a stronger O-H bond which can increase the vibrational frequency.
It is interesting to compare our results with those observed for cLN crystals double-doped with Mg and RE ions [
12]. Similarly to sLN:RE, no antisite niobium ions are present in cLN:Mg+RE with Mg concentrations above the threshold, and the RE
3+ ions are expected to also enter Nb sites, forming RE
3+Nb-OH
− complexes. Indeed, such OH
− bands were detected in double-doped cLN at about 3491 cm
−1 for Mg+Er and 3522 cm
−1 for Mg+Nd [
12]. At that time, however, IR spectrometers with grating monochromators were used with less accurate wavenumber calibrations than the FTIR spectrometers applied nowadays. Taking into account the position of the Mg-OH bands found at about 3538 cm
−1 earlier [
12] and at 3536 cm
−1 more recently [
4], a correction by 2 cm
−1 to lower wavenumbers should also be necessary for the other bands. Accordingly, the OH
− bands for Er and Nd in double-doped cLN have to be assumed to be at about 3489 and 3520 cm
−1, respectively, which is in relatively good agreement with our present results (3488 and 3518 cm
−1). The re-measurement of the Mg+Nd and Mg+Er co-doped cLN crystals fully confirmed our correction. This agreement, however, has a serious consequence for the previous model [
12], assuming O-H stretching vibrations in Mg
2+Li-OH
−-RE
3+Nb complexes. In fact, our recent results show that the OH
− absorption bands in double-doped cLN, similar to single RE
3+-doped sLN, originate from OH
− ions in RE
3+Nb-OH
− defects without Mg, as was pointed out by Kong et al. [
24] based on their nuclear magnetic resonance measurements. In fact, an additional charge compensator like Mg
Li in the imminent neighborhood of the RE
3+Nb-OH
− complex might result in a measurable shift of the OH
− vibration frequency, as suggested by the pronounced sensitivity of the latter to the charge of adjacent cations as displayed by
Figure 3a.
As shown in
Figure 2, a two-component band peaking at 3513 and 3517 cm
−1 has been observed in Nd
3+ doped sLN grown by the HTTSSG method, in contrast to the Czochralski grown crystal. The reason for this splitting is not yet known; it may originate from the existence of non-equivalent Nd centers at Nb sites, similar to the case of below-threshold systems, where Nd ions were reported to occupy various off-centered Li sites with non-equivalent local environments [
25]. A high number of non-equivalent centers have also been reported for Er [
25,
26,
27] or Yb [
25,
28,
29] doped LN crystals due to the presence of various charge compensating defects in the neighborhood of the dopants occupying Li sites. Similar non-equivalent local environments may also be present for Er and Yb sitting on Nb sites in our highly doped sLN crystals, resulting in broadening and the appearance of some shoulders of the OH
− vibrational bands seen in
Figure 2.

 ,
, 


