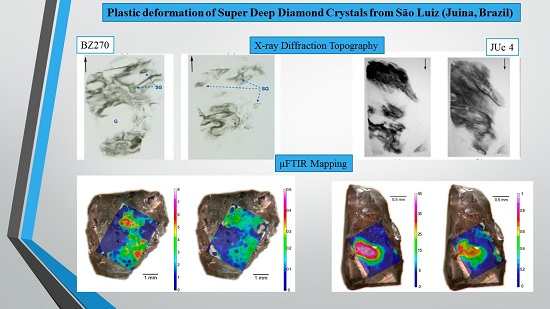
Non-Destructive In Situ Study of Plastic Deformations in Diamonds: X-ray Diffraction Topography and µFTIR Mapping of Two Super Deep Diamond Crystals from São Luiz (Juina, Brazil)

 , , , , and
Abstract
:
1. Introduction
2. Results
2.1. Samples
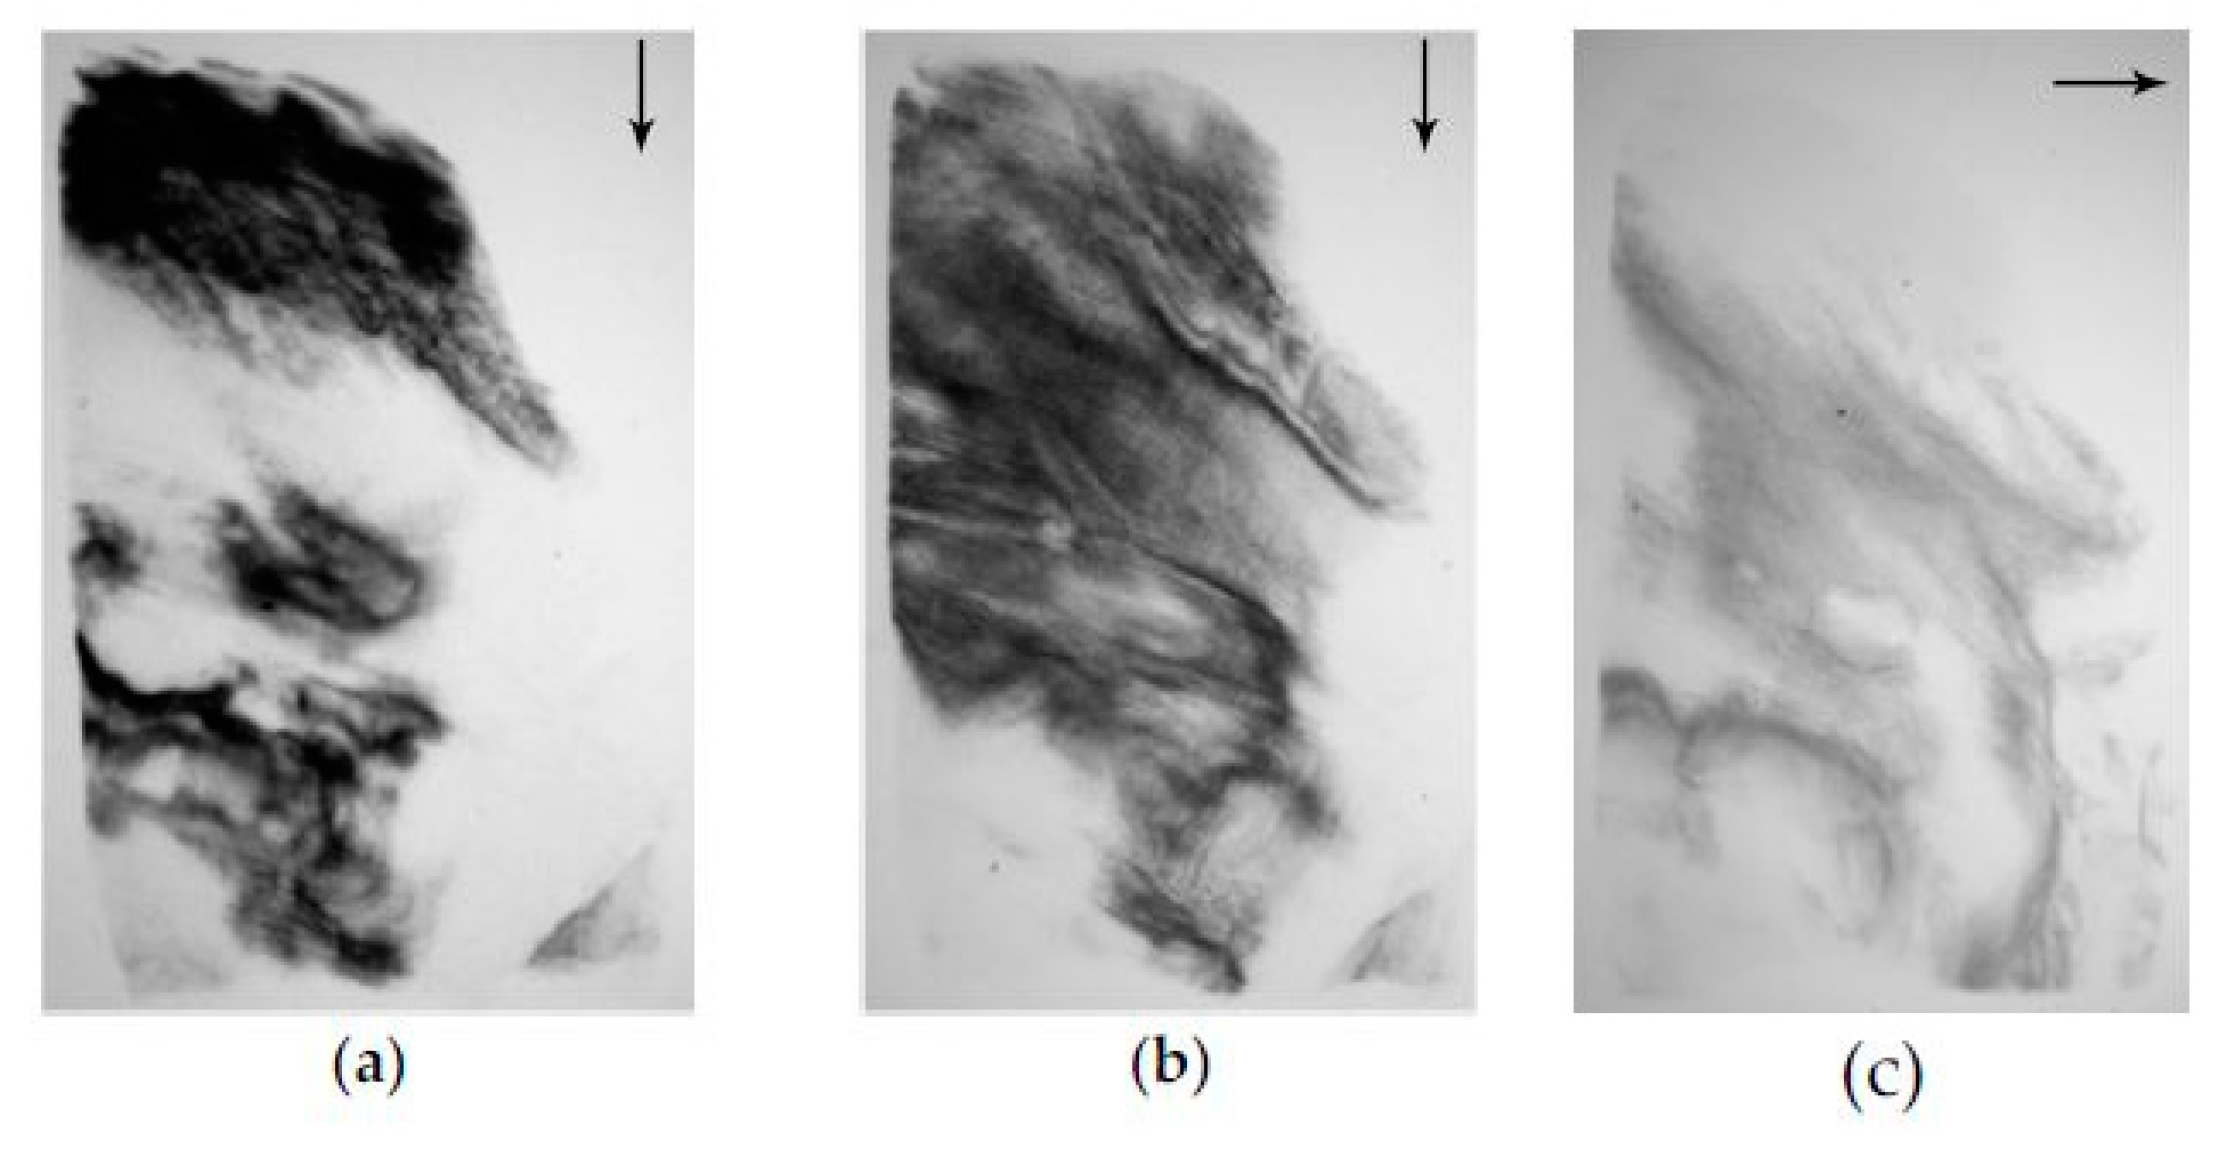
2.2. XRDT
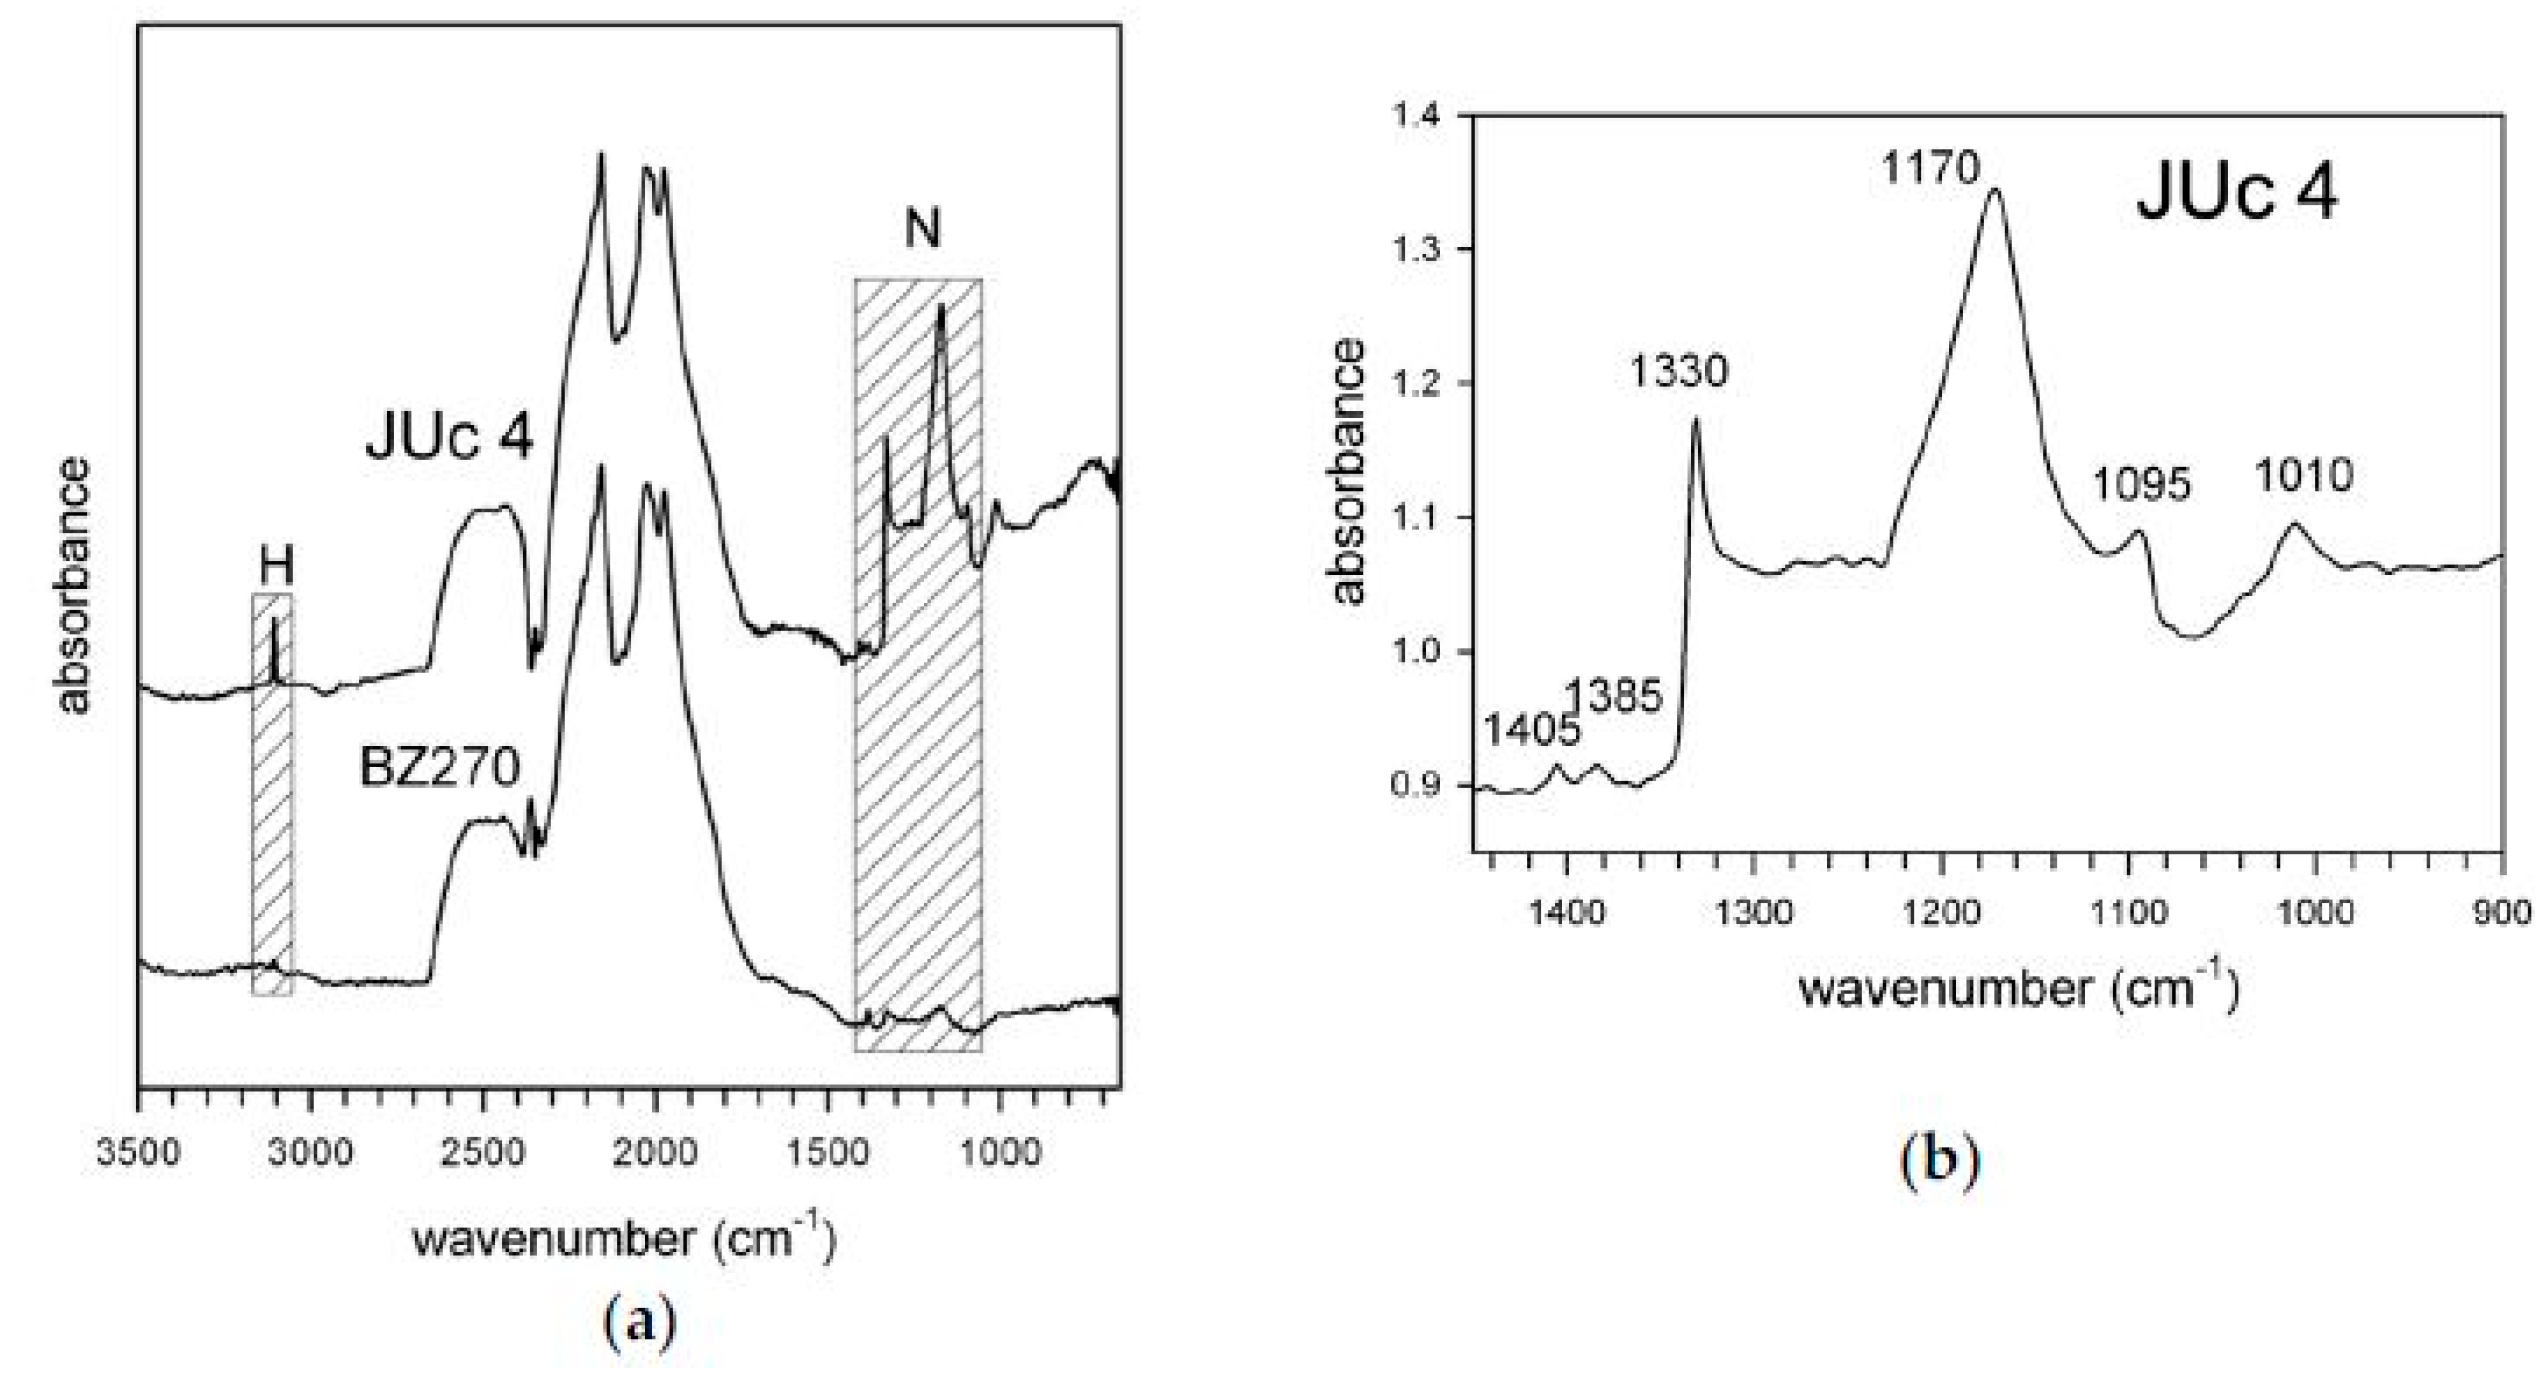
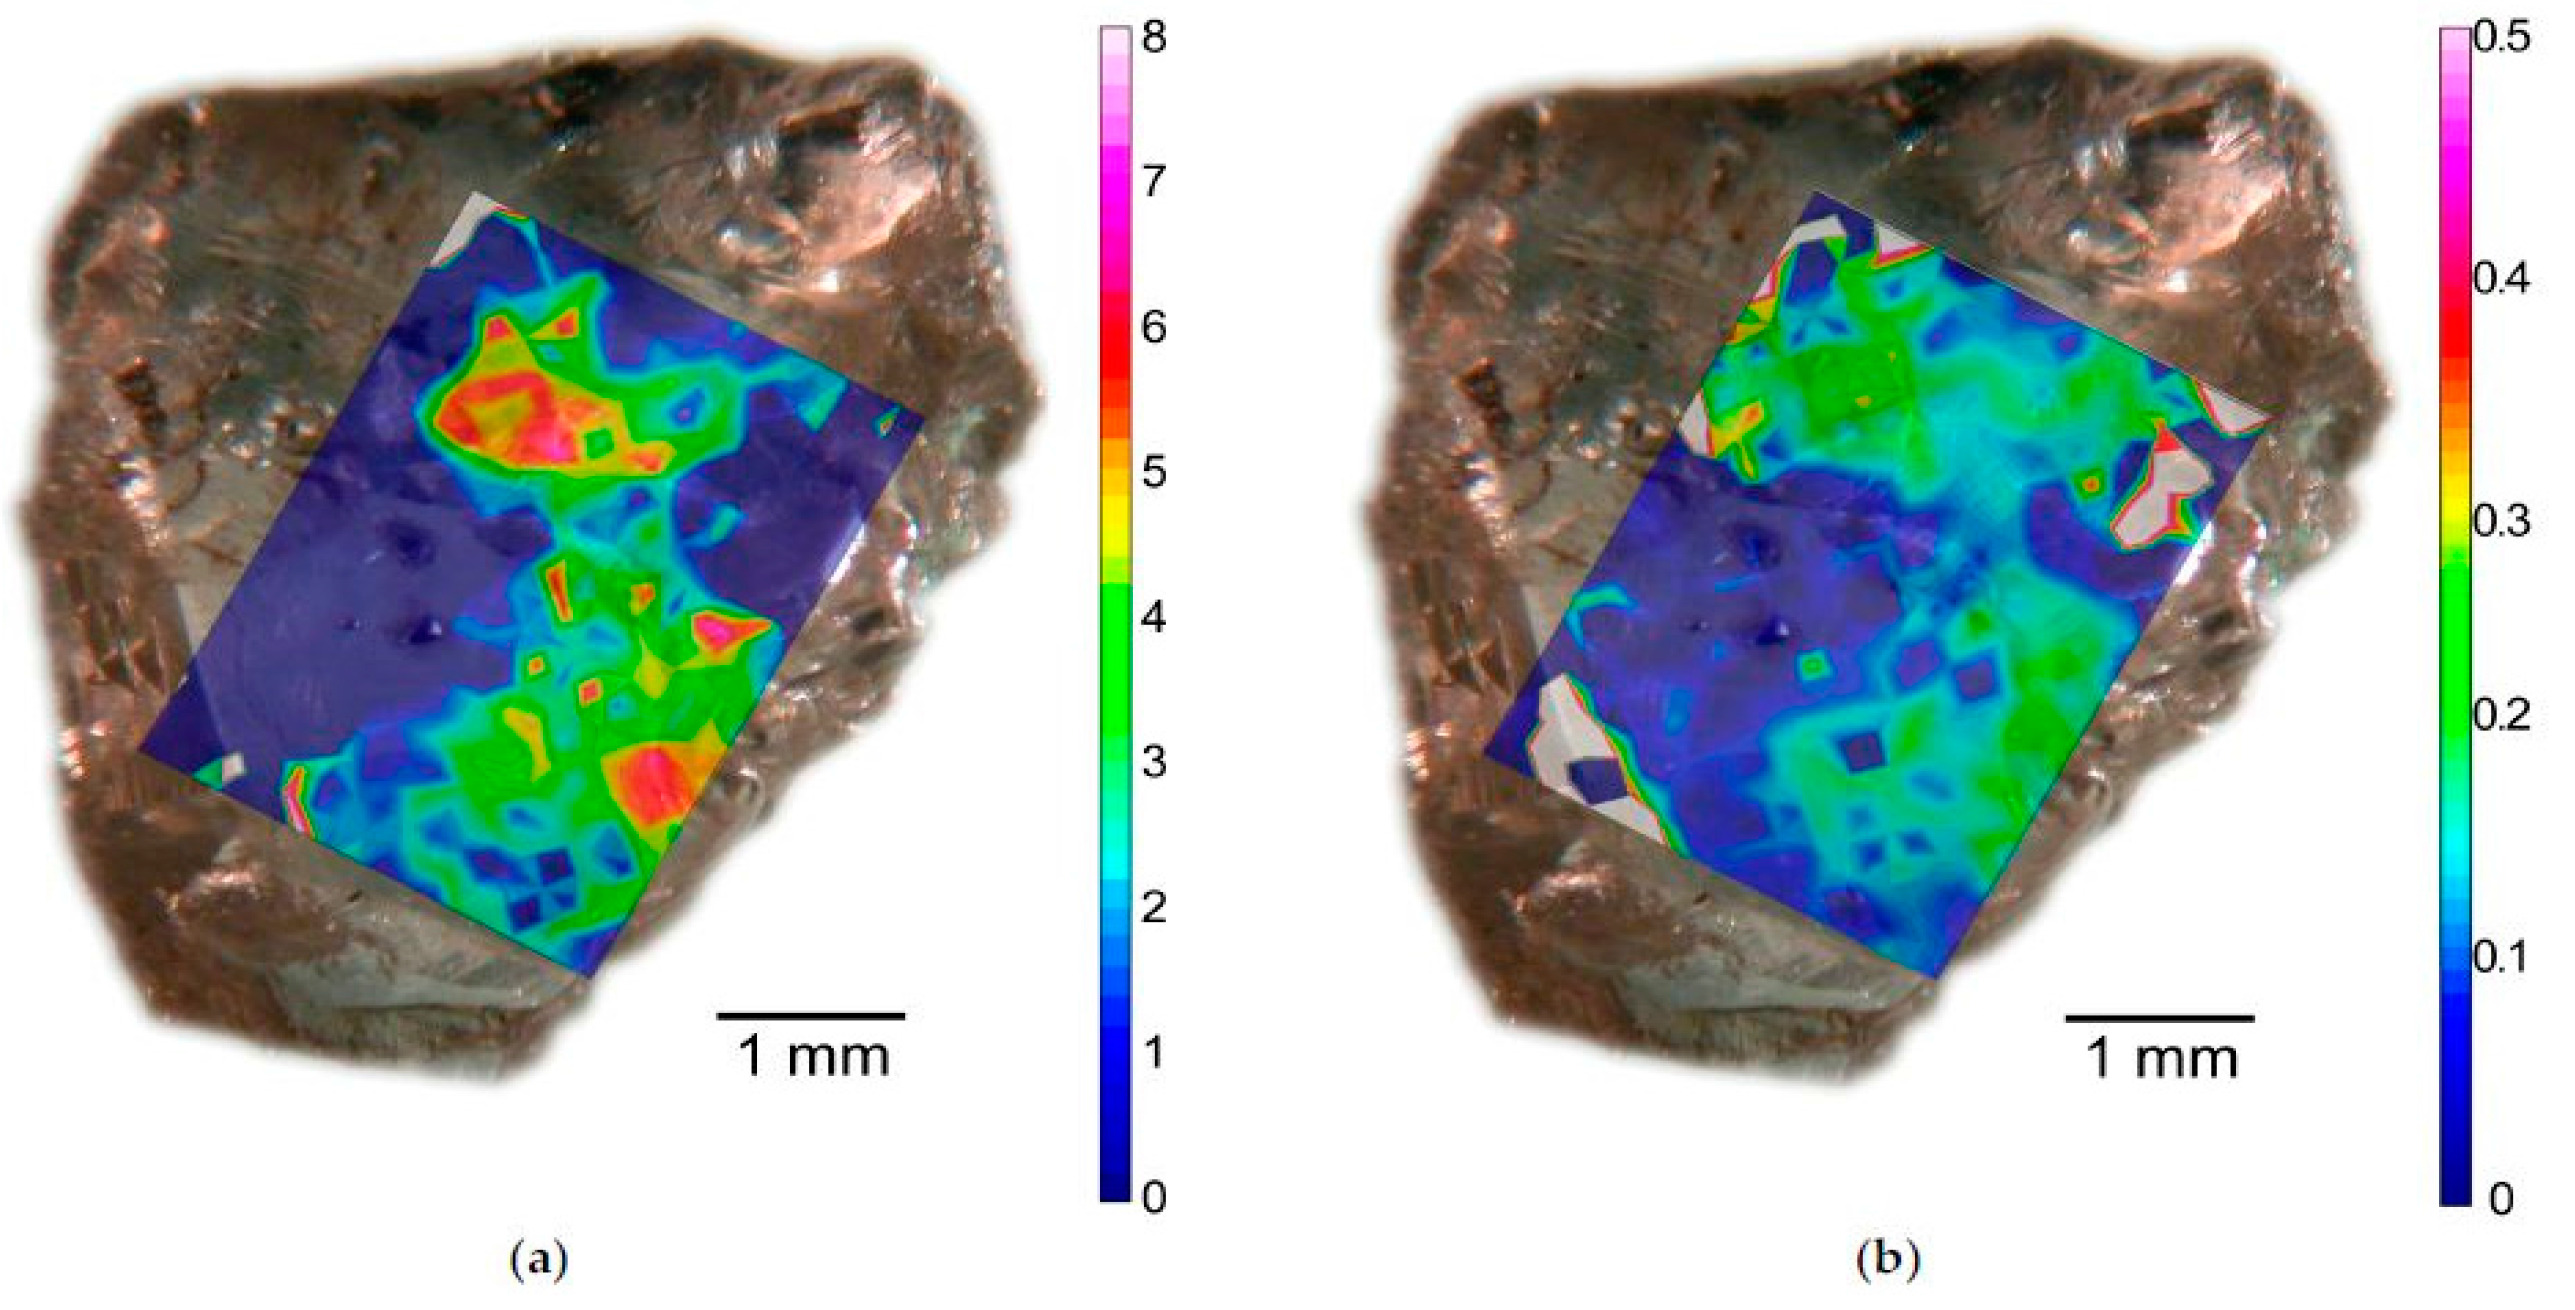
2.3. µFTIR
3. Discussion
4. Materials and Methods
4.1. XRDT
4.2. µFTIR
5. Conclusions
Acknowledgments
Author Contributions
Conflicts of Interest
References
- Shiryaev, A.A.; Fisenko, A.V.; Vlasov, I.I.; Semjonova, L.F.; Nagel, P.; Schuppler, S. Spectroscopic study of impurities and associated defects in nanodiamonds from Efremovka (CV3) and Orgueil (CI) meteorites. Geochim. Cosmochim. Acta 2011, 75, 3155–3166. [Google Scholar] [CrossRef]
- Bowen, D.K.; Tanner, B.K. High Resolution X-ray Diffractometry and Topography; CRC Press: Bristol, UK, 2005. [Google Scholar]
- Agrosì, G.; Tempesta, G.; Capitani, G.C.; Scandale, E.; Siche, D. Multi-analytical study of syntactic coalescence of polytypes in a 6H–SiC sample. J. Cryst. Growth 2009, 311, 4784–4790. [Google Scholar] [CrossRef]
- Agrosì, G.; Bosi, F.; Lucchesi, S.; Melchiorre, G.; Scandale, E. Mn-tourmaline crystals from island of Elba (Italy): Growth history and growth marks. Am. Mineral. 2006, 91, 944–952. [Google Scholar] [CrossRef]
- Agrosì, G.; Scandale, E.; Tempesta, G. Growth marks of titanian-andradite crystals from Colli Albani (Italy). Period. Di Mineral. 2011, 80, 89–104. [Google Scholar]
- Tempesta, G.; Scandale, E.; Agrosì, G. Striations and hollow channels in rounded beryl crystals. Period. Di Mineral. 2011, 79, 75–87. [Google Scholar]
- Pignatelli, I.; Giuliani, G.; Ohnenstetter, D.; Agrosì, G.; Mathieu, S.; Morlot, C.; Branquet, Y. Colombian trapiche emeralds: Recent advances in understanding their formation. Gems Gemol. 2015, 51, 222–259. [Google Scholar] [CrossRef]
- Moore, M. Imaging diamond with X-rays. J. Phys. Condens. Matter 2009, 21, 364217. [Google Scholar] [CrossRef] [PubMed]
- Moore, M.; Nailer, S.G.; Wierzchowski, W.K. Optical and X-ray topographic studies of dislocations, growth-sector boundaries, and stacking faults in synthetic diamonds. Crystals 2016, 6, 71. [Google Scholar] [CrossRef]
- Agrosì, G.; Tempesta, G.; Scandale, E.; Harris, J.W. Growth and post-growth defects of a diamond from Finsch mine (South Africa). Eur. J. Mineral. 2013, 25, 551–559. [Google Scholar] [CrossRef]
- Agrosì, G.; Nestola, F.; Tempesta, G.; Bruno, M.; Scandale, E.; Harris, J.W. X-ray topographic study of a diamond from Udachnaya: Implications for the genetic nature of inclusions. Lithos 2016, 248, 153–159. [Google Scholar] [CrossRef]
- Nestola, F.; Nimis, P.; Angel, R.J.; Milani, S.; Bruno, M.; Prencipe, M.; Harris, J.W. Olivine with diamond-imposed morphology included in diamonds. Syngenesis or protogenesis? Int. Geol. Rev. 2014, 56, 1658–1667. [Google Scholar] [CrossRef]
- Breeding, C.M.; Shigley, J.E. The “type” classification system of diamonds and its importance in gemology. Gems Gemol. 2009, 45, 96–111. [Google Scholar] [CrossRef]
- Kaminsky, F.V.; Khachatryan, G.K. The relationship between the distribution of nitrogen impurity centres in diamond crystals and their internal structure and mechanism of growth. Lithos 2004, 77, 255–271. [Google Scholar] [CrossRef]
- De Vries, D.W.; Pearson, D.G.; Bulanova, G.P.; Smelov, A.P.; Pavlushin, A.D.; Davies, G.R. Re–Os dating of sulphide inclusions zonally distributed in single Yakutian diamonds: Evidence for multiple episodes of Proterozoic formation and protracted timescales of diamond growth. Geochim. Cosmochim. Acta 2013, 120, 363–394. [Google Scholar] [CrossRef]
- Griffin, B.J.; Bulanova, G.P.; Taylor, W.R. CL and FTIR mapping of nitrogen content and hydrogen distribution in diamonds from the Mir pipe—Constraints on growth history. Extended Abstracts of the 6th International Kimberlite Conference, Novosibirsk, Russia, 7–11 August 1995. [Google Scholar]
- Palot, M.; Pearson, D.G.; Stachel, T.; Harris, J.W.; Bulanova, G.P.; Chinn, I. Multiple growth episodes or prolonged formation of diamonds? Inferences from infrared absorption data. In Proceedings of the 10th International Kimberlite Conference, New Delhi, India, 6–10 February 2012. [Google Scholar]
- Pearson, D.G.; Shirey, S.B.; Bulanova, G.P.; Carlson, R.W.; Milledge, H.J. Re–Os isotope measurements of single sulfide inclusions in a Siberian diamond and its nitrogen aggregation systematics. Geochim. Cosmochim. Acta 1999, 63, 703–711. [Google Scholar] [CrossRef]
- Taylor, W.R.; Bulanova, G.P.; Milledge, H.J. Quantitative nitrogen aggregation study of some Yakutian diamonds: Constraints on the growth, thermal and deformation history of peridotitic and eclogitic diamonds. Extended Abstracts of the 6th International Kimberlite Conference, Novosibirsk, Russia, 7–11 August 1995. [Google Scholar]
- Della Ventura, G.; Marcelli, A.; Bellatreccia, F. SR-FTIR Microscopy and FTIR Imaging in the Earth Sciences. Rev. Mineral. Geochem. 2014, 78, 447–480. [Google Scholar] [CrossRef]
- Kaminsky, F.V.; Khachatryan, G.K. Characteristics of nitrogen and other impurity in diamond, as revealed by infrared absorption data. Can. Mineral. 2001, 39, 1735–1745. [Google Scholar] [CrossRef]
- Hainschwang, T.; Notari, F.; Fritsch, E.; Massi, L. Natural, untreated diamonds showing the A, B and C infrared absorptions (“ABC diamonds”), and the H2 absorption. Diam. Relat. Mater. 2006, 15, 1555–1564. [Google Scholar] [CrossRef]
- Gaillou, E.; Post, J.E.; Rost, D.; Butler, J.E. Boron in natural type IIb blue diamonds; chemical and spectroscopic measurements. Am. Mineral. 2012, 97, 1–18. [Google Scholar] [CrossRef]
- Palot, M.; Jacobsen, S.D.; Townsend, J.P.; Nestola, F.; Marquardt, K.; Miyajima, N.; Harris, J.W.; Stachel, T.; McCammon, C.A.; Pearson, D.G. Evidence for H2O-bearing fluids in the lower mantle from diamond inclusion. Lithos 2016, 265, 237–243. [Google Scholar] [CrossRef]
- Bulanova, G.P.; Pearson, D.G.; Hauri, E.H.; Griffin, B.J. Carbon and nitrogen isotope systematics within a sector-growth diamond from the Mir kimberlite, Yakutia. Chem. Geol. 2002, 188, 105–123. [Google Scholar] [CrossRef]
- Howell, D.; O’Neill, C.J.; Grant, K.J.; Griffin, W.L.; O’Reilly, S.Y.; Pearson, N.J.; Stern, R.A.; Stachel, T. Platelet development in cuboid diamonds: Insights from micro-FTIR mapping. Contrib. Mineral. Petrol. 2012, 164, 1011–1025. [Google Scholar] [CrossRef]
- Lu, T.; Chen, H.; Qiu, Z.; Zhang, J.; Wei, R.; Ke, J.; Sunagawa, I.; Stern, R.; Stachel, T. Multiple core growth structure and nitrogen abundances of diamond crystals from Shandong and Liaoning kimberlite pipes, China. Eur. J. Mineral. 2012, 24, 651–656. [Google Scholar] [CrossRef]
- Spetsius, Z.V.; Bogush, I.N.; Kovalchuk, O.E. FTIR mapping of diamond plates of eclogitic and peridotitic xenoliths from the Nyurbinskaya pipe, Yakutia: Genetic implications. Russ. Geol. Geophys. 2015, 56, 344–353. [Google Scholar] [CrossRef]
- Kohn, S.C.; Speich, L.; Smith, C.B.; Bulanova, G.P. FTIR thermochronometry of natural diamonds: A closer look. Lithos 2016, 265, 148–158. [Google Scholar] [CrossRef]
- Smith, E.M.; Helmstaedt, H.H.; Flemming, R. Survival of Brown Colour in Diamond during Storage in the Subcontinental Lithospheric Mantle. Can. Mineral. 2010, 48, 571–582. [Google Scholar] [CrossRef]
- Yuryeva, O.P.; Rakhmanova, M.I.; Zedgenizov, D.A. Nature of type IaB diamonds from the Mir kimberlite pipe (Yakutia): Evidence from spectroscopic observation. Phys. Chem. Miner. 2017, 1–3. [Google Scholar] [CrossRef]
- Mikhail, S.; Howell, D.; Hutchinson, M.; Verchovsky, A.B.; Warburton, P.; Southworth, R.; Milledge, H.J. Constraining the internal variability of carbon and nitrogen isotopes in diamonds. Chem. Geol. 2014, 366, 14–23. [Google Scholar] [CrossRef]
- Brozel, M.R.; Evans, T.; Stephenson, R.F. Partial dissociation of nitrogen aggregates in diamond by high temperature-high pressure treatments. Proc. R. Soc. Lond. A 1978, 361, 109–127. [Google Scholar] [CrossRef]
- Sutherland, G.B.; Blackwell, D.E.; Simeral, W.G. The Problem of the Two Types of Diamond. Nature 1954, 174, 901–904. [Google Scholar] [CrossRef]
- Collins, A.T. In the Physics of Diamond. Course CXXXV, Proc. Int. School Physics; IOS Press: Amsterdam, The Netherlands, 1997; p. 195. [Google Scholar]
- Hutchinson, M.T.; Cartigny, P.; Harris, J.W. Carbon and nitrogen compositions and physical characteristics of transition zone and lower mantle diamonds from São Luiz, Brazil. In Proceedings of the 7th International Kimberlite Conference, Red Roof Design, Cape Town, South Africa, 11–17 April 1998. [Google Scholar]
- Titkov, S.V.; Krivovichev, S.V.; Organova, N.I. Plastic deformation of natural diamonds by twinning: Evidence from X-ray diffraction studies. Mineral. Mag. 2012, 76, 143–149. [Google Scholar] [CrossRef]
- Yu, X.; Raterron, P.; Zhang, J.; Xhijun, L.; Liping, W.; Zhao, Y. Constitutive Law and Flow Mechanism in Diamond Deformation. Sci. Rep. 2012, 2, 876. [Google Scholar] [CrossRef] [PubMed]
- Agrosì, G.; Tempesta, G.; Mele, D.; Allegretta, I.; Terzano, R.; Shirey, S.; Pearson, D.G.; Nestola, F. Multi-analytical approach for non-destructive analyses of a diamond from Udachnaya and its trapped inclusions: the first report of (Fe,Ni)1+xS mackinawite sulfide in diamonds. Am. Mineral. 2017, in press. [Google Scholar]
- Shiryaev, A.A.; Frost, D.J.; Langenhorst, F. Impurity diffusion and microstructure in diamonds deformed at high pressures and temperatures. Diam. Relat. Mater. 2007, 16, 503–511. [Google Scholar] [CrossRef]
- Friedel, G. Dislocations; [Russian translation]; Mir: Moscow, Russia, 1967. [Google Scholar]
- Hirth, J.P.; Lothe, J. Theory of Dislocation; [Russian translation]; Atomizdat: Moscow, Russia; McGraw-Hill: New York, NY, USA, 1972. [Google Scholar]
- Sumida, N.; Lang, A.R. Cathodoluminescence evidence of dislocation interactions in diamond. Philos. Mag. A 1981, 43, 1277–1287. [Google Scholar] [CrossRef]
- Hiraga, T.; Miyazaki, T.; Tasaka, M.; Yoshida, H. Mantle superplasticity and its self-made demise. Nature 2010, 468, 1091–1094. [Google Scholar] [CrossRef] [PubMed]
- Ohuchi, T.; Kawazoe, T.; Higo, Y.; Funakoshi, K.; Suzuki, A.; Kikegawa, T.; Irifune, T. Dislocation-accommodated grain boundary sliding as the major deformation mechanism of olivine in the Earth’s upper mantle. Sci. Adv. 2015, 1, e1500360. [Google Scholar] [CrossRef] [PubMed]
- Lang, A.R. The projection topograph: A new method in X-ray diffraction microradiography. Acta Cryst. 1959, 2, 249–250. [Google Scholar] [CrossRef]
- Authier, A.; Zarka, A. X-ray topographic study of the real structure of minerals. In Advanced Mineralogy; Marfunin, A.S., Ed.; Springer-Verlag: Berlin, Germany, 1994; pp. 221–233. [Google Scholar]


© 2017 by the authors. Licensee MDPI, Basel, Switzerland. This article is an open access article distributed under the terms and conditions of the Creative Commons Attribution (CC BY) license (http://creativecommons.org/licenses/by/4.0/).
Share and Cite
Agrosì, G.; Tempesta, G.; Della Ventura, G.; Cestelli Guidi, M.; Hutchison, M.; Nimis, P.; Nestola, F. Non-Destructive In Situ Study of Plastic Deformations in Diamonds: X-ray Diffraction Topography and µFTIR Mapping of Two Super Deep Diamond Crystals from São Luiz (Juina, Brazil). Crystals 2017, 7, 233. https://doi.org/10.3390/cryst7080233
Agrosì G, Tempesta G, Della Ventura G, Cestelli Guidi M, Hutchison M, Nimis P, Nestola F. Non-Destructive In Situ Study of Plastic Deformations in Diamonds: X-ray Diffraction Topography and µFTIR Mapping of Two Super Deep Diamond Crystals from São Luiz (Juina, Brazil). Crystals. 2017; 7(8):233. https://doi.org/10.3390/cryst7080233
Chicago/Turabian StyleAgrosì, Giovanna, Gioacchino Tempesta, Giancarlo Della Ventura, Mariangela Cestelli Guidi, Mark Hutchison, Paolo Nimis, and Fabrizio Nestola. 2017. "Non-Destructive In Situ Study of Plastic Deformations in Diamonds: X-ray Diffraction Topography and µFTIR Mapping of Two Super Deep Diamond Crystals from São Luiz (Juina, Brazil)" Crystals 7, no. 8: 233. https://doi.org/10.3390/cryst7080233