Atomistic Insights into the Effects of Residual Stress during Nanoindentation

1
State Key Laboratory for Mechanical Behavior of Materials, Xi’an Jiaotong University, Xi’an 710049, China
2
S&V Laboratory, Department of Engineering Mechanics, Xi’an Jiaotong University, Xi’an 710049, China
*
Author to whom correspondence should be addressed.
Crystals 2017, 7(8), 240; https://doi.org/10.3390/cryst7080240
Submission received: 21 June 2017
/
Revised: 26 July 2017
/
Accepted: 30 July 2017
/
Published: 1 August 2017
(This article belongs to the Special Issue Crystal Indentation Hardness)
Abstract
:The influence of in-plane residual stress on Hertzian nanoindentation for single-crystal copper thin film is investigated using molecular dynamics simulations (MD). It is found that: (i) the yield strength of incipient plasticity increases with compressive residual stress, but decreases with tensile residual stress; (ii) the hardness decreases with tensile residual stress, and increases with compressive residual stress, but abruptly drops down at a higher compressive residual stress level, because of the deterioration of the surface; (iii) the indentation modulus reduces linearly with decreasing compressive residual stress (and with increasing tensile residual stress). It can be concluded from the MD simulations that the residual stress not only strongly influences the dislocation evolution of the plastic deformation process, but also significantly affects the size of the plastic zone.
1. Introduction
Nowadays, thin film materials at micro- and nano-scale play a significant role in a wide range of engineering applications, such as medical instruments, micro-/nano-electromechanical systems (MEMS/NEMS), and optical devices [1,2,3,4]. The mechanical properties of thin film materials, which strongly influence the reliability and service life of a nano-device, have been attracting both industrial and scientific interest [4]. Therefore, it is vital to characterize the mechanical properties and understand the deformation mechanism of a thin film material, in order to manufacture nano-devices with high reliability and service life. Nanoindentation is one of the most popular methods used to investigate the mechanical properties of materials at micro- and nano-scale [5].
During a nanoindentation test, residual stress is a particular non-ignorable factor, which can influence the thin film material’s hardness and its plastic deformation behavior. Great efforts have been made in research [6,7,8,9,10,11]. Tsui et al. [7] found that hardness measured by a sharp indenter increases with compressive stress and decreases with tensile stress, but later on Yang et al. [8] claimed that the uniaxial tensile and compressive stress has a very small effect on the Vickers hardness. A subsequent finite element simulation also denied the change in hardness because of the pileup of the surface [9]. Interestingly, in comparison with the previously mentioned sharp indenter, Taljat and Pharr [11] reported that residual stress has an obvious influence on the load-depth curve by using spherical indentation. The controversy about residual stress function on the plastic deformation of nanoindentation in the literature suggests that more efforts need to be made, and new research approaches need to be employed, to reveal the deformation mechanism at micro-scale.
Molecular dynamics (MD) simulation is a very powerful approach to reveal micro-deformation in nano-materials [12,13,14]. For example, the plastic deformation behaviors of nanoindentation in FCC (Cu and Al) and BCC (Fe and Ta) metals by a spherical indenter have been analyzed using MD [15]. Taking advantage of MD, size effects due to grain boundary, high rate compression, and other confining conditions have been systematically studied by Voyiadjis and Yaghoobi [16,17,18,19]. Research on thin film deformation under nanoindentation has also been carried out. The nanoindentation behavior of a metal film under a spherical indenter was first simulated using MD by Kelchner et al. [20]. Since then, by using MD simulations, many new results have been reported. For example, Liang et al. [21] investigated the crystal orientation influence on the plastic deformation of copper under nanoindentation. Yaghoobi et al. [22] found that the typically observed defect in Ni thin film is the Shockley partial dislocation at the onset of plasticity. Moreover, nanoindentation on complex Ti-V multilayered thin films has been initially explored [23]. No doubt, the above studies have made considerable progress in understanding the nanoindentation behavior of metal films. Recently, we [24] simulated the nanoindentation of a virtual sphere indenter for single-crystal copper thin film. We found that the residual stress has an effect on the local surface hardness and incipient plasticity. However, there are three problems remaining: (i) in our previous study, we mainly focused on the scenario of the incipient plasticity of indentation, and thus the full developing indentation process and deformation process is unknown; (ii) because the virtual sphere indenter employed in our previous study is an unrealistic one, which was oversimplified, a more realistic indentation model needs to be built; and (iii) in our previous study, localized and detailed dislocation nucleation and development was discussed, but the full deformation field is still not clear.
In this paper, we perform MD simulations of nanoindentation for single-crystal copper thin film with pre-existing equiaxial stress, to study the effect of residual stress on plasticity deformation. In particular, the mechanism of the elastic–plastic transition will be explored, and the dynamics of dislocation evolution and the indentation stress field will also be investigated.
2. Simulation Model and Methodology
In this work, the MD method was performed to simulate the nanoindentation process between a single-crystal copper thin film and a spherical diamond indenter. Displacement control by positioning the spherical indenter is used during loading along the crystal direction [001] of the copper. The software LAMMPS [25] is used to perform the simulation. An embedded atom method (EAM) potential [26] is adopted to define the Cu-Cu atoms’ interaction. The Morse potential [27] is adopted to calculate the interaction between the copper atoms and carbon atoms of the diamond indenter, and the parameters are the same as in Ref. [4].
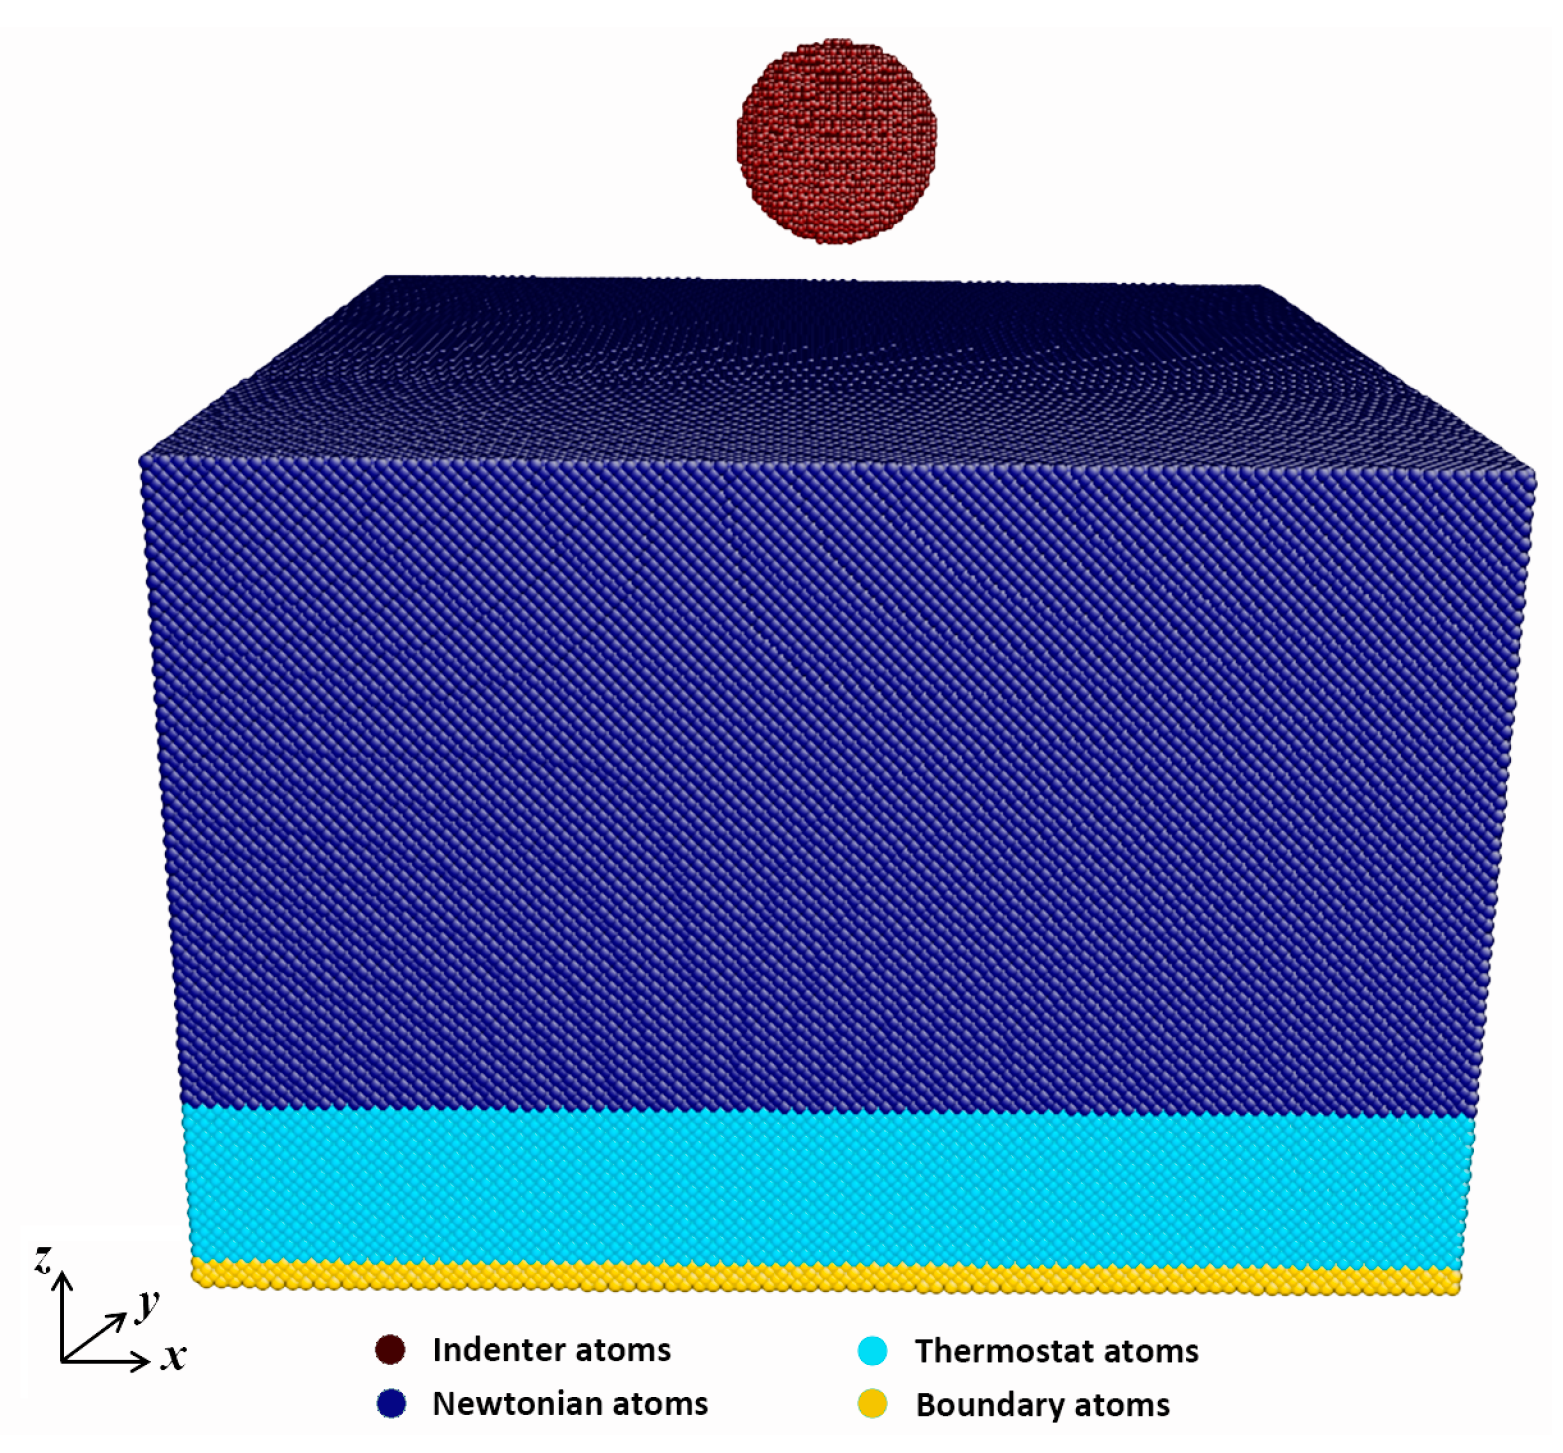
The schematic of the nanoindentation configuration with a spherical diamond indenter is shown in Figure 1. The lattice constant of the copper is 3.615 Å, and the models with pre-existing stress are of the same size, 32.5 × 32.5 × 21.3 nm, consisting of about 1,955,200 atoms. The spherical diamond indenter of radius R = 2.55 nm is assumed to be perfectly rigid, and the deformable copper substrate includes three kinds of atoms: boundary atoms, thermostat atoms, and Newtonian atoms. Three layers of atoms at the bottom of the substrate (lower z plane) are boundary atoms fixed in their initial lattice positions to reduce the boundary effects. A thermostat is applied to the thermostatic zone. The motions of Newtonian atoms obey the classical Newton’s second law, which are integrated with a velocity Verlet algorithm with a time step of 1 fs.
The initial stress-free model is relaxed through an energy minimization, followed by a zero-stress relaxation in the isothermal-isobaric (NPT) ensemble using a Nosé–Hoover thermostat at 0.1 K ignoring thermal vibrations for 20 ps. Then, to study the effect of residual stress on the nanoindentation behavior, pre-existing stress models are constructed by equiaxial compressing and/or tensioning the initial model in x and y directions. The pre-strain values are adopted from −2.5% to 2.0%. The pre-stress is listed in Table 1, and is normalized by the ideal shear strength (Gideal = 4.56 GPa) for the Cu (001) single-crystal [28]. After the desired strain is reached, the simulations are performed at 0.1 K under the canonical (NVT) ensemble. Periodic boundary conditions are imposed in the x and y directions for all simulations. The centro-symmetry parameters are used to discern defects [20].
At nano-scale, copper film shows strong anisotropy, i.e., the elasticity modulus is different along different crystal orientations [22]. From the material properties of copper suggested by Ref. [29], the related material elastic constants are C11 = 169.9 GPa, C12 = 122.6 GPa, and C44 = 76.2 GPa. Hence, the anisotropy factor, defined by 2C44/(C11 − C12), is 3.22 for single Cu film, and the Young’s modulus at [001] crystal orientation is calculated by following expression [29]:
Consequently, the residual stress, shown in Table 1, is not symmetrical about the pre-strain because of anisotropy.
3. Results and Discussion
3.1. Load vs. Indention Depth Response at Different Residual Stresses
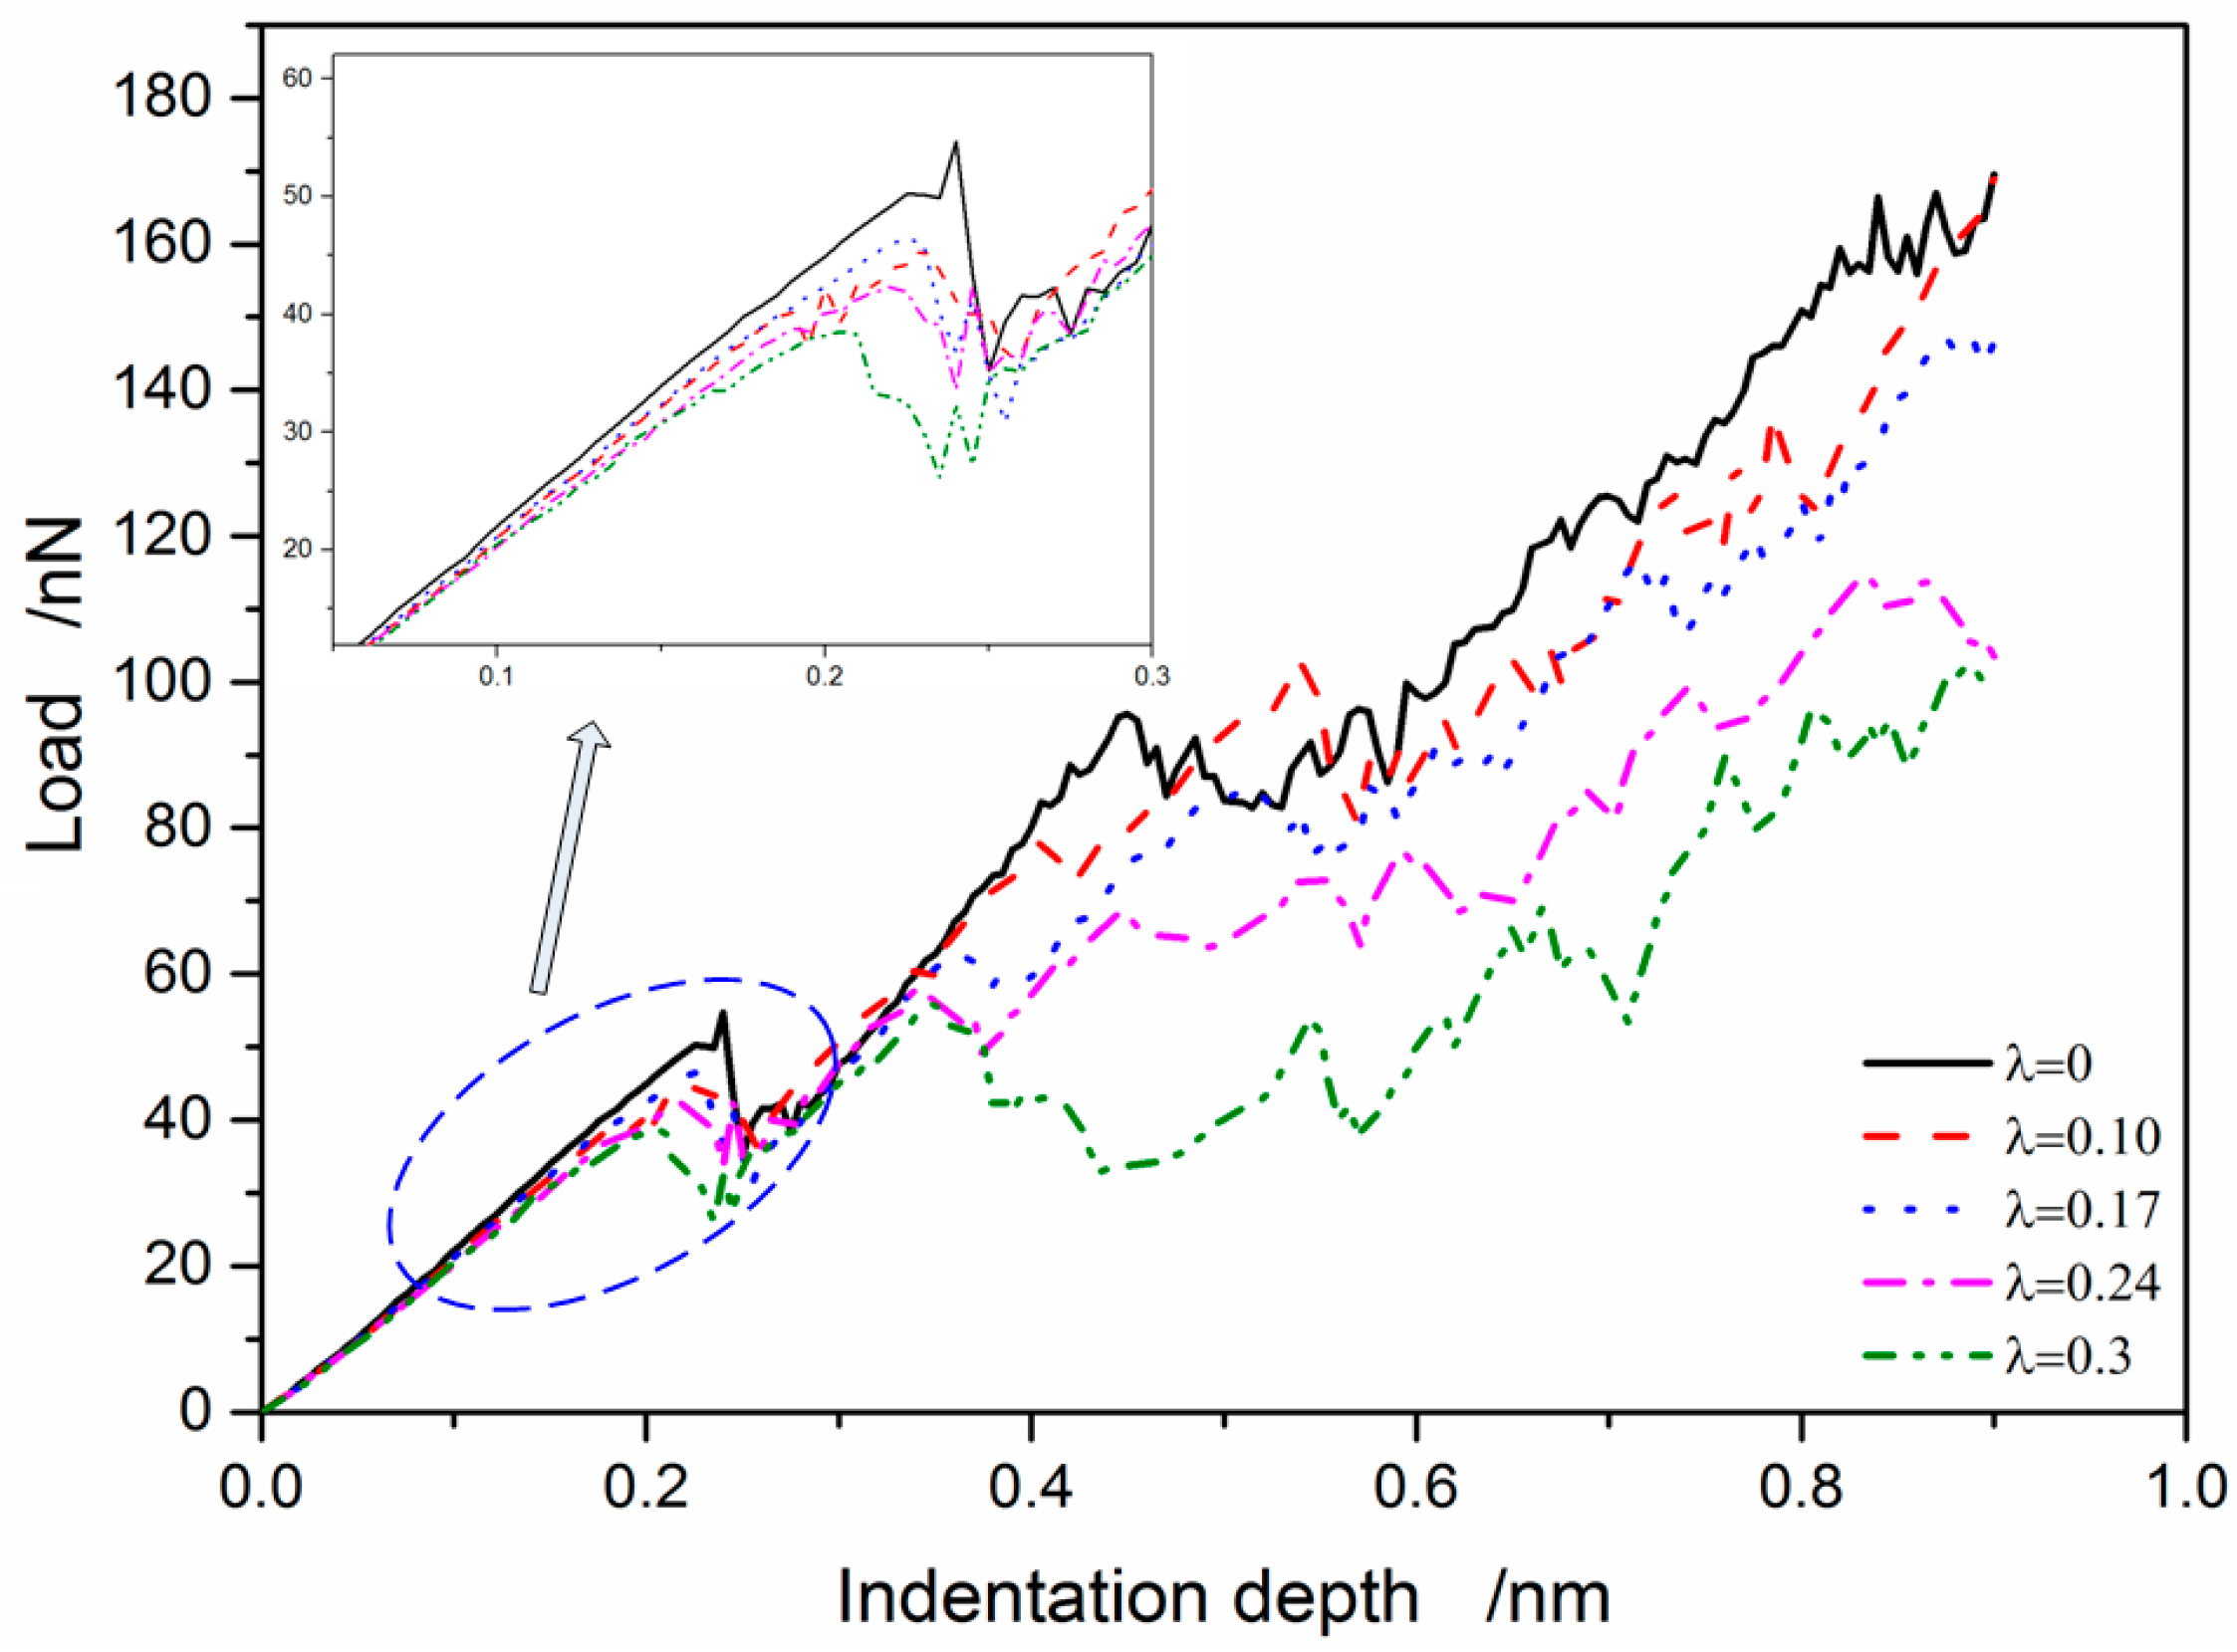
The load vs. indentation depth curves with residual stress are depicted in Figure 2 and Figure 3. There are three regimes in the load vs. indentation depth curve during indentation [4], namely the quasi-elastic regime, the sudden load drop regime, and the strain burst regime. The three regimes are distinct as shown in Figure 2 and Figure 3. In the quasi-elastic regime, the load raises linearly with indentation depth. Meanwhile, the residual stress on the load vs. indentation depth curve can be definitely neglected because of the exact overlapping for all curves, indicating that the residual stress has little effect on the elastic property of single-crystal copper thin film. Contrarily, in the sudden load drop regime, a sharp decrease of load occurs with increasing indentation depth, indicating the production of plastic yielding. In the strain burst regime, stress is continuously relaxed to a great extent, because of dislocation persistently gliding and propagating.
It is observed from Figure 2 and Figure 3 that an inflection point (a local maximum) corresponding to the elastic–plastic transition point [30] is observed before a large load drop occurs. By carefully examining the curves, the elastic–plastic transition point is increased with compressive residual stress, which moves towards the upper right relative to the case for no residual stress, as shown in Figure 2. On the contrary, the transition point is decreased with increasing tensile residual stress, which moves towards the bottom left as shown in Figure 3. Compared with the previous work [24], in which a virtual sphere indenter was used, the simulation also shows a similar trend. This suggests that a larger residual stress causes an increasing yield strength, and consequently postpones the incipient plasticity at the compressive state. For the tensile state the case is exactly to the contrary. Furthermore, in the strain burst regime, the load vs. indentation depth curve displays a less dispersive distribution in the compressive residual stress than that in the tensile residual stress. That difference between the compressive and tensile residual stresses is ascribed to a liable dislocation nucleation and propagation for tensile residual stress during indentation.
In Hertzian contact with residual stress, the load P by a spherical indenter is related to the indentation depth h, and can be defined as follows [2]:
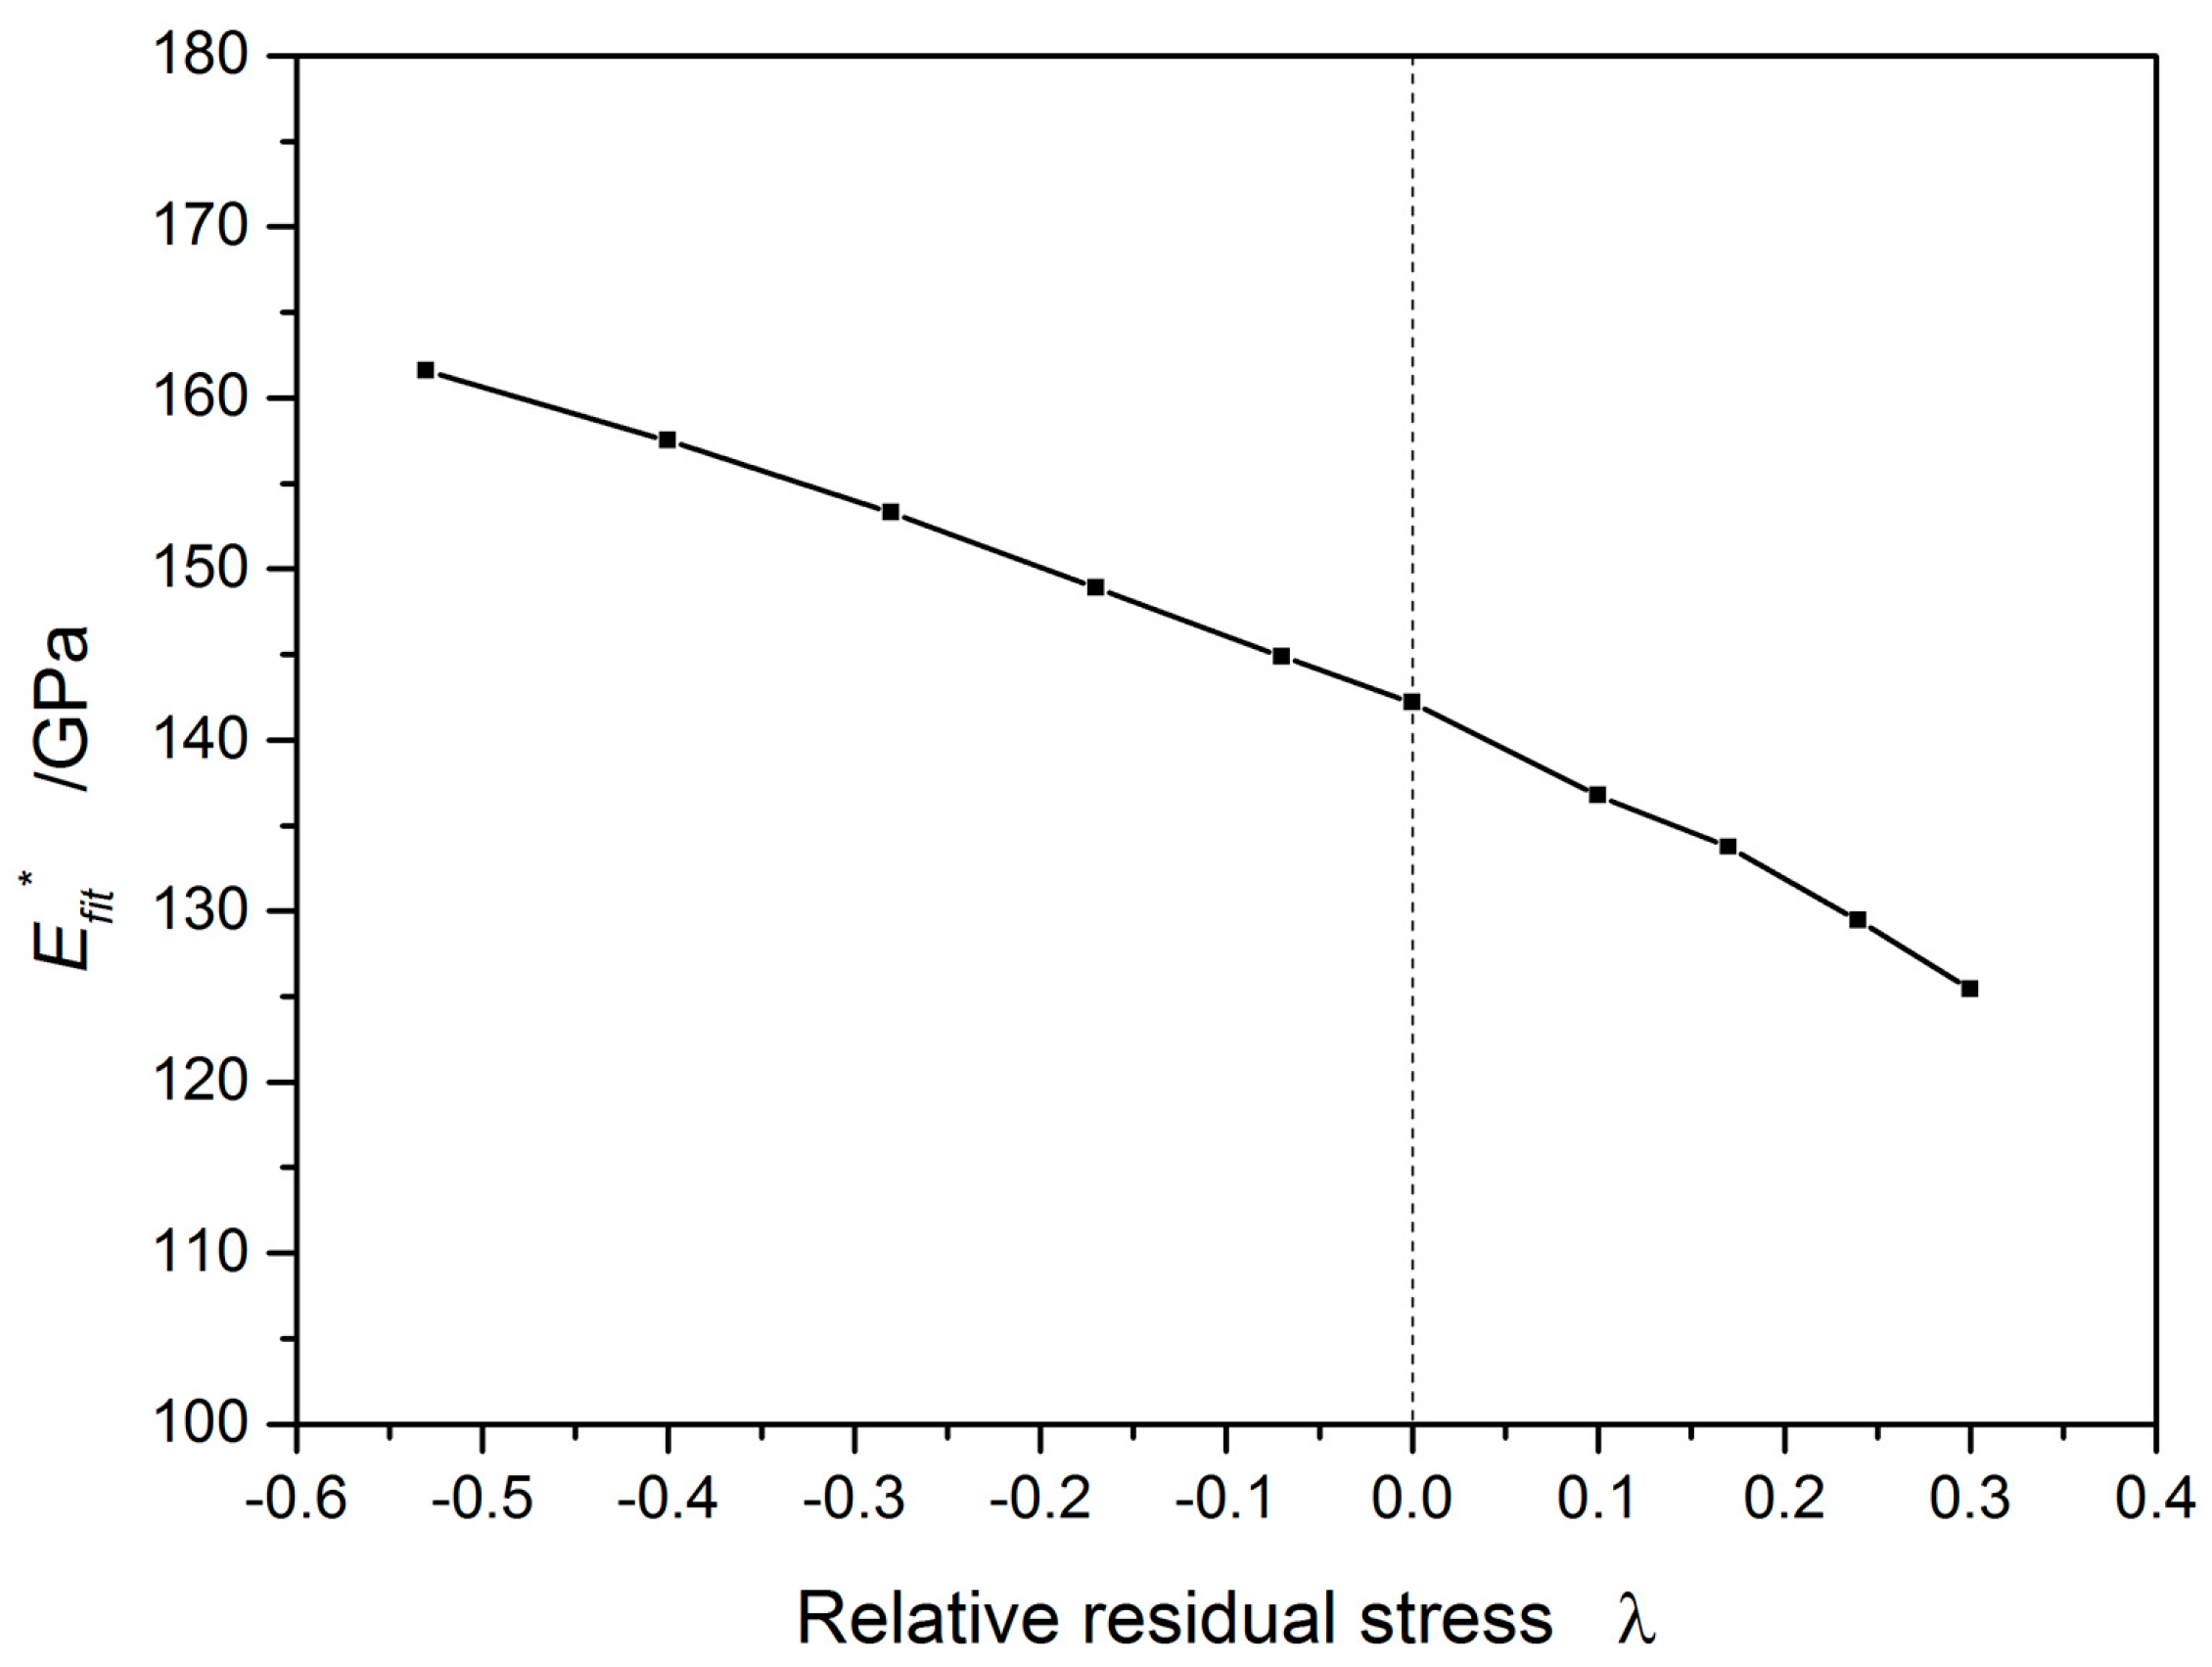
where the indentation modulus E* is the material’s elastic response, and can be obtained from curve fitting in an MD simulation as shown in Figure 4. The indentation modulus E* has, however, 142.6 GPa as calculated by the load vs. indentation depth curve, which is a bit larger than the 136.7 GPa reported in the literature [31]. The modulus E*fit shows a linear decrease with the reduction of compressive stress (and the increase of tensile stress). This indicates that the residual stresses have an important effect on the elastic property of single copper thin film, which is consistent with empirical estimates by experiments and finite element simulations [32].
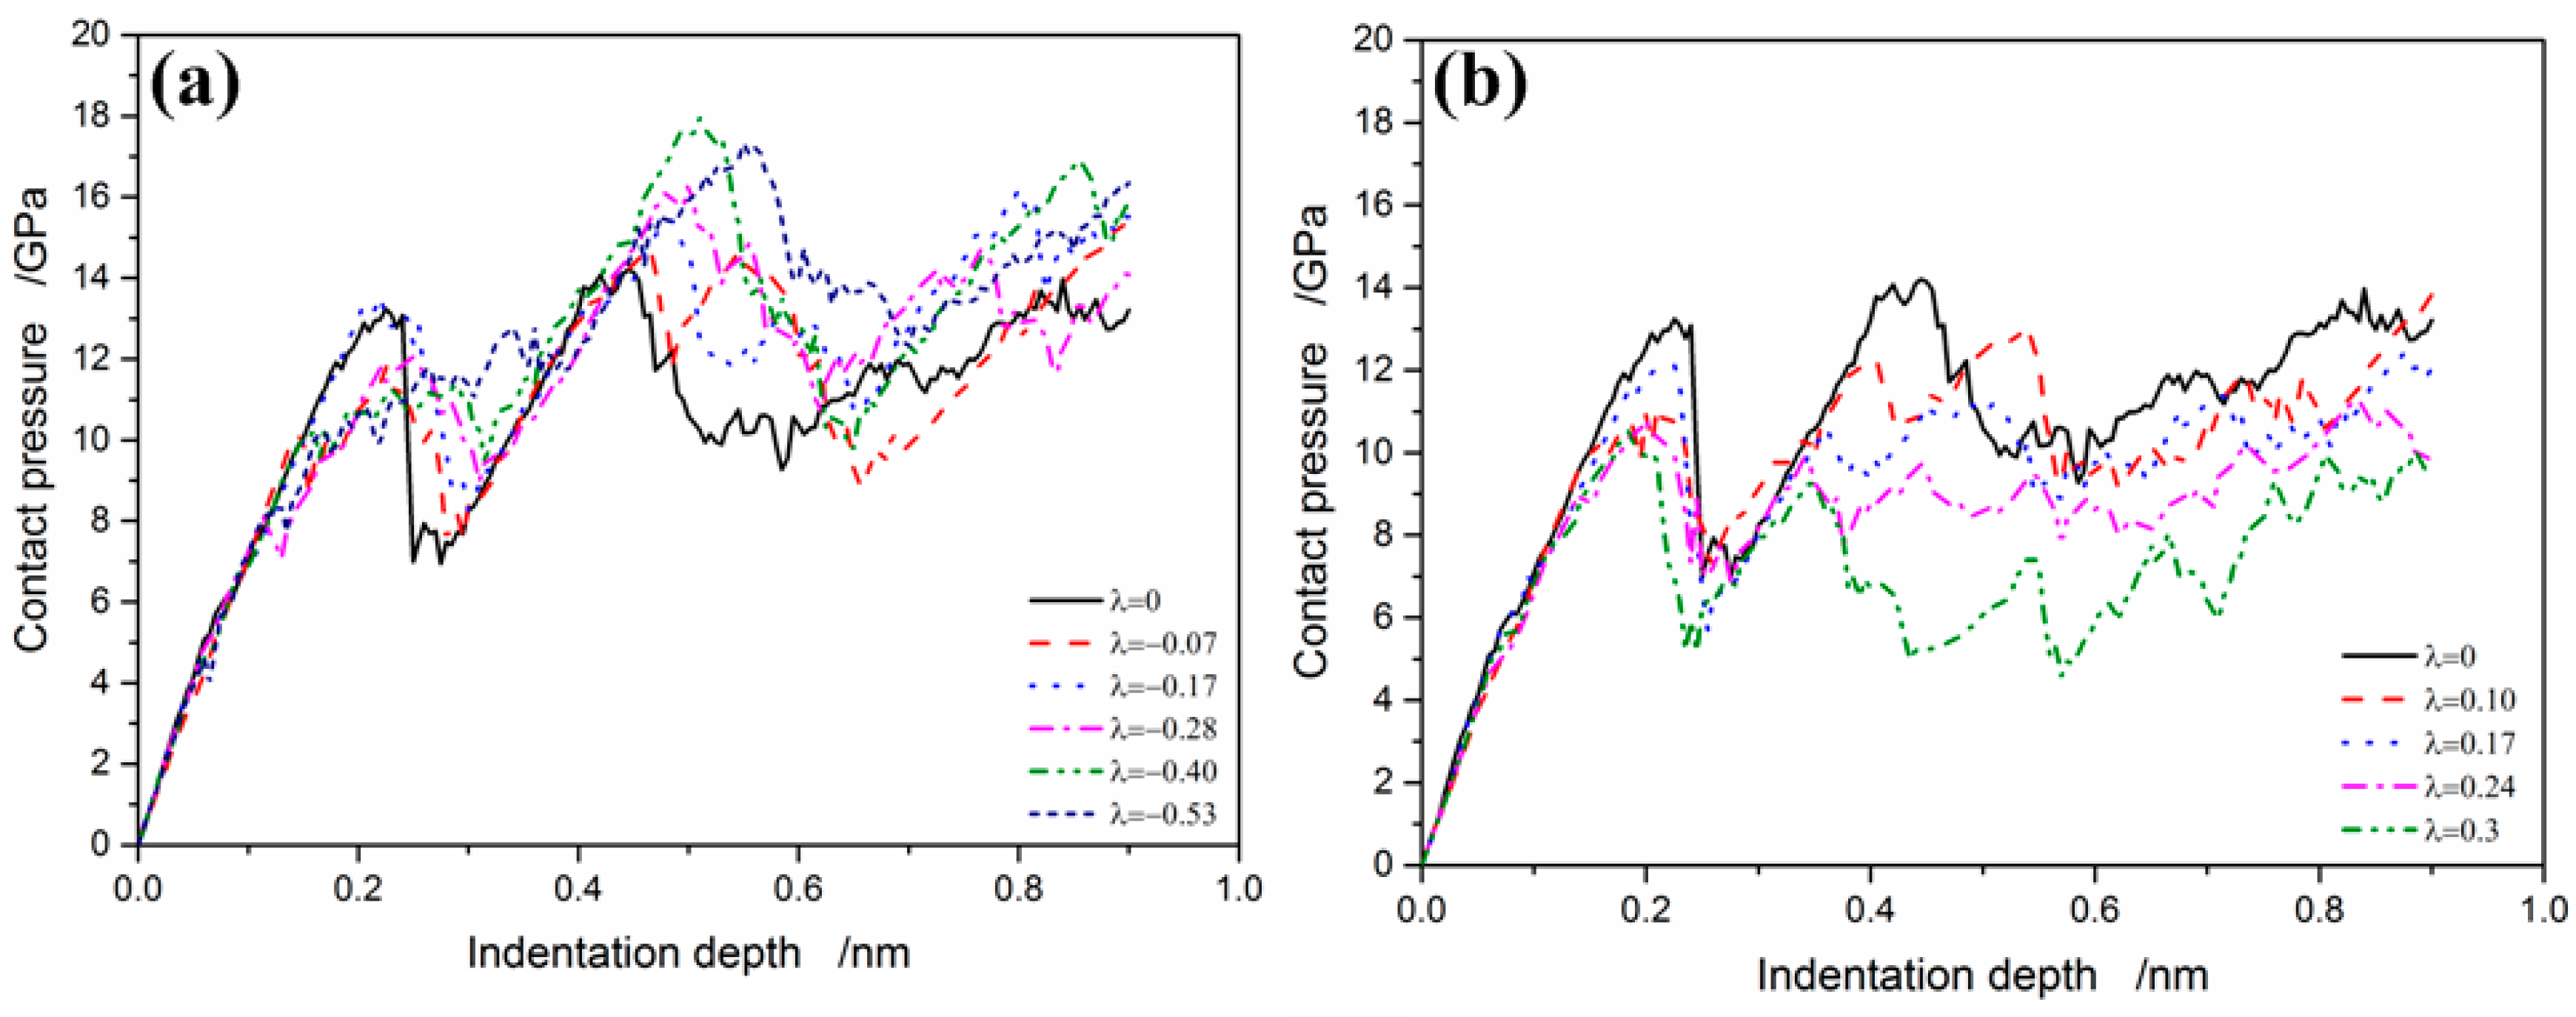
The variation of the mean contact pressure versus the indentation depth under different relative residual stresses may reflect the contact surface properties. The mean contact pressure is defined as
where P is real contact load obtained from an MD simulation, and the corresponding contact area is A evaluated from the projected polygon.
The contact pressure against indentation depth is presented in Figure 5. Apparently, it can be observed that, under the same indentation depth, compressive residual stress can increase the mean contact pressure (Figure 5a), while tensile residual stress decreases the mean contact pressure (Figure 5b). With this result, we can define the maximum mean contact pressure as the indentation hardness corresponding to a given residual stress value in Figure 5, as
which is shown in Figure 6. It can be seen that the indentation hardness H is 14.32 GPa (λ = 0). Thus, from the well-known relationship between yield stress and hardness:
the yield stress can be derived as 4.43 GPa. This value agrees with the ideal shear strength of Cu [33]. When increasing tensile stress, the hardness rapidly decreases, while the indentation hardness increases with compressive residual stress in a moderate range. That is consistent with the experiments, finite element simulations, and MD simulations [34,35]. However, when the relative compressive residual stress λ is larger than 0.40, the hardness decreases rather than increases as shown in Figure 6, which will be discussed with dislocation evolution in the following subsection.
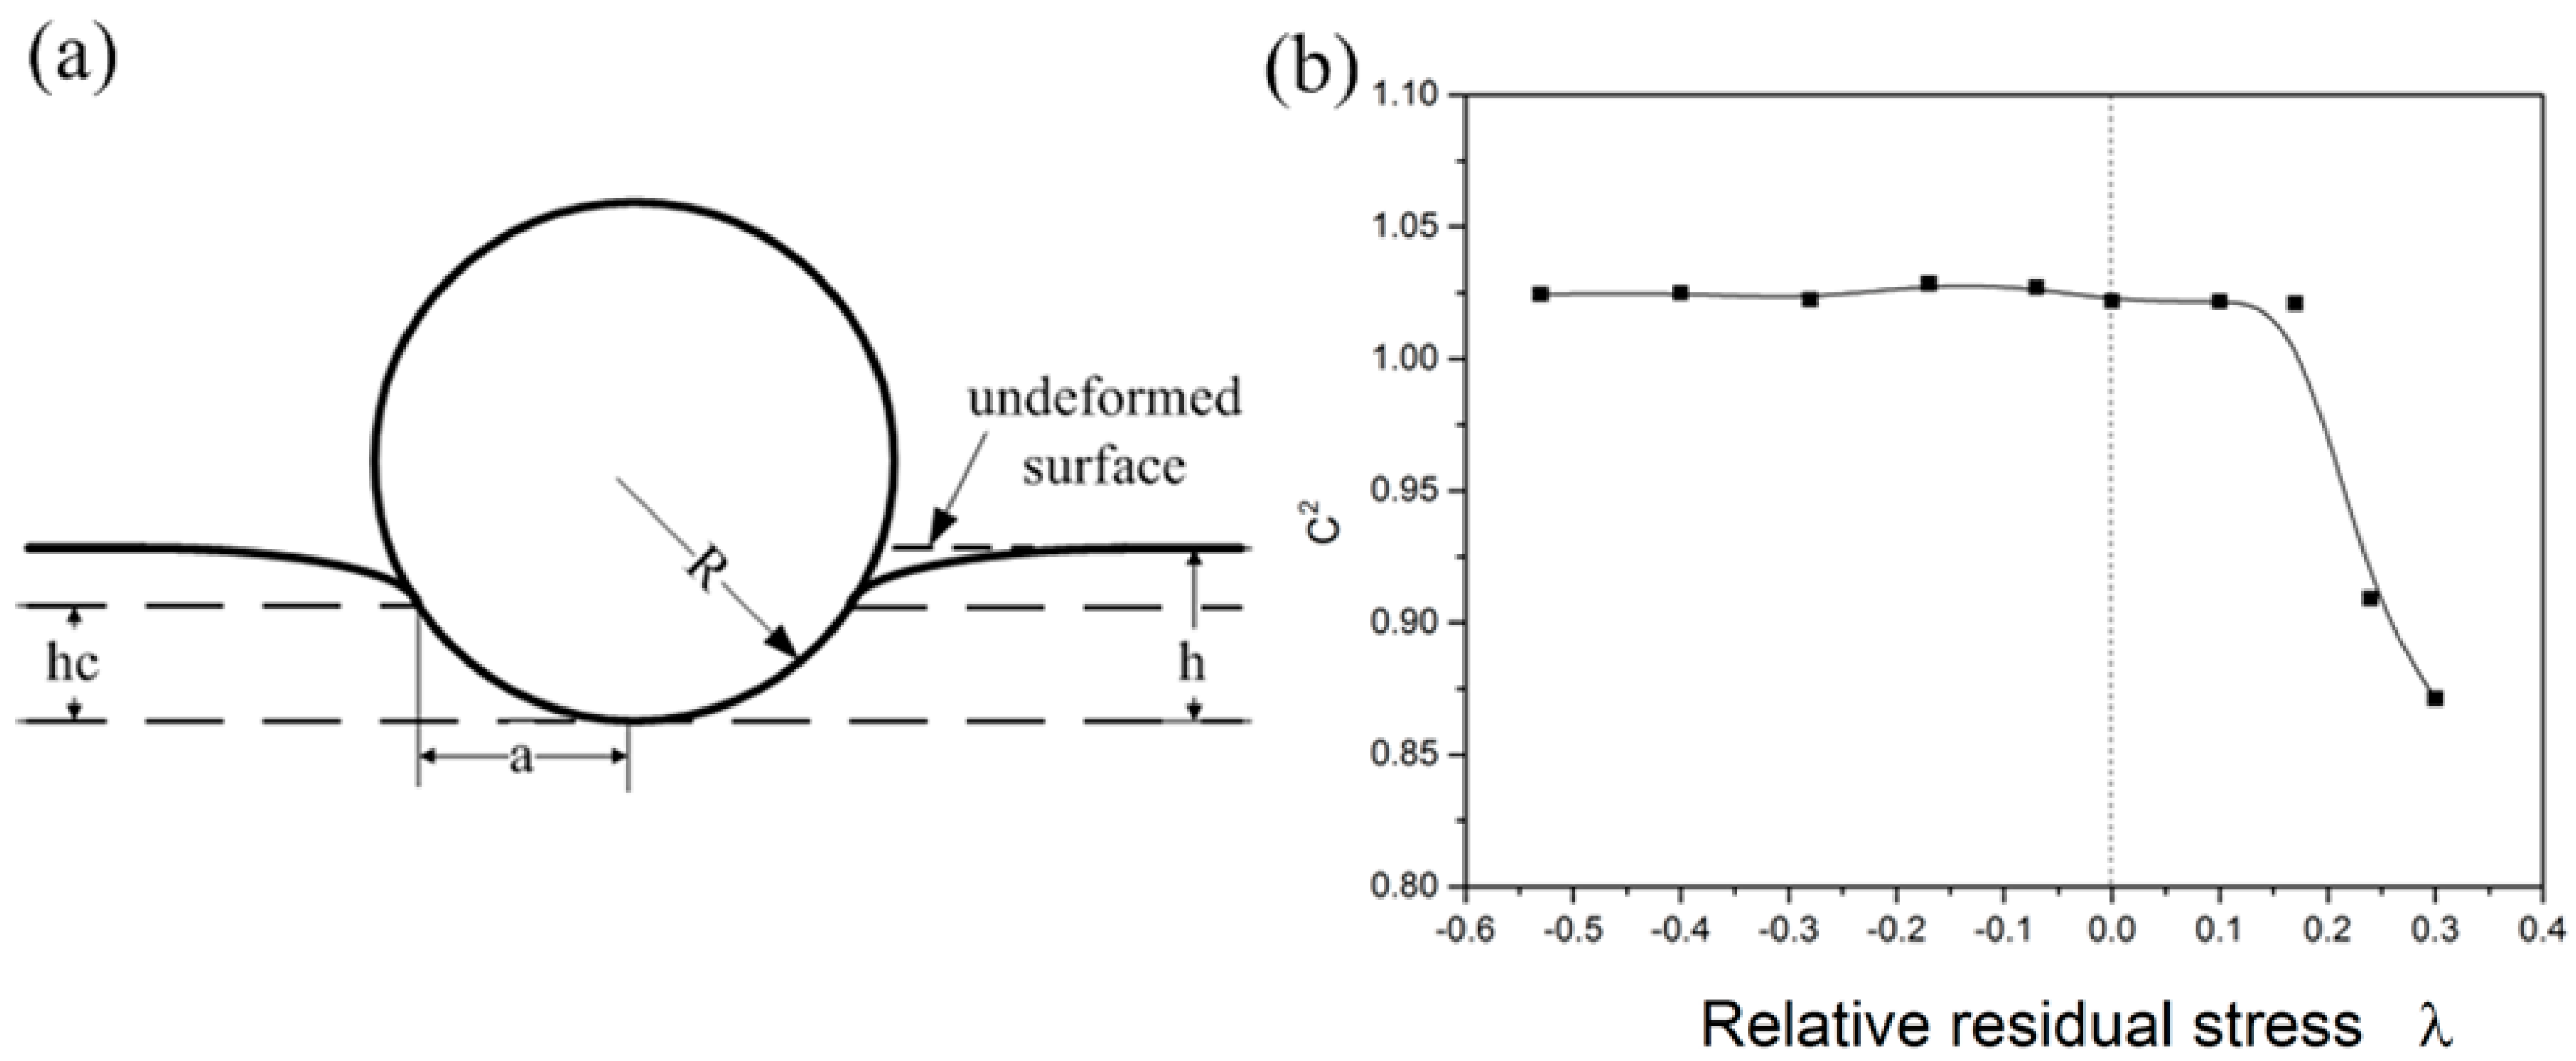
As the indenter is pressed in the surface, as illustrated in Figure 7a, the material either is in a plastic pileup or in an elastic sink-in at the crater rim. Here, a relative contact area C2 can be defined as
where A is the real contact area from the MD simulation, and is the nominal contact area. Substantial error can occur when measuring the contact radius after unloading due to the large elastic recovery [28]. The relative contact area C2, as a function of relative residual stress λ, is plotted in Figure 7b. It can be seen that the relative contact area keeps a constant value greater than 1.0 in compressive stress (λ < 0), while the relative contact area also keeps unchanged value at 1.025 with increasing tensile residual stress at first, and then decreases continuously (λ > 0.17). This implies that the film around the indenter is in plastic pileup for compressive residual stress, while the sink-in effect appears when the residual stress exceeds a critical value. This is in good agreement with the MD simulations and the experimental results [28,36]. The in-plane residual stress has, therefore, a significant influence on the elastic-plastic property in single-crystal copper thin film.
3.2. Microstructure Evolution at Different Residual Stress
The atomistic visualization of defects is incorporated here in order to study the microstructure evolution of copper thin film with different residual stresses. The dislocation snapshots at relative residual stress λ = 0, 0.17, −0.17, 0.30, and −0.53 are presented in Figure 8, Figure 9, Figure 10, Figure 11 and Figure 12, respectively. In those images, normal FCC atoms in the substrate are removed off.
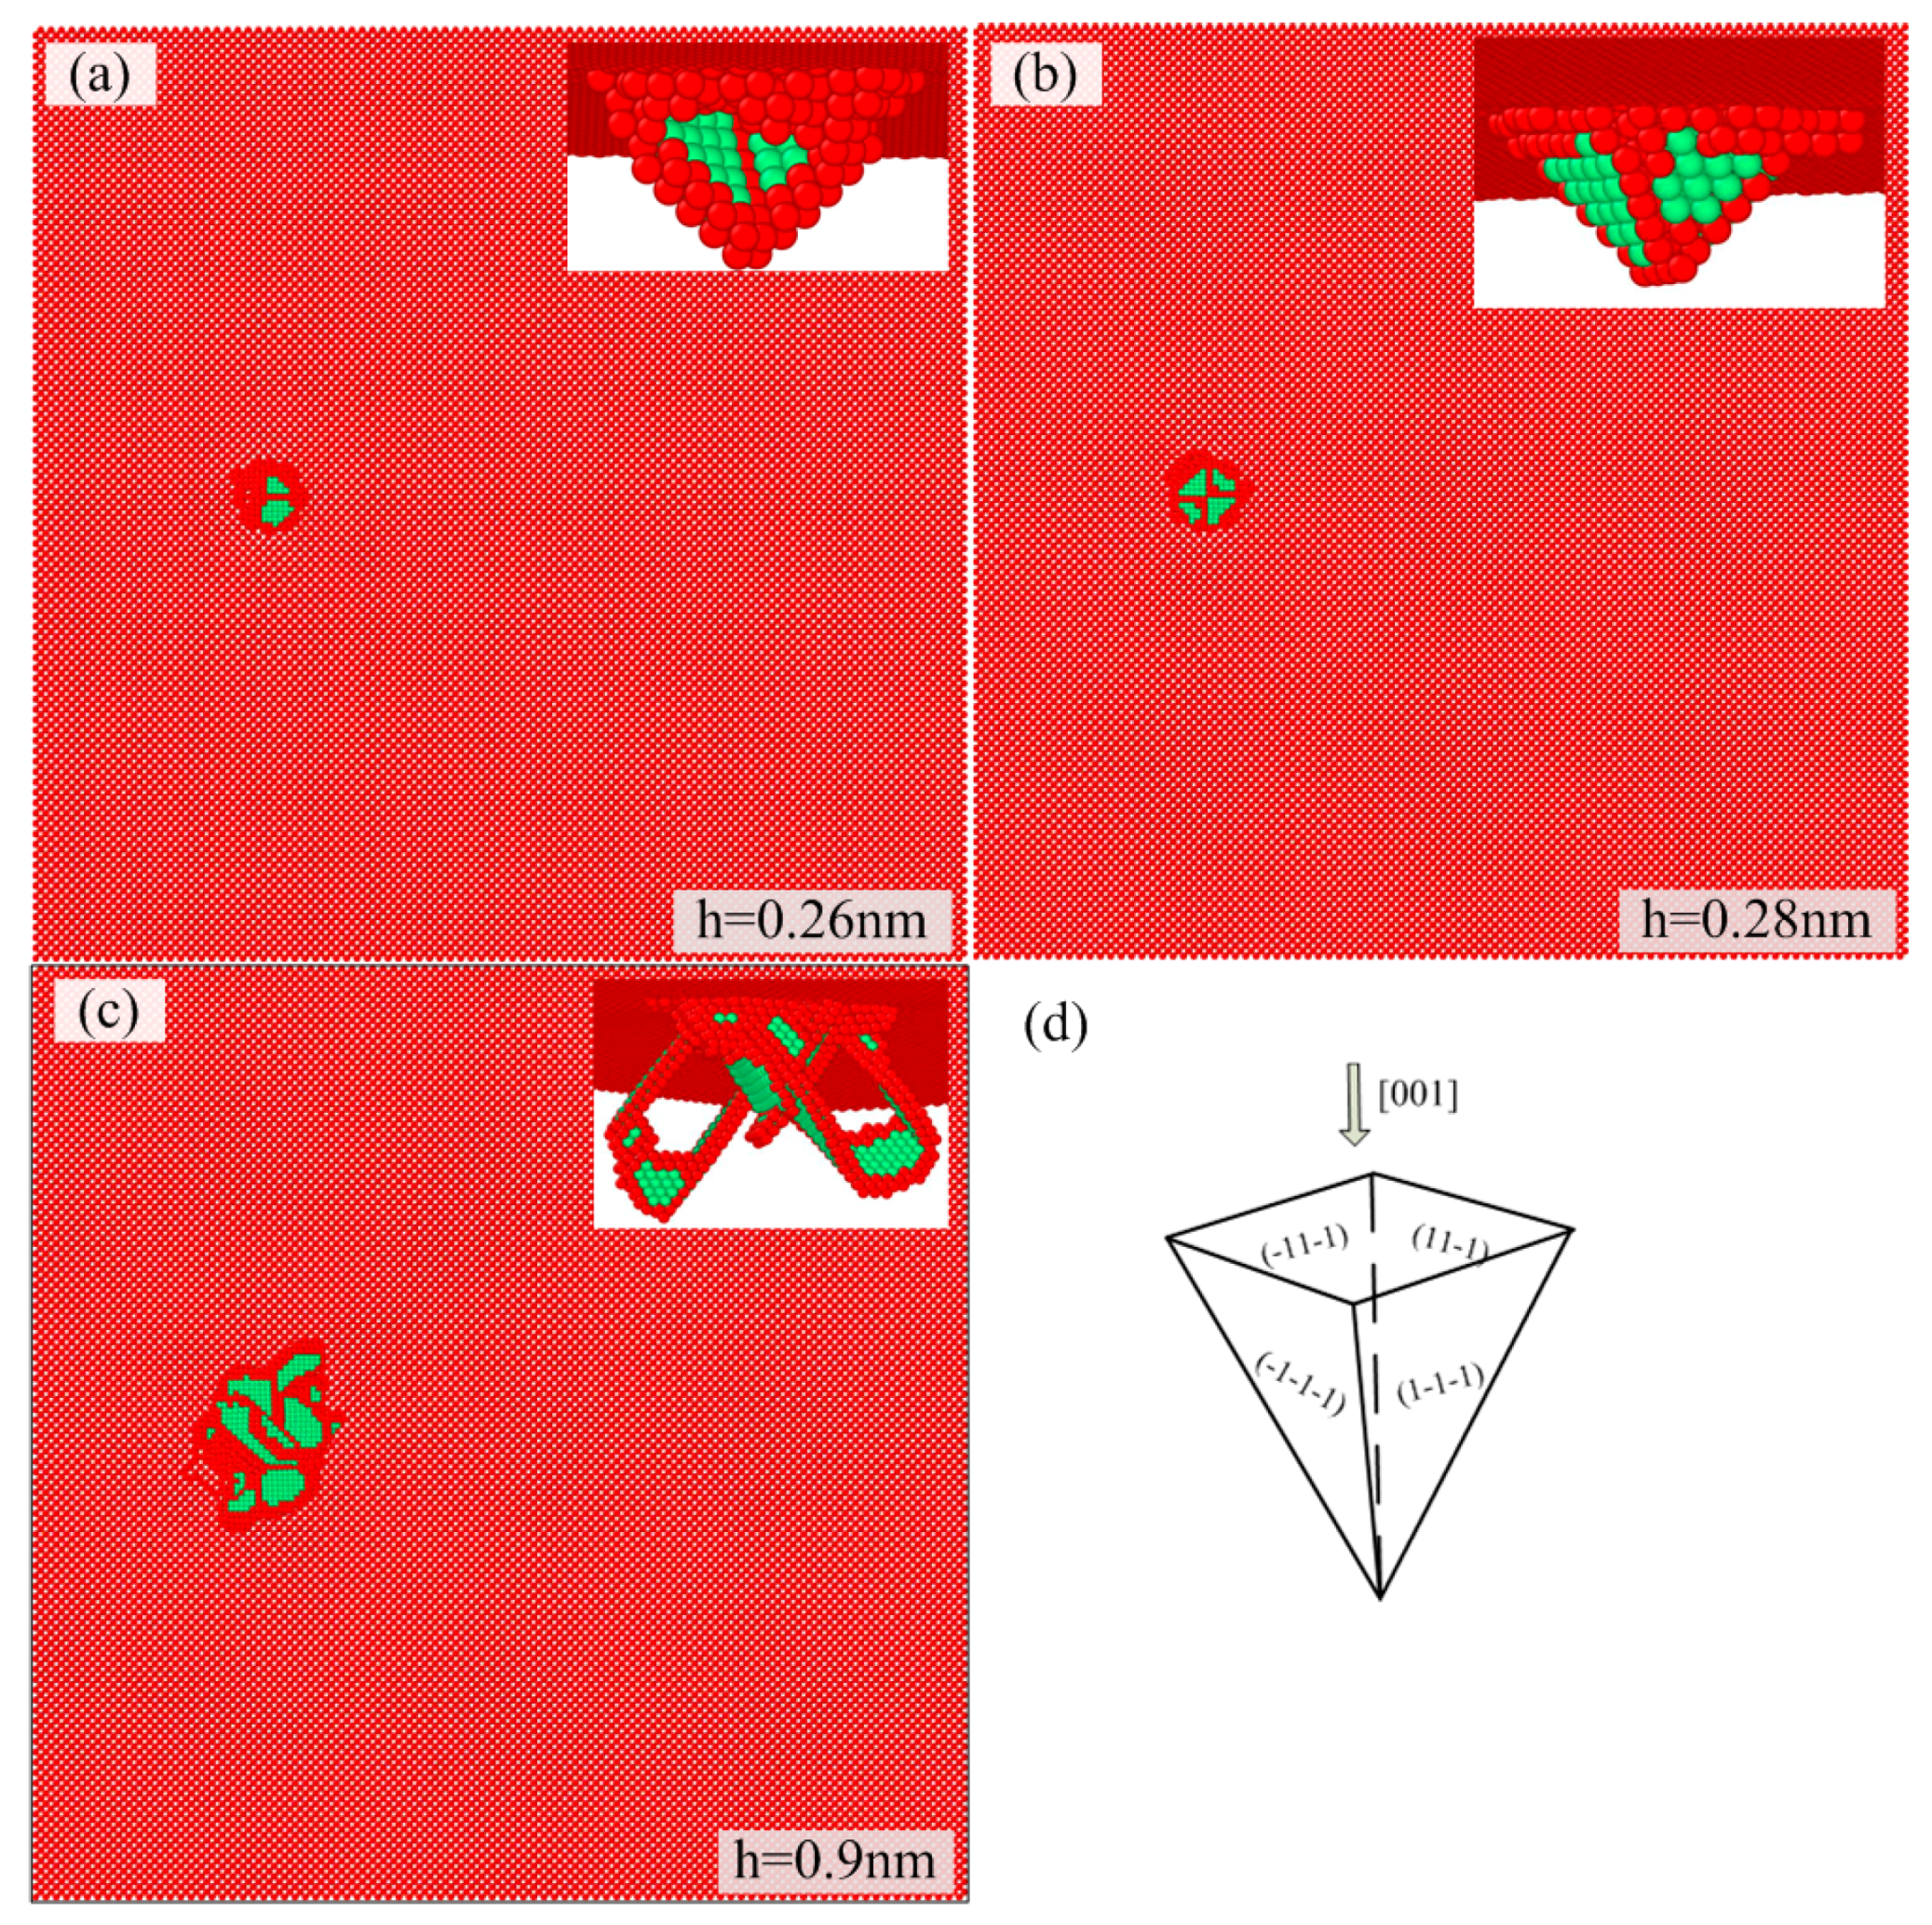
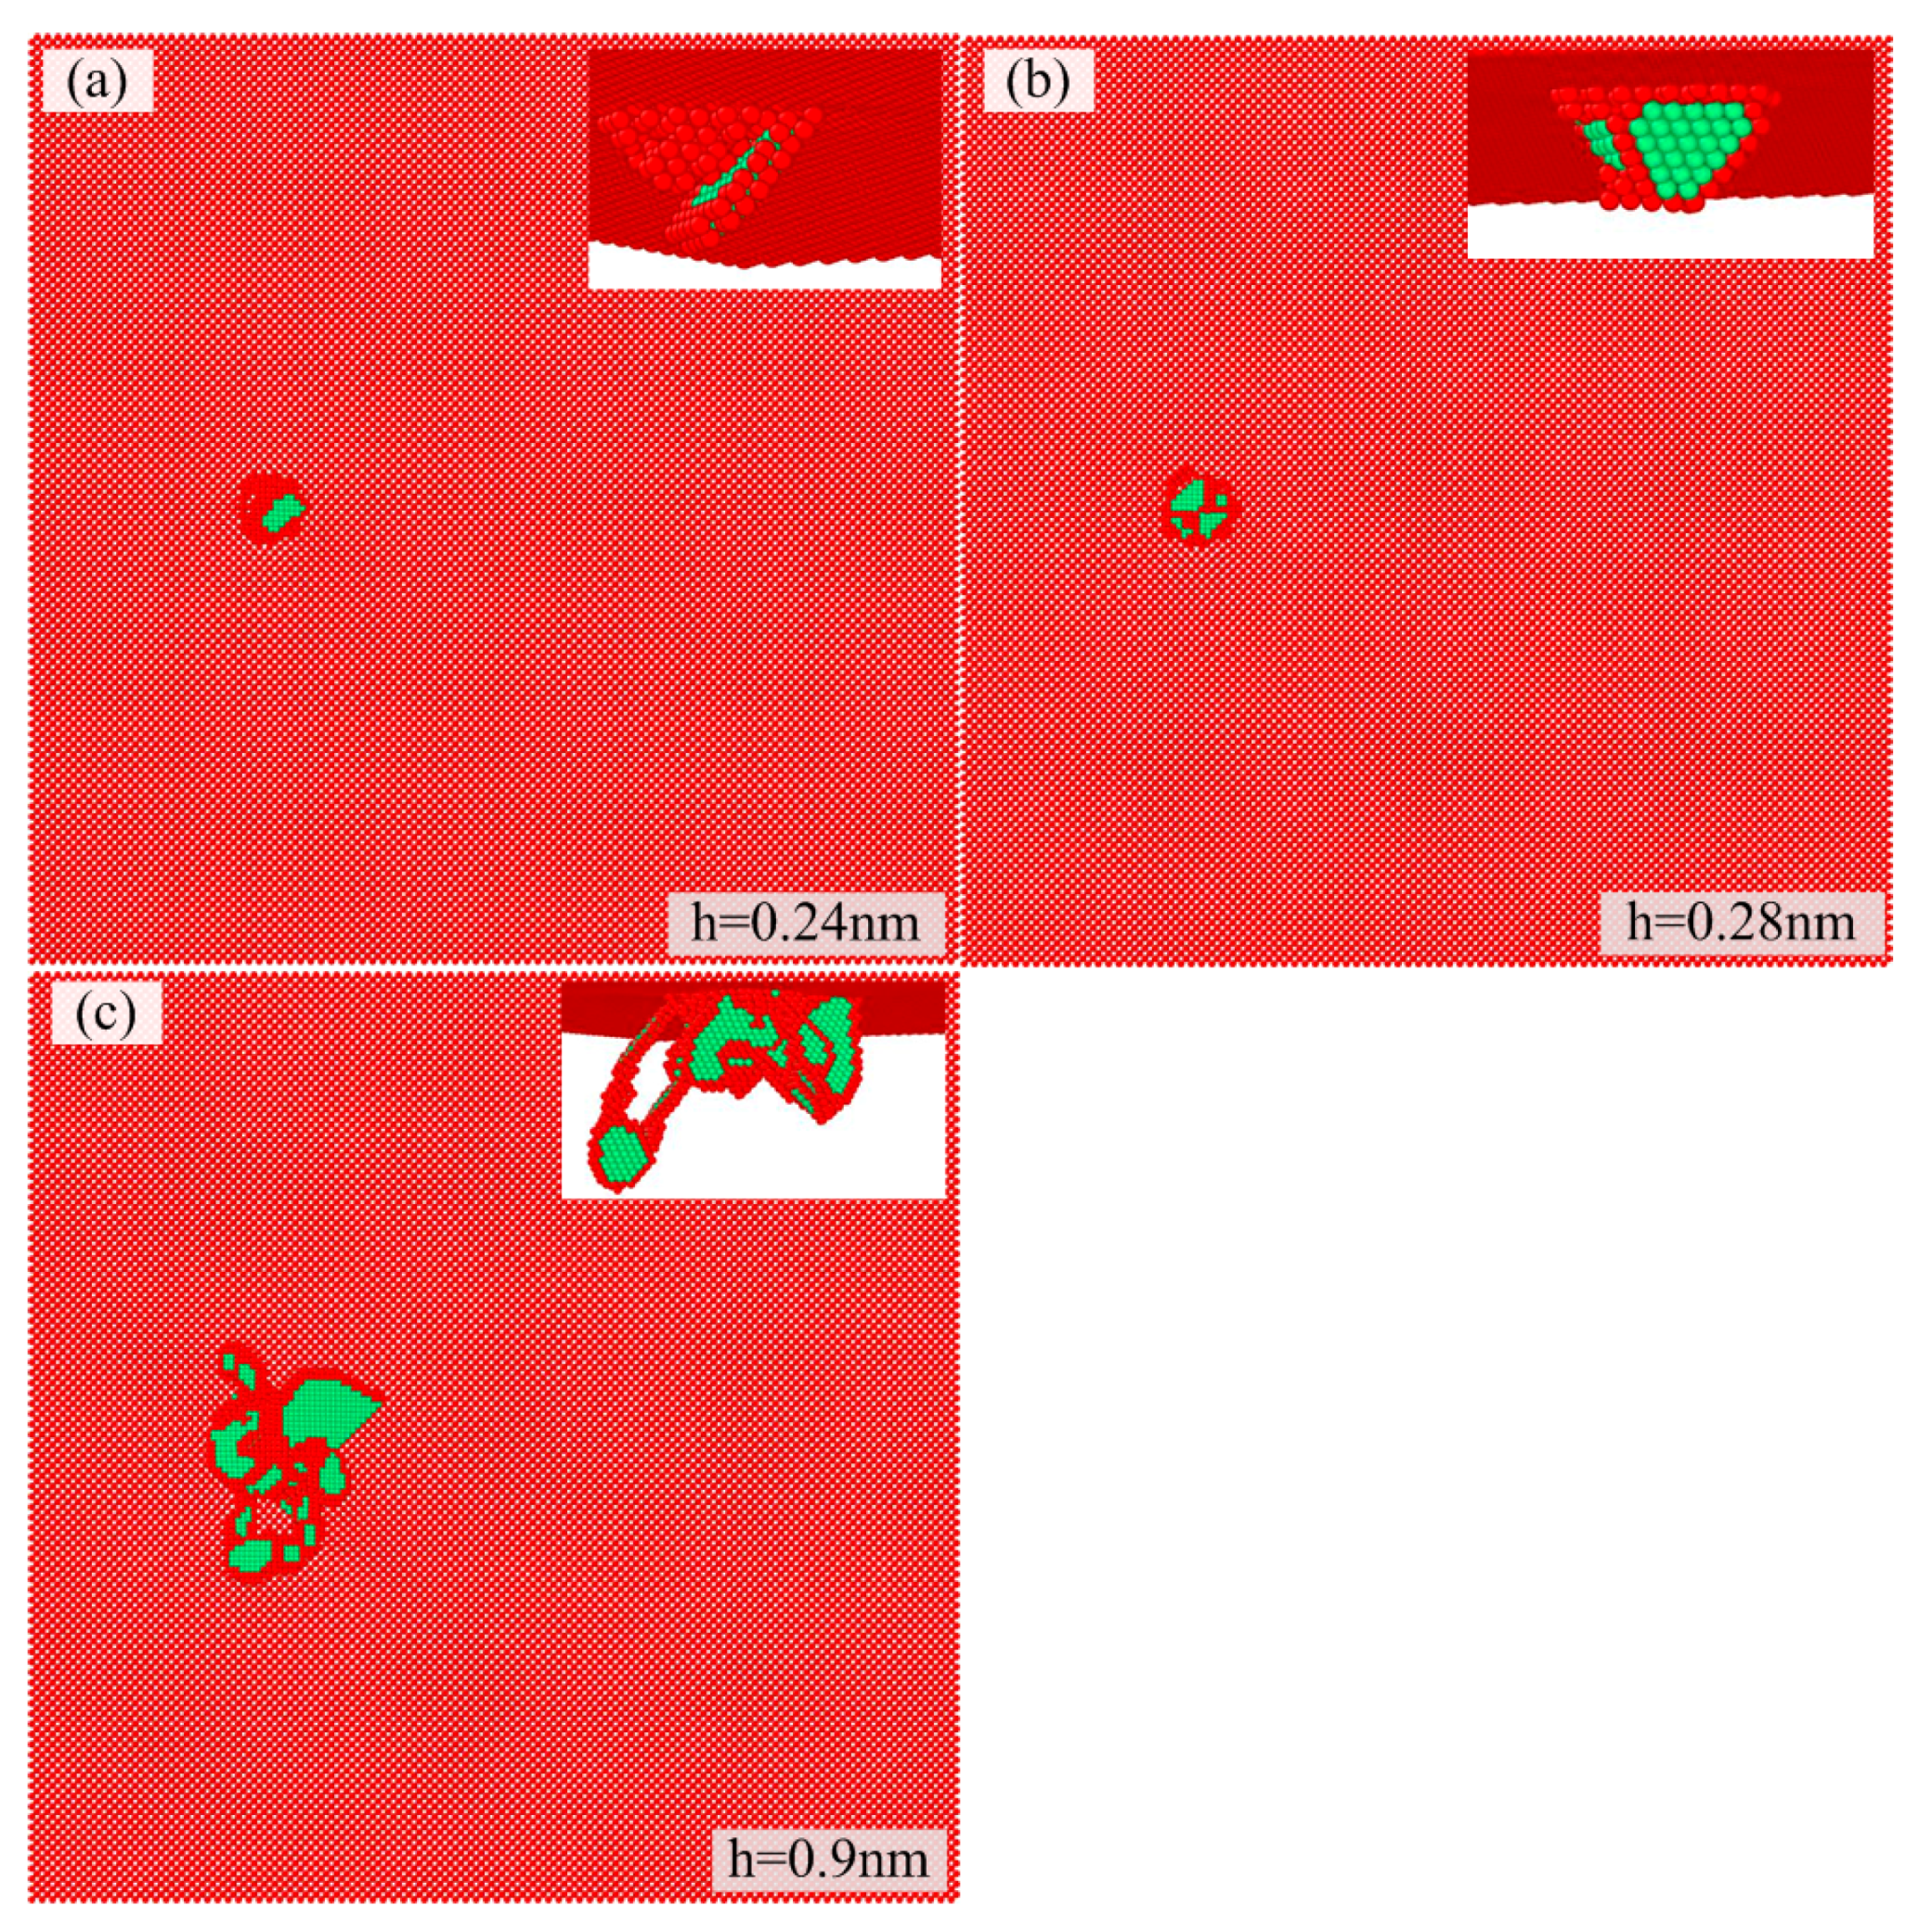
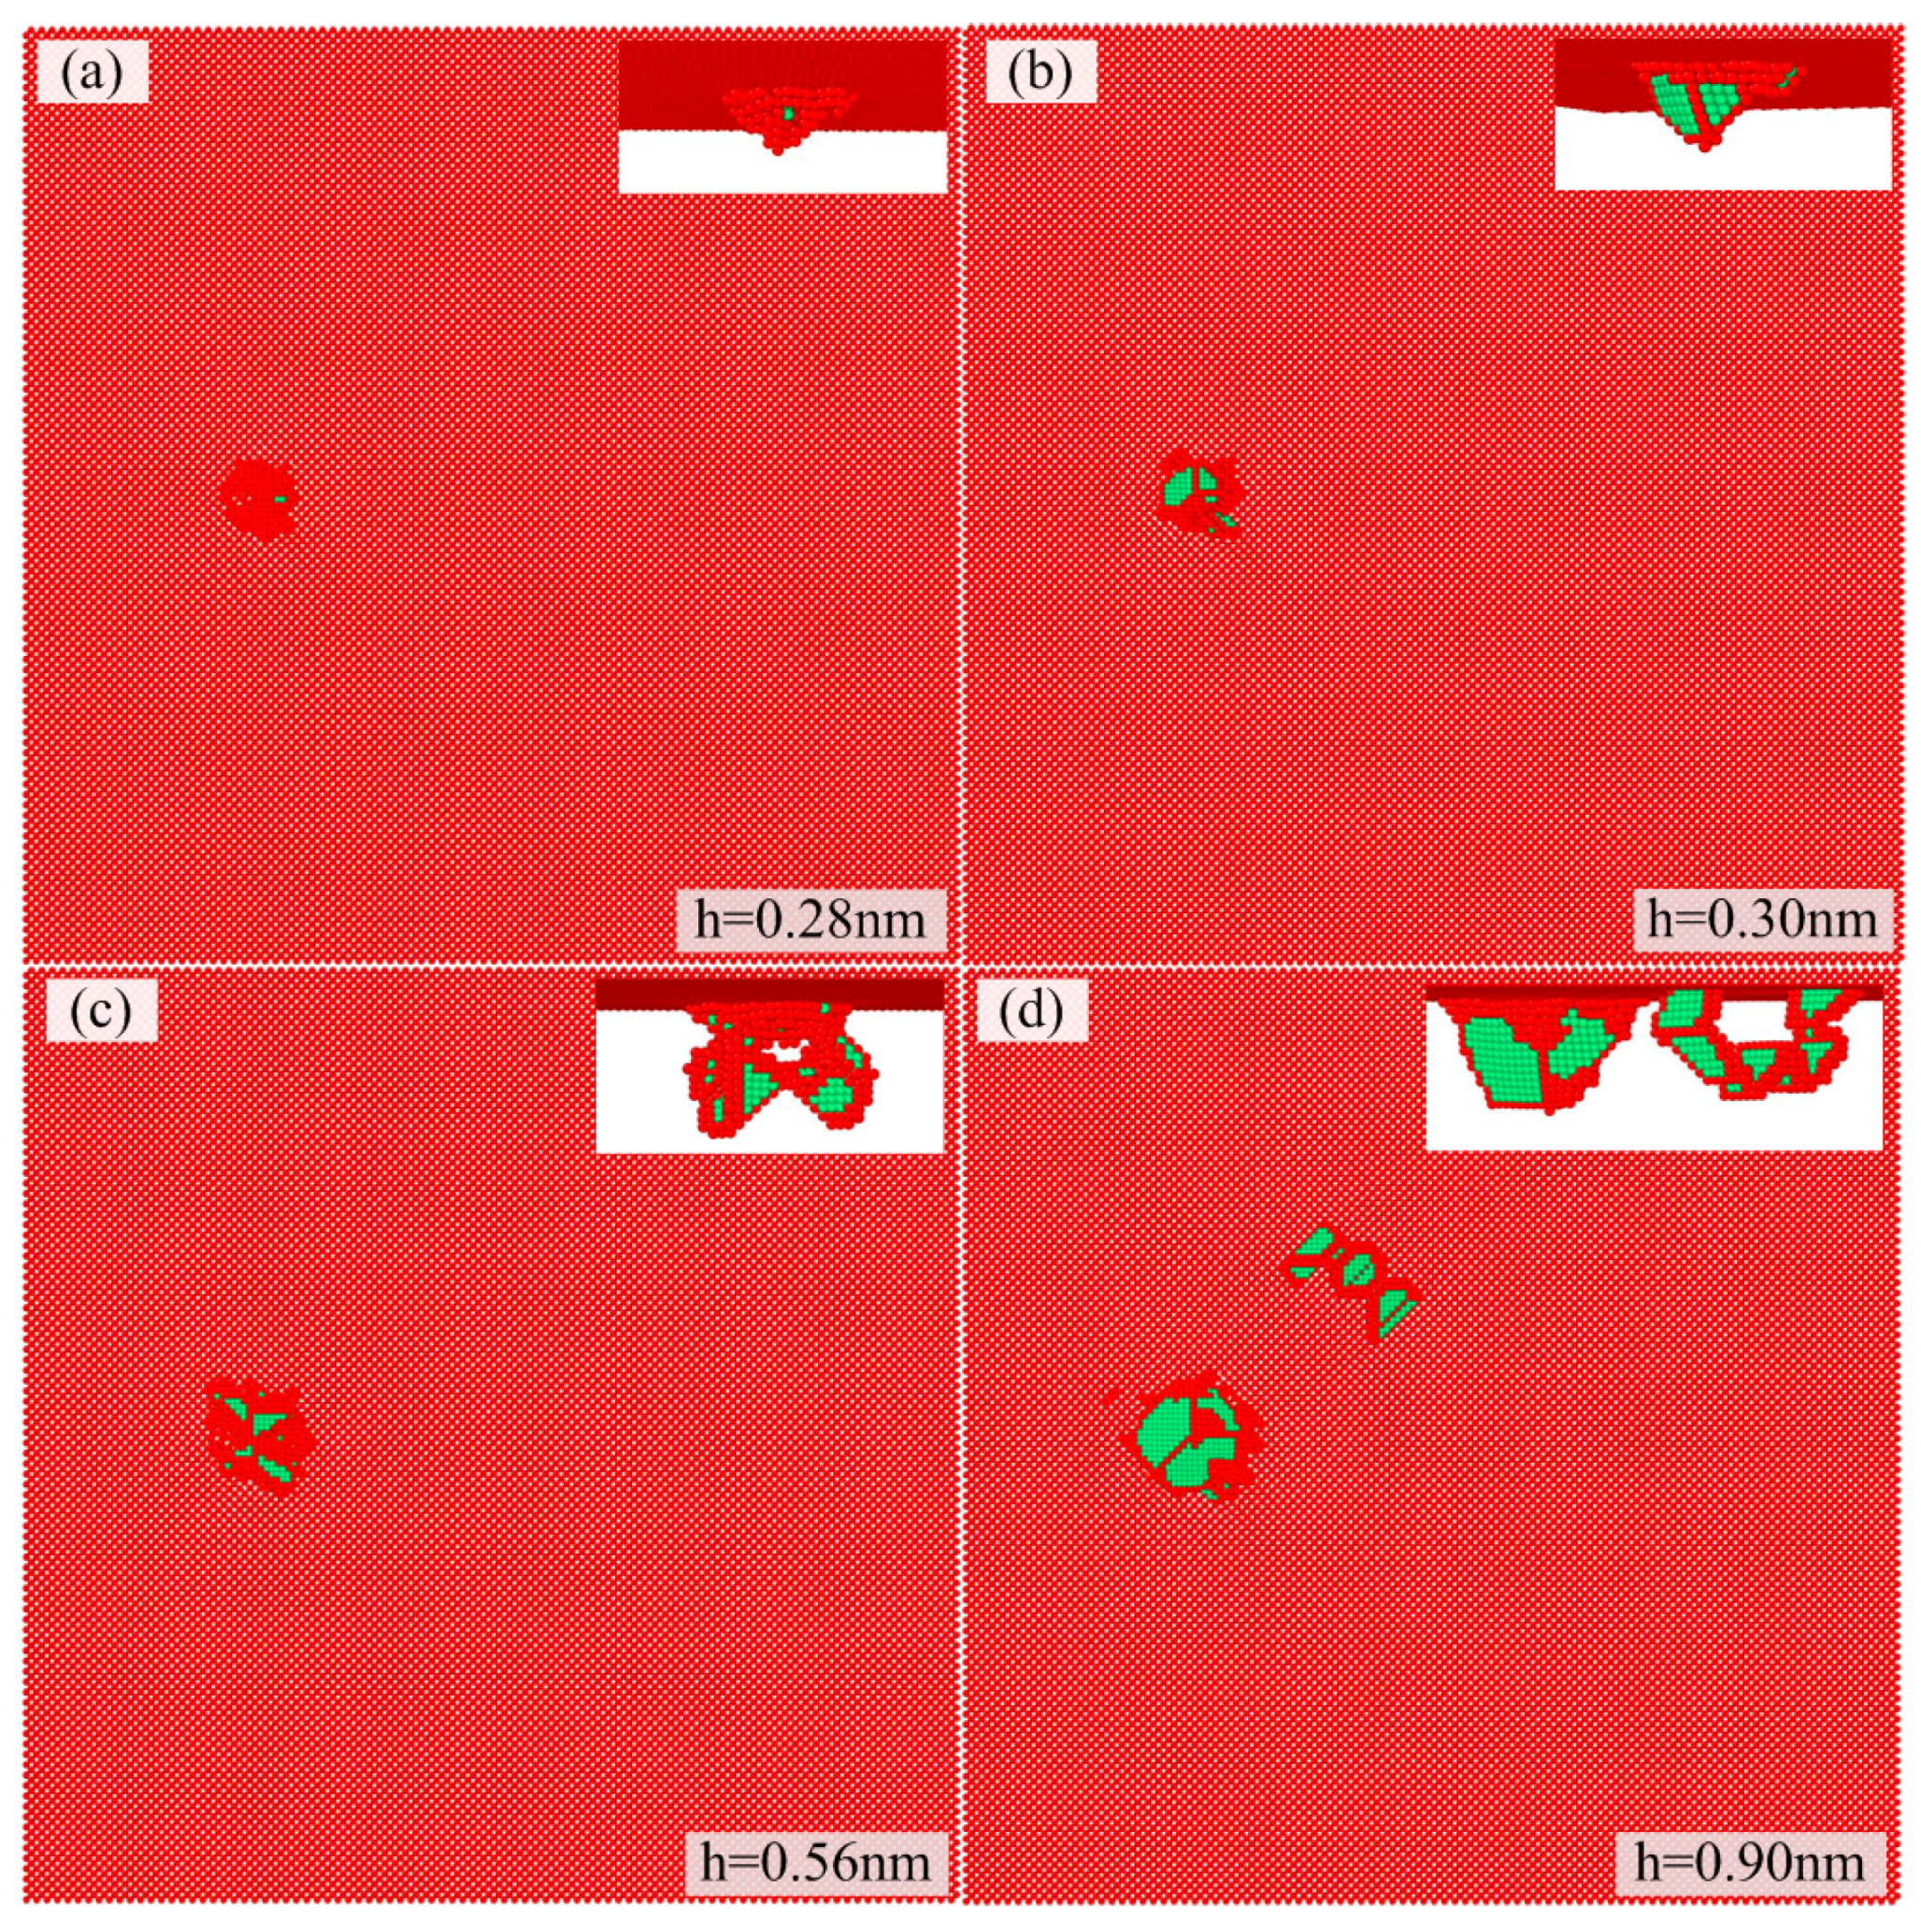
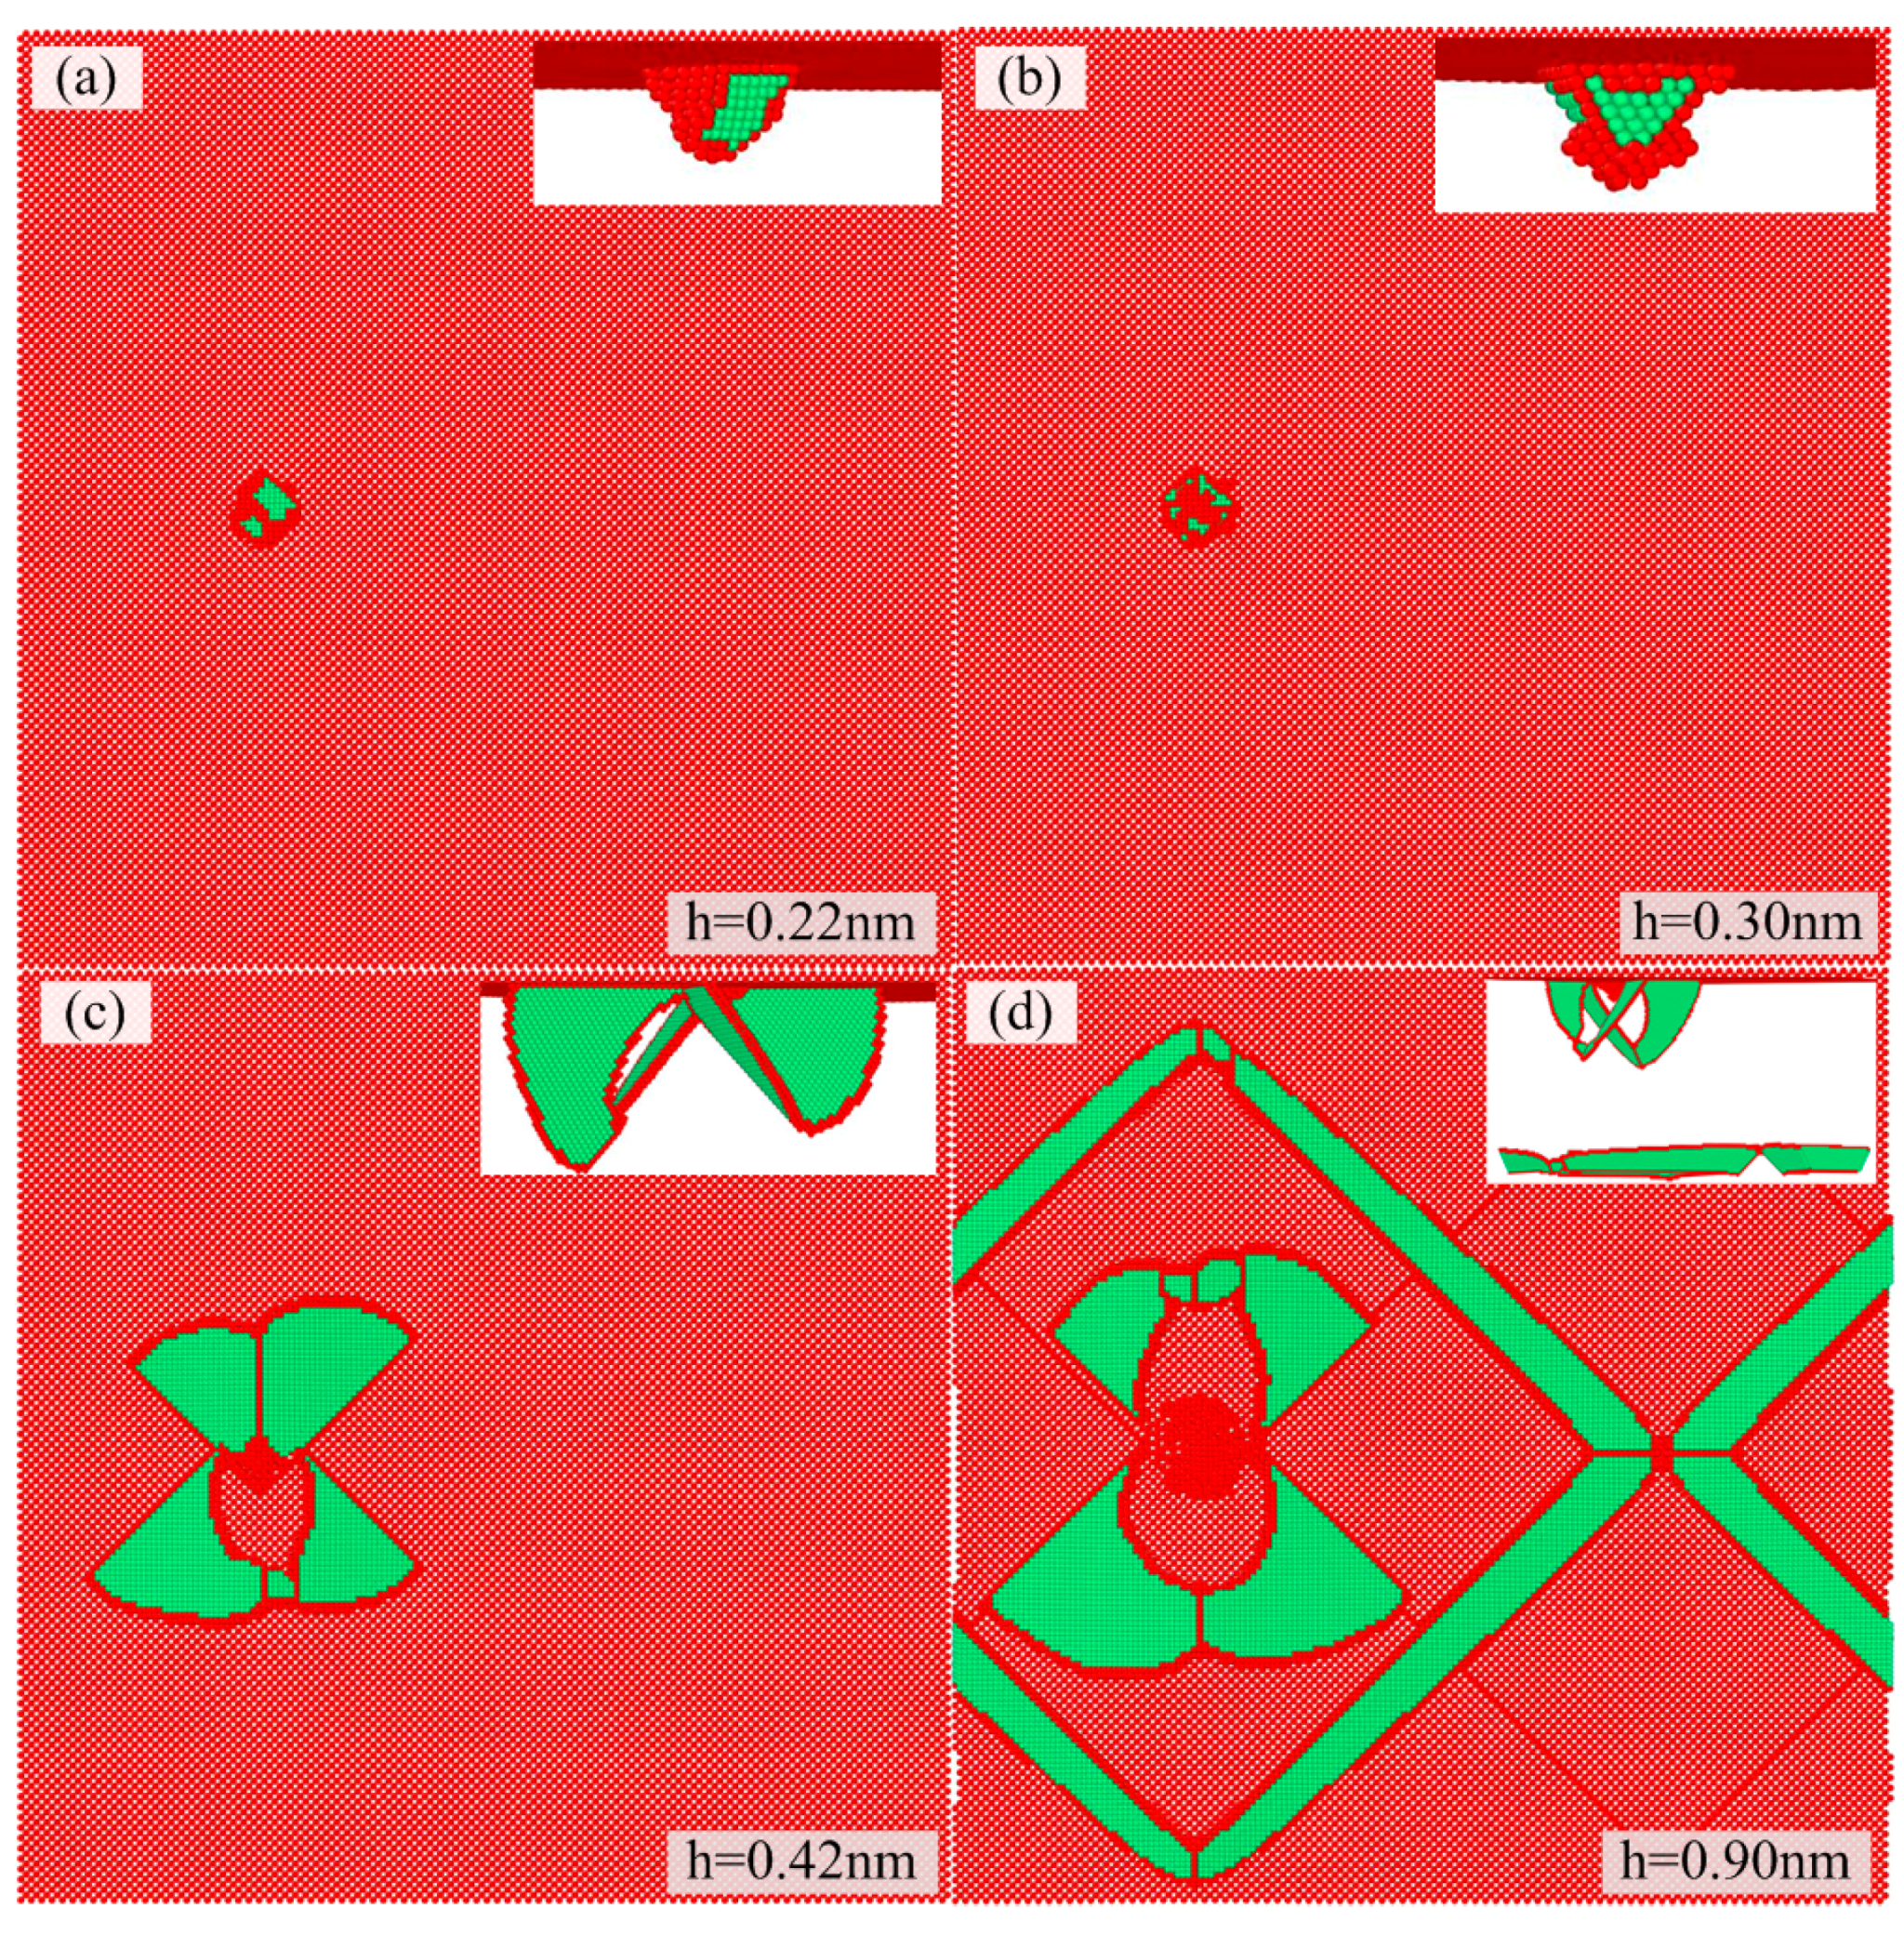
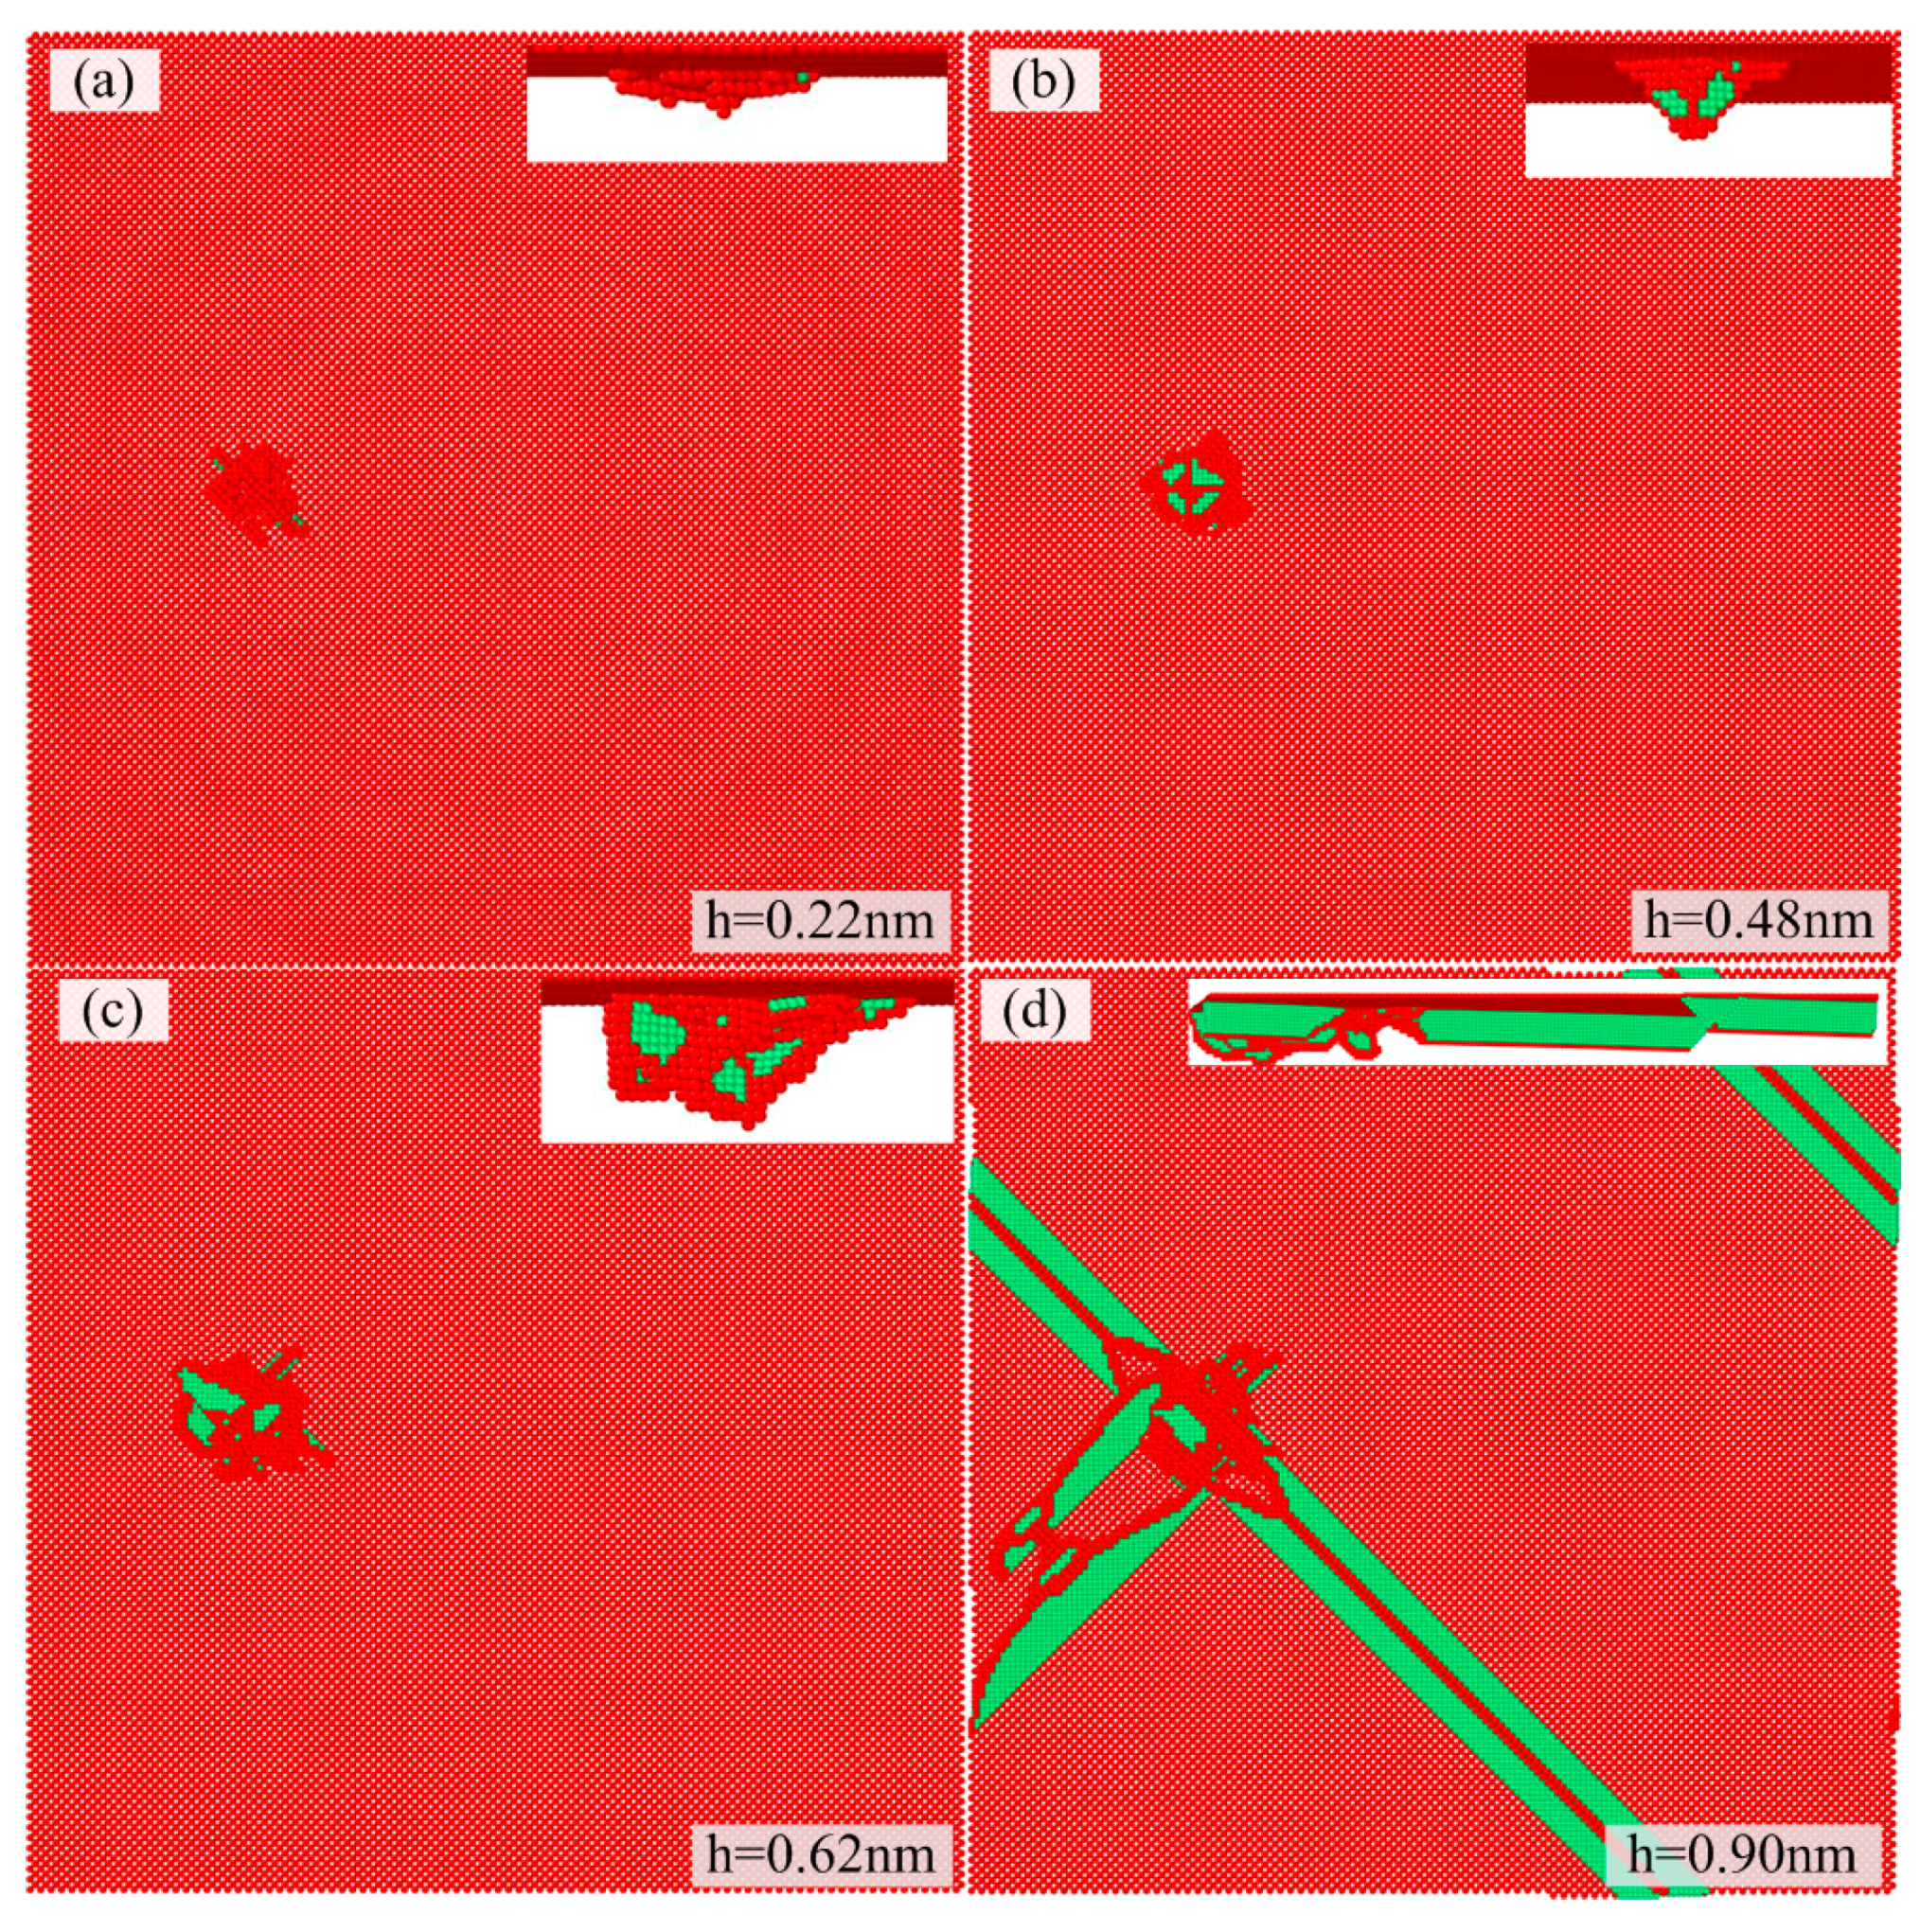
It can be observed from Figure 8, Figure 9, Figure 10, Figure 11 and Figure 12 that small atom clusters appear in the indented film with penetrating initiating, which can be regarded as precursors to dislocations. As the indentation depth moves beyond a critical indentation depth, dislocation embryos occur as shown in Figure 8, Figure 9, Figure 10, Figure 11 and Figure 12, then, they evolve and transform to a tetrahedral structure, which corresponds to a sharp load drop as shown in Figure 2 and Figure 3. In all cases, the Shockley partial dislocations bounding the stacking fault domains are nucleated and evolved in {111} planes (as shown in Figure 8d), which commonly occurs for FCC (111) nanoindentation. Similar results are also observed in the MD simulation of Cu in the (111) surface [24], although there exist three atom clusters in indented film. From b to c in Figure 8, Figure 9, Figure 10, Figure 11 and Figure 12, a great quantity of dislocations initiate and propagate, and dislocation loops also appear beneath the indented film with the increasing indentation depth in the strain burst regime (Figure 2 and Figure 3). However, compared with the dislocation distribution in compressive residual stress (in Figures 10d and 12d), the dislocations are extended to a deeper position beneath the indented surface in tensile residual stress, as shown in Figures 9c and 11d. In addition, it can be easily understood that a larger tensile residual stress accompanies a much smaller indentation depth for the incipient plasticity, which is contrary to the case of compressive residual stress, verifying the variation in the load drop regime in the load vs. indentation depth curves (Figure 2 and Figure 3).
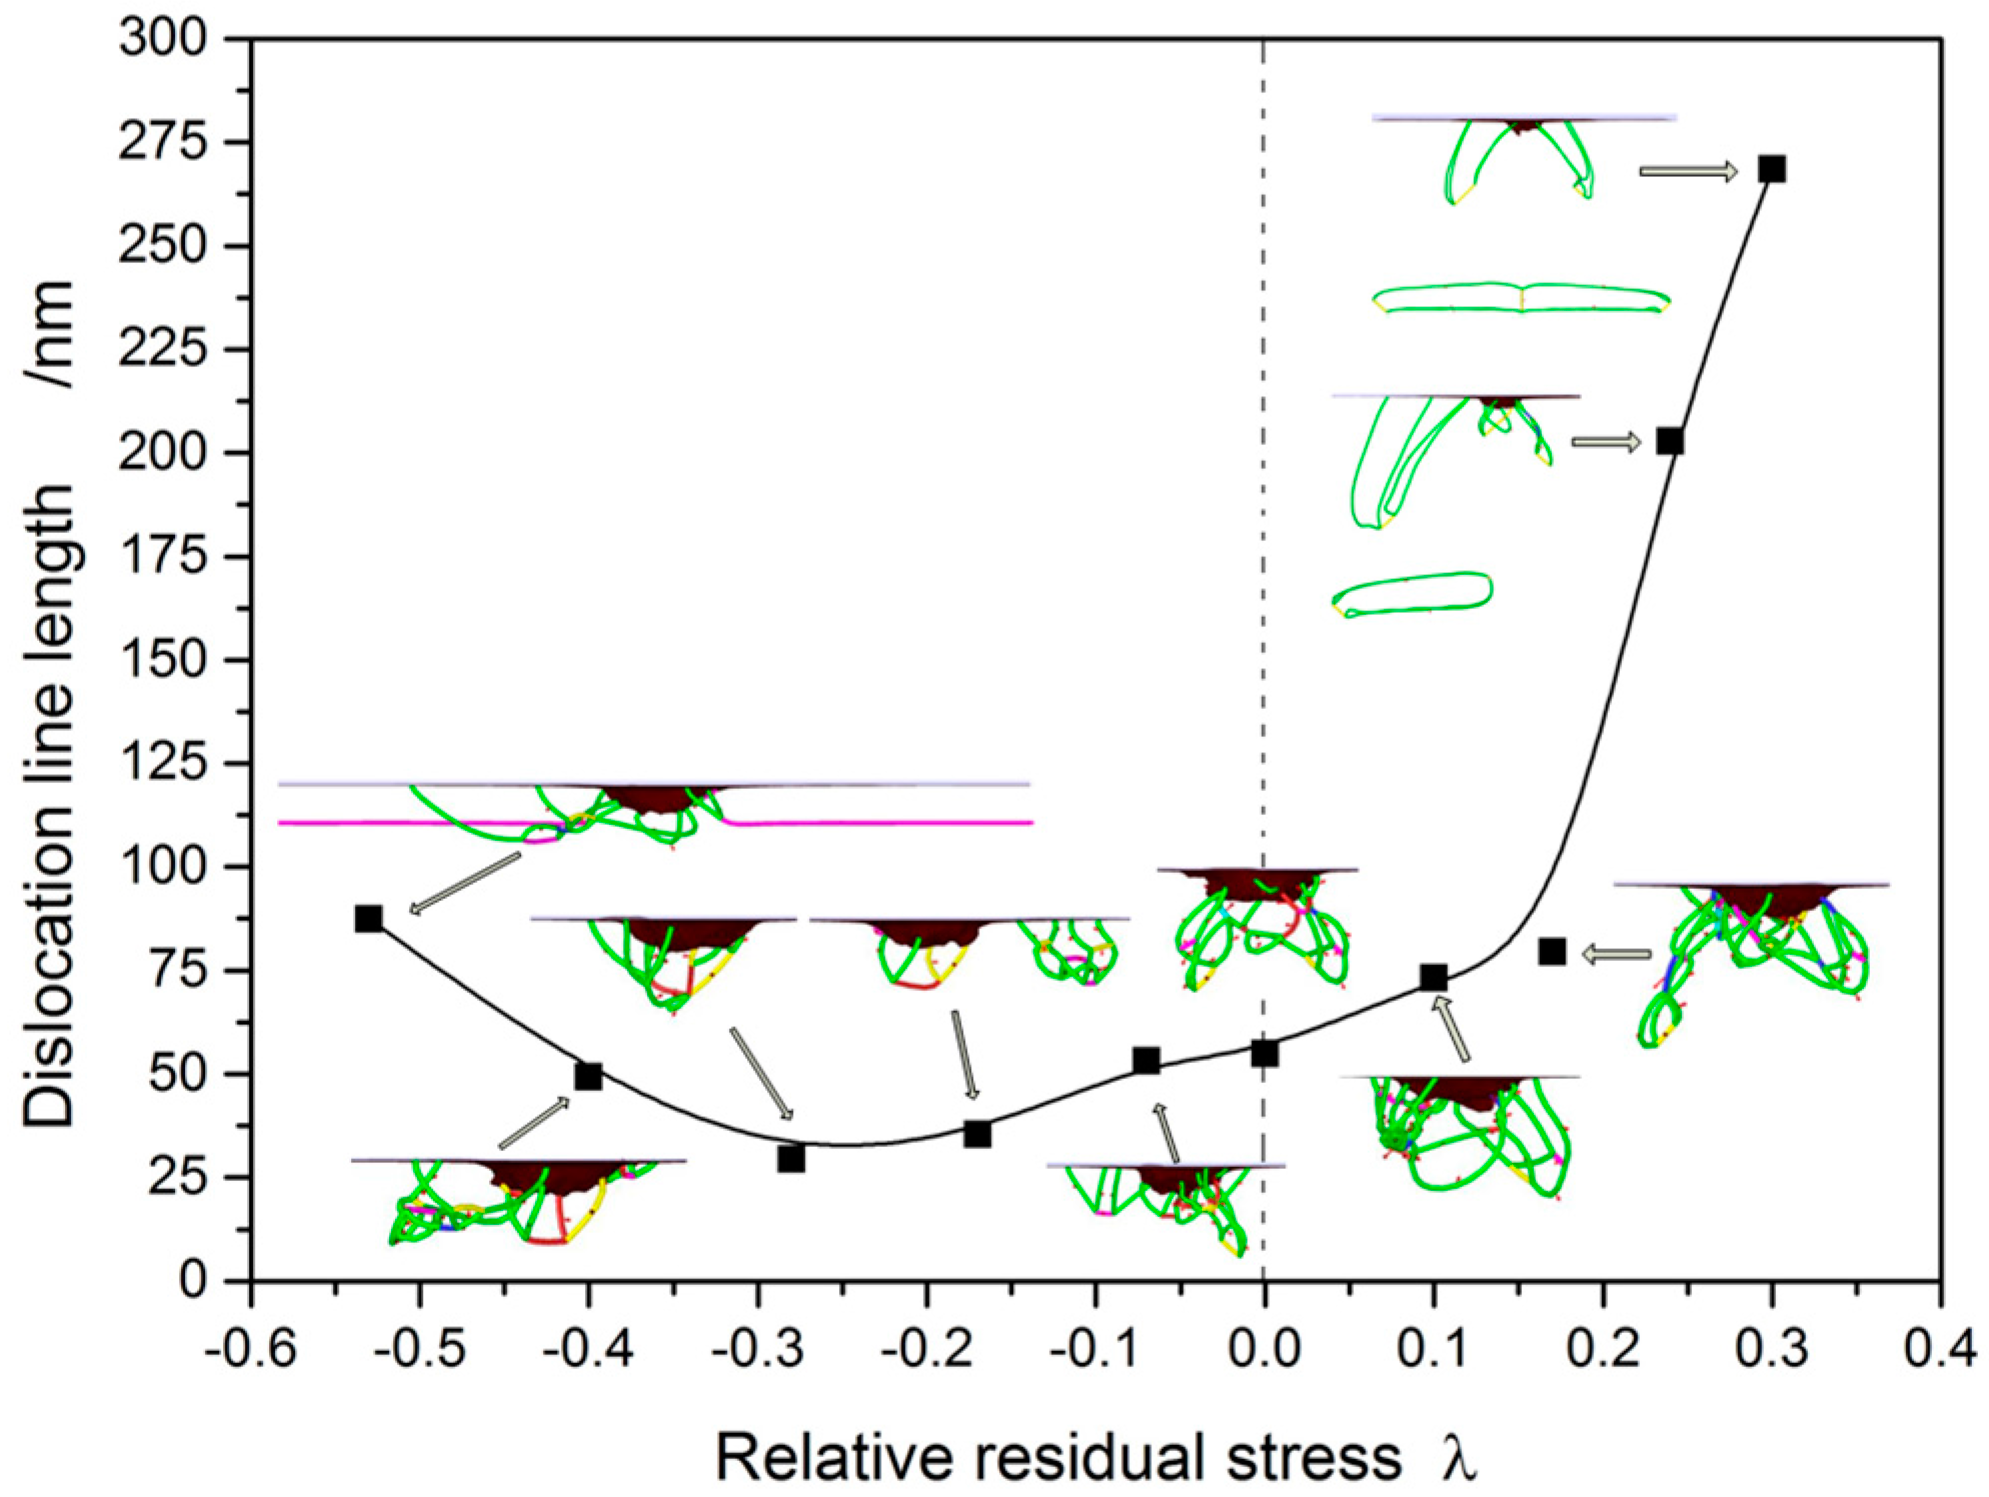
To further reveal the effect of residual stress on the dislocation distribution, a dislocation line length is introduced to describe the dislocation density in a certain volume. Dislocation lines are detected using the dislocation extraction algorithm (DXA) algorithm [37], and plotted as a function of relative residual stress in Figure 13. It can be seen that the dislocation line length increases linearly from λ = −0.28 to λ = 0.17, while it increases rapidly with the increasing tensile residual stress when the relative residual stress exceeds 0.17. This indicates that the larger tensile residual stress leads to a dramatic increase in dislocation density, and consequently deteriorates the indented surface film. When the compressive residual stress is smaller than −0.28, the dislocation density increases again as shown in Figure 13. By carefully examining the atomic configuration images, the increasing zone of dislocation density is mainly located at the subsurface, compared with Figure 12d, which definitely results in the dislocation vanishing in the surface during indenting. It also becomes a reason why a decrease of hardness occurs for a much larger compressive stress as shown in Figure 6.
3.3. Indentation Stress Field with Different Residual Stresses
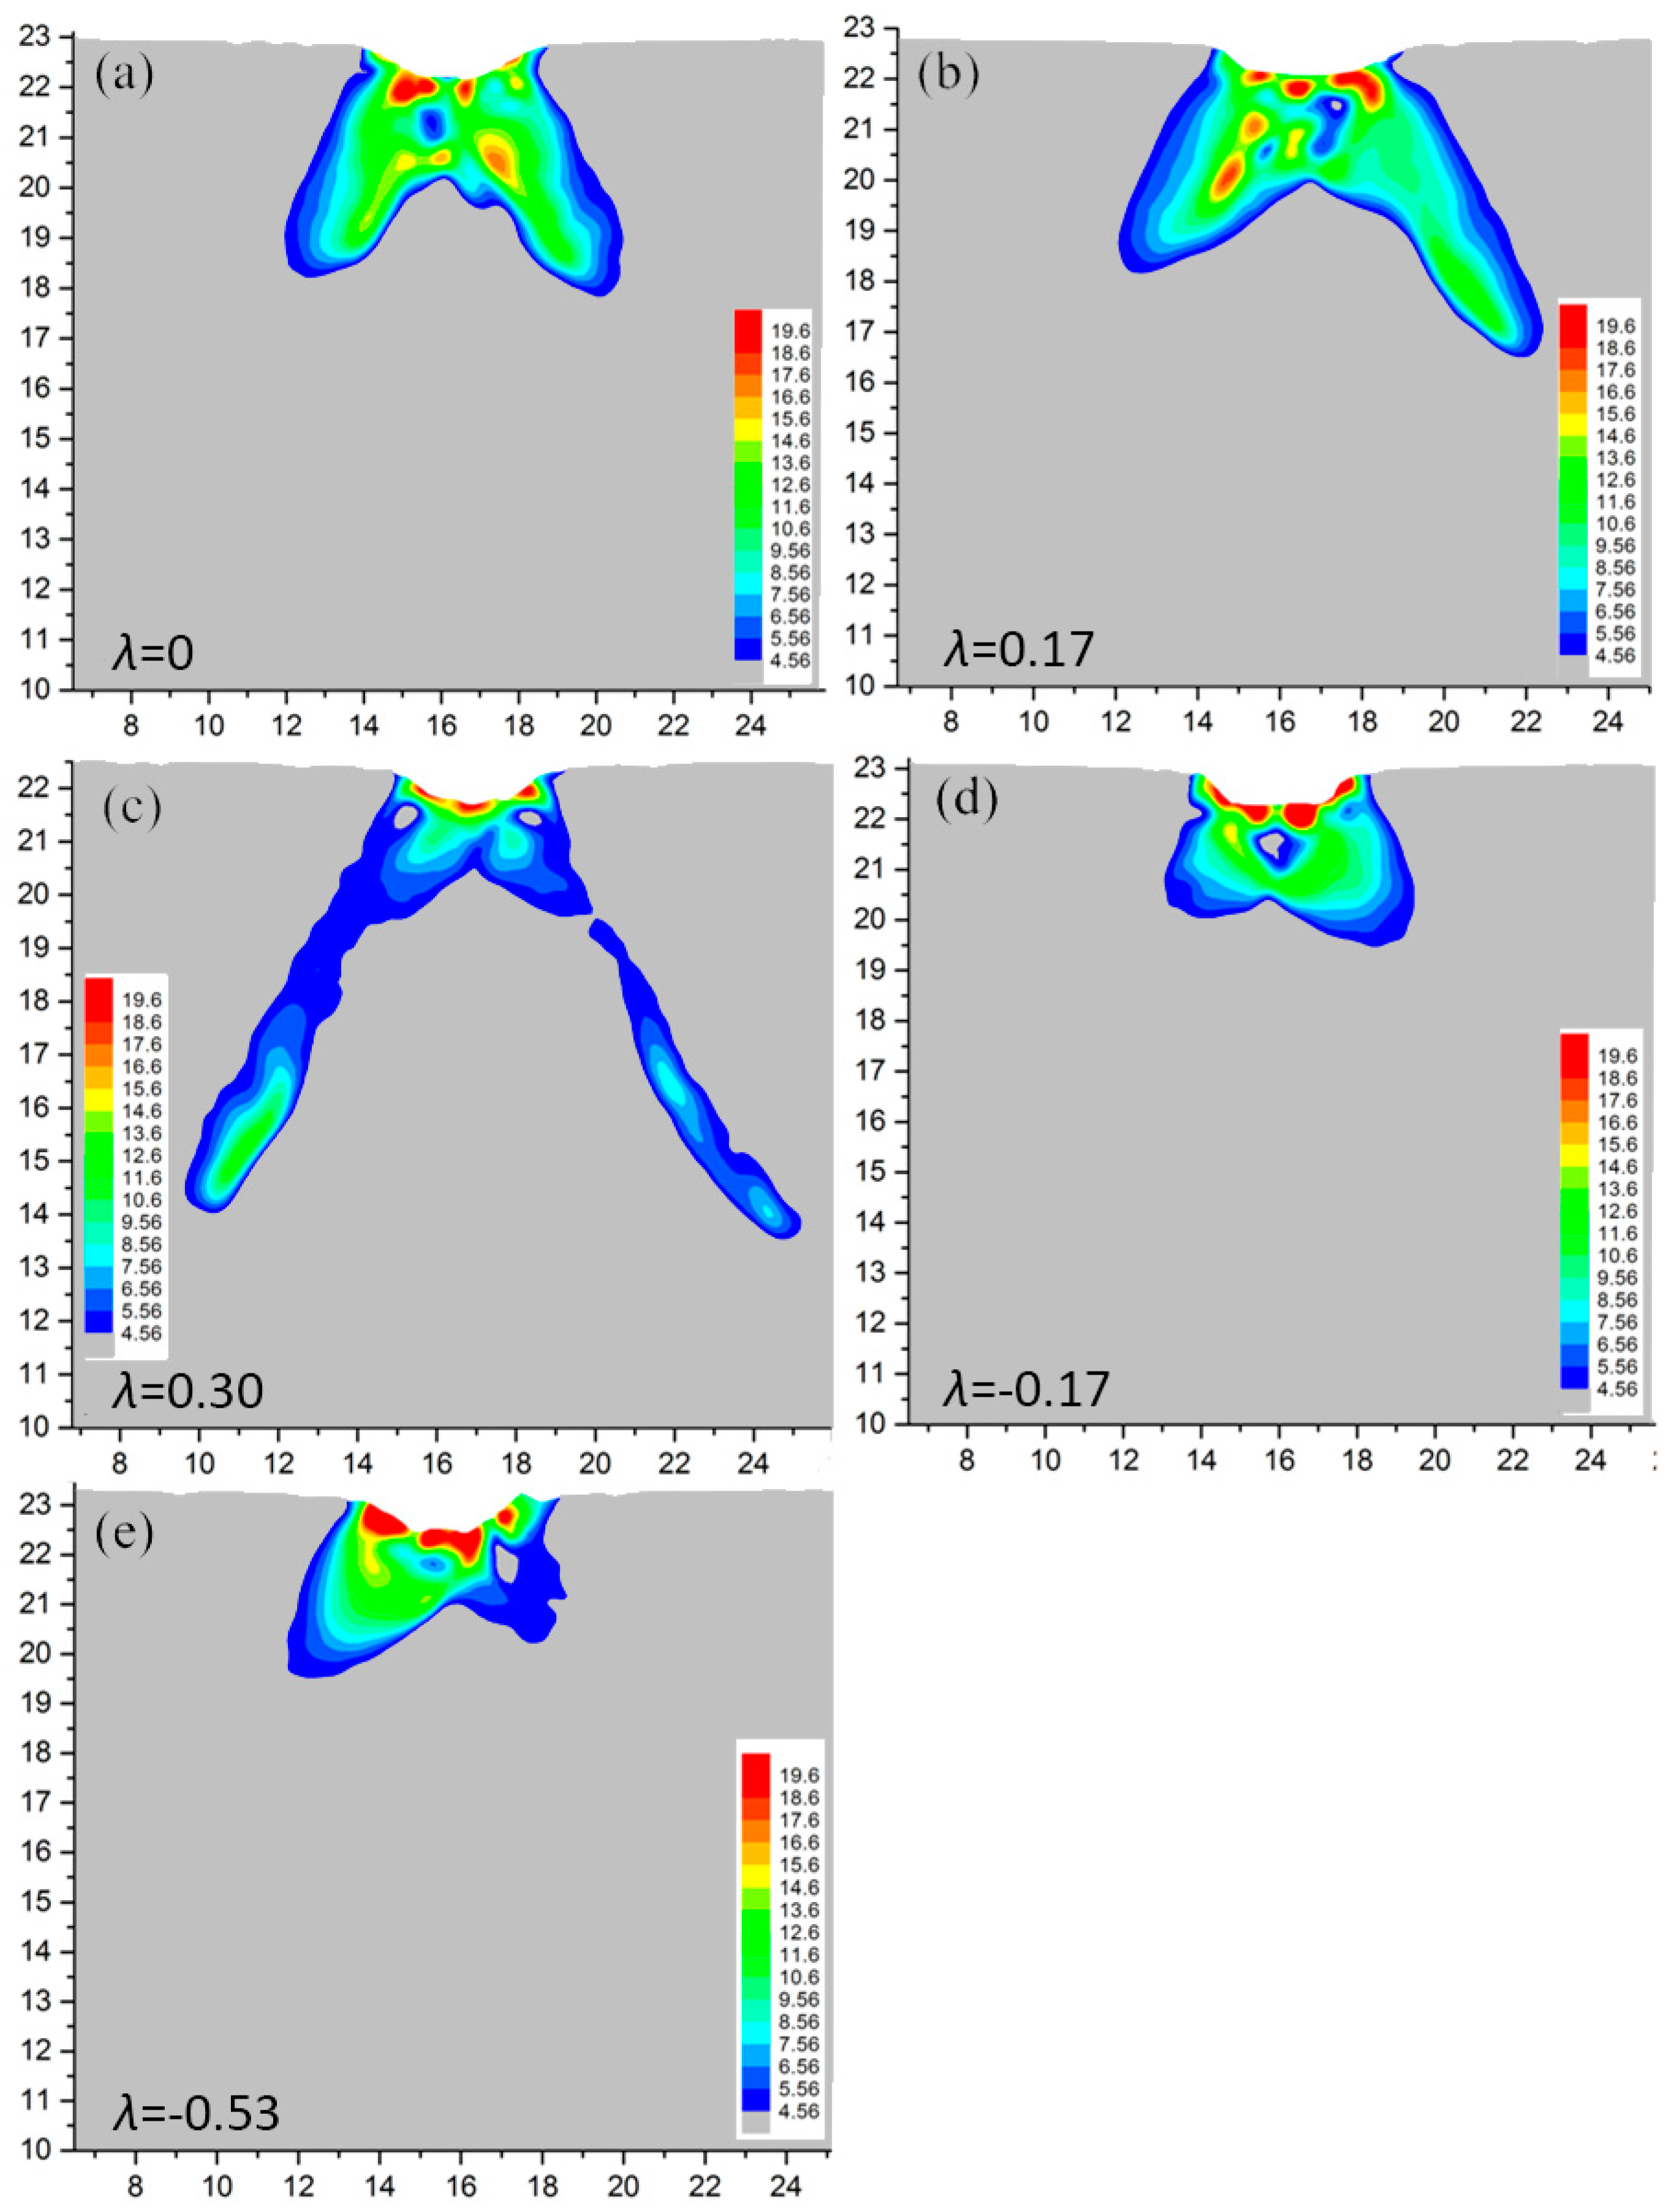
During indenting, dislocations are usually limited to a volume just beneath the indenter, which is here called the plastic zone. When dislocation prismatic loops glide away the indented film surface, they are not considered a part of the plastic zone in this paper. With this convention in place, the plastic zone is, therefore, calculated and plotted in Figure 14. In the literature, Samuels and Mulhearn [38,39] claimed that the plastic zone at macro-scale shows a spherical symmetry (usually hemispherical) shape if a conical indenter is used. Similarly, Chiang et al. [40] and Fischer-Cripps [41] developed a cavity model and demonstrated that the contacting surface of the indenter is encased by a hydrostatic “core”, which is in turn surrounded by a hemispherical plastic zone. In contrast, the plastic zone at micro-scale in our simulations (Figure 14) exhibits apparent material anisotropy and a far different deformation shape from spherical symmetry beneath the indented surface. In addition, the plastic zone is obviously in a different shape with different residual stress levels. With the increase of tensile stress, the plastic zone is dispersed and extended from the subsurface to a deeper position in the film (Figure 14c), which is in good agreement with the dislocation distribution as shown in Figure 11. However, it can be found in Figure 14d,e that the indentation plastic zone shrinks under compressive stress.
3.4. Comparison of Simulation Results of Realistic and Virtual Indenters
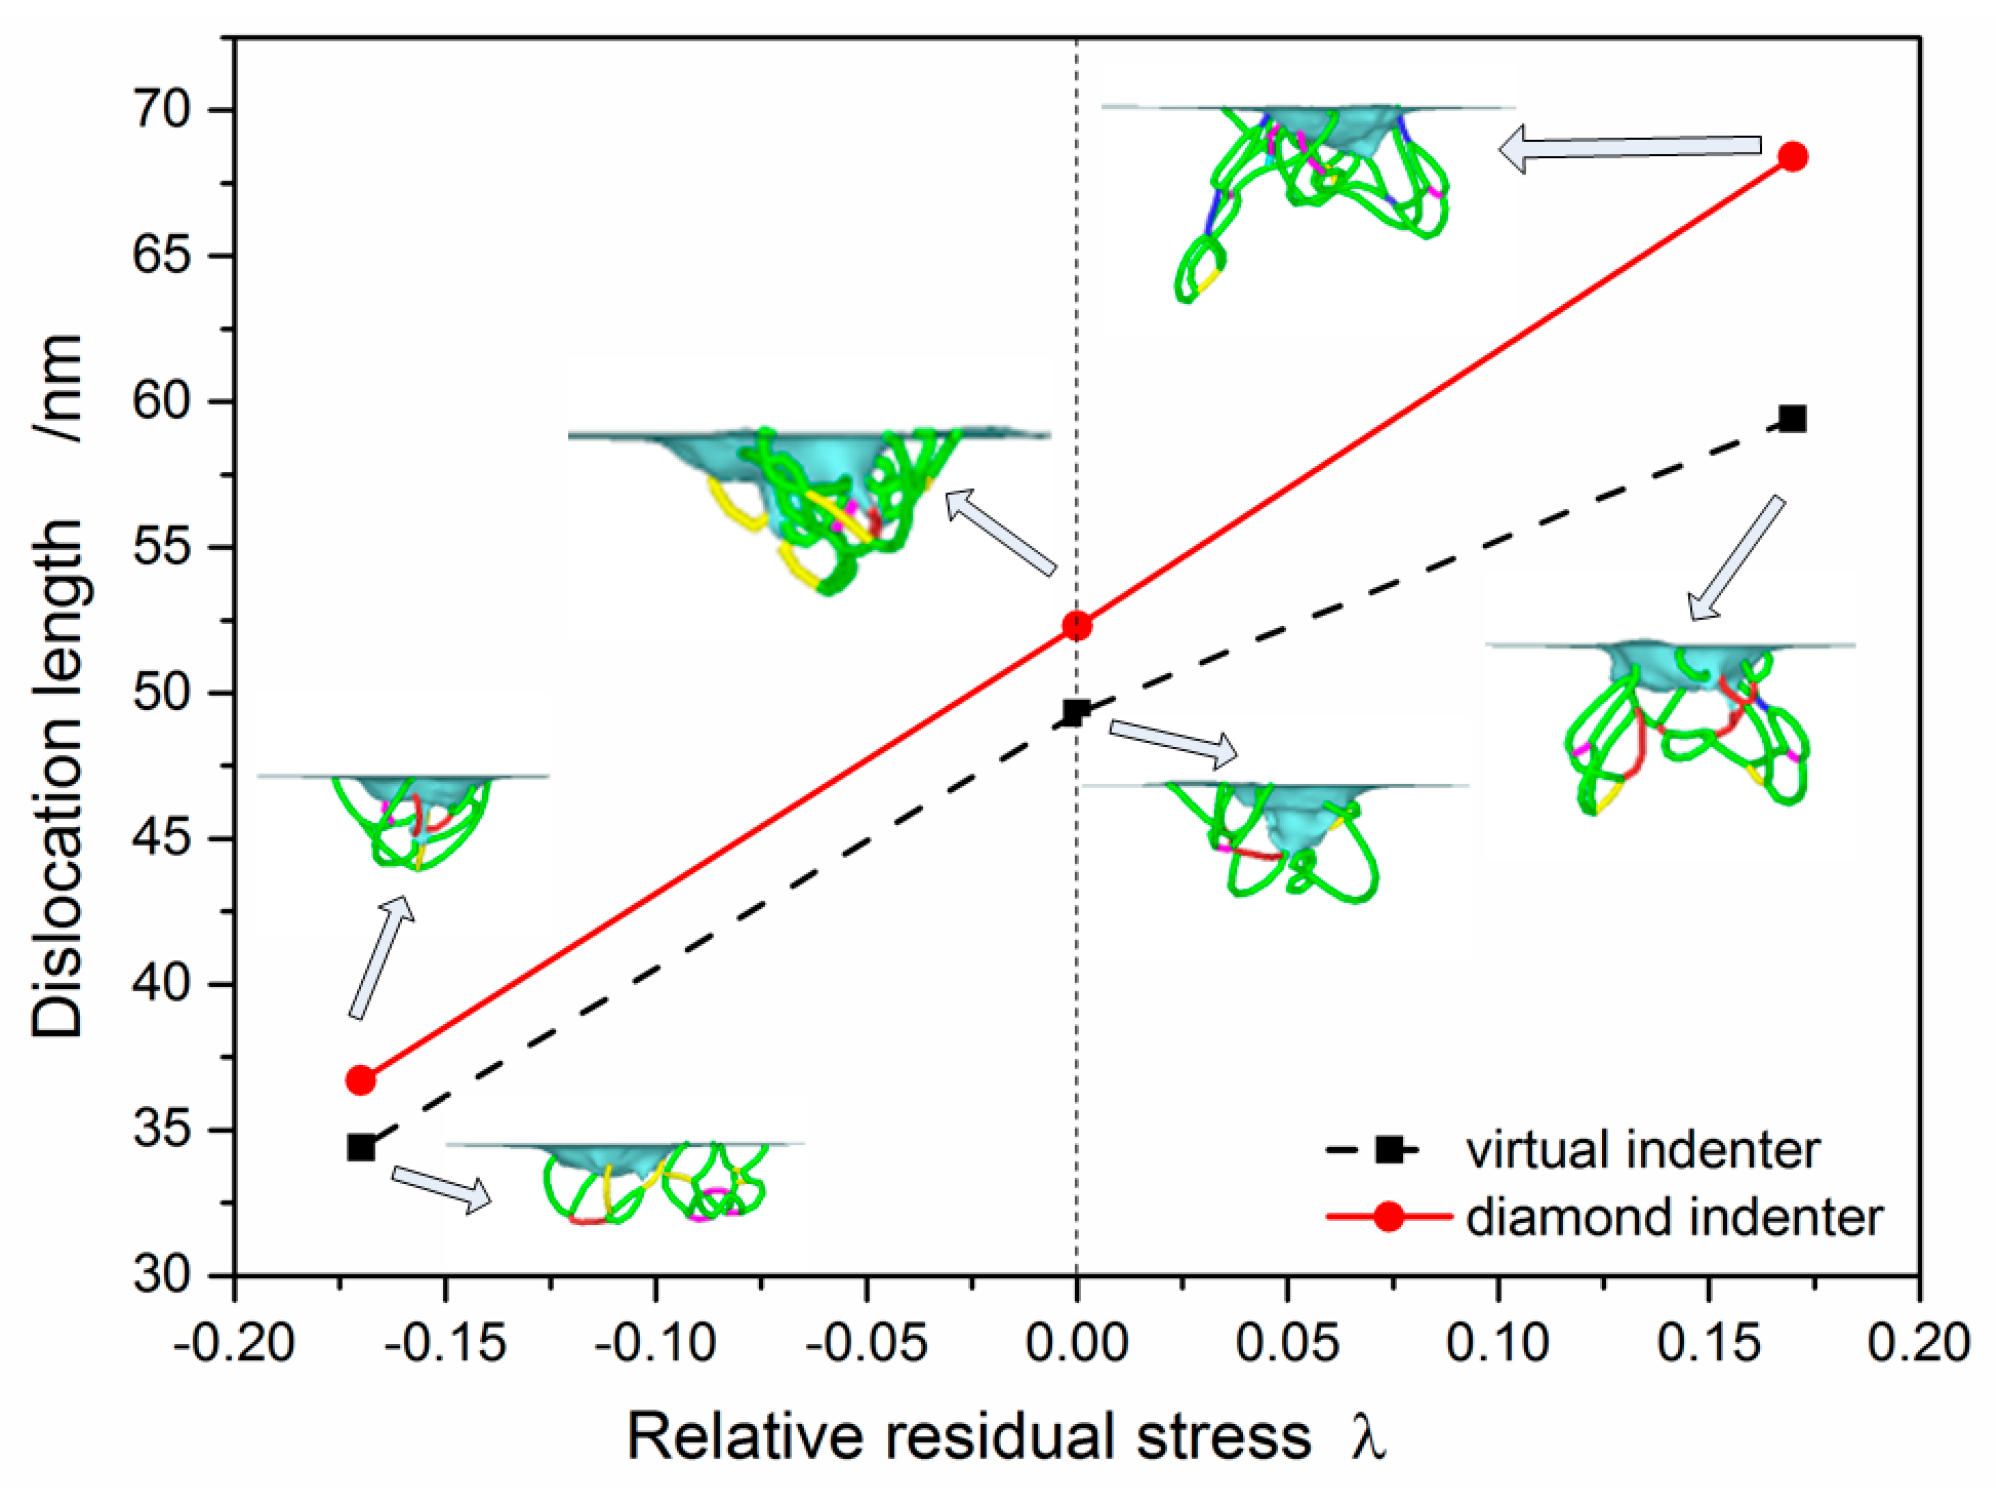
In theory, it is believed that the simulation results obtained by a realistic indenter should be more practical than the ones by a virtual indenter. Here, it is helpful to conduct a comparison of the simulation results obtained by a realistic indenter and a virtual indenter, under the same indentation condition. The load versus indentation depth curves are presented in Figure 15. It can be seen from Figure 15a–c that the two load-depth curves are quite similar in general, but for the realistic indenter the incipient plasticity loads are higher than the ones for the virtual indenter, and a similar result can be found in the regime after plastic yielding. Similarly, it can be observed in Figure 15d that the hardness by the realistic indenter is higher than the one by the virtual indenter. These results are ascribed to the smoothness degree of the indenters. At the same time, the dislocation length vs. the relative residual stress under the same indentation depth (0.9 nm) is plotted in Figure 16. It can be found that the dislocation length by the realistic indenter is longer than the one by the virtual indenter for any residual stress level. Both Figure 15 and Figure 16 provide a detailed description of the difference between the two indenter models.
4. Conclusions
The effects of in-plane residual stress on Hertzian nanoindentation behaviors for single-crystal copper thin film have been investigated through MD simulations. It has been found that the residual stresses give a significant influence on the plastic deformation, nominal indentation hardness, and indentation modulus of copper specimens:
- (1)
- The threshold of incipient plasticity increases with compressive stress but decreases with tensile stress.
- (2)
- The hardness decreases with tensile residual stress, while it increases with moderate compressive residual stress, but drops down with a higher compressive residual stress.
- (3)
- The indentation modulus reduces linearly with decreasing compressive residual stress (and increasing tensile residual stress).
- (4)
- The indentation plastic zone is extended from a concentrated shape into a deeper position beneath the indentation surface with increasing tensile stress, while the compressive residual stress is able to shrink the plastic zone.
Acknowledgments
The present authors appreciate the financial support from the National Natural Science Foundations of China (Grant No. 51475359 and 51375364) and the Natural Science Foundation of Shannxi Province of China (Grant No. 2014JM6219).
Author Contributions
Sun Kun conducted the MD simulation and wrote the paper. Junqin Shi calculated the data. Lifeng Ma conceived and supervised the whole work, and also revised the paper.
Conflicts of Interest
The authors declare no conflict of interest.
References
- Zhang, L.; Zhao, H.; Dai, L.; Yang, Y.; Du, X.; Tang, P.; Zhang, L. Molecular dynamics simulation of deformation accumulation in repeated nanometric cutting on single-crystal copper. RSC Adv. 2015, 17, 12678–12685. [Google Scholar] [CrossRef]
- Hansson, P. Influence of the crystallographic orientation of thin copper coatings during nano indentation. Procedia Mater. Sci. 2014, 3, 1093–1098. [Google Scholar] [CrossRef]
- Voyiadjis, G.Z.; Yaghoobi, M. Large scale atomistic simulation of size effects during nanoindentation: Dislocation length and hardness. Mater. Sci. Eng. A 2015, 634, 20–31. [Google Scholar] [CrossRef]
- Li, L.; Song, W.; Xu, M.; Ovcharenko, A.; Zhang, G. Atomistic insights into the loading—Unloading of an adhesive contact: A rigid sphere indenting a copper substrate. Comp. Mater. Sci. 2015, 98, 105–111. [Google Scholar] [CrossRef]
- Lahr, G.; Shao, S.; Medyanik, S.N. Dynamic Effects on Nanoscale Indentation and Dislocation Ropagation. Available online: http://lfp.mme.wsu.edu/REU2009/files/07.pdf (accessed on 25 July 2009).
- Kokubo, S. On the Change in Hardness of a Plate Caused by Bending; Science Report of Tohoku Imperial University; Tohoku Imperial University: Sendai, Japan, 1932. [Google Scholar]
- Tsui, T.Y.; Oliver, W.C.; Pharr, G.M. Influences of stress on the measurement of mechanical properties using nanoindentation: Part I. Experimental studies in an aluminum alloy. J. Mater. Res. 1996, 11, 752–759. [Google Scholar] [CrossRef]
- Yang, F.; Peng, L.; Okazaki, K. Microindentation of aluminum. Metall. Mater Trans. A 2004, 35, 3323–3328. [Google Scholar] [CrossRef]
- Bolshakov, A.; Oliver, W.C.; Pharr, G.M. Influences of stress on the measurement of mechanical properties using nanoindentation: Part II. Finite element simulation. J. Mater. Res. 1996, 11, 760–768. [Google Scholar] [CrossRef]
- Xu, Z.H.; Li, X. Influence of equi-biaxial residual stress on unloading behaviour of nanoindentation. Acta Mater. 2005, 53, 1913–1919. [Google Scholar] [CrossRef]
- Taljat, B.; Pharr, G.M. Measurement of Residual Stresses by Load and Depth Sensing Spherical Indentation. Mater. Res. Soc. Symp. Proc. 2000, 594, 519–524. [Google Scholar] [CrossRef]
- Peng, P.; Liao, G.L.; Shi, T.L.; Tang, Z.R.; Gao, Y. Molecular dynamic simulations of nanoindentation in aluminum thin film on silicon substrate. Appl. Surf. Sci. 2010, 21, 6284–6290. [Google Scholar] [CrossRef]
- Weinberger, C.R.; Tucker, G.J. Atomistic simulations of dislocation pinning points in pure face- centered-cubic nanopillars. Model. Simul. Mater. Sci. Eng. 2012, 20, 075001. [Google Scholar] [CrossRef]
- Tucker, G.J.; Aitken, Z.H.; Greer, J.R.; Weinberger, C.R. The mechanical behavior and deformation of bicrystalline nanowires. Model. Simul. Mater. Sci. Eng. 2013, 53, 015004. [Google Scholar] [CrossRef]
- Gao, Y.; Ruestes, C.J.; Tramontina, D.R.; Urbassek, H.M. Comparative simulation study of the structure of the plastic zone produced by nanoindentation. J. Mech. Phys. Solids 2015, 75, 58–75. [Google Scholar] [CrossRef]
- Voyiadjis, G.Z.; Yaghoobi, M. Role of grain boundary on the sources of size effects. Comput. Mater. Sci. 2016, 117, 315–329. [Google Scholar] [CrossRef]
- Voyiadjis, G.Z.; Yaghoobi, M. Size and strain rate effects in metallic samples of confined volumes: Dislocation length distribution. SCR Mater. 2017, 130, 182–186. [Google Scholar] [CrossRef]
- Yaghoobi, M.; Voyiadjis, G.Z. Size effects in FCC crystals during the high rate compression test. Acta Mater. 2016, 121, 190–201. [Google Scholar] [CrossRef]
- Yaghoobi, M.; Voyiadjis, G.Z. Atomistic simulation of size effects in single-crystalline metals of confined volumes during nanoindentation. Comput. Mater. Sci. 2016, 111, 64–73. [Google Scholar] [CrossRef]
- Kelchner, C.L.; Plimpton, S.J.; Hamilton, J.C. Dislocation nucleation and defect structure during surface indentation. Phys. Rev. B 1998, 58, 11085–11088. [Google Scholar] [CrossRef]
- Liang, H.Y.; Woo, C.H.; Huang, H.C.; Ngan, A.H.W.; Yu, T.X. Crystalline plasticity on copper (001), (110), and (111) surfaces during nanoindentation. CMES Comp. Model. Eng. 2004, 6, 105–114. [Google Scholar]
- Yaghoobi, M.; Voyiadjis, G.Z. Effect of boundary conditions on the MD simulation of nanoindentation. Comp. Mater. Sci. 2014, 95, 626–636. [Google Scholar] [CrossRef]
- Feng, C.; Peng, X.; Fu, T.; Zhao, Y.; Huang, C.; Wang, Z. Molecular dynamics simulation of nano-indentation on Ti-V multilayered thin films. Physica E 2017, 87, 213–219. [Google Scholar] [CrossRef]
- Sun, K.; Shen, W.; Ma, L. The influence of residual stress on incipient plasticity in single-crystal copper thin film under nanoindentation. Comput. Mater. Sci. 2014, 81, 226–232. [Google Scholar] [CrossRef]
- Plimpton, S. Fast Parallel Algorithms for Short-Range Molecular Dynamics. J. Comput. Phys. 1995, 117, 1–9. [Google Scholar] [CrossRef]
- Mishin, Y.; Mehl, M.J.; Papaconstantopoulos, D.A.; Voter, A.F.; Kress, J.D. Structural stability and lattice defects in copper: Ab initio, tight-binding, and embedded-atom calculations. Phys. Rev. B 2001, 22, 4106. [Google Scholar]
- Morse, P. Diatomic molecules according to the wave mechanics. II. Vibrational levels. Phys. Rev. 1929, 34, 57–64. [Google Scholar] [CrossRef]
- Dub, S.N.; Lim, Y.Y.; Chaudhri, M.M. Nanohardness of high purity Cu (111) single crystals: The effect of indenter load and prior plastic sample strain. J. Appl. Phys. 2010, 107, 043510. [Google Scholar] [CrossRef]
- Simons, G.; Wang, H. Single Crystal Elastic Constants and Calculated Aggregate Properties; MIT Press: Cambridge, MA, USA, 1977. [Google Scholar]
- Liang, H.Y.; Woo, C.H.; Huang, H.; Ngan, A.H.W.; Yu, T.X. Dislocation nucleation in the initial stage during nanoindentation. Philos. Mag. 2003, 83, 3609–3622. [Google Scholar] [CrossRef]
- Zhang, L.; Huang, H.; Zhao, H.; Ma, Z.; Yang, Y.; Hu, X. The evolution of machining-induced surface of single-crystal FCC copper via nanoindentation. Nanoscale Res. Lett. 2013, 8, 21. [Google Scholar] [CrossRef] [PubMed]
- Schall, J.D.; Brenner, D.W. Atomistic simulation of the influence of pre-existing stress on the interpretation of nanoindentation data. J. Mater. Res. 2004, 19, 3172–3180. [Google Scholar] [CrossRef]
- Krenn, C.R.; Roundy, D.; Cohen, M.L.; Chrzan, D.C.; Morris, J.W. Connecting atomistic and experimental estimates of ideal strength. Phys. Rev. B 2002, 65, 134111. [Google Scholar] [CrossRef]
- Huber, N.; Heerens, J. On the effect of a general residual stress state on indentation and hardness testing. Acta Mater. 2008, 56, 6205–6213. [Google Scholar] [CrossRef]
- Suresh, S.; Giannakopoulos, A.E. A new method for estimating residual stresses by instrumented sharp indentation. Acta Mater. 1998, 46, 5755–5767. [Google Scholar] [CrossRef]
- Timoshenko, S.P.; Goodier, J.N. Theory of Elasticity, 3rd ed.; McGraw-Hill: London, UK, 1970. [Google Scholar]
- Stukowski, A.; Albe, K. Extracting dislocation and non-dislocation crystal defects from atomic simulation data. Model. Simul. Mater. Sci. Eng. 2010, 18, 085001. [Google Scholar] [CrossRef]
- Samuels, L.E.; Mulhearn, T.O. An experimental investigation of the deformed zone associated with indentation hardness impressions. J. Mech. Phys. Solids 1957, 5, 125–134. [Google Scholar] [CrossRef]
- Mulhearn, T.O. The deformation of metals by vickers-type pyramidal indenters. J. Mech. Phys. Solids 1959, 7, 85–88. [Google Scholar] [CrossRef]
- Chiang, S.S.; Marshall, D.B.; Evans, A.G. The response of solids to elastic/plastic indentation. I. Stresses and residual stresses. J. Appl. Phys. 1982, 53, 298. [Google Scholar] [CrossRef]
- Fischer-Cripp, A.C. Introduction to Contact Mechanics, 2nd ed.; Springer: New York, NY, USA, 2007. [Google Scholar]
Figure 1.
Schematic of nanoindentation atomic configuration with a spherical diamond indenter.

Figure 2.
Load vs. indentation depth curves with different compressive residual stress.
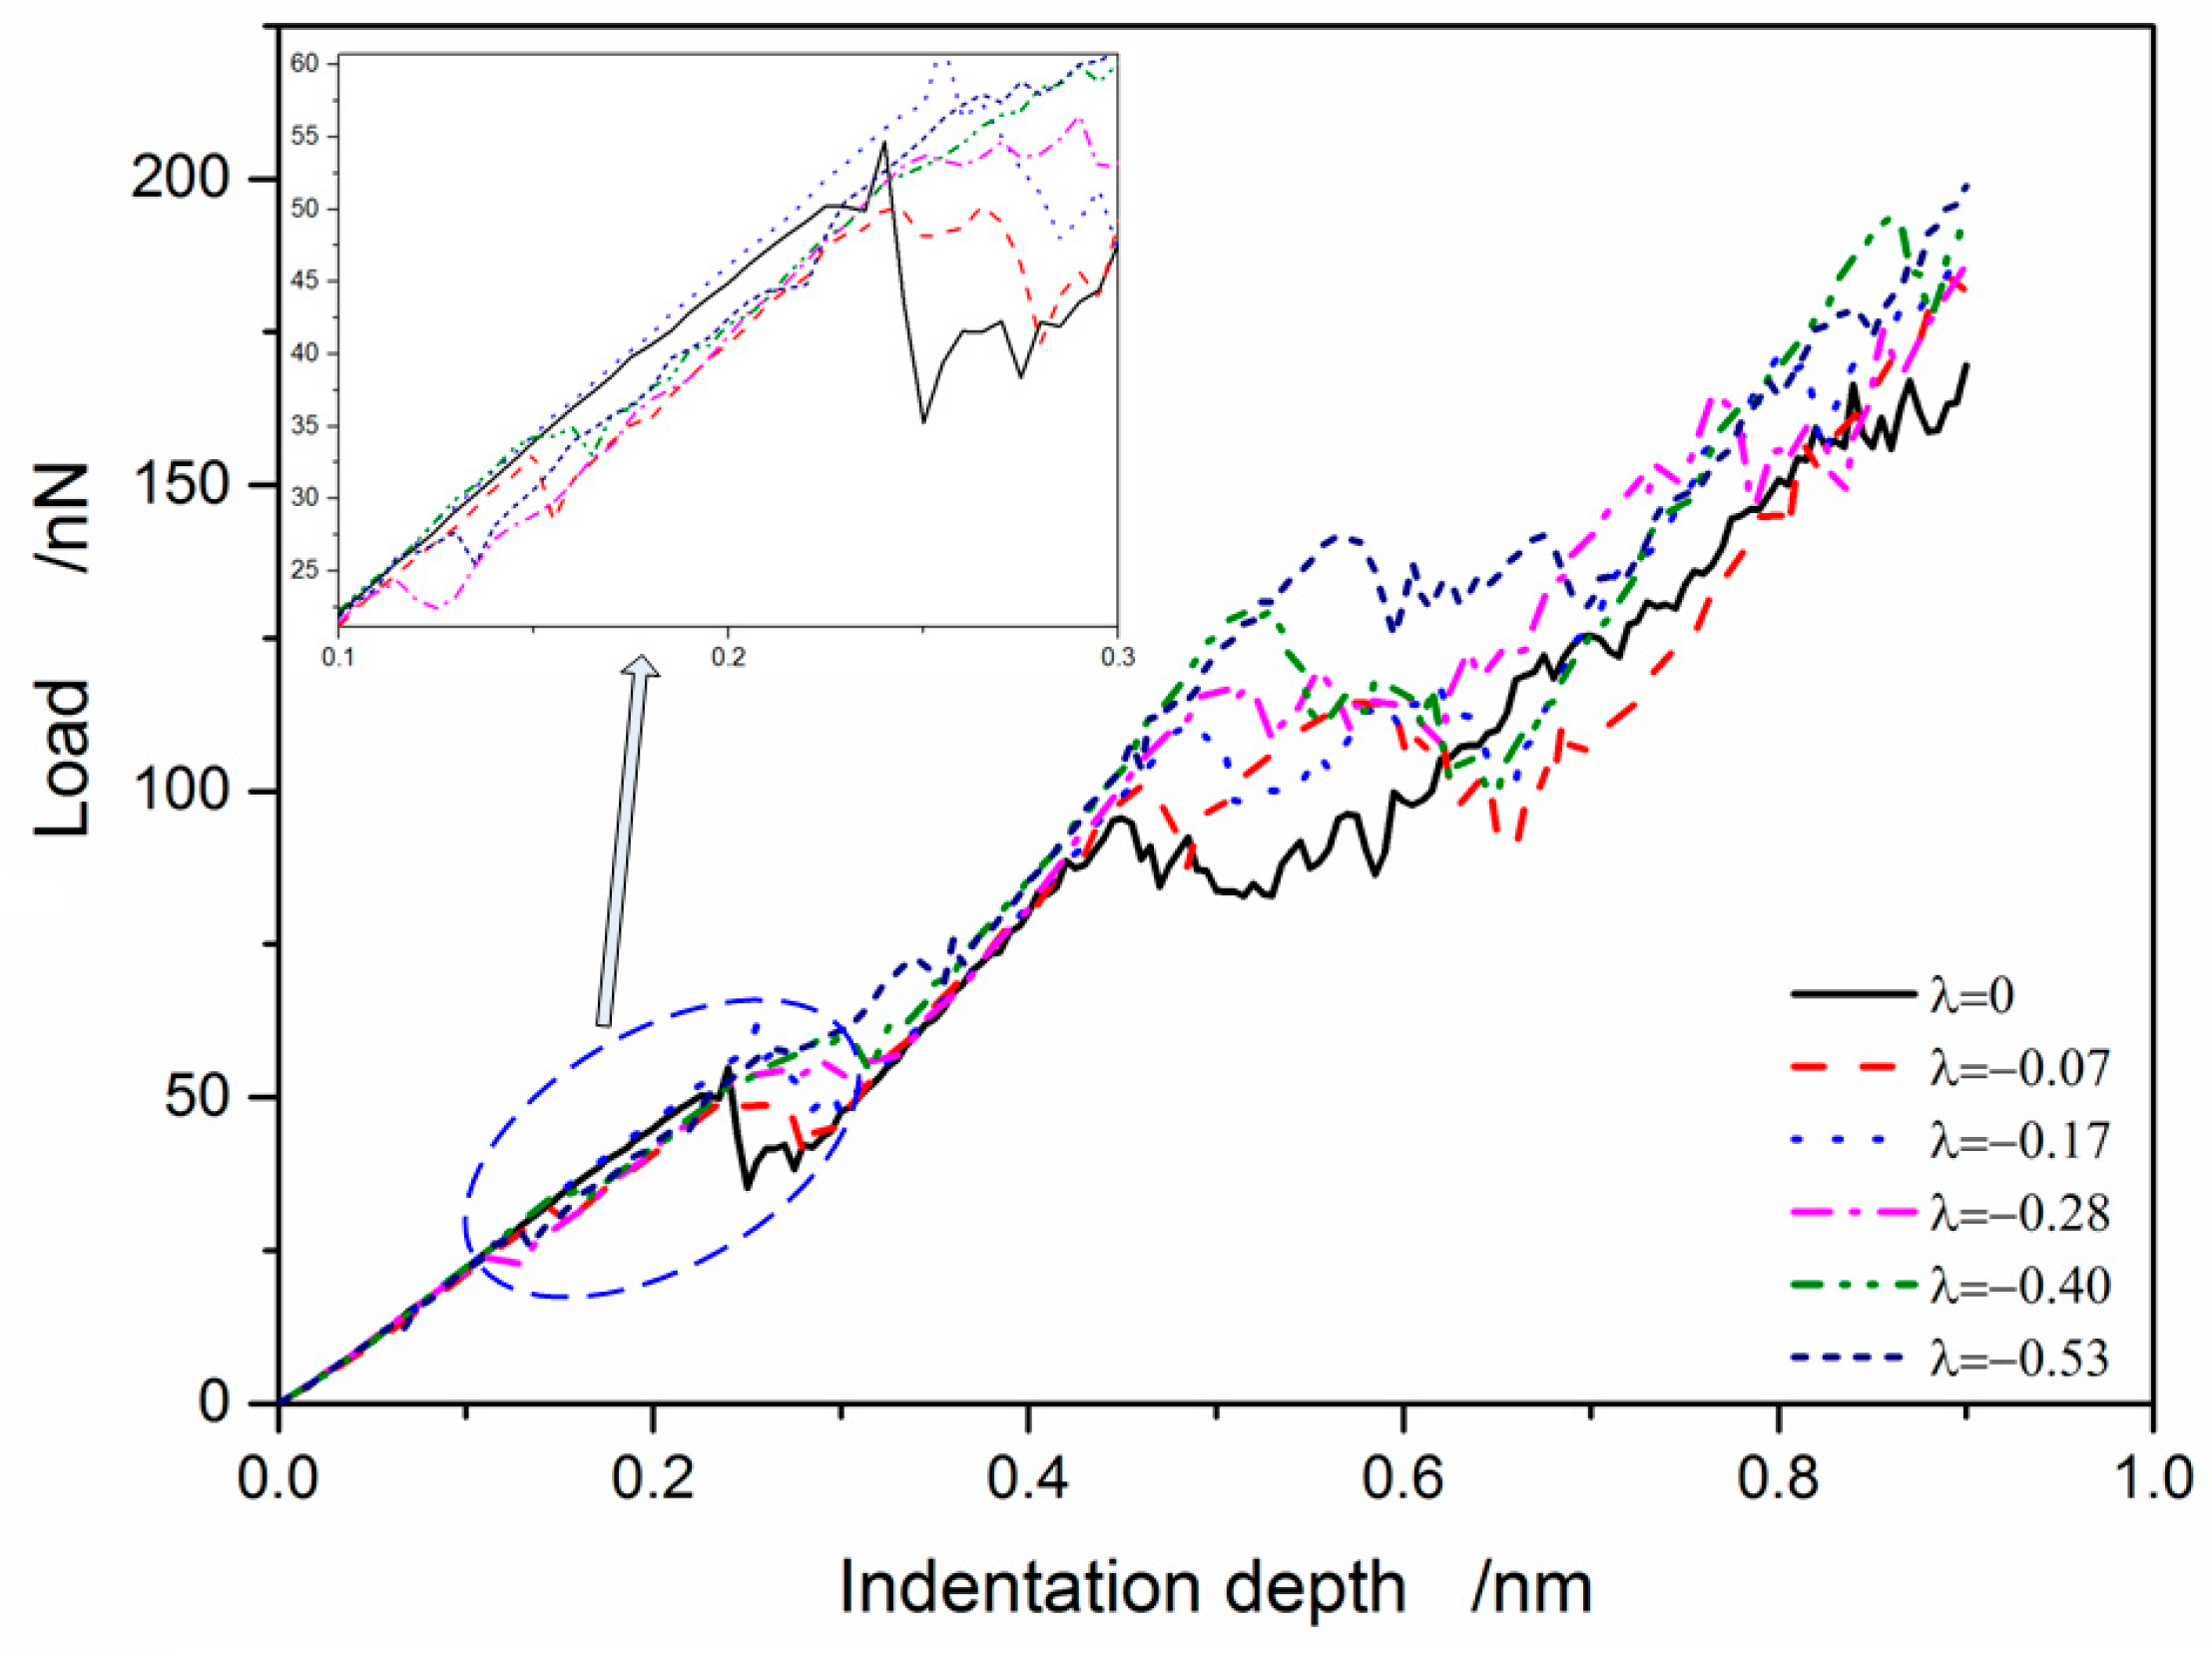
Figure 3.
Load vs. indentation depth curves with different tensile residual stress.

Figure 4.
Indentation modulus E*fit as a function of relative residual stress.

Figure 5.
Mean contact pressure vs. indentation depth with different relative residual stress; (a) compressive residual stress λ ≤ 0; (b) tensile residual stress λ ≥ 0.
Figure 5.
Mean contact pressure vs. indentation depth with different relative residual stress; (a) compressive residual stress λ ≤ 0; (b) tensile residual stress λ ≥ 0.

Figure 6.
Hardness as a function of relative residual stress. (The curve is fitted by B-spline with the MD numerical result points).
Figure 6.
Hardness as a function of relative residual stress. (The curve is fitted by B-spline with the MD numerical result points).
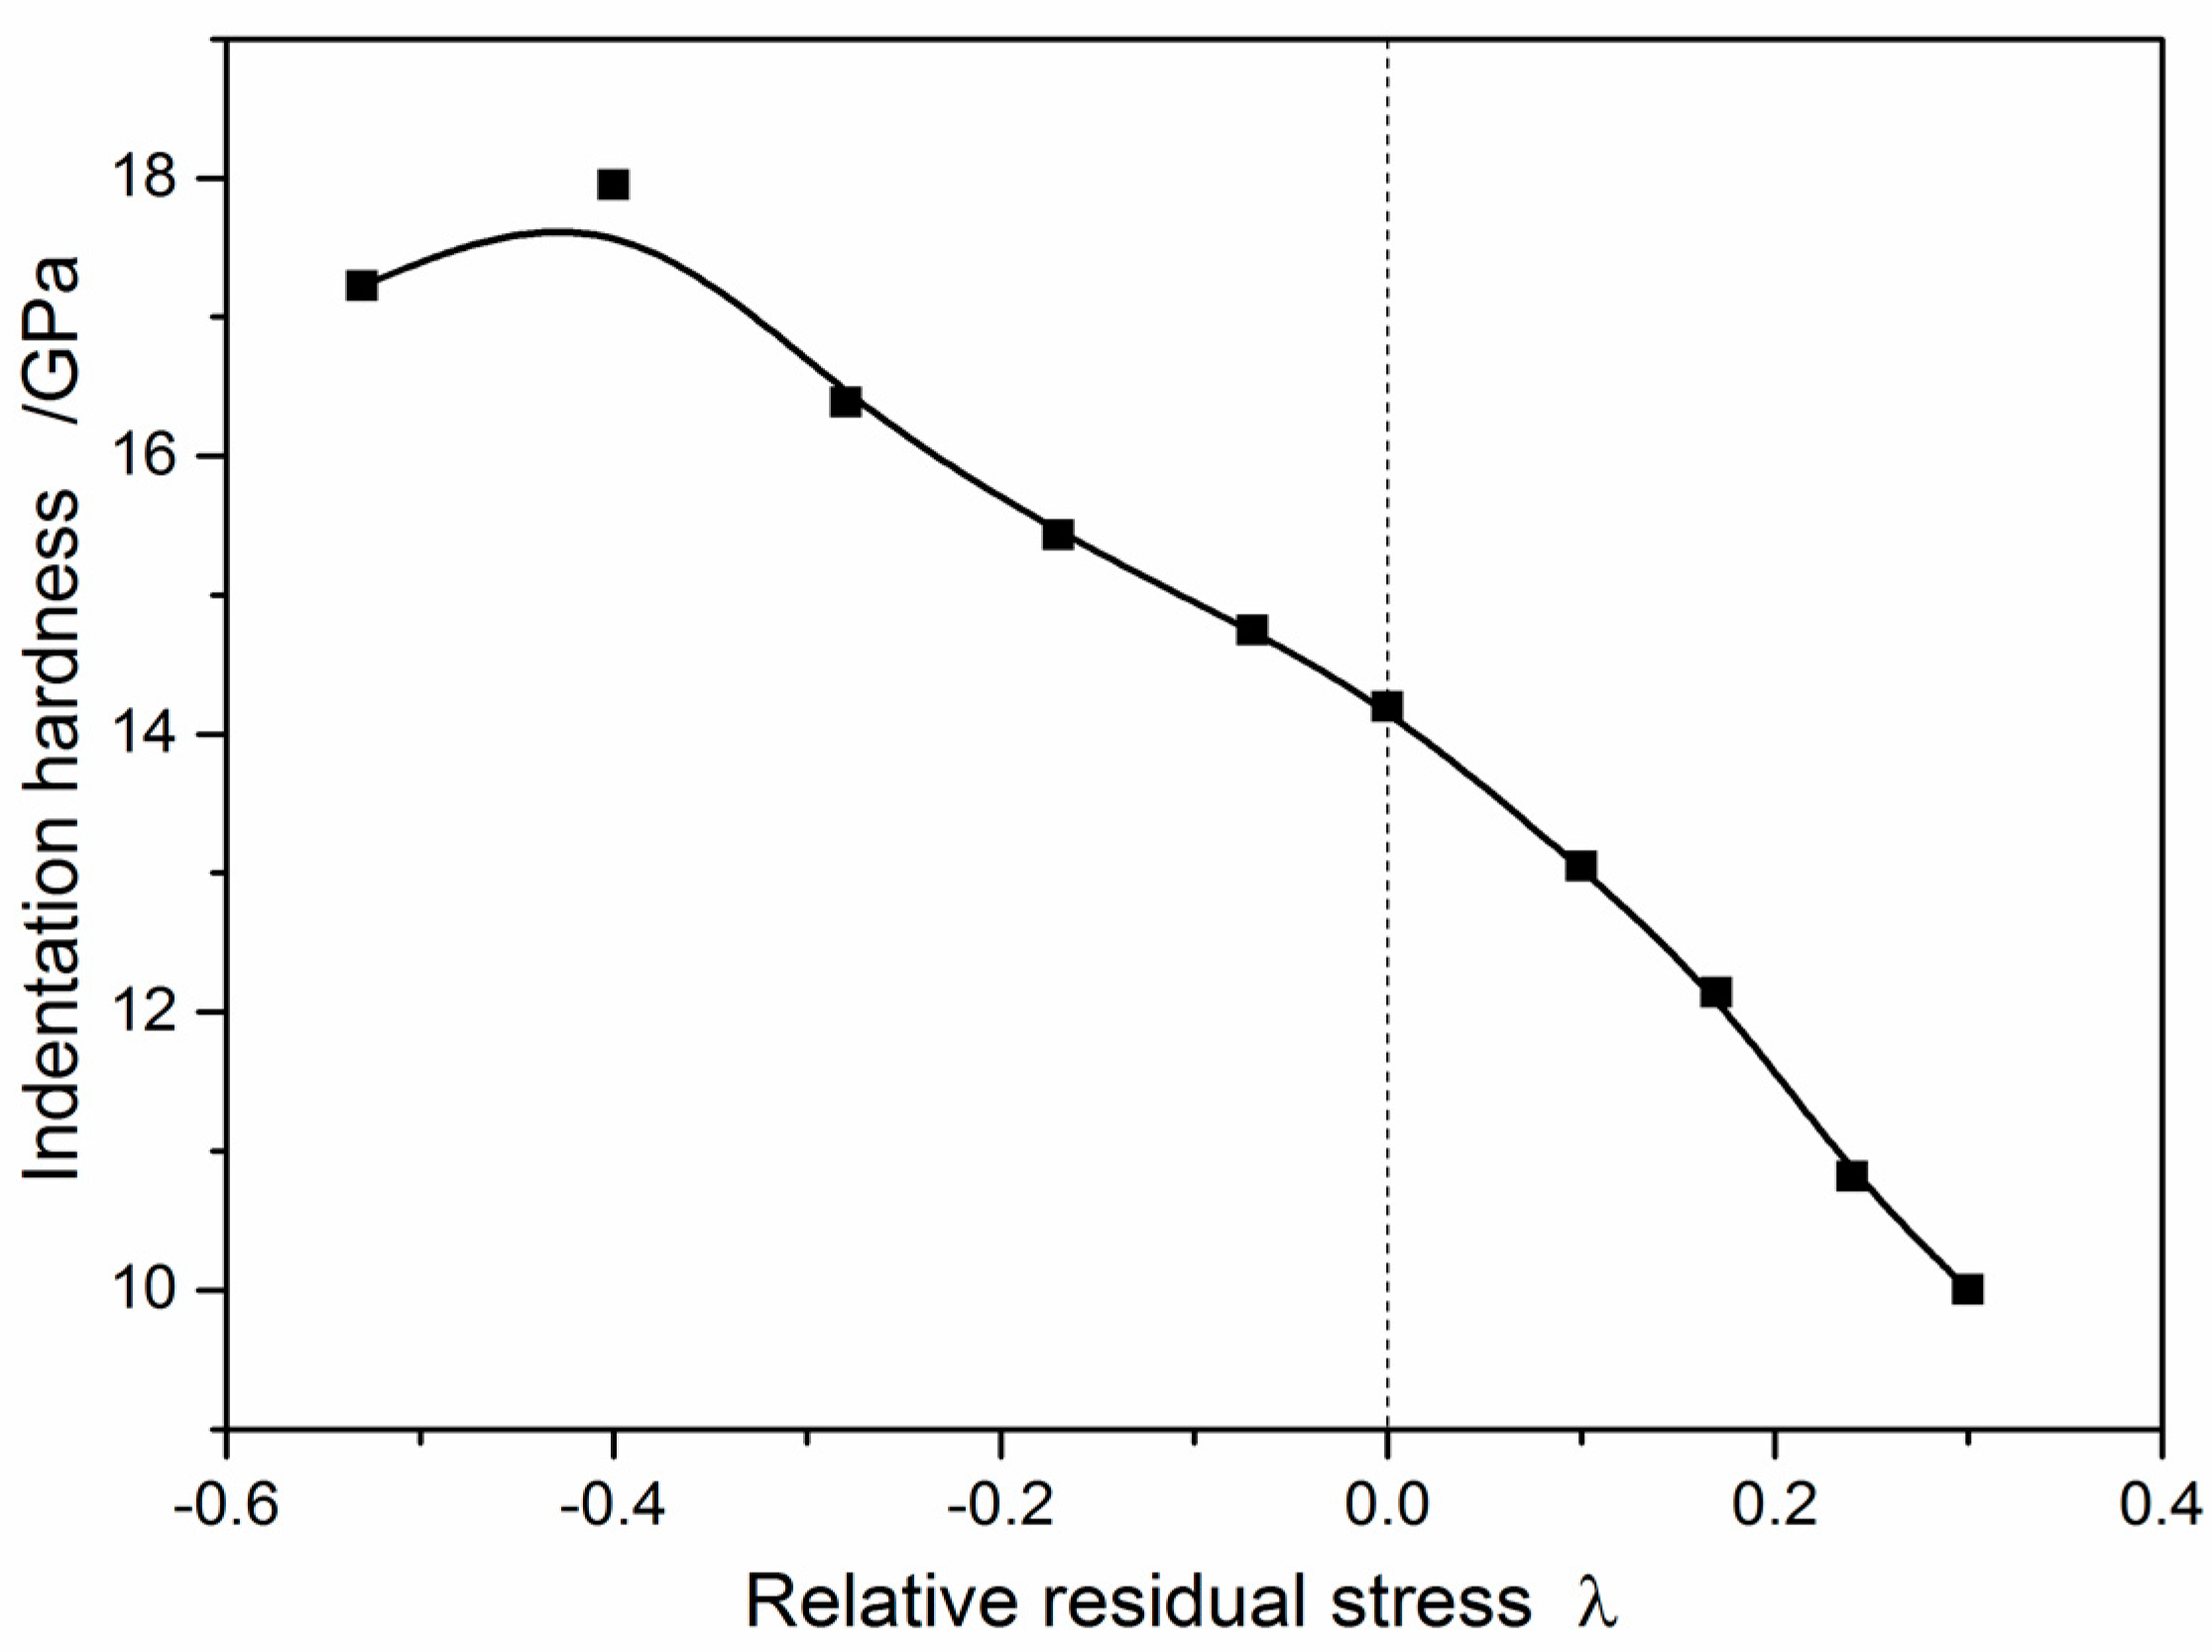
Figure 7.
(a) A spherical indentation geometry, where a is contact radius, hc is contact depth, h is indentation depth, and (b) relative contact area curve versus residual stress.
Figure 7.
(a) A spherical indentation geometry, where a is contact radius, hc is contact depth, h is indentation depth, and (b) relative contact area curve versus residual stress.

Figure 8.
Atom configuration during indentation process without residual stress: (a–d) schematic of four inclined {111}-type slip planes for (100) indentation. The green color shows stacking faults.
Figure 8.
Atom configuration during indentation process without residual stress: (a–d) schematic of four inclined {111}-type slip planes for (100) indentation. The green color shows stacking faults.

Figure 9.
Atom configuration during indentation process with residual tensile stress λ = 0.17 at various indentation depths: (a) 0.24 nm; (b) 0.28 nm; (c) 0.9 nm. The green color shows stacking faults.
Figure 9.
Atom configuration during indentation process with residual tensile stress λ = 0.17 at various indentation depths: (a) 0.24 nm; (b) 0.28 nm; (c) 0.9 nm. The green color shows stacking faults.

Figure 10.
Atom configuration during indentation process with residual compress stress λ = −0.17 at various indentation depths: (a) 0.28 nm; (b) 0.30 nm; (c) 0.56 nm; (d) 0.90 nm.. The green color shows stacking faults.
Figure 10.
Atom configuration during indentation process with residual compress stress λ = −0.17 at various indentation depths: (a) 0.28 nm; (b) 0.30 nm; (c) 0.56 nm; (d) 0.90 nm.. The green color shows stacking faults.

Figure 11.
Atom configuration during indentation process with residual tensile stress λ = 0.30 at various indentation depths: (a) 0.22 nm; (b) 0.30 nm; (c) 0.42 nm; (d) 0.90 nm. The green color shows stacking faults.
Figure 11.
Atom configuration during indentation process with residual tensile stress λ = 0.30 at various indentation depths: (a) 0.22 nm; (b) 0.30 nm; (c) 0.42 nm; (d) 0.90 nm. The green color shows stacking faults.

Figure 12.
Atom configuration during indentation process with residual compress stress λ = −0.53 at various indentation depths: (a) 0.22 nm; (b) 0.48 nm; (c) 0.62 nm; (d) 0.90 nm. The green color shows stacking faults.
Figure 12.
Atom configuration during indentation process with residual compress stress λ = −0.53 at various indentation depths: (a) 0.22 nm; (b) 0.48 nm; (c) 0.62 nm; (d) 0.90 nm. The green color shows stacking faults.

Figure 13.
Dislocation line length in Cu samples with different residual stresses.

Figure 14.
Indentation plastic zone with different residual stresses: (a) λ = 0; (b) λ = 0.17; (c) λ = 0.30; (d) λ = −0.17; (e) λ = −0.53.
Figure 14.
Indentation plastic zone with different residual stresses: (a) λ = 0; (b) λ = 0.17; (c) λ = 0.30; (d) λ = −0.17; (e) λ = −0.53.

Figure 15.
Comparison of indentation results of realistic and virtual sphere indenters. (a) without residual stress, (b) under compressive residual stress, (c) under tensile residual stress, (d) hardness vs. residual stress.
Figure 15.
Comparison of indentation results of realistic and virtual sphere indenters. (a) without residual stress, (b) under compressive residual stress, (c) under tensile residual stress, (d) hardness vs. residual stress.
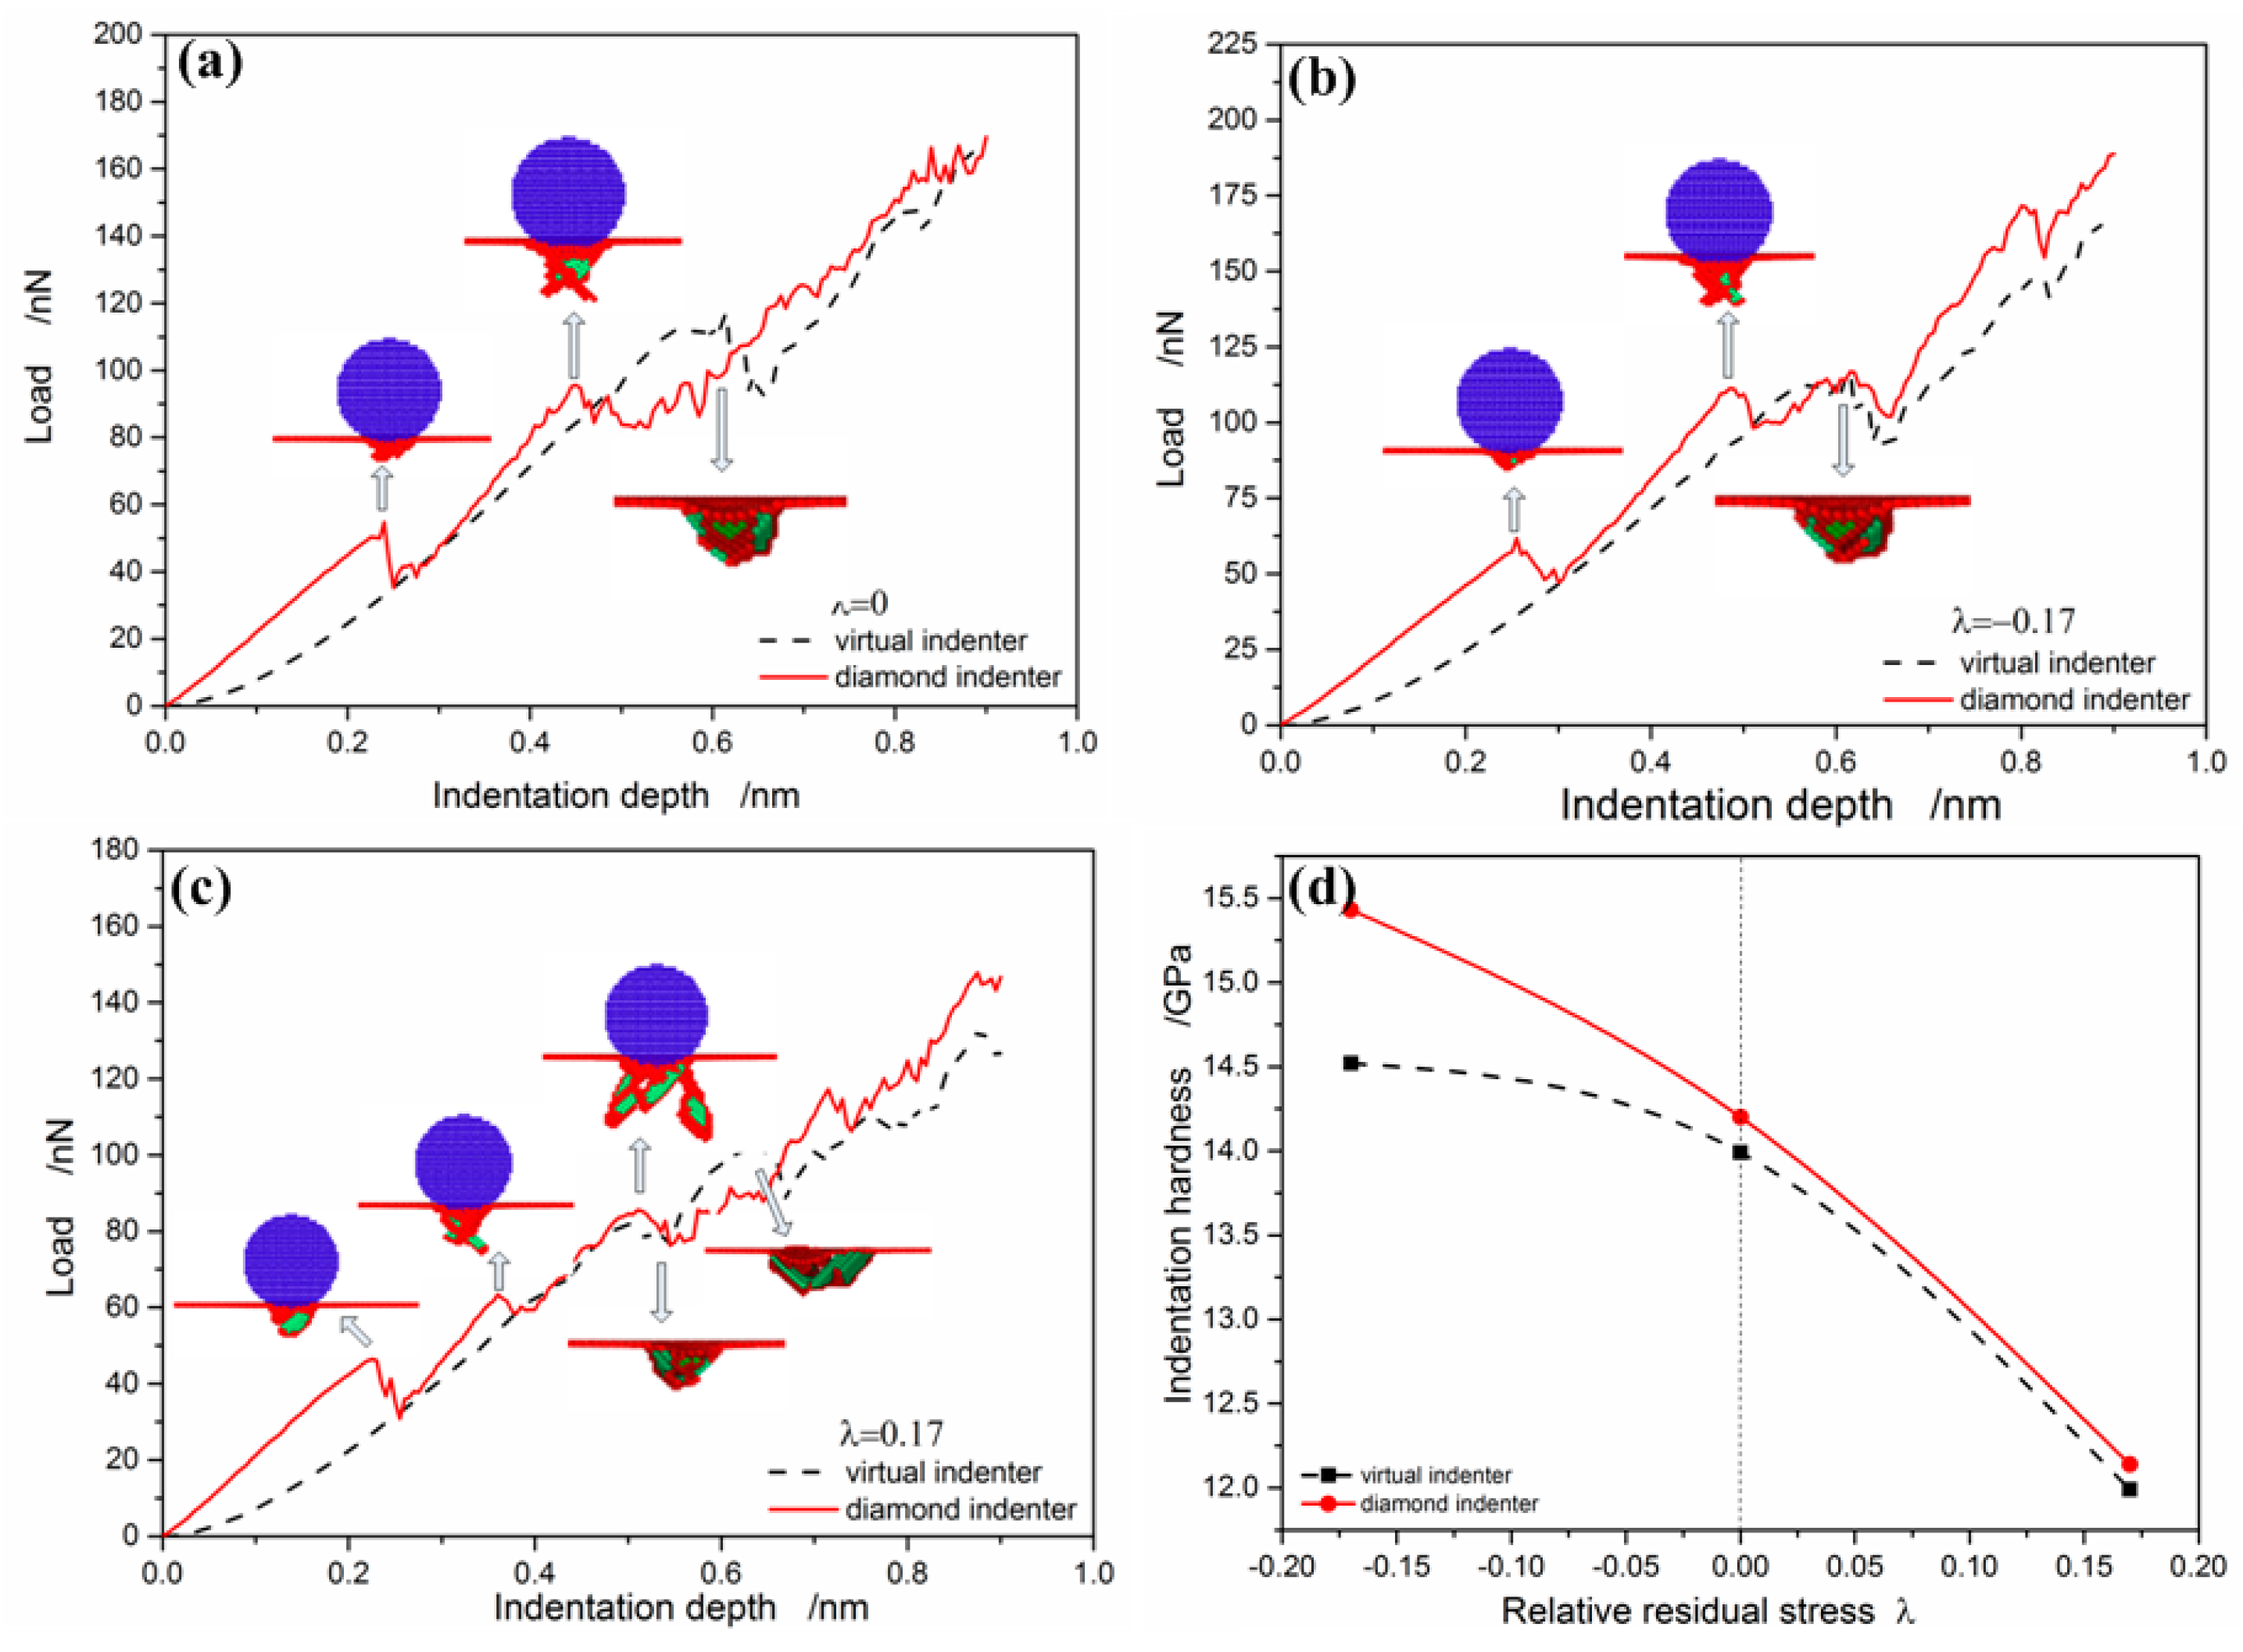
Figure 16.
Dislocation length vs. relative residual stress under the same indentation depth ().


Table 1.
Pre-strain vs. corresponding residual stress and normalized by the ideal shear strength of Cu single crystals.
Table 1.
Pre-strain vs. corresponding residual stress and normalized by the ideal shear strength of Cu single crystals.
| Pre-strain (%) | −2.5 | −2.0 | −1.5 | −1.0 | −0.5 | 0 | 0.5 | 1.0 | 1.5 | 2.0 |
| σres (GPa) | −2.42 | −1.81 | −1.26 | −0.76 | −0.32 | 0 | 0.46 | 0.79 | 1.10 | 1.36 |
| λ | −0.53 | −0.40 | −0.28 | −0.17 | −0.07 | 0 | 0.10 | 0.17 | 0.24 | 0.30 |
σres, residual stress resulting from the molecular dynamics (MD) simulations; λ, relative residual stress, , where Gideal is the ideal shear strength (Gideal = 4.56 GPa) of Cu single crystals [20].
© 2017 by the authors. Licensee MDPI, Basel, Switzerland. This article is an open access article distributed under the terms and conditions of the Creative Commons Attribution (CC BY) license (http://creativecommons.org/licenses/by/4.0/).
Share and Cite
MDPI and ACS Style
Sun, K.; Shi, J.; Ma, L. Atomistic Insights into the Effects of Residual Stress during Nanoindentation. Crystals 2017, 7, 240. https://doi.org/10.3390/cryst7080240
AMA Style
Sun K, Shi J, Ma L. Atomistic Insights into the Effects of Residual Stress during Nanoindentation. Crystals. 2017; 7(8):240. https://doi.org/10.3390/cryst7080240
Chicago/Turabian StyleSun, Kun, Junqin Shi, and Lifeng Ma. 2017. "Atomistic Insights into the Effects of Residual Stress during Nanoindentation" Crystals 7, no. 8: 240. https://doi.org/10.3390/cryst7080240
Note that from the first issue of 2016, this journal uses article numbers instead of page numbers. See further details here.