Article

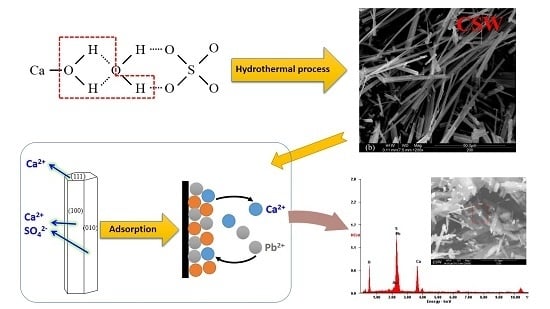
Calcium Sulfate Hemihydrate Whiskers Obtained from Flue Gas Desulfurization Gypsum and Used for the Adsorption Removal of Lead

1
School of Resource and Environmental Sciences, Wuhan University, Wuhan 430074, China
2
Hubei Environmental Remediation Material Engineering Technology Research Center, Wuhan University, Wuhan 430074, China
3
Groundwater and Environmental System Engineering Innovation Base, State Environmental Protection Key Laboratory of Simulation and Control of Groundwater Pollution, Chinese Research Academy of Environmental Sciences, Beijing 100012, China
4
Department of Civil Engineering, Urban Construction College of Anhui Jianzhu University, Hefei 230022, China
*
Authors to whom correspondence should be addressed.
Crystals 2017, 7(9), 270; https://doi.org/10.3390/cryst7090270
Submission received: 11 July 2017 / Revised: 23 August 2017 / Accepted: 1 September 2017 / Published: 4 September 2017

Abstract

:
As a recycled material, flue gas desulfurization gypsum has been used to prepare calcium sulfate hemihydrate whisker (CSHW) through hydrothermal synthesis for several decades. However, the subsequent utilization of this resultant material has not yet received considerable attention. In the present research, CSHW was successfully synthesized at a certain region, and was used for the adsorption of lead ions from aqueous solutions, thereby broadening the research field for the practical application of CSHW. Its adsorption capacity was significantly influenced by various parameters, particularly, the pH level and initial lead concentration. The pH value highly affected the hydrolysis degree of lead ions and dominated the adsorption of lead. The equilibrium isotherms under two different temperatures were simulated using Langmuir, Freundlich, and Temkin models. Both Langmuir and Temkin models showed a good fit to the data. Combined with the well-fitted pseudo-second-order model, the adsorption mechanism was thought to be a chemisorption process that was enforced by the ion exchange reaction. In addition, the specific crystal structure of CSHW revealed that ion exchange reaction occurred on the (010) and (100) facets due to their preferential growth and negatively charged property. The residual solid phase after adsorption was collected and detected using X-ray diffraction and scanning electron microscopy with energy dispersive X-ray spectroscopy. Results revealed that PbSO4 was formed on the surface of CSHW. The alkaline condition introduced the tribasic lead sulfate, and thus reduced the stability of the adsorption system.

Graphical Abstract

1. Introduction

Wet limestone–gypsum wet flue gas desulfurization (WFGD) has already been recognized as a relatively mature and efficient desulfurization technology for FGD treatment, and its actual application rate is approximately 90% worldwide [1]. However, the large amount of byproducts produced from this widespread technology results in massive accumulation of flue gas desulfurization (FGD) gypsum, and triggers a series of environment problems, such as resource wastage, land occupation, and soil erosion. As a high-quality gypsum resource, FGD gypsum is widely used in cement, agriculture, and building materials [2,3,4]. Nevertheless, the comprehensive utilization of FGD gypsum is remarkably lower in China than in Japan, USA, and European countries; these studies are mainly consumed in producing low and medium value-added materials [5]. The synthesis of FGD gypsum-based material, especially the production of calcium sulfate hemihydrate whisker (CSHW), must be improved to further widen the application value of FGD gypsum and achieve the target resource utilization.
CSHW is a kind of sub-nanoscale mineral, and its morphology is oriented by the differential growth velocity between axial and lateral directions [6]. CSHW has become popular due to its special properties, such as high aspect ratio [7], high tensile strength and elastic modulus [8,9], ease of surface modification [10], ease of dispersion [11], integrated internal structure [12], and nontoxicity [13]. This material is commonly obtained from industrial or natural gypsum through hydrothermal synthesis at a normal pressure level, which is perceived as an effective and easily controlled process. Since the achievements about CSHW were firstly proposed in the early 1970s [14,15], the research on this topic has focused on the following three directions [16,17,18]: (i) preparing target products from available wastes; (ii) modifying the crystal morphology through additives; and (iii) applying CSHW to produce constructional materials. Most studies have focused on technological modification or the mechanism of the preferred orientation growth. However, little effort has been made to deliberate the important role of CSHW with definite absorption performance in the field of heavy metal treatment.
Heavy metals, such as lead, cadmium, chromium, nickel, copper, zinc, and mercury, are detrimental, carcinogenic, and persistent inorganic contaminants that are found in human surroundings, and have been originated from natural or anthropogenic behavior [19]. The design and fabrication of common techniques have shown potential for treating polluted sewage with heavy metals [20,21,22]. Among all substances, lead is of particular concern, because it has high toxicity, is biorefractory, chronically accumulates, and has broad sources. Various techniques, including chemical precipitation, ion exchange, filtration, membrane separation, and adsorption, are utilized to deal with the lead contamination [23,24,25]. Compared with other processes, adsorption technology exhibits sufficient advantages, such as easy operation, low cost, secondary pollution-free, and extensive application scope.
Some natural materials, such as active carbon, kaolin, olive cake, sawdust, and fly ash, may serve as cost-effective sorbents for lead adsorption [24,26]. By contrast, synthetic or modified adsorbents are usually favorable because the manipulation of surface morphology and chemistry ensures enhanced uptake capacity. Goel et al. [27] showed that the adsorption of Pb(II) on sulfonated activated carbon exhibits a 35.0% increase in capacity (mg g−1) over normal activated carbon. In Gunay’s research [28], the maximum adsorption capacity of Pb(II) onto pretreated clinoptilolite is higher than that on the raw material. Gupta et al. synthesized an alumina-coated multi-wall carbon nanotube material and verified its effectiveness for the absorption of lead ions [29]. More recently, gypsum-based materials, such as CSHW, received considerable attention as alternative absorbents in the field of environmental governance. This material possesses great potential value in research and application, due to the remarkable characteristics of its crystal surface and chemical components. The strong chemical affinity of lead toward sulfate groups [27,30,31] serves as the theoretical basis for this paper. Yet, the interaction between lead and CSHW remains unclear.
The present study aims to explore the synthetic process and the substantial role of CSHW in removing lead ions. CSHW was acquired using FGD gypsum through the hydrothermal method. Actually, the important role of some metal ions on the generation of calcium sulfate crystals has been well investigated [32,33]. Mg2+ ions went against the formation of α-CSH, because of the association effect formed by stable MgSO40 in 4.50 M magnesium chloride solution [34]. Yang et al. [35] researched that when the potassium chloride concentration is up to 18.0 wt. %, pure calcium sulfate phase is difficult to obtain, due to the formation of syngenite or gorgeyite. In sodium chloride solution, the presence of cadmium, copper, ferrum, and chromium hindered the crystallization of calcium sulfate significantly, even at low concentrations [36]. That is to say, the nucleation and crystallization of gypsum crystals is closely related to added substances in the solution. In order to acquire products with high stability, the metastable lifetime zone of CSHW affected by calcium chloride and sulfuric acid was researched, and the transformation was further analyzed in this paper. The conversion from FGD gypsum to CSHW shows both economic and environmental benefits when low-grade wastes are used as a valuable absorbent. The influence of pH on adsorption was investigated extensively in practical experiments, and the appropriate scope was classified. Furthermore, the absorption performance was characterized and contrasted by data fitting using equilibrium isotherms and kinetic models, and the mechanism was proposed in detail.

2. Experiment and Characterization

2.1. Chemicals

All the chemicals used in this study were purchased from Sinopharm Chemical Reagent Corporation Ltd. (SCRC Ltd., Wuhan, China). Stock solutions of lead(II) were prepared by dissolving appropriate amounts of Pb(NO3)2 (SCRC Ltd., Wuhan, China) in deionized water to obtain desired different concentrations.

2.2. Synthesis of CSHW

As a raw material, FGD gypsum products were obtained from Jinzhou City in China, and its free water content was 9.95 wt. %. The gypsum was dried at 333 K for 24 h before use. In the practical operation, the dried samples were mixed with matrix solutions (sulfuric acid and calcium chloride) in deionized water to produce CSHW under hydrothermal conditions.
The main procedure was accomplished as follows. At the beginning of each run, sulfuric acid solution with the mass concentration of 1.0 wt. % was added into a 500 mL three-neckedround-bottomed flask, which was placed in a heat-collected magnetic stirring reactor (DF-101S, China). After preheating for 30 min at the fixed temperature of 369 K, 5 wt. % calcium chloride and 15 wt. % FGD gypsum were immediately added at the rotating speed of 300 rpm to form gypsum slurry. At a certain reaction time (4 h), the suspension samples were quickly detached, washed several times with nearly boiling water, and then rinsed twice by anhydrous ethyl alcohol with the purity of 99.5%. Finally, after vacuum drying to a constant weight at 333 K, the separated solids were the target CSHW applied in the next absorption process. Meanwhile, another 15 mL of supernatant liquor was collected for inductively coupled plasma quantitative analysis (ICP, IRIS Intrepid II XSP, Waltham, MA, USA). Under the limit of detection (LOD) of 9 mg L−1, the measured S abundance, with an uncertainty of 1.3 × 10⁻³, was united as g/100 mL for solubility characterization.

2.3. Adsorption Study of Lead Ions

Adsorption experiments were all conducted at a controlled temperature using freshly prepared solutions. Adequate mass of dried powder CSHW fixed at 2 g L−1 was added into 100 mL of several lead solutions (10, 30, 60, 80, and 100 mg L−1) in 150 mL centrifuge tubes. The resultant mixtures were subjected to a thermostatic water bath oscillator (SHA-BA, Jintan, China) at the controlled temperature (298 and 318 K) for a specific reaction time (5, 10, 15, 20, 25, 30, 60, 90, and 120 min). During absorption, a constant oscillation speed of 180 rpm was adopted for good mass transfer with continuous mixing. The pH values of initial solutions in the adsorption process were monitored and adjusted using 0.1 M hydrochloric acid and 0.1 M sodium hydroxide. In the course of the batch operation, the sample solution in the centrifuge tube was withdrawn from the device at the equilibration time, and was immediately placed in a low-speed autobalancing centrifuge for 5 min (TDZ5-W8, Shanghai, China). Afterward, 15 mL of supernatant liquid was obtained by using an injection syringe and was filtered with a 0.45 µm cellulose filter. After appropriate water dilution, the lead concentration in the clear filtrate was detected.
A series of experiments was conducted to determine the influence of pH level and initial lead concentration on adsorption. With an initial lead concentration of 30 mg L−1, the effect of pH values varied from 3 to 8 was studied at 298 K. To determine the adsorption capacity, varying initial lead concentrations were performed in the range of 10–100 mg L−1. The usability of CSHW for lead adsorption at different treatment times was also investigated to establish the most suitable kinetics model using with an initial lead concentration of 30 mg L−1.

2.4. Characterization

As common indexes used in studying the adsorption property, removal efficiency (RE, %) and adsorption capacity (Qe, mg g−1) were utilized to characterize the processing ability of CSHW in the uptake of heavy metal ions. RE and Qe can be calculated through Equations (1) and (2), respectively:
R E = c 0 c i c i × 100 %
Q e = c 0 c e m × V
where c 0 (mg L−1), c i (mg L−1), and c e (mg L−1) are the lead concentrations at the initial stage, adsorption stage, and equilibrium stage, respectively; m (g) represents the dosage of CSHW; and V (L) indicates the solution volume.
The assessment of calcium sulfate sample formation was identified by determining the loss of crystal water content and the phase constitute, which was performed through thermogravimetry and differential scanning calorimetry (Diamond DSC TG-DTA 6300, PerkinElmer, Waltham, MA, USA). Density tester was used to detect the bulk density of materials based on the Chinese National Standard “Gypsum plasters—Determination of water physical properties of powder” (GB/T 17699.5-1999, eqv. ISO 3049:1974). The true density of powder materials was determined by the pycnometer method. The content of crystal water was tested in accordance with the Chinese National Standard “Gypsum plasters—Determination of water of crystallization content” (GB/T 17699.2-1999, eqv. ISO 3052:1974). Particle distribution was experimented with a laser particle size analyzer (R7HJ-S3500, Microtrac, Montgomeryville, PA, USA). X-ray fluorescence spectrometer (S4 Pioneer, Bruker AXS, Karlsruhe, Germany) was used to analyze chemical compositions of the raw materials and synthesized calcium sulfate hemihydrate whiskers. Phase constitution was examined by X-ray diffraction (XD-98) with Cu/Kα radiation at a scanning rate of 2°/min in the 2θ range of 5° to 85°. Crystal morphologies were observed and material composition was also performed by an energy-dispersive spectrometer device (EDAX, Santiago, Chile) facility united with a scanning secondary electron microscope (SEM) (Quanta 200, FEI, Hillsboro, OR, USA). Flame atom absorption spectrophotometer (F-AAS, TAS-990, Beijing, China) at its maximum wavelength of 283.31 nm was used to determine the concentrations of lead ions under the LOD of 10 mg L−1, and an uncertainty of 1.9 × 10⁻³ in the clarified liquors before and after adsorption.

3. Results and Discussion

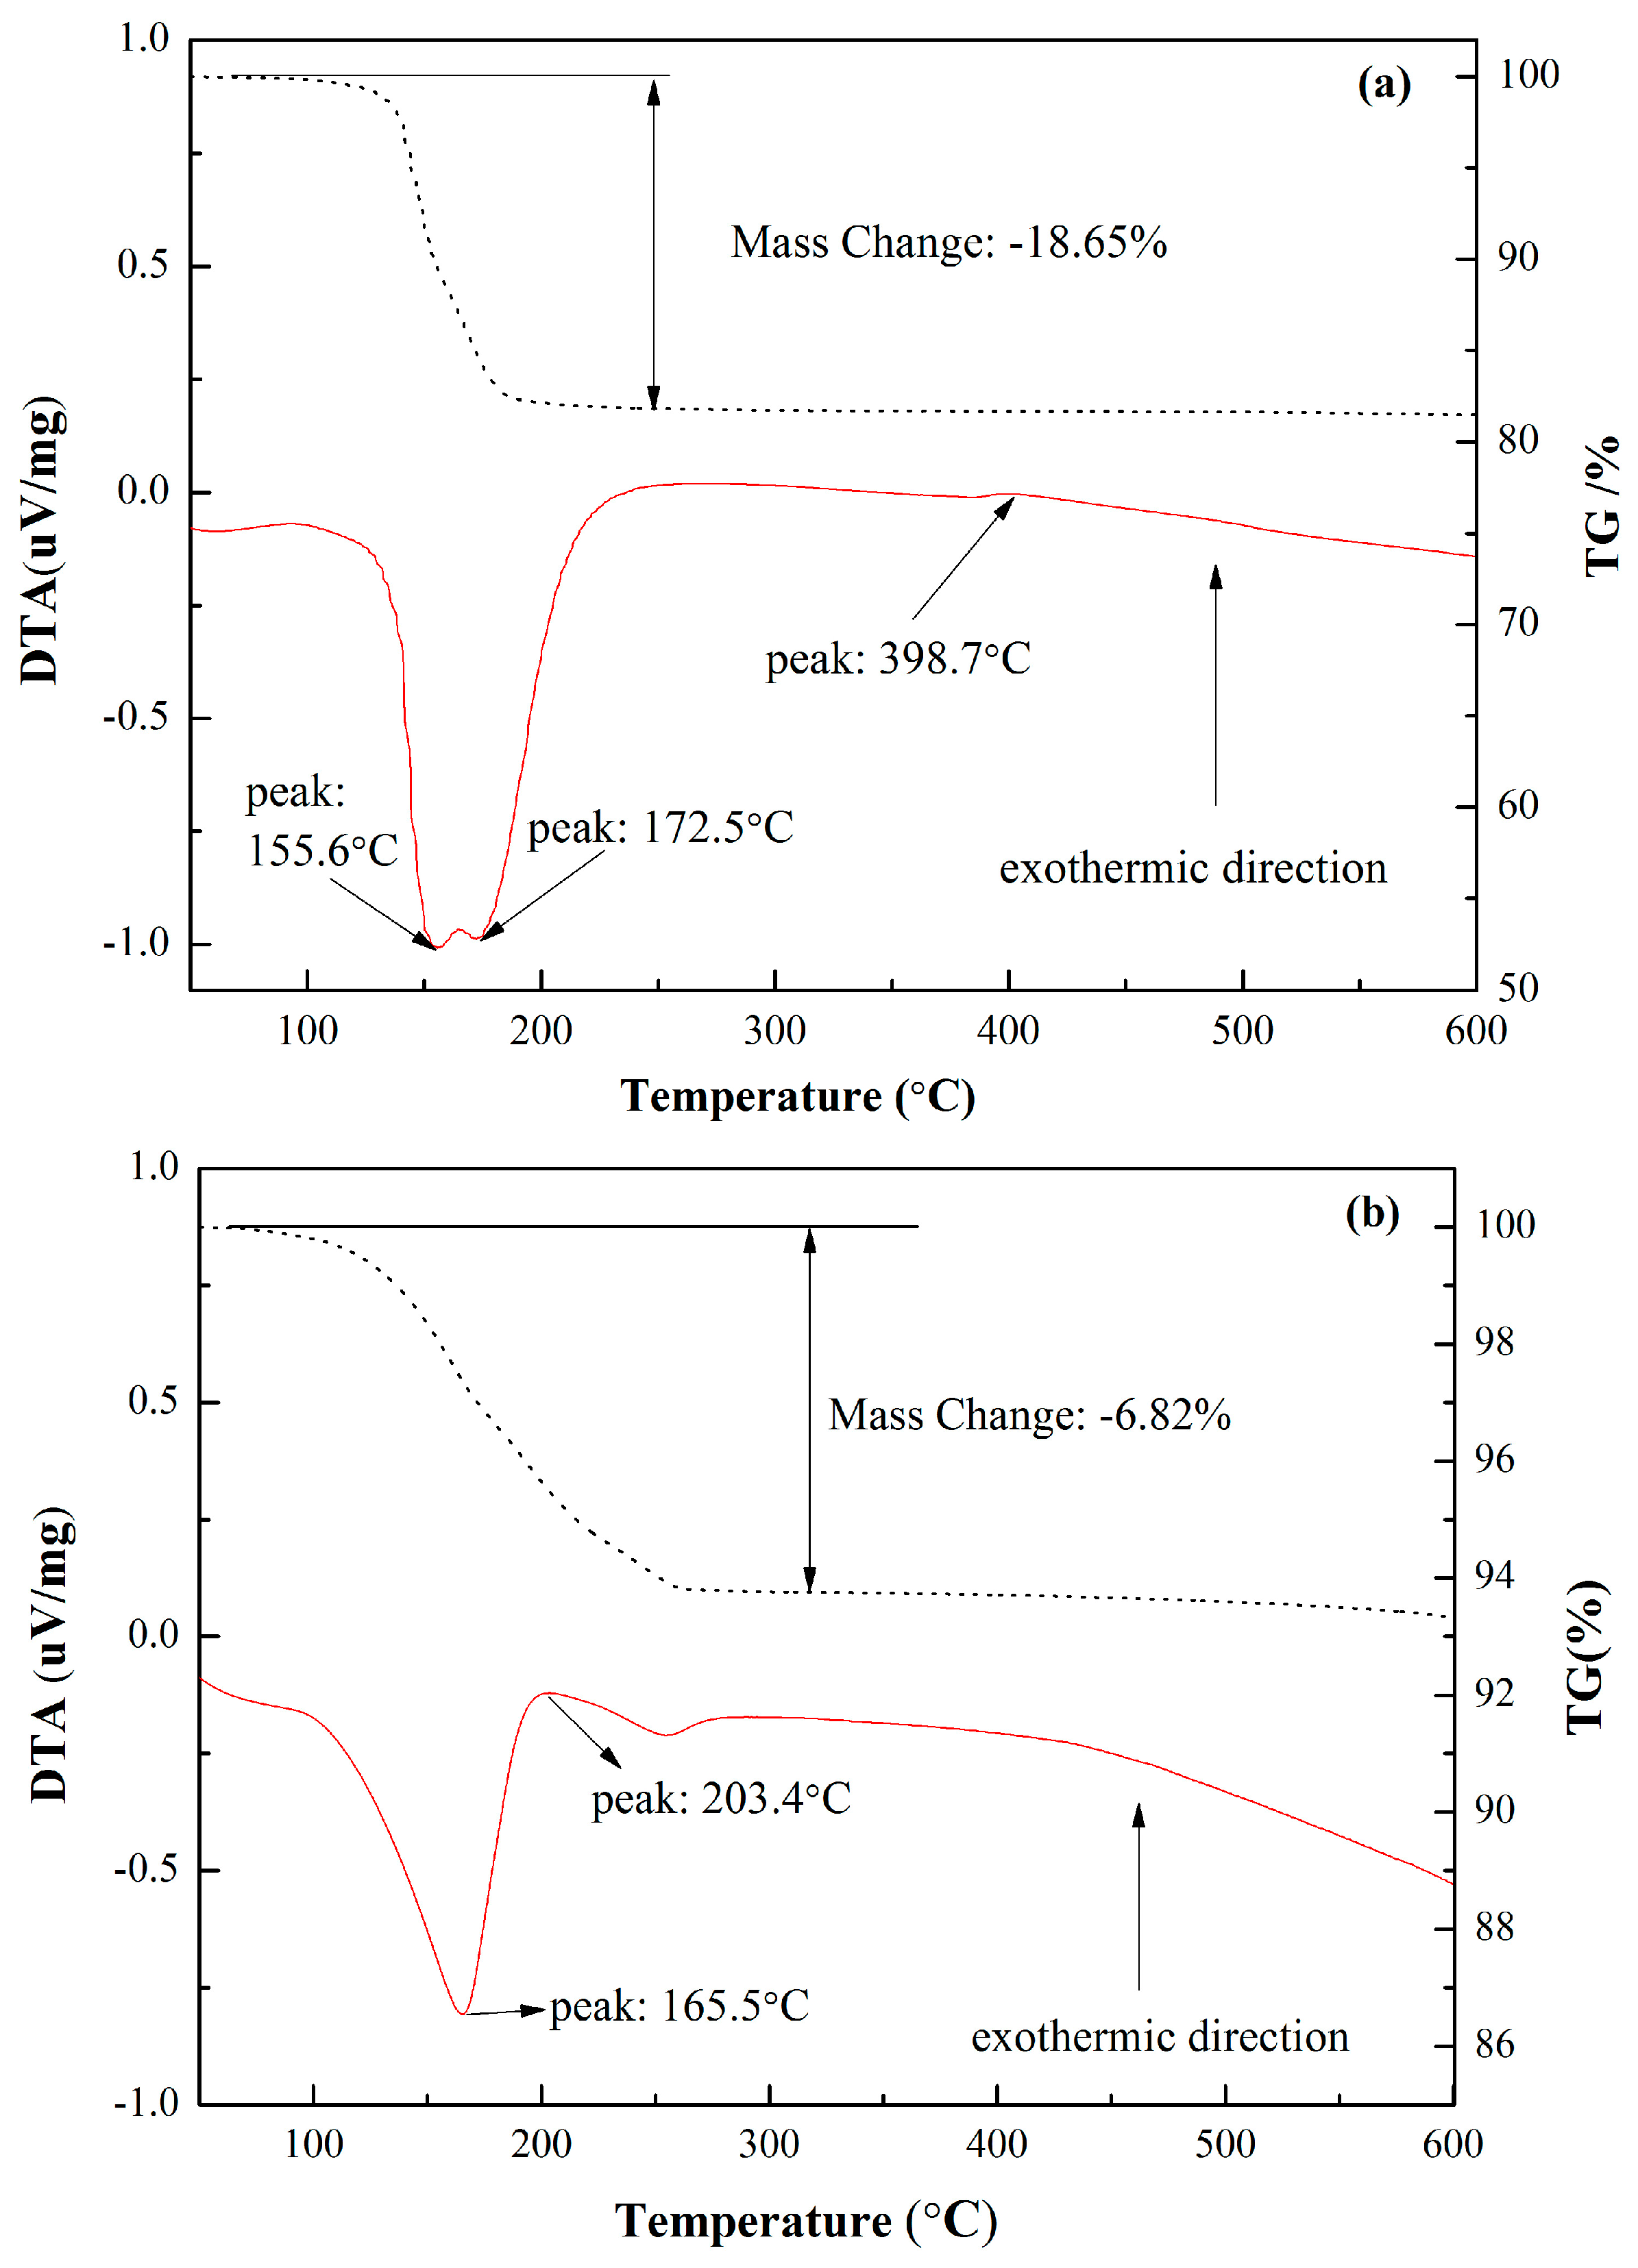
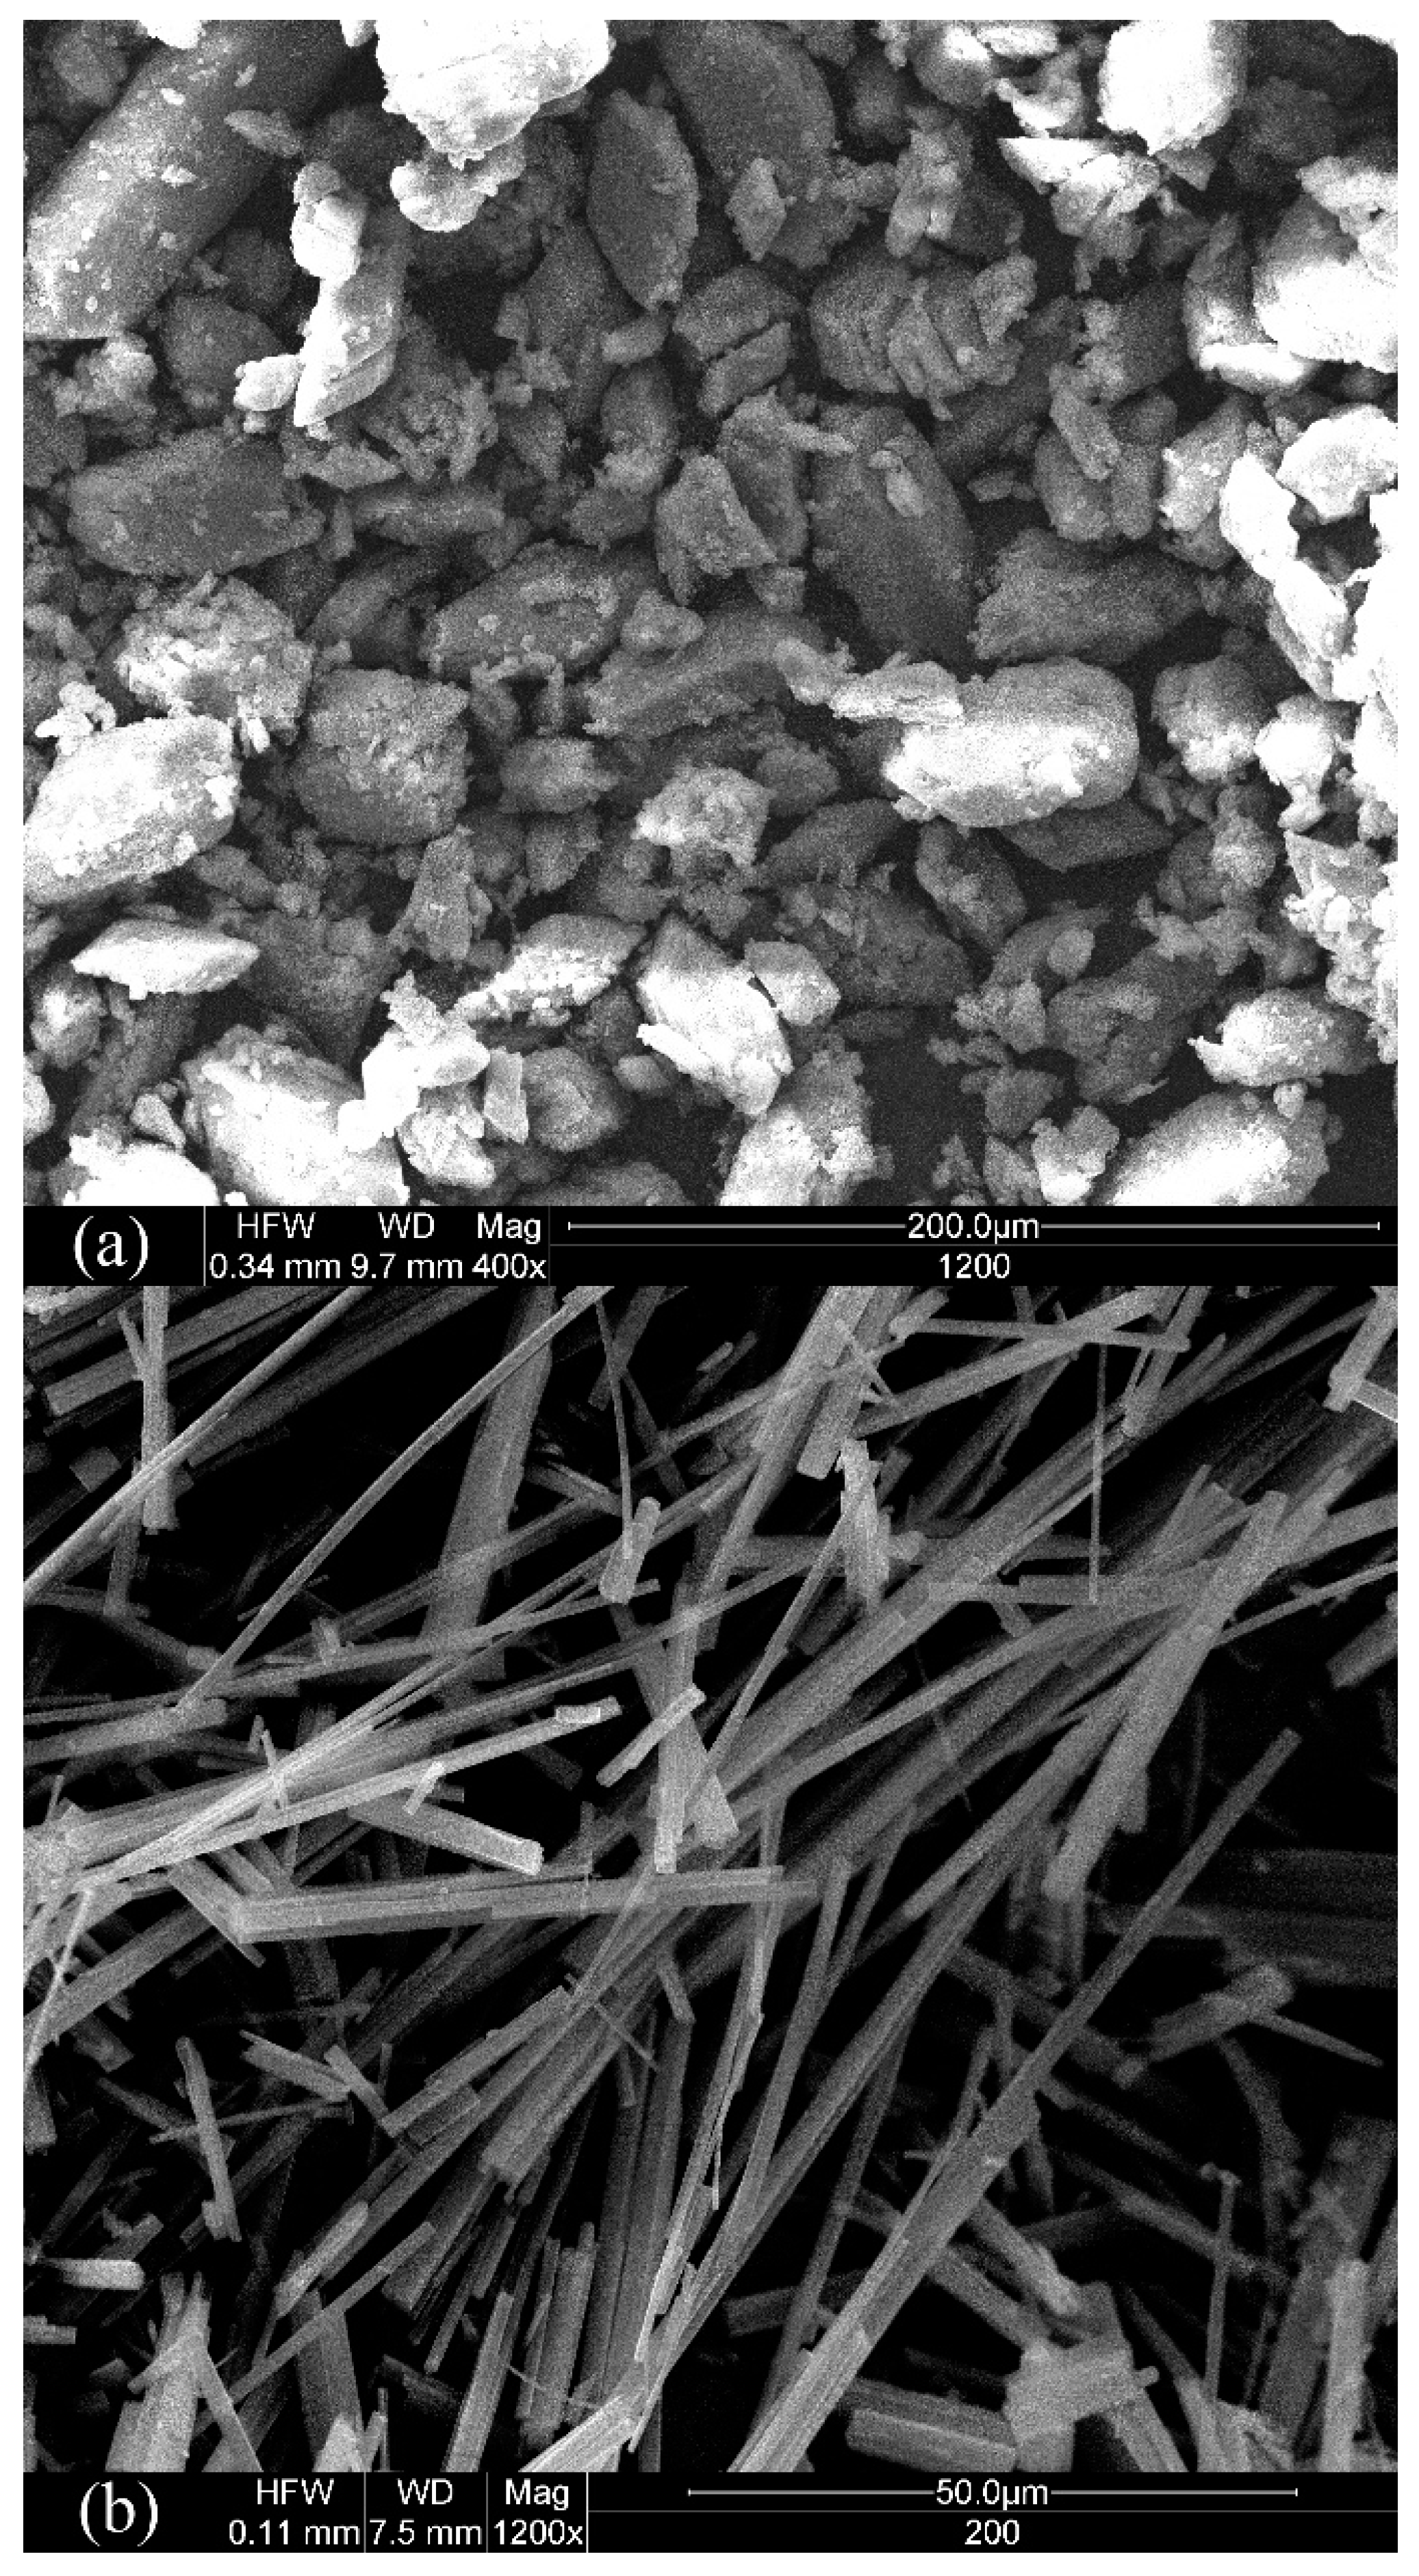
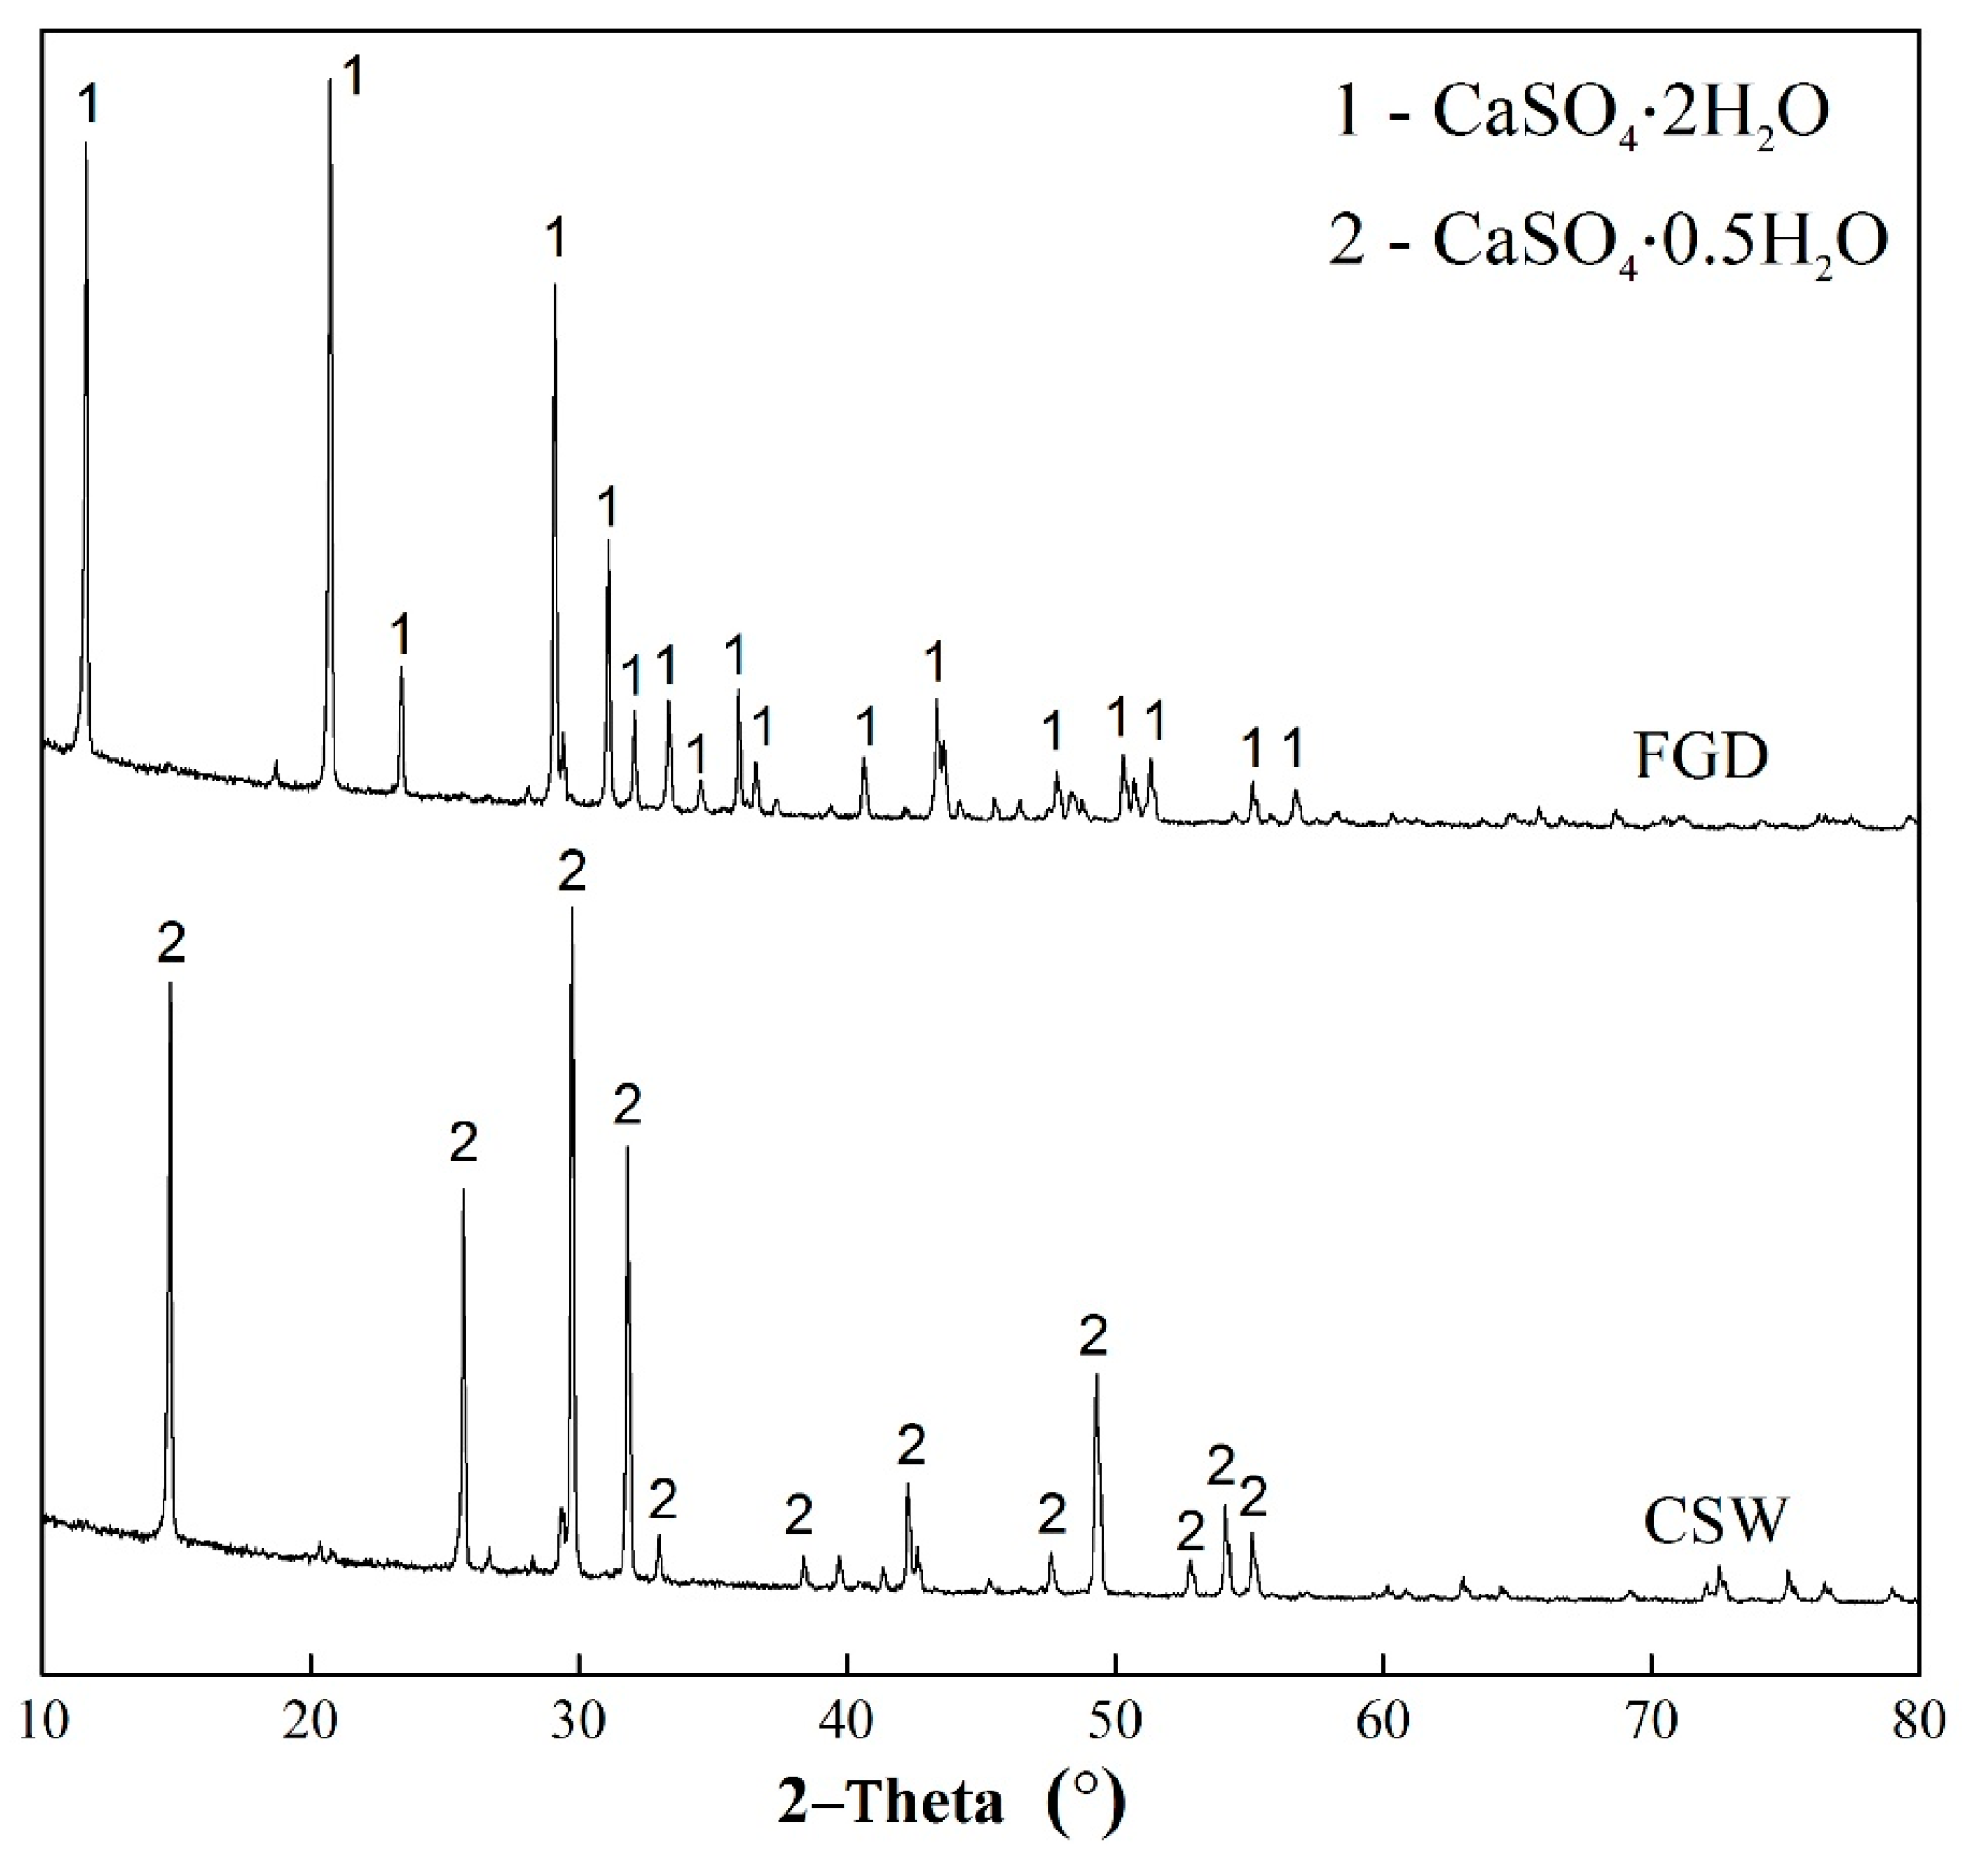
3.1. Basic Characteristics of CSHW

As mentioned above, CSHW was successfully prepared from FGD gypsum through hydrothermal synthesis under the atmospheric pressure. The physical characteristics and chemical compositions are summarized and contrasted in Table 1 and Table 2, respectively.
A study of the experimental data in Table 1 indicated that actual measured values of CSHW were pretty close to the raw material, meaning the hydrothermal method did not affect physical properties much. The FGD gypsum and CSHW were also chemically characterized and exhibited in Table 2. The chemical substances were both found to be inorganic in nature, and their contents rather similar. Besides, the main component was shown as calcium sulfate, due to the high content (more than 96%). In this research, the crystal water content of FGD gypsum was tested as 18.65 wt. %, which was approximate to the theoretical value of pure CSD (20.93 wt. %). Whereas, that of CSHW was 6.82 wt. %, similarly to pure CSH of 6.21 wt. % calculated from the chemical formulae. Thus, the large discrepancies in the hydration property between FGD gypsum and CSHW could be conceived as their different crystal morphologies and major ingredients.
The microstructures of the raw material (FGD gypsum) and the resultant material (CSHW) are shown in Figure 1. As displayed in the SEM graphs of Figure 1a, the FGD gypsum crystals show an uneven size distribution, and most exhibited a kind of rhombohedral structure. During dehydration reaction, whisker-shaped crystals (Figure 1b), which are longer than 100 μm, are observed during the dehydration reaction. Statistical analysis showed that the aspect ratio is 63, while the raw material of FGD gypsum is detected with an aspect ratio ranging from 1 to 4. These results, combined with the XRD patterns in Figure 2, showed three characteristic peaks at 11.62°, 20.72°, and 29.11° for FGD gypsum, indicating that the main component of the raw material is calcium sulfate dihydrate (CSD). Many literature studies have revealed that CSD can easily dehydrate into products with improved performance under specific conditions [37,38]. In this paper, the major product in CSHW is pure α calcium sulfate hemihydrate (α-CSH), which has been verified by the XRD pattern in Figure 2 and TG/DTA curve in Figure 3. In general, calcium sulfate hemihydrate owns two structures, including α-CSH and β-CSH, and TG/DSC has proved to be the essential approach to differentiate the two types [39]. Figure 3a manifests the sample detached 1.5 and 0.5 crystal water successively at exothermic DSC peaks of 155.6 °C and 172.5 °C. The mass change value is calculated to be 18.65%, denoting that the raw material is CSD crystal. As shown in Figure 3b, the exothermic peak is detected at 203.4 °C following the endothermic peak at 165.5 °C with a weight loss of 6.82%, which is characteristic of α-CSH.

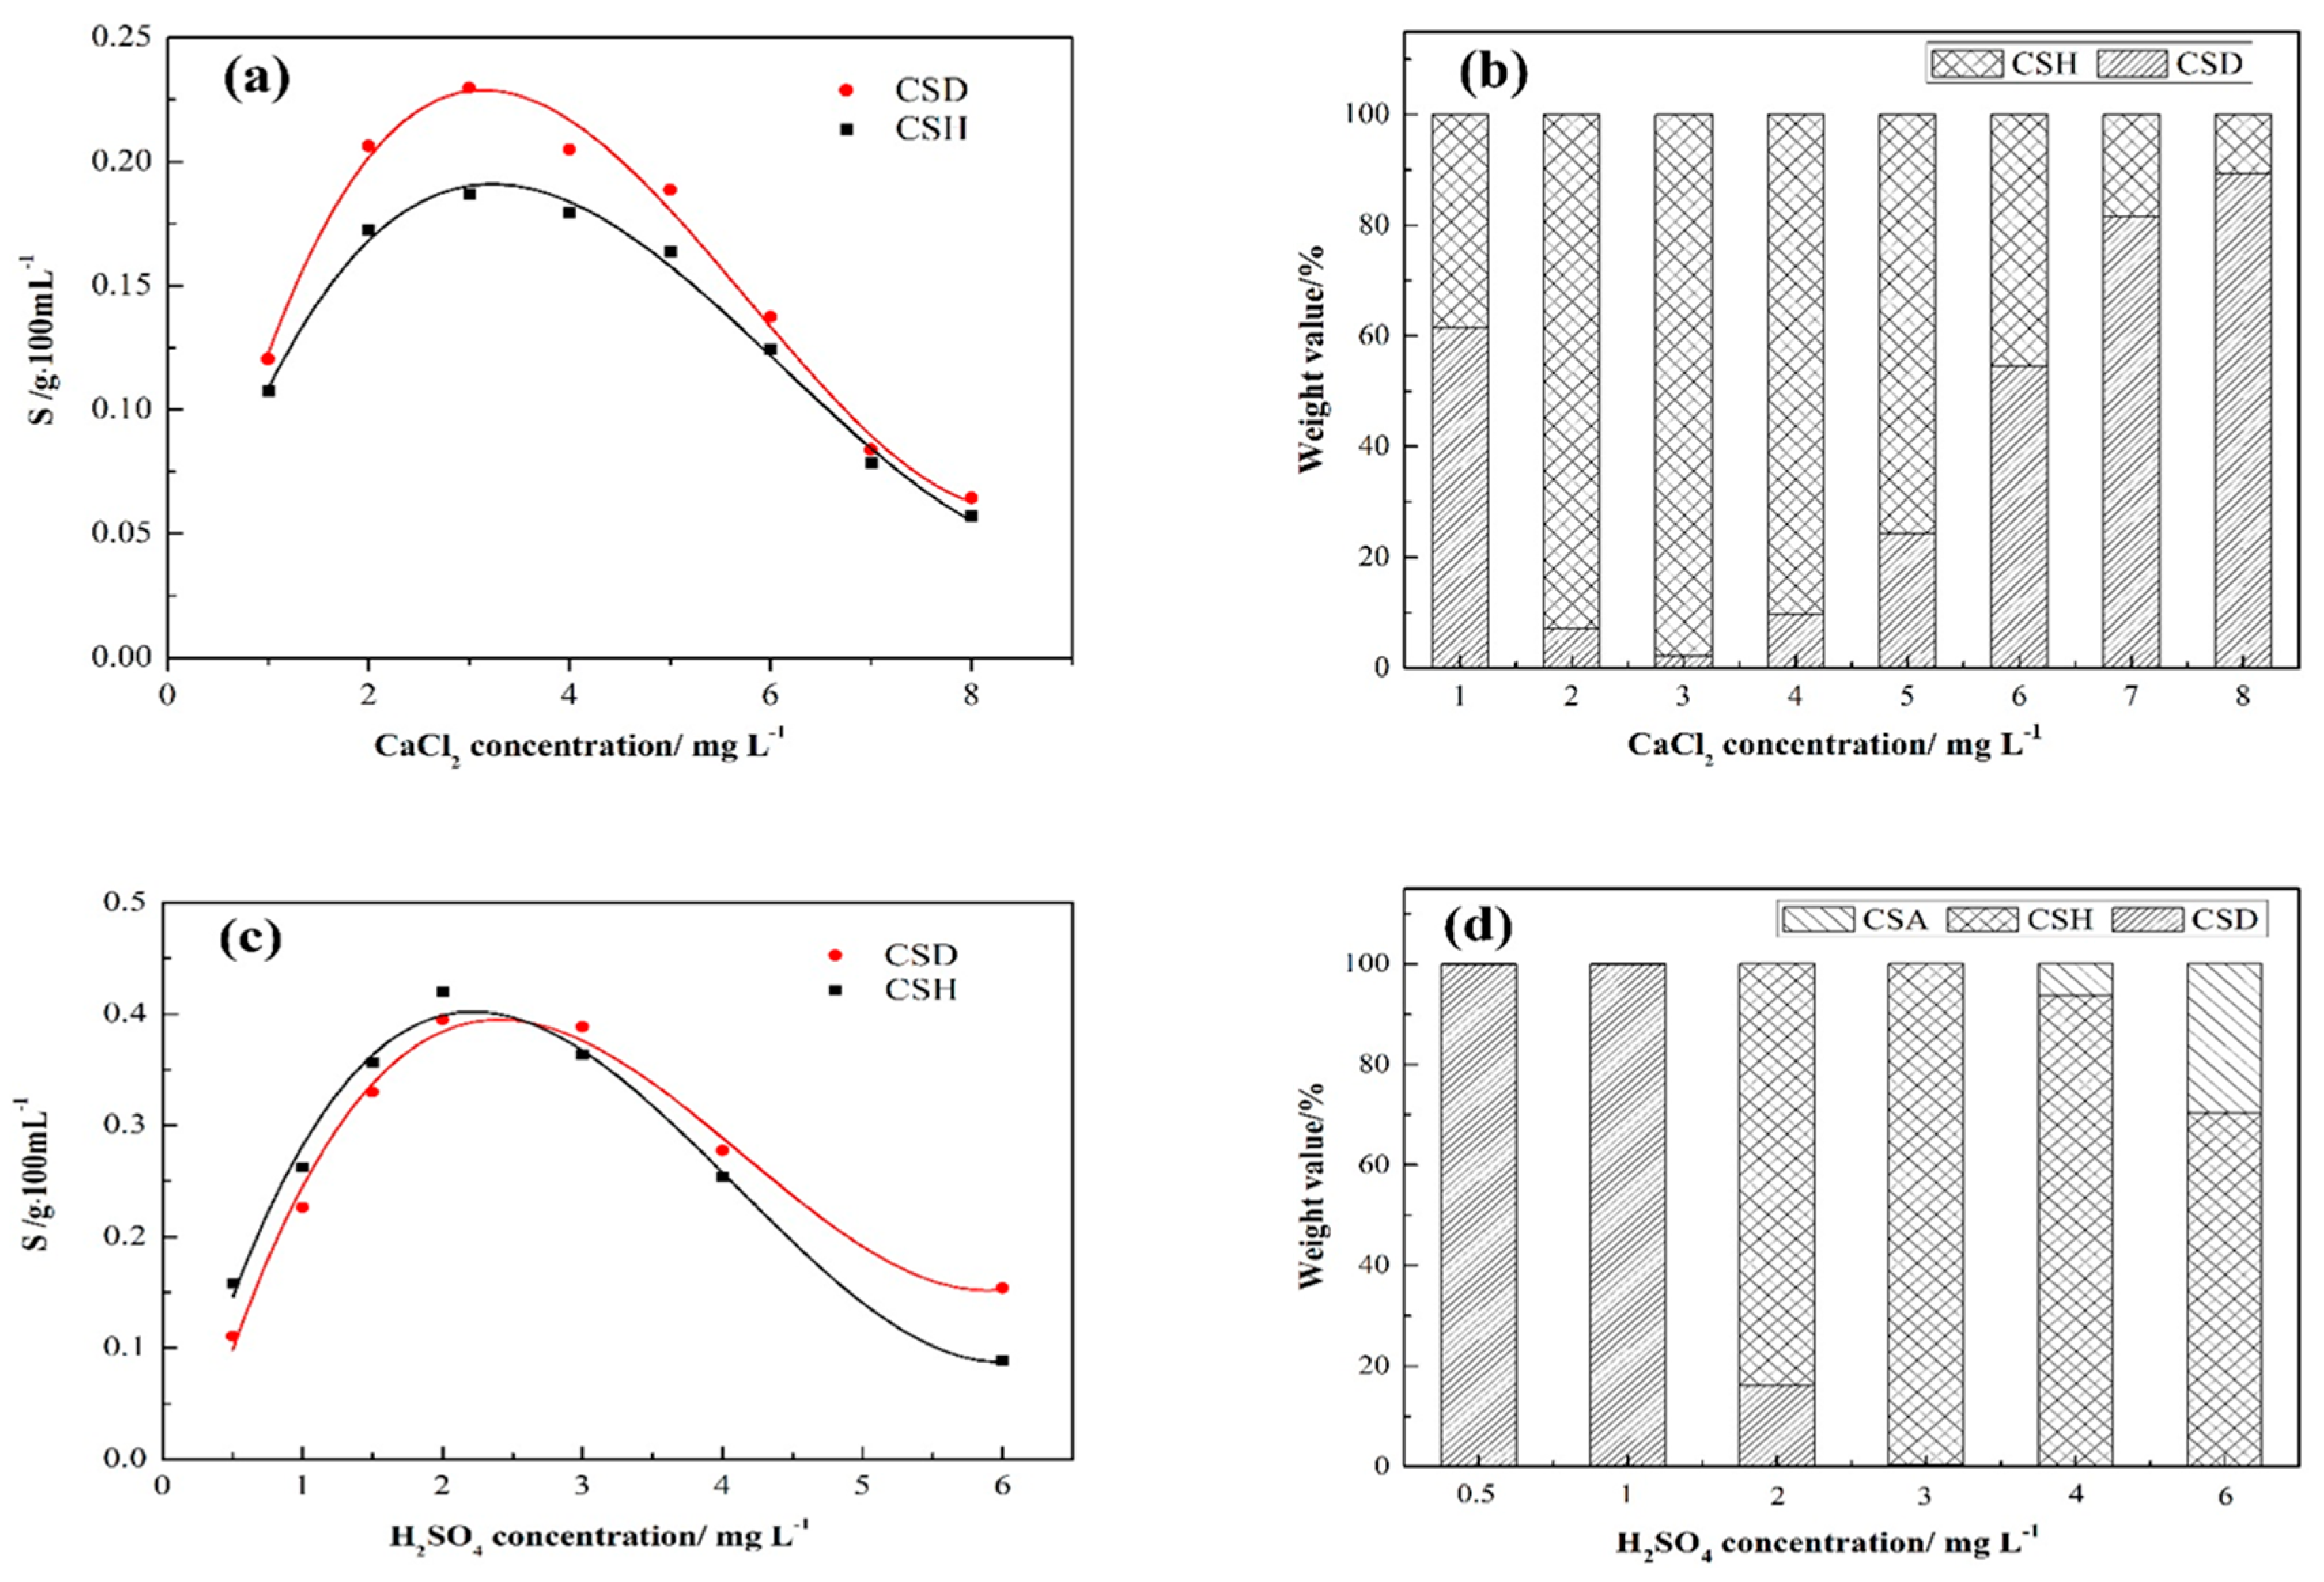
3.2. Metastable Lifetime Zone of CSHW during the Hydrothermal Reaction

As always, dissolution recrystallization theory has been regarded as the elementary mechanism underlying the transformation of α-CSH from FGD gypsum. This theory supports that supersaturation is the main impetus for α-CSH nucleation and growth. Fu et al. revealed that temperature and water activity are important factors affecting the solubility difference [40]. Based on previous research [41], the relationship between solubility and temperature has been verified. By contrast, the significant influence of electrolyte solution on water activity is a domain worthy of further exploration. In order to explain the dehydration and hydration behavior affected by the matrix solution, Figure 4 presents the solubility data gained from CSD and α-CSH dissolution with different calcium chloride (1, 2, 3, 4, 5, 6, 7, and 8 mg L−1) and sulfuric acid (0.5, 1, 1.5, 2, 3, 4, and 6 mg L−1) concentrations at 369 K.
Figure 4 shows that the different types of matrix solution have a similar effect on the solubility values. At a given initial concentration of raw material and temperature, the solubility values of CSD and CSH first increase and subsequently decrease with the increasing concentration of the matrix solution. The increased soluble matrix content, causing the constant decrease of water activity, should account for the increasing trend of solubility values. Furthermore, the solubility data versus the concentration of either calcium chloride or sulfuric acid can be empirically simulated with the cubic polynomial curves in a range of given concentrations:
S C a C l 2 ( C S D ) = 0.02291 + 0.1831 c 0.04004 c 2 + 0.00231 c 3   R 2 = 0.981
S C a C l 2 ( C S H ) = 0.00245 + 0.1327 c 0.0279 c 2 + 0.00152 c 3   R 2 = 0.987
S H 2 S O 4 ( C S D ) = 0.1112 + 0.4872 c 0.1427 c 2 + 0.01146 c 3   R 2 = 0.974
S H 2 S O 4 ( C S H ) = 0.05323 + 0.4688 c 0.1450 c 2 + 0.01179 c 3   R 2 = 0.976
These models were highly fitted and proven to be capable of predicting the solubility of calcium sulfate dehydrate and hemihydrate. The solubility changes induced by calcium chloride and sulfuric acid at different concentrations may be interpreted as follows. Seen from Figure 4a, when the calcium chloride content increases gradually in the solution, the solubility data of CSD are always higher than those of CSH, which indicated that calcium chloride is beneficial for the precipitation of CSH. This advantage is reflected within a certain range of calcium chloride concentrations (e.g., 2–5 M), which is shown in the phase composition graph in Figure 4b. Given the excessive addition of calcium ions, the influence of common ion effect on the solubility of gypsum is higher than that of the ionic strength effect, which suppresses the formation of CSH. In addition, the presence of calcium chloride promotes the effect of the preferential adsorption on the facets of (100) and (010), by slowing down their surface energy, which might be the main reason for the crystallization of CSHW [32].
Figure 4d illustrates that CSHs are not produced until the sulfuric acid concentration increases to 2 M; thus, the solubility of CSH is greater than that of CSD at low sulfuric acid concentrations and should be responsible for the phenomenon depicted above, which corresponds with the result of Li [42]. Combined with Equations (5) and (6), the solubility values of CSH and CSD are equal at the sulfuric acid concentration of 2.59 M. Therefore, CSD would not dehydrate to CSH when the sulfuric acid concentration is below this specific value. However, excessive amounts of sulfuric acid trigger further dehydration reaction from CSH to CSA (anhydrite), finally reducing the purity and quality of final products to some extent. Deduced on the basis of Figure 4, both calcium chloride and sulfuric acid can increase the solubility difference between CSD and CSH, and the former can also push the crystal modification of CSHW. In summary, the formation of target product is easily promoted with the calcium chloride concentration of 2–5 M and sulfuric acid concentration of 2.59–4 M.

3.3. Sorption of Lead Ions

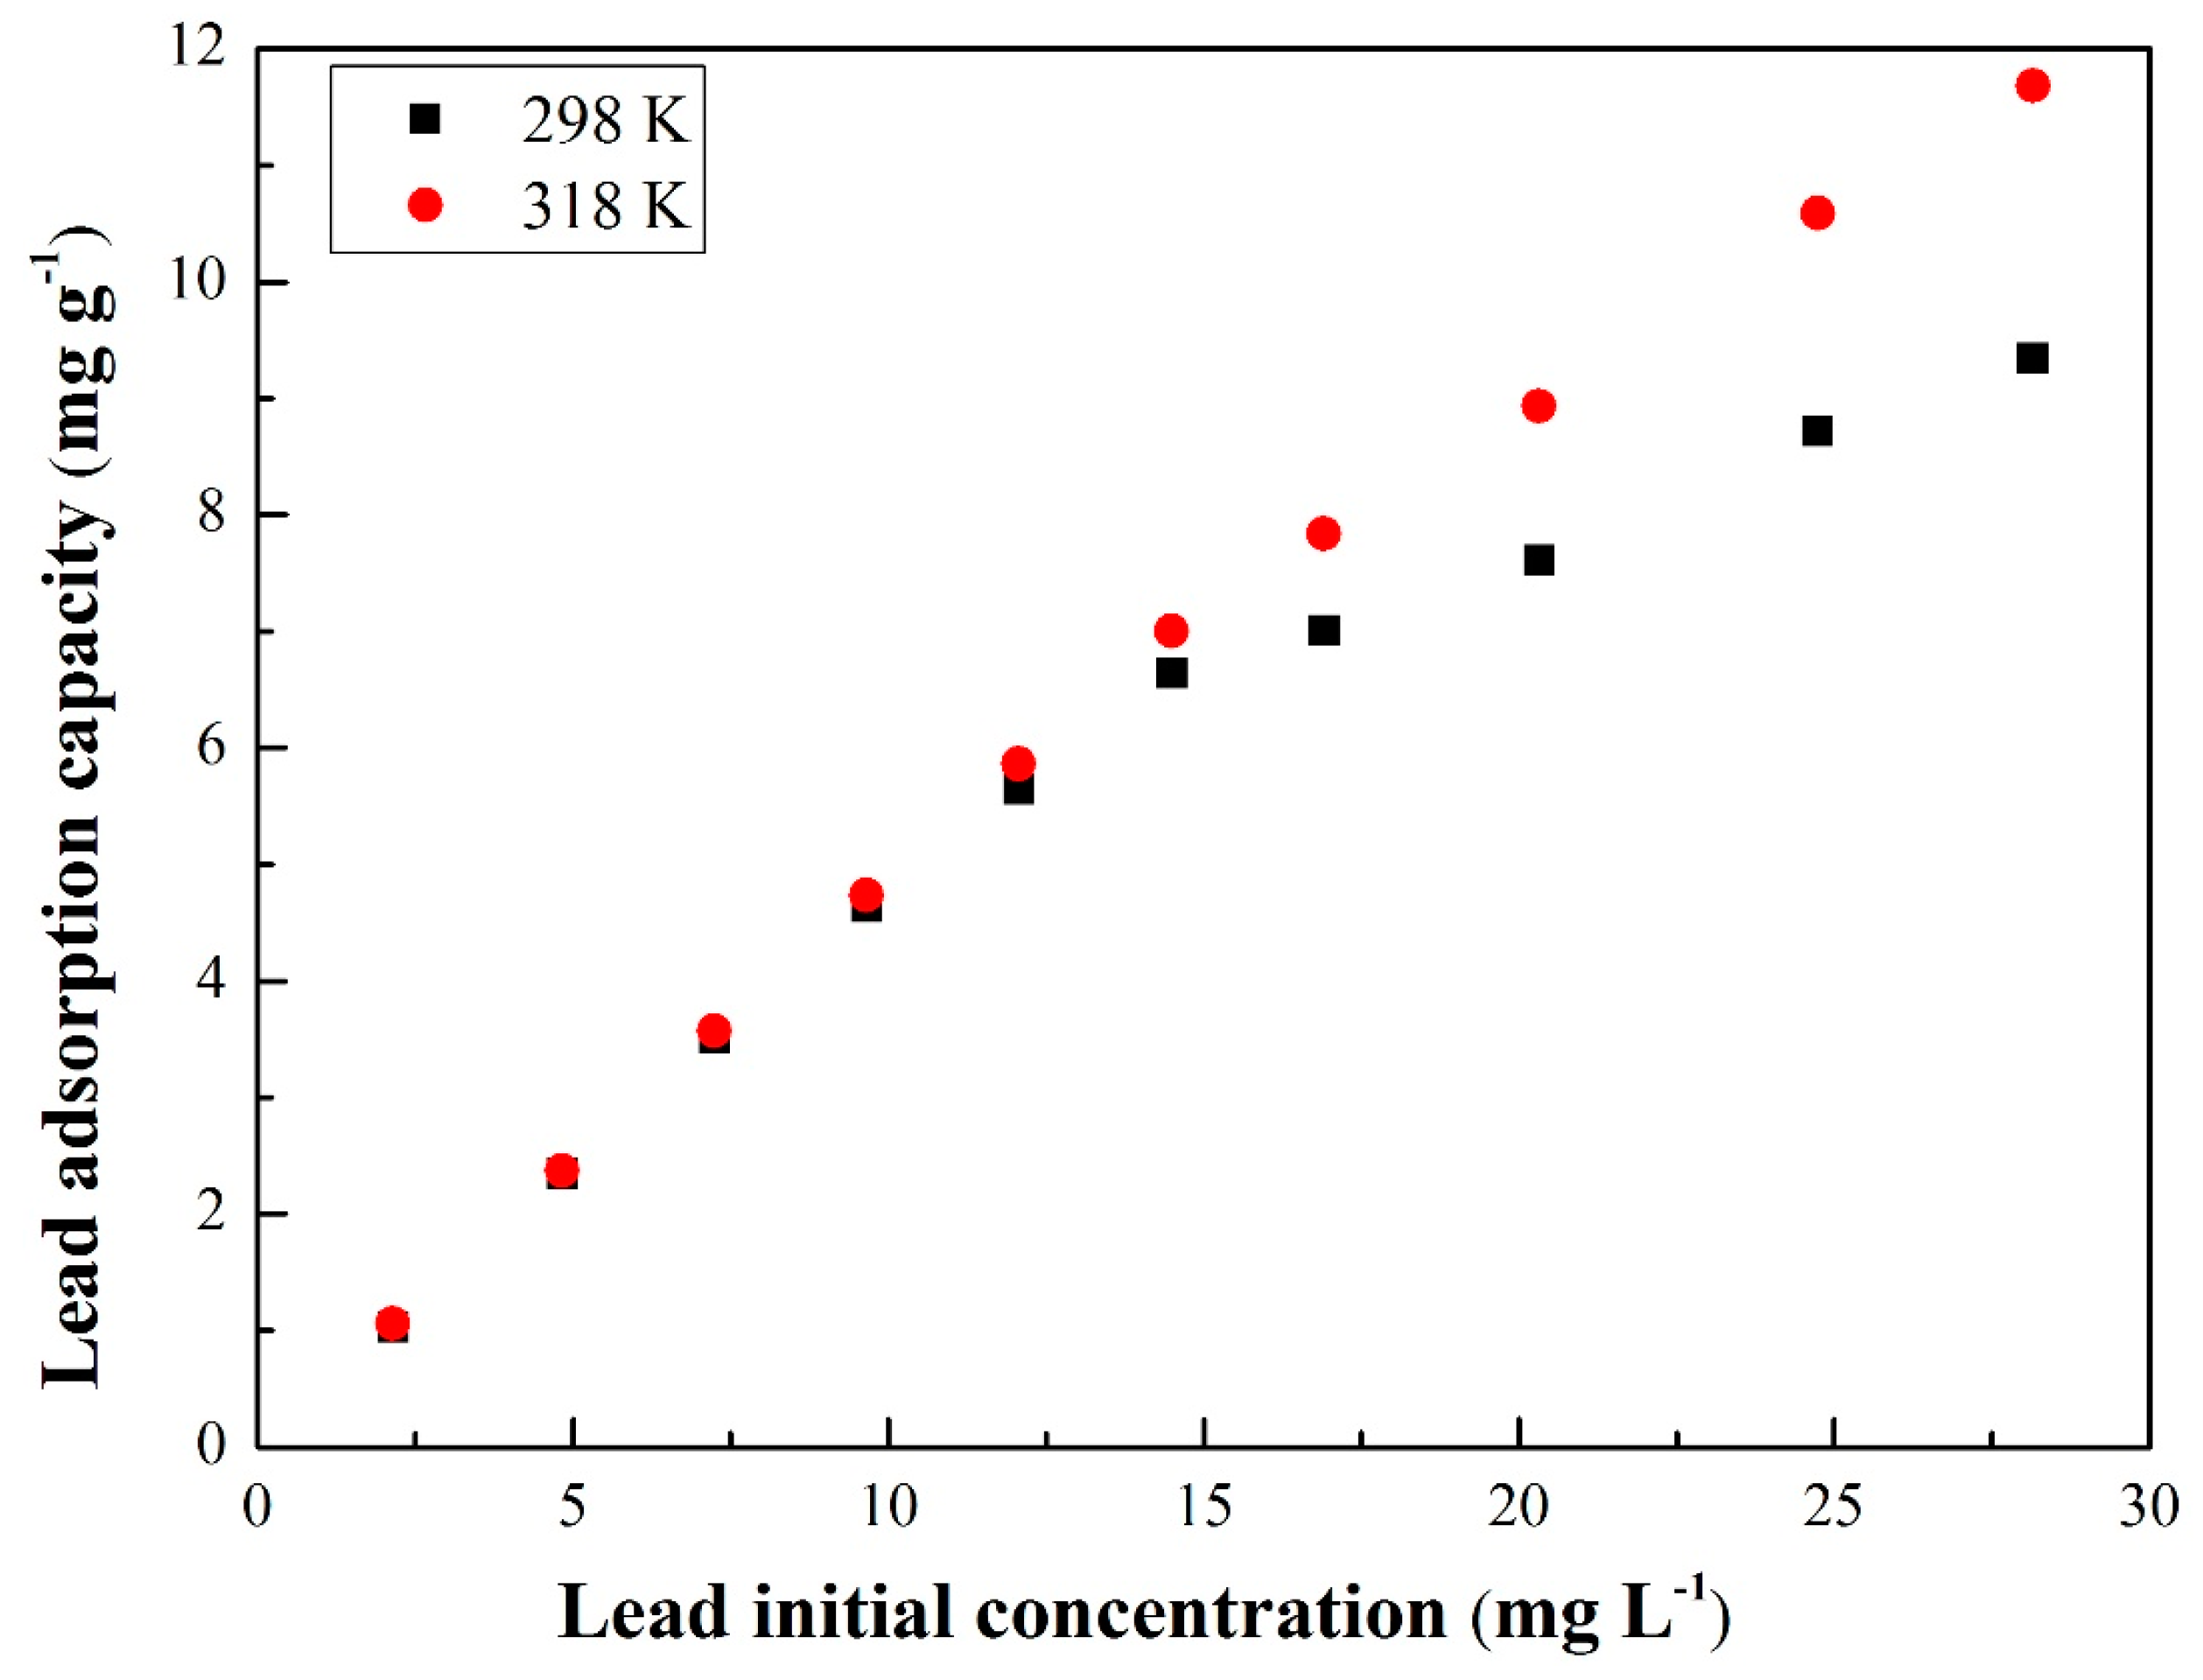
3.3.1. Equilibrium Isotherms

In order to lucubrate the adsorptive behavior of lead ions on CSHW, it is meaningful to process a satisfactory and fitted description of the equilibrium state. In this research, different forecasting results were compared with three kinds of equilibrium equations to fit the experimental data [43]. According to the monolayer adsorption, the Langmuir model assumes that interaction occurs on the homogeneous surface with a limited amount at bonding sites [44]. The linear expression is expressed in Equation (7):
c e Q e = c e Q m + 1 K L Q m
where Q e (mg g−1) is the equilibrium amount of lead ions on CSHW, Q m (mg g−1) is the maximum amount of lead ions on CSHW, c e (mg L−1) is the equilibrium lead concentration, and K L (L mg−1) is the Langmuir equilibrium constant.
Assuming that the adsorption process occurs on the heterogeneous surface, the Freundlich model is assumed as a semi-empirical equation [45], which is presented in a logarithmic form as in Equation (8):
ln Q e = ln K F + 1 n ln c e
where K F (mg g−1) represents the adsorption capacity, and n is the Freundlich equilibrium constant.
Considering the interactions among the adsorbates in the system, the Temkin model is proposed, as the following, Equation (9):
Q e = R T b T ln a T + R T b T ln c e
where R (J K−1 mol−1) indicates the gas constant and the value is always set as 8.314, T (K) signifies the absolute temperature, b T (KJ mol−1) is the heat of Temkin isothermal adsorption, and a T is the Temkin equilibrium constant.
Figure 5 shows the adsorption isotherms of lead ions by CSHW at the temperature of 298 and 318 K. The adsorption isotherms were tested using 30 mg L−1 lead solutions with constant temperature. After the linear fitting, various parameters for equilibrium isotherms of lead ions on CSHW were calculated based on Equations (7)–(9), and the results are presented in Table 3. According to the R 2 value, the matching degree of the three selected models is in the descending order of Langmuir > Temkin > Freundlich at each temperature value. The high applicability of the Langmuir model may suggest that lead removal is controlled by the homogenous distribution of active sites on the CSHW surface.
In the Freundlich model, the equilibrium constant ( n ) is higher than 2.0, indicating that CSHW is favorable for lead adsorption, and the maximum capacity would not significant change at the equilibrium state [46]. In contrast to the two other common isotherms, the application of the Temkin model considers the influence of absolute temperature. The Temkin constant ( a T ) at 318 K can increase approximately one order of magnitude compared with that at 298 K, which could be ascribed to the enhancement of mass transformation at high temperature. Based on the Langmuir model, the Q m values of CSHW toward lead ions at 298 K and 318 K are calculated as 9.461 and 9.681 mg g–1, respectively. Many researches have experimented other materials as low-cost adsorbents for lead removal, and the adsorption capacities of lead onto other materials range from 2.0 mg g−1 to 108 mg g−1 [47]. Actually, adsorption capacities are significantly affected by many parameters, such as the pH of the solution, initial lead concentration, reaction time, and adsorbent dosage.
Besides, what should be of concern is that the relatively high lead adsorption capacities are acquired by using absorbents after surface modification. The low adsorption capacity in the present study could be affected by the limited active sites, which can be remarkably increased through modified processing. However, extra modification treatments require additional expenses in actual application, and the influence of additives on the system have to be considered. Therefore, this paper aims to study the stability of the calcium sulfate system, without other chemicals and with gypsum products as the adsorbent, in removing lead ions from wastewater.

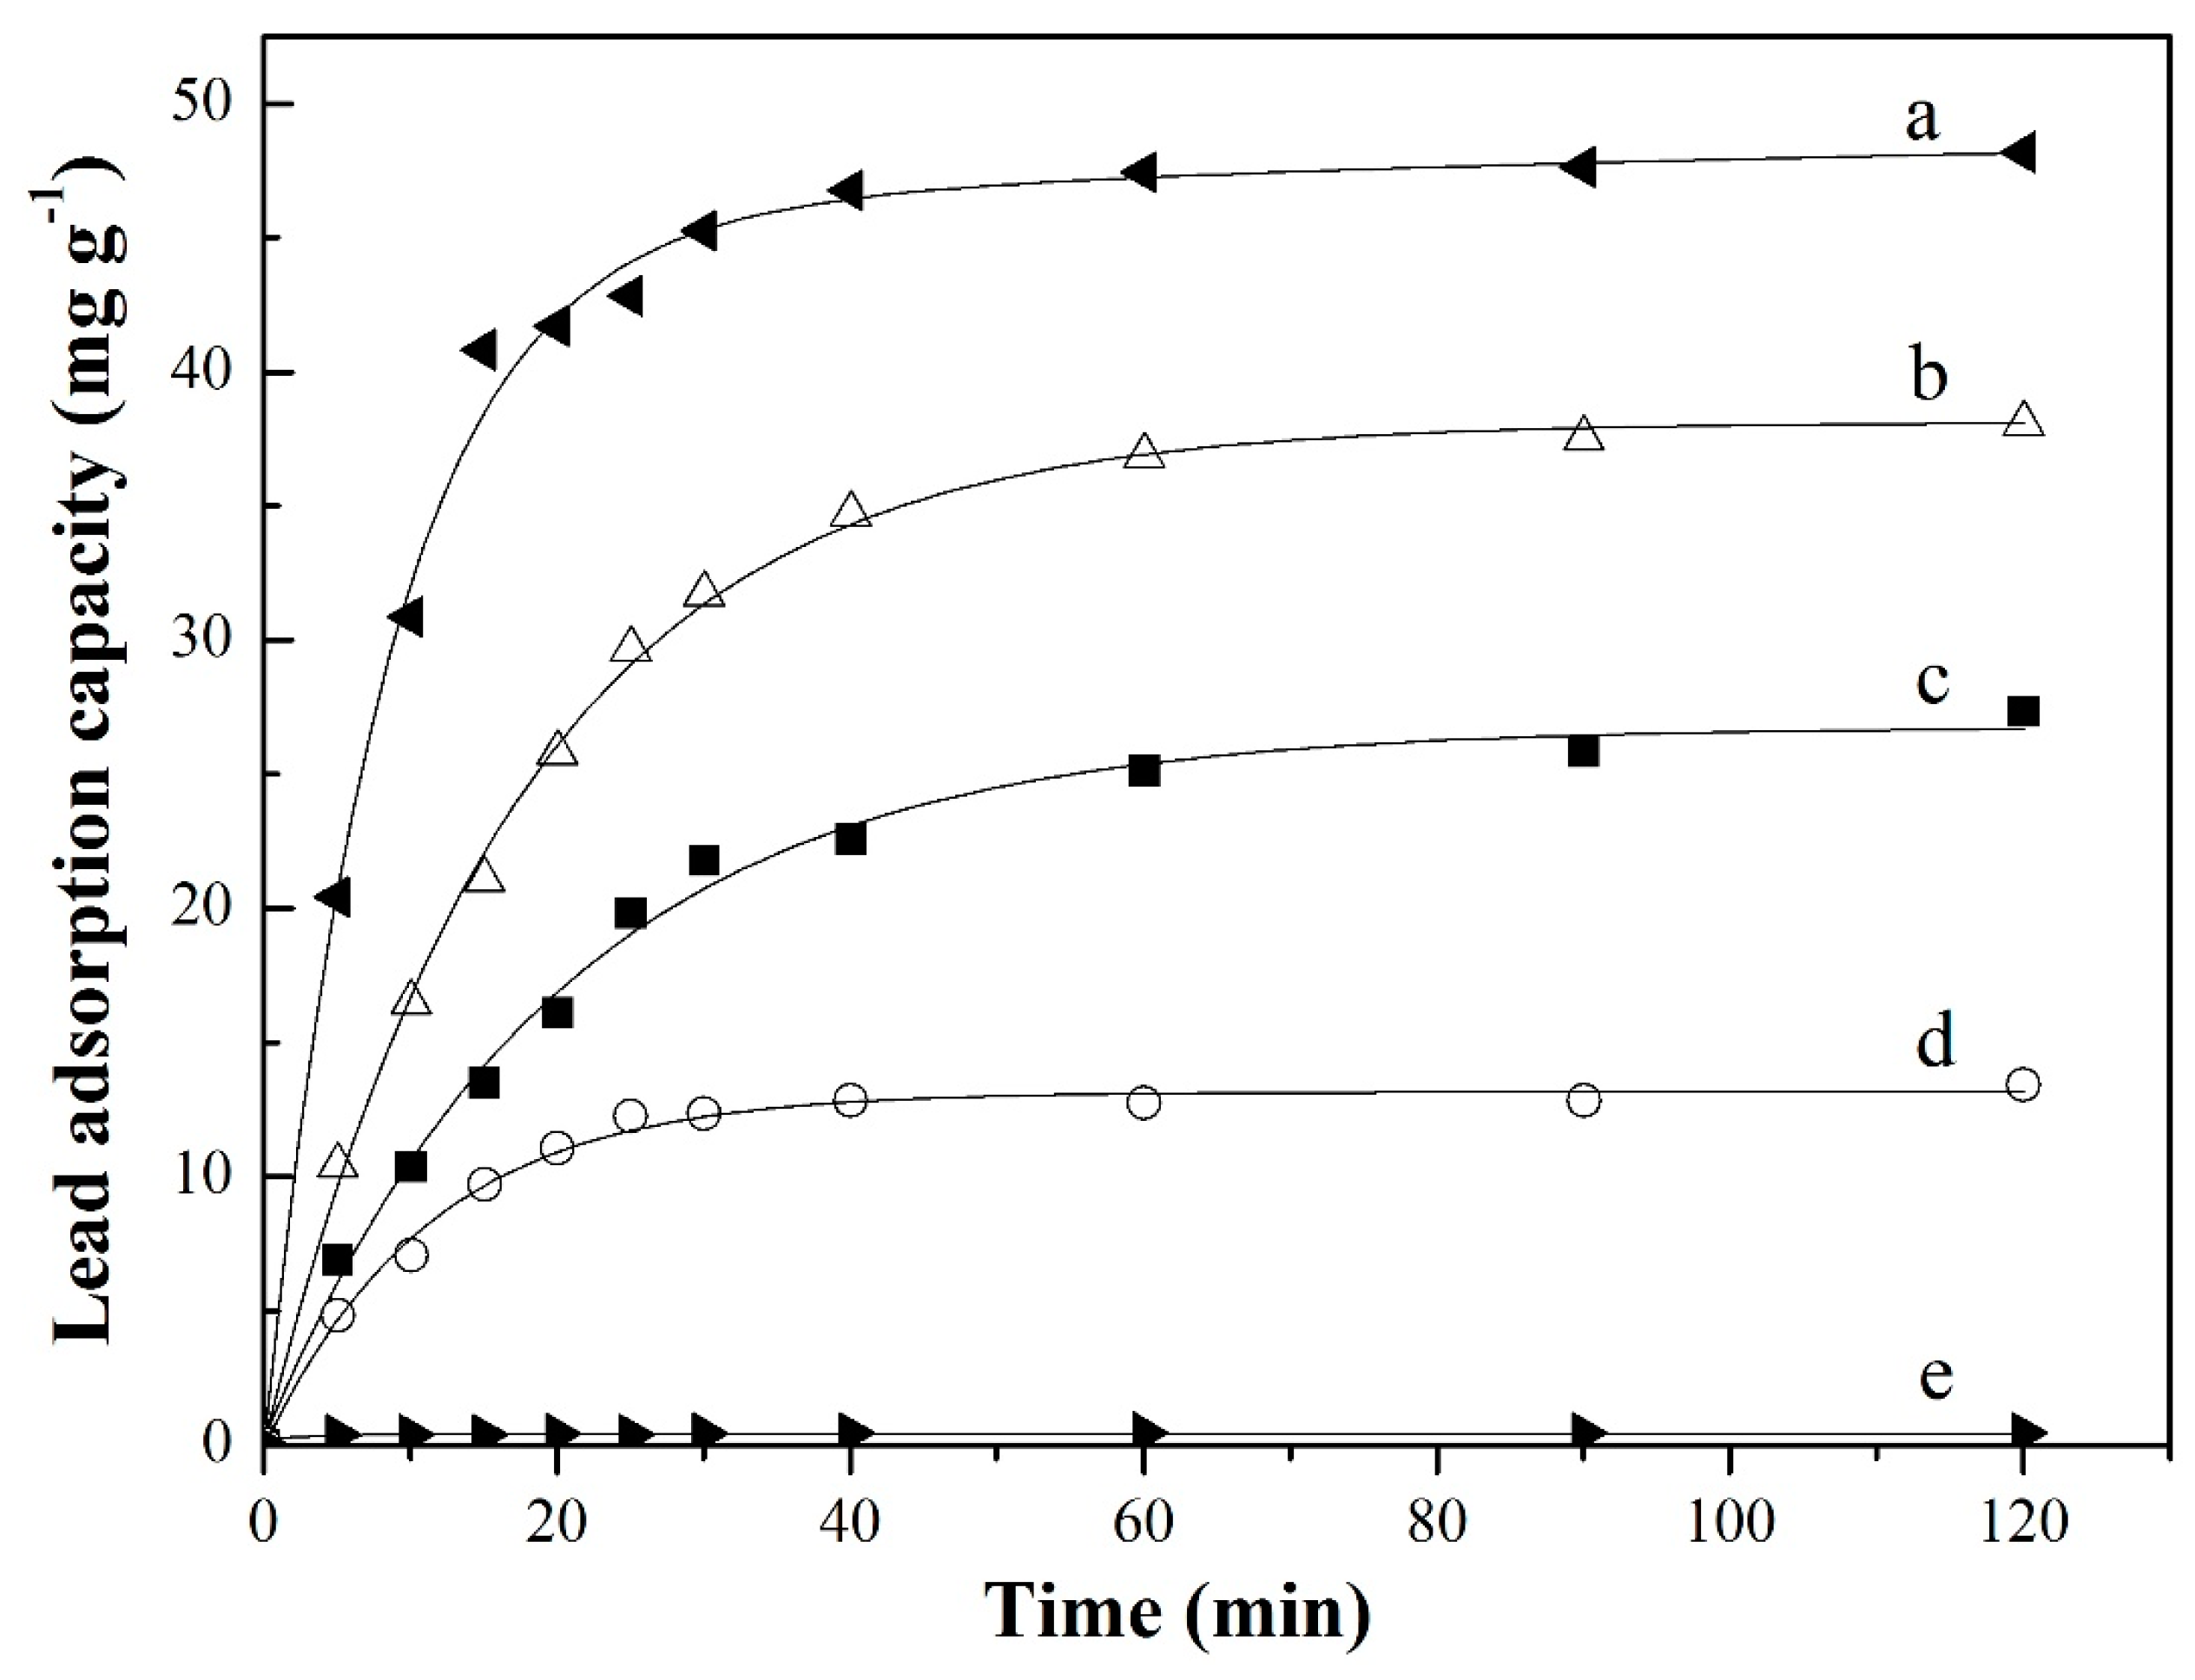
3.3.2. Adsorption Kinetics

The characteristic curves of the initial lead concentration (10−100 mg L−1) versus time ranged in 0−120 min are drawn out and illustrated in Figure 6. Empirical equations were proposed and widely used to describe the sorption kinetics and verify the control mechanism underlying adsorption.
Pseudo-second-order model was used for the clinical fitting of data through the linear form using Equation (10) [48]:
t Q t = 1 k Q e 2 + 1 Q e t
where Q t (mg g−1) and Q e (mg g−1) are the amount of lead ions on CSHW at any time and equilibrium, respectively, and k is the rate constant.
Experimental data were fitted and are depicted in Table 4. It could be observed that the pseudo-second-order model is well-fitted for the experimental results ( R 2 ≥ 0.995). According to the simulated linear equation at the initial lead concentration of 30 mg L−1, Q e was calculated as 14.124 mg g−1. This result is in agreement with the experimental data of sorption capacity from Equation (2).
Evident gaps exist among the experimental adsorption capacities at different initial lead concentrations, which could be attributed to the mass transfer effect. The initial adsorption rate increases with the initial lead concentration before the curves reach the plateau. The rate constant presents an opposite trend, except for the initial concentration at 10 mg L−1. In the batch mode, high lead concentrations provide many lead ions in the aqueous solution, thus increasing the driving force towards the bounding layer on the surface of CSHW; consequently, the influence of diffusion is enhanced, and the adsorption capacity of the adsorbent at equilibrium is strengthened [49]. Nevertheless, the adsorption capacity calculated as 0.42 mg g−1 signified that CSHW slightly affects lead at the low concentrations of 10 mg L−1. Thus, CSHW cannot be used to treat wastewater of heavy metals at low concentration. These analyses revealed that the interaction between lead ions and CSHW may be commanded by a chemical process involving valence bonds through sharing or exchanging of electrons [50].

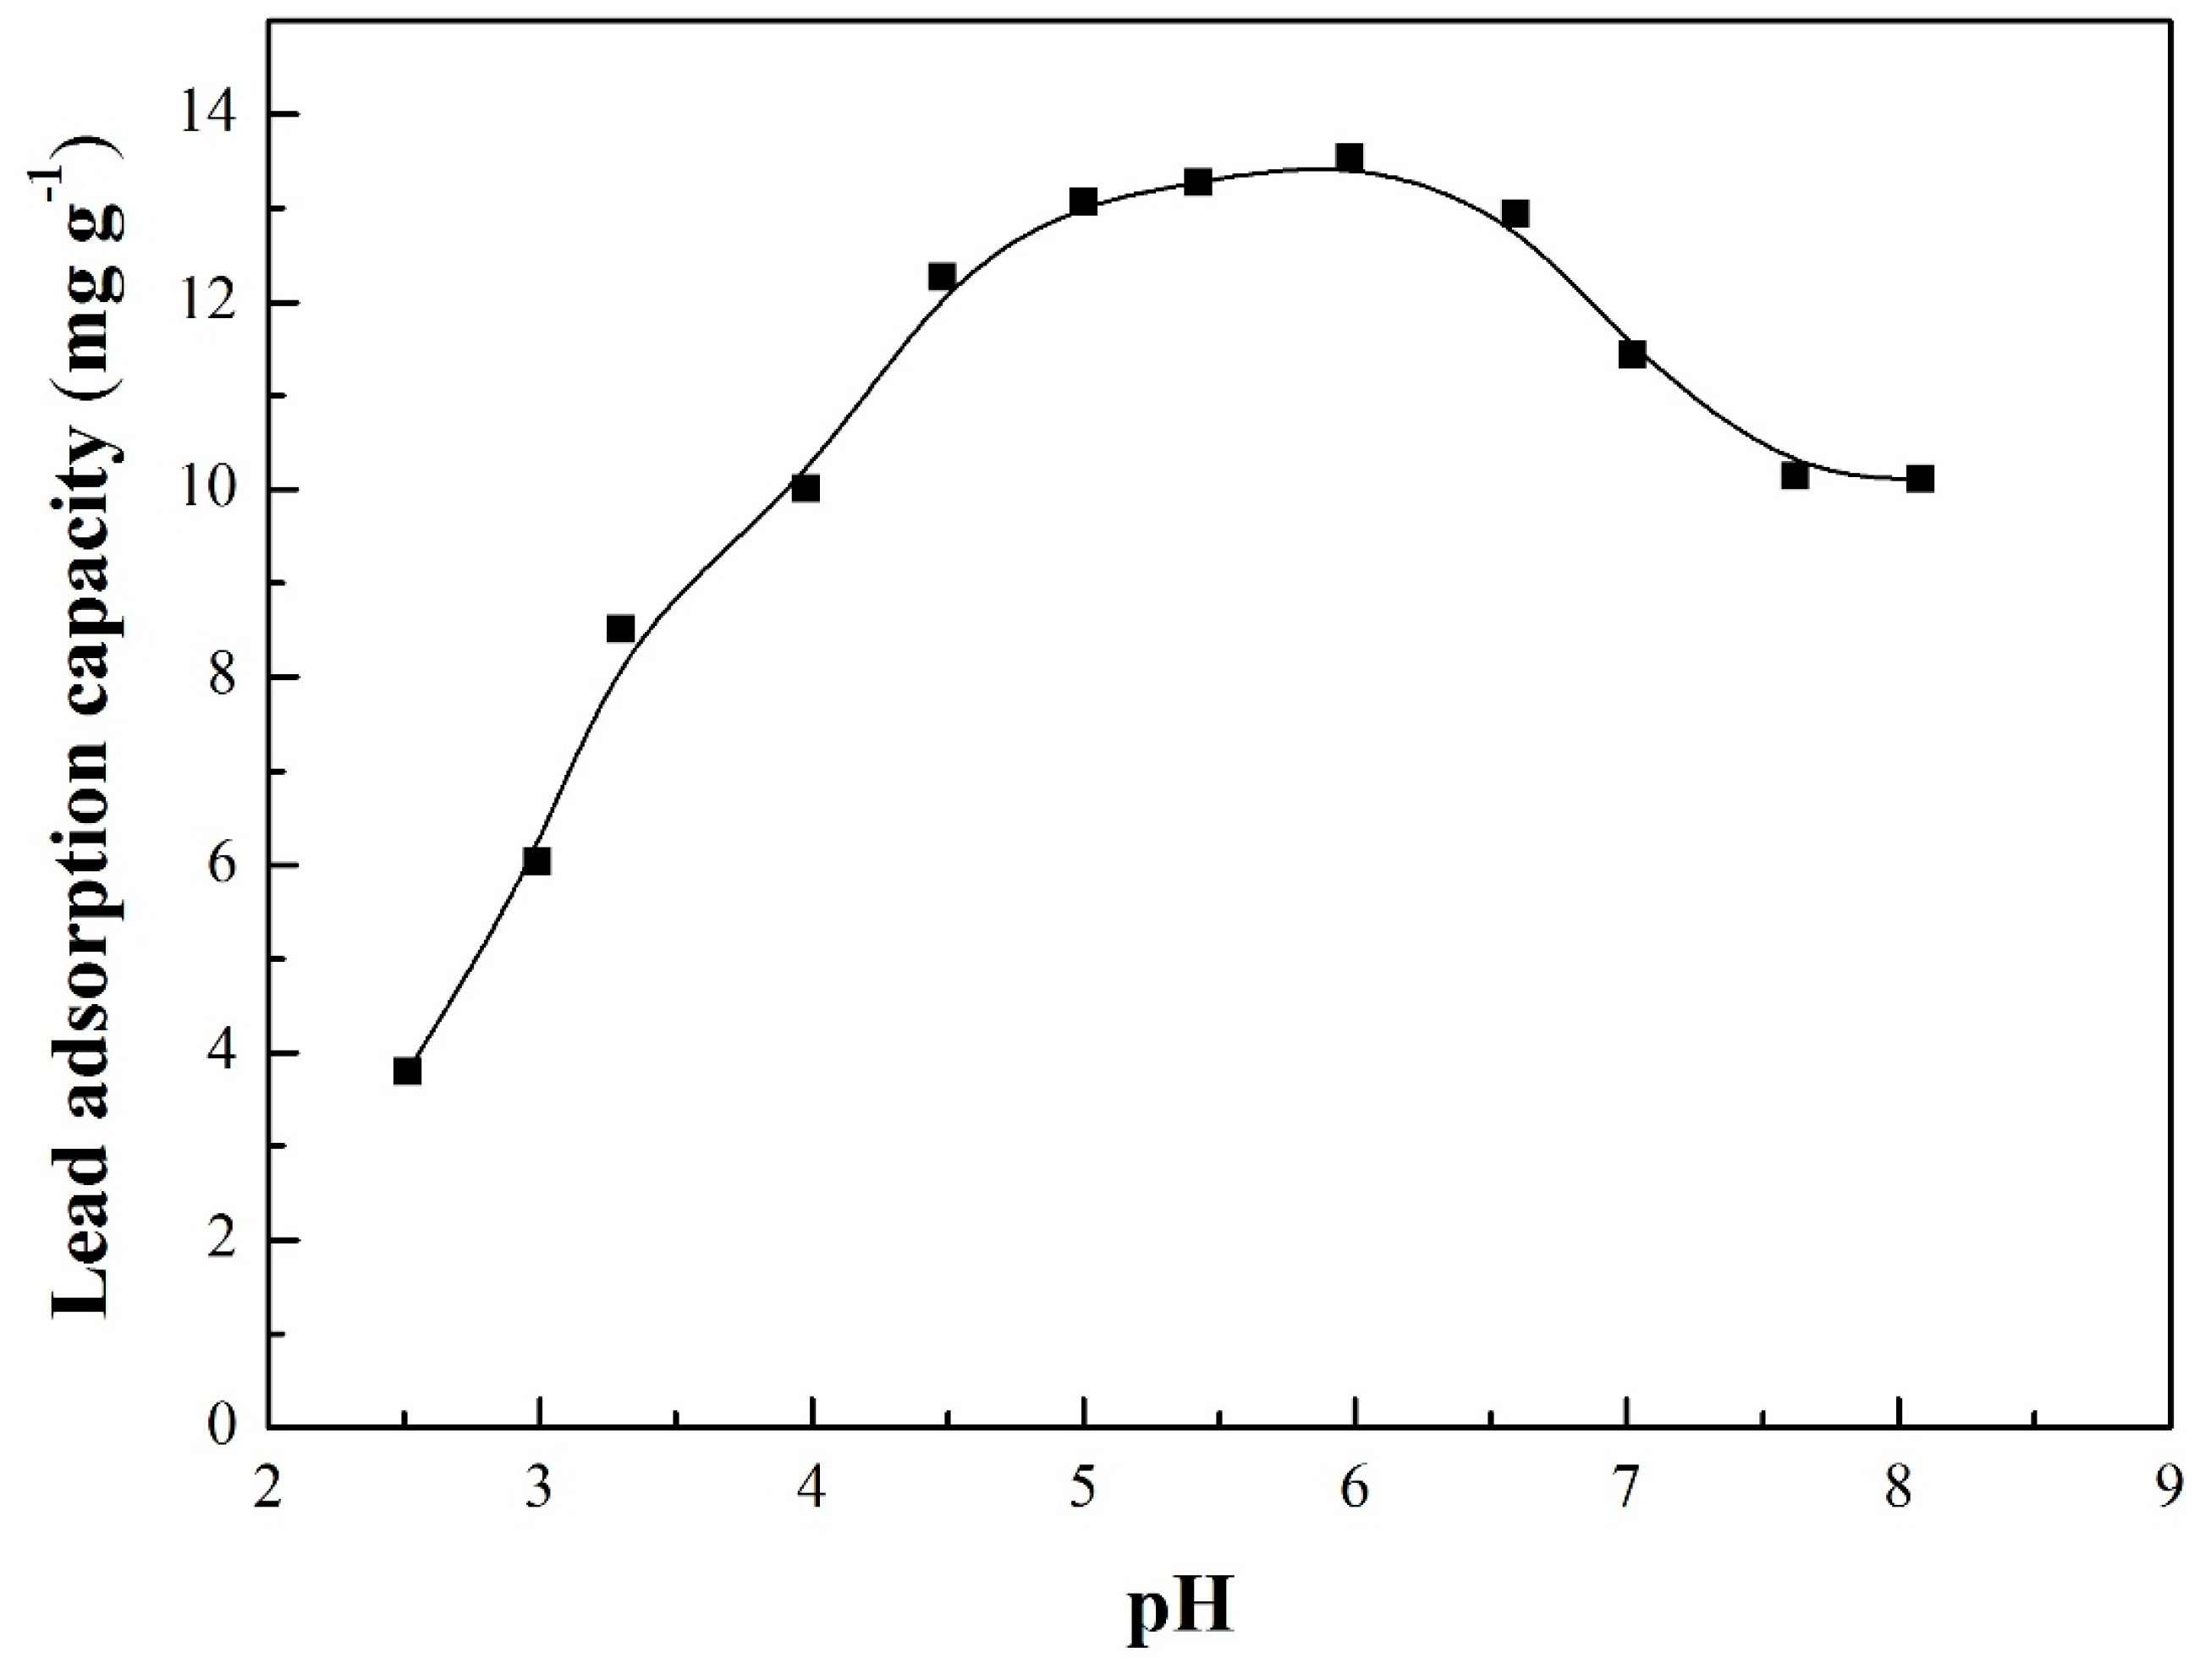
3.4. Adsorption Envelopes

The initial pH of the solution is a crucial parameter during the sorption study of target metals, because the pH controls the surface charge density of the adsorbent and ultimately determines the speciation of metal ions [51]. Therefore, the optimal value for pH (adsorption envelopes) should be ascertained to gain the highest removal effectiveness. In batch tests, sodium and chloride ions were undertaken for pH adjustment, and the influence of their existence on the metallic form is negligible. In order to determine the effect of the initial pH on lead removal, the initial lead concentration of 30 mg L−1 with 2 g L−1 CSHW was applied in the adsorption experiments at 298 K, and the results with different pH values (3–8) are presented and contrasted in Figure 7.
As revealed in Figure 7, the uptake amount of lead on CSHW increases rapidly from 3.80 mg g−1 to 13.55 mg g−1, and shows typical exponential growth with the increasing pH, from 2.51 to 5.98. After reaching a peak value of 13.55 mg g−1, the adsorption capacity decreases gradually to a relatively stable value of 11.77 mg g−1. When the pH is as extremely low as 2.5–3.3, the uptake amount of lead is less than 9 mg g−1, which could be explained by the surface properties of the adsorbent. At low pH, the large accumulated hydrogen ions exhibit strong affinity to CSHW in the solution. Consequently, the adsorbent surfaces are positively charged. When handled with similarly charged lead ions, the increasing shielding effect of the electrostatic repulsion induced by the addition of acid, should be considered in this adsorption state. In addition, the H+ competes with the sorption sites of the lead ions on the CSHW surface, thereby affecting the interface potential and the binding energy of the adsorbed species, and finally reducing the effective adsorption of lead in the solution [52]. With the increasing pH value, the CSHW surface possesses a high negative charge, which attracts lead ions. In general, the initial pH definitely influences the uptake of lead on the adsorbents in the solution.
Analysis on the pH trend during adsorption showed agreement between the pH values at initial and equilibrium states, and the removal efficiency (RE, %) was united and recorded in Table 5. Removal efficiency is clearly related with the pH difference between the equilibrium and initial values. Changes in H+ concentration ( Δ H + , mmol L−1) were calculated to quantitatively reflect this relationship and express the hydrogen ion variation in the solution [53], which was also demonstrated in Table 5.
With the increasing of pH, Δ H + values continue to increase with the increasing pH, except at the pH value of 8.08, which suggested the increasing number of hydrogen ions discharged from the CSHW is on the increase. However, the removal efficiency exhibits a different trend under the same constraints. This changing phenomenon could be explained by the ion exchange and the metal speciation, especially at the falling stage. At pH values ranging from 2.5 to 6.0, the ion exchange is assumed to be the dominant mechanism for lead uptake. In this adsorption scope, high Δ H + values of the solution are beneficial to enhance the ion exchange potential, which results in high removal efficiency.

3.5. Adsorption Mechanism

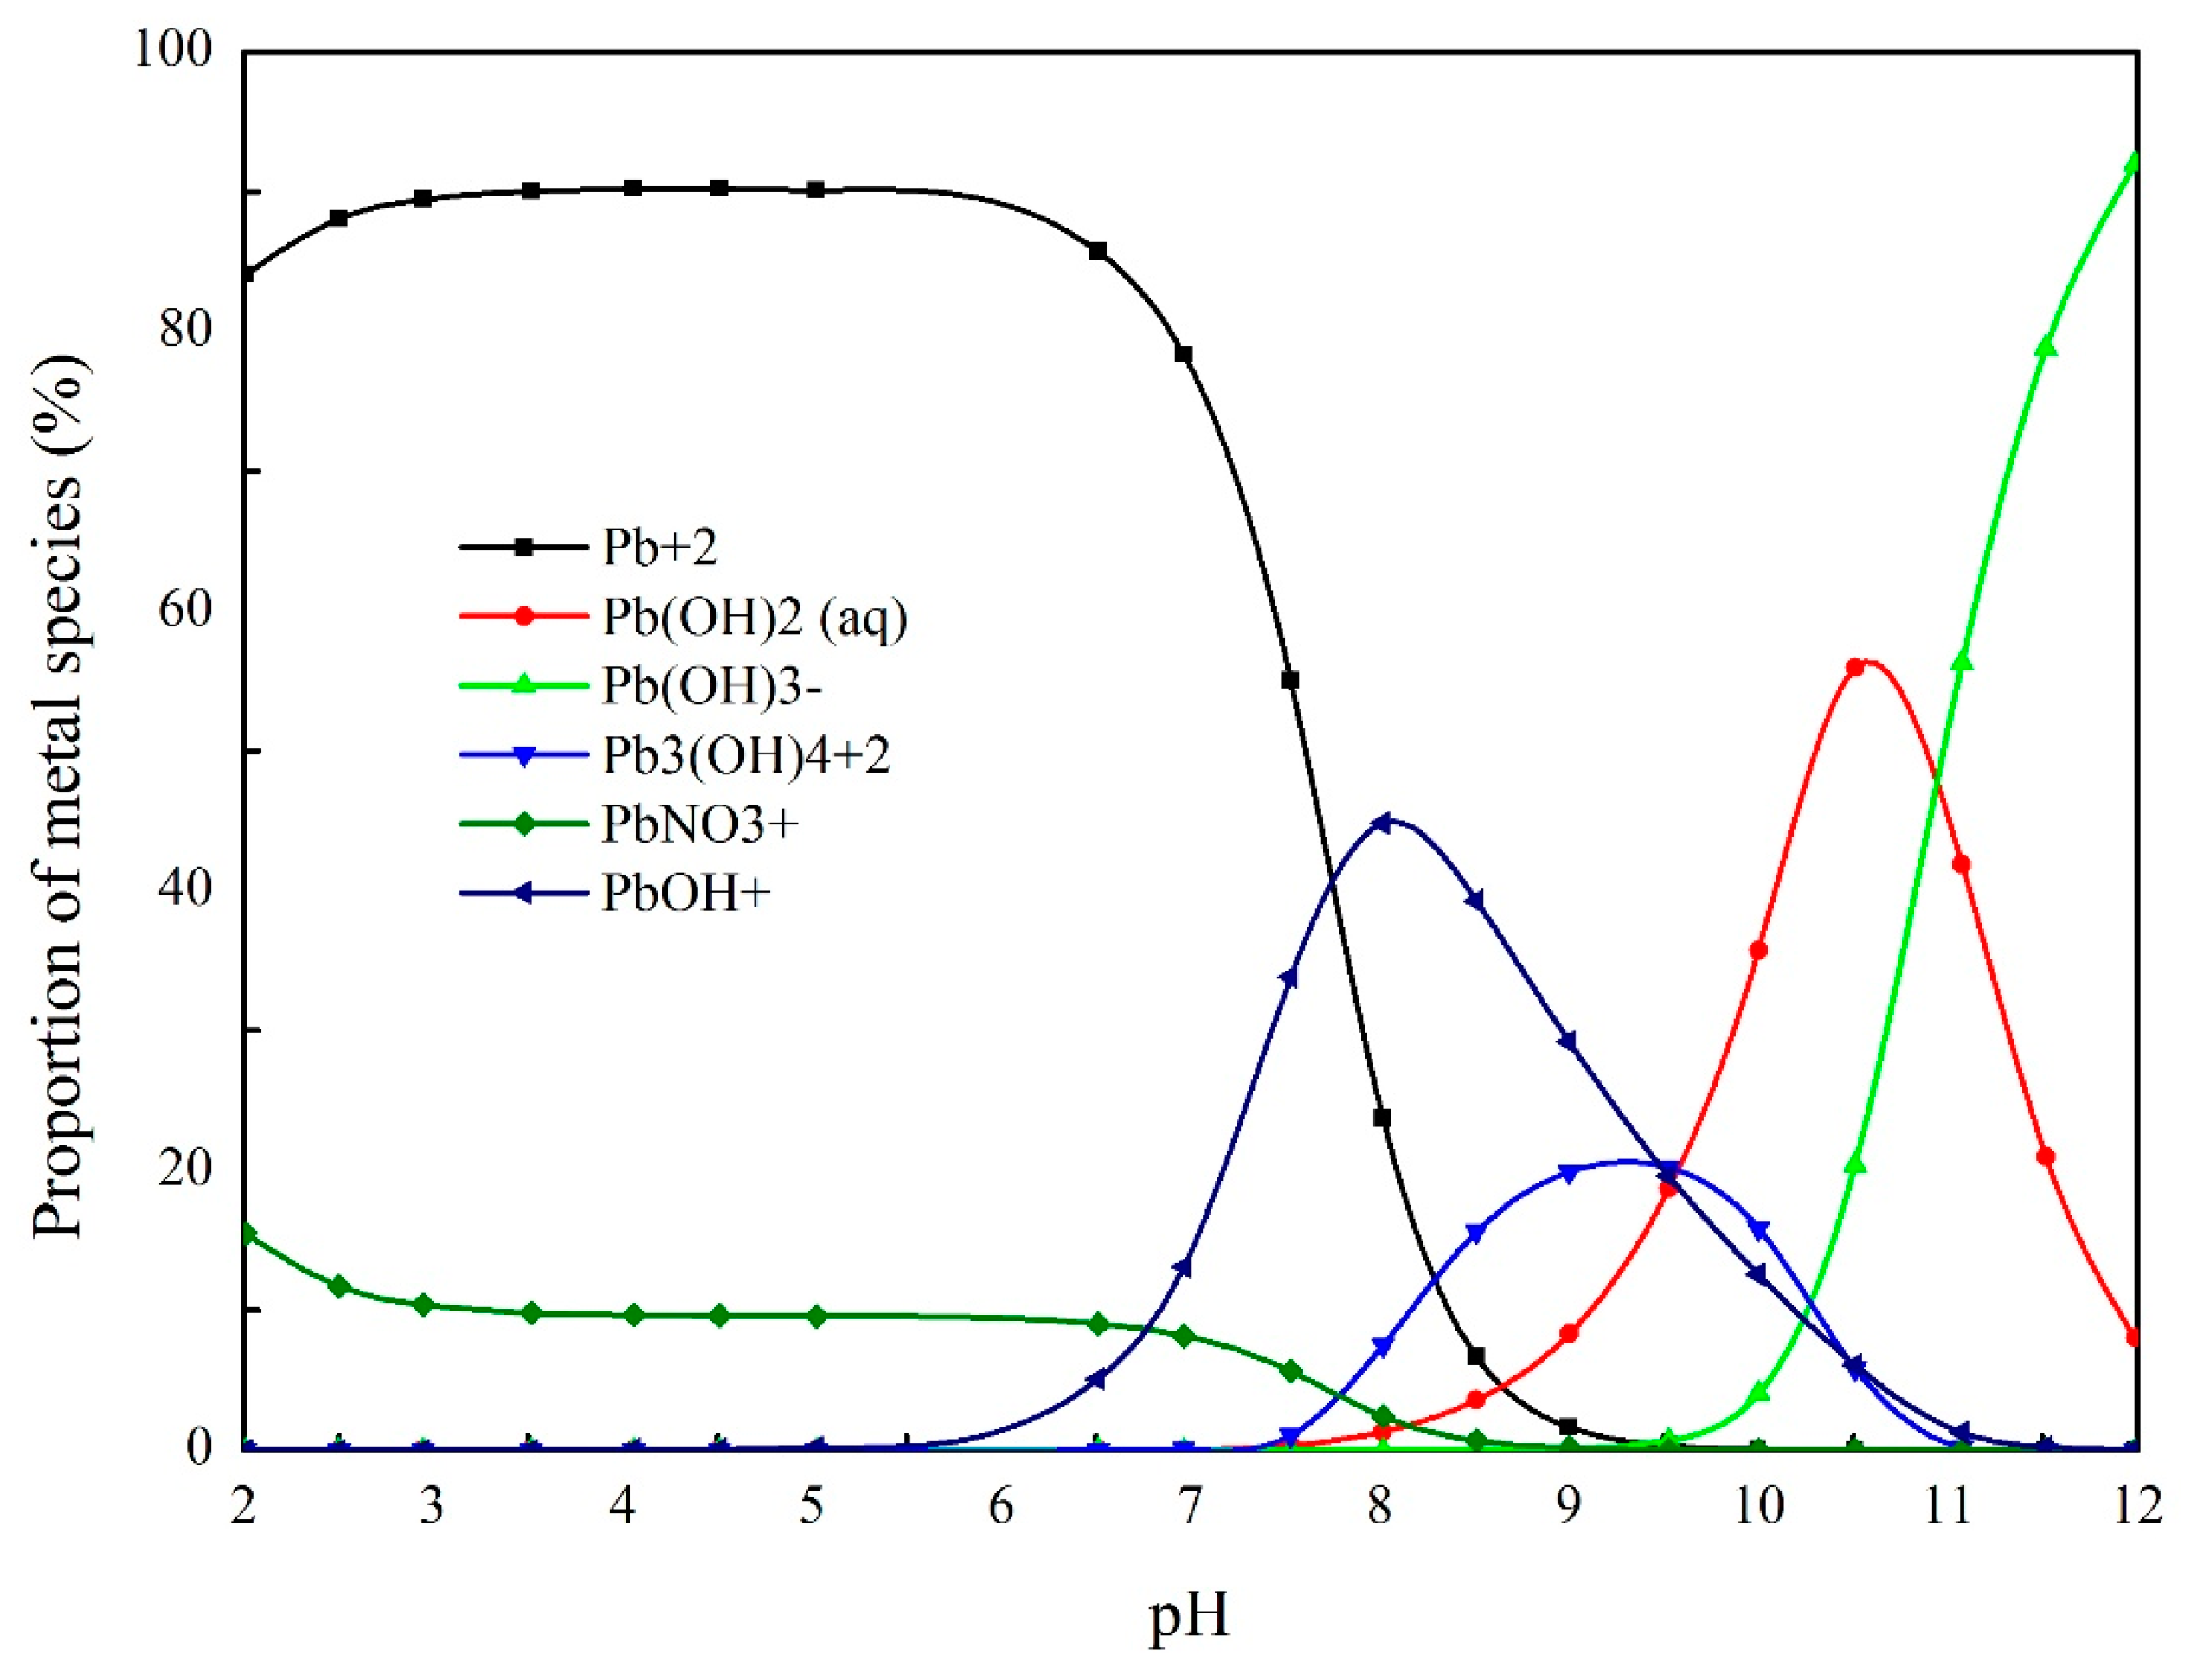
3.5.1. Lead Ion Speciation and Chemical Reaction

Aqueous speciation of lead affected by pH in the NaNO3 system is drawn in Figure 8. In this research, the optimal pH region for lead adsorption is verified as 5.42–5.98 which has been listed in Table 5, and lead occurs only as Pb2+ species from the initial pH value up to 6.0. Therefore, the complexation process of Pb2+ with CaSO4 is bonded, as per the following reaction:
C a S O 4 1 / 2 H 2 O C a 2 + + S O 4 2 + 1 / 2 H 2 O
P b 2 + + S O 4 2 P b S O 4
C a 2 + + S O 4 2 + 2 H 2 O C a S O 4 2 H 2 O
When the initial pH value is raised over 6.0, the Pb2+ species concentration remarkably decreases, and the concentrations of other lead species, such as Pb(OH)+, Pb3(OH)42− and Pb(OH)2 (aq) increase continually within the pH range [54]. This result is in agreement with the previous finding that 6.0 is the theoretical pH of initial precipitation for a 30 mg L−1 lead concentration [55]. More specifically, the lead removal efficiency is restricted due to the increment of hydroxyl products when the pH value exceeds 6.0, which should be responsible for the decreasing tendency of the lead removal efficiency. In a neutral environment, hydrolysis products, such as Pb(OH)+, would occupy the bonding sites, contend sulfate ions with Pb2+ species, and finally increase the soluble lead compounds in the solution.
P b ( O H ) + + S O 4 2 P b ( O H ) S O 4
P b ( O H ) + + H 2 O P b ( O H ) 2 ( a q ) + H +
4 P b S O 4 + 6 O H 3 P b O P b S O 4 H 2 O + 2 H 2 O + 3 S O 4 2
4 P b ( O H ) S O 4 + 2 O H 3 P b O P b S O 4 H 2 O + 2 H 2 O + 3 S O 4 2
In alkaline conditions, the constant production of negative oxygen ion of hydroxyl groups consequently and rapidly increases the amount of lead hydroxide solution [56]. Furthermore, excessive OH possesses strong adhesion in capturing lead complexes, and the final result is characterized as tribasic lead sulfate, which can be reflected in the Equations (14)–(17) [57]. However, this ternary substance can decompose spontaneously due to its inherent volatility, and thus, further influence the stability of adsorption reactions and composition of final products.

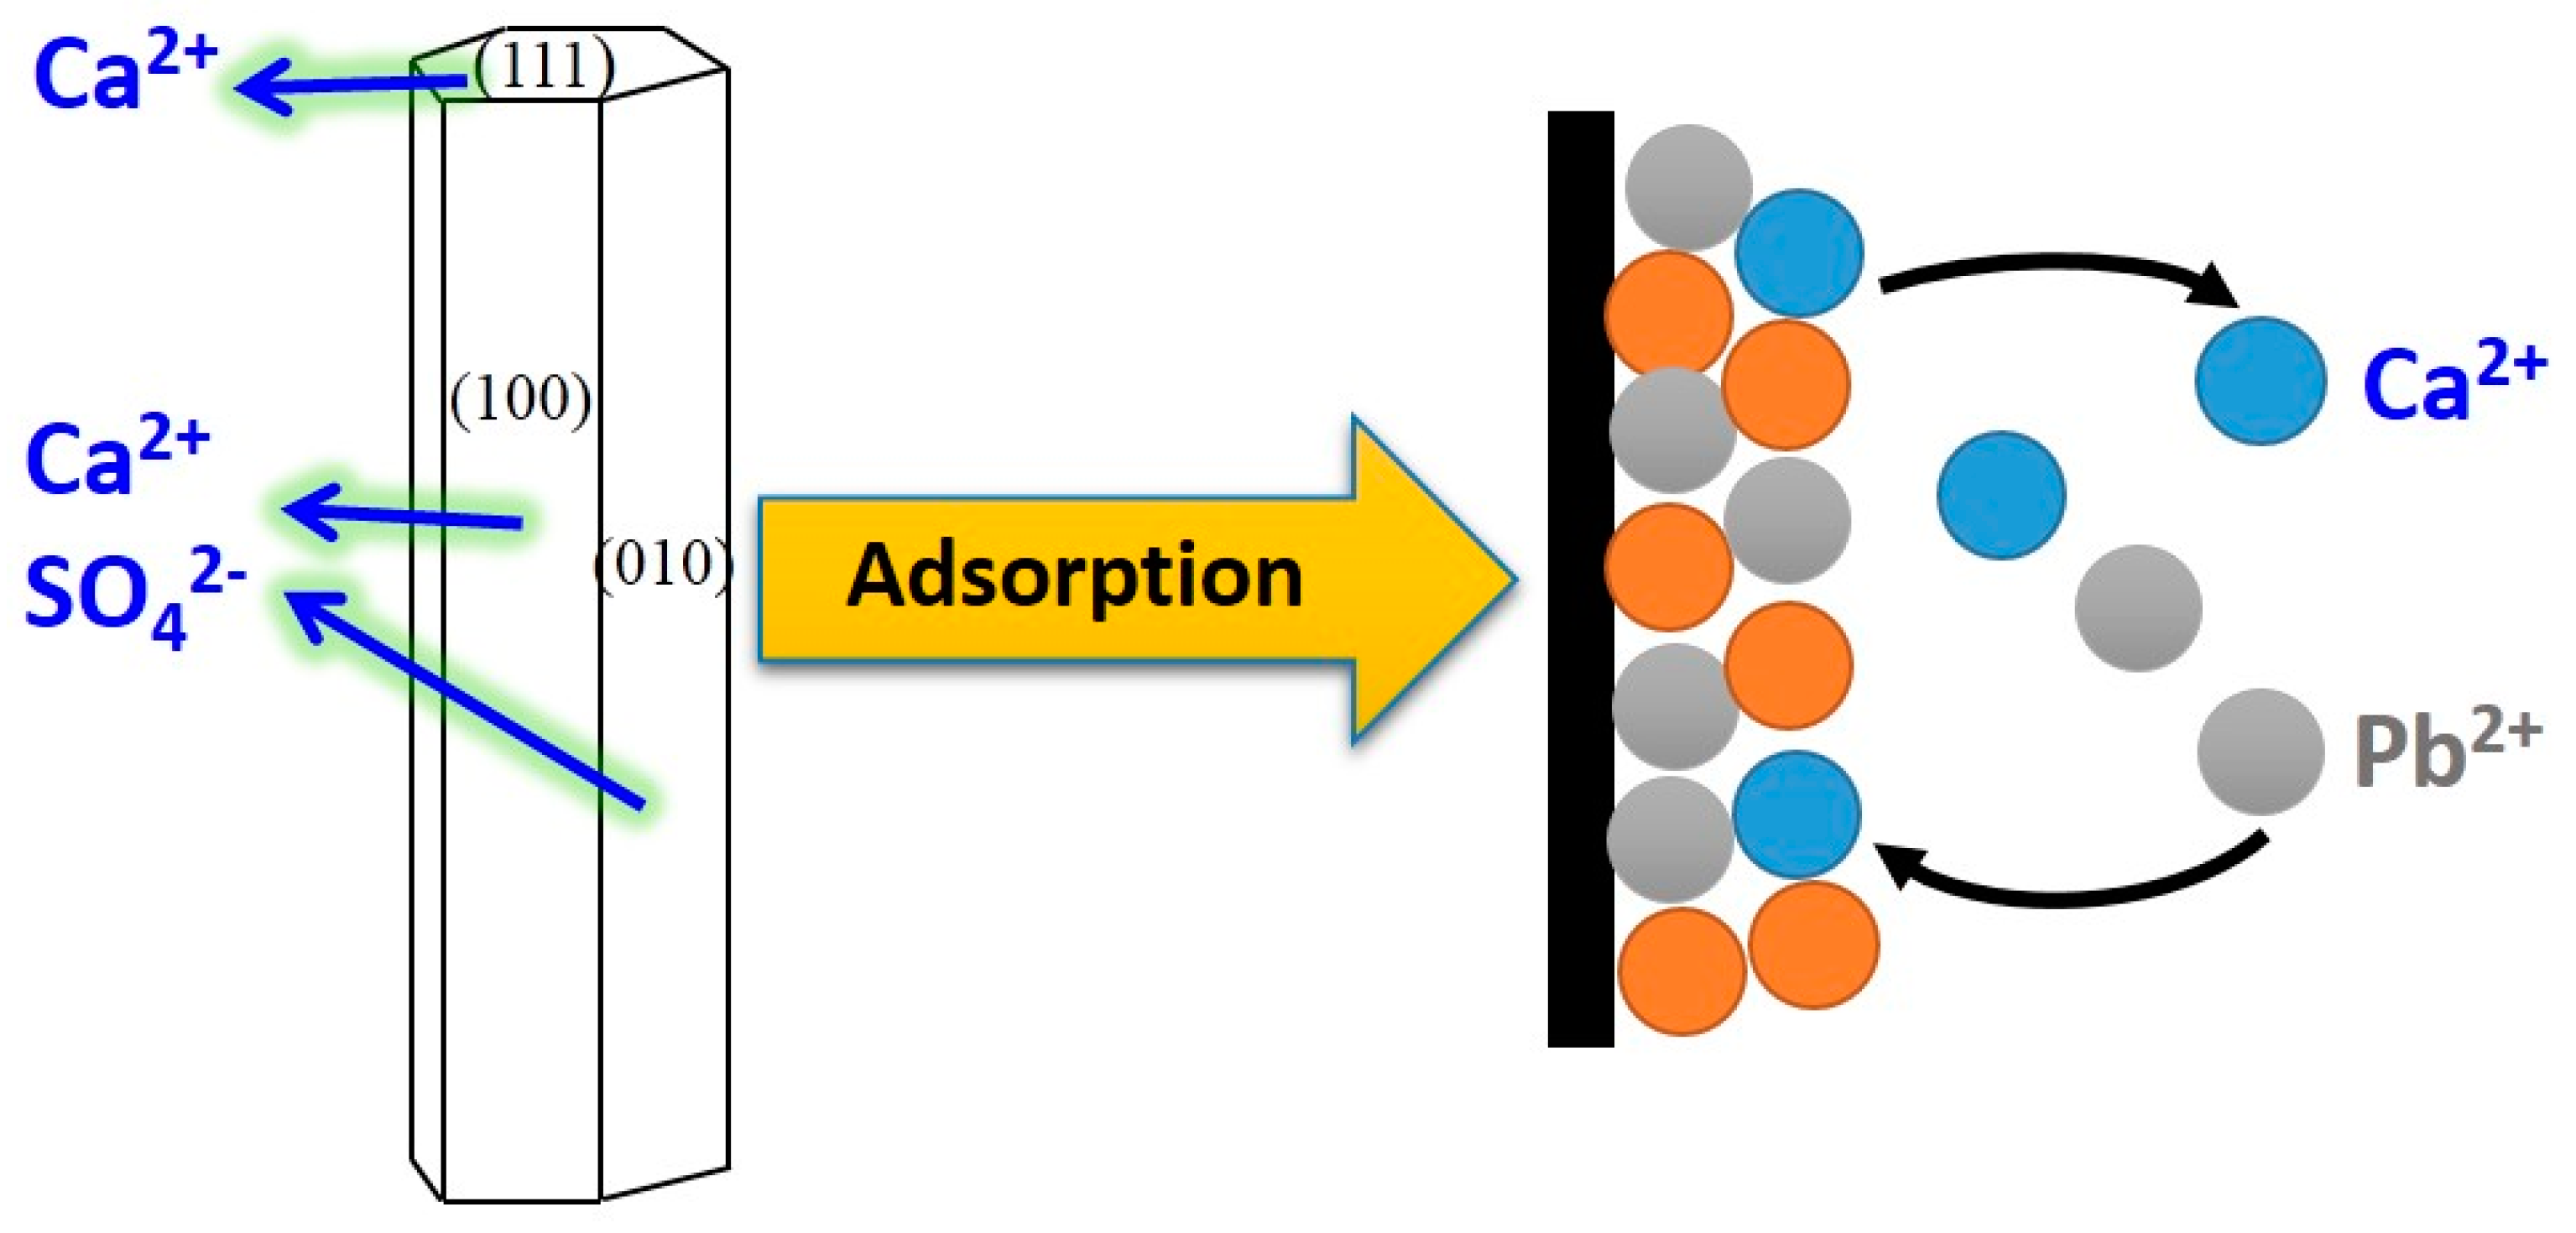
3.5.2. Adsorption Property of Lead Ions on CSHW Surface

The dominant mechanism underlying lead removal by CSHW was proposed as the ion exchange [58], which is closely related with the surface properties of adsorbents. The crystal lattice of CSHW is constructed with [SO4] tetrahedrons and [CaO8] octahedrons in the linear chain style and finally grows into the hexahedron structure, where a 1/2 molecule of water is bound to one sulfate ion by hydrogen bonding [59,60]. The transformation of crystalline lies on the different preferred orientation growths of lattice planes (010), (100), and (111). Finally, the atom density of CSHW is arranged in the depressed sequence of (111) > (100) > (010), which indicated that the facets of (100) and (010) are the main planes for crystal nucleation and growth. On this basis, this finding explains that the larger aspect ratio of CSHW than of FGD gypsum during conversion, as shown in Figure 1.
Figure 9 shows the schematic diagram for the adsorption process of lead ions on the CSHW. Once CSHW adds into the lead-containing wastewater, the lead ions bind to the crystal surface in at least two courses, namely, fast dispersion in the matrix, and progressive complexation with active groups on the surface of adsorbents. Their equilibrium is dependent on the experimental conditions. Actually, characteristic groups in the solution, such as Ca2+ ions, bind to the SO42− ions primarily through the ionic bonds on the CSHW surface. The characteristic structure of CSHW crystals reveals that Ca2+ ions are concentrated on the axial facets of (111), and the SO42− ions are preferentially distributed on the lateral facets of (010) and (100). Besides, the dipole on water molecules can trigger the electrostatic force on the crystals, which consequently results in that the (010) and (100) facets of the CSHW crystal are negatively charged, and are anticipated to combine tightly with the lead ions [60]. When the CSHW contacts the lead matrix, the lead ions occupy the active sites on the (010) and (100) facets to complex with SO42−, which further promotes the dissociation reaction on the surface of CSHW [61]. Furthermore, the dynamic process between Ca2+ and SO42− ions exacerbates their activities and heightens the driving force in the liquid phase. Finally, the CSHW achieves the optimal adsorption for the lead ions on the surface.

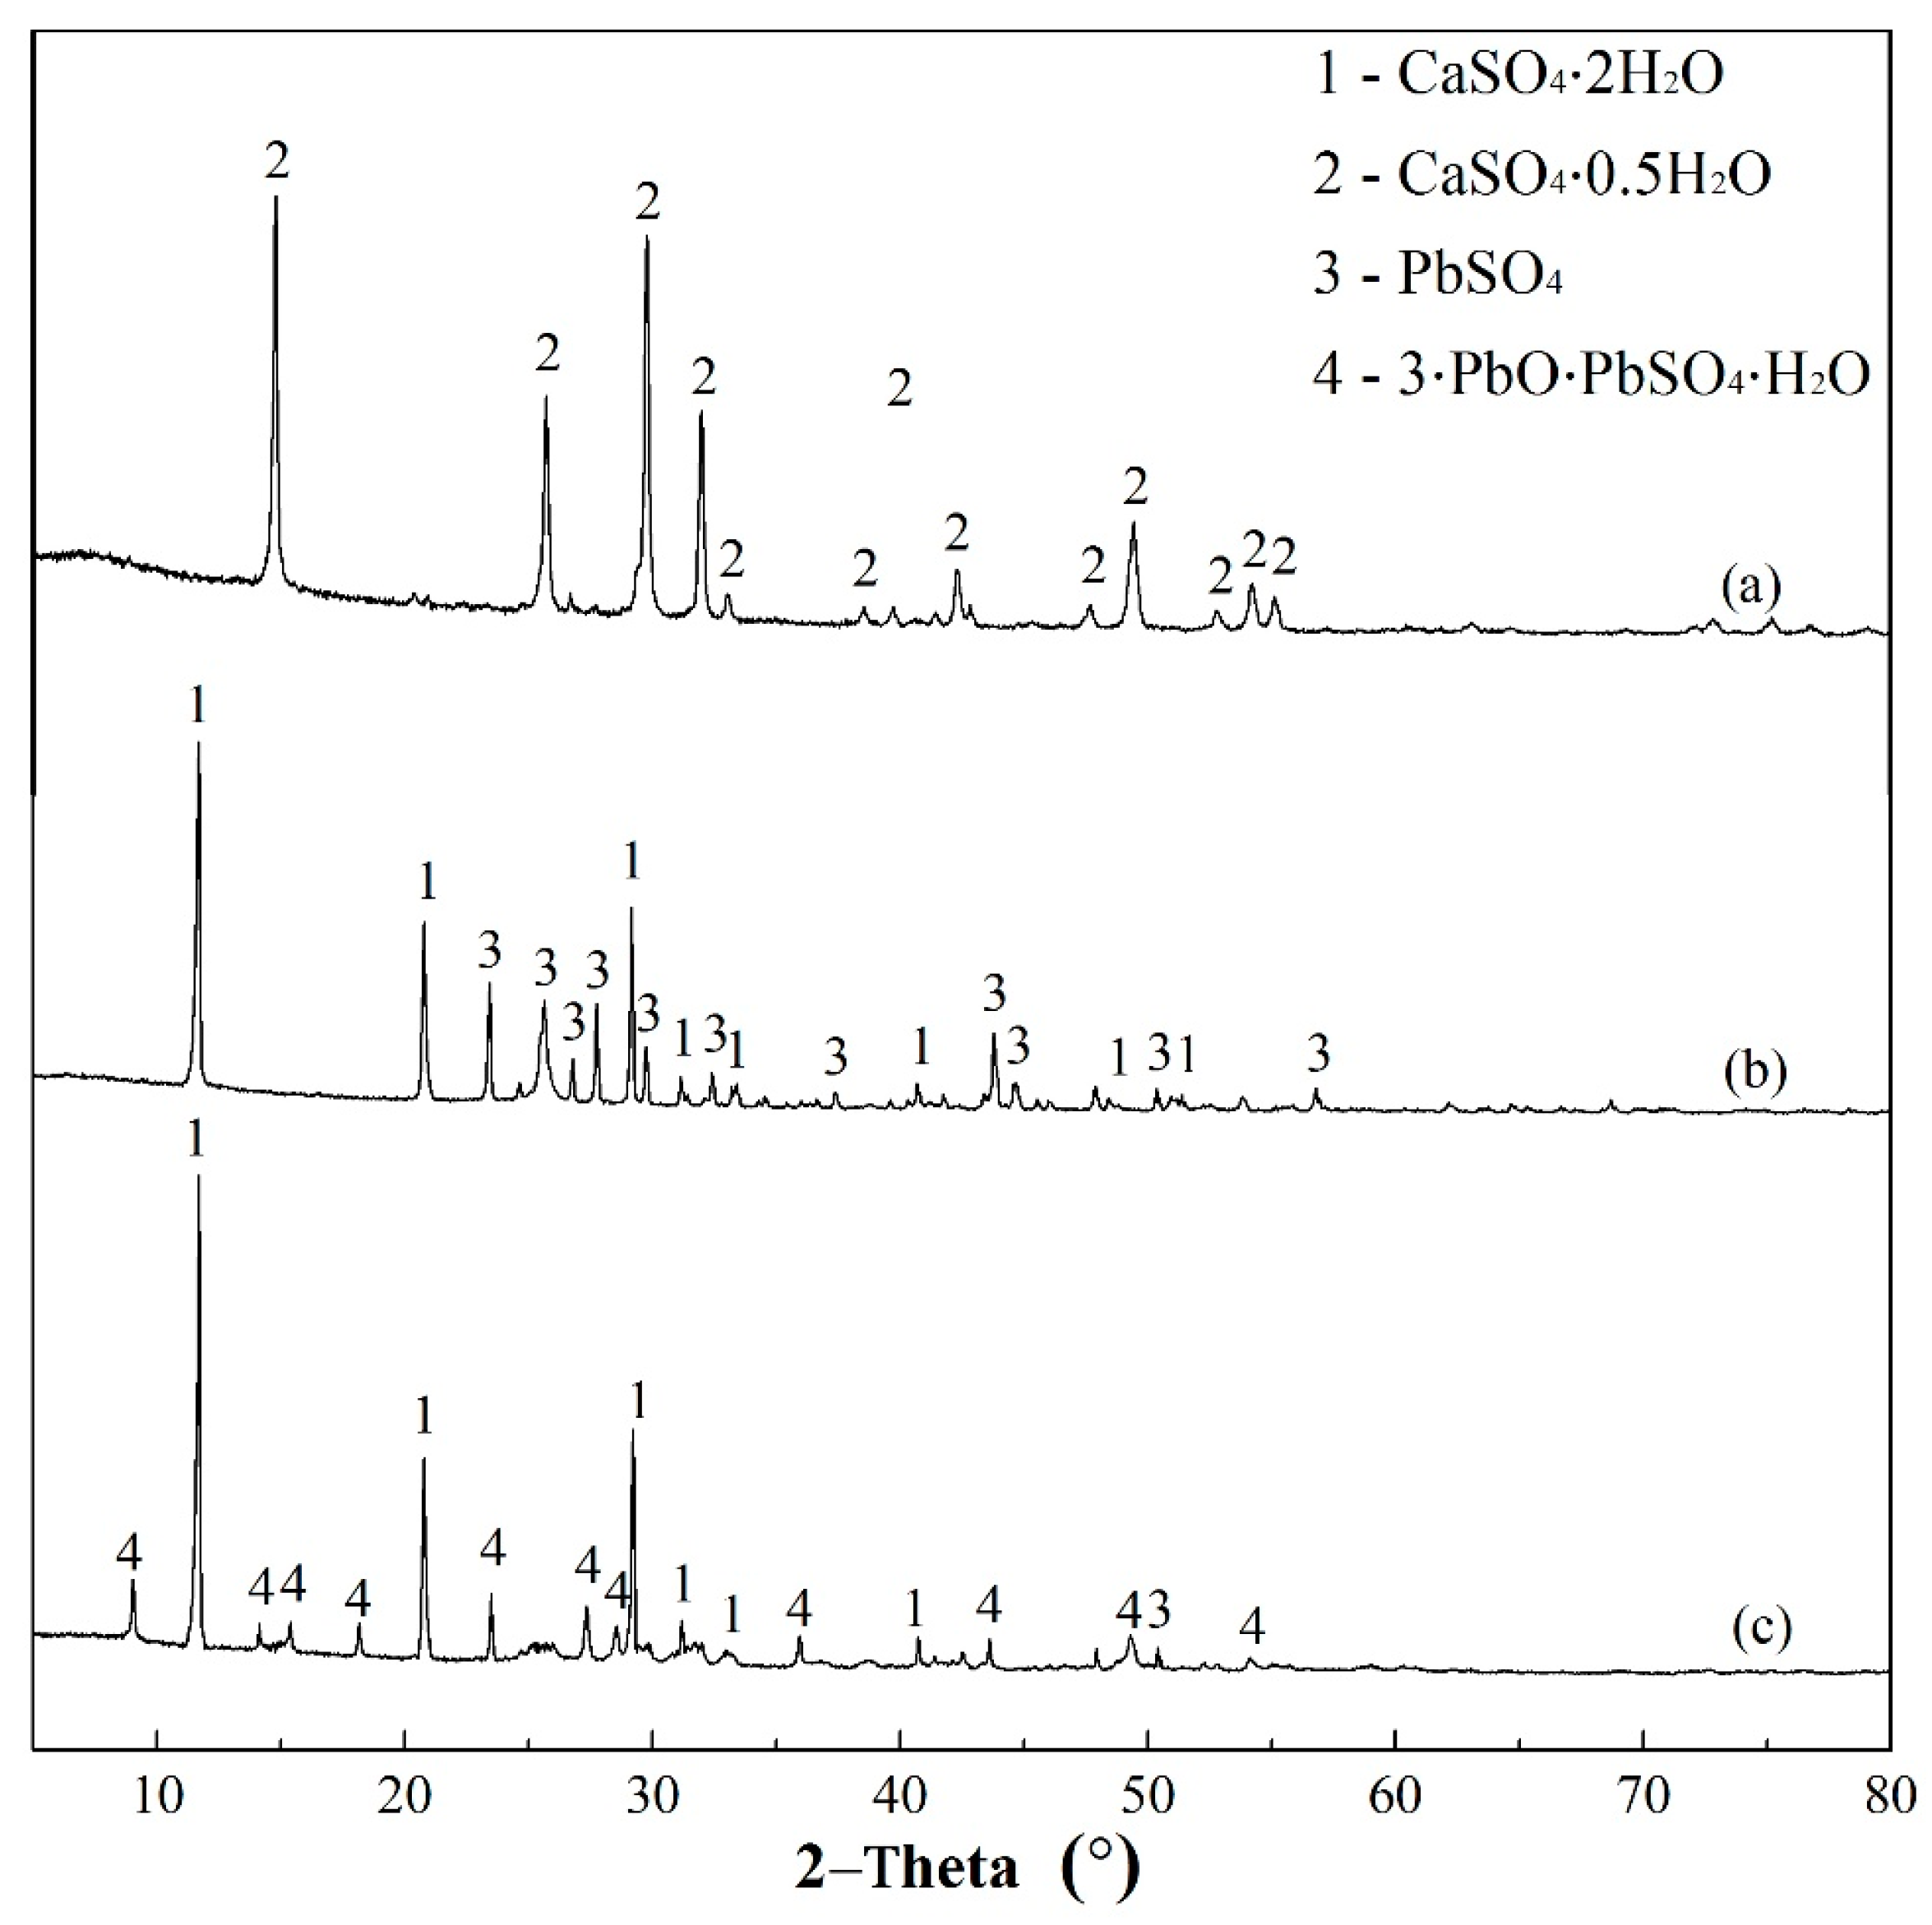
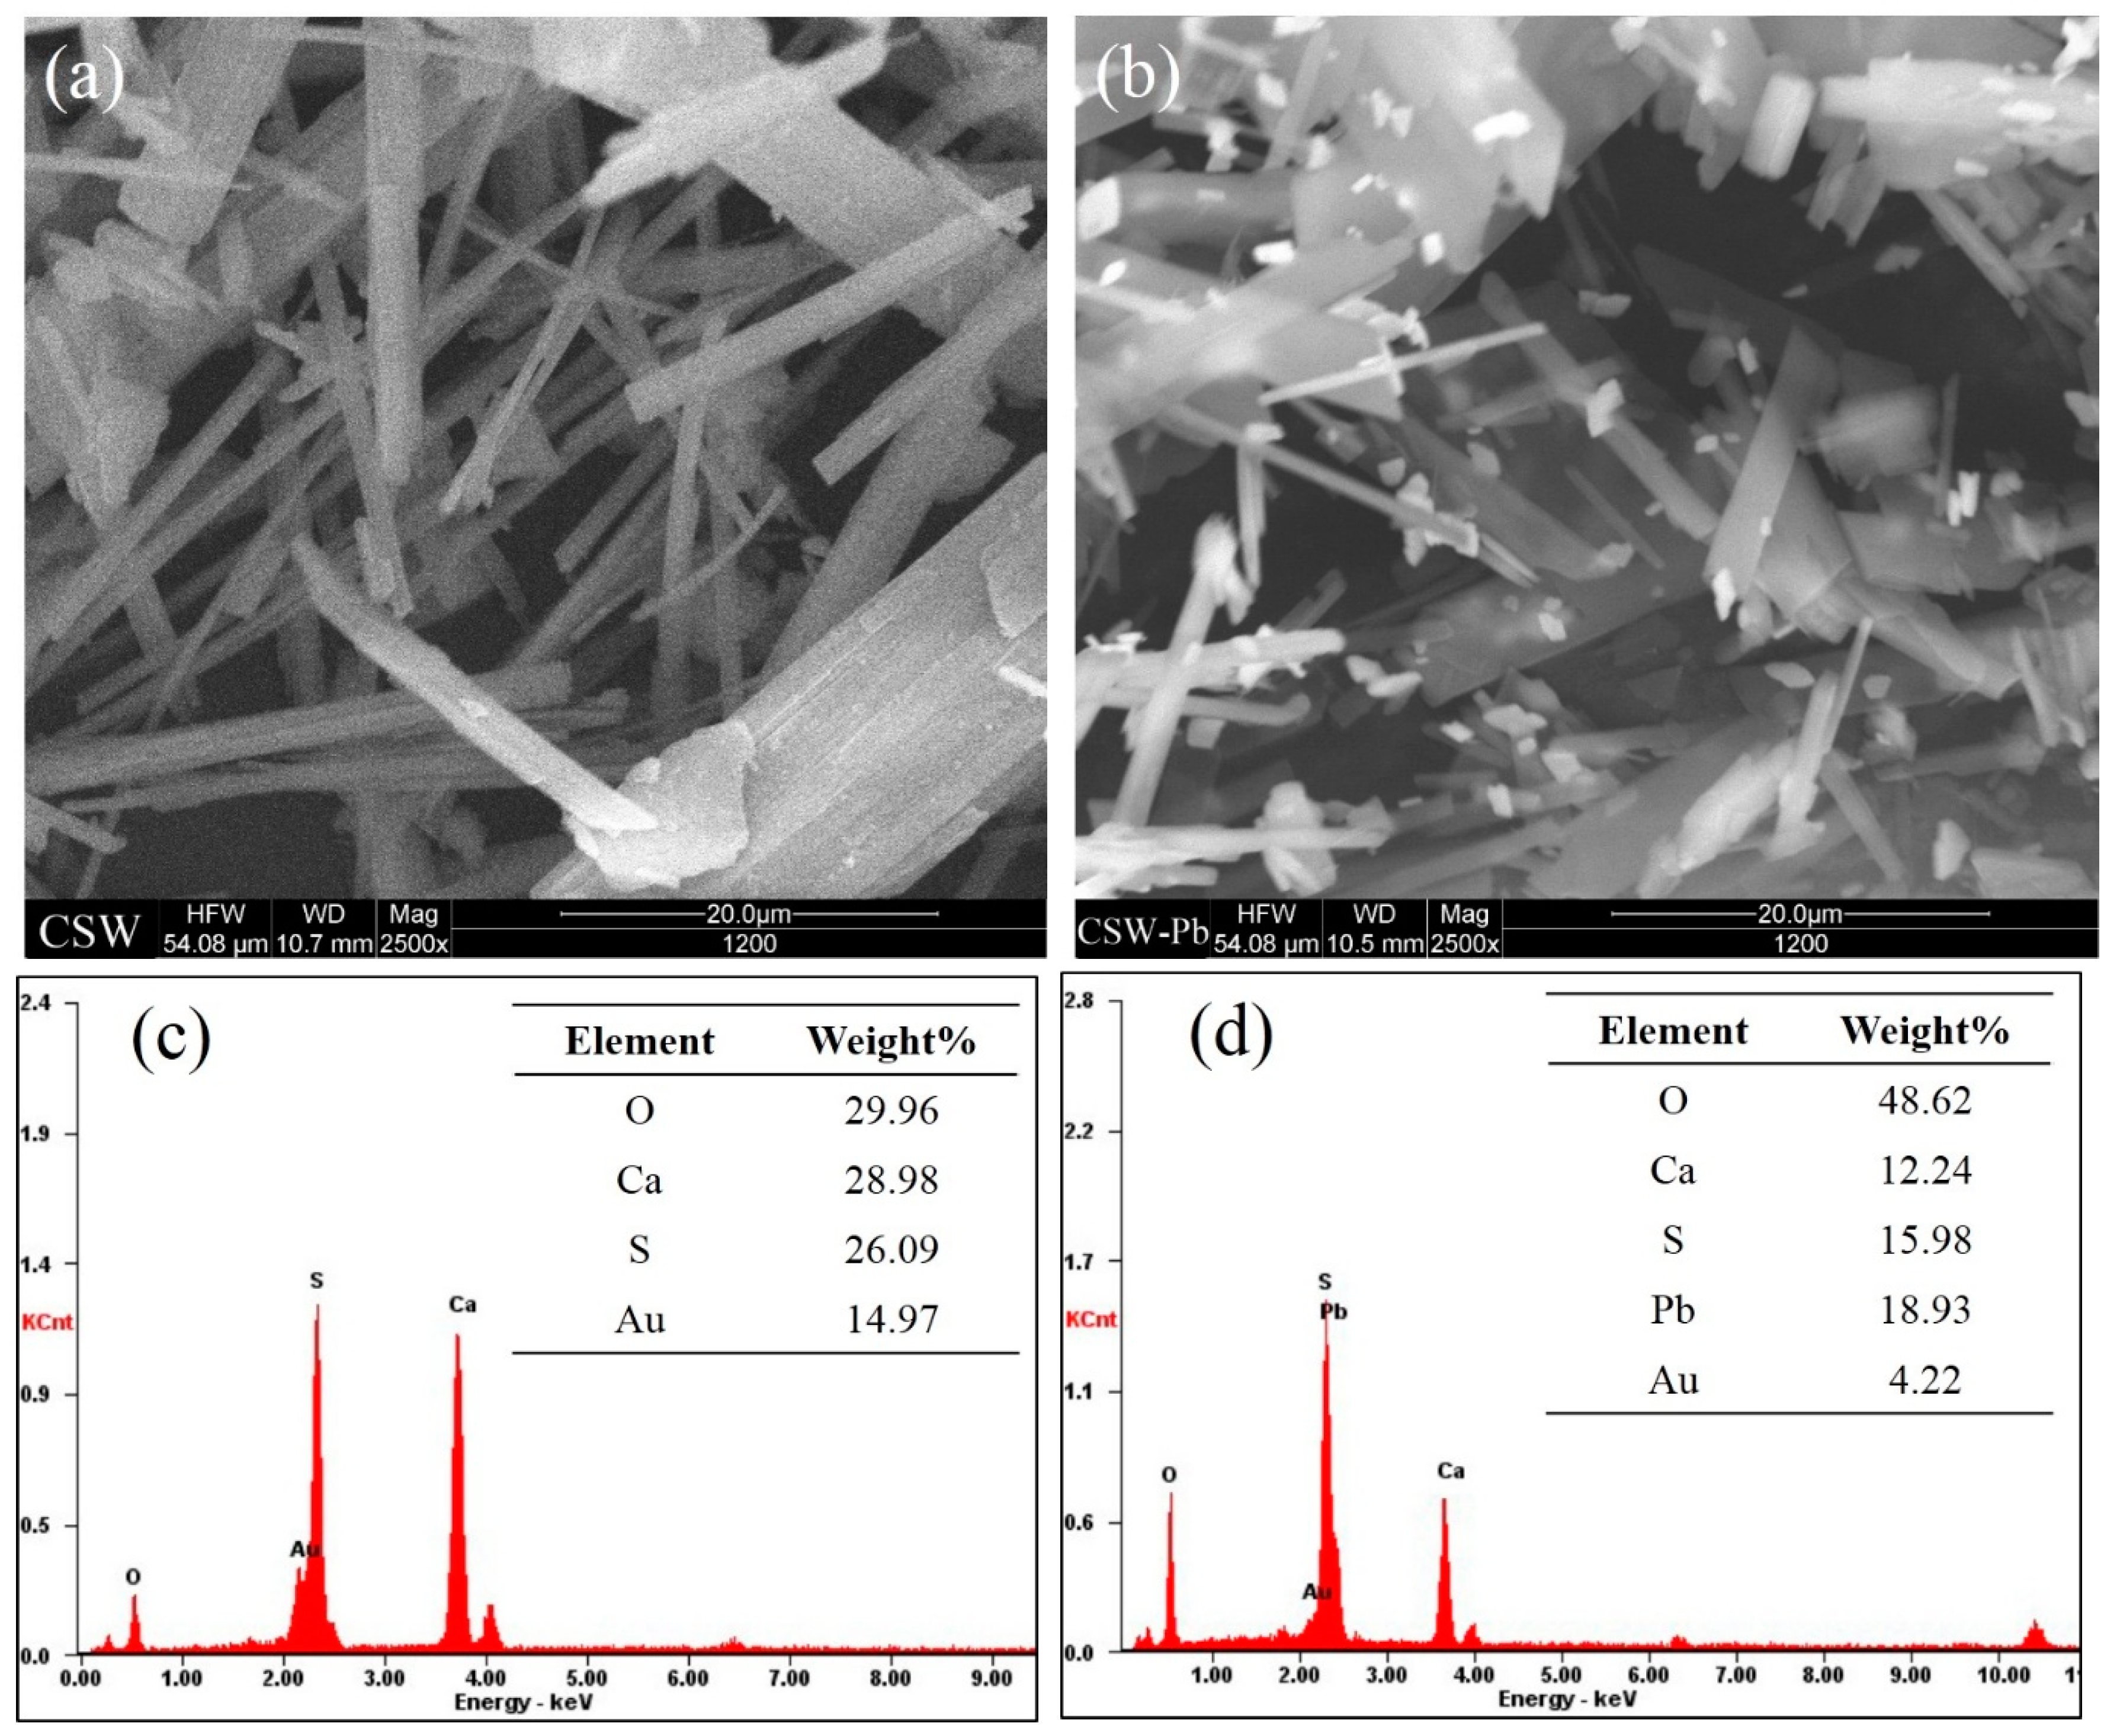
3.5.3. Post Adsorption Characteristics

Figure 10 shows a component comparison of raw adsorbent and post adsorption products acquired at different pH values of 5.42 and 8.08 by using XRD determination. As a gypsum-based product, CSHW is an air hardening inorganic binding material. Once it has come into contact with water, the hydration transition occurs immediately, which can be clearly represented by the chemical reaction in Equation (12). Such a process is thought to be the primary way that the major ingredient of final product transforms from hemihydrate (CSH) to dihydrate (CSD), as seen in Figure 10. The final resultants, PbSO4 and 3PbO PbSO4 H2O, are separately detected at pH values of 5.42 and 8.08, respectively. That is to say, during adsorption, lead uptake capacity relies heavily on the pH of the system. Moreover, the optimum removal behavior is obtained at the initial pH of 5−6.5, which includes the actual value of the solution itself.
The SEM graphs and EDS spectra of CSHW before and after lead ion sorption are shown and contrasted in Figure 11. As shown in Figure 11a, the fresh CSHW is shaped with a kind of whisker morphology, and shows a growth advantage in the lateral facets due to the hydrothermal synthesis derived from FGD gypsum. The SEM image in Figure 11b revealed that a large amount of white substances are generated and dispersed on the surface of CSHW. Ascribed to the hydration reaction, calcium sulfate hemihydrates continued to be consumed and dihydrates were constantly renewed, embodying, specifically, the fact that crystals had obviously thickened up, compared with Figure 11a. The relative content percentages of particles obtained from EDS analysis are presented in Figure 10c,d. The calcium content of the post adsorption product is less than fresh CSHW, which indicated calcium ions are partially replaced and dissolved into the solution. In addition, element Pb appears, and the O content increases after the reaction, which supported the uptake of lead ions on the CSHW surface. Figure 11d shows that the white substance is mainly composed of lead compound with other various amounts of inorganic elements, indicating that complexation process is mainly involved in lead removal. Under relatively high lead concentrations, hydrolysis reactions should be considered because the major reacting process is probably dominated by homogeneous nucleation, which might change the final products [62].

4. Conclusions

In this study, the calcium sulfate hemihydrate whisker was considered as a favorable adsorbent for lead uptake in aqueous solutions. This material was successfully fabricated from FGD gypsum at limited metastable lifetime zones through hydrothermal synthesis. The results provided a method for the resource treatment of this industry byproduct. CSHW exhibited distinct properties, such as crystal structures and surface compositions, which are suitable for lead removal. The most vital parameter for lead ion removal by adsorbents was the initial pH of the adsorption matrix. The pH value highly affected the hydrolysis degree of lead and determined the dominant mechanism. The maximum sorption capacity (48.18 mg g−1) for lead ions on CSHW was observed at the initial lead concentration of 100 mg g−1 without pH adjustment. Langmuir and Temkin isotherms best fit the equilibrium data for lead ions, as compared with the Freundlich isotherm. Results combined with the well-fitted pseudo-second-order model concluded that adsorption was primarily enforced by the ion exchange reaction in essence. The different preferred orientation growth determines the main crystal facets of CSHW. The negatively charged (010) and (100) facets contributed to the lead combination on the surface. PbSO4 was the major species of lead ions adsorbed on the CSHW surface. Furthermore, the excessive SO42− ions easily generated a number of unstable substances under alkaline conditions. In summary, this research paves way for a new research field and allows the broad use of CSHW for the adsorption of lead-containing wastewater.

Acknowledgments

This project is sponsored by the Major Science and Technology Projects of Hubei Province (No. 2013ACA013).

Author Contributions

Xiaoshu Wang, Haobo Hou, and Min Zhou conceived and designed the experiments; Xiaoshu Wang, Lei Wang, Ruiqi Tan and Xing Ke performed the experiments; Xiaoshu Wang, Lei Wang and Yan Wang analyzed the data; Xian Zhou and Junjun Geng contributed reagents/materials/analysis tools; Xiaoshu Wang wrote the paper.

Conflicts of Interest

The authors declare no conflict of interest.

References

  1. Zheng, D.; Lu, H.; Sun, X.; Liu, X.; Han, W.; Wang, L. Reaction mechanism of reductive decomposition of fgd gypsum with anthracite. Thermochim. Acta 2013, 559, 23–31. [Google Scholar] [CrossRef]
  2. Nan, J.; Chen, X.; Wang, X.; Lashari, M.S.; Wang, Y.; Guo, Z.; Du, Z. Effects of applying flue gas desulfurization gypsum and humic acid on soil physicochemical properties and rapeseed yield of a saline-sodic cropland in the eastern coastal area of china. J. Soils Sediments 2015, 16, 38–50. [Google Scholar] [CrossRef]
  3. Telesca, A.; Marroccoli, M.; Calabrese, D.; Valenti, G.L.; Montagnaro, F. Flue gas desulfurization gypsum and coal fly ash as basic components of prefabricated building materials. Waste Manag. 2013, 33, 628–633. [Google Scholar] [CrossRef] [PubMed]
  4. Chandara, C.; Azizli, K.A.; Ahmad, Z.A.; Sakai, E. Use of waste gypsum to replace natural gypsum as set retarders in portland cement. Waste Manag. 2009, 29, 1675–1679. [Google Scholar] [CrossRef] [PubMed]
  5. Guan, B.H.; Yang, L.; Fu, H.L.; Kong, B.; Li, T.Y.; Yang, L.C. Alpha-calcium sulfate hemihydrate preparation from fgd gypsum in recycling mixed salt solutions. Chem. Eng. J. 2011, 174, 296–303. [Google Scholar] [CrossRef]
  6. Pan, Z.Y.; Lou, Y.; Yang, G.Y.; Ni, X.; Chen, M.C.; Xu, H.Z.; Miao, X.G.; Liu, J.L.; Hu, C.F.; Huang, Q. Preparation of calcium sulfate dihydrate and calcium sulfate hemihydrate with controllable crystal morphology by using ethanol additive. Ceram. Int. 2013, 39, 5495–5502. [Google Scholar] [CrossRef]
  7. Hou, S.C.; Xiang, L. Influence of activity of CaSO4·2H2O on hydrothermal formation of CaSO4·0.5H2O whiskers. J. Nanomater. 2013, 2013, 2–7. [Google Scholar] [CrossRef]
  8. Chen, S.; Wang, Q.; Wang, T. Mechanical, damping, and thermal properties of calcium sulfate whisker-filled castor oil-based polyurethane/epoxy ipn composites. J. Reinf. Plast. Compos. 2011, 30, 509–515. [Google Scholar] [CrossRef]
  9. Zhao, W.; Wu, Y.; Xu, J.; Gao, C. Effect of ethylene glycol on hydrothermal formation of calcium sulfate hemihydrate whiskers with high aspect ratios. RSC Adv. 2015, 5, 50544–50548. [Google Scholar] [CrossRef]
  10. Wang, J.; Yang, K.; Lu, S. Preparation and characteristic of novel silicone rubber composites based on organophilic calcium sulfate whisker. High Perform. Polym. 2011, 23, 141–150. [Google Scholar] [CrossRef]
  11. Yuan, W.; Cui, J.; Cai, Y.; Xu, S. A novel surface modification for calcium sulfate whisker used for reinforcement of poly(vinyl chloride). J. Polym. Res. 2015, 22, 173. [Google Scholar] [CrossRef]
  12. Han, Q.; Luo, K.B.; Li, H.P.; Xiang, L. Influence of disodium hydrogen phosphate dodecahydrate on hydrothermal formation of hemihydrate calcium sulfate whiskers. Particuology 2014, 17, 131–135. [Google Scholar] [CrossRef]
  13. Xu, A.-Y.; Li, H.-P.; Luo, K.-B.; Xiang, L. Formation of calcium sulfate whiskers from caco3-bearing desulfurization gypsum. Res. Chem. Intermed. 2011, 37, 449–455. [Google Scholar] [CrossRef]
  14. Eberl, J.J.; Thelen, E.; Heller, H.L. Calcium Sulfate Whisker Fibers and the Method for the Manufacture Thereof. U.S. Patent 3,822,340, 2 July 1974. [Google Scholar]
  15. Eberl, J.J.; Thelen, E.; Heller, H.L. Method for the Manufacture of Coated Calcium Sulfate Whisker Fibers. U.S. Patent 3,961,105, 1 June 1976. [Google Scholar]
  16. Jiang, G.; Wang, H.; Chen, Q.; Zhang, X.; Wu, Z.; Guan, B. Preparation of alpha-calcium sulfate hemihydrate from fgd gypsum in chloride-free ca(no3)(2) solution under mild conditions. Fuel 2016, 174, 235–241. [Google Scholar] [CrossRef]
  17. Mao, X.; Song, X.; Lu, G.; Sun, Y.; Xu, Y.; Yu, J. Control of crystal morphology and size of calcium sulfate whiskers in aqueous hcl solutions by additives: Experimental and molecular dynamics simulation studies. Ind. Eng. Chem. Res. 2015, 54, 4781–4787. [Google Scholar] [CrossRef]
  18. Wang, J.; Tang, L.; Wu, D.; Guo, X.; Hao, W. Application of modified calcium sulfate whisker in methyl vinyl silicone rubber composites. Polym. Polym. Compos. 2012, 20, 453–461. [Google Scholar]
  19. Bradl, H.B. Adsorption of heavy metal ions on soils and soils constituents. J. Colloid Interface Sci. 2004, 277, 1–18. [Google Scholar] [CrossRef] [PubMed]
  20. Sabela, M.I.; Kunene, K.; Kanchi, S.; Xhakaza, N.M.; Bathinapatla, A.; Mdluli, P.; Sharma, D.; Bisetty, K. Removal of copper (ii) from wastewater using green vegetable waste derived activated carbon: An approach to equilibrium and kinetic study. Arab. J. Chem. 2016, in press. [Google Scholar] [CrossRef]
  21. Cross, J.B.; Hays, J.M.; Schmidt, R.; Katdare, V.Y. Removal of Heavy Metals from Hydrocarbon Gases. U.S. Patent 7,901,486, 8 March 2011. [Google Scholar]
  22. Samad, A.; Mai, F.; Katsumata, H.; Suzuki, T.; Kaneco, S. Photocatalytic oxidation and simultaneous removal of arsenite with cuo/zno photocatalyst. J. Photochem. Photobiol. A Chem. 2016, 325, 97–103. [Google Scholar] [CrossRef]
  23. Esalah, J.O.; Weber, M.E.; Vera, J.H. Removal of lead, cadmium and zinc from aqueous solutions by precipitation with sodium di-(n-octyl) phosphinate. Can. J. Chem. Eng. 2000, 78, 948–954. [Google Scholar] [CrossRef]
  24. Mishra, P.C.; Patel, R.K. Removal of lead and zinc ions from water by low cost adsorbents. J. Hazard. Mater. 2009, 168, 319–325. [Google Scholar] [CrossRef] [PubMed]
  25. Dong, S.; Sun, Y.; Wu, J.; Wu, B.; Creamer, A.E.; Gao, B. Graphene oxide as filter media to remove levofloxacin and lead from aqueous solution. Chemosphere 2015, 150, 759–764. [Google Scholar] [CrossRef] [PubMed]
  26. Dakiky, M.; Khamis, M.; Manassra, A.; Mer’eb, M. Selective adsorption of chromium(vi) in industrial wastewater using low-cost abundantly available adsorbents. Adv. Environ. Res. 2002, 6, 533–540. [Google Scholar] [CrossRef]
  27. Goel, J.; Kadirvelu, K.; Rajagopal, C.; Garg, V.K. Removal of lead(ii) by adsorption using treated granular activated carbon: Batch and column studies. J. Hazard. Mater. 2005, 125, 211–220. [Google Scholar] [CrossRef] [PubMed]
  28. Günay, A.; Arslankaya, E.; Tosun, İ. Lead removal from aqueous solution by natural and pretreated clinoptilolite: Adsorption equilibrium and kinetics. J. Hazard. Mater. 2007, 146, 362–371. [Google Scholar] [CrossRef] [PubMed]
  29. Gupta, V.K.; Agarwal, S.; Saleh, T.A. Synthesis and characterization of alumina-coated carbon nanotubes and their application for lead removal. J. Hazard. Mater. 2011, 185, 17–23. [Google Scholar] [CrossRef] [PubMed]
  30. Pearson, R.G. Absolute electronegativity and hardness: Application to inorganic chemistry. J. Org. Chem. 1988, 27, 734–740. [Google Scholar] [CrossRef]
  31. Gomez-Serrano, V.; Macias-Garcia, A.; Espinosa-Mansilla, A.; Valenzuela-Calahorro, C. Adsorption of mercury, cadmium and lead from aqueous solution on heat-treated and sulphurized activated carbon. Water Res. 1998, 32, 1–4. [Google Scholar] [CrossRef]
  32. Mao, X.; Song, X.; Lu, G.; Sun, Y.; Xu, Y.; Yu, J. Effects of metal ions on crystal morphology and size of calcium sulfate whiskers in aqueous hcl solutions. Ind. Eng. Chem. Res. 2014, 53, 17625–17635. [Google Scholar] [CrossRef]
  33. Rabizadeh, T.; Stawski, T.M.; Morgan, D.J.; Peacock, C.L.; Benning, L.G. The effects of inorganic additives on the nucleation and growth kinetics of calcium sulfate dihydrate crystals. Cryst. Growth Des. 2017, 17, 582–589. [Google Scholar] [CrossRef]
  34. Wu, X.Q.; Wang, K.M.; Xiong, Z.Y.; Ye, X.L. Solubility of alpha-calcium sulfate hemihydrate in ca-mg-k chloride salt solution at (353.0 to 371.0) k. J. Chem. Eng. Data 2013, 58, 48–54. [Google Scholar] [CrossRef]
  35. Yang, L.; Guan, B.; Wu, Z.; Ma, X. Solubility and phase transitions of calcium sulfate in kcl solutions between 85 and 100 °C. Ind. Eng. Chem. Res. 2009, 48, 7773–7779. [Google Scholar] [CrossRef]
  36. Hamdona, S.K.; Hadad, U.A.A. Crystallization of calcium sulfate dihydrate in the presence of some metal ions. J. Cryst. Growth 2007, 299, 146–151. [Google Scholar] [CrossRef]
  37. Li, F.; Liu, J.; Yang, G.; Pan, Z.; Ni, X.; Xu, H.; Huang, Q. Effect of ph and succinic acid on the morphology of α-calcium sulfate hemihydrate synthesized by a salt solution method. J. Cryst. Growth 2013, 374, 31–36. [Google Scholar] [CrossRef]
  38. Liu, C.; Zhao, Q.; Wang, Y.; Shi, P.; Jiang, M. Surface modification of calcium sulfate whisker prepared from flue gas desulfurization gypsum. Appl. Surf. Sci. 2016, 360, 263–269. [Google Scholar] [CrossRef]
  39. Guan, B.H.; Yang, L.C.; Wu, Z.B.; Shen, Z.X.; Ma, X.F.; Ye, Q.Q. Preparation of alpha-calcium sulfate hemihydrate from fgd gypsum in k, mg-containing concentrated cacl(2) solution under mild conditions. Fuel 2009, 88, 1286–1293. [Google Scholar] [CrossRef]
  40. Fu, H.L.; Jiang, G.M.; Wang, H.; Wu, Z.; Guan, B.H. Solution-mediated transformation kinetics of calcium sulfate dihydrate to alpha-calcium sulfate hemihydrate in cacl2 solutions at elevated temperature. Ind. Eng. Chem. Res. 2013, 52, 17134–17139. [Google Scholar] [CrossRef]
  41. Wang, X.; Zhou, M.; Ke, X.; Tan, R.; Chen, Y.; Hou, H. Synthesis of alpha hemihydrate particles with lithium and carboxylates via the hydrothermal method. Powder Technol. 2017, 317, 293–300. [Google Scholar] [CrossRef]
  42. Ling, Y.B.; Demopoulos, G.P. Solubility of calcium sulfate hydrates in (0 to 3.5) mol-kg(-1) sulfuric acid solutions at 100 °C. J. Chem. Eng. Data 2004, 49, 1263–1268. [Google Scholar] [CrossRef]
  43. El-Ashtoukhy, E.S.Z.; Amin, N.K.; Abdelwahab, O. Removal of lead (ii) and copper (ii) from aqueous solution using pomegranate peel as a new adsorbent. Desalination 2008, 223, 162–173. [Google Scholar] [CrossRef]
  44. Styles, P.M.; Chanda, M.; Rempel, G.L. Sorption of arsenic anions onto poly(ethylene mercaptoacetimide). React. Funct. Polym. 1996, 31, 89–102. [Google Scholar] [CrossRef]
  45. Ren, X.; Shao, D.; Yang, S.; Hu, J.; Sheng, G.; Tan, X.; Wang, X. Comparative study of pb(ii) sorption on xc-72 carbon and multi-walled carbon nanotubes from aqueous solutions. Chem. Eng. J. 2011, 170, 170–177. [Google Scholar] [CrossRef]
  46. Fu, R.; Yang, Y.; Xu, Z.; Zhang, X.; Guo, X.; Bi, D. The removal of chromium (vi) and lead (ii) from groundwater using sepiolite-supported nanoscale zero-valent iron (s-nzvi). Chemosphere 2015, 138, 726–734. [Google Scholar] [CrossRef] [PubMed]
  47. Amarasinghe, B.M.W.P.K.; Williams, R.A. Tea waste as a low cost adsorbent for the removal of cu and pb from wastewater. Chem. Eng. J. 2007, 132, 299–309. [Google Scholar] [CrossRef]
  48. Ho, Y.S.; Mckay, G. The sorption of lead(ii) ions on peat. Water Res. 1999, 33, 578–584. [Google Scholar] [CrossRef]
  49. Rao, M.M.; Rao, G.P.C.; Seshaiah, K.; Choudary, N.V.; Wang, M.C. Activated carbon from ceiba pentandra hulls, an agricultural waste, as an adsorbent in the removal of lead and zinc from aqueous solutions. Waste Manag. 2008, 28, 849–858. [Google Scholar] [CrossRef] [PubMed]
  50. Heidari, A.; Younesi, H.; Mehraban, Z. Removal of ni(ii), cd(ii), and pb(ii) from a ternary aqueous solution by amino functionalized mesoporous and nano mesoporous silica. Chem. Eng. J. 2009, 153, 70–79. [Google Scholar] [CrossRef]
  51. Sharma, A.; Bhattacharyya, K.G. Adsorption of chromium (vi) on azadirachta indica (neem) leaf powder. Adsorption 2005, 10, 327–338. [Google Scholar] [CrossRef]
  52. Wu, C.H. Studies of the equilibrium and thermodynamics of the adsorption of Cu(2+) onto as-produced and modified carbon nanotubes. J. Colloids Interface Sci. 2007, 311, 338–346. [Google Scholar] [CrossRef] [PubMed]
  53. Ho, Y.S. Effect of ph on lead removal from water using tree fern as the sorbent. Bioresour. Technol. 2005, 96, 1292–1296. [Google Scholar] [CrossRef] [PubMed]
  54. Srivastava, P.; Singh, B.; Angove, M. Competitive adsorption behavior of heavy metals on kaolinite. J. Colloids Interface Sci. 2005, 290, 28. [Google Scholar] [CrossRef] [PubMed]
  55. Caccin, M.; Giorgi, M.; Giacobbo, F.; Ros, M.D.; Besozzi, L.; Mariani, M. Removal of lead (ii) from aqueous solutions by adsorption onto activated carbons prepared from coconut shell. Desalination Water Treat. 2016, 57, 1–19. [Google Scholar] [CrossRef]
  56. Yan, T.; Luo, X.; Lin, X.; Yang, J. Preparation, characterization and adsorption properties for lead (ii) of alkali-activated porous leather particles. Colloids Surf. A Physicochem. Eng. Asp. 2016, 512, 7–16. [Google Scholar] [CrossRef]
  57. Allison, J.D.; Brown, D.S.; Novo-Gradac, K.J. Minteqa2/prodefa2, a Geochemical Assessment Model for Environmental Systems: Version 3.0 User’s Manual; Environmental Research Laboratory, Office of Research and Development, US Environmental Protection Agency: Washington, DC, USA, 1991.
  58. Bernardo, M.; Mendes, S.; Lapa, N.; Gonçalves, M.; Mendes, B.; Pinto, F.; Lopes, H.; Fonseca, I. Removal of lead (Pb2+) from aqueous medium by using chars from co-pyrolysis. J. Colloid Interface Sci. 2013, 409, 158–165. [Google Scholar] [CrossRef] [PubMed]
  59. Mandal, P.K.; Mandal, T.K. Anion water in gypsum (CaSO4 2H2O) and hemihydrate (CaSO4 0.5 H2O). Cement. Concrete Res. 2002, 32, 313–316. [Google Scholar] [CrossRef]
  60. Kong, B.; Guan, B.; Yates, M.Z.; Wu, Z. Control of alpha-calcium sulfate hemihydrate morphology using reverse microemulsions. Langmuir 2012, 28, 14137–14142. [Google Scholar] [CrossRef] [PubMed]
  61. Bosbach, D.; Junta-Rosso, J.L.; Becker, U.; Hochella, M.F. Gypsum growth in the presence of background electrolytes studied by scanning force microscopy. Geochim. Cosmochim. Acta 1996, 60, 3295–3304. [Google Scholar] [CrossRef]
  62. Martynowicz, E.; Witkamp, G.J.; vanRosmalen, G.M. The effect of aluminium fluoride on the formation of calcium sulfate hydrates. Hydrometallurgy 1996, 41, 171–186. [Google Scholar] [CrossRef]
Figure 1. SEM graphs of (a) FGD gypsum and (b) CSHW derived from FGD gypsum by hydrothermal synthesis.
Crystals 07 00270 g001
Figure 2. X-ray diffraction patterns of FGD gypsum and CSHW derived from FGD gypsum by the hydrothermal synthesis.
Crystals 07 00270 g002
Figure 3. TG-DTA pattern of (a) FGD gypsum and (b) CSHW derived from FGD gypsum by the hydrothermal synthesis.
Crystals 07 00270 g003
Figure 4. Solubility data of calcium sulfate dihydrate (CSD) and calcium sulfate hemihydrate (CSH) and phase composition obtained with different CaCl2 (a,b) and H2SO4 (c,d) concentrations.
Crystals 07 00270 g004
Figure 5. Adsorption isotherms of lead ions on CSHW at 298 and 318 K at a balance time of 60 min.
Crystals 07 00270 g005
Figure 6. Adsorption kinetic models for lead ions on CSHW at different initial lead concentrations (a) 10, (b) 30, (c) 60, (d) 80, and (e) 100 mg L−1 at an operating temperature of 298 K.
Crystals 07 00270 g006
Figure 7. Adsorption capacity of lead ions on CSHW with respect to various pH values at an initial lead concentration of 30 mg L−1, balance time of 60 min, and operating temperature of 298 K.
Crystals 07 00270 g007
Figure 8. Effect of pH values on the aqueous speciation of lead in 0.01 M NaNO3.
Crystals 07 00270 g008
Figure 9. Schematic diagram for the adsorption of lead ions on the CSHW.
Crystals 07 00270 g009
Figure 10. XRD patterns of materials before and after adsorption at different pH values: (a) CSHW, (b) product acquired at pH = 5.42, and (c) product acquired at pH = 8.08.
Crystals 07 00270 g010
Figure 11. SEM graph and EDS spectra of the particles before and after adsorption: (a,c) fresh CSHW; (b,d) post adsorption product.
Crystals 07 00270 g011
Table 1. Main physical characteristics of flue gas desulfurization (FGD) gypsum and calcium sulfate hemihydrate whisker (CSHW).
ParametersValue
FGD GypsumCSHW
Bulk density (g mL−1)1.060.26
True density (g mL−1)3.192.78
Particle median diameter (μm)38.2837.54
Table 2. Chemical compositions of FGD gypsum and CSHW (wt. %).
MaterialsCaOSO3SiO2Al2O3Fe2O3MgOCrystal Water (%)
FGD gypsum44.1552.891.050.460.270.3618.65
CSHW43.4353.121.360.610.250.396.82
Table 3. Parameters calculated by using the equilibrium models of lead on CSHW.
IsothermParameterTemperature
298 K318 K
Langmuir Q m (mg g−1)9.4619.681
K L (L mg−1)152.59526.12
R 2 0.9910.996
Freundlich K F (mg g−1)4.8142.718
n 2.73342.8305
R 2 0.8280.829
Temkin b T (KJ mol−1)4.0255.328
a T 3.455 × 10−33.495 × 10−4
R 2 0.9720.981
Table 4. Parameters from the kinetic modeling of lead on CSHW.
C0 (mg L−1)k (min−1)Qe a (mg g−1)Qe b (mg g−1)R2
1000.0041950.5048.180.999
800.0017443.1038.060.995
600.0018331.4527.300.996
300.010414.1213.910.996
101.1220.430.420.998
a lead adsorption amount from kinetic modeling prediction. b lead adsorption amount from practical experiment.
Table 5. Changes in the pH and hydrogen ions at the initial and equilibrium states.
pH ValueH+ Changes (mmol L−1)Removal Efficiency (%)
Initial ValueEquilibrium Value
2.512.89−1.80225.32
2.993.15−0.31540.26
3.303.45−0.14656.73
3.984.11−0.027166.73
4.484.60−7.99 × 10−381.76
5.005.12−2.41 × 10−387.12
5.42 a5.62−1.40 × 10−388.50
5.985.99−2.38 × 10−590.30
6.596.381.60 × 10−486.27
7.026.393.12 × 10−476.30
7.626.463.23 × 10−467.61
8.086.652.26 × 10−467.44
a actual pH value of the initial lead solution.

