
Size and Shape Controlled Crystallization of Hemoglobin for Advanced Crystallography

Division of Biophysics, Department of Physiology, Jichi Medical University, 3311-1 Yakushiji, Shimotsuke, Tochigi 329-0498, Japan
*
Author to whom correspondence should be addressed.
Crystals 2017, 7(9), 282; https://doi.org/10.3390/cryst7090282
Submission received: 6 September 2017
/
Revised: 16 September 2017
/
Accepted: 17 September 2017
/
Published: 20 September 2017
(This article belongs to the Special Issue Biological and Biogenic Crystallization)
Abstract
:While high-throughput screening for protein crystallization conditions have rapidly evolved in the last few decades, it is also becoming increasingly necessary for the control of crystal size and shape as increasing diversity of protein crystallographic experiments. For example, X-ray crystallography (XRC) combined with photoexcitation and/or spectrophotometry requires optically thin but well diffracting crystals. By contrast, large-volume crystals are needed for weak signal experiments, such as neutron crystallography (NC) or recently developed X-ray fluorescent holography (XFH). In this article, we present, using hemoglobin as an example protein, some techniques for obtaining the crystals of controlled size, shape, and adequate quality. Furthermore, we describe a few case studies of applications of the optimized hemoglobin crystals for implementing the above mentioned crystallographic experiments, providing some hints and tips for the further progress of advanced protein crystallography.
1. Introduction
Since the landmark work by Perutz and Kendrew on the X-ray structural determination of hemoglobin (Hb) and myoglobin (Mb) in the 1950s [1,2,3], X-ray crystallography (XRC) has been the most powerful technique to determine protein structures at the atomic level. In the early days of its history, however, it took several years of painstaking effort to solve a single protein structure due to the requirements of large, well-formed crystals (with edge dimensions of 0.5 mm or more) and heavy metal substitution for phase determination, and other experimental difficulties with data acquisition and analysis. Also, the identification of protein crystallization conditions was usually a trial-and-error process relied largely on the empirical knowledge of individual researchers. This is well illustrated by the fact that only eleven protein structures were solved by 1970. The situation has changed since the 1980s, with the advances in highly intense synchrotron X-ray sources, computer power, experimental instruments (such as X-ray detectors and automated sample manipulators), recombinant protein expression systems, phase determination techniques, and high-throughput/rationally-designed screening for crystallization conditions. Along with these technological and methodological advances, the crystal size and time required for XRC have been steadily decreasing over the years, and the initial search of crystallization conditions has become much easier and less time consuming. As a result, the number of crystal structures solved per year has been dramatically increasing from seven in 1980 to nearly ten thousand in 2016. Currently, the Protein Data Bank (PDB) [4] contains more than 120,000 protein structures, with the majority of them determined by XRC.
Figure 1.
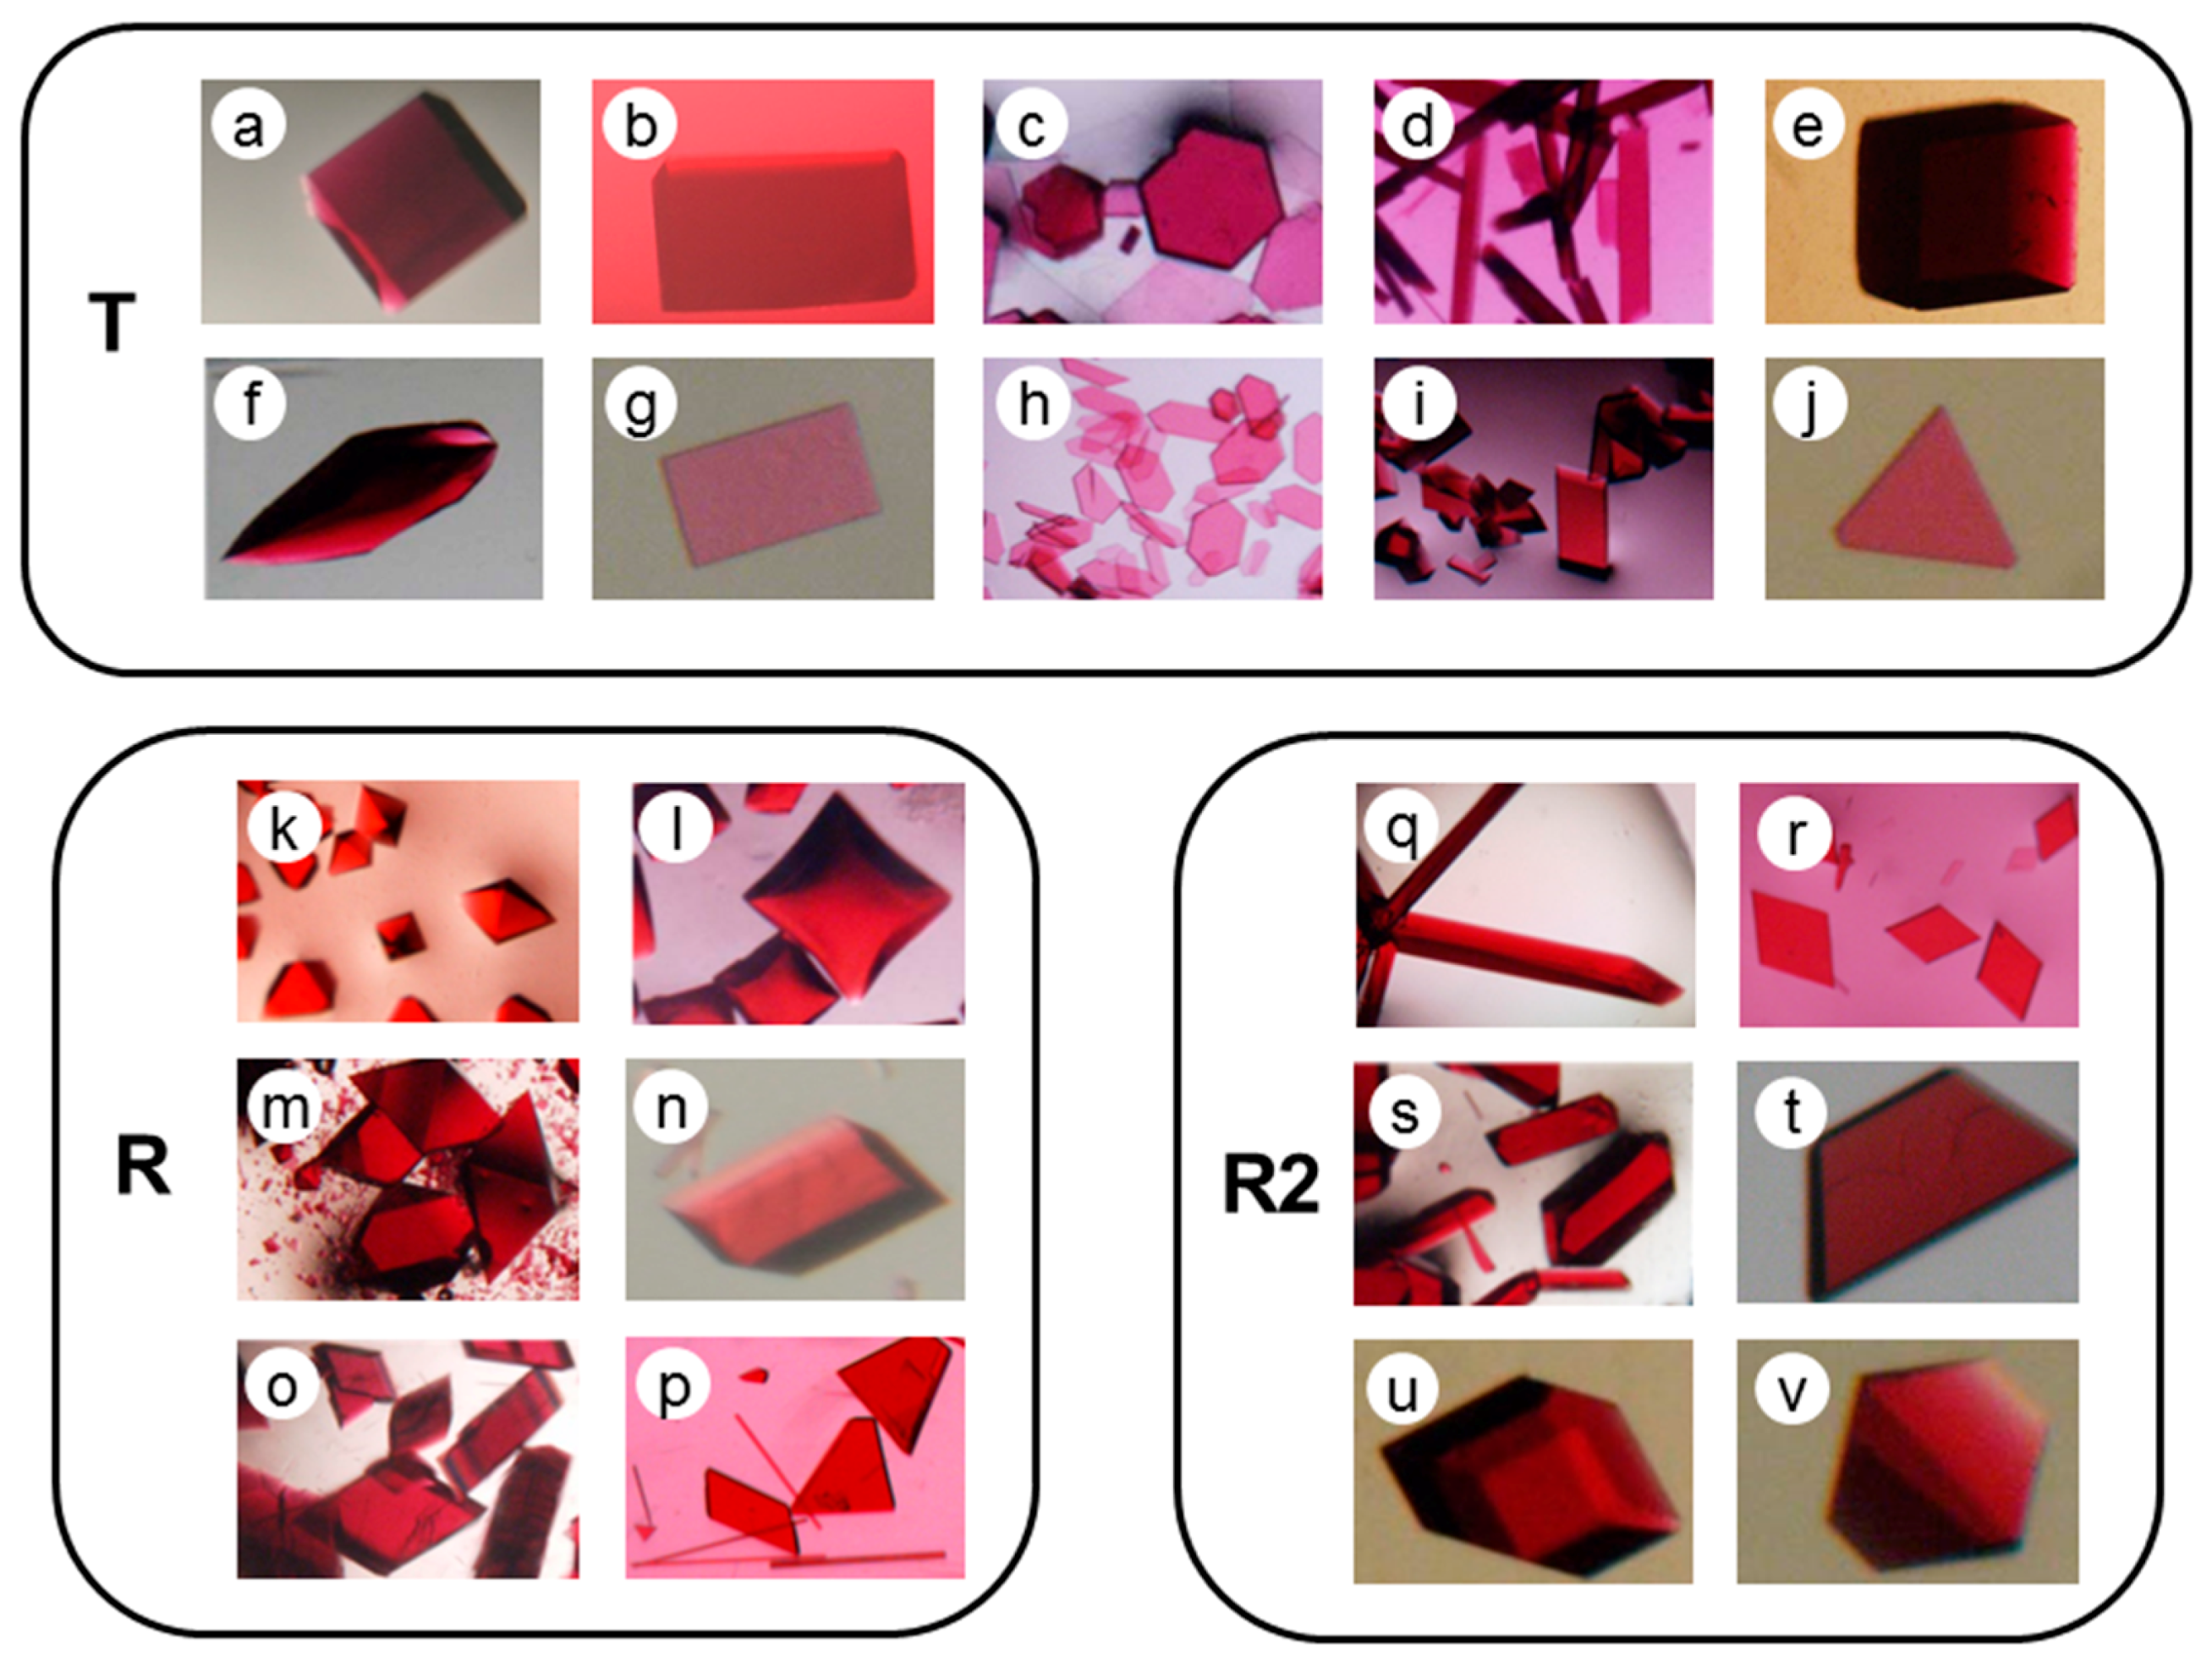
Examples of hemoglobin (Hb) crystals for three quaternary structures, T (a–j); R (k–p); and R2 (q–v); illustrating a variety of shapes and habits. (a) deoxyHbA with ammonium sulfate (pH 6.5); (b) deoxyHbA with PEG6000 (pH 7.0); (c) horse deoxyHb with PEG3350 (pH 8.8); (d) deoxyHbC with PEG3350 (pH 7.0); (e) deoxyHbC with PEG3350 (pH 8.6); (f) Ni(II)HbA with PEG3350 (pH 5.5); (g) Ni(II)HbS with PEG3350 (pH 8.3); (h) cross-linked Fe(II)-Ni(II) hybrid HbA with CO bound at the α hemes with PEG3350 (pH 6.6); (i) cross-linked Fe(II)-Ni(II) hybrid HbA with CO bound at the β hemes with PEG3350 (pH 6.6); (j) cross-linked Fe(II)-Ni(II) hybrid HbA with CO bound at only one β heme with PEG3350 (pH 7.0); (k) COHbA with phosphate (pH 6.7); (l) oxyHbA with ammonium sulfate (pH 7.1); (m) COHbC with phosphate (pH 7.2); (n) horse COHb with ammonium sulfate (pH 8.2); (o) horse deoxy desArg(α141)Hb with PEG3350 and PEG1000 (pH 7.7); (p) bezafibrate(BZF)-bound horse COHb with PEG1000 (pH 6.3); (q) COHbA with PEG3350 (pH 5.8, hanging drop); (r) COHbA with PEG3350 (pH 5.8, batch); (s) COHbC with PEG3350 (pH 7.6); (t) COHbS with PEG3350 (pH 8.3); (u) Fe(II)-Ni(II) hybrid HbS with CO bound at the α hemes with PEG3350 (pH 7.4); and (v) Fe(II)-Ni(II) hybrid HbS with CO bound at the β hemes with PEG3350 (pH 7.8). Note here that HbA is human adult hemoglobin, HbC and HbS are the naturally occurring mutant Hbs, in which Glu(β6) is replaced by Lys and Val, respectively, Ni(II)Hb is metal-substituted Hb in which Fe(II)-hemes have been replaced by Ni(II)-heme (acting as a surrogate for deoxy-Fe(II)-heme [5]), “cross-linked” denotes the presence of fumaryl cross-link between two Lys(β82) residues [6], and desArg(α141)Hb denotes Hb from which two Arg(α141) residues have been removed enzymatically.
Figure 1.
Examples of hemoglobin (Hb) crystals for three quaternary structures, T (a–j); R (k–p); and R2 (q–v); illustrating a variety of shapes and habits. (a) deoxyHbA with ammonium sulfate (pH 6.5); (b) deoxyHbA with PEG6000 (pH 7.0); (c) horse deoxyHb with PEG3350 (pH 8.8); (d) deoxyHbC with PEG3350 (pH 7.0); (e) deoxyHbC with PEG3350 (pH 8.6); (f) Ni(II)HbA with PEG3350 (pH 5.5); (g) Ni(II)HbS with PEG3350 (pH 8.3); (h) cross-linked Fe(II)-Ni(II) hybrid HbA with CO bound at the α hemes with PEG3350 (pH 6.6); (i) cross-linked Fe(II)-Ni(II) hybrid HbA with CO bound at the β hemes with PEG3350 (pH 6.6); (j) cross-linked Fe(II)-Ni(II) hybrid HbA with CO bound at only one β heme with PEG3350 (pH 7.0); (k) COHbA with phosphate (pH 6.7); (l) oxyHbA with ammonium sulfate (pH 7.1); (m) COHbC with phosphate (pH 7.2); (n) horse COHb with ammonium sulfate (pH 8.2); (o) horse deoxy desArg(α141)Hb with PEG3350 and PEG1000 (pH 7.7); (p) bezafibrate(BZF)-bound horse COHb with PEG1000 (pH 6.3); (q) COHbA with PEG3350 (pH 5.8, hanging drop); (r) COHbA with PEG3350 (pH 5.8, batch); (s) COHbC with PEG3350 (pH 7.6); (t) COHbS with PEG3350 (pH 8.3); (u) Fe(II)-Ni(II) hybrid HbS with CO bound at the α hemes with PEG3350 (pH 7.4); and (v) Fe(II)-Ni(II) hybrid HbS with CO bound at the β hemes with PEG3350 (pH 7.8). Note here that HbA is human adult hemoglobin, HbC and HbS are the naturally occurring mutant Hbs, in which Glu(β6) is replaced by Lys and Val, respectively, Ni(II)Hb is metal-substituted Hb in which Fe(II)-hemes have been replaced by Ni(II)-heme (acting as a surrogate for deoxy-Fe(II)-heme [5]), “cross-linked” denotes the presence of fumaryl cross-link between two Lys(β82) residues [6], and desArg(α141)Hb denotes Hb from which two Arg(α141) residues have been removed enzymatically.

Given such success, crystallization might be no longer such a severe bottleneck process in protein crystallography. However, this is not always the case, since protein crystallography experiments are becoming more diverse and challenging, and thereby requirements for crystals are also becoming more demanding in terms of size and shape. The purpose of this article is to illustrate our approach to the growth of Hb crystals to dimensions that meet the needs of advanced crystallography, including XRC combined with photoexcitation (e.g., photolysis of CO bound to Hb [7,8]) and/or spectrophotometry [9,10], neutron crystallography (NC) [11,12], and recently developed X-ray fluorescent holography (XFH) [13]. The first one requires optically thin but well-diffracting Hb crystals, while the latter two, especially XFH, require large-volume, well-ordered Hb crystals, due to feeble signals.
As described above, Hb was one of the first proteins whose crystal structure was solved by XRC, and so far hundreds of Hb structures have been solved and deposited in the PDB [4]. Human Hbs and other mammalian Hbs, together with avian, reptile, and bony fish Hbs, are all (αβ)2 tetramers [14] that undergo oxygenation-linked quaternary structural change, characterized by a relative rotation between the two αβ dimers [15]. Whereas, fully-unliganded deoxyHb tends to adopt a single tense (T) quaternary structure, fully-liganded Hb can adopt multiple relaxed quaternary structures, most typically represented by the classical relaxed (R) structure and the second relaxed (R2) structure (see a recent meta-analysis [16]). Thus, the tetrameric Hb structures can be classified into three distinct quaternary structures, T, R, and R2. An important fact to emphasize here is that each quaternary structure can be crystallized over a wide range of crystallization conditions and in different crystal lattices. This means that a number of different crystal forms are available by exploring various precipitates, crystallization conditions, and proteins with different amino acid sequences. Some examples from our laboratory are shown in Figure 1. Based on the accumulated experience and knowledge of Hb crystallization, we have chosen appropriate Hb samples and crystallization conditions for satisfying the requirements of the above mentioned crystallography experiments.
2. Results and Discussion
2.1. High-Quality, Thin Hb Crystal Growth for XRC Combined with Photoexcitation and Spectrophotometry
2.1.1. Human COHbC (β6 Glu→Lys) Crystal (R-State)
Even though XRC has provided atomic details of numerous protein structures, a mechanistic description of proteins also requires information about intermediates that occur during protein functioning. Hb and Mb can serve as model systems for studying such intermediates, by utilizing the photosensitivity of the CO bound complexes of these proteins (i.e., COHb and COMb). Absorption of photon breaks the heme Fe(II)-CO bond, initiating a series of structural and spectroscopic changes that can, in principle, be observed by XRC and spectrophotometry. Whereas, a number of crystal structures of photolyzed COMb have already been solved by several research groups [17,18,19,20], yet none of these groups have reported success in detailing the key movements in the Hb tetramer that initiate the allosteric transition. Since the quantum efficiency for CO photolysis is significantly lower for Hb than for Mb [21], the technical difficulties of producing strongly diffracting yet optically-thin crystals of COHb have prevented researchers from carrying out this type of experiment on Hb.
HbC is a human Hb variant in which the glutamic acid (Glu) at the sixth position of the β chain is replaced by lysine (Lys). It is known that this β6 Glu to Lys surface mutation does not significantly alter the oxygen equilibrium properties of Hb [22], but makes the protein less soluble when compared to normal human adult Hb (HbA) [23]. Indeed, HbC in the oxygenated form has a tendency to crystallize inside the red cell [24] (a typical example of pathological biogenic crystallization), which may contribute to “hemoglobin C disease” [23]. Recently we demonstrated that, although isomorphous with the COHbA crystals, the R-state COHbC crystals are of very high quality and remain intact upon deoxygenation [10], suggesting a high durability under photolysis conditions. We concluded that these COHbC crystals are well suited to the photolysis experiment, but unfortunately their shape is a problem.
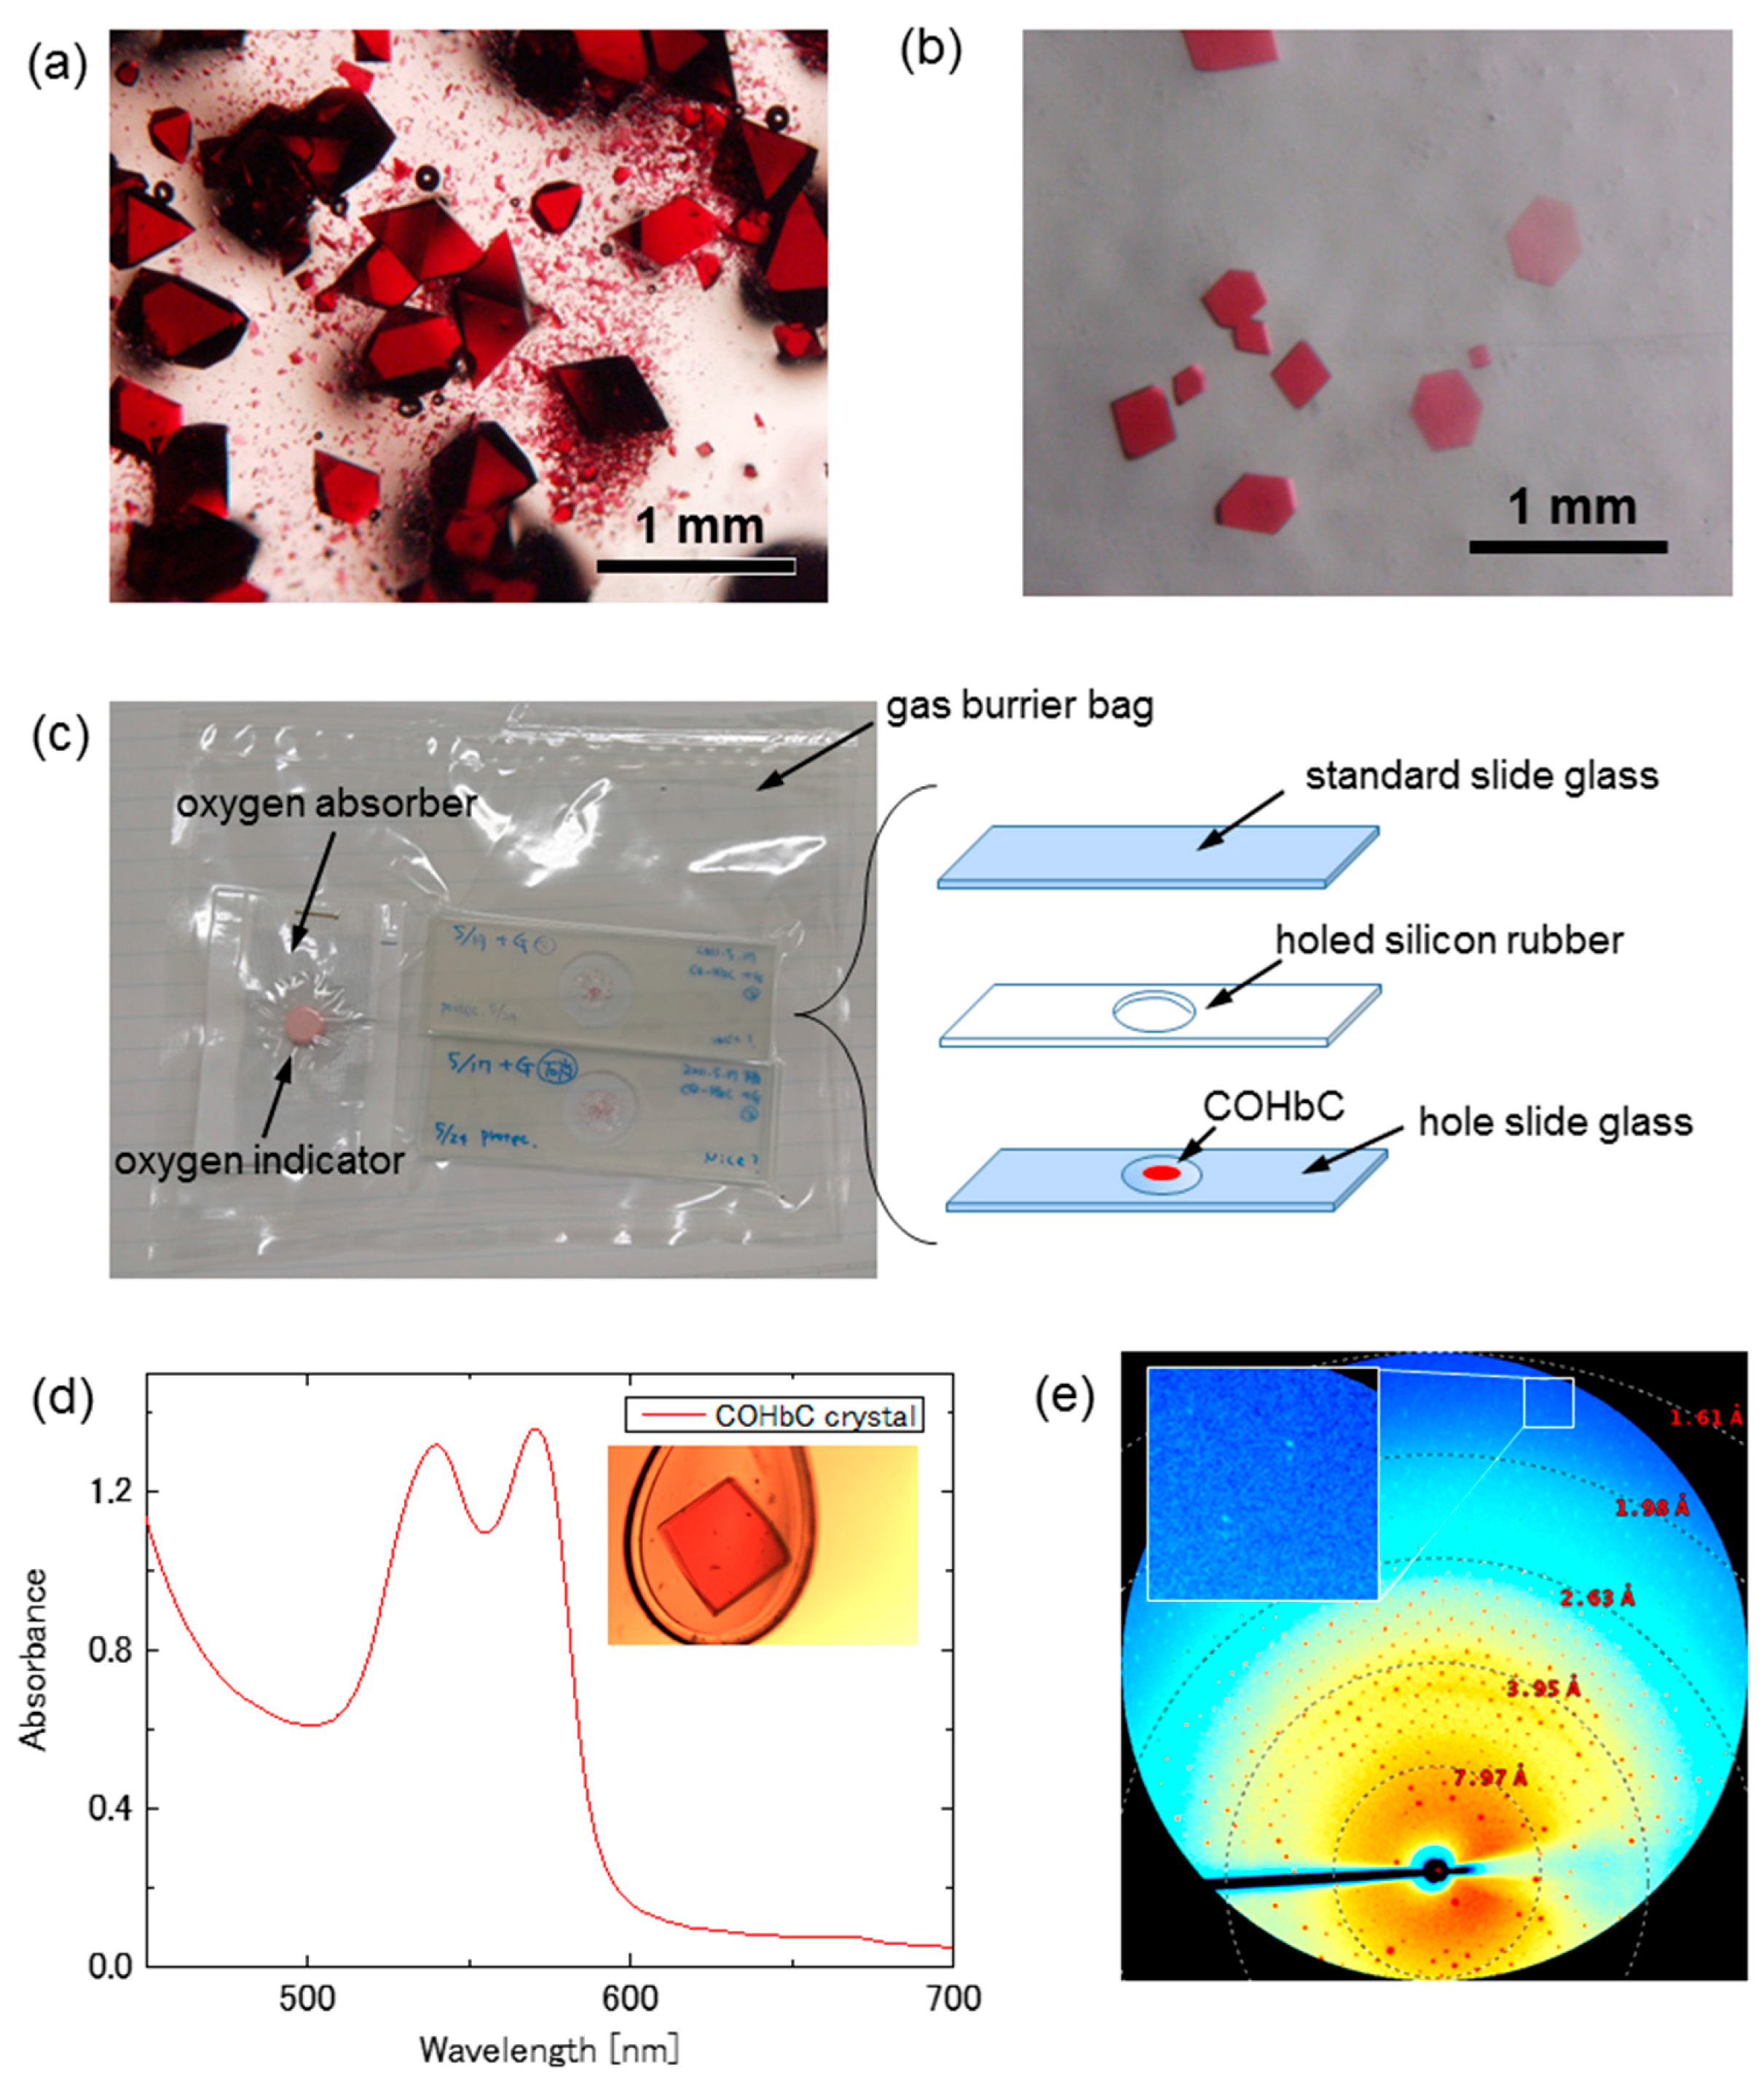
The R-state COHbC crystals usually assume a tetragonal bipyramidal shape (Figure 2a), which is disadvantageous for CO photolysis and optical measurement. We therefore employed an approach of spatially restricted crystallization to change their shape from bipyramidal to a plate-like one (Figure 2b). First, a CO-saturated mixed solution of 2 μL of deionized 6.0% (w/v) COHbC and the same volume of 2.5 M phosphate buffer containing 0.80 M NaH2PO4 and 1.7 M K2HPO4 (pH 7.1) was spread out on a hole slide glass. After 10 s, the hole slide glass was covered by a standard slide glass with insertion of a holed silicone rubber to avoid drying out the crystallization solution (Figure 2c; right). Then, the sample was placed in a gas barrier bag and sealed with an oxygen absorber A-500HS (ISO, Yokohama, Japan) and an oxygen indicator (an accessary of A-500HS) under CO (Figure 2c; left). The oxygen indicator changes color from blue (>0.5% O2) to pink (<0.1% O2), and the degree of anaerobicity in the bag can be easily checked by eye. Crystallization was carried out at 20 °C. A number of thin crystals normally appeared within a few days (Figure 2b). These plate-like crystals are isomorphous with the biphyramidal ones, both belonging to a space group of tetragonal P41212 with unit cell parameters of a = b = 53.1 Å, c = 191.5 Å. We note here that the thin crystals are characterized by a well-developed (010) (or ac) crystal face, while the bipyramidal ones by a four-fold screw axis (c-axis) passing through the apices of the two pyramids.
The absorption spectrum of the shape-controlled thin COHbC crystal at 120 K, measured with unpolarized light incident on the (010) crystal face, is shown in Figure 2d, which includes a photograph of the measured crystal in the inset. Based on a millimolar extinction coefficient of 13.4 (per heme) at 540 nm for COHb and the calculated heme concentration in the crystal (i.e., about 50 mM), the thickness of the crystal can be roughly estimated to be 20 μm. An X-ray diffraction image of the same COHbC crystal as used for the spectral measurement is shown in Figure 2e. We confirmed that the diffraction spots are visible up to 1.7 Å.
2.1.2. Bezafibrate-Bound Horse COHb (BZF-COhHb) Crystal (R-State)
Another, more promising crystalline sample for the CO photolysis experiment is the crystal of CO-bound horse Hb (COhHb) in complex with the allosteric effector bezafibrate (BZF) (see chemical structure in Figure 3a). BZF was initially reported to reduce the oxygen affinity of Hb by preferentially binding and stabilizing the low-affinity T-state [25]. However, our previous study demonstrated that BZF can also bind to R-state COhHb to form a stable complex with slightly a lower oxygen affinity than free R-state [26]. An important observation was that a relatively thin, flat diamond-shaped BZF-COhHb crystal diffracts to 1.55 Å and gives a diffraction pattern with round, well defined diffraction spots, suggesting its potential usefulness for the photolysis experiment.
The very thin R-state BZF-COhHb crystals were made by a simple batch method using a gas-tight glass vial SVG-5 (Nichiden-Rika Glass) for gas-chromatography (Figure 3b). First, a mixed solution of 1.12 mL of 50% (w/v) polyethyleneglycol (PEG) 1000 and 0.88 mL of distilled water was placed in the vial and saturated with CO at 0 °C by CO bubbling on ice. Then, 4 mg of solid dithionite was added, followed by the addition of 2.0 mL of a filtered, CO-saturated 0.975% horse COHb solution in 0.1 M MES/NaOH buffer (pH 6.3) containing 16 mM BZF. The gas phase in the vial was quickly replaced by CO gas. Crystallization was carried out at 4 °C. A large number of very thin, flat diamond-shaped BZF-COhHb crystals appeared within a few days (Figure 3c).
Absorption spectrum at 100 K of the very thin BZF-COhHb crystal is shown in Figure 3d. Inset is a photograph of the measured crystal. The estimated thickness of the crystal is about 10 μm. A diffraction image of the same crystal as used for the spectral measurement is shown in Figure 3e. Diffraction spots are visible up to 1.7 Å (Figure 3e, Inset). This high resolution is very unusual and attractive, considering its thickness of only 10 μm (corresponding to the half thickness of the COHbC crystal as described above). The BZF-COhHb crystals are orthorhombic (space group C2221) with unit cell parameters of a = 62.4 Å, b = 107.5 Å, c = 86.7 Å.
Adachi et al. [7] and Schotte et al. [8] have independently conducted X-ray analysis of the photoproduct of R-state COHb. These groups reported a 2.5 Å-resolution cryo-trapped photoproduct structure at 35 K, and time-resolved 2.0 Å-resolution electron density maps of the crystal at 15 °C, respectively. In both studies, the bipyramidal-shaped crystals of COHbA were used (with size of ~30 μm in the former study [7] and ~250 μm in the latter [8]). The yields of photoproducts at 35 K and 15 °C were about 50% and 15%, respectively. In both of the studies, the most prominent changes observed were the weakening of the electron density of the bound CO and the appearance of a new density of the photolyzed CO which is located near the heme. The changes in the atomic positions of the polypeptide moiety were very small, indicating no sign of allostric movements. The absence of protein conformational changes at 35 K is reasonably expected because large-scale protein fluctuations become frozen below ~180 K [27,28]. However, the absence of main chain motions at 15 °C could have resulted from the low photoproduct yield of 15%; a simple Monod-Wyman-Changeux (MWC) two-state model [29] suggests that 2 or 3 ligands (out of 4 per Hb molecule) must be photodissociated to trigger the R-to-T transition of tetrameric Hb. There is a possibility of detecting more conformational changes above 180 K by using a high-quality, thin COHb crystal. Our newly developed crystal forms, namely the shape-controlled thin COHbC crystal and the very thin BZF-COhHb crystal, are therefore a promising alternative to the well-known bipyramidal COHbA crystals for the observation of the initial allosteric movements in the Hb tetramer. Such attempts are now in progress in our laboratory.
2.2. Large-Volume (>20 mm3) Hb Crystal Growth for Neutron Crystallgoraphy (NC)
2.2.1. DeoxyHbA Crystal (T-State)
Neutron crystallography (NC) is the prevailing technique for the accurate determination of the positions of hydrogen atoms in proteins, enabling the identification of the protonation states of amino acid residues and the nature of hydrogen bonds and salt-bridges [11,12]. While informative, this method requires large and well-ordered single crystals because available neutron sources are very weak. In most cases, crystals of larger than 0.5 mm3 have been used to overcome the weak neutron flux of beamlines [30]. A further problem with NC is an anomalously large incoherent scattering from hydrogen (1H) [31]. This scattering does not contribute to Bragg diffraction peaks, but rather produces a uniform background. On the other hand, the incoherent scattering cross section of deuterium (2D) is approximately 40 times lower than that of 1H, and thus it is necessary to grow crystals from, or soak the crystals in, D2O solutions [31].
We accordingly modified the batch method of Perutz [32] to obtain large-sized, deuterated deoxyHbA crystals from D2O solutions. Before crystallization, the stock solution of COHbA (in H2O) was converted to the oxy-form by illumination for 30 min under a continuous stream of pure oxygen gas at 0 °C. The resulting oxyHbA sample was then diluted about tenfold with D2O and concentrated by ultrafiltration at 5 °C, by using an Amicon ultrafiltration unit equipped with a YM-10 membrane (Millipore). The dilution and concentration were repeated until the free H2O decreased down to less than 1%.
The concentrated oxyHbA solution was mixed with deuterated “solution C” of Perutz [32] to give a 8 mL solution of 1.0% (w/v) deoxyHbA, containing 4.30 M NH4, 1.94 M SO4, and 0.242 M PO4 (pH 6.3; which was read straight from the pH meter without correction for the deuterium shift). Note that Perutz’s solution C is a mixture of 4 M (NH4)2SO4, 2 M (NH4)H2PO4 and 2 M (NH4)2HPO4 with a volume ratio of 0.8:0.05:0.15 (pH 6.5). We also note here that the solubility of oxyHbA is significantly higher than that of deoxyHbA under these solution conditions, and the oxyHbA solution is clear at this stage.
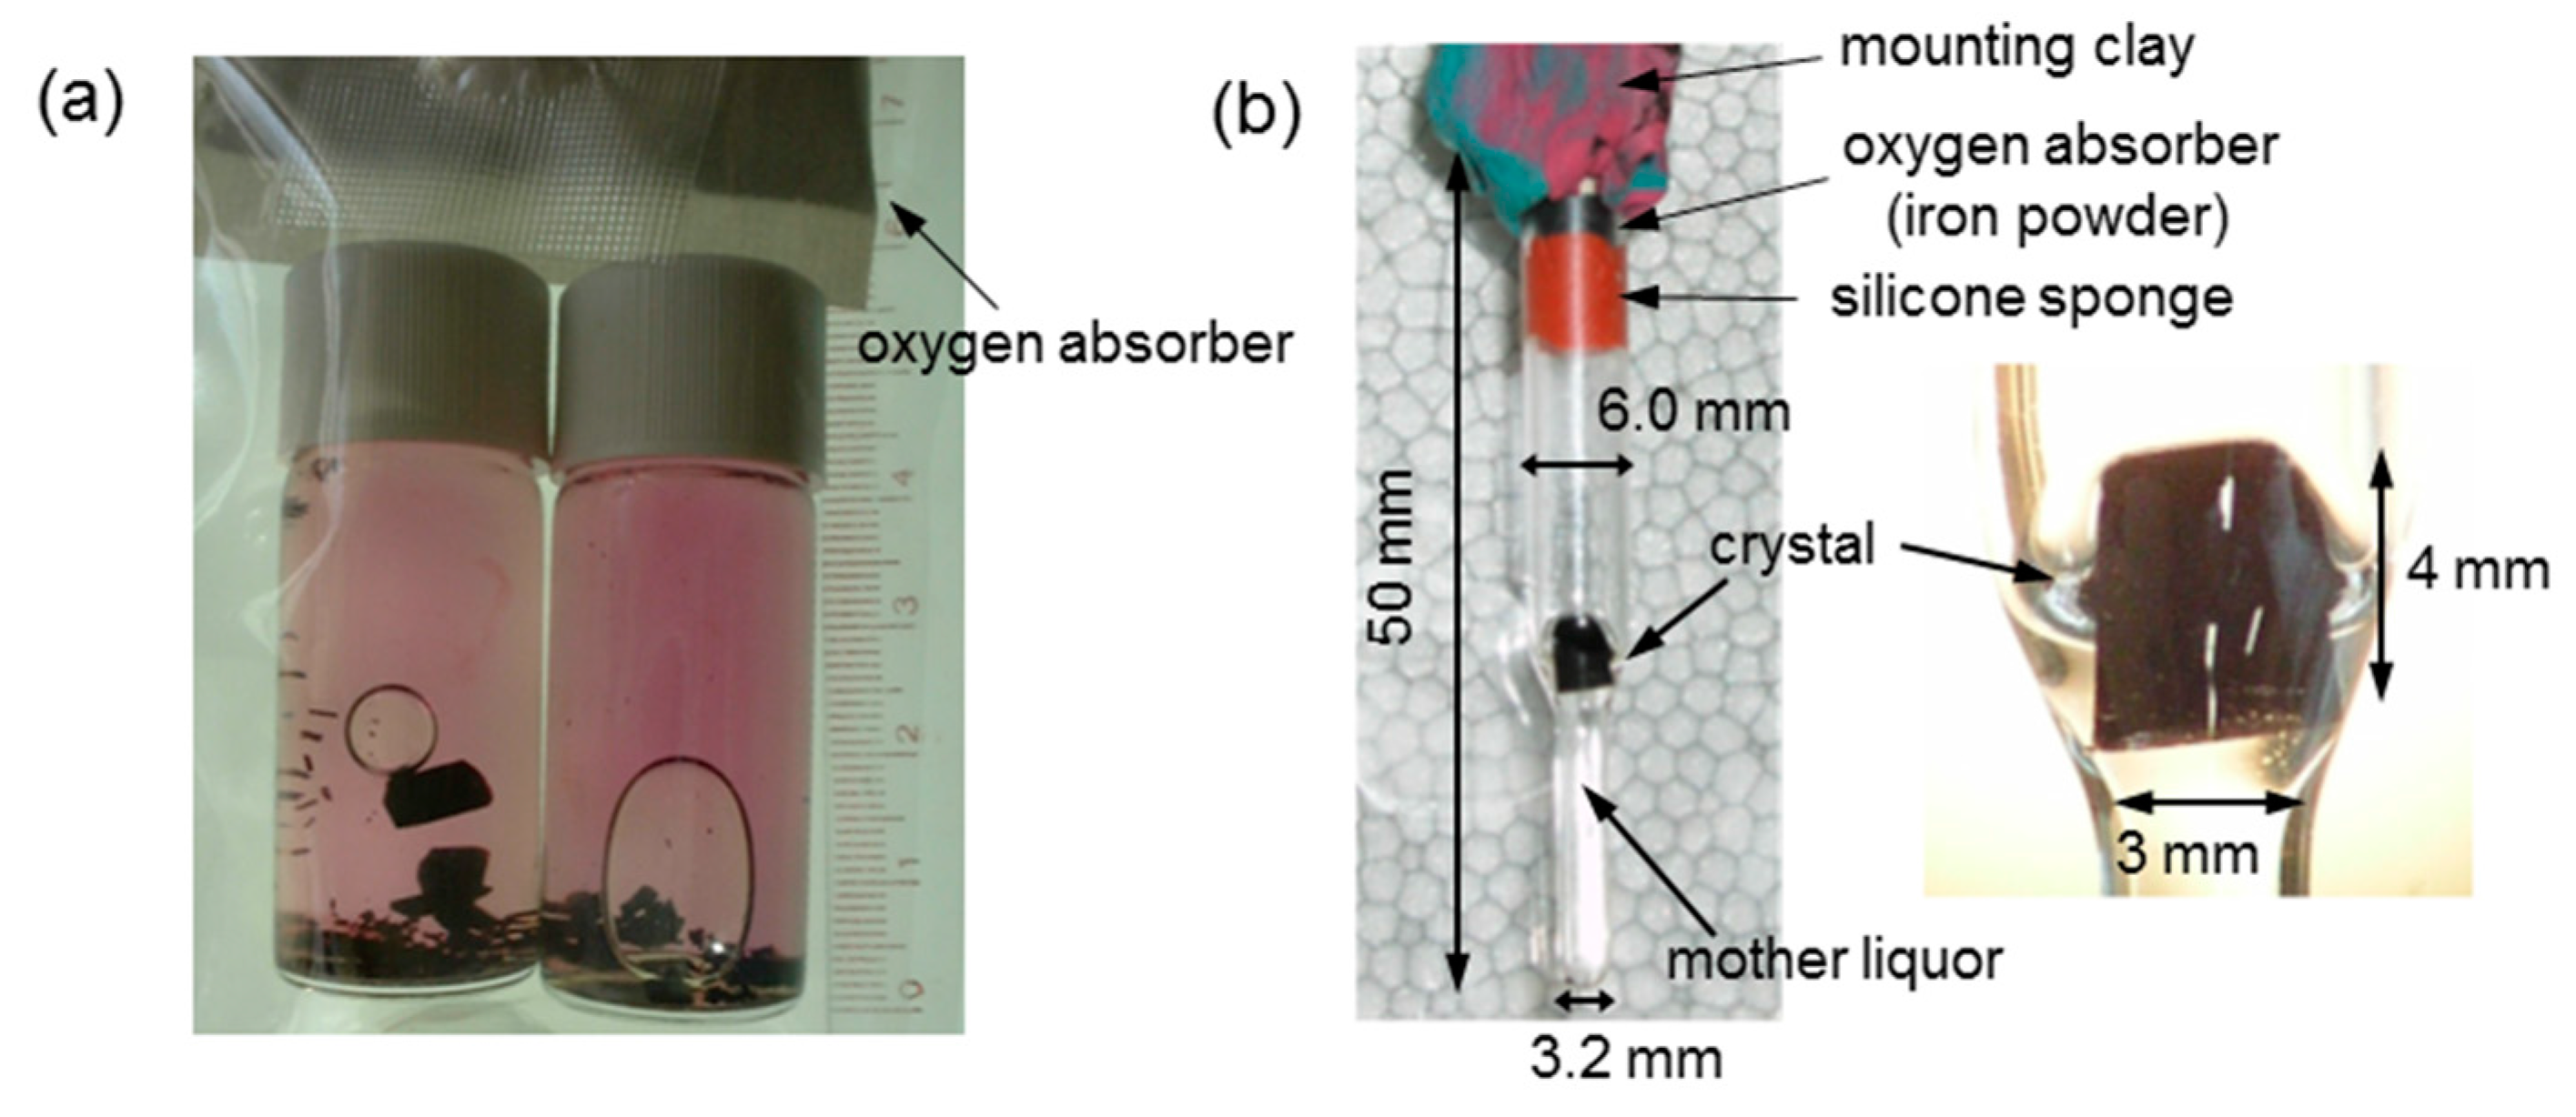
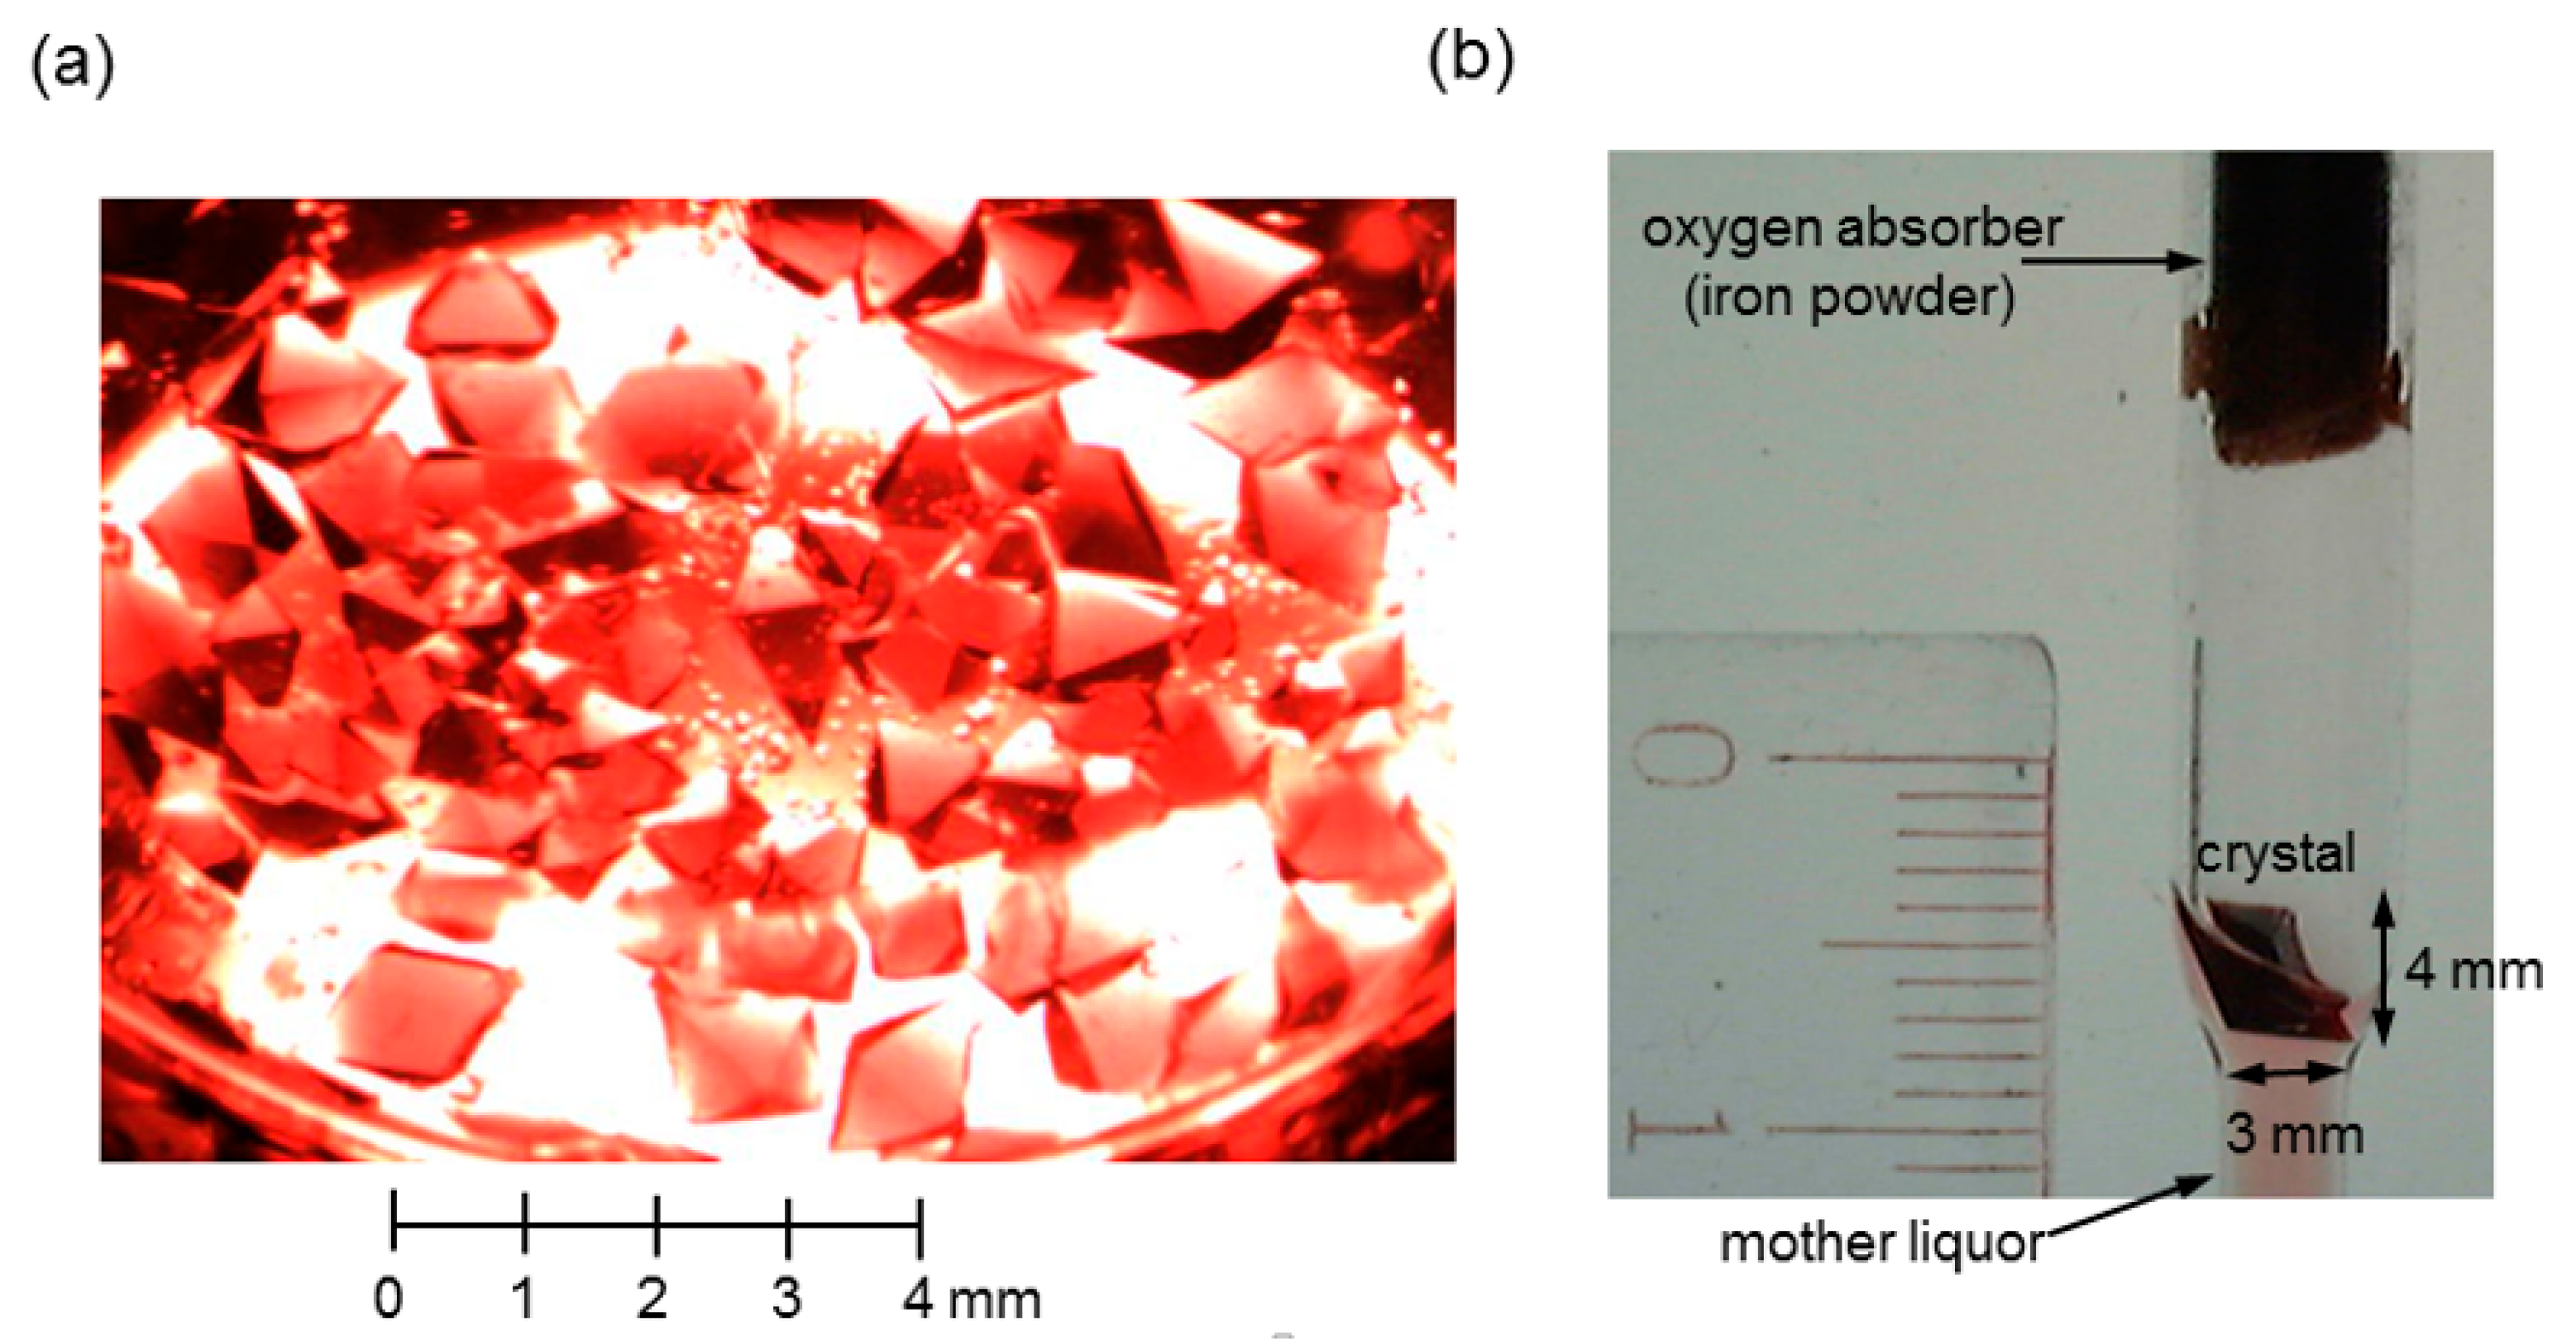
The deuterated oxyHbA sample was deoxygenated by repeated cycles of evacuation and equilibration with pure nitrogen gas at room temperature, then residual oxygen was scavenged by adding a small amount of solid sodium dithionite to give a final concentration of about 5 mM. The deoxygenated sample was placed into a gas-tight glass vial SVG-5 (Nichiden-Rika Glass) and quickly sealed with an oxygen absorber A-500HS (ISO, Yokohama, Japan) to maintain complete anaerobic conditions during crystallization at 20 °C. Crystals normally grew to their maximum size in about one month (Figure 4a). In our experience, the success rate of obtaining crystals of above 20 mm3 in volume (with edge dimensions of ~3 mm) is about 50%.
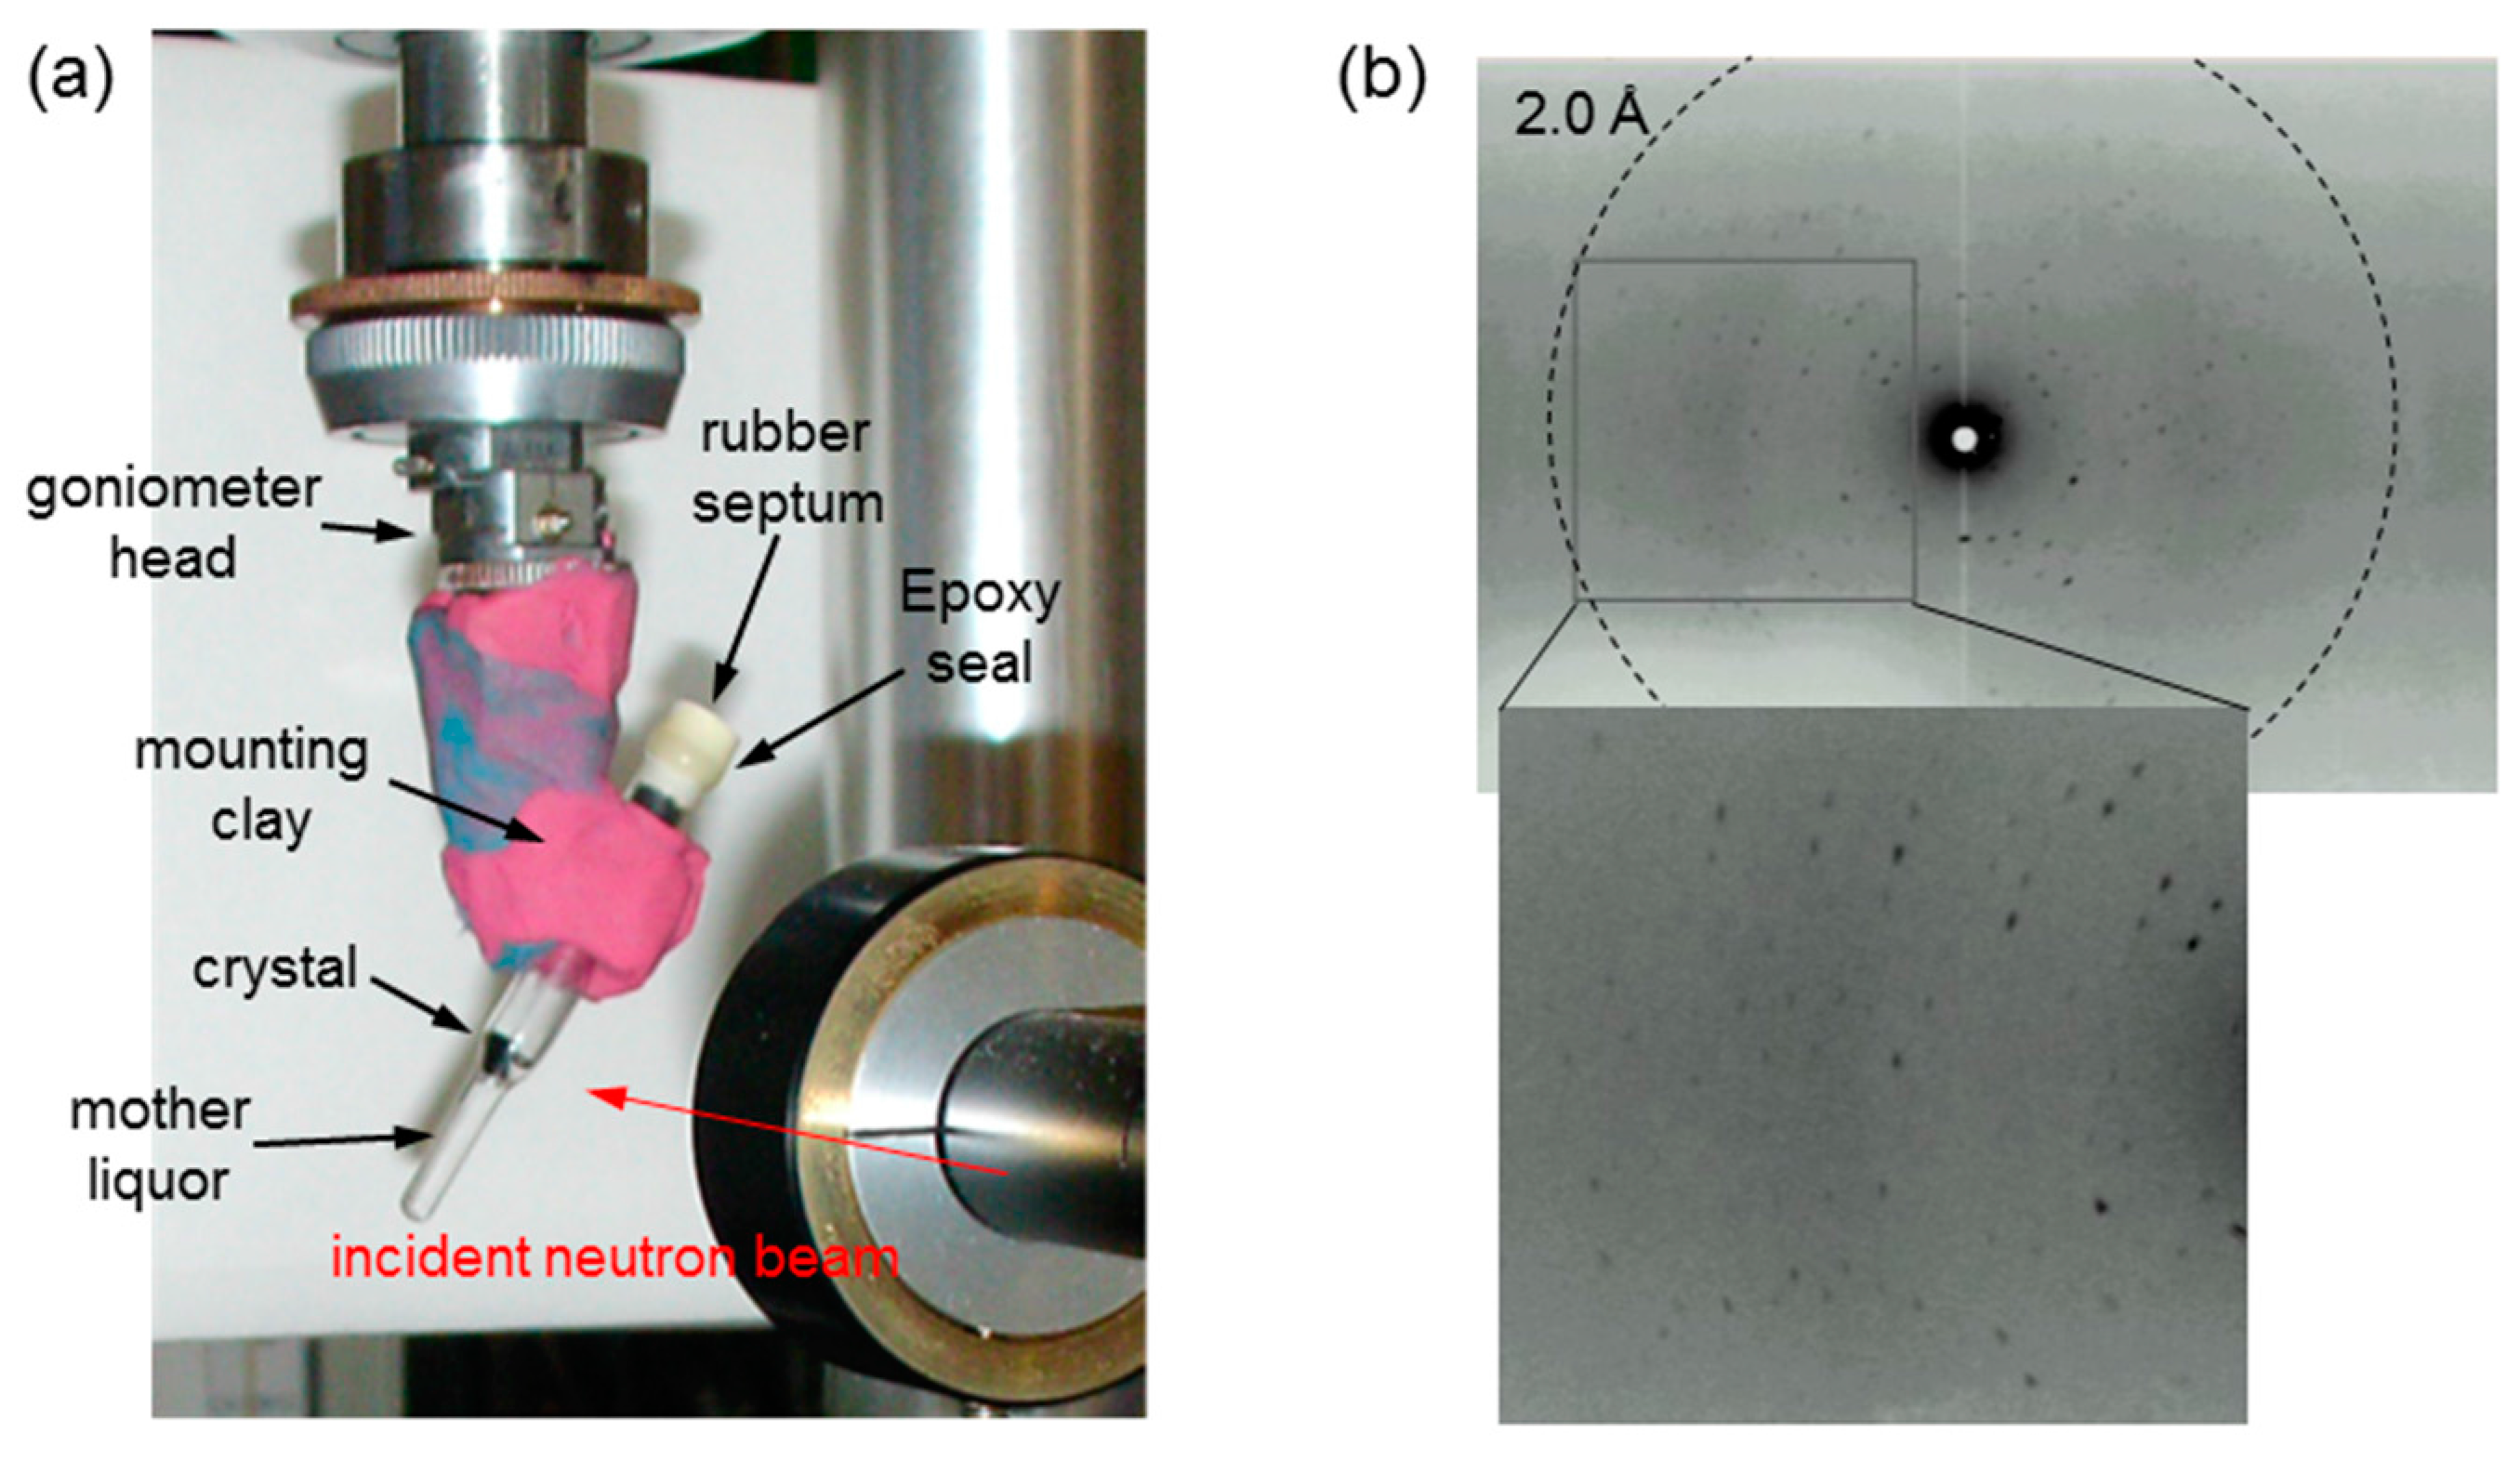
Since neutron diffraction experiments require a long data collection time (from days to months), the deoxyHbA crystals must be kept wet and free from oxygen during this time period. Accordingly, a large crystal (4 × 3 × 3 mm3) was mounted in a specially designed, anaerobic quartz capillary containing mother liquor (4.73 M NH4, 2.13 M SO4, and 0.267 M PO4) in contact with the bottom of the crystal (Figure 4b). This capillary also contains ~100 mm3 of iron powder of oxygen absorber A-500HS (ISO, Yokohama, Japan) and a small amount crushed oxygen indicator placed ~20 mm above the crystal (Figure 4b), to maintain the anaerobic conditions during the long neutron experiment. The capillary was tightly sealed with a rubber septum at the upper end (Figure 5a). This operation was carried out in a glove box filled with pure nitrogen. Finally, the upper end of the capillary was further sealed with epoxy resin (Figure 5a). Using this method, the deoxyHbA crystals can be kept wet and free from O2 for more than a year.
The first neutron diffraction data on the deoxyHbA crystal to 2.1 Å resolution were collected at JRR-3M reactor in Japan Atomic Energy Agency (JAEA) using the BIX-3 diffractometer [33]. The neutron beam size was 5 mm in diameter and the wavelength was 2.9 Å. A step-scan data-collection method with an interval of 0.3° between frames was used. Two data sets of 588 and 621 still frames were taken with the different rotation axes. Exposure times were about 110 min per frame and the total time required was 120 days. The typical experimental set up and the neutron diffraction pattern of the deoxyHbA crystal are shown in Figure 5. The details of the neutron structure were described in elsewhere [33].
2.2.2. COHbA Crystal (R-State)
The oxygen affinity of Hb is lowered by the uptake of protons, but the mechanism of this alkaline Bohr effect is still not fully understood [34]. A comparison of the neutron structures of T-state deoxyHbA and R-state liganded Hb (e.g., oxyHbA or COHbA) provide direct information about the protonation changes in Hb associated with ligand binding, allowing identification of the Bohr protons. Thus, we further attempted the growth of large volume COHbA crystals for NC.
We combined the batch method of Perutz [32] and a seeding technique to obtain large-sized, deuterated COHbA crystals from D2O solutions. First, deuteration of the stock solution of COHbA (in H2O) was carried out according to the same procedure as described in Section 2.2.1 without converting to the oxy-form. The deuterated COHbA solution was mixed with deuterated 4 M phosphate buffer of Perutz [32] to give a 3 mL solution of 0.66% (w/v) COHbA in CO-saturated 2.10 M phosphate buffer containing 0.875 M NaH2PO4, 1.225 M K2HPO4, and 7.4 mM dl-homocysteine in D2O. Note that Perutz’s phosphate buffer is a mixture of 4 M NaH2PO4 and 4 M K2HPO4 with a volume ratio of 5:7 (pH 6.7). We also note here that the COHbA solution is almost clear at this stage.
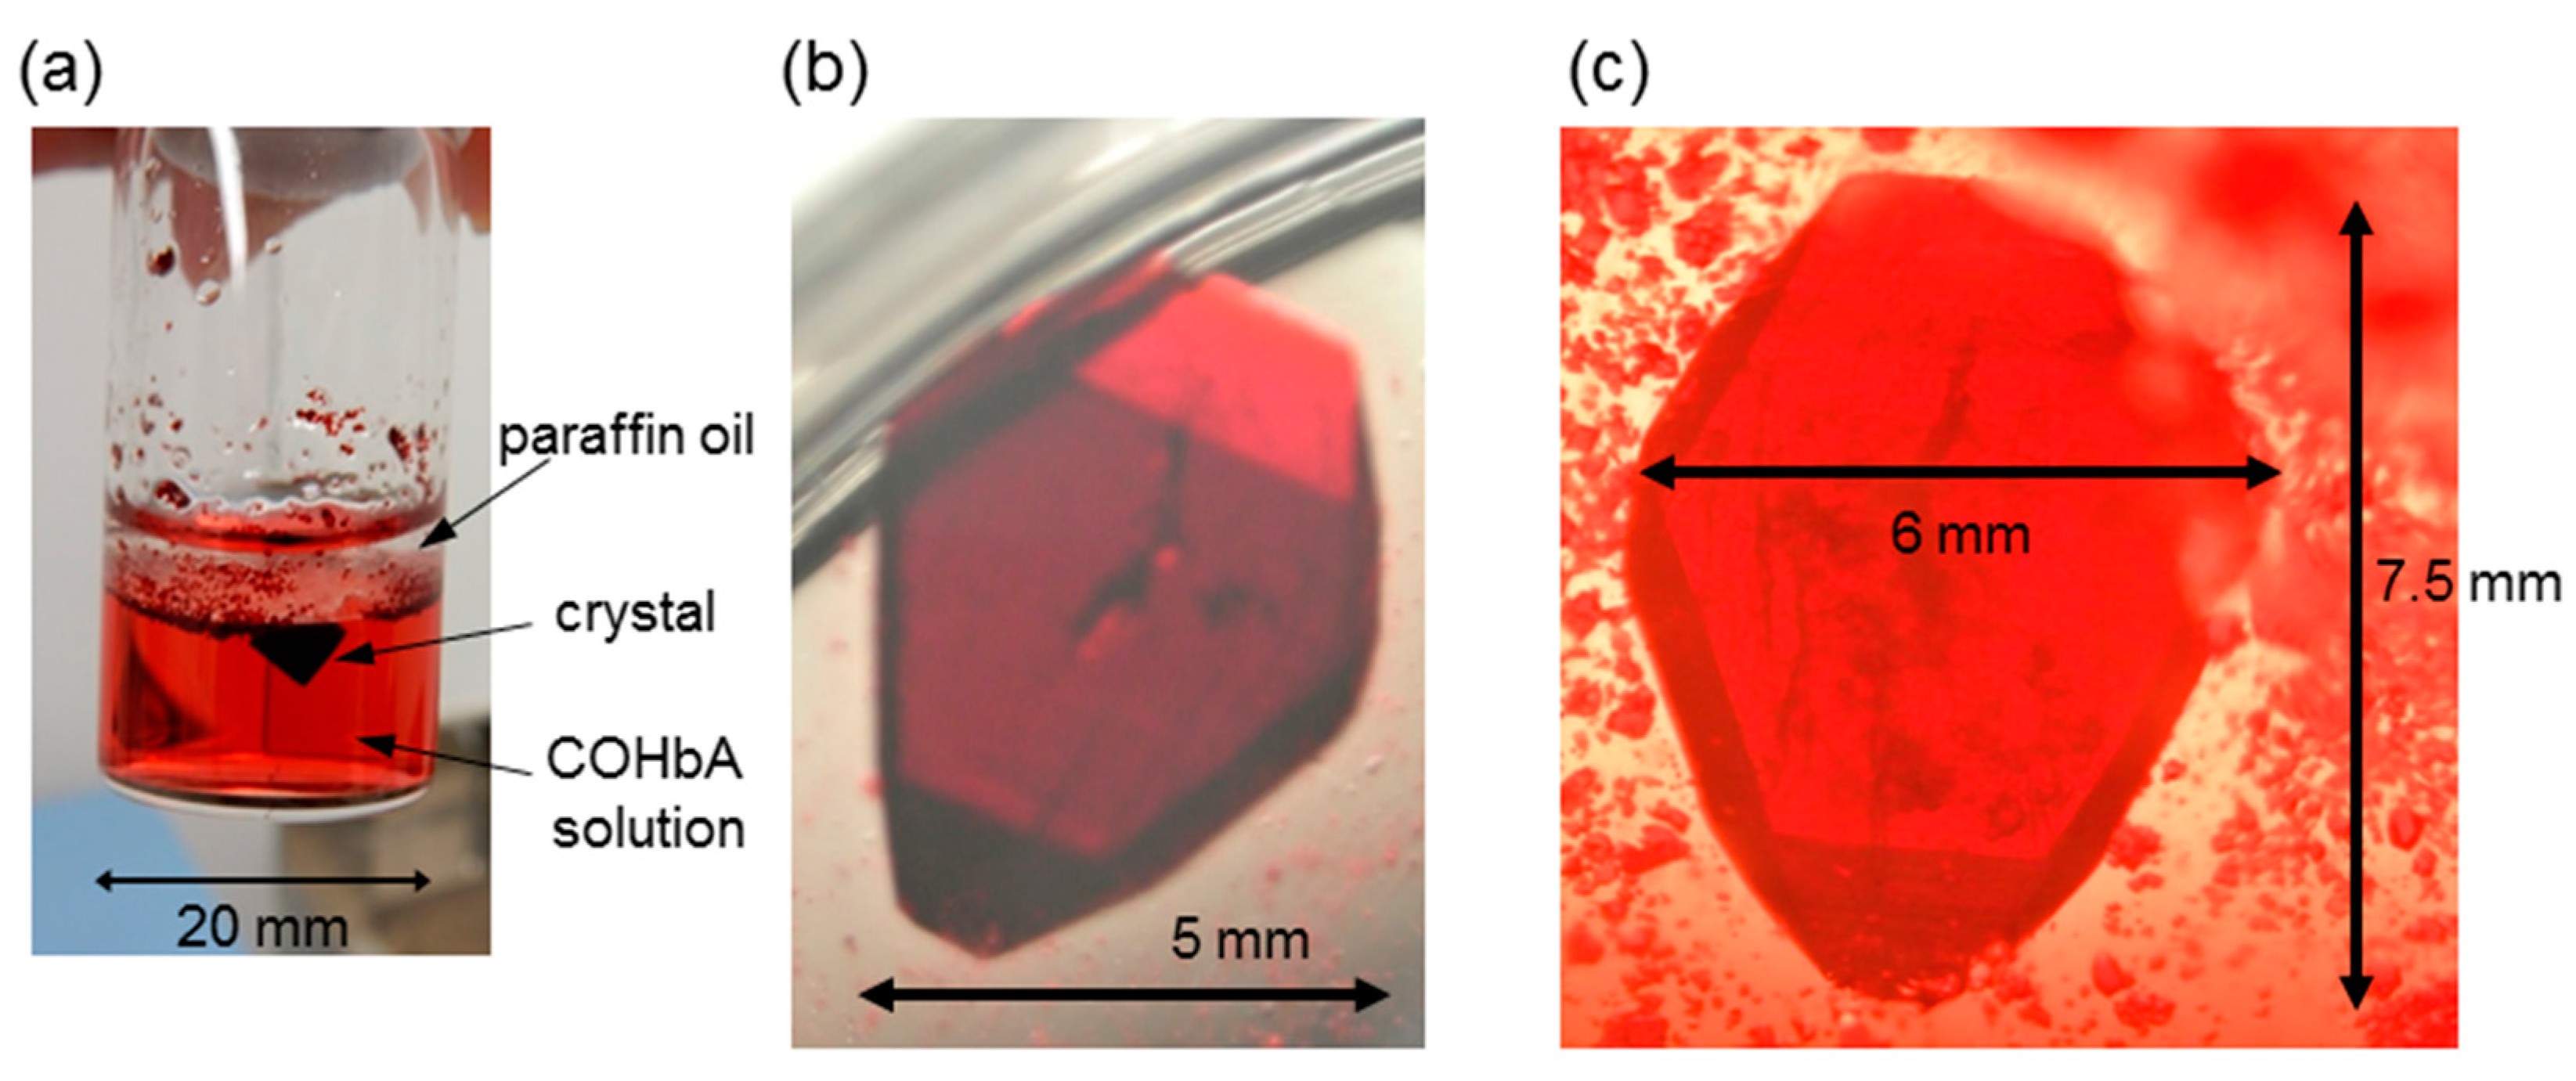
Then, a small amount of the mother liquor of the above mentioned COHbC crystal sample (containing submicrometer-sized crystals and/or crystalline particles) was added to the COHbA solution as seeds, followed by the addition of 1 mL of paraffin oil and 100 μL of toluene. It is important to note that the addition of paraffin oil and toluene is effective for the growth of well-shaped crystals. The sample was placed in a gas-tight glass vial SVG-5 (Nichiden-Rika Glass) and quickly sealed with oxygen absorber A-500HS (ISO, Yokohama, Japan) under CO. Crystallization was carried out at 20 °C. A number of visible crystals appeared within several days at the oil-solution interface and normally grew to about 1 mm in size within one month (Figure 6a). Among them, well-formed single crystals were used as seeds for the next macroseeding step.
Each selected COHbA crystal was soaked and washed several times in a drop of CO-saturated 2.00 M phosphate buffer containing 0.833 M NaH2PO4 and 1.167 M K2HPO4 in D2O, where the COHbA crystals remain intact for a while but very slowly dissolve with time. The washed crystal was then transferred into a 6 mL solution of 0.66% (w/v) COHbA in CO-saturated 2.10 M deuterated phosphate buffer (as mentioned above) in a gas-tight glass vial SVG-30 (Nichiden-Rika Glass), followed by the gentle addition of 2 mL of paraffin oil and 200 μL of toluene. The vial was quickly sealed with oxygen absorber A-500HS (ISO, Yokohama, Japan) under CO, and crystal growth was carried out at 20 °C. Crystals grew to their maximum size in several months. Figure 6b shows an example of the grown COHbA crystal (4 × 3 × 2 mm3) mounted in a CO-filled anaerobic quartz capillary as used for the deoxyHbA crystals. Note that the NC measurement on this sample has not yet been completed.
Taken together, we have succeeded in obtaining large volume crystals of both deoxyHbA and COHbA for NC, by using approaches that are based on the classical batch method under optimized conditions. Macroseeding was also employed to enlarge the COHbA crystals. The obtained large-volume (>20 mm3) Hb crystals are one of the largest protein crystals ever grown for NC [30,31]. It is noteworthy that, in the case of Hb, the batch method is advantageous over the more commonly used crystallization methods, such as the vapor diffusion [35] and counter-diffusion methods [36], in terms of better anaerobicity and of higher capacity. In particular, completely anaerobic conditions are required to avoid oxidization of the ferrous heme to the ferric (or met) form when crystallizing either deoxyHbA or COHbA over a period of months. Our batch methods were designed to meet such a requirement.
2.3. Extremely Large-Volume (>100 mm3) Hb Crystal Growth for X-ray Fluorescence Holography (XFH)
X-ray fluorescence holography (XFH) is a novel imaging technique that utilizes a specific fluorescing metal as a wave source to monitor the interference field formed in a crystalline sample [37,38]. When compared to traditional diffraction-based XRC, a remarkable feature of XFH is that it can record both intensity and phase information, allowing model-free image reconstruction of the surrounding atoms through a simple Fourier-like transform. However, one negative aspect of this method is the very low signal-to-noise ratio (about 0.1%). While XFH has recently been successfully applied for local structural analysis of inorganic materials, its application to metalloprotein crystals remains limited, largely because protein crystals contain a much smaller proportion of metal atoms than inorganic crystals.
Hb is an attractive protein sample for XFH, as it contains one Fe(II)-heme group per subunit and crystals can be grown to very large sizes. However, since the size requirement for XFH appears to be much higher than that for NC, it is still necessary to grow the largest crystals possible. In addition, unlike NC, protein crystals must be kept cool throughout the XFH experiment to reduce X-ray radiation damage, requiring the presence of a cryoprotectant in the crystal growth conditions. Deuteration, or any other form of labeling, is not necessary for XFH.
With these requirements in mind, we optimized the method for COHbA crystallization (as described in Section 2.2.2) by adding glycerol (as a cryoprotectant) and using macroseeding for further crystal growth. First, the COHbA solution (in H2O) was mixed with 4 M phosphate buffer of Perutz [32] to give a 2 mL solution of 2.0% (w/v) COHbA in CO-saturated 2.15 M phosphate buffer containing 0.896 M NaH2PO4, 1.254 M K2HPO4, 10% (v/v) glycerol, and 7.4 mM dl-homocysteine. Then, a small amount of the mother liquor of the COHbC crystal sample (as described in Section 2.1.1) was added to the COHbA solution as seeds, followed by the addition of 0.65 mL of paraffin oil and 0.1 mL of toluene. The COHbA sample was placed in a gas-tight glass vial SVG-5 (Nichiden-Rika Glass) and quickly sealed under CO. Crystallization was carried out at 20 °C. A number of visible crystals appeared within 24 h at the oil-solution interface.
After several days of crystallization, a qualified, medium-sized COHbA crystal (with the edge dimension of about 0.2 mm) was soaked and washed several in a drop of CO-saturated 2.00 M phosphate buffer containing 0.833 M NaH2PO4, 1.167 M K2HPO4, and 10% (v/v) glycerol. The washed crystal was then transfer into a 2 mL solution of 2.0% (w/v) COHbA in CO-saturated 2.15 M phosphate buffer (as mentioned above) in a gas-tight glass vial SVG-5 (Nichiden-Rika Glass), followed by the gentle addition of 0.65 mL of paraffin oil and 0.1 mL of toluene. The vial was quickly sealed under CO, and crystal growth was carried out at 20 °C. Crystals grew to about 5 mm in size within one month (Figure 7a,b).
To further grow this crystal, the second macroseeding was carried out. The crystal was soaked and washed several times in a drop of CO-saturated 2.00 M phosphate buffer containing 0.833 M NaH2PO4, 1.167 M K2HPO4, and 10% (v/v) glycerol (Figure 7b), and then transfer into a 10 mL solution of 1.5% (w/v) COHbA in CO-saturated 2.15 M phosphate buffer (as mentioned above) in a gas-tight glass vial SVG-30 (Nichiden-Rika Glass), followed by the gentle addition of 3.25 mL of paraffin oil and 0.5 mL of toluene. The vial was quickly sealed under CO, and crystal growth was carried out at 20 °C. Crystals grew to over 100 mm3 in volume within several months (Figure 7c). To our knowledge, this crystal size is far larger than any previously reported sizes of Hb crystals.
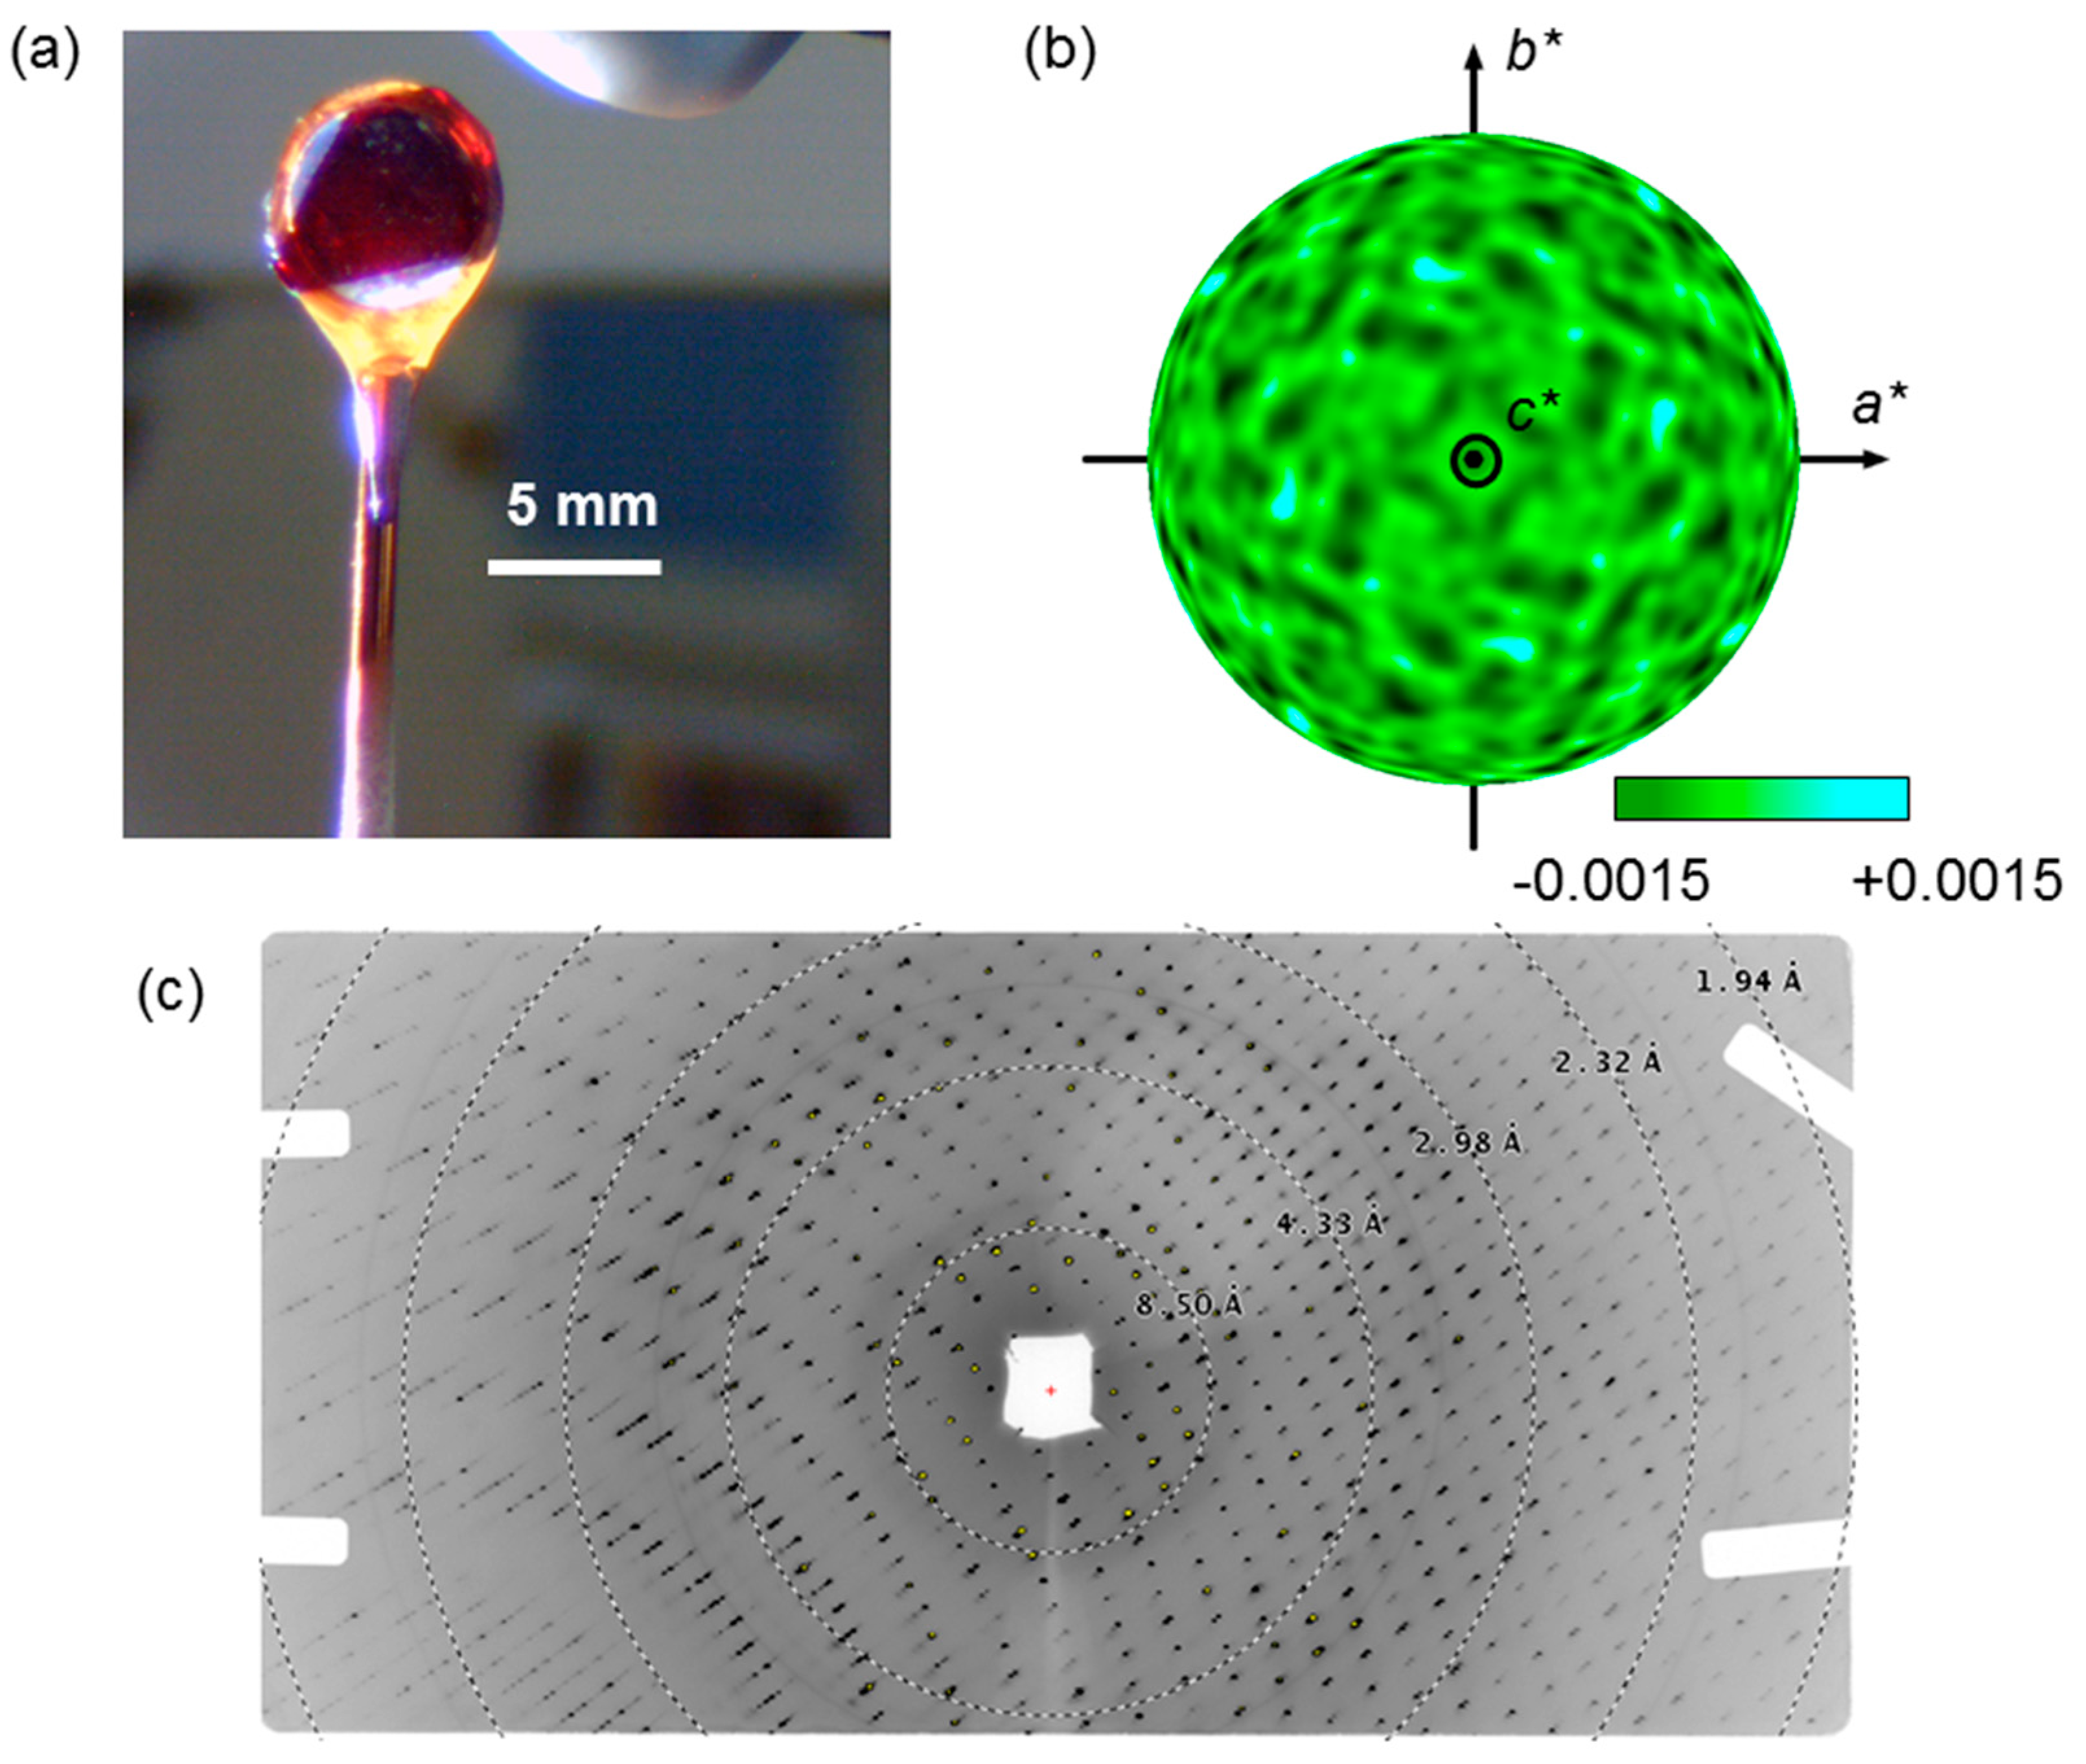
For the XFH measurement, the large COHbA crystal was briefly soaked in CO-saturated 2.30 M phosphate buffer containing 0.958 M NaH2PO4, 1.342 M K2HPO4, and 15% (v/v) glycerol, and then flash cooled to 100 K to reduce X-ray radiation damage (Figure 8a). The first XFH data-set using a COHbA crystal was collected at the beamline BL6C of Photon Factory [13]. A step-scan data collection was performed with an interval of 0.25° and 1.0° in pitch and yaw, respectively. The data were collected using eight X-ray energies in the 7.25–10.75 keV region in a step of 0.5 keV. A typical hologram pattern of the COHbA crystal is shown in Figure 8b. We checked the crystal quality by measuring the Bragg diffraction pattern for X-rays incident on the crystal (Figure 8c). More details of the XFH measurement are described in elsewhere [13]. Note that the crystals grown at the oil-solution interface tend to have shapes with well-developed crystal faces (Figure 7b,c and Figure 8a). This shape is well suited to minimize the “crystal shape effect” on the fluorescent X-ray intensity during crystal rotation necessary for the XFH measurement.
3. Materials and Methods
3.1. Preparation of HbA, HbC, and Horse Hb
3.2. Microspectrophotometry and Diffraction Image Collection for the COHbC Crystal
Microspectrophotometry of the R-state COHbC crystal was performed by a similar system, as reported previously [39], except using a different microscope (Eclipse TE2000-U, Nikon, Tokyo, Japan), spectrometer (double monochromator, Horiba Jobin Yvon, Kyoto, Japan), photomultiplier (model C3830, Hamamatsu Photonics, Hamamatsu, Japan), light chopper (5584A, NF, Yokohama, Japan) and digital lock-in amplifier (LI5640, NF, Yokohama, Japan). The crystal was cooled to 120 K by cold nitrogen gas (open-flow cryostat, Rigaku, Tokyo, Japan). The mother liquor containing 15% (v/v) glycerol was used for the COHbC crystal as cryoprotectant, in which the crystal was rinsed briefly before flash-freezing in liquid nitrogen.
The diffraction images were collected at the beamline NW14A at PF-AR, High Energy Accelerator Research Organization (KEK) using CCD detector (marccd, rayonix, Quebec, QC, Canada) and mardtb stage [40]. The crystal was cooled to 140 K by cold nitrogen gas (cryostream 600, Oxford cryosystems, Oxford, UK). X-ray wavelength, detector distance, oscillation range, and 2theta angle are 0.827 Å, 250 mm, 1° and 12°, respectively.
3.3. Microspectrophotometry and Diffraction Image Collection for the BZF-COhHb Crystal
On-line microspectrophotometry of the R-state BZF-COhHb crystal was performed at the beamline X26C at NSLS, Brookhaven National Laboratory using UV-VIS light source (L10290, Hamamatsu Photonics, Hamamatsu, Japan) and spectrometer (QE65000, Ocean Optics, Largo, FL, USA) [41]. The crystal was cooled to 100 K by cold nitrogen gas (cryostream 600, Oxford cryosystems, Oxford, UK). The mother liquor containing 20% (v/v) glycerol was used for the BZF-COhHb crystal as cryoprotectant, in which the crystal was rinsed briefly before flash-freezing in liquid nitrogen.
The diffraction image was collected at the beamline X26C using CCD detector (315r, Quantum detector, Oxford, UK). X-ray wavelength, detector distance, and oscillation range are 1.0 Å, 250 mm and 1°, respectively. The crystal was cooled to 100 K.
4. Conclusions
This work illustrates the various shapes and sizes of Hb crystals that can be grown by carefully controlling and optimizing the crystallization conditions by using the knowledge accumulated in our laboratory. Methods are described for obtaining reproducibly high-quality, thin crystals, and growing crystals with dimensions over 5 mm. The quality of these crystals and their applicability to novel crystallographic techniques were also examined. These Hb crystals are suitable for X-ray crystallography (XRC) combined with photoexcitation and/or spectrophotometry, neutron crystallography (NC), and X-ray fluorescent holography (XFH). Although beyond the scope of this article, it is important to note that one of the common challenges now faced is growing very small crystals for use with X-ray free electron laser (XFEL) serial crystallography experiments. We expect that the methods presented here will provide a basis for new and challenging experiments, and will encourage further progress of protein crystallographic work that poses very strict requirements on crystal size and quality.
Acknowledgments
We thank K. Hayashi, N. Happo and Y. C. Sasaki for help with the XFH experiment, A. M. Orville, B. Andi, T. Senda, M. Senda, S. Adachi, S. Nozawa and T. Sato for help with the XRC and spectroscopic experiments, and T. Chatake and Y. Morimoto for help with the NC experiment. We also thank J. Tame for helpful comments and suggestions to improve the paper. This work was supported by the MEXT/JSPS Grants-in-Aid for JSPS Fellows 11J10227 (to A.S.-T.), JSPS KAKENHI Grant Numbers 26105005 (to N.S.), 26840028 (to A.S.-T.), JP15H01646 (to N.S.), JP16K07326 (to N.S.), JP17H06372 (to A.S.-T.), and Jichi Medical University Young Investigator Award (to A.S.-T.). The XRD experiments were performed at the beamlines X26C of NSLS and NW14A of Photon Factory Advanced Ring (PF-AR) with the approval of KEK (Proposal No. 2009G683 and 2011G607). The XFH experiments were performed at the beamline BL6C of Photon Factory with the approval of KEK (Proposal No. 2013G605, 2013G653, and 2015G589).
Author Contributions
Naoya Shibayama designed the research, carried out Hb preparation and most of crystallization, performed experiments, and wrote the manuscript. Ayana Sato-Tomita carried out crystallization, performed experiments and generated data and figures. Both authors contributed to editing and reviewing the manuscript.
Conflicts of Interest
The authors declare no conflict of interest.
References
- Kendrew, J.C.; Bodo, G.; Dintzis, H.M.; Parrish, R.G.; Wyckoff, H.; Phillips, D.C. A three-dimensional model of the myoglobin molecule obtained by X-ray analysis. Nature 1958, 181, 662–666. [Google Scholar] [CrossRef] [PubMed]
- Pertz, M.F.; Rossmann, M.G.; Cullis, A.F.; Muirhead, H.; Will, G.; North, A.C. Structure of haemoglobin: A three-dimensional Fourier synthesis at 5.5-A. resolution, obtained by X-ray analysis. Nature 1960, 185, 416–422. [Google Scholar] [CrossRef]
- Kendrew, J.C.; Dickerson, R.E.; Strandberg, B.E.; Hart, R.G.; Davies, D.R.; Phillips, D.C.; Shore, V.C. Structure of myoglobin: A three-dimensional Fourier synthesis at 2 Å resolution. Nature 1960, 185, 422–427. [Google Scholar] [CrossRef] [PubMed]
- RCSB Protein Data Bank. Available online: https://www.rcsb.org (accessed on 2 September 2017).
- Shibayama, N.; Morimoto, H.; Kitagawa, T. Properties of chemically modified Ni(II)-Fe(II) hybrid hemoglobins: Ni(II) protoporphyrin IX as a model for a permanent deoxy-heme. J. Mol. Biol. 1986, 192, 331–336. [Google Scholar] [CrossRef]
- Shibayama, N.; Imai, K.; Hirata, H.; Hiraiwa, H.; Morimoto, H.; Saigo, S. Oxygen equilibrium properties of highly purified human adult hemoglobin cross-linked between 82β1 and 82β2 lysyl residues by bis(3,5-dibromosalicyl)fumarate. Biochemistry 1991, 30, 8158–8165. [Google Scholar] [CrossRef] [PubMed]
- Adachi, S.; Park, S.-Y.; Tame, J.R.H.; Shiro, Y.; Shibayama, N. Direct observation of photolysis-induced tertiary structural changes in hemoglobin. Proc. Natl. Acad. Sci. USA 2003, 100, 517–520. [Google Scholar] [CrossRef] [PubMed]
- Schotte, F.; Cho, H.S.; Soman, J.; Wulff, M.; Olson, J.S.; Anfinrud, P.A. Real-time tacking of CO migration and binding in the α and β subunits of human hemoglobin via 150-ps time-resolved Laue crystallography. Chem. Phys. 2013, 422, 98–106. [Google Scholar] [CrossRef] [PubMed]
- Mozzarelli, A.; Rivetti, C.; Rossi, G.L.; Henry, E.R.; Eaton, W.A. Crystals of haemoglobin with the T quaternary structure bind oxygen noncooperatively with no Bohr effect. Nature 1991, 351, 416–419. [Google Scholar] [CrossRef] [PubMed]
- Shibayama, N.; Sugiyama, K.; Park, S.Y. Structures and oxygen affinities of crystalline human hemoglobin C (β6 Glu→Lys) in the R and R2 quaternary structures. J. Biol. Chem. 2011, 286, 33661–33668. [Google Scholar] [CrossRef] [PubMed]
- Blakeley, M.P.; Langan, P.; Niimura, N.; Podjarny, A. Neutron crystallography: Opportunities, challenges, and limitations. Curr. Opin. Struct. Biol. 2008, 18, 593–600. [Google Scholar] [CrossRef] [PubMed]
- Niimura, N.; Bau, R. Neutron protein crystallography: Beyond the folding structure of biological macromolecules. Acta Crystallogr. 2008, 64, 12–22. [Google Scholar] [CrossRef] [PubMed]
- Sato-Tomita, A.; Shibayama, S.; Happo, N.; Kimura, K.; Okabe, T.; Matsushita, T.; Park, S.-Y.; Sasaki, Y.C.; Hayashi, K. Development of an X-ray fluorescence holographic measurement system for protein crystals. Rev. Sci. Instrum. 2016, 87. [Google Scholar] [CrossRef] [PubMed]
- Dickerson, R.E.; Geis, I. Hemoglobin: Structure, Function, Evolution, and Pathology, 1st ed.; The Benjamin/Cummings Publishing Company: Menlo Park, CA, USA, 1983; pp. 76–116. ISBN 0-805-32411-9. [Google Scholar]
- Baldwin, J.; Chothia, C. Haemoglobin: The structural changes related to ligand binding and its allosteric mechanism. J. Mol. Biol. 1979, 129, 175–220. [Google Scholar] [CrossRef]
- Ren, Z. Reaction trajectory revealed by a joint analysis of protein data bank. PLoS ONE 2013, 8, e77141. [Google Scholar] [CrossRef] [PubMed]
- Schlichting, I.; Berendzen, J.; Phillips, G.N., Jr.; Sweet, R.M. Crystal structure of photolysed carbonmonoxy-myoglobin. Nature 1994, 371, 808–812. [Google Scholar] [CrossRef] [PubMed]
- Teng, T.Y.; Srajer, V.; Moffat, K. Photolysis-induced structural changes in single crystals of carbonmonoxy myoglobin at 40 K. Nat. Struct. Biol. 1994, 1, 701–705. [Google Scholar] [CrossRef] [PubMed]
- Ostermann, A.; Waschipky, R.; Parak, F.G.; Nienhaus, G.U. Ligand binding and conformational motions in myoglobin. Nature 2000, 404, 205–208. [Google Scholar] [CrossRef] [PubMed]
- Tomita, A.; Sato, T.; Ichiyanagi, K.; Nozawa, S.; Ichikawa, H.; Chollet, M.; Kawai, F.; Park, S.Y.; Tsuduki, T.; Yamato, T.; et al. Visualizing breathing motion of internal cavities in concert with ligand migration in myoglobin. Proc. Natl. Acad. Sci. USA 2009, 106, 2612–2616. [Google Scholar] [CrossRef] [PubMed]
- Sawicki, C.A.; Gibson, Q.H. Dependence of the quantum efficiency for photolysis of carboxyhemoglobin on the degree of ligation. J. Biol. Chem. 1979, 254, 4058–4062. [Google Scholar] [PubMed]
- Hirsch, R.E.; Juszczak, L.J.; Fataliev, N.A.; Friedman, J.M.; Nagel, R.L. Solution-active structural alterations in liganded hemoglobins C (β6 Glu→Lys) and S (β6 Glu→Val). J. Biol. Chem. 1999, 274, 13777–13782. [Google Scholar] [CrossRef] [PubMed]
- Diggs, L.W.; Kraus, A.P.; Morrison, D.B.; Rudnicki, R.P. Intraerythrocytic crystals in a white patient with hemoglobin C in the absence of other types of hemoglobin. Blood 1954, 9, 1172–1184. [Google Scholar] [PubMed]
- Hirsch, R.E.; Raventos-Suarez, C.; Olson, J.A.; Nagel, R.L. Ligand state of intraerythrocytic circulating HbC crystals in homozygote CC patients. Blood 1985, 66, 775–777. [Google Scholar] [PubMed]
- Perutz, M.F.; Fermi, G.; Abraham, D.J.; Poyart, C.; Bursaux, E. Hemoglobin as a receptor of drugs and peptides: X-ray studies of the stereochemistry of binding. J. Am. Chem. Soc. 1986, 108, 1064–1078. [Google Scholar] [CrossRef]
- Shibayama, N.; Miura, S.; Tame, J.R.H.; Yonetani, T.; Park, S.-Y. Crystal structure of horse carbonmonoxyhemoglobin-bezafibrate complex at 1.55-Å resolution. A novel allosteric binding site in R-state hemoglobin. J. Biol. Chem. 2002, 277, 38791–38796. [Google Scholar] [CrossRef] [PubMed]
- Parak, F.; Knapp, E.W.; Kucheida, D. Protein dynamics: Mössbauer spectroscopy on deoxymyoglobin crystals. J. Mol. Biol. 1982, 161, 177–194. [Google Scholar] [CrossRef]
- Doster, W.; Cusack, S.; Petry, W. Dynamical transition of myoglobin revealed by inelastic neutron scattering. Nature 1989, 337, 754–756. [Google Scholar] [CrossRef] [PubMed]
- Monod, J.; Wyman, J.; Changeux, J.-P. On the nature of allosteric transitions: A plausible model. J. Mol. Biol. 1965, 12, 88–118. [Google Scholar] [CrossRef]
- Ng, J.D.; Baird, J.K.; Coates, L.; García-Ruiz, J.M.; Hodge, T.A.; Huang, S. Large-volume protein crystal growth for neutron macromolecular crystallography. Acta Crystallogr. F Struct. Biol. Commun. 2015, 71, 358–370. [Google Scholar] [CrossRef] [PubMed]
- Blakeley, M.P.; Hasnain, S.S.; Antonyuk, S.V. Sub-atomic resolution X-ray crystallography and neutron crystallography: promise, challenges and potential. IUCrJ 2015, 2, 464–474. [Google Scholar] [CrossRef] [PubMed]
- Pertz, M.F. Preparation of hemoglobin crystals. J. Cryst. Growth 1968, 2, 54–56. [Google Scholar] [CrossRef]
- Chatake, T.; Shibayama, N.; Park, S.-Y.; Kurihara, K.; Tamada, T.; Tanaka, I.; Niimura, N.; Kuroki, R.; Morimoto, Y. Protonation states of buried histidine residues in human deoxyhemoglobin revealed by neutron crystallography. J. Am. Chem. Soc. 2007, 129, 14840–14841. [Google Scholar] [CrossRef] [PubMed]
- Imai, K.; Yonetani, T. PH dependence of the Adair constants of human hemoglobin. Nonuniform contribution of successive oxygen bindings to the alkaline Bohr effect. J. Biol. Chem. 1975, 250, 2227–2231. [Google Scholar] [PubMed]
- Benvenuti, M.; Mangani, S. Crystallization of soluble proteins in vapor diffusion for X-ray crystallography. Nat. Protoc. 2007, 2, 1633–1651. [Google Scholar] [CrossRef] [PubMed]
- García-Ruiz, J.M. Counter diffusion methods for macromolecular crystallization. Methods Enzymol. 2003, 368, 130–154. [Google Scholar] [PubMed]
- Tegze, M.; Faigel, G. X-ray holography with atomic resolution. Nature 1996, 380, 49–51. [Google Scholar] [CrossRef]
- Gog, T.; Len, P.M.; Materlik, G.; Bahr, D.; Fadley, C.S.; Sanchez-Hanke, C. Multiple-energy X-ray holography: Atomic images of hematite (Fe2O3). Phys. Rev. Lett. 1996, 76, 3132–3135. [Google Scholar] [CrossRef] [PubMed]
- Sakai, K.; Matsui, Y.; Kouyama, T.; Shiro, Y.; Adachi, S. Optical monitoring of freeze-trapped reaction intermediates in protein crystals: a microspectro-photometer for cryogenic protein crystallography. J. Appl. Cryst. 2002, 35, 270–273. [Google Scholar] [CrossRef]
- Nozawa, S.; Adachi, S.; Takahashi, J.; Tazaki, R.; Guérin, L.; Daimon, M.; Tomita, A.; Sato, T.; Chollet, M.; Collet, E.; et al. Developing 100 ps-resolved X-ray structural analysis capabilities on beamline NW14A at the Photon Factory Advanced Ring. J. Synchrotron Radiat. 2007, 14, 313–319. [Google Scholar] [CrossRef] [PubMed]
- Orville, A.M.; Buono, R.; Cowan, M.; Heroux, A.; Shea-McCarthy, G.; Schneider, D.K.; Skinner, J.M.; Skinner, M.J.; Stoner-Ma, D.; Sweet, R.M. Correlated single-crystal electronic absorption spectroscopy and X-ray crystallography at NSLS beamline X26-C. J. Synchrotron Radiat. 2011, 18, 358–366. [Google Scholar] [CrossRef] [PubMed]
Figure 2.
High quality, thin R-state COHbC crystals for X-ray crystallography (XRC) combined with CO photolysis and/or spectrophotometry. (a) COHbC crystals obtained by a conventional batch method; (b) Shape-controlled thin COHbC crystals; (c) Shape control approach using a spatially restricted crystallization; (d) Typical absorption spectrum of the shape-controlled thin COHbC crystal at 120 K. Inset is a photograph of the measured crystal; and, (e) An X-ray diffraction pattern of the same COHbC crystal as used for the spectral measurement. Diffraction spots are visible up to 1.7 Å.

Figure 3.
High quality, very thin R-state Bezafibrate-Bound Horse COHb (BZF-COhHb) crystals for XRC combined with CO photolysis and/or spectrophotometry. (a) The allosteric effector, bezafibrate (BZF); (b) Batch samples at 5 days after the crystallization setup; (c) Very thin BZF-COhHb crystals under polarized light; (d) Typical absorption spectrum of the BZF-COhHb crystal at 100 K. Inset shows a photograph of the measured crystal; and, (e) An X-ray diffraction pattern of the same COHbC crystal as used for the spectral measurement. Diffraction spots are visible at least to 1.7 Å.
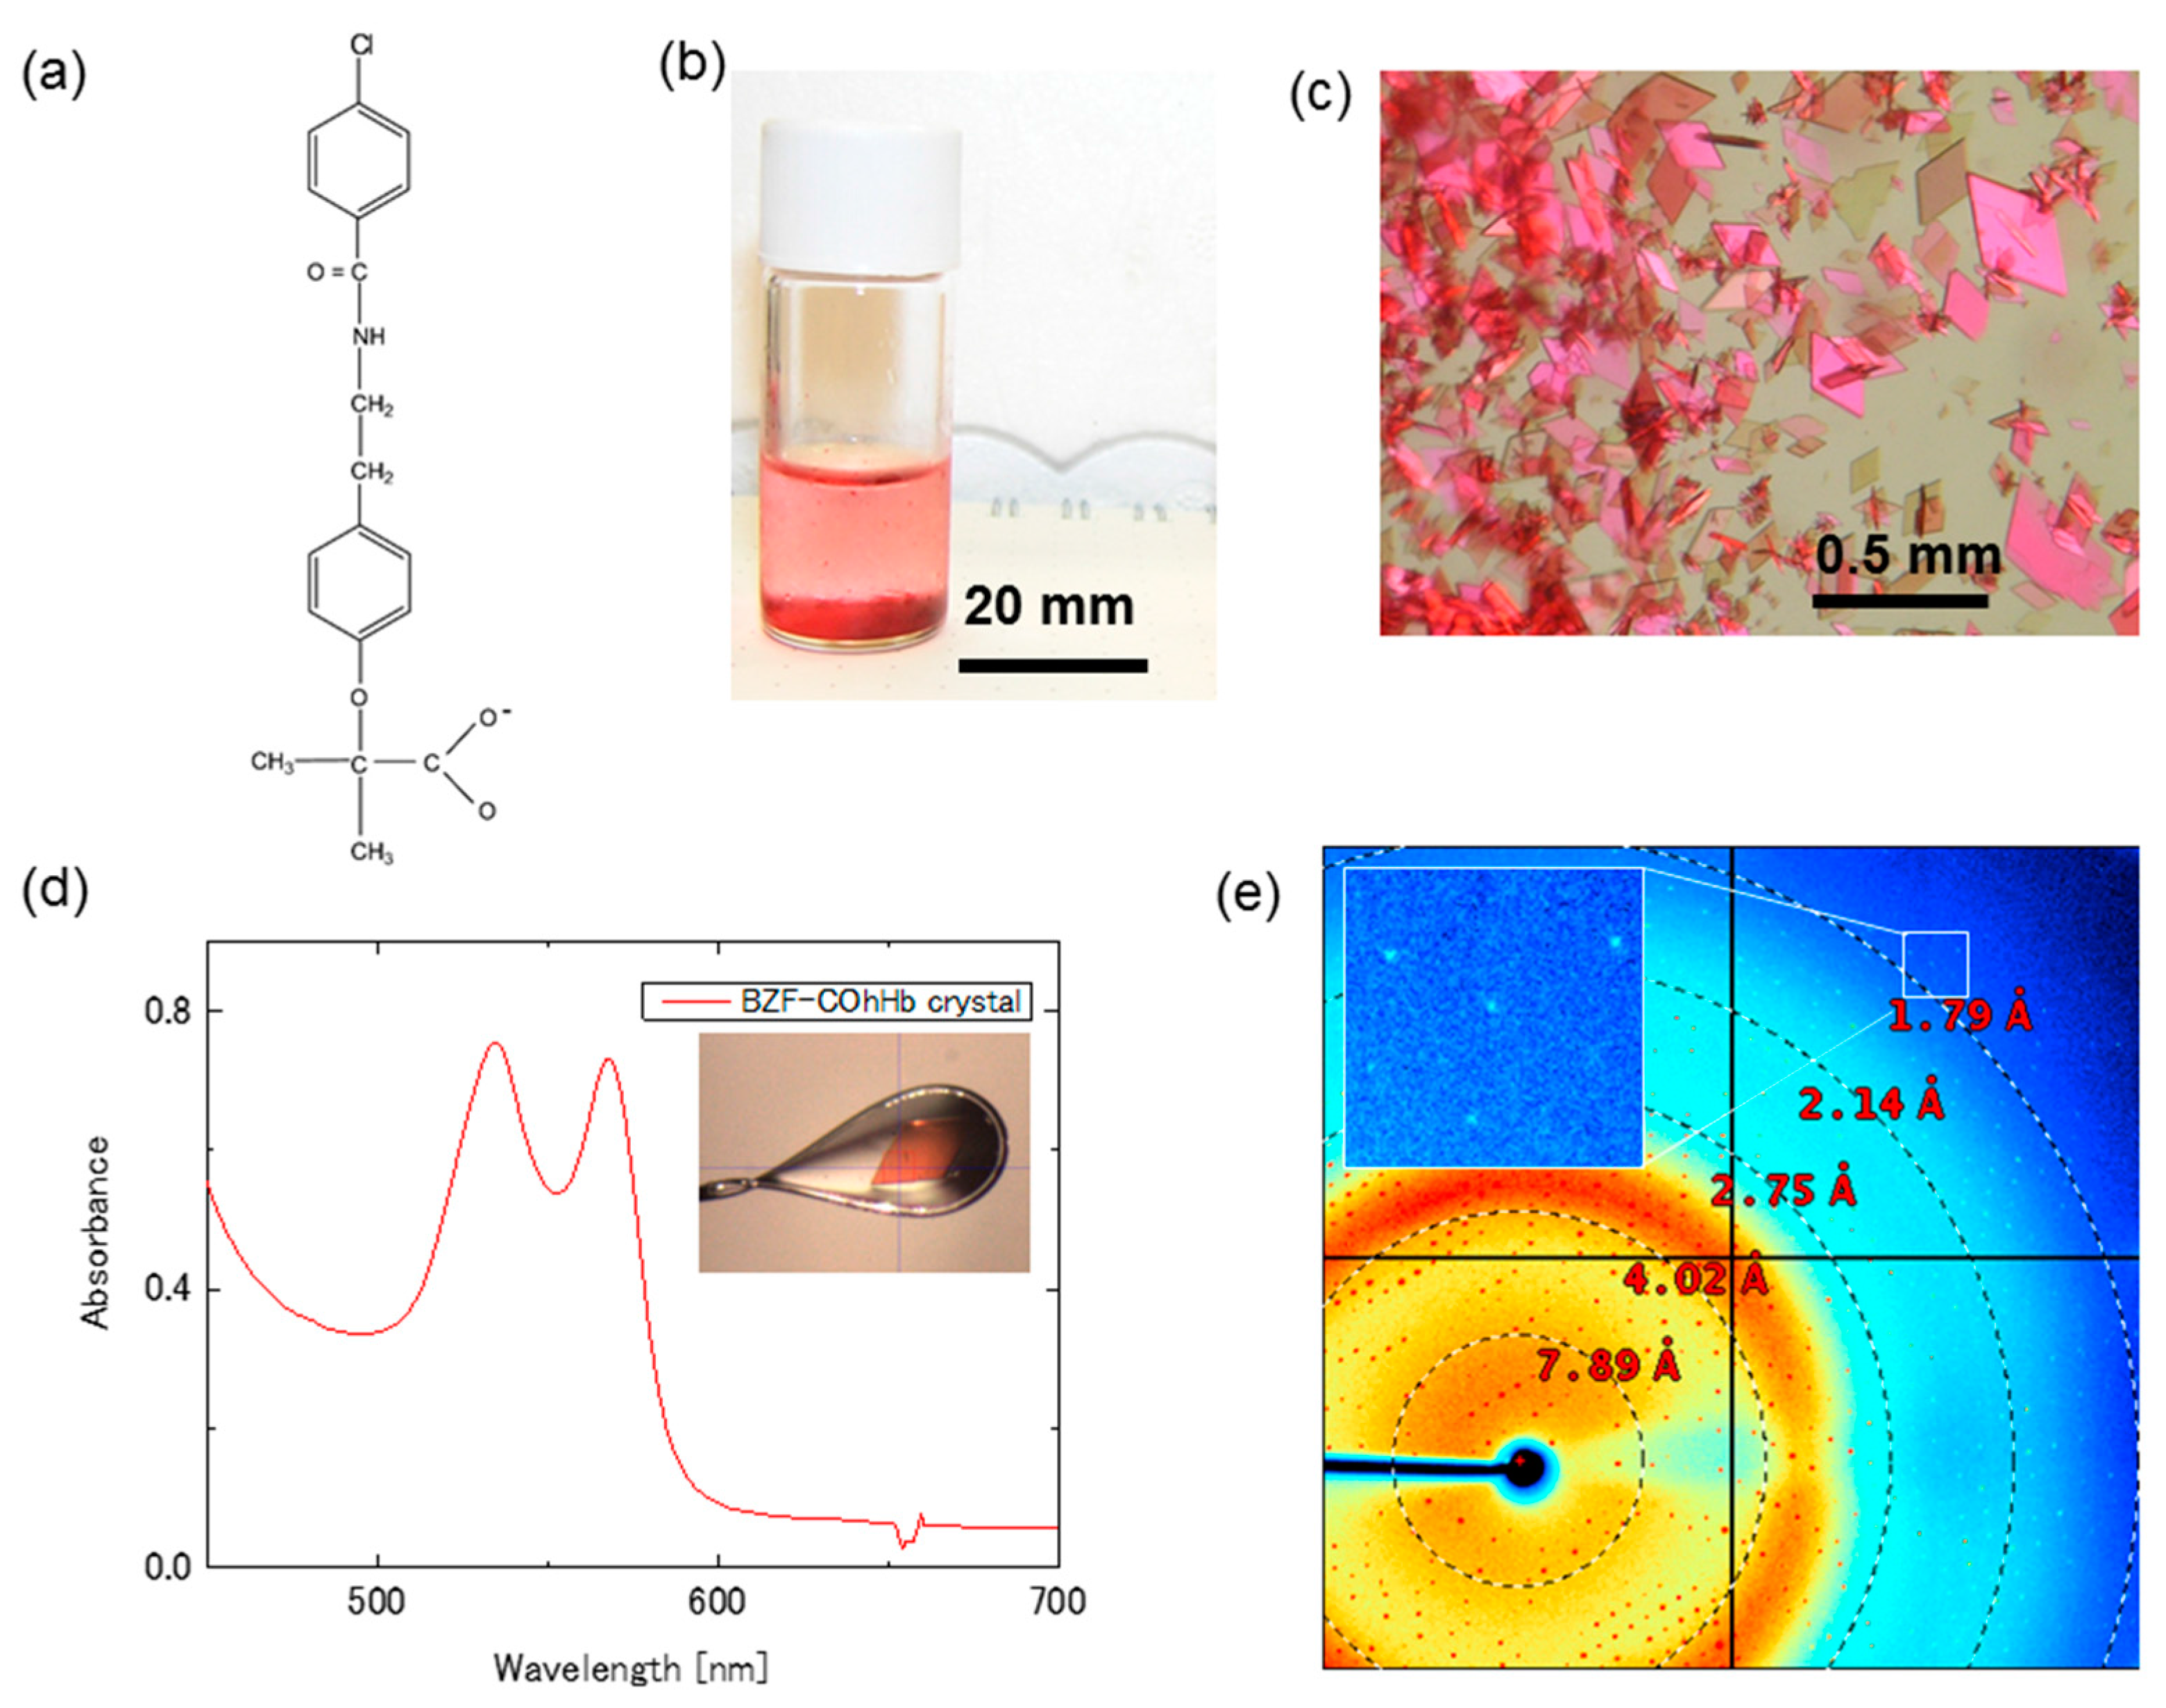
Figure 4.
Large-volume, deuterated T-state deoxyHbA crystals for neutron crystallography (NC). (a) Batch samples at 55 days after the crystallization setup; (b) The sample for NC measurement. A deoxyHbA crystal of about 4 × 3 × 3 mm in size (~36 mm3) was mounted in an anaerobic quartz capillary.
Figure 4.
Large-volume, deuterated T-state deoxyHbA crystals for neutron crystallography (NC). (a) Batch samples at 55 days after the crystallization setup; (b) The sample for NC measurement. A deoxyHbA crystal of about 4 × 3 × 3 mm in size (~36 mm3) was mounted in an anaerobic quartz capillary.

Figure 5.
NC measurement for the T-state deoxyHbA crystal. (a) Experimental setup; (b) Typical neutron diffraction pattern of the deoxyHbA crystal. The dashed circle represents the resolution at 2.0 Å. The picture below is a close up view.
Figure 5.
NC measurement for the T-state deoxyHbA crystal. (a) Experimental setup; (b) Typical neutron diffraction pattern of the deoxyHbA crystal. The dashed circle represents the resolution at 2.0 Å. The picture below is a close up view.

Figure 6.
Large-volume, deuterated R-state COHbA crystals for NC. (a) The batch sample at 14 days after the first crystallization setup; (b) The COHbA crystal grown to about 4 × 3 × 2 mm in size (~24 mm3) at 368 days after the macroseeding setup. The crystal was mounted in a CO-filled anaerobic quartz capillary for NC.

Figure 7.
An extremely large-volume R-state COHbA crystal for XFH. (a) Example of the batch method using paraffin oil. Crystals appeared at the oil-solution interface (b) The COHbA crystal at 34 days after the first macroseeding setup. The crystal was washed to remove tiny crystals attached on the surface of the large crystal; (c) The same COHbA crystal grown to about 7.5 × 6 × 3 mm in size (~130 mm3) at 193 days after the second macroseeding setup. This crystal was used for the measurement of XFH (see Figure 8a).

Figure 8.
X-ray fluorescent holography (XFH) measurement for the COHbA crystal. (a) Crystal setup for data collection. Our largest COHbA crystal of about 7.5 × 6 × 3 mm in size (~130 mm3) was mounted on a customized loop made by a polyimide film (0.125 mm thickness) with a copper wire (1.2 mm diameter), and cooled to 100 K by nitrogen gas flow; (b) Typical hologram pattern of the COHbA crystal (excited by 7.25 keV X-ray photons), represented as a stereographic projection of an interference pattern in the reciprocal space (a*, b*, c*) after applying a Gaussian low path spatial filter [13]; (c) An X-ray diffraction pattern of the COHbA crystal used for the XFH measurement. The measurement was carried out using an imaging plate of 2048 × 4020 pixels. The wavelength of X-ray was 1.127 Å.

© 2017 by the authors. Licensee MDPI, Basel, Switzerland. This article is an open access article distributed under the terms and conditions of the Creative Commons Attribution (CC BY) license (http://creativecommons.org/licenses/by/4.0/).
Share and Cite
MDPI and ACS Style
Sato-Tomita, A.; Shibayama, N. Size and Shape Controlled Crystallization of Hemoglobin for Advanced Crystallography. Crystals 2017, 7, 282. https://doi.org/10.3390/cryst7090282
AMA Style
Sato-Tomita A, Shibayama N. Size and Shape Controlled Crystallization of Hemoglobin for Advanced Crystallography. Crystals. 2017; 7(9):282. https://doi.org/10.3390/cryst7090282
Chicago/Turabian StyleSato-Tomita, Ayana, and Naoya Shibayama. 2017. "Size and Shape Controlled Crystallization of Hemoglobin for Advanced Crystallography" Crystals 7, no. 9: 282. https://doi.org/10.3390/cryst7090282
Note that from the first issue of 2016, this journal uses article numbers instead of page numbers. See further details here.